- royal ceramics lanka plcrocell.com/image/reports/rocell annual report 2015.pdf · ·...
TRANSCRIPT
Royal C
eramics Lanka PLC
Annual R
eport 2014 - 2015
roYaL CeramiCS LanKa pLCannUaL report 2014 - 2015
www.rocell.com

Name of the CompanyRoyal Ceramics Lanka PLC
Legal FormA Public Quoted Company with limited liabilty incorporated
Under the provisions of Companies Act No. 7 of 2007
Date of Incorporation29th August 1990
Company Registration NumberPQ 125
Nature of BusinessManufacture and sale of Porcelain & Ceramic Tiles
Board of DirectorsMr. K.D.D. Perera - Chairman
Mr. A.M. Weerasinghe - Deputy Chairman
Mr. W.D.N.H. Perera - Managing Director
Mr. T.G. Thoradeniya - Director Marketing &
Business Development
Mr. R.B. Thambiayah
Mr. L.T. Samarawickrama
Mr. M.D.S. Goonatilleke
Mr. G.A.R.D. Prasanna
Mr. R.N. Asirwatham
Mr. S. H Amarasekara
Head Office and Registered Office10, R.A. de Mel Mawatha, Colombo 03
Tel : 011 4799400
Fax : 011 4720077
Email : [email protected]
Website : www.rocell.com
Subsidiary CompaniesRoyal Porcelain (Pvt) Ltd.
Royal Bathware Ltd.
Royal Ceramics Distributors (Pvt) Ltd.
Ever Paint and Chemical Industries (Pvt) Ltd.
Lanka Ceramic PLC
Rocell Pty Limited
Rocell Ceramics Limited
Associate CompaniesDelmege Limited
L B Finance PLC
SecretariesP W Corporate Secretarial (Pvt) Ltd.
3/17, Kynsey Road, Colombo 08
Tel : 011 4640360-3
Fax : 011 4740588
Email : [email protected]
External AuditorsErnest & Young,
Chartered Accountants
201, De Saram Place, P.O. Box 101, Colombo 10.
BankersCommercial Bank of Ceylon PLC
Hatton National Bank PLC
Standard Chartered Bank Ltd.
HSBC Ltd.
DFCC Bank PLC
Seylan Bank PLC
Bank of Ceylon
NDB Bank PLC
PABC Bank PLC
Sampath Bank PLC
MCB Bank Ltd.
Corporate information
ContentSFinancial Highlights 07
Chairman’s Statement 08
Managing Director’s Review of Operations 09
The Board of Directors 12
Management Discussion and Analysis 15
Sustainability Report 36
Showroom Network 48
Financial Review 50
Corporate Governance 53
Risk Management 58
Annual Report of the Board of Directors 62
Statement of Directors’ Responsibility 74
Report of the Audit Committee 75
Report of the Remuneration Committee 77
Financial Calendar 78
Independent Auditor’s Report 79
Statement of Financial Position 80
Statement of Profit or Loss 82
Statement of Comprehensive Income 83
Statement of Changes in Equity 84
Cash Flow Statement 86
Notes to the Financial Statements 88
Ten Years Summary - Company 182
Group Value Added Statement 185
Share Information 186
Glossary of Financial Terms 188
Notice of Meeting 190
Form of Proxy 195
Designed & produced by
Digital Plates & Printing by Softwave Printing and Publishing (Pvt) Ltd

For over 20 years, Royal Ceramics Lanka PLC has grown in skills, strength andcorporate value to become one of Sri Lanka’s most respected diversified group ofcompanies. We have grown our portfolio to include some of the nation’skey economic growth drivers; wall and floor tiles, bathware, aluminium extrusions,plantations, packaging, paints and financial services.
Our primary businesses remain walltile, floortile and bathware manufacture and over the years we have streamlined our processes and refined our tile portfolio to be elegant, cost effective and functional. The benchmarks we set remain unchallenged as we continue to be a key player in the many industry sectors we operate, contributing to the national economy, generating employment and creating wealth across the multiple stakeholder segments we impact.
We are proud to see the results of our many synergies of success that have led to thestrong balance sheet and value we describe in this report today. We are confidentthat our offering will remain unmatched for industry resources, expertise andinfrastructure, as we continue to craft enduring value into all that we do, now andinto the future.

• Partnership with Grohe AG of Germany : world’s largest design portfolio of single branded sanitary fittings
• Going International : acquired an Australian tile retail business • LMD top hundred companies in Sri Lanka : 37th place
• Investor returns : Rs. 5/- per share dividend for 2014/15
• Revenue tops : Rs 22 billion • Wider customer choice : With over 700 product s designs available at 49 state -of -the -art showroom network across the country
• Reali s ed synergies : almost all the companies acquired have shown improved results
A Market Leader in the Floor and Walltile Industry in Sri Lanka
Royal Ceramics Lanka PLC is a public quoted company listed in the Colombo stock exchange, and a true market leader. Delivering the best in state-of-the-art and elegant surfacing solutions, the company has come a long way from producing porcelain tiles to offering a portfolio of diverse surfacing and bathware products that own a significant market share of the industry today.
Our pledge
Rocell is in the business of enhancing the quality of life by adding colour, style, and elegance to life. It creates a sense of aspiration, expectation, fashion and style always stirring aspirations around good living. Creating sensorial pleasures of an aesthetically appealing living ambience.

4 Royal Ceramics Lanka PLC . Annual Report 2014 - 2015
The Royal Ceramics Lanka PLC Group Structure
Royal Ceramics Lanka PLC
Lanka Ceramic PLC
Lanka Walltiles PLC
Lanka Tiles PLC
Swisstek Ceylon PLC
Swisstek Aluminium
Limited
Delmage Ltd LB Finance PLC
76.93%
62.19%
21% 26.1%
68.22%
87.38%
11.48%
47.80%

5
“Value creations by realizing synergies”2014/15 was a year of realized synergies across the value chain to deliver performance that is exceptional
Royal Porcelain (Pvt) Ltd
Rocell Bathware LtdEver Paint and
Chemical Industries (Pvt) Ltd
100% 100%
100%
100%
99.83%
51%
100%
Vallibel Plantation Management Ltd
Horana
Plantation PLC
Uni-Dil Packaging
Limited
Uni-Dil Papersacks
(Pvt) Limited
6 Royal Ceramics Lanka PLC . Annual Report 2014 - 2015
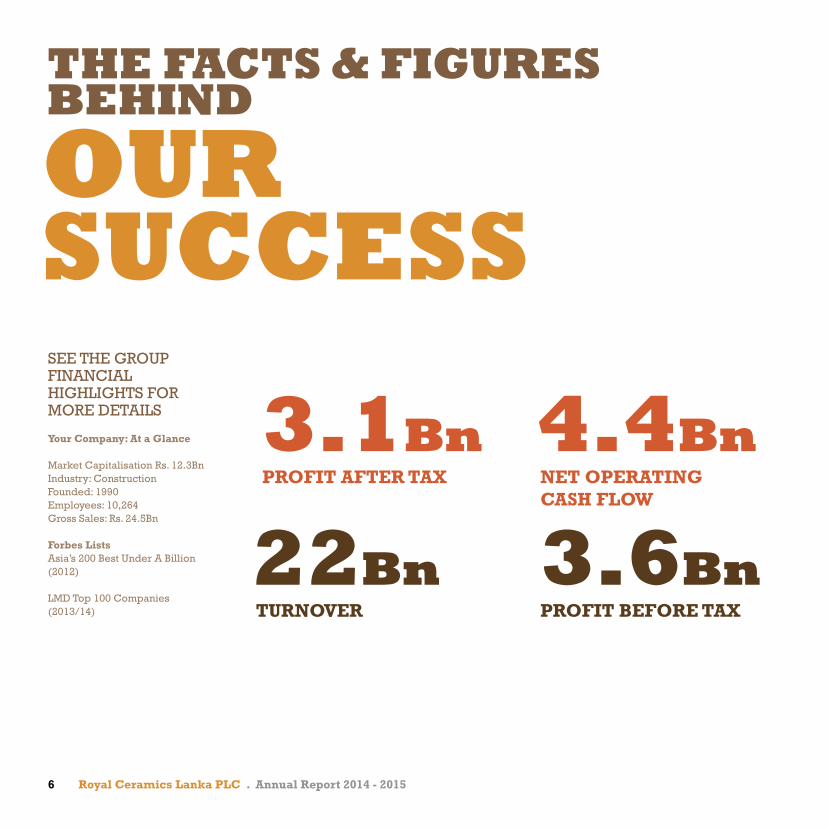
22BnTURNOVER
3.1BnPROFIT AFTER TAX
4.4BnNET OPERATINg CASH FLOW
3.6BnPROFIT BEFORE TAX
OUR SUCCESSSEE THE GROUP FINANCIAL HIGHLIGHTS FOR MORE DETAILS
Your Company: At a glance
Market Capitalisation Rs. 12.3BnIndustry: ConstructionFounded: 1990Employees: 10,264Gross Sales: Rs. 24.5Bn
Forbes ListsAsia’s 200 Best Under A Billion (2012)
LMD Top 100 Companies (2013/14)

7
GROUP FInAnCIAL HIGHLIGHTS
2015 2014 Change Rs.’000 Rs.’000 (%)
For the year ended 31st MarchTurnover - Gross 24,498,207 21,711,453 12.84 - Net 22,379,069 19,748,800 13.32 Profit before tax 3,643,582 2,293,814 58.84 Profit after tax 3,066,907 1,975,283 55.26 Gross dividends 553,947 110,789 400.00 Interest cover (No of times) 4.75 2.63 80.50 Dividend cover (No of times) 3.85 10.16 (62.11)Return on Equity (%) 17.03 12.67 34.41 As at 31st March Shareholder’s Funds 11,874,800 10,394,413 14.24 Total Assets 35,096,532 33,331,604 5.29 Group employment (No of Employees) 10,264 10,863 (5.5)Current Ratio (Current assets : Current liabilities) 1.3:1 1.22:1 6.55 Per share (Issued and fully paid shares 110,789,384) Earnings (Rs.) 19.27 10.16 89.6 Dividend (Rs.) 5.00 1.00 400.00 Net assets (Rs.) 107.18 93.82 14.24 Market value (Rs.) 111.00 79.30 39.97
2011 2012 2013 2014 2015
EARNINGS PER SHARE (Rs)
13.01
11.22
15.08
10.16
19.27
2011 2012 2013 2014 2015
NET ASSETS PER SHARE (Rs)
45.59
59.02
75.83
93.82
107.18
2011 2012 2013 2014 2015
SALES (Rs. Mn)
5,75
1.38
6,95
6.11
7,61
1.4
19,7
48.8
22,3
79.0

8 Royal Ceramics Lanka PLC . Annual Report 2014 - 2015
2.1BnNET PROFIT Attributable to the Parent
CHAIRMAn’SSTATEMEnTDear Shareholders,
“Value Crafting by realizing synergies”
As another year of accomplishments come to an end, it gives me
great pleasure to present to you, our shareholders, the audited
Financial Statements and Annual Report for the financial year
2014/15. I am confident that our shareholders will be more than
pleased with the performance of Royal Ceramics Lanka PLC this
financial year.
Your company has once again proven the adage that “the whole
is greater than the sum of its parts”. This is truly the case with
Royal Ceramics, time and time again over the past decade; it has
realized synergies across the value chain to deliver performance
that is exceptional. But in 2014/15, your Company has outdone
itself, to garner wealth across all parts of its Group components to
not only create value but to truly craft value. Despite challenging
market and operative conditions, your Company posted a Net Profit
attributable to the Parent of Rs. 2.1 billion in 2014/15, up from Rs.
1.1 billion in the previous financial year.
For Royal Ceramics crafting is nothing new. Its whole business
philosophy is centered on “crafting”. As the leader in the surface
covering industry, Royal Ceramics has created a platform of
success through creative disruption. Over the past decade or
more, the Group has continued to reinvent the sector through
innovation. It has not only questioned its own design ethos but has
continuously reinvented it, by doing so it has created an upheaval,
pushing the industry players and customers into a continued state
of creative re-thinking. I believe that your Company catalyzed a
movement towards greater awareness, desire and action towards
the crafting of design in Sri Lanka. We have made design relevant
to customers and in doing so; we have crafted not only design but
also crafted the art of delivering value across all angles.
This philosophy of creative disruption and value crafting saw your
Company acquire businesses that are complimentary over the past
five years. Growth through acquisition well defines our forward
strategy and we are more than confident that this strategy will
continue to deliver value over the course of the medium term. We
will continue to refine and re-engineer these new components of
the business to add sustained value to our Group operations.
As we move forward, we are well aware of the changing context of
the operative environment. We are cognizant of the fact that change
is imminent and that the market situation is fluid. As we look to
the future, we will do so, with a resolute strategy to innovate our
business to a new paradigm – one that will see Royal Ceramics
craft value on the global stage with greater vigour.
To our customers, shareholders, employees and valued partners
across the world, I say thank you. I ask for your support to
overcome future challenges, let us live up to our inimitable spirit of
achievement at all odds, and let us craft value and create greater
wealth for all our stakeholders.
Dhammika Perera
Chairman

9
MAnAGInG DIRECTOR’S REvIEW OF OPERATIOnS Rocell has completed an year of consolidation, demonstrating
that our Group’s most significant milestone, the acquisition of a
controlling stake in Lanka Ceramic PLC, was a move that not only
gave us an unparalleled advantage in the market; but was also an
opportunity to prove that our formidable business and consumer
expertise could be used to increase productivity and profitability
across our subsidiaries. This was an important part of our mandate
during the year under review, and our results prove that we
successfully achieved it.
Group revenues increased to Rs 22.4billion from Rs.19.7billion in
the previous year. The Net Profit of the Group rose from 2 billion to
3.1 billion. With a 13% topline growth, and a 55% increase in the
bottom line, improved results have been achieved in almost every
subsidiary within the Group.
However, the year was not without challenges, the Sri Lankan
Plantation sector was plagued by falling tea prices, a rubber market
at an all-time low and high production costs, which had overall
estates suffering Rs. 2.85 billion in losses. Horana Plantations was
also affected, and ended the year with a 55% drop in PAT.
Additionally, disposable income fell in the first six months of the
year, resulting in a downturn in the market which compelled us
to slow our production rate in order to compensate. However
falling interest rates in the subsequent six months immediately
benefitted the Group. Industry showed a return to record form in
terms of square meters sold, breaking 2011/12 record of 16million
square meters, to achieve 17million square meters during the year
under review. We expect this successful run to continue gaining
momentum throughout 2015/16.
These positive results have been directly translated into greater
benefits for our shareholders; with a decision taken that 26% of the
Group profit be allocated as dividends for the year under review.
This is a 400% increase on the previous year.
Value Crafting
The phrase ‘Value Crafting’, not only serves as our theme for this
years’ report, but also perfectly expresses what we do in every
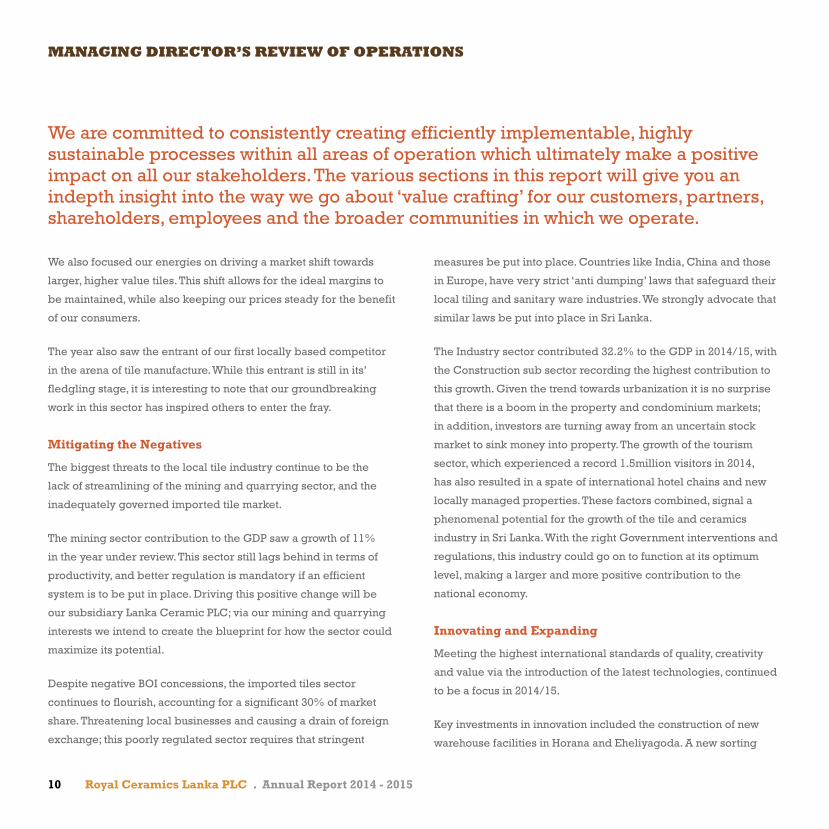
sphere of our business. We are committed to consistently creating
efficiently implementable, highly sustainable processes within all
areas of operation which ultimately make a positive impact on all
our stakeholders. The various sections in this report will give you
an indepth insight into the way we go about ‘value crafting’ for our
customers, partners, shareholders, employees and the broader
communities in which we operate.
Maximising the Positives
2014/15 saw the ceramic tile and sanitary ware industries benefit
from tariff reductions which lowered the hitherto high expenditure
on fuel and electricity, that have long been industry bugbears.
The lowering of electricity tariffs and LPG gas prices resulted in a
significant reduction in production expenditure.
Another boon came in the form of decreasing interest rates, which
allowed for an noticeable 31% reduction in Finance Costs.
The steady decline of the Euro meant further savings, as we were
able to take advantage of competitive exchange rates to secure
high quality raw materials from Europe.
10 Royal Ceramics Lanka PLC . Annual Report 2014 - 2015
We also focused our energies on driving a market shift towards
larger, higher value tiles. This shift allows for the ideal margins to
be maintained, while also keeping our prices steady for the benefit
of our consumers.
The year also saw the entrant of our first locally based competitor
in the arena of tile manufacture. While this entrant is still in its’
fledgling stage, it is interesting to note that our groundbreaking
work in this sector has inspired others to enter the fray.
Mitigating the Negatives
The biggest threats to the local tile industry continue to be the
lack of streamlining of the mining and quarrying sector, and the
inadequately governed imported tile market.
The mining sector contribution to the GDP saw a growth of 11%
in the year under review. This sector still lags behind in terms of
productivity, and better regulation is mandatory if an efficient
system is to be put in place. Driving this positive change will be
our subsidiary Lanka Ceramic PLC; via our mining and quarrying
interests we intend to create the blueprint for how the sector could
maximize its potential.
Despite negative BOI concessions, the imported tiles sector
continues to flourish, accounting for a significant 30% of market
share. Threatening local businesses and causing a drain of foreign
exchange; this poorly regulated sector requires that stringent
measures be put into place. Countries like India, China and those
in Europe, have very strict ‘anti dumping’ laws that safeguard their
local tiling and sanitary ware industries. We strongly advocate that
similar laws be put into place in Sri Lanka.
The Industry sector contributed 32.2% to the GDP in 2014/15, with
the Construction sub sector recording the highest contribution to
this growth. Given the trend towards urbanization it is no surprise
that there is a boom in the property and condominium markets;
in addition, investors are turning away from an uncertain stock
market to sink money into property. The growth of the tourism
sector, which experienced a record 1.5million visitors in 2014,
has also resulted in a spate of international hotel chains and new
locally managed properties. These factors combined, signal a
phenomenal potential for the growth of the tile and ceramics
industry in Sri Lanka. With the right Government interventions and
regulations, this industry could go on to function at its optimum
level, making a larger and more positive contribution to the
national economy.
Innovating and Expanding
Meeting the highest international standards of quality, creativity
and value via the introduction of the latest technologies, continued
to be a focus in 2014/15.
Key investments in innovation included the construction of new
warehouse facilities in Horana and Eheliyagoda. A new sorting
MAnAGInG DIRECTOR’S REvIEW OF OPERATIOnS
We are committed to consistently creating efficiently implementable, highly sustainable processes within all areas of operation which ultimately make a positive impact on all our stakeholders. The various sections in this report will give you an indepth insight into the way we go about ‘value crafting’ for our customers, partners, shareholders, employees and the broader communities in which we operate.

11
LEADERSHIPRocell was ranking 37th place in the LMD top hundred
companies published in December 2014.
22.4BnTURNOVER
3.1BnPROFIT AFTER TAX
line for the Squaring and Polishing operation which also features
automatic Unloading and RED LINE machine for warpage
measurement, represents the very latest in advanced technology;
while a top of the line Dust Suction plant at Eheliyagoda was also
installed.
In order to give every consumer an unmatched customer
experience, we continued to expand our reach, and make
ourselves easily accessible to more of the population. Thus we
opened one franchised showroom in Avissawella, along with two
second grade sales locations in Thalawathugoda and Wattala
during the year under review, which served as valuable additions
to our network of 49 showrooms, and list of over 350 direct and
sub dealers across Sri Lanka. Our outlets in Malabe, Moratuwa,
Kurunegala, Nittambuwa and Nawala have been refurbished, and
the construction of new showrooms is underway in Kadawatha
and Batticaloa, with upgrades already taking place in Seeduwa,
Katugastota and Kottawa. Our expansion plans will continue apace
in 2015/16 with six new showrooms due to begin construction, in
addition to a further nine showrooms to be upgraded, and five to
be relocated.
going International
In 2014/15 we decided to take our investment in the international
markets one step further by investing in acquiring an established
Australian tile retail business. Having acquired the company’s
residual stock and a full fleet of staff, we now have a firm footing on
that continent. The Australian market values quality and standards,
making it an ideal one for our superior quality products. We look
forward to expanding this business and establishing our brand in
Australia during 2015/16.
Crediting the team
Human capital is our most valuable asset. Thankful to the hard
work and dedication of the Group’s employees that we achieved
the levels of success reached during the year under review. Every
member of our team has worked with focus to grow this business,
thereby contributing to the economy.
Nimal Perera
Managing Director
12 Royal Ceramics Lanka PLC . Annual Report 2014 - 2015
We have the ability to share ideas across silos inside and outside the company. Internally, we have always excelled at best-practice sharing. Outside the company, systems thinking requires “horizontal” innovation, connecting technology, public policy, social trends and people across all our operations.
THE BOARD OF
Mr. Dhammika Perera - Chairman
Mr. Dhammika Perera is the quintessential business leader, with
interests in a variety of key industries including Hydropower
generation, Manufacturing, Hospitality, Entertainment, Banking and
Finance. He enriches the Board with over 25 years of experience
in building formidable businesses through unmatched strategic
foresight.
Mr. Perera is the Chairman of Sampath Bank PLC, Vallibel One PLC,
Vallibel Power Erathna PLC, Royal Ceramics Lanka PLC,The Fortress
Resorts PLC , Delmege Limited and Sun Tan Beach Resorts Ltd. He is
the Co- Chairman of Hayleys PLC, Executive Deputy Chairman of LB
Finance PLC and Deputy Chairman of Horana Plantations PLC, and
Lanka Ceramic PLC. He is the Executive Director of Vallibel Finance
PLC. He also serves on the Boards of Amaya Leisure PLC, Lanka Tiles
PLC, Haycarb PLC, Hayleys MGT Knitting Mills PLC, The Kingsbury
PLC, Dipped Products PLC & Hayleys Global Beverages (Pvt) Ltd.
Mr A M Weerasinghe - Deputy Chairman
Founder of Royal Ceramics Lanka PLC in 1990. A Gem Merchant by
profession. Has been in the business field for more than 30 years
involved in Real Estate, Construction, Transportation & Hospital
Industry. Has been a Landed Proprietor. In addition to the above, also
the Chairman of the Singhe Hospitals Ltd and Weerasinghe Property
Development (Pvt) Ltd.
Mr. Nimal Perera - Managing Director
In the director panel since 2002, Mr. Nimal Perera serves on boards of
Pan Asia Banking Corporation PLC, Lanka Tiles PLC, Lanka Walltiles
PLC, Lanka Ceramic PLC, Horana Plantations PLC, Swisstek Ceylon
PLC, N P Capital Limited and N Capital (Pvt) Ltd as the Chairman,
Vallibel One PLC as the Deputy Chairman, LB Finance PLC as an
Executive Director, Vallibel Power Erathna PLC and The Fortress
Resorts PLC as an Alternate Director. He also holds directorships in
Hayleys PLC, Kingsbury PLC, Haycarb PLC, Talawakelle Tea Estates
PLC and Amaya Leisure PLC. He is a renowned business magnate,
stock trader and shareholder of many companies in the country.
Mr. Tharana Thoradeniya- Director Marketing and Business Development/ CEO - Rocell Bathware Ltd
Tharana Thoradeniya has over two decades of senior management
experience in multi- industry scenarios. He sits on the Boards of
several public quoted and privately held companies in Sri Lanka,
including Pan Asia Banking Corporation PLC, Lanka Walltiles PLC,
Lanka Tiles PLC, Hayleys Fibre PLC, Delmege Limited, Uni-Dil
Packaging Limited, Vallibel Plantation Management Limited, Dipped
Products (Thailand) Limited, and several others. He is a Group
Director of Royal Ceramics Lanka PLC and CEO/Director of Rocell
Bathware Ltd. Tharana has been credited as a proven business
innovator across industries. A marketer by profession, Tharana was
in the pioneering batch of Chartered Marketers of the Chartered
Institute of Marketing (UK).

13
Mr M D S goonatilleke
Mr Goonatilleke is a Financial Professional with over 30 years post
qualification experience. He has held senior managerial positions
in leading Public, Multinational and Private Companies during his
career. He is an Associate Member of the Institute of Chartered
Management Accountants (UK), since 1987 as well as a Certified
Global Management Accountant (CGMA). He is a passed finalist of
the Institute of Chartered Accountants (Sri Lanka). Mr Goonatilleke
has obtained a Post Graduate Diploma in Management from PIM
of University of Sri Jayawardenapura as well. He currently services
as a Group Executive Director of DSL Group of Companies. Mr
Goonatilleke also serves as an independent Director of Hayleys PLC,
Colombo Land & Development Company PLC and Pan Asia Banking
Corporation PLC.
Mr. L T Samarawickrama
An internationally qualified Hotelier having gained most of his
Management experience in UK, working for large international hotel
chains over a long period of time. The first Sri Lankan Manager to be
appointed by the Beaufort International Chain of Hotels to run the first
seaside boutique resort. He is a member of the Institute of Hospitality,
UK (formerly HCIMA) and of the Royal Society of Health, London.
He has several years of experience in the trade, having specialized
in Hotel designs and development, he has been responsible
for the careful planning and execution of Amaya Resorts & Spas
refurbishment and rehabilitation programmes.
Director of Royal Ceramics Lanka PLC since 2003, Mr
Samarawickrama is an Executive Director of Hayleys PLC and serves
as the Managing Director of Amaya Leisure PLC, The Kingsbury
PLC, Hunas Falls and Sun Tan Beach Resorts. He is also a Director of
The Fortress Resorts PLC, and Kelani Valley Plantations PLC, Royal
Porcelain (Private) Limited, Royal Ceramics Distributors (Pvt) Ltd,
Rocell Bathware Limited, Culture Club Resorts (Pvt) Ltd and Kandyan
Resorts (Pvt) Ltd.
Mr R B Thambiayah
Mr Ravi Thambiayah holds a degree in Economics from the University
of Madras. He is a well known and highly respected figure in the Sri
Lankan Hotel industry. He was the President of Colombo City Tourist
Hotels Association and Vice President of the Tourist Hotels Association
of Sri Lanka. He is the Chairman of several companies in the Renuka
Hotels Group, Cargo Boat Development Company PLC and a Director
of Rocell Bathware Limited and Royal Porcelain (Private) Limited. He is
fellow of the Chartered Management Institute (UK).
Mr R N Asirwatham
Mr Rajan Asirwatham was the Senior Partner and Country Head of
KPMG Ford Rhodes Thornton & Company from 2001 to 2008. Further,
he was the Chairman of the Steering Committee for the Sustainable
Tourism Project funded by the World Bank for the Ministry of Tourism
and also a member of the Presidential Commission on Taxation,
appointed by His Excellency the President.
As at present, Mr Asirwatham, a fellow member of the Institute of
Chartered Accountants of Sri Lanka. He is also a member of the
Ceylon Chamber of Commerce Advisory Council. He also serves
on the Boards of Fentons Ltd, Vallibel One PLC, Ceylon Tea Services
PLC, CIC Holdings PLC, Brown & Company PLC, Aitken Spence PLC,
Aitken Spence Hotels PLC, Dial Tex Industries Private Limited, Renuka
Hotels Private Limited, Rajawella Holdings Private Limited, Mercantile
Merchant Bank, Dankotuwa Porcelain PLC, Colombo City Holdings
(Pvt) Ltd, Peninsular Properties (Pvt) Ltd and Yaal Hotels Private
Limited.

14 Royal Ceramics Lanka PLC . Annual Report 2014 - 2015
Mr. Harsha Amarasekera
Mr. Harsha Amarasekera, President Counsel is a leading Lawyer in
Sri Lanka having a wide practice in the Original Courts as well as in
the Appellate Courts, specializing in Commercial Law, Business Law,
Securities Law, Banking Law and Intellectual Property Law.
He also serves as an Independent Director in several leading listed
companies in the Colombo Stock Exchange including CIC Holdings
PLC (Chairman) , Chemanex PLC (Chairman), Vallibel One PLC, Expo
Lanka Holdings PLC, Chevron Lubricants Lanka PLC, Amana Bank
PLC, Keells Food Products PLC, Amaya Leisure PLC, & Vallibel Power
Erathna PLC. He is also the Chairman of CIC Agri Business (Private)
Limited.
Mr. g A R D Prasanna
Mr. Prasanna was appointed to the Royal Ceramics Board on 29 May
2009. He is the Managing Director of Wise Property Solutions Pvt
Ltd and also serves as Director on the Boards of Pan Asia Banking
Corporation PLC, Delmage,&Grand Mark Pvt Ltd.
Arnila Lakshmi Thambiayah
Alternate Director to Mr. R B Thambiayah
Arnila Lakshmi Thambiayah holds a Bachelor of Arts (Hons.) in
Management Studies from the University of Nottingham, UK and a
Master of Science in International Business and Management from
Manchester Business School, University of Manchester, UK. She has
worked at Keells Hotel Management Services Ltd and John Keells
Holdings – New Business Development and Group Initiatives. She is
the Jt. Managing Director of Renuka Hotels Ltd and Renuka City Hotels
PLC and a Director of Cargo Boat Development Company PLC.
BOARD OF DIRECTORS

15
“Expansion through innovation has always been at the core of our business, with every investment made in the latest technology serving to increase productivity, improve quality and create a wider product portfolio.”
MAnAGEMEnT DISCUSSIOn & AnALYSIS
16 Royal Ceramics Lanka PLC . Annual Report 2014 - 2015
BIg IDEASIn May 2013 Royal Ceramics Lanka PLC gained a controlling stake
in Lanka Ceramic PLC and its subsidiaries, and as a result Lanka
Walltiles PLC and Lanka Tiles PLC came under the Rocell umbrella,
giving Royal Ceramics a dominant share in both the local wall and
floor tile markets.
Royal Ceramics Lanka PLC is a public Limited liability company
quoted on the Colombo Stock Exchange. The company operates
four fully owned subsidiaries, Royal Porcelain (Private) limited,
Rocell Bathware Limited and Ever Paint and Chemical Industries
(Private) limited and Rocell Pty limited (Australia).
The manufacture and retail of porcelain and ceramic tiles under
the brand name “Rocell” forms the core of the Group’s business.
The Group’s sanitary ware products are marketed under “Rocell
Bathware” and its paint and allied products are marketed under the
brand name “ColorBrite”.
In May 2013 Royal Ceramics Lanka PLC gained a controlling
stake in Lanka Ceramic PLC and its subsidiaries, including Lanka
Wall tiles, Lanka Tiles, Horana Plantations, Swisstek and Uni-Dil
Packaging. As a result of this landmark acquisition, Lanka Wall tiles
and Lanka Floor tiles came under the Rocell umbrella, giving Royal
Ceramics a dominant share in both the local wall and floor tile
markets.
Industry Overview
The country recorded a GDP of 7.4% in 2014. The Industry sector
contribution within the GDP rose to 32.2%, with the fast expanding
Construction sub sector recording the highest contribution to this
growth.
Sri Lanka is an island rich in minerals such as kaolin, ball clay,
feldspar, silica sand, quartz and dolomite; and is renowned for
producing exquisite porcelain tableware, porcelain ornamental-
ware and glazed wall and floor tiles for both the local and export
markets.
This highly conducive environment ensures excellent potential
for the further growth of the local tile and sanitary ware sectors.
2014/15 saw a degree of relief for the industry in the form of a
reduction in LPG prices and electricity tariffs, which helped lower
high production expenditure; in addition to this the lowering of
interest rates also had a positive effect decreasing the Groups’
finance costs.
However two key challenges remain. The first is the inadequately
governed import of tiles from India, China, Indonesia and Europe
which should be answered with stricter regulations and stringent
anti dumping laws. Second is the need for the local mining and
quarrying sector to be streamlined and regulated so that it runs
more efficiently and with better productivity. These two factors
must be addressed if detrimental effects to the local tile and
ceramics industry are to be avoided.
Financial Performance
During 2014/15 Group revenues increased to Rs. 22.4 billion from
Rs.19.7 billion in the previous year. Company revenue increased to
Rs. 2.6 billion from Rs. 2.4 billion in 2013/14.
Company profit after tax was Rs. 779.5 million compared to
Rs. 854.6 million in the previous year, and the group profit after tax
stood at Rs. 3.1 billion against Rs. 2 billion in the previous year.
Finance costs decreased from Rs. 1405 million in 2013/14 to Rs. 971
million during the year under review. The share price ended this
year at Rs. 111.00 compared to a price of Rs. 79.3 per share as at
March 31, 2014.
MAnAGEMEnT DISCUSSIOn & AnALYSIS

17

18 Royal Ceramics Lanka PLC . Annual Report 2014 - 2015
Key goals for 2015/16 include the implementation of TPM (Total Productivity Management) across the factories in the Group. New methodology to reduce staining of polished tiles has been developed in house, and will be put into place.
Operational Highlights
Expansion through innovation has always been at the core of our
business, with every investment made in the latest technology
serving to increase productivity, improve quality and create a
wider product portfolio.
During the year under review the company invested in the
construction of New Warehouse with the capacity of 2700 pallets.
A new sorting line for the Squaring and Polishing operation
which also features automatic unloading and a RED LINE machine
for warpage measurement, was installed along with a new dust
suction unit and a new Powder Mixing control unit. Apart from
the productivity gains that will result from this state of the art
machinery, increases in energy efficiency will serve as a further
advantage.
The decision to shift to LPG to power the duel fuel kiln proved
immensely beneficial, which gave the company an impressive
savings. The Average Cumulative Yield improved from 84% to
85.5% and kiln efficiency improved from 94.5% to 96.6% during
the year under review.
Energy efficiency was further increased by the replacement of
Speed variators with inverter controlled gear motors; and via the
reduction of KVA Units in the Squaring and Polishing plant.
Manufacturing changes were made in order that production costs
could be reduced. The use of locally available materials to develop
economical white bodies allowed the company to dispense with
the use of expensive Zirconium. The new bodies not only add value
but also meet stringent technical standards.
The development of fast firing bodies and a green base body for
products in the darker colour range, led to significant savings,
with the latter initiative resulting in a 70% reduction in body cost,
resulting in significant savings per month.
The Groups’ paints and allied products are marketed under the
‘ColorBrite’ brand. Thanks to investments made in technical
knowhow, ColorBrite is now a high quality product on par with its
international counterparts. Proof of this lies in the achievement
MAnAGEMEnT DISCUSSIOn & AnALYSIS
‘Crefa’ Digital Printing Machine at Eheliyagoda plant

19
of SLS certification for both ColorBrite’s emulsion and enamel
paints. The range is now available exclusively via the Lanka Tiles
direct dealer and distributors network. The local paint market is
a lucrative one for our high volume competitors. However a small
volume high cost outfit like ColorBrite, demands further investment
and expansion. Discussion as to ColorBrites future will take place
during 2015/16.
Internal Control Systems
The Group introduced a Business Intelligence tool for report
generation and detailed analysis during the year under review.
The tool is available to staff across the various subsidiaries and
it also open to showrooms staff. This is particularly useful since
showrooms now have access to performance scorecards enabling
them to accurately judge their progress and provide innovative
solution that will help them reach a specified goal. The system is
simple and transparent and allows for greater clarity, efficiency
and streamlining across the group.
Human Resource Development
The personal and professional development of our staff is a
priority, and investment in regular training and development
programs were a key aspect of the Groups’ Human Resource
mandate for the year 2014/15.
Royal ceramics’ Human resource development initiatives for
2014/15 included safety training programs for operators, as well
as international training for selected executive staff members in
various specialized subjects.
In addition, the Group also placed emphasis on recreational
activities. The annual Trip for all staff and Shop floor employees
took place during 2014/15. They spent a fun filled day, building
relationships and strengthening their professional and personal
bonds.
Annual family days were also organized for the staff of every
factory within the Group. The Annual Get Together for employees
and their family members of head office staff was also a great
success.
Future Outlook
In 2014 GDP per capita increased to US dollars 3,625 from US
dollars 3,280 in the previous year. This figure is expected to rise,
a fact that can only serve as a positive for the tile and ceramic
industries, since tile consumption is directly linked to per capital
Income.
At Royal Ceramics we are ready to make the most of this positive
environment. Key goals for 2015/16 include the implementation of
TPM (Total Productivity Management) across the factories in the
Group. New methodology to reduce staining of polished tiles has
been developed in house, and will be put into place.
2014/15 was a positive year for the Group and 2015/16 is expected
to exceed that performance.
As a successful group with a market Leadership in many of the
areas in which we operate, Royal Ceramics Lanka PLC and its
subsidiaries are all committed to one ultimate goal - crafting
enduring value into everything we do, and delivering positive
results and clear advantages to all our stakeholders. Be they
investors, customers, employees, suppliers or members of the
local communities in which we operate, we are focused on making
a positive, sustainable impact in their lives. We extend that same
philosophy to our environment, seeking to renew, preserve, and
mitigate wherever possible. In this way, via careful and consistent
value crafting, we will ensure not just our own success, and that of
our stakeholders; but we will also contribute to the development
and progress of our nation.

20 Royal Ceramics Lanka PLC . Annual Report 2014 - 2015
MAnAGEMEnT DISCUSSIOn & AnALYSIS
Subsidiary companies
Royal Porcelain (Private) LtdTechnology and innovation are the watchwords of Royal Porcelain Lanka Ltd, a company that for over a dozen years has been engaged in the design and manufacture of superior quality tiles for walls and floor under the ‘Rocell’ brand name. Rocell’s commitment to advancement is at the very core of its brand equity, with a business philosophy built on continuous modernization, new machinery and state of the art infrastructure.
History and Achievements
Perfection is the goal through every stage of the process, starting with the selection of the raw materials that are used to form the body of each Rocell tile. These materials are generally homogenized to ensure consistency in composition.
The company’s high capacity modern plant in Horana, has a production capability of 10,000 Sq.m. of tiles per day. A series of demanding tests and certifications are applied at every turn. All tiles are compatible to ISO 13,006 Standard and EN Standard and are Classified under GPB 1 and B2
The company’s manufacturing arm operates 3 production lines, with all dedicated to state of the art digital printing technology, most advanced selection lines with redline measuring technologies guarantee the production of defect minimized and design optimized Glazed Ceramic and Vitrified Glazed Porcelain tiles.
Situated in Meegoda and Nawala are Rocell’s ultramodern warehouses. The internationally renowned ‘Schaefer’ racking system from Germany ensures accuracy and efficiency, while German engineered ‘Still’ reach trucks handle the transportation of the tiles insuring against bruising and damages.
Design novelty and creativity are mainstays of the brand, and are maintained via collaborations with the best Italian designers in the industry. The company’s high quality products are available
via a strong network of concept centres stores, state of the Art showrooms, as well as dealer and franchise outlets across the island.
growth and Development in 2014/15
Over Rs.20Mn was invested in warehouse capacity expansion
during the year under review. The new finished goods warehouse
has a 100,000 sqm capacity, while projects to upgrade our water
treatment and processing plant, and develop a road network and
new car park at our factory complex were also completed.
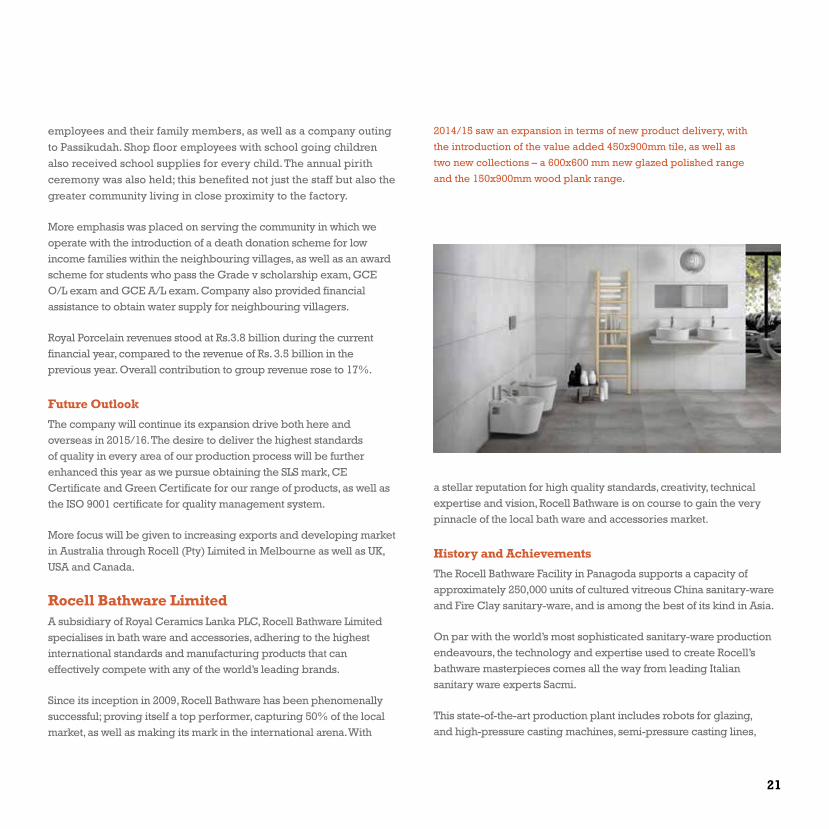
2014/15 saw an expansion in terms of new product delivery, with the introduction of the value added 450x900mm tile, as well as two new collections – a 600x600 mm new glazed polished range and the 150x900mm wood plank range. These new products offer customers increased value as well as greater versatility and creative freedom.
A significant investment was also made in mitigating negative environmental impacts via a SLR 1.2Mn investment in increasing the height of the factory boundary walls in order to reduce noise pollution. The skylight laying project increases day light usage within the factory thereby contributing to its energy saving drive, and the development of natural water drain streams around the factory boundaries contributed to avoid spillage of rain water during the rainy season and benefited farmers in the neighbouring villages.
Our commitment to our employees was manifest in 2014/15 via a series of training programs and workshops. 5S training was conducted for all staff, and a fork lift driving program enabled workers to improve their driving skills. The company also facilitated workers to obtain NVQ level 3 certificates in heavy machines driving.
Royal Porcelain also continued its employee engagement initiatives with an annual family day organized for all staff, shop floor
21
2014/15 saw an expansion in terms of new product delivery, with
the introduction of the value added 450x900mm tile, as well as
two new collections – a 600x600 mm new glazed polished range
and the 150x900mm wood plank range.
employees and their family members, as well as a company outing to Passikudah. Shop floor employees with school going children also received school supplies for every child. The annual pirith ceremony was also held; this benefited not just the staff but also the greater community living in close proximity to the factory.
More emphasis was placed on serving the community in which we operate with the introduction of a death donation scheme for low income families within the neighbouring villages, as well as an award scheme for students who pass the Grade v scholarship exam, GCE O/L exam and GCE A/L exam. Company also provided financial assistance to obtain water supply for neighbouring villagers.
Royal Porcelain revenues stood at Rs.3.8 billion during the current financial year, compared to the revenue of Rs. 3.5 billion in the previous year. Overall contribution to group revenue rose to 17%.
Future Outlook
The company will continue its expansion drive both here and overseas in 2015/16. The desire to deliver the highest standards of quality in every area of our production process will be further enhanced this year as we pursue obtaining the SLS mark, CE Certificate and Green Certificate for our range of products, as well as the ISO 9001 certificate for quality management system.
More focus will be given to increasing exports and developing market in Australia through Rocell (Pty) Limited in Melbourne as well as UK, USA and Canada.
Rocell Bathware Limited A subsidiary of Royal Ceramics Lanka PLC, Rocell Bathware Limited specialises in bath ware and accessories, adhering to the highest international standards and manufacturing products that can effectively compete with any of the world’s leading brands.
Since its inception in 2009, Rocell Bathware has been phenomenally successful; proving itself a top performer, capturing 50% of the local market, as well as making its mark in the international arena. With
a stellar reputation for high quality standards, creativity, technical expertise and vision, Rocell Bathware is on course to gain the very pinnacle of the local bath ware and accessories market.
History and Achievements
The Rocell Bathware Facility in Panagoda supports a capacity of approximately 250,000 units of cultured vitreous China sanitary-ware and Fire Clay sanitary-ware, and is among the best of its kind in Asia.
On par with the world’s most sophisticated sanitary-ware production endeavours, the technology and expertise used to create Rocell’s bathware masterpieces comes all the way from leading Italian sanitary ware experts Sacmi.
This state-of-the-art production plant includes robots for glazing, and high-pressure casting machines, semi-pressure casting lines,
22 Royal Ceramics Lanka PLC . Annual Report 2014 - 2015
automated dryers and high performance kilns. The brand conforms to British Standard-BS 3402:1969 and European CE certification, a key guarantee of consumer safety, health and environmental ideals. The production process is endorsed under the ISO 9001: 2008 quality management system and adheres to ISO 14001 : 2004 environmental standards.
Rocell Bathware draws its design inspiration from the beauty of nature, a muse that provides designers with an infinite and rich source of inspiration and creativity.
This creativity extends to the Rocell Bathware concept stores. These experiential stores allow customers to not only view Rocell’s fine products, but to also see them within a suitable and aesthetically pleasing context
growth and Development in 2014/15
During the year under review, Rocell Bathware generated a revenue of Rs.1.35 billion, compared to Rs. 1.12 billion registered in 2013/14. The company contributed 6% of the Group’s Revenue in 2014/15.
Rocell Bathware was proud to have its production process endorsed under the ISO 9001:2008 quality management system. The factory’s ISO 14001:2004 environmental standards certification was also renewed in recognition of its commitment to Green Initiatives.
The company invested in the installation of a sewerage treatment plant at a cost of Rs. 8.5 million. This was deemed necessary in order that the company could meet its social and environmental protection goals. Rocell Bathware now recycles all its sewerage water after biologically treated via this Plant.
Several new benefit schemes were introduced for employees during the year under review. These included the implementation of a death donation scheme and an insurance scheme for staff members. Training and development was also high on the agenda, and the company carried out a Trade Test for Fork Lift Operators
In the year under review, Rocell Bathware PLC entered into a partnership with Grohe AG of Germany, the world’s largest design portfolio of single branded Sanitary fittings with a revenue of Euro 1.58 Billion (2014). Under this agreement Rocell is authorised to directly import and retail Grohe Sanitary fittings. Inclusion of Grohe in Rocell’s product portfolio is considered a fitting tribute to our endeavour to provide a complete world class designer Bathware solution to deserving consumers in Sri Lanka.
From a recreational and team building stand point, Rocell Bathware hosted its entire staff to an annual trip. The 2014/15 trip to Wadduwa, saw our members of staff and their families enjoy a day of revelry and relaxation.
Staff welfare activities for the year under review included a medical camp conducted in collaboration with the Homagama Ministry of Health; and an eye clinic for all employees.
The company also extended its philanthropic efforts, making generous donations of sanitary ware sets to the Athurugiriya Police Station, funding the renovation of the gate and donating dictionaries to the Sri Parakrama Maha Vidyalaya in Panagoda and donating towards the repair of the road leading to the entrance of the zone. An alms giving was held and medicine donated to the Cancer Hospital. The staff together with the National Blood Bank also conducted a blood donation campaign.
MAnAGEMEnT DISCUSSIOn & AnALYSIS
Subsidiary companies
In the year under review, Rocell Bathware PLC entered into a
partnership with Grohe AG of Germany, the world’s largest
design portfolio of single branded Sanitary fittings with a revenue
of Euro 1.58 Billion (2014).

23
Future Outlook
Our goals this year include obtaining WELS (Water Efficiency Labelling scheme) for our range of sanitary ware and appliances
Just six years in the making, Rocell Bathware’s clear and continuous upward trajectory pins the company as the rising star of the Group. 2015/16 will be a year in which the company continues to pursue excellence in quality, design and delivery, expanding its reach at home, as well as in key international markets.
Lanka Ceramic PLCIn 2012/13, Lanka Ceramic PLC moved out of the retailing
business and chose to focus on the mining and processing of
the raw materials essential for the Tiling and Ceramic Industry.
Today, almost 90% of company’s production goes towards tile
manufacturing, making it the largest supplier of essential raw
materials for the local tiling sector.
Lanka Ceramic PLC and its subsidiaries were acquired by Royal
Ceramics Lanka PLC in May 2013. During the years since its
acquisition Lanka Ceramic has seen improved mining capacity for
both ball clay and feldspar; as well as increased productivity and
cost effectiveness across the board.
The Lanka Ceramic PLC group includes Lanka Tiles PLC, Lanka
Walltiles PLC, Horana Plantations PLC, Uni-Dil Packaging Ltd and
Swisstek Aluminium Ltd, Ceytea Plantation Management Ltd, Uni-
Dil Papersacks (Pvt) Ltd and Swisstek Ceylon PLC.
The company’s mines are located in Meetiyagoda, Ovala and
Dediyawela from which Kaolin, Feldspar and Ball Clay are mined
respectively.
Rocell Bathware draws its design inspiration from the beauty of nature, a muse that provides designers with an infinite and rich source of inspiration and creativity. History and Achievements
Sri Lanka’s ceramics industry dates back to antiquity (500 –
250BC); however the need for developing this local cottage
industry was not felt till centuries later. The Government Ceramic
Factory at Negombo, was opened in 1942. In September 1955,
“Ceylon Ceramics” was established to spearhead the development
of the local ceramics industry, and in August 1958 was renamed the
“Ceylon Ceramics Corporation”.
The Ceylon Ceramics Corporation was commercialized in January
1990 under the name Lanka Ceramic PLC. Incorporated in 1991,
Lanka Ceramic PLC now comprises eight subsidiary companies
catering to numerous sectors and segments of the domestic
market.
growth and Development in 2014/15
Despite several key challenges including the restrictions of
demand from major customers, negative weather conditions and
competition with private and imported clay suppliers; Lanka
Ceramic PLC was able to achieve its financial targets, and is
currently at the top of its game as the largest raw clay supplier in
Sri Lanka.
The accumulated production for the current financial year includes
42,617 MT made up of 2,312 MT from Meetiyagoda, 17,745 MT from
Dediyawela, and 22,560MT from Ovala.
Lanka Ceramic PLC was able to achieve a Revenue of Rs. 163
million during the year under review, with a Profit After Tax of
Rs.245 million compared to the Profit of Rs.58 million in the last
financial year.

24 Royal Ceramics Lanka PLC . Annual Report 2014 - 2015
MAnAGEMEnT DISCUSSIOn & AnALYSIS
Subsidiary companies
Key goals for 2015/16 include moving towards other ceramic
products supplies, raw material quality improvements through
investment in new technology and the continued search for, and
acquisition of, mining lands.
Lanka Ceramic PLC continued its drive to secure more clay rich
land in 2014/15. The Ovala mine of 05 acres & the Etholuwa mine in
Meetiyagoda of 3.5 acres, will provide sufficient operating capacity
for another 08 years and 05 years respectively, ensuring a steady
supply for the company’s customers.
The current mine in Dediyawala will provide a continuous supply
of ball clay for another year. Lanka Ceramic will look to mine
Delduwa land, which will provide sufficient capacity for further 02
years.
Lanka Ceramic PLC has implemented several internal control
systems with respect to all its operational and financial spheres, in
order to ensure adherence to good corporate governance. These
measures include a special hierarchical approval procedure for
authorizing major capital expenditures, sudden site visits and
audits by the Head Office, as well as internal controls for observing
the attendance and daily productivity of all employees.
The company is committed to adhering to the specifications for
the rehabilitation of all mines, as per the environmental regulations
imposed by the CEA. The maintenance of the access roads to the
mines, construction and display of security fences and warning
boards, and other regulations that serve to protect the surrounding
community, are followed in an efficient and timely manner.
Lanka Ceramic PLC also re-evaluated and is in the process of
rectifying any glitches in the factory’s Energy Waste Processes.
The community surrounding the Etholuwa mine in Meetiyagoda
now benefits from a supply of fresh water provided by the
company. This community service project benefits over 80 people
living around the mine.
Taking care of its Human Resources is a priority for the company
and 2014/15 saw the implementation of several welfare initiatives
designed to support and motivate them. These included the annual
company trip for all factory employees and their families, an
annual “bahirawa pooja” carried out at every mine, as well as an
uniform allowance for factory employees.
Future Outlook
Royal Ceramics Lanka PLC has ambitious long term plans for Lanka
Ceramic PLC, and sees in the company an opportunity to create a
blueprint for the mining industry of Sri Lanka.
Despite the challenges that lie ahead in terms of obtaining mining
license for clay mines, the intense competition from low cost
imports, and difficulty purchasing mining lands; the company
is confident that it will continue to grow. Key goals for 2015/16
include moving towards other ceramic products supplies, raw
material quality improvements through investment in new
technology and the continued search for, and acquisition of, mining
lands.

25
Lanka Tiles PLC Lanka Tiles PLC was incorporated in 1984, with Ceramic Glazed floor
tiles as its core business. Today, this pioneer in floor tile manufacture
in Sri Lanka, has a production capacity of 3 million square meters per
year, and caters to both local and international markets. Delivering the
total tile package, the company is committed to offering state of the
art technology, high quality materials and inspirational designs and
textures.
History and Achievements
A household name in Sri Lanka, and well respected in the competitive
international market, Lanka Tiles takes pride in its use of primarily
indigenous raw materials, a 100% Sri Lankan work force and the
application of the latest in Italian technology. The factory produces
tiles in a range of sizes and textures including matt, rough, gloss, stone,
marble and terra-cotta, in a variety of self-colours or shades. All Lanka
Tiles products conform to ISO 13006.
The company operates in both the domestic and international
markets. In the former, via showrooms in Nawala and Jawatte, as
well as 40 Franchise showrooms islandwide; while the latter focuses
on exports to Australia, New Zealand, USA, Japan, India, Maldives,
Pakistan, Fiji, Singapore, Canada and the UAE.
The Company operates an ultra-modern factory at Ranala. The
complex is spread over 30 acres and is equipped with the latest
technology and staffed with highly skilled engineers and technicians.
Lanka Tiles has warehouses in Nawala, Rajagiriya and Biyagama, a
factory outlet in Balummahara, as well as six Consignment agents.
growth and Development in 2014/15
Lanka Tiles PLC was able to secure a 5.5% YoY growth in volume
during the year under review, which led to an increase in both top and
bottom line growth. The company’s turnover crossed the Rs. 5Bn mark
to register a revenue growth of 5%, compared to 2013/14.
The company’s shares traded strongly, ending the year on a positive
note, trading at Rs. 106/- per share as at 31st march 2015.
Credit for this improved performance lies largely with ongoing efforts
to streamline operational processes, improve efficiencies across the
board and optimize capacity utilization at the Lanka Tiles factory. Of
the Rs. 165 Million invested during the year, Rs. 29 Mn went on a range
Continuously re-evaluating the value proposition presented to the customer and investing in enhancing both our design andmanufacturing capabilities, will play key roles, as will maximizing the advantages of the company’s widespread franchise network.
TECNOFERRARI - VIVA JET Digital Printing Machine at Lanka Tiles factory at Ranala

26 Royal Ceramics Lanka PLC . Annual Report 2014 - 2015
of state-of-the-art equipment upgrades that would serve to augment
existing digital printing capabilities, design and product quality.
Reducing operational costs also remained a key priority for the
company and much effort went into introducing energy efficient
technologies and streamlining manufacturing processes in line
with the ISO 9000 Quality Management Systems, the ISO 14000
Environmental Management Systems and the OHSAS 18000
Occupational Health and Safety Management System framework.
Apart from strict and consistent internal systems and controls, the
reduction in energy costs resulting from the drop in world crude oil
prices also helped boost margins. Low global energy prices resulted
in cost savings in gas and kerosene, and led to a growth in gross profit
from 32% last year to 36% in the current year.
2014/15 saw a systematic expansion of the company’s island wide
reach as the number of franchise showrooms grew from 36 to 40,
which helped to reduce the company’s dependence on the dealer
network. The Jawatte showroom was renovated and converted into
a concept showroom so as to better present its value proposition to
high-end and niche value customers.
The Lanka Tiles Tilers Club was introduced as part of the company’s
brand awareness campaign. This pioneering initiative is aimed at
developing business partnerships that will help the brand penetrate
as yet untapped markets in Sri Lanka. In addition the Tiler Plus sales
outlet scheme, an innovative new sales model that will allow the
further extension of the company’s reach into new territories and
geographies across the island, was also launched.
With the Lanka Tiles showroom in Bangalore, India, showing
promising results, the company expanded its regional presence in
2014/15 to include the Maldives. The year under review also saw the
development of the emerging potential in the North American and
European markets.
With an awareness that development begins from within, the
company’s comprehensive HRM module encapsulates fair practices
within a framework of ethical conduct. Throughout the year we
continued to engage in a number of proactive measures to further
enrich our human capital.
Lanka Tiles also continued to invest in information technology,
revisiting our IT framework, and making the necessary improvements
that allowed for the formation of the most efficient operational
template. Key changes that would help realize possible cost savings
and improve overall efficiencies were brought in during the year
under review.
Future Outlook
The recent changes in the political and economic landscape in the
country seem likely to have a positive impact on the company, as
the tile industry benefits from stricter regulatory controls that would
enable better domestic economic opportunities.
Lanka Tiles will continue to leverage its competitive advantage to
penetrate a wider cross section of the market island-wide, relying
on Group synergies to improve operational processes and refine the
company’s strategic focus.
Continuously re-evaluating the value proposition presented to
the customer and investing in enhancing both our design and
manufacturing capabilities, will play key roles, as will maximizing the
advantages of the company’s widespread franchise network.
2015/16 will also be a year for aggressively developing the brands
presence in key overseas markets, especially in North America and
Europe. Underpinned by the recent revival of economic activity
in many advanced economies, we will focus on strengthening our
foothold in these markets, in the year ahead.
MAnAGEMEnT DISCUSSIOn & AnALYSIS
Subsidiary companies

27
Lanka Walltiles PLCAs part of the Royal Ceramics Group, Lanka Walltiles has evolved into a larger more versatile operation since 2013.
The only manufacturer of glazed ceramic wall tiles in Sri Lanka, Lanka Walltiles PLC has held a dominant market position locally as well as internationally, for four decades. Incorporated in 1975 as an export oriented joint venture with Japanese partners; Lanka Walltiles PLC commenced commercial production in its Balangoda factory in May 1977 and quickly established itself as a leading contender in the highly competitive international wall tile arena. In 1994 it became a public quoted company, and the growth of the business both in the domestic and export markets led to the commissioning of a second factory, using state of the art Italian technology and internationally renowned machinery, in Meepe, Padukka.
History and Achievements
Lanka Walltiles produces an unmatched range of tiles in a variety of colours, textures and sizes including special trim tiles, decorated tiles, as well as handmade and hand painted tiles. Producing approximately 2.6 million square meters of tile annually, Lanka Walltiles has set the industry standard for productivity, efficiency, quality and creativity of design.
The company has always invested heavily in Research & Development in order that its tiles continue to meet the exacting manufacturing standards of the international marketplace. Lanka Walltiles conform to British, European, Singapore, Hong Kong and Japanese Standards, and in 1997, the company was awarded the ISO 9001 quality system certification for design development and manufacture of ceramic glazed wall tiles.
Lanka Walltile PLC was the first export oriented company to win the much coveted Presidential Export Award in 1981, and has continued to do so multiple times since. The company has also been honoured at the National Productivity Awards.
The company exports products to international markets including Australia, Bangladesh, Canada, France, Hong Kong, Japan, Middle East, Maldives, the Netherlands, New Zealand, Singapore, South Africa, Taiwan, USA, India and UK.
With an Environmental Management System that is consistently documented, implemented, effectively maintained and communicated to all relevant personnel; the company champions eco friendly principles and is on the cutting edge of green tile production.
Automatic lazer guided tile transporter at Meepe plant High tech ‘Durst’ Digital Printing Station at Meepe plant
28 Royal Ceramics Lanka PLC . Annual Report 2014 - 2015
growth and Development in 2014/15
A highly competitive operating environment remained a key challenge for the company during the year under review. The competition from imported tiles continued to be a dominant factor in volume that threatened to undermine the company’s current market share of 56%.
Lanka Walltiles PLC faced this challenge in a proactive and focused manner in 2014/15. The company produced a range of new design concepts and widened the range of sizes on offer so as to cater to a broader spectrum of customer needs. While addressing the urban markets strong demand for larger tiles, the company also invested extensively in enhancing its digital printing capabilities.
The company initiated a highly focused marketing campaign to stimulate the mainstream demand for wall tiles in other regions of the country, promoting the brands core values of high quality and end to end local manufacturing.
A range of alternative distribution channels was introduced to help penetrate new markets across the country. Among these was the Tilers Club, a ground-breaking move that partners with the island-wide Tiler communities to promote the Lanka Walltile range to the mass market.
The Lankatile Plus sales outlet concept was also introduced. This innovation is based on a partnership that offers small businesses the opportunity to become registered sales agents for our brand.
Lanka Walltiles PLC also emphasized the development of the export markets in 2014/15, focusing particularly on expanding into the lucrative North American and European markets.
Human resource development is a key priority for the company. Significant investments in training and development were made during the year under review in order to ensure a future ready-workforce, equipped to drive corporate aspirations in the years ahead.
Lanka Walltiles PLC also proactively engaged in fine tuning the company’s Information Technology systems thereby improving efficiency across multiple levels of the business.
The company also benefited from the sharp decline in world oil prices in the latter half of the year, which lowered the cost of production and helped raise the Gross Profit Margin to 30% compared to the 26% recorded in 2013/14.
2014/15 was a successful year, registering a 14% YoY increase in volumes which translated into a 19% growth in Turnover from Rs. 2.6 Bn in the previous year to Rs. 3.1 Bn for the year ended 31st March 2015.
This resulted in strong bottom line growth, boosted from Rs. 194 Mn in the previous year to Rs. 517 Mn for the current year, a YoY increase of 166%
The company’s shares performed well during the year, reaching the highest traded price of Rs. 105/- per share in December 2014.
Future Outlook
The development of a marketing strategy that will go hand in hand with our brand building efforts to promote our brand to the mass market; emphasizing the versatility and functionality of the company’s product range, is a vital part of the company’s developmental strategy for the year ahead.
The synergies derived from the Group perfectly support the level of diversity we seek, and equip us with a distinct edge over our competition; this will no doubt enable us to go further in 2015/16 further securing our position as the market leader in Sri Lanka’s wall tile space.
MAnAGEMEnT DISCUSSIOn & AnALYSIS
Subsidiary companies

29
Uni-Dil Packaging LtdUni-Dil Packaging Ltd is a subsidiary of Lanka Walltiles PLC
specializing in the production of paper based packaging and
accessories. Incorporated in 1994, the company offers a full
turnkey packaging service from design to delivery. Uni-Dil
Packaging can custom manufacture, print and over-label any type
of box or packaging using any class of corrugated board.
For over two decades Uni-Dil has made steady progress,
expanding year on year, and the company is now on the cusp of
being recognized as the number one packaging company in
Sri Lanka. Uni-Dil owes this success to the dedication and hard
work of its well trained and highly motivated work force, as well as
to the company’s continuous investment in western and Japanese
productivity improvement tools which help to increase quality
and efficacy standards across the board. Its strict adherence to
a Quality Management system that complies with ISO 9001 and
ISO 14000 and the exclusive use of food grade materials are other
factors that have contributed to the company’s success.
Apart from investments in hardware, Uni-Dil has also prioritized
the establishment of a group of suppliers who share the company’s
business philosophy and vision; these partnerships form a strong
network in which customer satisfaction, professionalism and
excellence are paramount.
History and Achievements
Having secured 15% of the packaging manufacture market for
both local and export sectors, Uni-Dil supplies retail and end
user manufacturers in various industries including Tea, Garments,
Ceramics, Agriculture, Rubber and Food.
The company specializes in Printed DieCut, Standard Cartons,
Trays and Hanger Packs. In addition Uni-Dil prides itself on its
ability to custom design and manufacture corrugated packaging
boxes of any description for any industry.

30 Royal Ceramics Lanka PLC . Annual Report 2014 - 2015
MAnAGEMEnT DISCUSSIOn & AnALYSIS
Subsidiary companies
Uni-Dil abides by key management concepts and techniques such
as 5S, Quality Circles, Kaizen, T.Q.M and Six Sigma to maximize
productivity and excellence, and is a multiple award winner,
having secured the National Productivity Award in 2004 and again
in 2006 in the Manufacturing sector, 5s Award in 2001 and Kaizen
Award in 2002
growth and Development in 2014
Over the years Uni-Dil Packaging has shown an incremental growth
in profit. The company together with its fully owned subsidiary;
Uni-Dil Papersack (Pvt) Ltd continued to expand its horizons in
2014/15, registering its best ever performance, with a Turnover
growth of 15% and a net profit growth of 104% when compared to
2013/14.
This achievement is particularly noteworthy in what was a
challenging year for the entire packaging industry, due to the
recession in the West, and the turmoil in the Middle East; both
of which had a knock on detrimental effect on the local tea
and garment industries. The stable paper market contributed
immensely towards Unidil’s positive results, as did the support of
the Vallibel Group. Credit must also be given to the great effort
made by the company’s employees to capture market share,
securing the business of top end multinational companies such as,
Nestle, Dilmah, Ansell and Brandix.
The company continued to invest in productivity enhancement,
waste reduction and employee engagement in 2014/15.
Uni-Dil invested in the expansion of the main factory building, and
poured Rs. 50Mn into acquiring sophisticated Printing facilities
as well as the ability to produce E Flute and laminated cartons for
niche markets. These investments helped increase the facility’s
production capacity by 10%.
Waste reduction and the mitigation of negative environmental
impacts is a priority, and the Uni-Dil production facility which is
located on 12 acres of land in a scenic village in the Gampaha
District, is run on green principles with all company waste
recycled and turned into usable water.
Energy efficiency is assured via investment in a wood based boiler
which has served to significantly reduce energy costs.
Employee engagement is a considered vital, and staff are involved
in all decision making processes. Personal development is ensured
through various small group activities. Various religious and
recreational activities are conducted throughout the year to bring
the staff together and enhance understanding, commitment and
satisfaction among employees.
Future Outlook
Uni-Dil Packaging is a company on a definite upward trajectory,
and with plans to increase customer satisfaction via investment in
a state of the art printing machine that will enhance print quality
and performance, the management aims for a further increase in
business during the 2015/16.
Uni-Dil invested in the expansion of the main factory building, and
poured Rs. 50Mn into acquiring sophisticated Printing facilities as
well as the ability to produce E Flute and laminated cartons for niche
markets.
31
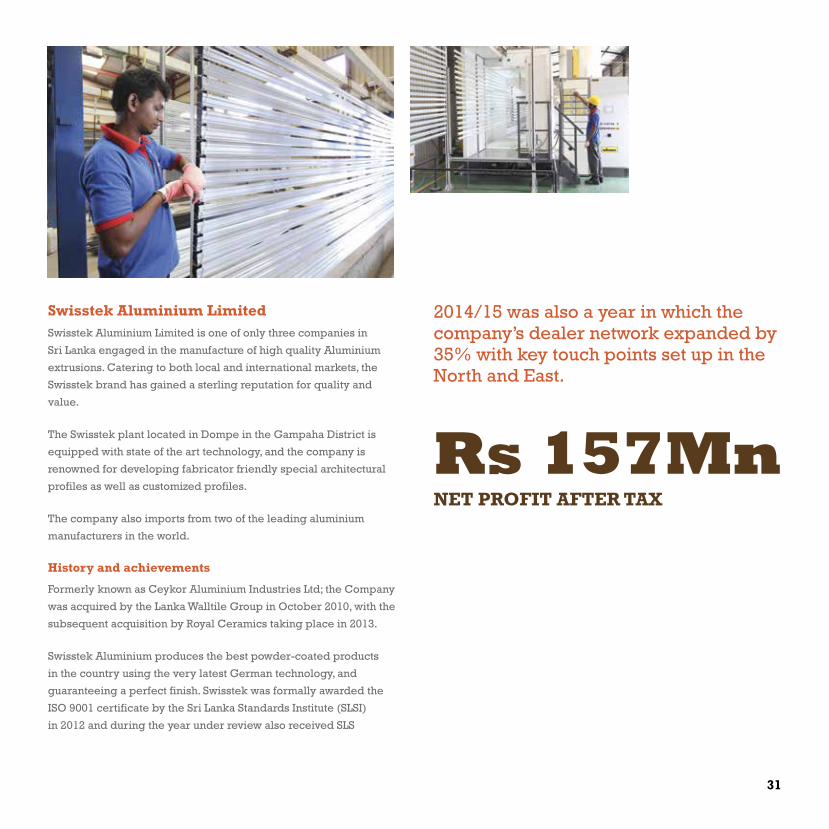
Swisstek Aluminium Limited Swisstek Aluminium Limited is one of only three companies in
Sri Lanka engaged in the manufacture of high quality Aluminium
extrusions. Catering to both local and international markets, the
Swisstek brand has gained a sterling reputation for quality and
value.
The Swisstek plant located in Dompe in the Gampaha District is
equipped with state of the art technology, and the company is
renowned for developing fabricator friendly special architectural
profiles as well as customized profiles.
The company also imports from two of the leading aluminium
manufacturers in the world.
History and achievements
Formerly known as Ceykor Aluminium Industries Ltd; the Company
was acquired by the Lanka Walltile Group in October 2010, with the
subsequent acquisition by Royal Ceramics taking place in 2013.
Swisstek Aluminium produces the best powder-coated products
in the country using the very latest German technology, and
guaranteeing a perfect finish. Swisstek was formally awarded the
ISO 9001 certificate by the Sri Lanka Standards Institute (SLSI)
in 2012 and during the year under review also received SLS
2014/15 was also a year in which the company’s dealer network expanded by 35% with key touch points set up in the North and East.
Rs 157MnNET PROFIT AFTER TAX

32 Royal Ceramics Lanka PLC . Annual Report 2014 - 2015
certification. The company also obtained the Jotune approved
applicator status for its powder coating process which ensures a
minimum 15 year warranty
Swisstek’s ultramodern machinery ensures a production rate of
350MT of high quality extrusions per month. To ensure smooth
transition and optimum productivity, the company’s anodizing and
powder coating plants have been equipped to match this level of
production. The range of products manufactured by the company
includes profiles to fabricate all types of doors, sliding doors,
windows, shop fronts, partitions, curtain walls, roller shutters,
ladders and tile beading.
The company operates at a 64% capacity with a work force of over
235 well trained professionals who are passionate about producing
superlative results.
The company also maintains excellent relationships with its
fabricators, hosting the Swisstek Aluminium dealer convention on
an annual basis and rewarding the hard work and extraordinary
performances witnessed during the given year.
Health and safety regulations are of paramount importance at
Swisstek, as is a focus on green principles formulated to mitigate
negative environmental impacts, particularly in the areas of energy
efficiency and waste water purification.
growth and development in 2014/15
2014/15 was a remarkable year for the Company as it achieved a
29.3% growth in Revenue compared to the previous financial year.
This resulted in the company ending the year with a total net profit
of Rs 157 million, a record increase of 121% when compared to
2013/14.
MAnAGEMEnT DISCUSSIOn & AnALYSIS
Subsidiary companies
These phenomenal results were largely due to a 40% improvement
in aluminium scrap collection, which was in turn matched by
developments in the Billet casting capacity. Further improvements
took place due to the company’s investment in a new Baler
machine from Shanghai, China.
As always increased productivity was not the sole goal, as
efficiency upgrades also resulted in the consumption of less
energy. Such initiatives included the installation of a new aging
oven from China, and a state of the art energy efficient oven to run
alongside the existing oven
Additions to the company’s product portfolio including triple track
sliding doors and new powder coat products proved popular,
driving sales up by 50%
2014/15 was also a year in which the company’s dealer network
expanded by 35% with key touch points set up in the North and
East.
An internal control system was put in place. This system monitors
the efficacy of control procedures within the company with
frequent updates on the adequacy and effectiveness of internal
control, compliance with laws and regulations, and established
policies and procedures.
Swisstek also engaged in various community service activities
during the year
Future Outlook
Swisstek Aluminium Limited has achieved continuous and
remarkable growth since it came under the wing of Royal Ceramics
Lanka PLC in 2013. This upward trajectory will not falter in 2015/16
as the company invests further in ultra modern machinery and
new value added systems designed to build capacity and increase
productivity.
33
Horana Plantations PLC Since being incorporated in1992, Horana Plantations PLC has
grown into a leading producer of the finest tea, rubber and other
agricultural produce, with 42 % of the company’s cultivated area
dedicated to tea, 47 % to rubber, 5 % to timber, and 6 % to other
diversified agricultural crops. As one of Sri Lanka’s premier
plantation companies, with estates primarily in the Central and
Western provinces of the island, Horana Plantations’ product range
is renowned for its exceptional quality and standards.
A large portion of the Company’s estates have been internationally
certified with quality standards. All factories are accredited with
ISO 22000:2005/HACCP Certifications. Neuchatel and Frocester
Estates have received 9001:2008/ QMS Certification.
Horana Plantations relationship with the Ethical Tea Partnership
(ETP) certification program has continued to grow and all
upcountry estates are ETP accredited. Bambarakelle, Fairlawn and
Mahanilu. were revalidated subsequent to an audit carried out by
an auditing body of the ETP during the year 2014/15
The Sustainability Agriculture Network (SAN) promotes efficient
agriculture, biodiversity conservation and sustainable community
development by creating social and environmental standards. The
company has moved into the 3rd year of the Rainforest Alliance
Certification Audit Cycle via SAN.
Fairtrade product certification applies to Stockholm and Alton
Estates, and the company continues to advocate Fair trade policies
in other Estates under the Horana Plantations umbrella.
All rubber estates under the Horana Plantations banner have been
awarded the Non - Timber Forest Products ( NTFP) Certification by
the Forestry Stewardship Council.
History and Achievements
Horana Plantations is one of the largest producers of Ceylon tea,
with an annual capacity of approximately 4.6 Million Kg of made
tea which includes fine western high grown grades include BOP,
BOP Fannings, Pekoe, Dust and Dust 1; while 14 varieties of low
grown teas are produced, of which BOP1, FBOP, Pekoe, OP1 and
OPA are but a few.
The company is also one of Sri Lanka’s largest producers of natural
rubber of various types and qualities including Latex Crepe ,
Ribbed Smoke Sheet and Sole Crepe. Horana Plantations’ rubber
factories have a total production capacity of 1.6 Million Kg of Made
Rubber per year.
Horana Plantations has gained a sterling reputation for its high
quality products, and stringent processes are applied at every
stage of production to ensure that these quality standards are
maintained at all times.
The company’s estates received multiple recognitions and awards
during the year under review
Neuchatel Estate , Naboda was awarded for “Best excellence in
Social Development through Estate Worker Housing Cooperative
Society among all Plantations in the Island presented by the
Plantation Housing Development Trust for the year 2014”.
Alton Estate was placed 1st in the Upcot /Maskeliya Agro climatic
Region in the sale Averages for the year 2014 at the Forbes and
Walkers Award ceremony. Alton Factory was positioned in 5th
place in the Western High Category.
Alton Estate was awarded a merit certificate at the specialty tea
estates competition held in Dubai

34 Royal Ceramics Lanka PLC . Annual Report 2014 - 2015
MAnAGEMEnT DISCUSSIOn & AnALYSIS
Subsidiary companies
Stockholm Estate was awarded a merit certificate at the John Keells
Awards Ceremony 2014
The Company’s Annual Report for the year 2013/14 received the
Bronze award in the Plantations Category at the Annual Report
Awards 2014 conducted by the Institute of Chartered Accountants
of Sri Lanka.
growth and Development in 2014/15
The year under review proved to be one of many challenges;
despite this Horana Plantations achieved a commendable profit
after tax of Rs. 61.975 Million for the year under review.
In the domestic sphere, adverse and erratic weather conditions
together with poor trading conditions had a detrimental effect
on the rubber sector. Adverse weather conditions that prevailed
during the first two quarters of 2014/15 contributed to a
considerable decline in Rubber yields from 871 kg to 615 Kg YoY
per hectare.
Additionally the glut of rubber in the global markets pushed
down rubber prices. These combined factors resulted in this sector
recording a loss of Rs. 82.469 Million contributing towards an
overall reduction in post-tax profit against the previous
financial year.
The Rouble crisis, and economic contraction in Russia, Sri Lanka’s
primary importer, unrest in the Middle East, and its declining
oil prices, sanctions on Iran as well as political and economic
instability in Syria, Egypt, and Libya had their impact on the
tea industry. The Company’s tea sector recorded a gross profit
of Rs.69.375 Million, an increase from Rs 67.320 Million in the
previous year. Despite a lower Net Sale Average of Rs 432.89 per
kilogram versus Rs 453.42 in the previous financial year, a higher
yield resulting from better agricultural and management practices
boosted the bottom line.
Despite the challenges, the Company continued to confidently
invest in replanting, upgrading and modernizing its Tea and
Rubber factories as part of its larger capital expenditure program
with an investment of Rs 277.8 Million made in 2014/15.
Horana Plantations PLC has long recognized its plantation
community as a core component of the Company’s management
strategy. The company’s commitment to ethical business practices
through contribution to the development of the community and
the preservation of the environment, form the foundation of its
sustainability ethos. The Happy Family concept encapsulates all
this and works around the insight that if Horana Plantations is to
progress then the plantation worker community must be protected
and uplifted.
During the year under review Horana Plantations initiated several
social development programmes to improve the quality of life for
the plantation community; some of these projects were supported
by Ministry of Infrastructure Development, Plantation Human
Development Trust and National Housing Development Authority
and by NGO’s.
Among them was the construction of 45 Worker Houses on the
Millakande, Frocester and Bambarakelle Estates, a new water
projects on Halwathura and the renovation of the Neuchatel Estates
Hospital. In addition Frocester Estate completed constructing a
well-equipped Training Center under the Fair Trade funds at a cost
of 2.8 M for the benefit of the Estate community and a new volley
ball court was constructed on Neuchatel estate.
Occupational Health and Safety (OHS) is a top priority on our
Estates. Workers are provided with health and safety instructions
and Personnel Protective Equipments (PPE) for their safety when
working. The Company conducted a series of training sessions on
Health and Safety for Chemical Sprayers and Factory workers on
all the Estates during the year under review.

35
Other training programmes carried out during the year 2014/15,
focused on knowledge and skill enhancement in areas of General
Management, Agricultural Operations, Occupational Health and
Safety and Product Certifications, among others.
Horana Plantations is committed to Environmental conservation
initiatives to conserve and protect High Value Ecosystems and
all other natural ecosystems on our plantations. The company is
also focused on increasing native plant cover and reducing or
eliminating invasive species.
Examples of other green initiatives carried out during the year
under review include the construction of waste bins at the Upcot
Estates as a part of the Integrated Waste Management system, and
waste water soakage pits in worker houses. The construction of
Effluent Treatment plants at the Kobowella, Frocester and Dumbara
Factories were also completed, and Waste/Oil and
Water separation tanks were installed in all Factories within
Upcot Estates.
Future Outlook
A company with a rich history, Horana Plantation is backed by
decades of expertise and experience. For the company, steady
growth and development and a firm belief in ‘you reap what you
sow’ forms the basis of our operational strategy.
Crop diversification at the heart of our strategic field development
programme for 2015/16, with this in mind, the replanting
programmes both in the Tea and Rubber sectors continue and
the planting of lucrative, high yield Oil Palm crops in Neuchatel,
Mirishena and Halwatura has also been completed.
During the coming year, the Company will continue planting
cinnamon and coconut as well as Fruits and Vegetables. The
company will also focus on planting Coffee on the upcountry
estates.
The uncertainties of weather patterns, the high cost of production
and particularly the demand for ad hoc wage increases, have long
challenged the plantation sector. We believe that the wage increase
should be linked to productivity and will pursue that goal, so that a
mutually beneficial arrangement is assured.
Since being incorporated in 1992, Horana Plantations PLC has grown into a leading producer of the finest tea, rubber and other agricultural produce, with 42 % of the company’s cultivated area dedicated to tea, 47 % to rubber, 5 % to timber, and 6% to other diversified agricultural crops.
Gouravilla Estate

36 Royal Ceramics Lanka PLC . Annual Report 2014 - 2015
Our Responses /
Achievements in 2014/15 Channels of
Communication
Annual General Meeting
Publishing of interim accounts
Publications and announcements
on performance, launch of new
products and services
Access to management via email/
telephone
Meetings with fund managers/
stock brokers, etc.
Updated corporate web site
Communication
goals
Review share holder expectations
Provide assurance on regulatory
& statutory compliance and
governance
Identify investor preferences &
their risk appetite & concerns
Facilitate informed timely
investment decision
We believe that the greatest value we can craft is not in the products we make, but in the difference we make in the world. As a Group, our sustainability goals are built around adding value in three key areas; to our employees, to the people in the communities in which we operate and to our environment. In this Report the Discussion includes only the activities of the fully owned subsidiaries of Royal Ceramics Lanka PLC.
Investors
Attractive dividend of Rs 5/- per
share proposed for 2014/15
Business diversification reducing
business risk targeting high return
for the investment
Strong cost Management systems
across the group which facilitates
collective bargaining to maximize
return
Constant Research and
developments for product and
process innovations
Introduction of value added products
STAKEHOLDER EnGAGEMEnT
SUSTAInABILITYREPORT

37
Our Responses /
Achievements in 2014/15 Channels of
Communication
Frequent customer visits/site visits
by account, project and service
management professionals
Daily interaction via 49 showrooms
and over 250 dealers and
distributors located across the
country
Customer service hotlines
Formal complaint management
process and a centralized
dedicated unit to manage and
resolve customer complaints
Updated corporate website and
social media accounts
Feedback form on website
Customer education workshops
Tilers training programmes
Annual dealer conference
Communication
goals
Understand customer needs &
expectations
Review customer perception on
quality of product and brand
Identify improvements expected on
service levels
Improve awareness of products &
services
Training on use of products
Customers
Multi channel distribution strategy
for ease of access, physical
presence at 49 showrooms and
over 100 direct dealers and 350 sub
dealers located across the country
Wider customer choice with more
than 700 product designs
Quality testing and improvements
in quality & safety parameters
Introduction of warranty schemes
Introduction of software tools to
visualize the living spaces with
selected products.
Improvement in the website with
details of product designs and
characteristics
ISO9001 quality certification
Tile laying instruction manuals
Tiler’s loyalty schemes
Dealer performance based reward
schemes
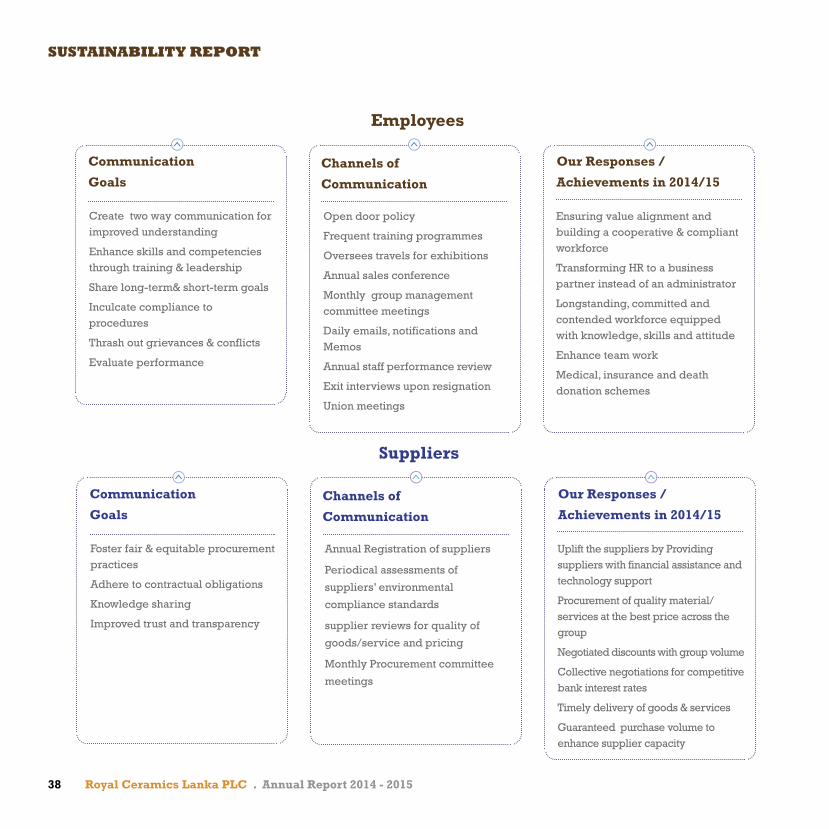
38 Royal Ceramics Lanka PLC . Annual Report 2014 - 2015
Our Responses /
Achievements in 2014/15
Our Responses /
Achievements in 2014/15
Channels of
Communication
Channels of
Communication
Open door policy
Frequent training programmes
Oversees travels for exhibitions
Annual sales conference
Monthly group management committee meetings
Daily emails, notifications and Memos
Annual staff performance review
Exit interviews upon resignation
Union meetings
Annual Registration of suppliers
Periodical assessments of
suppliers’ environmental
compliance standards
supplier reviews for quality of
goods/service and pricing
Monthly Procurement committee
meetings
Communication
goals
Communication
goals
Create two way communication for improved understanding
Enhance skills and competencies through training & leadership
Share long-term& short-term goals
Inculcate compliance to procedures
Thrash out grievances & conflicts
Evaluate performance
Foster fair & equitable procurement practices
Adhere to contractual obligations
Knowledge sharing
Improved trust and transparency
Employees
Suppliers
Ensuring value alignment and building a cooperative & compliant workforce
Transforming HR to a business partner instead of an administrator
Longstanding, committed and contended workforce equipped with knowledge, skills and attitude
Enhance team work
Medical, insurance and death donation schemes
Uplift the suppliers by Providing suppliers with financial assistance and technology support
Procurement of quality material/ services at the best price across the group
Negotiated discounts with group volume
Collective negotiations for competitive bank interest rates
Timely delivery of goods & services
Guaranteed purchase volume to enhance supplier capacity
SUSTAInABILITY REPORT

39
Our Responses /
Achievements in 2014/15 Channels of
Communication
Group CSR programs
Staff volunteerism initiatives
Dialog through network of
showrooms
Community visits by factory and
showroom staff
Communication
goals
We support community
development programs to provide
for the well-being and economic
progress of communities in the
markets in which we operate.
Local communities
Road developments of neighbouring
showrooms and factories
Donations of books to schools
Providing death donations to the low
income families around factories
Assisting to obtain pipe born water
for the needy families
Workshop assistance to repair
nearby premises
Provide internships to university &
professional students
Our Responses /
Achievements in 2014/15 Channels of
Communication
Monthly Efficiency meetings
Monthly evaluation of fuel
efficiency standards against actuals
Field visits to the suppliers’ sites to
ensure the refilling of mines used
for ball clay excavation
Regular test on treated water from
treatment plants
Regular test on noise level
Communication
goals
We promote green management
practices and operational
procedures to mitigate the
environmental impact of our
business
Environment
Installation of skylights in factories
to reduce power consumption
Installation of Water recycling
system & sewerage treatment plants
Raising of boundary walls & tree
planting initiatives to prevent noise
pollution
Dust suction plant to prevent air
pollution

40 Royal Ceramics Lanka PLC . Annual Report 2014 - 2015

41
We want a committed workforce, who enjoy long standing relationships with the company. We believe in open and constant two way communication. We invest in knowledge, skill and attitude building so that we add value to the person as well as the professional. Because every investment in our people, is an investment in the future.
Royal Ceramics’ Human Resource development initiatives for
2014/15 combined both professional and personal growth. Our
safety training programs for operators saw 24 employees in the
kiln department participate in a comprehensive program that
covered health and safety information based on the use of a variety
of machinery.
A program offering sponsorship to international training programs
was met with great enthusiasm. Selected executive staff members
were able to travel to overseas and spend time training in a
specialized subject which would enable them to perform their jobs
more skillfully, efficiently and productively upon their return.
Recreational activities were also prioritized as these present
ideal opportunities for employees to get to know each other
better, building relationships and forming bonds beyond their
departments. The annual trip for all staff and shop floor employees
EMPOWERINg OUR
Royal Ceramics’ Human Resource development initiatives for 2014/15 combined both professional and personal growth. Our safety training programs for operators saw 24 employees in the kiln department participate in a comprehensive program that covered health and safety information based on the use of a variety of machinery.
3.7BnVALUE ADDED
PEOPLE
EMPLOYEES ANALYZED BY GENDER
1
2
1 Male (1,459) 2 Female (124)

42 Royal Ceramics Lanka PLC . Annual Report 2014 - 2015
EMPLOYEE CATEGORY - AGE-WISE
1 Above 55 (21) 2 41-55 (400) 3 31-40 (508) 4 21-30 (630) 5 18-20 (24)
1
2
3
4
5was to Nuwara Eliya, and was a great success, as was the annual
get together for employees; given the large numbers involved,
the staff were divided into five groups visiting Trincomalee,
Theleimannaram, Willpattu, Kalpitiya and Mannar. The annual
get together for head office staff and their families took place in
Wadduwa.
The staff at Royal Porcelain all received 5S training. In addition the
fork lift driving program enabled workers to improve their driving
skills. The company also facilitated workers to obtain NVQ level
3 certificates in heavy machines driving. An annual family day for
all staff, workers and their family members was organized, and all
workers had their outing to Passikudah. Workers with school going
children received school supplies for their children. The annual
pirith ceremony was also held; this benefited not just the workers
but also the greater community living in close proximity to the
factory.
Rocell Bathware introduced several new schemes for employees
including the implementation of a death donation scheme and an
insurance scheme. Training and development was also high on
the agenda, and the company carried out a Trade Test for Fork Lift
Operators. The annual trip was organized for staff members who
spent the day in Wadduwa.
Staff welfare activities for the year under review included a
medical camp conducted in collaboration with the Homagama
Ministry of Health; and an eye clinic for all employees.
The success of these initiatives and the strength of the Groups’
Human Resource policy can be measured in many ways. Primarily
in terms of the low employee turnover rate within the Groups
companies. This high level of retention is manifest in all areas of
operation.
Category Male Female
Permanent employees 1340 108
Trainees 20 1
Probationers 88 10
Fixed term contracts 11 5
Total 1459 124
We are responsible for over 1500 livelihoods, and most of our
cadre is made up of those in the 21 – 30 age group, a statistic that
we believe demonstrates the aspirational nature of our business.
The staff at Royal Porcelain all received 5S training. In addition the fork lift driving program enabled workers to improve their driving skills. The company also facilitated workers to obtain NVQ level 3 certificates in heavy machines driving.
SUSTAInABILITY REPORT
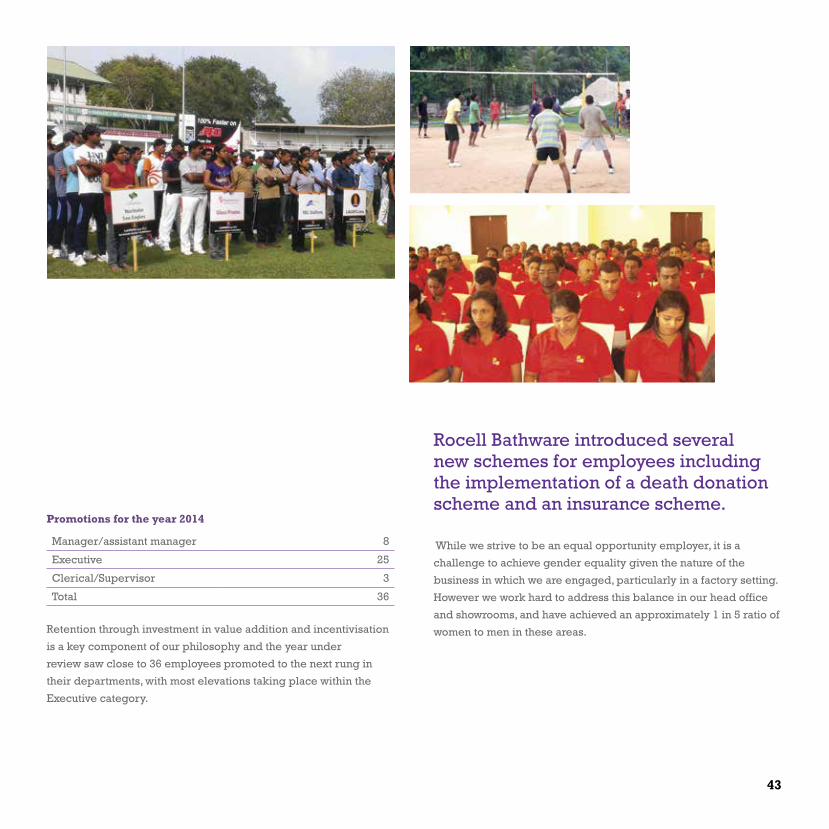
43
Promotions for the year 2014
Manager/assistant manager 8
Executive 25
Clerical/Supervisor 3
Total 36
Retention through investment in value addition and incentivisation
is a key component of our philosophy and the year under
review saw close to 36 employees promoted to the next rung in
their departments, with most elevations taking place within the
Executive category.
While we strive to be an equal opportunity employer, it is a
challenge to achieve gender equality given the nature of the
business in which we are engaged, particularly in a factory setting.
However we work hard to address this balance in our head office
and showrooms, and have achieved an approximately 1 in 5 ratio of
women to men in these areas.
Rocell Bathware introduced several new schemes for employees including the implementation of a death donation scheme and an insurance scheme.

44 Royal Ceramics Lanka PLC . Annual Report 2014 - 2015

45
ENRICHINg OUR
The communities in which we work are immensely important to us. They are an extension of our operations and their support and cooperation are essential. Providing for their well being and economic progress is our privilege and we do this via Group community projects as well as staff volunteerism initiatives.
3BnVALUE ADDED TO THE gOVERNMENT
COMMUNITY
The communities in which we work are immensely important
to us. They are an extension of our operations and their support
and cooperation are essential. Providing for their well being and
economic progress is our privilege and we do this via Group
community projects as well as staff volunteerism initiatives.
Royal Ceramics engaged in several outreach projects during the
year under review including the tiling of ward 2 of the Eheliyagoda
District Hospital as well as the Budu Madura of Sri Nagabodhi
Viharaya in Bodhimaluwa. Provision of equipment for the kids
playground at the Ministry of Health office complex in Kuruwita,
and lighting and sound for the ‘Sadaham Udanaya’ Vesak festival
organized by the Divisional Secretariat Office in Eheliyagoda, were
among the other projects the factory contributed to.
Royal Porcelain introduced a death donation for low income
families within the neighbouring villages which serves as much
needed aid at a tragic point in their lives. The company also
introduced an award scheme for students, encouraging academic
achievement by rewarding those students who pass the Grade v
scholarship exam, GCE O/L exam or GCE A/L exam.
Rocell Bathware made philanthropic endeavours a priority via
generous donations of sanitary ware sets to the Athurugiriya
Police Station, funding the renovation of the gate and donating
dictionaries to the Sri Parakrama Maha Vidyalaya in Panagoda, and
donating towards the repair of the road leading to the entrance of
the zone.
In addition an alms giving was held and medicine donated to the
Cancer Hospital. The staff together with the National Blood Bank
also conducted a blood donation campaign.

46 Royal Ceramics Lanka PLC . Annual Report 2014 - 2015

47
PRESERVINg OUR
At Royal Ceramics PLC our business is dependent on the bounty of nature. Our environment gives us so much, and we are obligated to do our utmost in turn to preserve our natural surroundings. Our “Environment Management system” allows us to monitor and control pollution levels and maintain them at an absolute minimum.
ENVIRONMENT
At Royal Ceramics PLC our business is dependent on the bounty
of nature. Our environment gives us so much, and we are obligated
to do our utmost in turn to preserve our natural surroundings.
Our “Environment Management system” allows us to monitor and
control pollution levels and maintain them at an absolute minimum.
The program is run according to the ISO 14000 international
environment management standards specified by BVQ1 (London)
in 2000.
At Royal Ceramics regular field visits take place to the suppliers’
sites to ensure the refilling of mines used for ball clay excavation.
We promote green management practices and operational
procedures to mitigate the environmental impact of our business.
Monthly efficiency meetings and evaluations are carried out to
ensure that procedures are being adhered to and the desired
results are achieved.
The Eheliyagoda factory devoted itself to the construction of a
systematic draining system that will prevent the neighbouring
canal from flooding the area during the rainy season. Further work
was also done to clean and repair the canal in an adjoining field.
At Royal Porcelain a significant investment was also made during
the year under review to mitigate negative environmental impacts.
Extra control over sound and dust emission was established via a
Rs. 1.2 million investment in increasing the height of the factory
boundary walls, which effectively reduced noise pollution. The
skylight laying project increases day light usage within the factory
thereby contributing to its energy saving drive.
Rocell Bathware invested in the installation of a sewerage treatment
plant at a cost of Rs. 8.5 million. This was deemed necessary in
order that the company could meet its social and environmental
protection goals, and the factory now recycles all its sewerage
treated water via this treatment plant.
Conclusion
2015/16 will see us continuing to add value in all these areas. Royal
Ceramic’s implementation of the Total Productivity Management
(TPM) system, the goal of obtaining WELS (Water Efficiency
Labelling and Standards) for our range of sanitary ware and
appliances at Rocell Bathware and the pursuit of the ISO 9001
certificate for quality management at Royal Porcelain will all aid in
the monitoring, updating and completion of all our sustainability
centric goals. Specific community oriented projects such as the
concreting of neighbourhood by roads and the provision of pipe
borne water for needy families in the community will be priorities
in 2015/16.
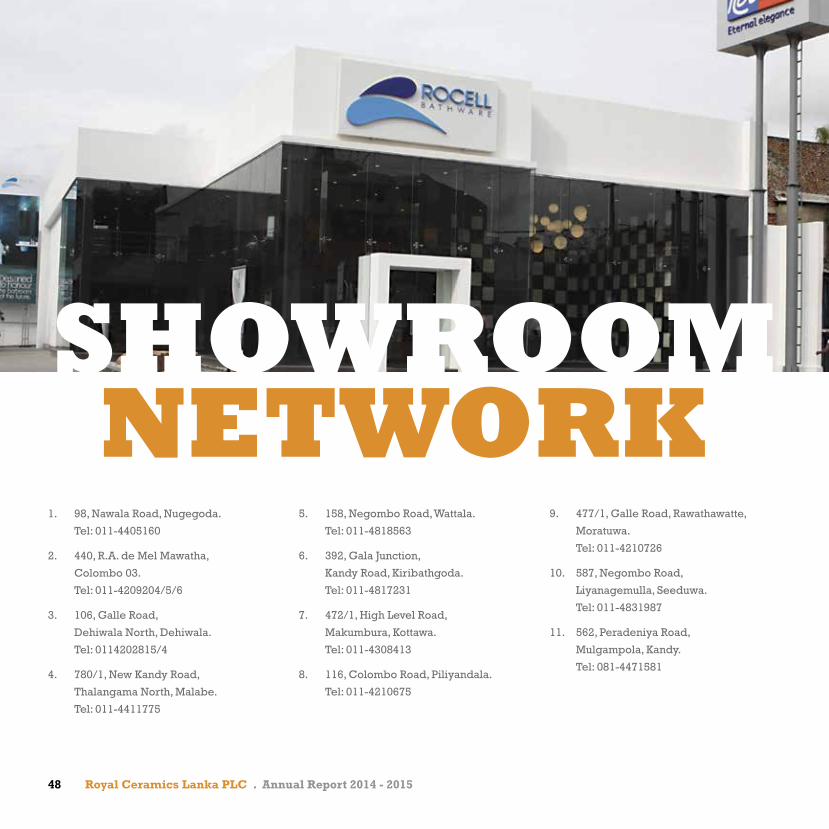
48 Royal Ceramics Lanka PLC . Annual Report 2014 - 2015
1. 98, Nawala Road, Nugegoda.
Tel: 011-4405160
2. 440, R.A. de Mel Mawatha,
Colombo 03.
Tel: 011-4209204/5/6
3. 106, Galle Road,
Dehiwala North, Dehiwala.
Tel: 0114202815/4
4. 780/1, New Kandy Road,
Thalangama North, Malabe.
Tel: 011-4411775
5. 158, Negombo Road, Wattala.
Tel: 011-4818563
6. 392, Gala Junction,
Kandy Road, Kiribathgoda.
Tel: 011-4817231
7. 472/1, High Level Road,
Makumbura, Kottawa.
Tel: 011-4308413
8. 116, Colombo Road, Piliyandala.
Tel: 011-4210675
9. 477/1, Galle Road, Rawathawatte,
Moratuwa.
Tel: 011-4210726
10. 587, Negombo Road,
Liyanagemulla, Seeduwa.
Tel: 011-4831987
11. 562, Peradeniya Road,
Mulgampola, Kandy.
Tel: 081-4471581
SHOWROOMnETWORK

49
12. 37, A.A. Dharmasena Mawatha,
Mahaiyawa, Kandy.
Tel: 081-4475825
13. 504/1, Kandy Road, Kegalle.
Tel: 035-2230980
14. No-136, Colombo Road, Kurunegala.
Tel: 037-4690467
15. 46, Chilaw Road, Wennappuwa.
Tel: 031-4874656
16. 521/5, 2nd Stage,
Maithreepala Senanayaka Mawatha,
Anuradhapura.
Tel: 025-4580294
17. 223, Colombo Road,
Ratnapura.
Tel: 045-4360318
18. 348, Badulla Road, Bandarawela.
Tel: 057-4496014
19. 443, Galle Road,
Kalutara North, Kalutara.
Tel: 034-4280469
20. 132, Anguruwatota Road, Horana.
Tel: 034-4285033
21. 77, W.D.S. Abeygunawardena Mawatha,
Pettigalawatte, Galle
Tel: 091-4380033
22. 139, Gunawardena Mawatha,
Kotuwegoda, Matara.
Tel: 041-4933629
23. 143, Highlevel Road, Maharagama.
Tel: 011-4319514
24. 504, Galle Road, Panadura.
Tel: 038-4281898
25. Colombo Road, Kaduwela.
Tel: 011-4948182
26. 200, Colombo Road, Negombo.
Tel: 031-4922192
27. 721 & 721 A, Mandandawela,
Trincomalee Street, Matale.
Tel: 066-4460928
28. 86, Weyangoda Road, Minuwangoda.
Tel. 011-4969060
29. 174/A/2, Colombo Road, Gampaha.
Tel: 033-4670937/755
30. 181, Hettipola Road, Kuliyapitiya.
Tel: 037-4930870, 037-4696134
31. Katugastota Road, Kandy.
Tel: 081-4481759/60
32. 574, Galle Road,
Kalutara South, Kalutara
Tel: 034-4280933/4
33. 101, Nawala Road, Nawala.
Tel: 011-4311311
34. 278, Massale, Galle Road, Beruwala.
Tel: 034-4288371/2
35. 39, Godagama Road, Athurugiriya.
Tel: 011-4443641
36. 52, Kandy Road, Nittambuwa.
Tel: 033-4929681
37. 52, Barnes Ratwatta Mawatha,
Balangoda.
Tel: 045-4927365
38. 70, Bank Road, Badulla.
Tel: 055-4499780
39. 76 A, Tangalle Road,
Thavaluwila, Ambalanthota.
Tel: 047-4932446
40. 30, Narahenpita Road, Nawala.
Tel: 011-4651000
41. 185 B, Ratnapura Road,
Moragala, Eheliyagoda.
Tel: 036-4922946
42. 7, T.B. Panabokke Mawatha, Gampola.
Tel: 081-4951436
43. Sri Bodhi Dakshinaramaya,
Kandy Road, Vavuniya.
Tel: 024-4928331/2
44. 2/1, Kandy Road, Trincomalee.
Tel: 026-2225008
45. No. 679, Anuradhapura Road, Dambulla
Tel: 066-4935041/2
46. No. 218, Stanley Road, Jaffna
Tel: 021-4927003/4
47. No. 232. Rathnapura Road
Pelmadulla
Tel: 045 4935060, 045 4935065
48. “Kandaland” Wellawaya Road
Monaragala
Tel: 055 4936169
49. No. 114, Colombo Road
Chilaw
Tel: 032 4934126
nETWORK

50 Royal Ceramics Lanka PLC . Annual Report 2014 - 2015
FInAnCIALREvIEWThe Financial Statements of the Group and of the Company, which
form a part of this Annual Report, set out the financial performance.
The Financial review discusses an overview of the Group’s financial
performance
group Results
The Group has reported a Net Turnover of Rs. 22.4 billion during
the financial year 2014/15 with an increase by 13% compared the
net revenue of Rs 19.7 billion recorded for 2014/15. Almost all the
sectors of the group reported growth in turnover due to favourable
economic conditions prevalent during the year.
GROUP REVENUE - SECTORWISE
1 Tiles & Associated Items (66.87%) 2 Sanitaryware (5.94%) 3 Paints and Allied Products (0.42%) 4 Plantation (9.49%) 5 Packing Material (10.03%)6 Aluminium Products (6.69%) 7 Other (0.56%)
123
4
5
6 7
A growth of 88% is seen in the group export turnover with Rs. 1.5
Billion in export sales. Exploring new markets by taking advantage
of group synergies has helped to expand the export operation of
the group. Export sales have contributed 7% towards total sales of
the group. The lower export revenue contribution to the group is
mainly due to low priced products from countries such as China
and India dominating the world market with their economies of
scale in the face of global price competition. The Company is
taking necessary steps to counter these threats and will continue to
focus on this segment and Rocell ventured into its first international
operation in Australia by forming a company, Rocell Pty Limited
during the year.
Profitability
The Gross Profit of the Group recorded a growth of 15% compared
to the last year. Reduction in fuel and electricity costs has led to
considerable saving in energy cost which is the main cost element
of the manufacturing cost. Improving operational efficiencies in the
manufacturing plants and group collective cost reduction initiatives
have helped achieve lower manufacturing costs despite increases
in other cost elements.
Group Profit after Tax increased to Rs. 3.1 billion as against
Rs. 2 billion in the previous year which shows 55% growth. Net
profit of Tiles sector increased by 63% and sanitary ware sector
increased by 16%. While the packing material, Aluminium and
Finance sectors showed tremendous performance growing
profitability by 100%, 142% and 54% respectively, Plantation and
Paint sectors were recording negative growth of 55% and 70%
Group Profit after Tax increased to Rs. 3.1 billion as against Rs. 2 billion in the previous year which shows 55% growth.
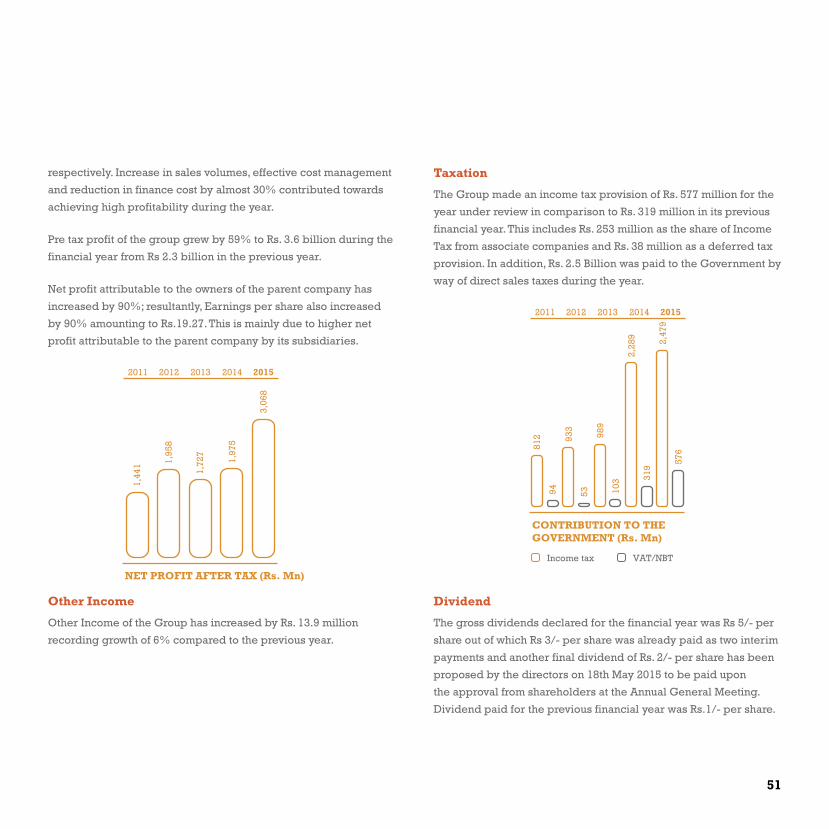
51
respectively. Increase in sales volumes, effective cost management
and reduction in finance cost by almost 30% contributed towards
achieving high profitability during the year.
Pre tax profit of the group grew by 59% to Rs. 3.6 billion during the
financial year from Rs 2.3 billion in the previous year.
Net profit attributable to the owners of the parent company has
increased by 90%; resultantly, Earnings per share also increased
by 90% amounting to Rs.19.27. This is mainly due to higher net
profit attributable to the parent company by its subsidiaries.
2011 2012 2013 2014 2015
NET PROFIT AFTER TAX (Rs. Mn)
1,44
1 1,95
8
1,72
7
1,97
5
3,06
8
Other Income
Other Income of the Group has increased by Rs. 13.9 million
recording growth of 6% compared to the previous year.
Taxation
The Group made an income tax provision of Rs. 577 million for the
year under review in comparison to Rs. 319 million in its previous
financial year. This includes Rs. 253 million as the share of Income
Tax from associate companies and Rs. 38 million as a deferred tax
provision. In addition, Rs. 2.5 Billion was paid to the Government by
way of direct sales taxes during the year.
2011 2012 2013 2014 2015
CONTRIBUTION TO THEGOVERNMENT (Rs. Mn)
812
94
933
53
989
103
2,28
9
319
2,47
9
576
Income tax VAT/NBT
Dividend
The gross dividends declared for the financial year was Rs 5/- per
share out of which Rs 3/- per share was already paid as two interim
payments and another final dividend of Rs. 2/- per share has been
proposed by the directors on 18th May 2015 to be paid upon
the approval from shareholders at the Annual General Meeting.
Dividend paid for the previous financial year was Rs.1/- per share.
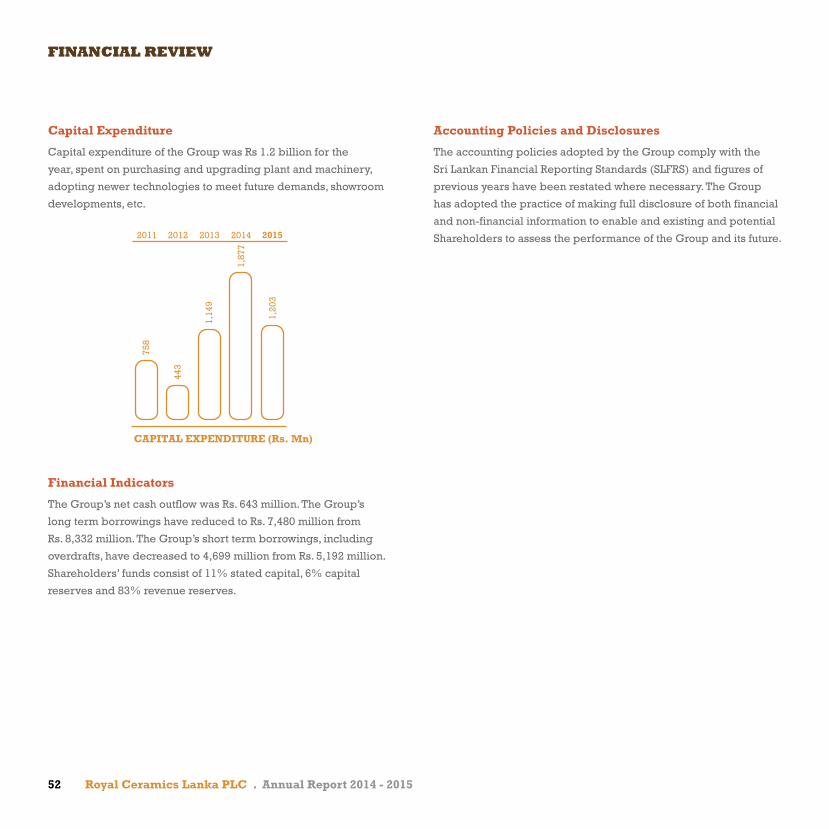
52 Royal Ceramics Lanka PLC . Annual Report 2014 - 2015
Capital Expenditure
Capital expenditure of the Group was Rs 1.2 billion for the
year, spent on purchasing and upgrading plant and machinery,
adopting newer technologies to meet future demands, showroom
developments, etc.
2011 2012 2013 2014 2015
CAPITAL EXPENDITURE (Rs. Mn)
758
443
1,14
9
1,87
7
1,20
3
Financial Indicators
The Group’s net cash outflow was Rs. 643 million. The Group’s
long term borrowings have reduced to Rs. 7,480 million from
Rs. 8,332 million. The Group’s short term borrowings, including
overdrafts, have decreased to 4,699 million from Rs. 5,192 million.
Shareholders’ funds consist of 11% stated capital, 6% capital
reserves and 83% revenue reserves.
Accounting Policies and Disclosures
The accounting policies adopted by the Group comply with the
Sri Lankan Financial Reporting Standards (SLFRS) and figures of
previous years have been restated where necessary. The Group
has adopted the practice of making full disclosure of both financial
and non-financial information to enable and existing and potential
Shareholders to assess the performance of the Group and its future.
FInAnCIAL REvIEW
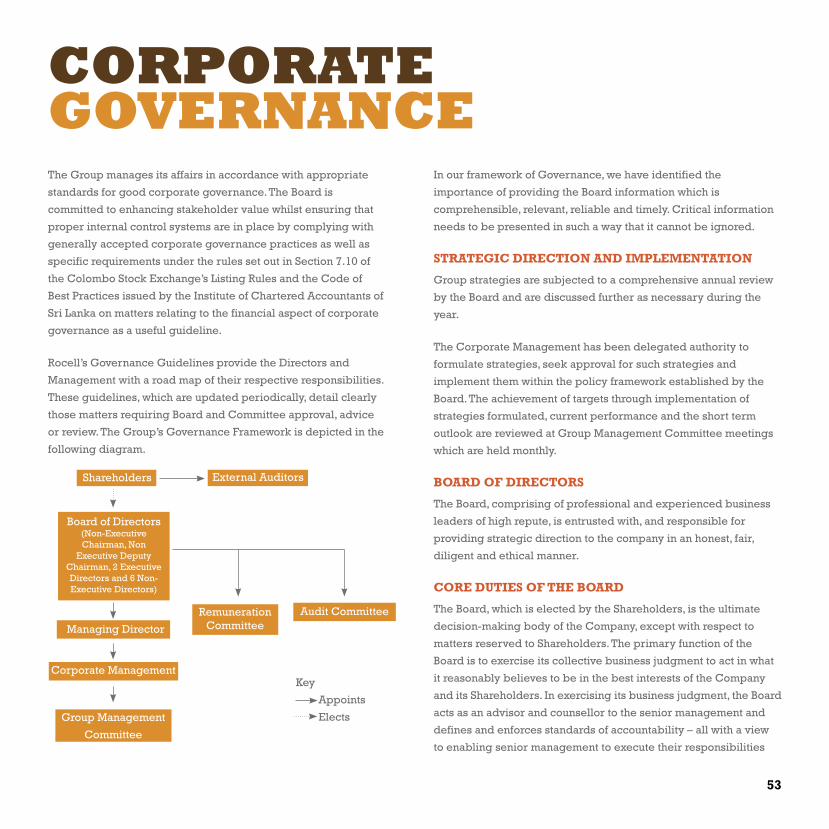
53
CORPORATEGOvERnAnCEThe Group manages its affairs in accordance with appropriate
standards for good corporate governance. The Board is
committed to enhancing stakeholder value whilst ensuring that
proper internal control systems are in place by complying with
generally accepted corporate governance practices as well as
specific requirements under the rules set out in Section 7.10 of
the Colombo Stock Exchange’s Listing Rules and the Code of
Best Practices issued by the Institute of Chartered Accountants of
Sri Lanka on matters relating to the financial aspect of corporate
governance as a useful guideline.
Rocell’s Governance Guidelines provide the Directors and
Management with a road map of their respective responsibilities.
These guidelines, which are updated periodically, detail clearly
those matters requiring Board and Committee approval, advice
or review. The Group’s Governance Framework is depicted in the
following diagram.
In our framework of Governance, we have identified the
importance of providing the Board information which is
comprehensible, relevant, reliable and timely. Critical information
needs to be presented in such a way that it cannot be ignored.
STRATEgIC DIRECTION AND IMPLEMENTATION
Group strategies are subjected to a comprehensive annual review
by the Board and are discussed further as necessary during the
year.
The Corporate Management has been delegated authority to
formulate strategies, seek approval for such strategies and
implement them within the policy framework established by the
Board. The achievement of targets through implementation of
strategies formulated, current performance and the short term
outlook are reviewed at Group Management Committee meetings
which are held monthly.
BOARD OF DIRECTORS
The Board, comprising of professional and experienced business
leaders of high repute, is entrusted with, and responsible for
providing strategic direction to the company in an honest, fair,
diligent and ethical manner.
CORE DUTIES OF THE BOARD
The Board, which is elected by the Shareholders, is the ultimate
decision-making body of the Company, except with respect to
matters reserved to Shareholders. The primary function of the
Board is to exercise its collective business judgment to act in what
it reasonably believes to be in the best interests of the Company
and its Shareholders. In exercising its business judgment, the Board
acts as an advisor and counsellor to the senior management and
defines and enforces standards of accountability – all with a view
to enabling senior management to execute their responsibilities
Shareholders
Corporate Management
Audit CommitteeRemuneration Committee
Group Management
Committee
Board of Directors(Non-Executive Chairman, Non
Executive Deputy Chairman, 2 Executive Directors and 6 Non-Executive Directors)
External Auditors
Key
Appoints
Elects
Managing Director

54 Royal Ceramics Lanka PLC . Annual Report 2014 - 2015
fully and in the interests of Shareholders. The following are the
Board’s primary responsibilities, some of which may be carried out
by Sub-Committees of the Board or the independent Directors as
appropriate:
• OverseeingtheconductoftheCompany’sbusinesssothatitis
effectively managed in the long-term interests of Shareholders;
• Selecting,evaluatingandcompensatingtheManagingDirector
and planning for Managing Director succession, as well as
monitoring management’s succession planning for other key
executives;
• OverseeingandreviewingtheCompany’sstrategicdirection
and objectives, taking into account (among other considerations)
the Company’s risk profile and exposures;
• MonitoringtheCompany’saccountingandfinancialreporting
practices and reviewing the Company’s financial and other
controls;
• OverseeingtheCompany’scompliancewithapplicablelawsand
regulations; and
• Overseeingtheprocessesthatareinplacetosafeguardthe
Company’s assets and mitigate risks.
In discharging its duties, the Board is entitled to rely on the
advice, reports and opinions of the management, auditors and
outside experts. In that regard, the Board and its Committees
shall be entitled, at the expense of the Company, to engage such
independent legal, financial or other advisors as they deem
appropriate, without consulting or obtaining the approval of any
Officer of the Company.
COMPOSITION OF THE BOARD
The Board consists of ten Directors, eight Non-Executive Directors
and two Executive Directors being the Managing Director – Mr.
Nimal Perera and the Director Marketing & Business Development
– Mr. Tharana Thoradeniya.
There is a balance of Executive and Non-Executive Directors to
ensure that the decisions taken by the Board are collective. The
Non-Executive Directors do not have any business interest that
could materially interfere with the exercise of their independent
judgment.
Each Non-Executive Director has submitted a declaration of his
independence or non- independence as required under the Listing
Rules of the Colombo Stock Exchange.
Based on the declarations submitted by the Directors the Board has
resolved that Mr. R B Thambiayah, Mr. L T Samarawickrama,
Mr. M. D. S. Goonatilleke , Mr. R. N. Asirwatham, Mr. G. A. R.
D. Prasanna and Mr. S H Amarasekera can be classified as
Independent Non-Executive Directors although they serve on
the Boards of other subsidiary companies of RCL in which a
majority of the other members of the Board are also Directors.
Specifically determining that Messrs R B Thambiayah and L T
Samarawickrama be treated as Independent Directors of the
Company notwithstanding that they have served on the Board of
the Company for a period exceeding nine years from their dates
of appointment, on the basis that such period of service does not
compromise their independence on the Board.
The Board further resolved that Mr. S H Amarasekera, too,
be treated as an Independent Director, notwithstanding his
Directorship on Vallibel One PLC, which has a significant
shareholding in the Company. It was also emphasized that though
Mr Amarasekera serves as an Independent Director to this
Company and the fact that there are other common Directors on
this Board does not have a bearing on his independence.
During the year under review Mr. Dhammika Perera was appointed
as the Chairman of the Board with effect from 30th June 2014 and
CORPORATE GOvERnAnCE
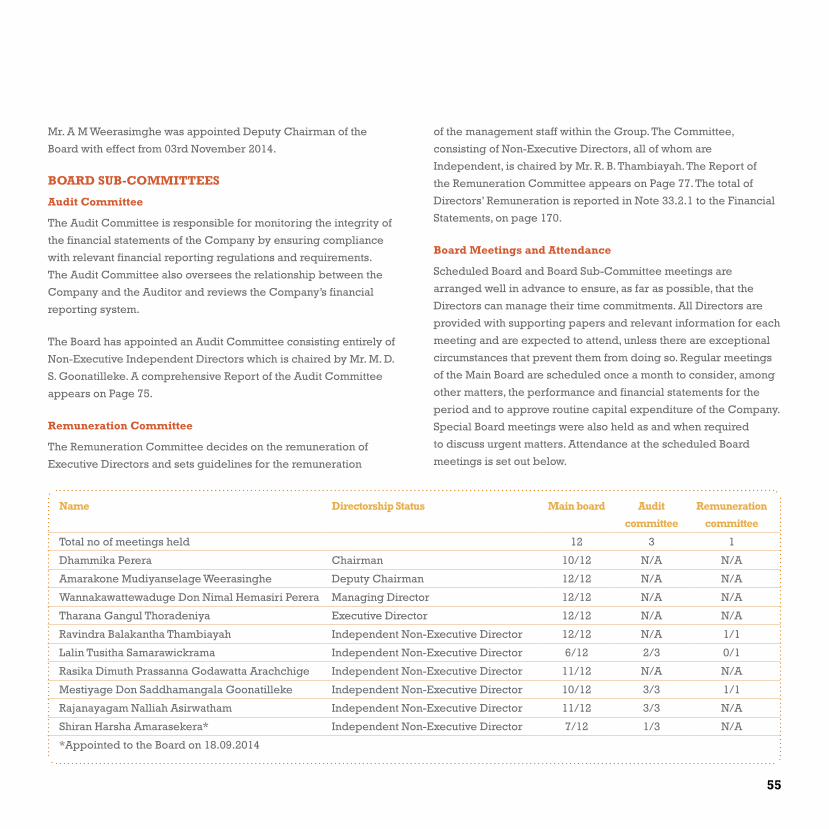
55
Mr. A M Weerasimghe was appointed Deputy Chairman of the
Board with effect from 03rd November 2014.
BOARD SUB-COMMITTEES
Audit Committee
The Audit Committee is responsible for monitoring the integrity of
the financial statements of the Company by ensuring compliance
with relevant financial reporting regulations and requirements.
The Audit Committee also oversees the relationship between the
Company and the Auditor and reviews the Company’s financial
reporting system.
The Board has appointed an Audit Committee consisting entirely of
Non-Executive Independent Directors which is chaired by Mr. M. D.
S. Goonatilleke. A comprehensive Report of the Audit Committee
appears on Page 75.
Remuneration Committee
The Remuneration Committee decides on the remuneration of
Executive Directors and sets guidelines for the remuneration
of the management staff within the Group. The Committee,
consisting of Non-Executive Directors, all of whom are
Independent, is chaired by Mr. R. B. Thambiayah. The Report of
the Remuneration Committee appears on Page 77. The total of
Directors’ Remuneration is reported in Note 33.2.1 to the Financial
Statements, on page 170.
Board Meetings and Attendance
Scheduled Board and Board Sub-Committee meetings are
arranged well in advance to ensure, as far as possible, that the
Directors can manage their time commitments. All Directors are
provided with supporting papers and relevant information for each
meeting and are expected to attend, unless there are exceptional
circumstances that prevent them from doing so. Regular meetings
of the Main Board are scheduled once a month to consider, among
other matters, the performance and financial statements for the
period and to approve routine capital expenditure of the Company.
Special Board meetings were also held as and when required
to discuss urgent matters. Attendance at the scheduled Board
meetings is set out below.
Name Directorship Status Main board Audit
committee
Remuneration
committee
Total no of meetings held 12 3 1
Dhammika Perera Chairman 10/12 N/A N/A
Amarakone Mudiyanselage Weerasinghe Deputy Chairman 12/12 N/A N/A
Wannakawattewaduge Don Nimal Hemasiri Perera Managing Director 12/12 N/A N/A
Tharana Gangul Thoradeniya Executive Director 12/12 N/A N/A
Ravindra Balakantha Thambiayah Independent Non-Executive Director 12/12 N/A 1/1
Lalin Tusitha Samarawickrama Independent Non-Executive Director 6/12 2/3 0/1
Rasika Dimuth Prassanna Godawatta Arachchige Independent Non-Executive Director 11/12 N/A N/A
Mestiyage Don Saddhamangala Goonatilleke Independent Non-Executive Director 10/12 3/3 1/1
Rajanayagam Nalliah Asirwatham Independent Non-Executive Director 11/12 3/3 N/A
Shiran Harsha Amarasekera* Independent Non-Executive Director 7/12 1/3 N/A
*Appointed to the Board on 18.09.2014
56 Royal Ceramics Lanka PLC . Annual Report 2014 - 2015
RELATIONSHIP WITH SHAREHOLDERS
Shareholders are provided with Quarterly Financial Statements
and the Annual Report, which the Group considers as its
principal communication with them and other stakeholders.
The Shareholders have the opportunity of meeting the Board
and forwarding their questions at the Annual General Meeting.
The Board believes the AGM as a means of continuing effective
dialogue with Shareholders. The Board offers clarifications and
responds to concerns Shareholders have over the content of the
Annual Report as well as other matters which are important to
them. The AGM is also used to adopt the Financial Statements
for the year. However, this does not limit the Shareholders’
communication with the Board, and they are free to communicate
anytime with the Managing Director, Company Secretary or any of
the senior managers depending on the matter to be addressed.
INTERNAL CONTROL
The Board places a high priority on internal controls to manage
the day-to-day affairs of the company. The Board is responsible for
the Group’s internal control and its effectiveness. Internal control
is established with emphasis placed on safeguarding assets,
making available accurate and timely information and imposing
greater discipline on decision making. It covers all controls,
including financial, operational and compliance control and risk
management. It is important to state, however that any system can
ensure only reasonable and not absolute assurance that errors and
irregularities are prevented or detected within a reasonable time.
The Group’s Internal Audit Department plays a significant role
in assessing the effectiveness and successful implementation of
existing controls and strengthening these and establishing new
controls where necessary. The Internal Audit reports are made
available to the Managing Director, Head of Finance & Treasury
and the Audit Committee.
The Group also obtains the services of independent professional
accounting firms other than the statutory auditors to carry out
internal audits and reviews to supplement the work done by the
Internal Audit Department.
The Board has reviewed the effectiveness of the system of financial
controls for the period up to date of signing the accounts.
DISCLOSURE
The Board’s policy is to disclose all relevant information to
stakeholders, within the bounds of prudent commercial judgment,
in addition to preparing the financial statements in accordance
with Sri Lanka Accounting Standards, the Companies Act No.
7 of 2007, and in conformity with Stock Exchange disclosure
requirements.
gOINg CONCERN
The Board of Directors, after conducting necessary inquiries
and reviews of the Group’s budget for the ensuing year, capital
expenditure requirements, future prospects and risks, cash flows
and borrowing facilities, has a reasonable expectation that the
Company and the Group have adequate resources to continue in
operational existence for the foreseeable future. Therefore the
going concern basis has been adopted in the preparation of the
Financial Statements.
CORPORATE GOvERnAnCE
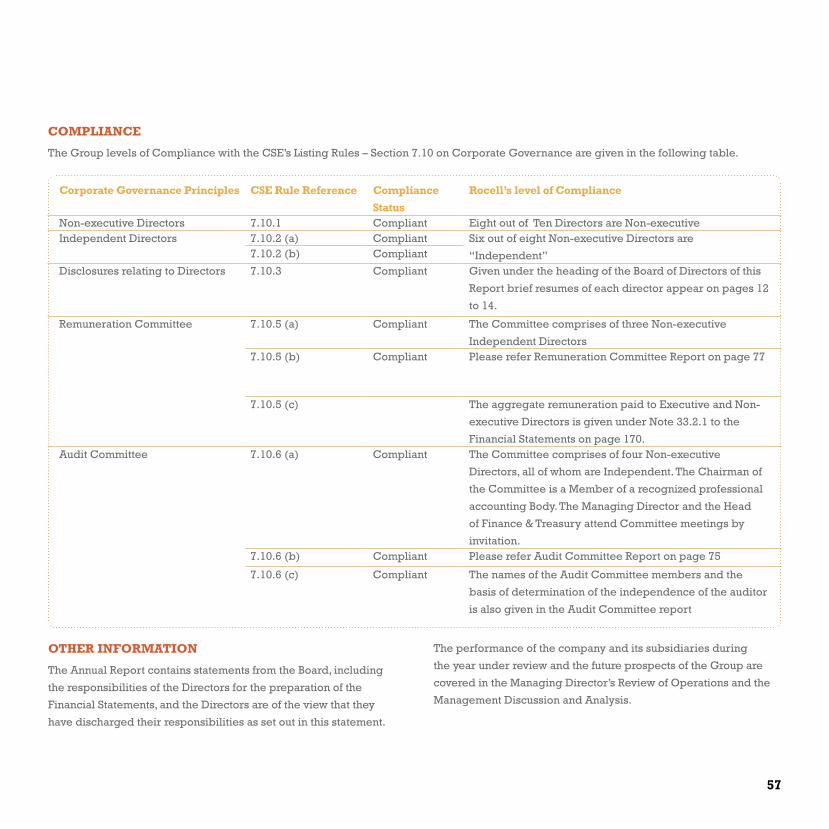
57
COMPLIANCE
The Group levels of Compliance with the CSE’s Listing Rules – Section 7.10 on Corporate Governance are given in the following table.
Corporate governance Principles CSE Rule Reference Compliance
Status
Rocell’s level of Compliance
Non-executive Directors 7.10.1 Compliant Eight out of Ten Directors are Non-executiveIndependent Directors 7.10.2 (a) Compliant Six out of eight Non-executive Directors are
“Independent”7.10.2 (b) Compliant
Disclosures relating to Directors 7.10.3 Compliant Given under the heading of the Board of Directors of this
Report brief resumes of each director appear on pages 12
to 14.
Remuneration Committee 7.10.5 (a) Compliant The Committee comprises of three Non-executive
Independent Directors 7.10.5 (b) Compliant Please refer Remuneration Committee Report on page 77
7.10.5 (c) The aggregate remuneration paid to Executive and Non-
executive Directors is given under Note 33.2.1 to the
Financial Statements on page 170.Audit Committee 7.10.6 (a) Compliant The Committee comprises of four Non-executive
Directors, all of whom are Independent. The Chairman of
the Committee is a Member of a recognized professional
accounting Body. The Managing Director and the Head
of Finance & Treasury attend Committee meetings by
invitation.7.10.6 (b) Compliant Please refer Audit Committee Report on page 75
7.10.6 (c) Compliant The names of the Audit Committee members and the
basis of determination of the independence of the auditor
is also given in the Audit Committee report
OTHER INFORMATION
The Annual Report contains statements from the Board, including
the responsibilities of the Directors for the preparation of the
Financial Statements, and the Directors are of the view that they
have discharged their responsibilities as set out in this statement.
The performance of the company and its subsidiaries during
the year under review and the future prospects of the Group are
covered in the Managing Director’s Review of Operations and the
Management Discussion and Analysis.

58 Royal Ceramics Lanka PLC . Annual Report 2014 - 2015
RISKMAnAGEMEnTThe Board of Directors are responsible for risk management in the
Company and is supported by the Audit committee and Group
Management Committee. The aim of the risk management system
is to ensure that the extent to which the company’ strategic and
operational objectives are being achieved is understood, that the
company’s reporting is reliable and that the company complies
with relevant laws and regulations.
The Risk Management Framework of Rocell has been designed
to achieve maximum integration of the risk management process
in the normal business processes. It provides for risk assessment
tools, controls for risks that commonly occur in the company and
monitoring and reporting procedures and systems. The internal
controls for the goods and money flows have been ‘built into’
business processes, and tools have been developed to support
their implementation and to monitor their effectiveness in
operation. In this way, a high level of internal control is achieved
efficiently.
The Functioning of the System in 2015
The important events in risk management in 2015 are reported
below. This section is structured according to the elements of the
Company’s risk management framework.
Internal environment for risk management
Values and business principles are an important element of the
internal environment for risk management. Directly related to its
mission to create brighter lives for people today and generations
to come, Rocell has chosen sustainability as its core value.
Rocell’s business principles, which are defined in the Code of
Business Conduct, are based on this core value. The Company
Code of Business Conduct describes principles in the areas of
People (social and humanitarian standards), Planet (principles with
regard to the environment) and Profit (principles regarding fair
and ethical business practices). A company-wide inventory was
made of bribery and corruption risks. This inventory will be used
to complement the general policy against corruption and bribery
with business and region specific actions and practices.
Another important factor determining the internal environment for
risk management is the risk appetite. This risk appetite cannot be
captured in one figure or formula, but varies per category of risks.
The Board of Directors has reviewed the company’s desired risk
appetite. The main characteristics can be described as follows:
• Tofulfillitsstrategicintent,Rocellispreparedtoaccept
considerable risks in its drive to develop its people and
organizational base into a competitive advantage, in its
innovation programs, in its expansion to high growth economies
and in developing sustainability as a business driver. Of course
these risks will always be limited by defined hurdle criteria and
rigorous implementation programs.
• Inriskareassuchasintellectualpropertyprotection,acquisitions
and joint ventures, production-process reliability, business
continuity, and product liability the company is cautious to
conservative.
•Withregardtoreputation,safety,healthandenvironmentand
internal and external non-compliance the company is risk
averse.
This risk appetite gives guidance for the responses to the risks
identified in the Corporate Risk Assessment (see below). For
specific units, the risk appetite may deviate from the overall
company profile.
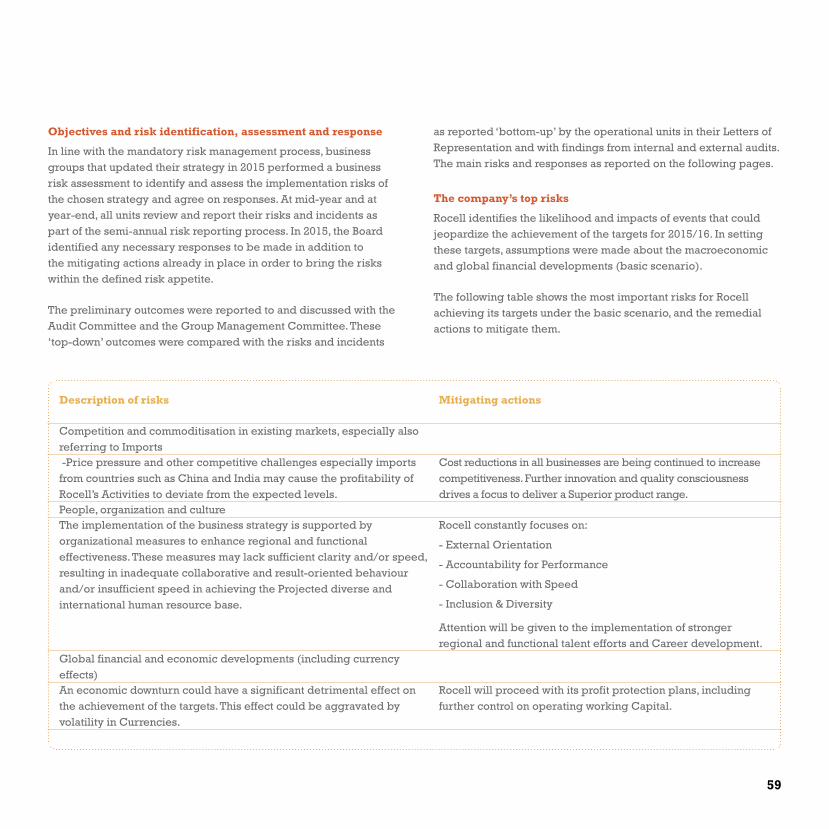
59
Objectives and risk identification, assessment and response
In line with the mandatory risk management process, business groups that updated their strategy in 2015 performed a business risk assessment to identify and assess the implementation risks of the chosen strategy and agree on responses. At mid-year and at year-end, all units review and report their risks and incidents as part of the semi-annual risk reporting process. In 2015, the Board identified any necessary responses to be made in addition to the mitigating actions already in place in order to bring the risks within the defined risk appetite.
The preliminary outcomes were reported to and discussed with the Audit Committee and the Group Management Committee. These ‘top-down’ outcomes were compared with the risks and incidents
as reported ‘bottom-up’ by the operational units in their Letters of Representation and with findings from internal and external audits. The main risks and responses as reported on the following pages.
The company’s top risks
Rocell identifies the likelihood and impacts of events that could jeopardize the achievement of the targets for 2015/16. In setting these targets, assumptions were made about the macroeconomic and global financial developments (basic scenario).
The following table shows the most important risks for Rocell achieving its targets under the basic scenario, and the remedial actions to mitigate them.
Description of risks Mitigating actions
Competition and commoditisation in existing markets, especially also referring to Imports -Price pressure and other competitive challenges especially imports from countries such as China and India may cause the profitability of Rocell’s Activities to deviate from the expected levels.
Cost reductions in all businesses are being continued to increase competitiveness. Further innovation and quality consciousness drives a focus to deliver a Superior product range.
People, organization and cultureThe implementation of the business strategy is supported by organizational measures to enhance regional and functional effectiveness. These measures may lack sufficient clarity and/or speed, resulting in inadequate collaborative and result-oriented behaviour and/or insufficient speed in achieving the Projected diverse and international human resource base.
Rocell constantly focuses on:
- External Orientation
- Accountability for Performance
- Collaboration with Speed
- Inclusion & Diversity
Attention will be given to the implementation of stronger regional and functional talent efforts and Career development.
Global financial and economic developments (including currency effects)An economic downturn could have a significant detrimental effect on the achievement of the targets. This effect could be aggravated by volatility in Currencies.
Rocell will proceed with its profit protection plans, including further control on operating working Capital.

60 Royal Ceramics Lanka PLC . Annual Report 2014 - 2015
Other important risks
• Acquisitions&Partnerships
The risk on Acquisitions & Partnerships shifted from finding
sufficient additional value adding acquisitions to getting the
recent acquisitions effectively integrated. The company has
developed good practices and structured processes to mitigate
this.
• Innovation
The current outlook is that Rocell is on track to realize the
innovation ambitions as set in its strategy and it’s Brand Promise.
In addition to the top risks, the most recent risk assessment and
reports show the following risks as being most important:
• Rawmaterialandenergypriceandavailabilityrisks.
Rocell implement various policies to avoid supply chain
disruptions (e.g. multiple supplier strategy) and decrease price
volatility (e.g. supplier contracts). Nevertheless, the increasing
complexity and interdependence of worldwide supply streams
as well as increasing (perceived) pressure on the availability of
resources may lead to price fluctuations and availability issues,
influencing Rocell’s profitability.
• Intellectualproperty(IP)risks.
The policy of accelerated growth through speeding up
innovation and expansion in high growth economies holds the
risk of increased exposure in the IP area. Measures will continue
to be taken to contain these risks, but these may not always be
completely effective in mitigating IP risks.
• Security(includinginformationsecurity).
Especially in the area of the security of and access to data in ICT
systems, a continued focus on monitoring and mitigating actions
is required, given the increasing tension between the growing
professionalism of cybercrime and widespread use of (mobile)
IT.
• Businesscontinuityrisks.
Major disruptions, especially in the supply chain, in
manufacturing and in the ICT environment, remain a low
likelihood but possibly a high impact risk. Actions are being
continued to recognize and prepare for the most important
scenarios.
• Safety,HealthandEnvironmental(SHE)risks.
Rocell have enhanced its already strict safety policies even
further. These risks cannot be excluded altogether and any
accidents may have a deep impact in terms of human suffering
and (reputation) damage to the company.
• Productionprocessrisks.
These risks are identified and mitigated frequently. This
demonstrates awareness for the normal operational risks of the
company.
Overview of risk categories
The following is an overview of all risk categories that have been
identified as potentially important and from which the main risks
described above have been derived.
For the management of all these categories of risks, strategies,
controls and/or mitigating measures have been put in place as part
of Rocell’s risk management practices. These nevertheless involve
uncertainties that may lead to the actual results differing from
those projected. There may also be risks that the company has not
yet fully assessed and that are currently qualified as ‘minor’ but
that could have a material impact on the company’s performance
at a later stage. The company’s risk management and internal
control system has been designed to identify and respond to these
developments on time, but 100% assurance can never be achieved.
RISK MAnAGEMEnT

61
Control activities
Rocell’s Audit Committee which, under the direction of the
Managing Director sets up annual risk management plans
monitors their implementation and reviews risk management
issues on a regular basis. During the year under review, major risk
management events, such as business risk assessments, audits and
the occurrence of control failures or weaknesses, were discussed
with the responsible Group Management Committee and Board
member.
generic/strategic risks
•Globalfinancialandeconomicdevelopmentrisks
• Risksrelatedtohighgrowtheconomies
• Risksofcompetitionandcommoditisationinexistingmarkets
• Politicalandcountryrisks
• Risksrelatedtodisposals,acquisitionsandjointventures
• Innovationrisks(newmarkets,productsandtechnologies)
• People,organizationandculturerisks
• IntellectualPropertyprotectionrisks
• Rawmaterial/energypriceandavailabilityrisks
• Sustainabilityrisks
•Othergeneric/strategicrisks
Operational risks
• Reputationrisks
•Customerrisks
• Productionprocessrisks
• Businesscontinuityrisks
• Productliabilityrisks
• ICTrisks
• ProgramandProjectManagementrisks
• (Information)securityandInternalControlrelatedrisks
• Industrialrelationsrisks
• Safety,HealthandEnvironmentalrisks
•Otheroperationalrisks
Financial and reporting risks
• Liquidityandmarketrisks
• Reportingintegrityrisks
•Otherfinancialrisks(e.g.credit,tax)
Legal and compliance risks
• Risksoflegalnon-compliance
• Risksrelatedtoregulatorydevelopments
•Otherlegalandcompliancerisks
Commonly occurring risks are mitigated through the
implementation of the Corporate Requirements and process
controls in the business processes. The operational units
regularly test compliance with these requirements and the
effectiveness of the controls. Deviations from Corporate
Requirements are only allowed temporarily, if sufficient
alternative controls are in place and after approval by the
responsible Board member. A limited number of waivers have
been granted.
Information and communication
A continuous effort is being made to inform employees about the
Rocell risk management system and train them in its use.
Conclusion
The Board of Directors, the Audit Committee and the Group
Management Committee are of the view that an effective Risk
Management Framework and Process is in place to minimize all
potential risks and their probable impact on Rocell.

62 Royal Ceramics Lanka PLC . Annual Report 2014 - 2015
AnnUAL REPORT OF THE BOARD OF DIRECTORS On THE AFFAIRS OF THE COMPAnY
The Directors of Royal Ceramics Lanka PLC have pleasure in
presenting their Annual Report together with the Audited Financial
Statements of the Company and the audited financial statements of
the Group for the year ended 31st March 2015.
general
Royal Ceramics Lanka PLC is a public limited liability company
which was incorporated under the Companies Act No. 17 of 1982
as a private limited company on 29th August 1990, converted to a
public limited liability company on 6th December 1991, listed on
the Colombo Stock Exchange on 3rd May 1994 and re-registered
as per the Companies Act, No.7 of 2007 on 13th March 2008 with
PQ 125 as the new number assigned to the Company.
Principal activities of the Company and review of performance during the year
The Principal activities of the Company are the holding of
investments and the manufacture and sale of wall tiles and floor
tiles.
The Principal activities of subsidiary Companies are the
manufacture and sale of wall and floor tiles, sanitary ware,
paint and allied products, distribution of tiles and undertaking
designing and laying of tiles, investments and management of
subsidiary companies, cultivation and processing of tea and
rubber, mining, processing and sale of raw materials for tiles
and ceramic products, manufacture and sale of tile grout and
mortar, manufacturing and trading of aluminium extrusions and
manufacture and marketing of corrugated cartons.
During the year a company, under the name Rocell Pty Limited, was
incorporated as a fully owned subsidiary of Royal Ceramics Lanka
PLC in Australia, to engage in the wholesale and retail business of
floor and wall tiles and bath ware.
A review of the business and performance of the Group during
the year, with comments on financial results, future strategies and
prospects are contained in the Managing Director’s Review of
Operations, Chairman’s Statement and Management Discussion
and Analysis on pages 8,9 and 16 which form an integral part of
this Report.
This Report together with the Financial Statements, reflect the state
of affairs of the Company.
Financial Statements
The complete Financial Statements of the Company and the
consolidated financial statements of the Company and its
subsidiaries duly signed by two Directors on behalf of the Board
and the Auditors are given on pages 80 to181.
Auditors’ Report
The Report of the Auditors on the Group Financial Statements of
the Company is given on page 79.
Accounting Policies
The accounting policies adopted by the Company in the
preparation of Group’s consolidated financial statements are given
on pages 88 to 109 and are consistent with those of the previous
period.
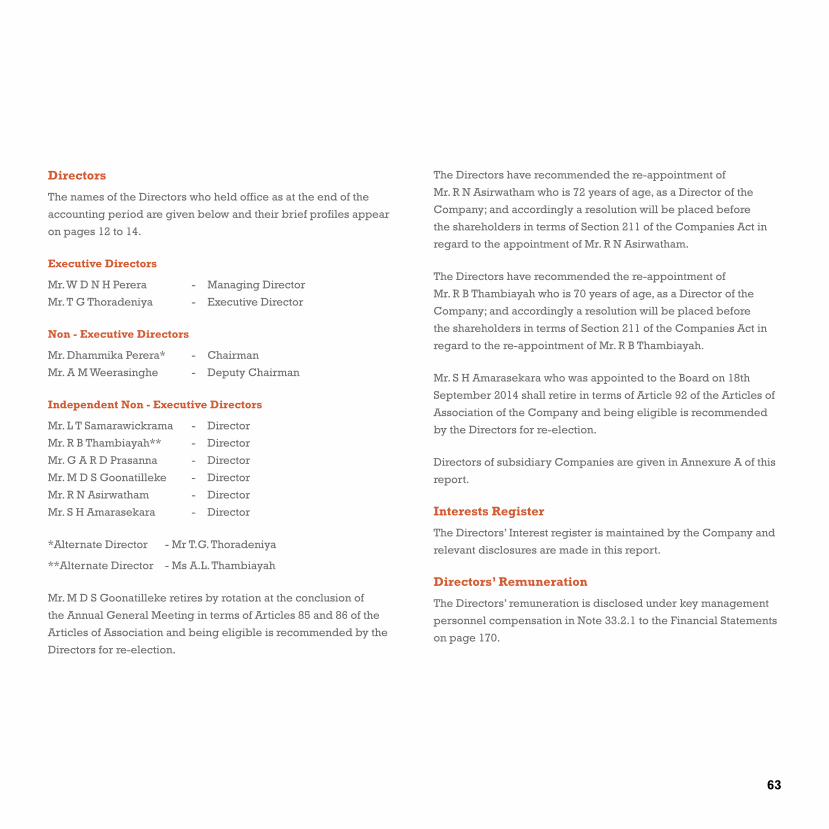
63
Directors
The names of the Directors who held office as at the end of the
accounting period are given below and their brief profiles appear
on pages 12 to 14.
Executive Directors
Mr. W D N H Perera - Managing Director
Mr. T G Thoradeniya - Executive Director
Non - Executive Directors
Mr. Dhammika Perera* - Chairman
Mr. A M Weerasinghe - Deputy Chairman
Independent Non - Executive Directors
Mr. L T Samarawickrama - Director
Mr. R B Thambiayah** - Director
Mr. G A R D Prasanna - Director
Mr. M D S Goonatilleke - Director
Mr. R N Asirwatham - Director
Mr. S H Amarasekara - Director
*Alternate Director - Mr T.G. Thoradeniya
**Alternate Director - Ms A.L. Thambiayah
Mr. M D S Goonatilleke retires by rotation at the conclusion of
the Annual General Meeting in terms of Articles 85 and 86 of the
Articles of Association and being eligible is recommended by the
Directors for re-election.
The Directors have recommended the re-appointment of
Mr. R N Asirwatham who is 72 years of age, as a Director of the
Company; and accordingly a resolution will be placed before
the shareholders in terms of Section 211 of the Companies Act in
regard to the appointment of Mr. R N Asirwatham.
The Directors have recommended the re-appointment of
Mr. R B Thambiayah who is 70 years of age, as a Director of the
Company; and accordingly a resolution will be placed before
the shareholders in terms of Section 211 of the Companies Act in
regard to the re-appointment of Mr. R B Thambiayah.
Mr. S H Amarasekara who was appointed to the Board on 18th
September 2014 shall retire in terms of Article 92 of the Articles of
Association of the Company and being eligible is recommended
by the Directors for re-election.
Directors of subsidiary Companies are given in Annexure A of this
report.
Interests Register
The Directors’ Interest register is maintained by the Company and
relevant disclosures are made in this report.
Directors’ Remuneration
The Directors’ remuneration is disclosed under key management
personnel compensation in Note 33.2.1 to the Financial Statements
on page 170.

64 Royal Ceramics Lanka PLC . Annual Report 2014 - 2015
Directors’ Interests in Contracts
Except for the transactions referred to in Note 33 to the Financial
Statements, the Company did not carry out any transaction with any
of the Directors. The Company carried out transactions during the
year in the ordinary course of its business at commercial rates with
the related entities of directors referred to herein. The Directors
have no direct or indirect interest in any other contract or proposed
contract with the Company
AnnUAL REPORT OF THE BOARD OF DIRECTORS On THE AFFAIRS OF THE COMPAnY
Name of
Related Party
Name of Director Relationship Details Balance
outstanding
As at
31/03/2015
Royal Porcelain
(Pvt) Ltd
Mr. W.D.N.H.Perera
Mr. T.G.Thoradeniya
Mr. R.B.Thambiayah
Mr. L.T. Samarawickrema
Mr.G.A.R.D Prasanna
Mr.M.D.S. Goonatillake
Mr.R.N.Asirwatham
Mr A.M.Weerasinghe
Managing Director
Director Marketing
& Business
Development
Director
Director
Director
Director
Director
Director
A sum of Rs.1,140,301 /- was Received as Service
charges
A sum of Rs.4,500,000/- was received as Rent
Materials worth of Rs. 14,626,119/- were Sold
A sum of Rs870,000,000 /- was received as dividends.
A sum of Rs. 13,308,884/- worth of Damaged tiles
were purchased.
Materials worth of Rs. 22,627,919/- were Purchased
A sum of Rs.1,413,838,195/= was received as short
term funds
A sum of Rs.424,254,526/= was received as
reimbursement of expenses.
(587,885,479)
Rocell
Bathware Ltd
Mr. W.D.N.H.Perera
Mr. T.G.Thoradeniya
Mr. R.B.Thambiayah
Mr. L.T. Samarawickrema
Mr.G.A.R.D Prasanna
Mr.M.D.S. Goonatillake
Mr.R.N.Asirwatham
Mr A.M.Weerasinghe
Director
CEO
Director
Director
Director
Director
Director
Chairman
Materials worth of Rs. 767,899/- were purchased.
Materials worth of Rs. 2,618,496/- were sold.
A sum of Rs 230,825,947/- was received as short term
funds.
A sum of Rs. 125,066,090/- was received as
reimbursement of expenses.
A sum of Rs. 2,510,999/- was received as dividends.
(448,506,783)
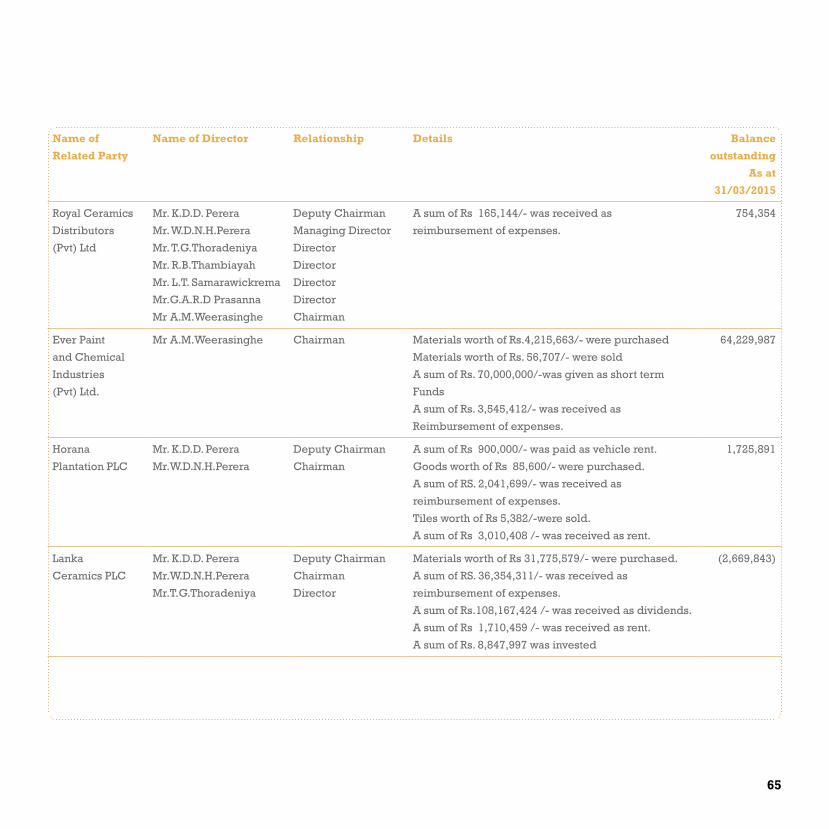
65
Name of
Related Party
Name of Director Relationship Details Balance
outstanding
As at
31/03/2015
Royal Ceramics
Distributors
(Pvt) Ltd
Mr. K.D.D. Perera
Mr. W.D.N.H.Perera
Mr. T.G.Thoradeniya
Mr. R.B.Thambiayah
Mr. L.T. Samarawickrema
Mr.G.A.R.D Prasanna
Mr A.M.Weerasinghe
Deputy Chairman
Managing Director
Director
Director
Director
Director
Chairman
A sum of Rs 165,144/- was received as
reimbursement of expenses.
754,354
Ever Paint
and Chemical
Industries
(Pvt) Ltd.
Mr A.M.Weerasinghe Chairman Materials worth of Rs.4,215,663/- were purchased
Materials worth of Rs. 56,707/- were sold
A sum of Rs. 70,000,000/-was given as short term
Funds
A sum of Rs. 3,545,412/- was received as
Reimbursement of expenses.
64,229,987
Horana
Plantation PLC
Mr. K.D.D. Perera
Mr.W.D.N.H.Perera
Deputy Chairman
Chairman
A sum of Rs 900,000/- was paid as vehicle rent.
Goods worth of Rs 85,600/- were purchased.
A sum of RS. 2,041,699/- was received as
reimbursement of expenses.
Tiles worth of Rs 5,382/-were sold.
A sum of Rs 3,010,408 /- was received as rent.
1,725,891
Lanka
Ceramics PLC
Mr. K.D.D. Perera
Mr.W.D.N.H.Perera
Mr.T.G.Thoradeniya
Deputy Chairman
Chairman
Director
Materials worth of Rs 31,775,579/- were purchased.
A sum of RS. 36,354,311/- was received as
reimbursement of expenses.
A sum of Rs.108,167,424 /- was received as dividends.
A sum of Rs 1,710,459 /- was received as rent.
A sum of Rs. 8,847,997 was invested
(2,669,843)

66 Royal Ceramics Lanka PLC . Annual Report 2014 - 2015
Name of
Related Party
Name of Director Relationship Details Balance
outstanding
As at
31/03/2015
Lanka Tiles PLC Mr. K.D.D. Perera
Mr.W.D.N.H.Perera
Mr.T.G.Thoradeniya
Director
Chairman
Director
Materials worth of Rs 1,031,229/- goods were
purchased.
Tiles worth of Rs 645,731/- were sold.
A sum of Rs.121,987,002/- was received as
Technical charges
A sum of RS. 56,573,878/- was received as
reimbursement of expenses.
A sum of Rs.4,404,283/- was received as dividends.
A sum of Rs. 58,317,540 was invested
16,846,930
Lanka
Walltiles PLC
Mr.W.D.N.H.Perera
Mr.T.G.Thoradeniya
Chairman
Director
Tile worth of Rs 344,531/- were sold.
A sum of Rs 35,092,058 was received as technical fee.
A sum of RS. 41,453,046/- was received as
reimbursement expenses.
A sum of Rs.2,610,765 /- was received as dividends.
A sum of Rs. 7,423,067/- was received as sales
commission
5,350,770
Uni-Dil
Packaging
Limited
Mr.W.D.N.H.Perera
Mr.T.G.Thoradeniya
Chairman
Director
Goods worth of Rs 30,962,368/- were purchased.
A sum of RS. 925,982/- was received as
reimbursement expenses.
(8,046,691)
Swisstek
(Ceylon) PLC
Mr.W.D.N.H.Perera
Mr.T.G.Thoradeniya
Chairman
Director
Goods worth of Rs 1,477,347/- were purchased.
A sum of RS.1,310,601 was received as Technical
charges.
A sum of RS.8,196,198/- was paid as sales commission
A sum of RS. 5,442,456/- was received as
reimbursement of expenses.
(2,625,541)
Swisstek
Aluminium
Limited
Mr.W.D.N.H.Perera Chairman A sum of RS. 13,564,019/- was received as
reimbursement of expenses.
626,570
AnnUAL REPORT OF THE BOARD OF DIRECTORS On THE AFFAIRS OF THE COMPAnY

67
Name of
Related Party
Name of Director Relationship Details Balance
outstanding
As at
31/03/2015
Aitken Spence
Hotels PLC
Mr. R N Asirwatham Director Tiles worth of Rs 27,028/- were sold.
A sum of Rs.450,000/- was received as dividends.
14,355
Chemanex PLC Mr. S H Amarasekara Chairman Tiles worth of Rs 1,686,652/- were sold. (369,636)
Colombo
Land and
Development
Company
Mr. M D S Goonatilleke Director Tiles worth of Rs 10,648,392/- were sold.
Douglas &
Sons Ltd
Mr. M D S Goonatilleke Director Tiles worth of Rs 498,400/- were sold.
Haycarb PLC Mr. W D N H Perera
Mr. Dhammika Perera
Director
Director
Tiles worth of Rs 994,484/- were sold.
Hayleys PLC Mr. W D N H Perera
Mr. M D S Goonatilleke
Mr. L T Samarawickrama
Mr. K D D Perera
Director
Director
Director
Co-Chairman
(Non Executive)
Tiles worth of Rs 2,037,313/- were sold. 191,831
Kandyan Resorts
(Pvt) Ltd
Mr. L T Samarawickrama Director Tiles worth of Rs 438,108/- were sold.
Renuka Hotels
Ltd
Mr. R N Asirwatham
Mr. R B Thambiayah
Director
Chairman
Tiles worth of Rs 1,022,124/- were sold. 35,700
The Kingsbury
PLC
Mr. W D N H Perera
Mr. K D D Perera
Mr. L T Samarawickrama
Director
Director
Director
Tiles worth of Rs 494,634/- were sold.
A sum of Rs. 4,017,051 was paid as hotel bills
L B Finance PLC Mr. K D D Perera
Mr. W D N H Perera
Executive Deputy
Chairman
Executive Director
A sum of Rs.105,660,453 /- was received as dividends. 67,597
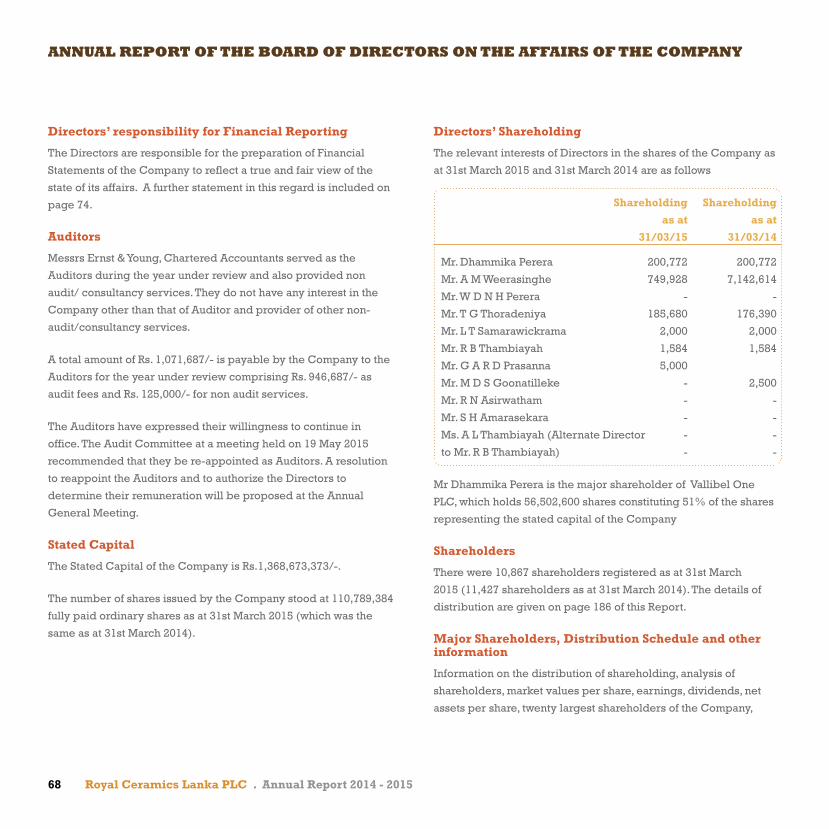
68 Royal Ceramics Lanka PLC . Annual Report 2014 - 2015
Directors’ responsibility for Financial Reporting
The Directors are responsible for the preparation of Financial
Statements of the Company to reflect a true and fair view of the
state of its affairs. A further statement in this regard is included on
page 74.
Auditors
Messrs Ernst & Young, Chartered Accountants served as the
Auditors during the year under review and also provided non
audit/ consultancy services. They do not have any interest in the
Company other than that of Auditor and provider of other non-
audit/consultancy services.
A total amount of Rs. 1,071,687/- is payable by the Company to the
Auditors for the year under review comprising Rs. 946,687/- as
audit fees and Rs. 125,000/- for non audit services.
The Auditors have expressed their willingness to continue in
office. The Audit Committee at a meeting held on 19 May 2015
recommended that they be re-appointed as Auditors. A resolution
to reappoint the Auditors and to authorize the Directors to
determine their remuneration will be proposed at the Annual
General Meeting.
Stated Capital
The Stated Capital of the Company is Rs.1,368,673,373/-.
The number of shares issued by the Company stood at 110,789,384
fully paid ordinary shares as at 31st March 2015 (which was the
same as at 31st March 2014).
Directors’ Shareholding
The relevant interests of Directors in the shares of the Company as
at 31st March 2015 and 31st March 2014 are as follows
Shareholding Shareholding
as at as at
31/03/15 31/03/14
Mr. Dhammika Perera 200,772 200,772
Mr. A M Weerasinghe 749,928 7,142,614
Mr. W D N H Perera - -
Mr. T G Thoradeniya 185,680 176,390
Mr. L T Samarawickrama 2,000 2,000
Mr. R B Thambiayah 1,584 1,584
Mr. G A R D Prasanna 5,000
Mr. M D S Goonatilleke - 2,500
Mr. R N Asirwatham - -
Mr. S H Amarasekara - -
Ms. A L Thambiayah (Alternate Director - -
to Mr. R B Thambiayah) - -
Mr Dhammika Perera is the major shareholder of Vallibel One
PLC, which holds 56,502,600 shares constituting 51% of the shares
representing the stated capital of the Company
Shareholders
There were 10,867 shareholders registered as at 31st March
2015 (11,427 shareholders as at 31st March 2014). The details of
distribution are given on page 186 of this Report.
Major Shareholders, Distribution Schedule and other information
Information on the distribution of shareholding, analysis of
shareholders, market values per share, earnings, dividends, net
assets per share, twenty largest shareholders of the Company,
AnnUAL REPORT OF THE BOARD OF DIRECTORS On THE AFFAIRS OF THE COMPAnY

69
percentage of shares held by the public as per the Listing Rules of
the Colombo Stock Exchange are given on page 186 to187 under
Share Information and on page No. 182 under the 10 year summary
of the Company.
Employment Policy
The Company’s employment policy is totally non-discriminatory
which respects individuals and provides carrier opportunities
irrespective of the gender, race or religion.
1,028 persons were in employment as at 31st March 2015 (1,001
persons as at 31st March 2014).
Reserves
The reserves of the Company with the movements during the year
are given in Note 14 to the Financial Statements on page 135.
Land holdings
The Company’s land holdings referred to in note 3 of the accounts
comprise of the following:
Location No of Extent As At
Buildings (perches) 31-03-2015
Kottawa 3 230.72 105,485,000.00
Eheliyagoda 28 7,937.40 250,299,000.00
Meegoda WH 1 440.00 52,379,000.00
Nawala New 1 24.96 87,150,000.00
Nuwara Eliya 1 28.69 25,048,150.00
Naththandiya - 1,600.00 20,000,000.00
Kalutara - 768.16 11,525,000.00
Seeduwa - 52.52 66,112,619.00
Narahenpita - 17.02 59,313,500.00
Colpetty 1 19.96 119,820,000.00
Panadura 1 18.82 55,164,932.00
36 11,138.25 852,297,201.00
1. A land of an extent of 18.82 perches situated in Panadura,
which was acquired during the current financial year for Rs.
55,164,932. (The current market value being Rs. 55,164,932)
2. A land in extent 16 perches situated in Meegoda which was
acquired during the year for Rs 3,639,000 (current market value
being Rs 3,639,000).
3. A land in extent 27.95 perches at Ehaliyagoda which was
acquired during the year for Rs 3,149,000 (current market value
being Rs 3,149,000)
Property, Plant & Equipment
Details and movements of property, plant and equipment are given
under Notes 3 to the Financial Statements on pages 110 to 126.
Investments
Details of the Company’s quoted and unquoted investments as
at 31st March 2015 are given in Notes 5,6 and 12 to the Financial
Statements on pages 128, 129 and 134.
Donations
The Company made donations amounting to Rs. 12,000/- in total,
during the year under review
Dividends
During the year under review the Company paid two interim
dividends of which the first interim dividend of Rs. 1/- per share
for the financial year ending 31st March 2015 was paid on 21st
November 2014 and the second interim dividend of Rs. 2/- per
share for the financial year ending 31st March 2015 was paid on
17th March 2015
The Directors have recommended a final dividend of Rs 2/- per
share for the year under review subject to obtaining a certificate of
solvency from the auditors and to be approved by the shareholders

70 Royal Ceramics Lanka PLC . Annual Report 2014 - 2015
at the forthcoming Annual General Meeting. As required by Section
56 of the Companies Act, the Directors have certified that they
are satisfied that the Company will, immediately after the said
distribution is made, satisfy the solvency test in accordance with
the Companies Act. No 07 of 2007.
The said dividend will be payable subject to approval by the
shareholders, on 7th market day from the date of the annual
general meeting. The said dividends are included in the
distributable profit for the year under review.
Risk Management
An ongoing process is in place to identify and manage the risks
that are associated with the business and operations of the
Company. The Directors review this process through the Audit
Committee.
Specific steps taken by the Company in managing the risks are
detailed in the section on Risk Management on pages 58.
Statutory Payments
The Directors confirm that to the best of their knowledge, all taxes,
duties and levies payable by the Company, all contributions, levies
and taxes payable on behalf of, and in respect of employees of
the Company and all other known statutory dues as were due
and payable by the Company as at the Balance Sheet date have
been paid or, where relevant provided for, except for certain
assessments where appeals have been lodged.
Contingent Liabilities
Except as disclosed in Note 29 to the Financial Statements on page
167. There were no material Contingent Liabilities as at the Balance
Sheet date.
Events occurring after the Balance Sheet date
Except for the matters disclosed in Note 31 to the Financial
Statements on page 168 there are no material events as at the date
of the Auditor’s report which require adjustment to, or disclosure in
the Financial Statements.
Corporate governance
The Board of Directors confirms that the Company is compliant
with section 7.10 of the Listing Rules of the CSE.
An Audit Committee and a Remuneration Committee function as
Board sub committees, with Directors who possess the requisite
qualifications and experience. The composition of the said
committees is as follows.
Audit Committee
Mr. M D S Goonatilleke - Chairman
Mr. L T Samarawickrama
Mr. R N Asirwatham
Mr. S H Amarasekara
Remuneration Committee
Mr. R B Thambiayah - Chairman
Mr. L T Samarawickrama
Mr. M D S Goonatilleke
The corporate governance of the Company is reflected in its
strong belief in protecting and enhancing stakeholder value in
a sustainable manner, supported by a sound system of policies
and practices. Prudent internal controls ensure professionalism,
integrity and commitment of the Board of Directors, Management
and employees.
AnnUAL REPORT OF THE BOARD OF DIRECTORS On THE AFFAIRS OF THE COMPAnY

71
The Corporate Governance Statement on pages 53 to 57 explains
the measures adopted by the Company during the year.
Corporate Social Responsibility
The Company continued its Corporate Social Responsibility
Programme, details of which are set out on pages 36 to 47 of this
Report.
Special Business
The Board is of the opinion that the change of name of the
Company to ‘Rocell PLC’ would be appropriate to further elevate
the Company’s image and profile, recommends to the shareholders
that the name of the Company be changed to ‘Rocell PLC’.
Accordingly, a resolution will be placed before the shareholders
at the forthcoming Annual General Meeting to give effect to such
change of name.
The Directors have also recommended an amendment to the
Articles of Association whereby the provisions for the appointment
and cessation of an Alternate Director be changed inter alia to
enable an Alternate Director to be appointed at any time by notice
in writing left at the Office. Accordingly, a resolution is placed
before the shareholders to obtain shareholders’ approval for the
said amendment to the Articles of Association.
Annual general Meeting
The Notice of the Twenty Fifth (25th) Annual General Meeting
appears on page 190.
This Annual Report is signed for and on behalf of the Board of
Directors by
Dhammika Perera
Chairman
W D N H Perera
Managing Director
P W Corporate Secretarial (Pvt) Ltd
Secretaries
29th May 2015

72 Royal Ceramics Lanka PLC . Annual Report 2014 - 2015
Annexure A to the Annual Report of the Board of Directors on the Affairs of The Company
Directors of subsidiary Companies
Royal Porcelain (Private) Limited
Mr. A M Weerasinghe
Mr. W D N H Perera
Mr. T G Thoradeniya
Mr. L T Samarawickrama
Mr. R B Thambiayah
Mr. G A R D Prasanna
Mr. M D S Goonatilleke
Mr. R N Asirwatham
Mr. H Somashantha
Mr. M W R N Somaratne
Rocell Bathware Limited
Mr. A M Weerasinghe
Mr. W D N H Perera
Mr. T G Thoradeniya
Mr. L T Samarawickrama
Mr. R B Thambiayah
Mr. G A R D Prasanna
Mr. M D S Goonatilleke
Mr. R N Asirwatham
Mr. D J Silva
Royal Ceramics Distributors Limited
Mr. A M Weerasinghe
Mr. W D N H Perera
Mr. T G Thoradeniya
Mr. G A R D Prasanna
Mr. L T Samarawickrama
Mr. R B Thambiayah
Mr. K D H Perera
Ever Paint and Chemical Industries (Private) Limited
Mr. A M Weerasinghe
Mr. H Somashantha
Mr. M W R N Somaratna
Mr. J K A Sirinatha
Mr. D B Gamalath
Lanka Ceramic PLC
Mr. W D N H Perera
Mr. JA P M Jayasekara
Mr. Dhammika Perera
Mr. T G Thoradeniya
Dr. S Selliah
Mr. K D G Gunaratne
Ms A M L Page
Mr. N A Abeyesekera
Mr. D J Silva
Mr. R D P Godawatta Arachchige
(Alternate Director to Mr Dhammika Perera)
Lanka Walltiles PLC
Mr. W D N H Perera
Mr. J A P M Jayasekera
Mr. T De Soysa
Dr. S Selliah
Mr. T G Thoradeniya
Mr. K D G Gunaratne
Ms. A M L Page
Mr. M W R N Somaratne
Lanka Tiles PLC
Mr. W D N H Perera
Mr. Dhammika Perera
Mr. J A P M Jayasekara
Mr. P L Amarasinghe
AnnUAL REPORT OF THE BOARD OF DIRECTORS On THE AFFAIRS OF THE COMPAnY
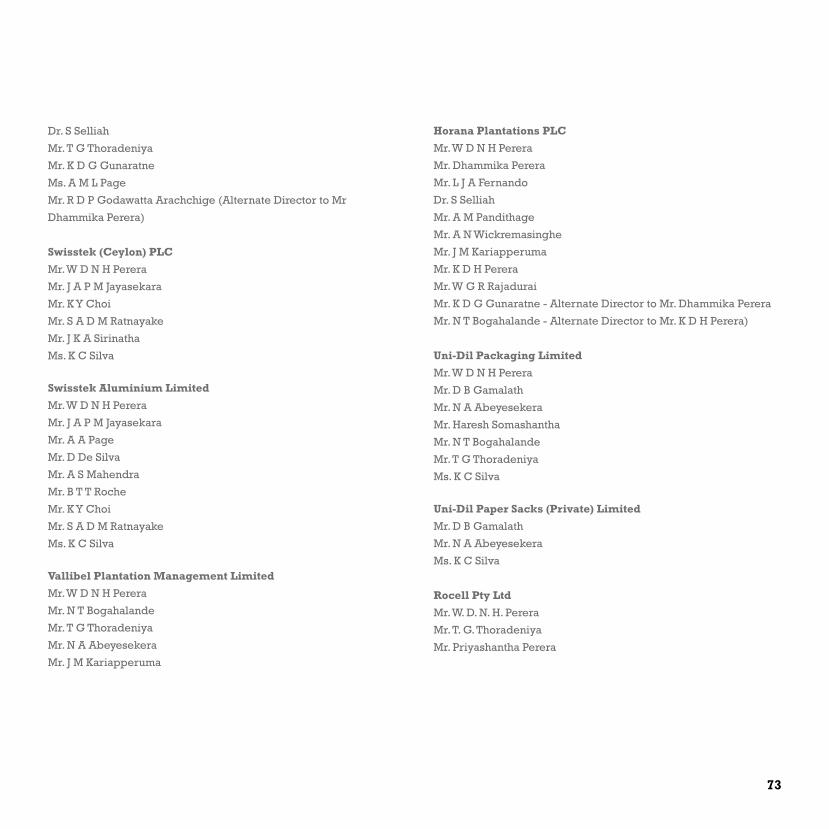
73
Dr. S Selliah
Mr. T G Thoradeniya
Mr. K D G Gunaratne
Ms. A M L Page
Mr. R D P Godawatta Arachchige (Alternate Director to Mr
Dhammika Perera)
Swisstek (Ceylon) PLC
Mr. W D N H Perera
Mr. J A P M Jayasekara
Mr. K Y Choi
Mr. S A D M Ratnayake
Mr. J K A Sirinatha
Ms. K C Silva
Swisstek Aluminium Limited
Mr. W D N H Perera
Mr. J A P M Jayasekara
Mr. A A Page
Mr. D De Silva
Mr. A S Mahendra
Mr. B T T Roche
Mr. K Y Choi
Mr. S A D M Ratnayake
Ms. K C Silva
Vallibel Plantation Management Limited
Mr. W D N H Perera
Mr. N T Bogahalande
Mr. T G Thoradeniya
Mr. N A Abeyesekera
Mr. J M Kariapperuma
Horana Plantations PLC
Mr. W D N H Perera
Mr. Dhammika Perera
Mr. L J A Fernando
Dr. S Selliah
Mr. A M Pandithage
Mr. A N Wickremasinghe
Mr. J M Kariapperuma
Mr. K D H Perera
Mr. W G R Rajadurai
Mr. K D G Gunaratne - Alternate Director to Mr. Dhammika Perera
Mr. N T Bogahalande - Alternate Director to Mr. K D H Perera)
Uni-Dil Packaging Limited
Mr. W D N H Perera
Mr. D B Gamalath
Mr. N A Abeyesekera
Mr. Haresh Somashantha
Mr. N T Bogahalande
Mr. T G Thoradeniya
Ms. K C Silva
Uni-Dil Paper Sacks (Private) Limited
Mr. D B Gamalath
Mr. N A Abeyesekera
Ms. K C Silva
Rocell Pty Ltd
Mr. W. D. N. H. Perera
Mr. T. G. Thoradeniya
Mr. Priyashantha Perera

74 Royal Ceramics Lanka PLC . Annual Report 2014 - 2015
STATEMEnT OFDIRECTORS’ RESPOnSIBILITIESThe Directors are responsible for preparing the Annual Report
and the Consolidated Financial Statements in accordance with
the Companies Act, No.7 of 2007 and Sri Lanka Accounting and
Auditing Standards Act No. 15 of 1995 and are required to prepare
Financial Statements for each financial year, which give a true and
fair view of the state of affairs of the Company and its subsidiaries
as at the reporting date and the income and expenditure of the
Company for the accounting year ending on that reporting date.
The Directors are also responsible in ensuring that the Financial
Statements comply with any regulations made under the
Companies Act, which specifies the form and content of Financial
Statements and any other requirements which apply to the
Company’s Financial Statements under any other law.
The Directors have ensured that the Financial Statements
presented in this Annual Report have been prepared using
appropriate accounting policies, consistently applied and
supported by reasonable and prudent judgments’ and estimates
and in compliance with the Sri Lanka Financial Reporting
Standards, Companies Act, No.7 of 2007 and the Sri Lanka
Accounting and Auditing Standards Act No.15 of 1995.
The Directors are responsible for keeping sufficient accounting
records, which disclose with reasonable accuracy the financial
position of the group, which will enable them to have the Financial
Statements prepared and presented as aforesaid.
They are also responsible for taking measures to safeguard the
assets of the group and in that context to have proper regards to
the establishment of appropriate systems of internal control with a
view to prevention and detection of fraud and other irregularities.
The Directors are also confident that the Company and the group
have adequate resources to continue in operation and have applied
the going concern basis in preparing the financial statements.
The Directors are of the view that they have discharged their
responsibilities as set out in this statement.
By Order of the Board
Royal Ceramics Lanka PLC
P W Corporate Secretarial (Pvt) Ltd
Secretaries
29th May 2015

75
REPORT OF THEAUDIT COMMITTEE
Composition of the Audit Committee
The Audit Committee, appointed by the Board of Directors of
Royal Ceramics Lanka PLC, comprises of four Independent Non-
Executive Directors, and is chaired by Mr. M.D.S.Goonatilleke, who
is an Associate member of the Institute of Chartered Management
Accountants (UK) and a passed finalist of the Institute of Chartered
Accountants (Sri Lanka).
The members of the Board appointed Audit Committee are;
Mr. M D S Goonatilleke - Chairman
Mr. L T Samarawickrama
Mr. R N Asirwatham
Mr. S.H Amarasekara
The Board Secretary functions as the Secretary to the Audit
Committee.
Role of the Audit Committee
The Audit Committee is a formally constituted sub – committee
of the Board of Directors and it reports and is accountable to the
Board. The Committee has a written Terms of Reference, which
clearly defines the role and responsibility of the Audit Committee.
The key purpose of the Audit Committee of Royal Ceramics Lanka
PLC is to assist the Board of Directors in fulfilling its oversight
responsibility for;
1. The integrity of financial statements in accordance with Sri
Lanka Financial Reporting Standards.
2. The compliance with legal and regulatory requirements of
Companies Act and other relevant financial reporting related
regulations and requirements.
3. The External Auditor’s independence and performance.
4. The performance review of the internal audit function to ensure
that the Company’s internal controls and risk management
systems are adequate.
Meetings
The Audit Committee met three times during the year. The
Managing Director, Head of Finance & Treasury and Chief Internal
Auditor also attended these meetings by invitation. The other
executives and external auditors do so as and when required.
Attendance by the Committee members at each of these meetings
are given in the Corporate Governance Report on page 53. The
Committee carried out the following activities.
Financial Reporting
As part of its responsibility to oversee the Company’s financial
reporting process on behalf of the Board of Directors, the
Committee has reviewed and discussed with the Management,
the annual and the quarterly Financial Statements prior to their
issuance, including the extent of compliance with the Sri Lanka
Financial Reporting Standards and the Companies Act No. 07 of
2007.
Matters of special interest in the current environment and the
processes that support certifications of the Financial Statements by
the Company’s Managing Director and Head of Finance & Treasury
were also brought up for discussion.
76 Royal Ceramics Lanka PLC . Annual Report 2014 - 2015
Risks and Controls
During the year, the Committee assessed the major business
and control risks and the control environment prevalent in the
Company and advised the management on action to be taken in
areas where weaknesses were observed. The Committee reviewed
reports on losses resulting from frauds and operational failures,
and scrutinized the effectiveness of the Company’s internal control
system already in place and the processes for identification,
evaluation, and management of all significant risks.
External Audit
The Committee met with the External Auditor during the year to
discuss their audit approach and procedures, including matters
relating to the scope of the audit. In addition, the annual evaluation
of the independence and objectivity of the External Auditor and
the effectiveness of the audit process was also undertaken.
The Committee reviewed the Management Letter arising from the
audit of Annual Financial Statements issued by the External Auditor
together with the management responses and recommendations
thereto and ensured appropriate follow up actions were taken. The
Non-Audit Services provided by the External Auditor were also
reviewed and the Committee was of the view that such services
did not impair with their independence and were not within the
category of services identified as restricted under the guidelines
for listed companies on Audit and Audit Committees issued by the
Securities and Exchange Commission of Sri Lanka.
The Letter of Representation issued to the External Auditor was
tabled at the Audit Committee meeting. The re-appointment of the
External Auditor, M/s Ernst & Young has been recommended to the
Board of Directors and the Committee has also fixed the Auditor’s
remuneration, subject to approval by the shareholders at the
Annual General Meeting.
Internal Audit
During the year, the Audit Committee reviewed the performance
of the internal audit function the findings of the audits completed
which covered the head-office, showrooms, stores, factories and
Subsidiary companies with special reference to the internal
controls regarding inventory and debtors, and the Department’s
resource requirements including succession planning. The Internal
Audit Plan was also reviewed and approved by the committee and
follow up actions were monitored regularly.
Regulatory Compliance
The Head of Finance & Treasury has submitted to the Audit
Committee, a report on the extent to which the Company was
in compliance with mandatory and statutory requirements. The
Committee reviewed the procedures established by Management
for compliance with the requirements of regulatory bodies and
also ensured the full compliance to the Colombo Stock Exchange
Rule No 7.10 on Corporate Governance disclosure requirements,
which is given on page 60.
M D S goonatilleke
Chairman - Audit Committee
29th May 2015
REPORT OF THE AUDIT COMMITTEE

77
The Remuneration Committee, appointed by and responsible to the
Board of Directors, comprises three Non-Executive Independent
Directors
Mr. R B Thambiayah - Chairman
Mr. L T Samarawickrama
Mr. M D S Goonatilleke
Policy
The remuneration policy of the Company endeavours to attract,
motivate, and retain quality management in a competitive
environment with the relevant expertise necessary to achieve
the objectives of the Company. The Committee focuses on and is
responsible for ensuring that the total package is competitive to
attract the best talent for the benefit of the Company.
The remuneration framework of the Company for the Non-
Executive Chairman, Managing Director, and Corporate
Management is designed to create and enhance value to all
stakeholders of the Company and to ensure alignment qua the
short and long term interests of the Company and its Executives
and, in designing competitive compensation packages, the
Committee consciously balances the short-term performance with
medium to long-term goals of the Company.
Scope
The Committee reviews all significant changes in the corporate
sector in determining salary structures and terms and conditions
relating to staff at senior Executive level. In this decision making
process, necessary information and recommendations are
obtained from the Managing Director. The Committee deliberates
and recommends to the Board of Directors the remuneration
packages and annual increments and bonuses of the Managing
Director, members of the Corporate Management and Senior
REPORT OF THEREMUnERATIOn COMMITTEE
Executive staff and lays down guidelines for the compensation
structure for all Executive staff and overviews the implementation
of thereof. The Managing Director who is responsible for the
overall management of the Company attends all meetings by
invitation and participates in the deliberations except when his
own performance and compensation package is discussed.
Fees
All Non-Executive Directors receive a fee for attendance at Board
Meetings and serving on sub-committees. They do not receive
any performance or incentive payments. The total remuneration to
Directors is shown in Note 34.2.1 on page 189.
Meetings
The Committee met once during the financial year under review.
A report of the decisions approved and recommended to the Board
by the Committee has been approved by the Board of Directors.
Professional Advice
The Committee has the authority to seek external professional
advice on matters within its purview.
Committee Evaluation
Self-assessment by Committee members was compiled with at the
commencement of 2015.
R B Thambiayah
Chairman- Remuneration Committee
29th May 2015

78 Royal Ceramics Lanka PLC . Annual Report 2014 - 2015
FInAnCIAL CALEnDAR
Final Dividend 2013/14 May 30, 2014
Interim Report- 1st Quarter 2014/2015 August 12, 2014
Interim Report- 2nd Quarter 2014/2015 November 12, 2014
1st Interim Dividend 2014/15 November 21, 2014
Interim Report- 3rd Quarter 2014/2015 February 6, 2015
2nd Interim Dividend 2014/15 March 17, 2015
Interim Report- 4th Quarter 2014/2015 May 29, 2015
Annual Report 2014/2015 May 29, 2015
25th Annual general meeting June 29, 2015
Final Dividend 2014/15 July 9, 2015

79
INDEPENDENT AUDITORS’ REPORT
TO THE SHAREHOLDERS OF ROYAL CERAMICS LANKA PLC
Report on the Financial Statements
We have audited the accompanying financial statements of Royal Ceramics Lanka PLC, (the “Company”), and the consolidated financial statements of the Company and its subsidiaries (the “Group”), which comprise the statement of financial position as at 31 March 2015, and the statement of profit or loss and comprehensive income, statement of changes in equity and, cash flow statement for the year then ended, and a summary of significant accounting policies and other explanatory information.
Board’s Responsibility for the Financial Statements
The Board of Directors (the “Board”) is responsible for the preparation of these financial statements that give a true and fair view in accordance with Sri Lanka Accounting Standards, and for such internal control as Board determines is necessary to enable the preparation of financial statements that are free from material misstatement, whether due to fraud or error.
Auditors’ Responsibility
Our responsibility is to express an opinion on these financial statements based on our audit. We conducted our audit in accordance with Sri Lanka Auditing Standards. Those standards require that we comply with ethical requirements and plan and perform the audit to obtain reasonable assurance about whether the financial statements are free from material misstatement.
An audit involves performing procedures to obtain audit evidence about the amounts and disclosures in the financial statements. The procedures selected depend on the auditors’ judgment, including the assessment of the risks of material misstatement of the financial statements, whether due to fraud or error. In making those risk assessments, the auditors consider internal control relevant to the Company’s preparation of the financial statements that give a true and fair view in order to design audit procedures that are appropriate in the circumstances, but not for the purpose of expressing an opinion on the effectiveness of the Company’s internal control. An audit also includes evaluating the
appropriateness of accounting policies used and the reasonableness of accounting estimates made by Board, as well as evaluating the overall presentation of the financial statements.
We believe that the audit evidence we have obtained is sufficient and appropriate to provide a basis for our audit opinion.
Opinion
In our opinion, the consolidated financial statements give a true and fair view of the financial position of the Group as at 31 March 2015, and of its financial performance and cash flows for the year then ended in accordance with Sri Lanka Accounting Standards.
Report on Other Legal and Regulatory Requirements
As required by Section 163(2) of the Companies Act No. 7 of 2007, we state the following:
a) The basis of opinion and scope and limitations of the audit are as stated above.
b) In our opinion :
- We have obtained all the information and explanations that were required for the audit and, as far as appears from our examination, proper accounting records have been kept by the Company.
- The financial statements of the Company give a true and fair view of the financial position as at 31 March 2015, and of its financial performance and cash flows for the year then ended in accordance with Sri Lanka Accounting Standards.
- The financial statements of the Company and the Group, comply with the requirements of sections 151 and 153 of the Companies Act No. 07 of 2007.
29th May 2015Colombo
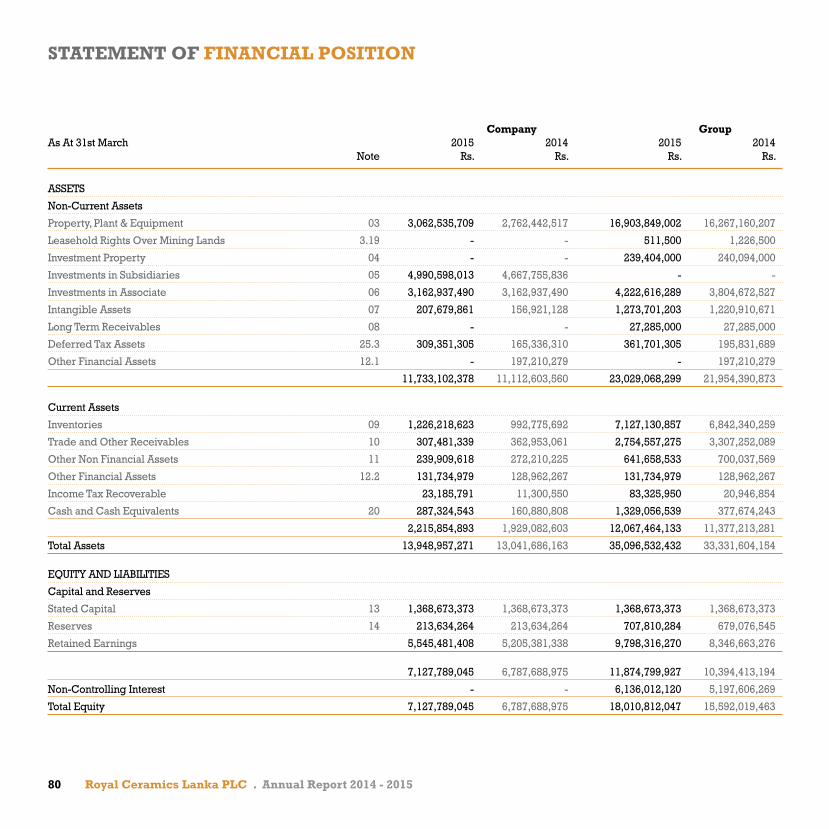
80 Royal Ceramics Lanka PLC . Annual Report 2014 - 2015
STATEMENT OF FINANCIAL POSITION
Company groupAs At 31st March 2015 2014 2015 2014 Note Rs. Rs. Rs. Rs.
ASSETS
Non-Current Assets
Property, Plant & Equipment 03 3,062,535,709 2,762,442,517 16,903,849,002 16,267,160,207
Leasehold Rights Over Mining Lands 3.19 - - 511,500 1,226,500
Investment Property 04 - - 239,404,000 240,094,000
Investments in Subsidiaries 05 4,990,598,013 4,667,755,836 - -
Investments in Associate 06 3,162,937,490 3,162,937,490 4,222,616,289 3,804,672,527
Intangible Assets 07 207,679,861 156,921,128 1,273,701,203 1,220,910,671
Long Term Receivables 08 - - 27,285,000 27,285,000
Deferred Tax Assets 25.3 309,351,305 165,336,310 361,701,305 195,831,689
Other Financial Assets 12.1 - 197,210,279 - 197,210,279
11,733,102,378 11,112,603,560 23,029,068,299 21,954,390,873
Current Assets
Inventories 09 1,226,218,623 992,775,692 7,127,130,857 6,842,340,259
Trade and Other Receivables 10 307,481,339 362,953,061 2,754,557,275 3,307,252,089
Other Non Financial Assets 11 239,909,618 272,210,225 641,658,533 700,037,569
Other Financial Assets 12.2 131,734,979 128,962,267 131,734,979 128,962,267
Income Tax Recoverable 23,185,791 11,300,550 83,325,950 20,946,854
Cash and Cash Equivalents 20 287,324,543 160,880,808 1,329,056,539 377,674,243
2,215,854,893 1,929,082,603 12,067,464,133 11,377,213,281
Total Assets 13,948,957,271 13,041,686,163 35,096,532,432 33,331,604,154
EQUITY AND LIABILITIES
Capital and Reserves
Stated Capital 13 1,368,673,373 1,368,673,373 1,368,673,373 1,368,673,373
Reserves 14 213,634,264 213,634,264 707,810,284 679,076,545
Retained Earnings 5,545,481,408 5,205,381,338 9,798,316,270 8,346,663,276
7,127,789,045 6,787,688,975 11,874,799,927 10,394,413,194
Non-Controlling Interest - - 6,136,012,120 5,197,606,269
Total Equity 7,127,789,045 6,787,688,975 18,010,812,047 15,592,019,463

81
Company groupAs At 31st March 2015 2014 2015 2014
Note Rs. Rs. Rs. Rs.
Non-Current Liabilities
Interest Bearing Loans & Borrowings 15 3,315,570,610 3,708,063,034 5,985,992,017 6,832,074,111
Deferred Tax Liabilities 25.4 - - 753,546,160 604,138,639
Retirement Benefit Liability 16 171,683,467 151,061,887 963,368,345 883,354,555
Deferred income & Capital grants 17 - - 121,613,000 118,411,000
3,487,254,077 3,859,124,921 7,824,519,522 8,437,978,305
Current Liabilities
Trade and Other Payable’s 18 1,392,583,392 1,145,866,646 2,094,498,375 2,032,997,420
Other Current Liabilities 19 507,342,863 262,539,495 582,142,600 369,237,435
Dividend Payable 36,151,214 25,847,795 102,767,214 46,462,247
Income Tax Liabilities - - 173,480,666 27,260,629
Interest Bearing Loans & Borrowings 15 1,397,836,680 960,618,331 6,308,312,008 6,825,648,655
3,333,914,149 2,394,872,267 9,261,200,863 9,301,606,386
Total Equity and Liabilities 13,948,957,271 13,041,686,163 35,096,532,432 33,331,604,154
I certify that these financial statements are in accordance with the requirements of the Companies Act No. 7 of 2007.
H Somashantha
Head of Finance & Treasury
The Board of Directors is responsible for the preparation and presentation of these financial statements. Signed for and on behalf of the board by,
K D D Perera W D N H Perera
Chairman Managing Director
The Accounting Policies and Notes on pages 88 through 181 form an integral part of these financial statements.
29th May 2015
Colombo
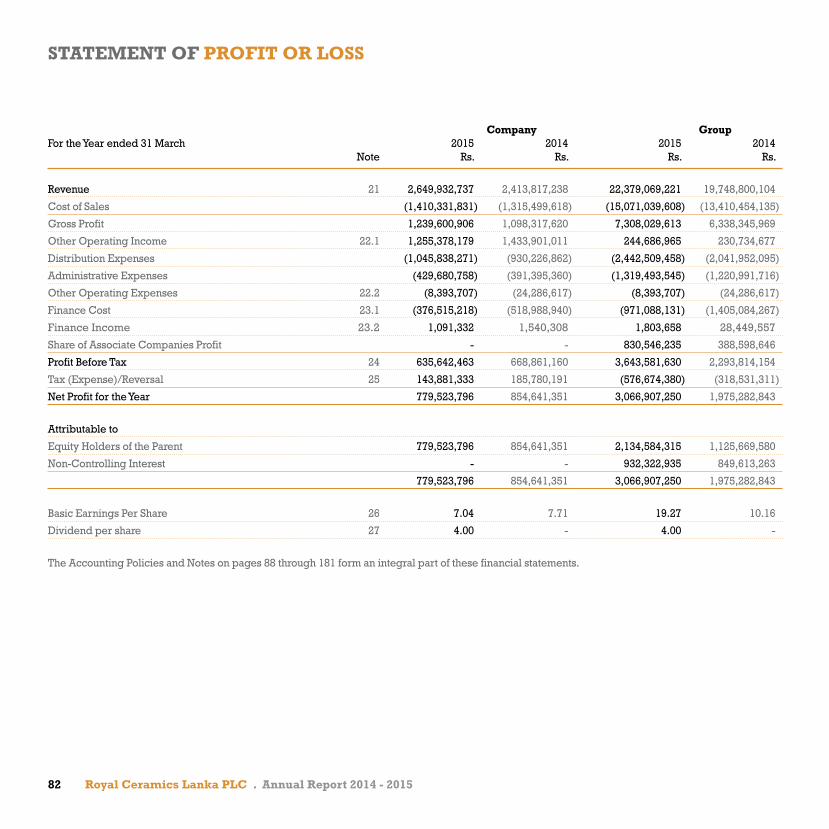
82 Royal Ceramics Lanka PLC . Annual Report 2014 - 2015
STATEMENT OF PROFIT OR LOSS
Company groupFor the Year ended 31 March 2015 2014 2015 2014 Note Rs. Rs. Rs. Rs.
Revenue 21 2,649,932,737 2,413,817,238 22,379,069,221 19,748,800,104
Cost of Sales (1,410,331,831) (1,315,499,618) (15,071,039,608) (13,410,454,135)
Gross Profit 1,239,600,906 1,098,317,620 7,308,029,613 6,338,345,969
Other Operating Income 22.1 1,255,378,179 1,433,901,011 244,686,965 230,734,677
Distribution Expenses (1,045,838,271) (930,226,862) (2,442,509,458) (2,041,952,095)
Administrative Expenses (429,680,758) (391,395,360) (1,319,493,545) (1,220,991,716)
Other Operating Expenses 22.2 (8,393,707) (24,286,617) (8,393,707) (24,286,617)
Finance Cost 23.1 (376,515,218) (518,988,940) (971,088,131) (1,405,084,267)
Finance Income 23.2 1,091,332 1,540,308 1,803,658 28,449,557
Share of Associate Companies Profit - - 830,546,235 388,598,646
Profit Before Tax 24 635,642,463 668,861,160 3,643,581,630 2,293,814,154
Tax (Expense)/Reversal 25 143,881,333 185,780,191 (576,674,380) (318,531,311)
Net Profit for the Year 779,523,796 854,641,351 3,066,907,250 1,975,282,843
Attributable to
Equity Holders of the Parent 779,523,796 854,641,351 2,134,584,315 1,125,669,580
Non-Controlling Interest - - 932,322,935 849,613,263
779,523,796 854,641,351 3,066,907,250 1,975,282,843
Basic Earnings Per Share 26 7.04 7.71 19.27 10.16
Dividend per share 27 4.00 - 4.00 -
The Accounting Policies and Notes on pages 88 through 181 form an integral part of these financial statements.

83
STATEMENT OF COMPREHENSIVE INCOME
Company groupFor the Year ended 31 March 2015 2014 2015 2014 Note Rs. Rs. Rs. Rs.
Net Profit for the Year 779,523,796 854,641,351 3,066,907,250 1,975,282,843
Other Comprehensive Income
Other Comprehensive Income to be reclassified to
profit or loss in subsequent periods (net of tax):
Exchange Differences on translation of foreign operations - - (4,169,416) -
Net (loss)/gain on available-for-sale financial assets of
Associate company 14.2 - - (2,468,658) 8,499,840
Net Other Comprehensive Income to be reclassified to
profit or loss in subsequent periods - - (6,638,074) 8,499,840
Other Comprehensive Income not to be reclassified to
profit or loss in subsequent periods (net of tax):
Revaluation of Land - - 165,260,000 15,167,176
Revaluation Reserve on Disposal of Land and Building - - (10,185,000) -
Revaluation of Land of Associate company - - - 148,521,315
Acturial (Loss)/Gain on Retirement Benefit Liability (354,414) (4,139,270) (1,996,389) (86,444,514)
Acturial (Loss)/Gain on Retirement Benefit Liability of
Associate Company - - (667,563) (3,327,269)
Net Other Comprehensive Income not to be reclassified to
profit or loss in subsequent periods (354,414) (4,139,270) 152,411,048 73,916,707
Other comprehensive income for the year, Net of tax (354,414) (4,139,270) 145,772,974 82,416,547
Total comprehensive income for the year, Net of tax 779,169,382 850,502,081 3,212,680,224 2,057,699,391
Attributable to
Equity Holders of the Parent 2,159,798,189 1,261,055,916
Non-Controlling Interest 1,052,882,035 796,643,475
3,212,680,224 2,057,699,391
The Accounting Policies and Notes on pages 88 through 181 form an integral part of these financial statements.

84 Royal Ceramics Lanka PLC . Annual Report 2014 - 2015
STATEMENT OF CHANgES IN EQUITY - COMPANY
For the Year ended 31 March 2015 Stated Revaluation Retained
Capital Reserve Earnings Total
Rs. Rs. Rs. Rs.
Balance as at 1st April 2013 1,368,673,373 213,634,264 4,354,879,257 5,937,186,894
Net Profit for the Year - - 854,641,351 854,641,351
Other Comprehensive Income/(Loss) - - (4,139,270) (4,139,270)
Total Comprehensive Income - - 850,502,081 850,502,081
Balance as at 31st March 2014 1,368,673,373 213,634,264 5,205,381,338 6,787,688,975
Net Profit for the Year - - 779,523,796 779,523,796
Other Comprehensive Income/(Loss) - - (354,414) (354,414)
Total Comprehensive income - - 779,169,382 779,169,382
Final Dividends - 2013/2014 - - (110,789,384) (110,789,384)
Interim Dividends 2014/2015 - - (332,368,152) (332,368,152)
Dividend Write back - - 4,088,225 4,088,225
Balance as at 31st March 2015 1,368,673,373 213,634,264 5,545,481,408 7,127,789,045
The Accounting Policies and Notes on pages 88 through 181 form an integral part of these financial statements.
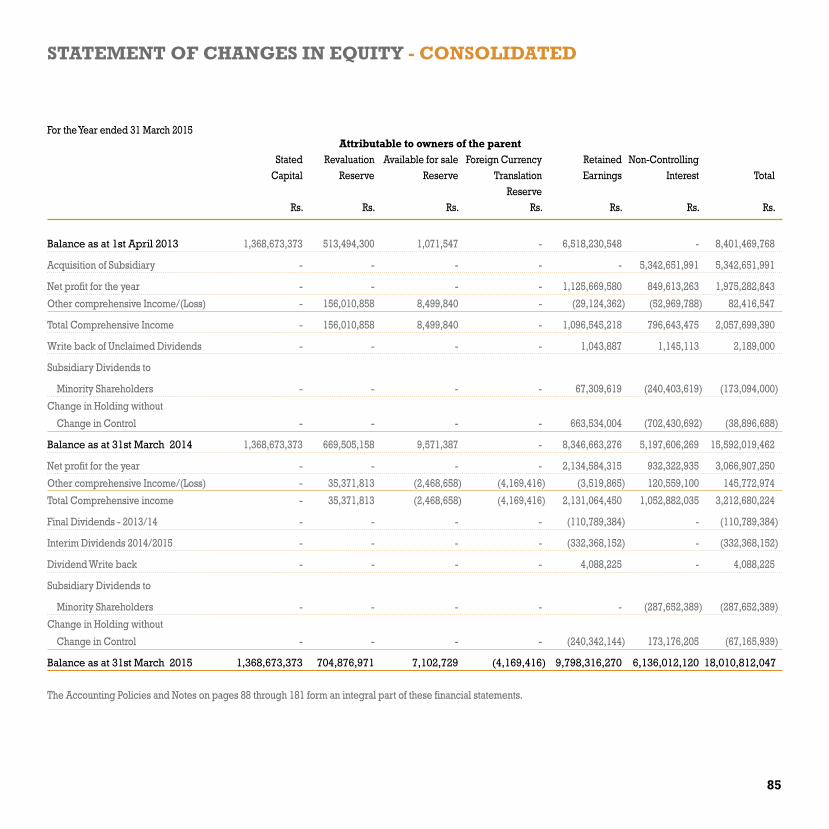
85
STATEMENT OF CHANgES IN EQUITY - CONSOLIDATED
For the Year ended 31 March 2015 Attributable to owners of the parent Stated Revaluation Available for sale Foreign Currency Retained Non-Controlling Capital Reserve Reserve Translation Earnings Interest Total Reserve Rs. Rs. Rs. Rs. Rs. Rs. Rs.
Balance as at 1st April 2013 1,368,673,373 513,494,300 1,071,547 - 6,518,230,548 - 8,401,469,768
Acquisition of Subsidiary - - - - - 5,342,651,991 5,342,651,991
Net profit for the year - - - - 1,125,669,580 849,613,263 1,975,282,843
Other comprehensive Income/(Loss) - 156,010,858 8,499,840 - (29,124,362) (52,969,788) 82,416,547
Total Comprehensive Income - 156,010,858 8,499,840 - 1,096,545,218 796,643,475 2,057,699,390
Write back of Unclaimed Dividends - - - - 1,043,887 1,145,113 2,189,000
Subsidiary Dividends to
Minority Shareholders - - - - 67,309,619 (240,403,619) (173,094,000)
Change in Holding without
Change in Control - - - - 663,534,004 (702,430,692) (38,896,688)
Balance as at 31st March 2014 1,368,673,373 669,505,158 9,571,387 - 8,346,663,276 5,197,606,269 15,592,019,462
Net profit for the year - - - - 2,134,584,315 932,322,935 3,066,907,250
Other comprehensive Income/(Loss) - 35,371,813 (2,468,658) (4,169,416) (3,519,865) 120,559,100 145,772,974
Total Comprehensive income - 35,371,813 (2,468,658) (4,169,416) 2,131,064,450 1,052,882,035 3,212,680,224
Final Dividends - 2013/14 - - - - (110,789,384) - (110,789,384)
Interim Dividends 2014/2015 - - - - (332,368,152) - (332,368,152)
Dividend Write back - - - - 4,088,225 - 4,088,225
Subsidiary Dividends to
Minority Shareholders - - - - - (287,652,389) (287,652,389)
Change in Holding without
Change in Control - - - - (240,342,144) 173,176,205 (67,165,939)
Balance as at 31st March 2015 1,368,673,373 704,876,971 7,102,729 (4,169,416) 9,798,316,270 6,136,012,120 18,010,812,047
The Accounting Policies and Notes on pages 88 through 181 form an integral part of these financial statements.
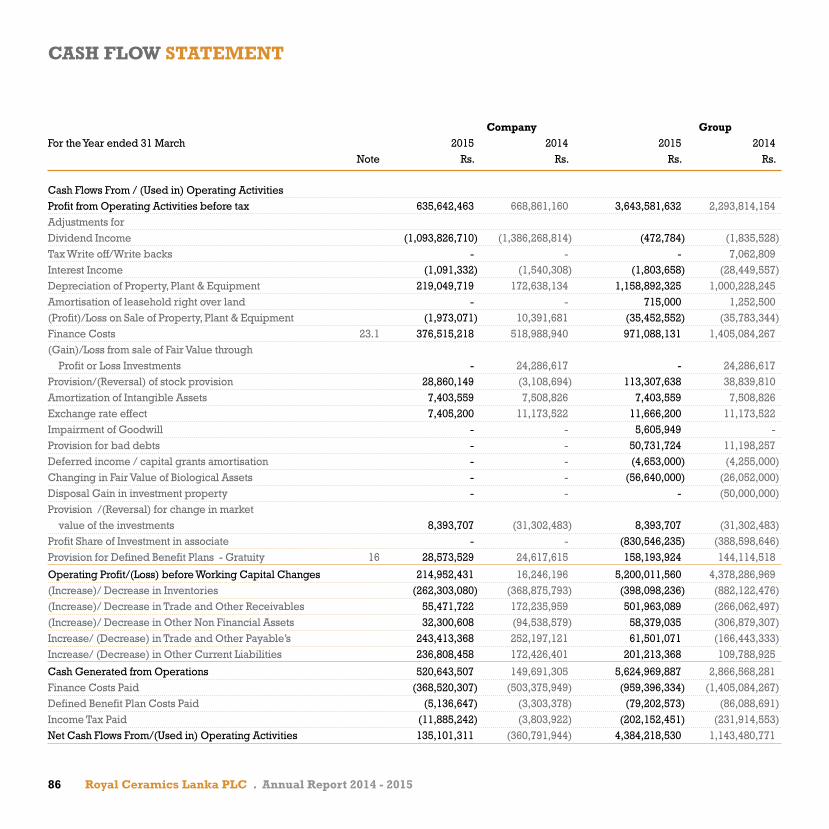
86 Royal Ceramics Lanka PLC . Annual Report 2014 - 2015
CASH FLOW STATEMENT
Company groupFor the Year ended 31 March 2015 2014 2015 2014 Note Rs. Rs. Rs. Rs.
Cash Flows From / (Used in) Operating ActivitiesProfit from Operating Activities before tax 635,642,463 668,861,160 3,643,581,632 2,293,814,154 Adjustments forDividend Income (1,093,826,710) (1,386,268,814) (472,784) (1,835,528)Tax Write off/Write backs - - - 7,062,809 Interest Income (1,091,332) (1,540,308) (1,803,658) (28,449,557)Depreciation of Property, Plant & Equipment 219,049,719 172,638,134 1,158,892,325 1,000,228,245 Amortisation of leasehold right over land - - 715,000 1,252,500 (Profit)/Loss on Sale of Property, Plant & Equipment (1,973,071) 10,391,681 (35,452,552) (35,783,344)Finance Costs 23.1 376,515,218 518,988,940 971,088,131 1,405,084,267 (Gain)/Loss from sale of Fair Value through Profit or Loss Investments - 24,286,617 - 24,286,617 Provision/(Reversal) of stock provision 28,860,149 (3,108,694) 113,307,638 38,839,810Amortization of Intangible Assets 7,403,559 7,508,826 7,403,559 7,508,826 Exchange rate effect 7,405,200 11,173,522 11,666,200 11,173,522 Impairment of Goodwill - - 5,605,949 -Provision for bad debts - - 50,731,724 11,198,257Deferred income / capital grants amortisation - - (4,653,000) (4,255,000)Changing in Fair Value of Biological Assets - - (56,640,000) (26,052,000)Disposal Gain in investment property - - - (50,000,000)Provision /(Reversal) for change in market value of the investments 8,393,707 (31,302,483) 8,393,707 (31,302,483)Profit Share of Investment in associate - - (830,546,235) (388,598,646)Provision for Defined Benefit Plans - Gratuity 16 28,573,529 24,617,615 158,193,924 144,114,518
Operating Profit/(Loss) before Working Capital Changes 214,952,431 16,246,196 5,200,011,560 4,378,286,969 (Increase)/ Decrease in Inventories (262,303,080) (368,875,793) (398,098,236) (882,122,476)(Increase)/ Decrease in Trade and Other Receivables 55,471,722 172,235,959 501,963,089 (266,062,497)(Increase)/ Decrease in Other Non Financial Assets 32,300,608 (94,538,579) 58,379,035 (306,879,307)Increase/ (Decrease) in Trade and Other Payable’s 243,413,368 252,197,121 61,501,071 (166,443,333)Increase/ (Decrease) in Other Current Liabilities 236,808,458 172,426,401 201,213,368 109,788,925
Cash Generated from Operations 520,643,507 149,691,305 5,624,969,887 2,866,568,281 Finance Costs Paid (368,520,307) (503,375,949) (959,396,334) (1,405,084,267)Defined Benefit Plan Costs Paid (5,136,647) (3,303,378) (79,202,573) (86,088,691)Income Tax Paid (11,885,242) (3,803,922) (202,152,451) (231,914,553)Net Cash Flows From/(Used in) Operating Activities 135,101,311 (360,791,944) 4,384,218,530 1,143,480,771

87
Company groupFor the Year ended 31 March 2015 2014 2015 2014 Note Rs. Rs. Rs. Rs.
Cash Flows from / (Used in) Investing ActivitiesAcquisition of Property, Plant & Equipment (519,175,451) (710,304,145) (1,148,818,965) (1,877,946,391)Acquisition of Plantation Assets - - (240,800,000) (268,513,467)Proceeds from Sale of Property, Plant & Equipment 2,005,611 2,166,063 40,571,459 38,501,080 Disposal of investment property - - - 130,000,000 Acquisition of Intangible Assets (58,162,291) (52,777,280) (60,194,091) (53,376,571)Proceeds from Sale of Short Term investments - 183,498,439 - 183,498,240 (Acquisition)/Disposals of Short-Term Investment (12,161,898) (13,041,633) (12,161,898) (13,658,293)Increase in other non financial assets 73,506 (740,275) 73,506 (740,275)(Acquisition)/Disposals of Investment in Associate - (7,712,921) - (8,110,557)Acquisition of Investment in subsidiary (57,543,988) (2,860,567,663) - (3,533,223,864)Acquisition of Non Controlling Interest (67,165,938) (107,405,166) (67,165,938) (900,565,804)Interest Received 1,091,332 1,540,308 1,803,658 28,449,557 Dividends Received 1,093,826,710 1,385,989,814 106,133,235 107,111,502 Net Cash Flows from/(Used in) Investing Activities 382,787,593 (2,179,354,460) (1,380,559,035) (6,168,574,842)
Cash Flows from / (Used in) Financing Activities Proceeds From Interest Bearing Loans & Borrowings 3,948,122,282 5,078,188,222 11,079,601,598 13,571,738,970 Repayment of Interest Bearing Loans & Borrowings (4,148,481,795) (2,479,160,424) (12,744,496,034) (9,028,684,880)Capital Repayments under Finance Lease Liabilities (13,848,146) (5,780,348) (33,477,473) (14,896,738)Dividends Paid on Ordinary Shares (428,765,895) (5,334,422) (428,765,895) (5,334,422)Dividend paid to non controlling interest (241,650,839) (173,094,000)Capital grants received 7,855,000 6,729,000 Net Cash Flows from/(Used in) Financing Activities (642,973,554) 2,587,913,028 (2,360,933,643) 4,356,457,930
Net (Decrease) in Cash and Cash Equivalents (125,084,649) 47,766,624 642,725,849 (668,636,141)Net foreign exchange difference - - (4,169,416) -Cash and Cash Equivalents at the beginning of the year 20 (22,736,034) (70,502,658) (1,418,951,580) (750,315,439)Cash and Cash Equivalents at the end of the year 20 (147,820,683) (22,736,034) (780,395,147) (1,418,951,580)
The Accounting Policies and Notes on pages 88 through 181 form an integral part of these financial statements.
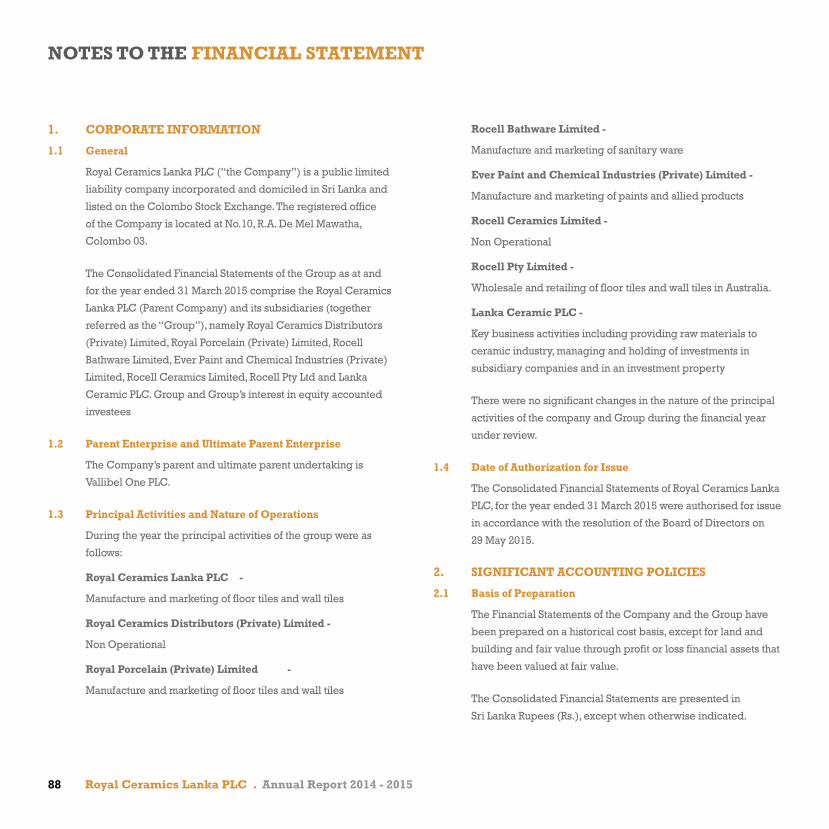
88 Royal Ceramics Lanka PLC . Annual Report 2014 - 2015
NOTES TO THE FINANCIAL STATEMENT
1. CORPORATE INFORMATION
1.1 general
Royal Ceramics Lanka PLC (“the Company”) is a public limited
liability company incorporated and domiciled in Sri Lanka and
listed on the Colombo Stock Exchange. The registered office
of the Company is located at No.10, R.A. De Mel Mawatha,
Colombo 03.
The Consolidated Financial Statements of the Group as at and
for the year ended 31 March 2015 comprise the Royal Ceramics
Lanka PLC (Parent Company) and its subsidiaries (together
referred as the “Group”), namely Royal Ceramics Distributors
(Private) Limited, Royal Porcelain (Private) Limited, Rocell
Bathware Limited, Ever Paint and Chemical Industries (Private)
Limited, Rocell Ceramics Limited, Rocell Pty Ltd and Lanka
Ceramic PLC. Group and Group’s interest in equity accounted
investees
1.2 Parent Enterprise and Ultimate Parent Enterprise
The Company’s parent and ultimate parent undertaking is
Vallibel One PLC.
1.3 Principal Activities and Nature of Operations
During the year the principal activities of the group were as
follows:
Royal Ceramics Lanka PLC -
Manufacture and marketing of floor tiles and wall tiles
Royal Ceramics Distributors (Private) Limited -
Non Operational
Royal Porcelain (Private) Limited -
Manufacture and marketing of floor tiles and wall tiles
Rocell Bathware Limited -
Manufacture and marketing of sanitary ware
Ever Paint and Chemical Industries (Private) Limited -
Manufacture and marketing of paints and allied products
Rocell Ceramics Limited -
Non Operational
Rocell Pty Limited -
Wholesale and retailing of floor tiles and wall tiles in Australia.
Lanka Ceramic PLC -
Key business activities including providing raw materials to
ceramic industry, managing and holding of investments in
subsidiary companies and in an investment property
There were no significant changes in the nature of the principal
activities of the company and Group during the financial year
under review.
1.4 Date of Authorization for Issue
The Consolidated Financial Statements of Royal Ceramics Lanka
PLC, for the year ended 31 March 2015 were authorised for issue
in accordance with the resolution of the Board of Directors on
29 May 2015.
2. SIgNIFICANT ACCOUNTINg POLICIES
2.1 Basis of Preparation
The Financial Statements of the Company and the Group have
been prepared on a historical cost basis, except for land and
building and fair value through profit or loss financial assets that
have been valued at fair value.
The Consolidated Financial Statements are presented in
Sri Lanka Rupees (Rs.), except when otherwise indicated.
89
2.1.1 Statement of Compliance
The financial statements of the Company and the Group have
been prepared in accordance with Sri Lanka Accounting
Standards (SLFRS/LKAS) as issued by the Institute of Chartered
Accountants of Sri Lanka. The preparation and presentation
of these financial statements are in compliance with the
Companies Act No. 07 of 2007.
2.2 Basis of Consolidation
The consolidated financial statements comprise the financial
statements of the Group and its subsidiaries as at 31 March 2015.
Control is achieved when the Group is exposed, or has rights,
to variable returns from its involvement with the investee and
has the ability to affect those returns through its power over the
investee. Specifically, the Group controls an investee if, and only
if, the Group has:
• Powerovertheinvestee(i.e.,existingrightsthatgiveitthe
current ability to direct the relevant activities of the investee)
• Exposure,orrights,tovariablereturnsfromitsinvolvement
with the investee
• Theabilitytouseitspowerovertheinvesteetoaffectits
returns
Generally, there is a presumption that a majority of voting
rights result in control. To support this presumption and when
the Group has less than a majority of the voting or similar
rights of an investee, the Group considers all relevant facts
and circumstances in assessing whether it has power over an
investee, including:
• Thecontractualarrangementwiththeothervoteholdersof
the investee
• Rightsarisingfromothercontractualarrangements
• TheGroup’svotingrightsandpotentialvotingrights
The Group re-assesses whether or not it controls an investee
if facts and circumstances indicate that there are changes to
one or more of the three elements of control. Consolidation
of a subsidiary begins when the Group obtains control over
the subsidiary and ceases when the Group loses control of
the subsidiary. Assets, liabilities, income and expenses of a
subsidiary acquired or disposed of during the year are included
in the consolidated financial statements from the date the Group
gains control until the date the Group ceases to control the
subsidiary.
Profit or loss and each component of other comprehensive
income (OCI) are attributed to the equity holders of the
parent of the Group and to the non-controlling interests, even
if this results in the non-controlling interests having a deficit
balance. When necessary, adjustments are made to the financial
statements of subsidiaries to bring their accounting policies into
line with the Group’s accounting policies. All intra-group assets
and liabilities, equity, income, expenses and cash flows relating
to transactions between members of the Group are eliminated
in full on consolidation.
A change in the ownership interest of a subsidiary, without a loss
of control, is accounted for as an equity transaction.
If the Group loses control over a subsidiary, it derecognises the
related assets (including goodwill), liabilities, non-controlling
interest and other components of equity while any resultant gain
or loss is recognized in profit or loss. Any investment retained is
recognized at fair value.

90 Royal Ceramics Lanka PLC . Annual Report 2014 - 2015
The details of Subsidiaries are as follows:
Company Name Year of
Incorporation
Ownership
Percentage
Royal Ceramics Distributors
(Private) Limited
1993/1994 100%
Royal Porcelain (Private)
Limited
2000/2001 100%
Rocell Bathware Limited 2005/2006 100%
Ever Paint and Chemical
Industries (Private) Limited
2002/2003 100%
Lanka Ceramic PLC 1991/1992 77%
Rocell Ceramics Limited 2006/2007 100%
Rocell Pty. Limited 2014/2015 100%
Companies with different accounting years
The financial statements of all the subsidiaries in the Group
other than Rocell Pty Limited are prepared for a common
financial year which ends on March 31. Rocell Pty Limited
prepares their financial statements for the financial year end
30th June each year.
2.3 Significant Accounting Judgments, Estimates and Assumptions
The preparation of the financial statements of the Group
require the management to make judgments, estimates
and assumptions, which may affects the amounts of income,
expenditure, assets, liabilities and the disclosure of contingent
liabilities, at the end of the reporting period. In the process of
applying the Group’s accounting policies, the key assumptions
made relating to the future and the sources of estimation at the
reporting date together with the related judgment that have
significant risk of causing a material adjustment to the carrying
amounts of assets and liabilities within the financial year are
discussed below.
(i) going Concern
The Directors have made an assessment of the Group’s ability
to continue as a going concern and are satisfied that the Group
continue in operational existence for the foreseeable future.
(ii) Valuation of Property, Plant and Equipment and Investment Property
The Group measures land and buildings at revalued amounts
with changes in fair value being recognized in other
comprehensive income and in the statement of equity. The
Group engaged independent valuation experts to determine
fair value of land and buildings.
The valuer has used valuation techniques such as market values
and discounted cash flow method where there was lack of
comparable market data available based on the nature of the
property.
The determined fair values of investment properties, using
investment method, are most sensitive to the estimated yield
as well as the long term occupancy rate. The methods used to
determine the fair value of the investment properties, are further
explained in note 04.
(iii) Impairment of non-financial assets
Impairment exists when the carrying value of an asset or cash
generating unit exceeds its recoverable amount, which is the
higher of its fair value less costs of disposal and its value in
use. The fair value less costs of disposal calculation is based on
available data from binding sales transactions, conducted at
arm’s length, for similar assets or observable market prices less
incremental costs for disposing of the asset. The value in use
calculation is based on a DCF model. The cash flows are derived
from the budget for the next five years and do not include
restructuring activities that the Group is not yet committed to
or significant future investments that will enhance the asset’s
nOTES TO THE FInAnCIAL STATEMEnTS
91
performance of the CGU being tested. The recoverable amount
is sensitive to the discount rate used for the DCF model as well
as the expected future cash-inflows and the growth rate used for
extrapolation purposes.
These estimates are most relevant to goodwill and other
intangibles with indefinite useful lives recognised by the Group.
(iv) Impairment of financial assets
The Group assesses at each reporting date whether there is any
objective evidence that a financial asset or a Group of financial
assets is impaired. A financial asset or a Group of financial
assets is deemed to be impaired if, and only if, there is objective
evidence of impairment as a result of one or more events
that has occurred after the initial recognition of the asset (an
incurred ‘loss event’) and that loss event has an impact on the
estimated future cash flows of the financial asset or the Group
of financial assets that can be reliably estimated. Evidence of
impairment may include indications that the debtors or a Group
of debtors is experiencing significant financial difficulty, default
or delinquency in payments, the probability that they will
enter bankruptcy or other financial reorganisation and where
observable data indicate that there is a measurable decrease
in the estimated future cash flows, such as changes in arrears or
economic conditions that correlate with defaults.
(v) Defined Benefit Plans
The Defined Benefit Obligation and the related charge for the
year are determined using actuarial valuations. The actuarial
valuation involves making assumptions about discount rates,
future salary increases, mortality rates etc. Due to the long term
nature of these plans such estimates are subject to significant
uncertainty. Further details are given in Note 16.
(vi) Provision for Slow moving inventories
A provision for slow moving inventories is recognized based
on the best estimates available to management on their future
usability/sale. As management uses historical information as the
basis to determine the future usability and recoverability, actual
future losses on inventories could vary from the provision made
in these financial statements (Note 9).
2.4 Changes in Accounting Policies
Changes in accounting policies
The accounting policies adopted are consistent with those of the
previous financial year except for
SLFRS 10 Consolidated Financial Statements, SLFRS 13 Fair
Value Measurement and amendments to LKAS 1 Presentation
of Financial Statements. In addition, the application of SLFRS 12
Disclosure of Interests in Other Entities resulted in additional
disclosures in the consolidated financial statements.
SLFRS 10 - Consolidated financial statements
With the adoption of SLFRS 10 in Sri Lanka with effect from
1 January 2014, the Group changed its accounting policy for
determining whether an investee is a subsidiary based on the
definition of control. The Group considers that control exists
when the Company has power over an investee; has exposure or
rights to variable returns from its involvement with the investee
and when it has ability to use its power over the investee to
affect the amount of the Company’s returns.
Upon the adoption of SLFRS 10, the Group reassessed the control
over its investees and concluded that the application of this
standard does require a retrospective adjustment considering
the materiality to the Group.
92 Royal Ceramics Lanka PLC . Annual Report 2014 - 2015
SLFRS 12 - Disclosure of interests in other entities
SLFRS 12 sets out the requirements for disclosures relating to an
entity’s interests in subsidiaries, joint arrangements, associates
and structured entities. The requirements in SLFRS 12 are
more comprehensive than the previously existing disclosure
requirements for subsidiaries. SLFRS 12 disclosures are
provided in Notes 36 and 37.
SLFRS 13 - Fair value measurement
SLFRS 13 establishes a single source of guidance under SLFRS
for all fair value measurements. SLFRS 13 does not change
when an entity is required to use fair value, but rather provides
guidance on how to measure fair value under SLFRS. SLFRS 13
defines fair value as an exit price. The Group re-assessed its
policies for measuring fair values. Application of SLFRS 13 has
not materially impacted the fair value measurements of the
Group. Additional disclosures where required, are provided in
the individual notes relating to the assets and liabilities whose
fair values were determined. Fair value hierarchy is provided in
Note 38.
LKAS 1 Presentation of Items of Other Comprehensive
Income – Amendments to LKAS 1
The amendments to LKAS 1 introduce a grouping of items
presented in Other Comprehensive Income. Items that will be
reclassified (‘recycled’) to Income Statement at a future point in
time have to be presented separately from items that will not be
reclassified. The amendments affect presentation only and have
no impact on the Group’s financial position or performance.
2.5 Summary of Significant Accounting Policies
2.5.1 Foreign Currency Translation
The Group’s consolidated financial statements are presented in
Sri Lankan Rupees, which is Group’s functional currency except
for Rocell Pty Limited. For each entity, the Group determines
the functional currency and items included in the financial
statements of each entity are measured using that functional
currency. The Group uses the direct method of consolidation
and on disposal of a foreign operation, the gain or loss that is
reclassified to profit or loss reflects the amount that arises from
using this method.
(i) Transactions and balances
Transactions in foreign currencies are initially recorded by the
Group’s entities at their respective functional currency spot rates
at the date the transaction first qualifies for recognition.
Monetary assets and liabilities denominated in foreign
currencies are translated at the functional currency spot rates
of exchange at the reporting date. Differences arising on
settlement or translation of monetary items are recognised in
profit or loss.
Non-monetary items that are measured in terms of historical
cost in a foreign currency are translated using the exchange
rates at the dates of the initial transactions. Non-monetary items
measured at fair value in a foreign currency are translated
using the exchange rates at the date when the fair value is
determined. The gain or loss arising on translation of non-
monetary items measured at fair value is treated in line with the
recognition of the gain or loss on the change in fair value of the
item (i.e., translation differences on items whose fair value gain
or loss is recognised in OCI or profit or loss are also recognised
in OCI or profit or loss, respectively).
(ii) group companies
On consolidation, the assets and liabilities of foreign operations
are translated into Sri Lankan Rupees at the rate of exchange
prevailing at the reporting date and their statements of profit or
loss are translated at exchange rates prevailing at the dates of
the transactions. The exchange differences arising on translation
nOTES TO THE FInAnCIAL STATEMEnTS

93
for consolidation are recognised in OCI. On disposal of a foreign
operation, the component of OCI relating to that particular
foreign operation is recognised in profit or loss.
Any goodwill arising on the acquisition of a foreign operation
and any fair value adjustments to the carrying amounts of assets
and liabilities arising on the acquisition are treated as assets and
liabilities of the foreign operation and translated at the spot rate
of exchange at the reporting date.
2.5.2 Taxation
(a) Income Tax
Current income tax assets and liabilities for the current and
prior periods are measured at the amount expected to be
recovered from or paid to the taxation authorities. The tax rates
and tax laws used to compute the amount are those that are
enacted or substantively enacted by the reporting date.
The provision for income tax is based on the elements of income
and expenditure as reported in the financial statements and
computed in accordance with the provisions of the relevant tax
legislations. Current income tax relating to items recognised
directly in equity statement is recognized in equity and not in
the statement of total comprehensive income.
Royal Ceramics Lanka PLC, Lanka Ceramic PLC, Royal
Ceramics Distributors (Pvt) Ltd, Ever Paint & Chemical
Industries (Pvt) Ltd, Lanka Walltiles PLC, Lanka Tiles PLC,
Ceytea Plantation Management Ltd, Swisstek Ceylon PLC
and Horana Plantations PLC.
The Provision for income tax is based on the elements of
income and expenditure as reported in Financial Statements
and computed in accordance with the provisions of the Inland
Revenue Act No. 10 of 2006.
The statutory tax rates of above companies are as follows;
2015 2014
Local sales and other profits 28% 28%
Qualified export profit 12% 12%
Agricultural profit 10% 10%
Specified profits 12% 15%
Swisstek Aluminium Ltd
Swisstek Aluminium Ltd is exempted from income tax for a
period of five years, commencing from the year of assessment
2012/2013.
Royal Porcelain (Pvt) Ltd
In terms of Section 17(A) of the Inland Revenue Amendment
Act No.10 of 2006 and its subsequent amendments, the profits
from new undertaking is exempt for income tax for 7 years
commencing from year of assessment 2012/13. The profits on
the existing business is liable for tax at 28% on local sales and
12% on qualified export profit.
Rocell Bathware Limited
Pursuant to agreement dated 07 July 2006 entered into with
Board of Investment under section 17 of the Board of Investment
Law, Inland Revenue Act relating to the imposition, payment and
recovery of income tax shall not apply for a period of 06 years
from the year of assessment in which the company commences
to make profits or any year of assessment not later than two
years reckoned from the date of commencement of commercial
operations whichever year is earlier. The tax expiration period
expires on year of assessment 2016/17 and after the expiration
of tax exemption period the profits and income of the enterprise
shall be charged for any year of assessment at the rate of 15%.

94 Royal Ceramics Lanka PLC . Annual Report 2014 - 2015
(b) Deferred Tax
Deferred income tax is provided using the liability method on
temporary differences at the reporting date between the tax
bases of assets and liabilities and their carrying amounts for
financial reporting purposes.
Deferred income tax liabilities are recognised for all taxable
temporary differences except:
• wherethedeferredincometaxliabilityarisesfrominitial
recognition of goodwill or of an asset or liability in a
transaction that is not a business combination and, at the time
of transaction, affects neither the accounting profit nor taxable
profit or loss; and
• inrespectoftaxabletemporarydifferencesassociatedwith
investments in subsidiaries, where the timing of reversal
of the temporary differences can be controlled and it is
probable that the temporary differences will not reverse in
the foreseeable future.
Deferred income tax assets are recognised for all deductible
temporary differences, carry-forward of unused tax credits and
unused tax losses, to the extent that it is probable that taxable
profit will be available against which the deductible temporary
differences, and the carry-forward of unused tax credits and
unused tax losses can be utilised except:
• wherethedeferredincometaxassetrelatingtothe
deductible temporary difference arises from initial
recognition of an asset or liability in a transaction that is not a
business combination and, at the time of transaction, affects
neither the accounting profit nor taxable profit or loss; and
• inrespectofdeductibletemporarydifferencesassociated
with investments in subsidiaries, deferred income tax assets
are recognised only to the extent that it is probable that
the temporary differences will reverse in the foreseeable
future and taxable profit will be available against which the
temporary differences can be utilised.
The carrying amount of deferred income tax assets is reviewed
at each reporting date and reduced to the extent that it is no
longer probable that sufficient taxable profit will be available to
allow all or part of the deferred income tax asset to be utilised.
Unrecognised deferred income tax assets are reassessed at
each reporting date and are recognised to the extent that it
has become probable that future taxable profit will allow the
deferred tax asset to be recovered.
Deferred income tax assets and liabilities are measured at the
tax rates that are expected to apply to the year when the asset is
realised or the liability is settled, based on the tax rates and tax
laws that have been enacted or subsequently enacted as at the
reporting date.
Deferred income tax assets and deferred income tax liabilities
are offset, if a legally enforceable right exists to set off current
tax assets against current income tax liabilities and the deferred
income taxes relates to the same taxable entity and the same
taxation authority.
(c) Economic Service Charge (ESC)
As per the provisions of the Economic Service Charges Act No.
13 of 2006, ESC is payable on the liable turnover at specified
rates. ESC paid is deductible from the income tax liability. Any
unclaimed liability can be carried forward and set off against
the income tax payable for further four years.
(d) Turnover Based Taxes
Turnover based taxes include Value Added Tax (VAT) and
Nation Building Tax (NBT). The Company/Group pays such taxes
in accordance with the respective statutes.
nOTES TO THE FInAnCIAL STATEMEnTS
95
Revenue, expenses and assets are recognised net of the amount
of sales tax except where the sales tax incurred on a purchase
of assets or services is not recoverable from the taxation
authorities in which case the sales tax is recognized as a part of
the cost of the asset or part of the expense items as applicable
and receivable and payable are stated with the amount of sales
tax included. The amount of sales tax recoverable and payable
to taxation authorities is included as a part of other receivables
and other payables in the Statement of Financial Position.
2.5.3 Borrowing Cost
Borrowing costs are recognised as an expense in the period in
which they are incurred except to the extent where borrowing
cost that are directly attributable to acquisition, construction or
production of assets that takes a substantial period of time to
get ready for its intended use or sale. Such borrowing costs are
capitalized as part of those assets.
2.5.4 Inventories
Inventories are valued at lower of cost and net realizable value,
after making due allowances for obsolete and slow moving
items. Net realizable value is the price at which inventories can
be sold in the ordinary course of business less the estimated
cost of completion and the estimated cost necessary to make the
sale.
The cost incurred in bringing inventories to its present location
and condition is accounted using the following cost formulae:
(a) Raw material - At purchase cost on weighted average cost basis,
except for Ever Paint and Chemical Industries Private Limited
,Ceytea Plantation Management Limited and Swisstek (Ceylon)
PLC which is on a first in first out basis.
(b) Consumable and spares - At purchase cost on weighted average
cost basis, except for Ever Paint and Chemical Industries Private
Limited which is on a first in first out basis.
(c) Finished goods and Work in progress - at the cost of direct
material, direct labour and appropriated proportion of
production overheads based on normal operating capacity.
(d) Goods in transit have been valued at cost.
(e) Trading goods – At Purchase cost on weighted average basis
except for Lanka Walltiles group which is on first in first out
basis
2.5.5 Property, Plant and Equipment
(a) Initial recognition
All items of property, plant and equipment are initially recorded
at cost.
The cost of property, plant and equipment is the cost of
acquisition or construction together with any expenses incurred
in bringing the asset to its working condition for its intended
use. Subsequent to the initial recognition as an asset at cost,
revalued assets are carried at revalued amounts less any
subsequent deprecation thereon. All other property, plant and
equipment are stated at cost less accumulated depreciation
and/or accumulated impairment losses, if any. Accumulated
depreciation is provided for, on the bases specified in (c) below.
Where an item of property, plant and equipment comprises
major components having different useful lives, they are
accounted for as separate items of property, plant and
equipment.
96 Royal Ceramics Lanka PLC . Annual Report 2014 - 2015
(b) Subsequent Expenditure
Expenditure incurred to replace a component of an item of
property, plant and equipment that is accounted for separately,
including major inspection and overhaul expenditure, is
capitalized. Other subsequent expenditure is capitalized only
when it increases the future economic benefits embodied in the
item of property, plant and equipment. All other expenditure
incurred on repairs or maintenance of property, plant and
equipment in order to restore or maintain the future economic
benefits expected from the originally assessed standard of
performance, is recognised as an expense when incurred.
(c) Depreciation
Depreciation is calculated by using a straight-line basis on
all property, plant and equipment, other than freehold land,
in order to write off the cost or valuation over the estimated
economic life of such assets.
The asset’s residual values, useful lives and methods of
depreciation are reviewed, and adjusted if appropriate, at each
financial year end.
(d) Revaluation
Land and buildings are measured at fair value less accumulated
depreciation on buildings and impairment losses recognised
after the date of the revaluation. Valuations are performed with
sufficient frequency to ensure that the fair value of a revalued
asset does not differ materially from its carrying amount.
Any revaluation surplus is recognised in other comprehensive
income and accumulated in equity in the asset revaluation
reserve, except to the extent that it reverses a revaluation
decrease of the same asset previously recognised in the
statement of income, in which case the increase is recognised
in the statement of income. A revaluation deficit is recognised
in the statement of income, except to the extent that it offsets
an existing surplus on the same asset recognised in the asset
revaluation reserve.
Cost of repairs and maintenance are charged to the statement of
income during the period in which they are incurred.
(e) De-recognition
An item of property, plant and equipment is derecognised upon
disposal or when no future economic benefits are expected from
its use or disposal. Any gain or loss arising on de-recognition of
the asset (calculated as the difference between the net disposal
proceeds and the carrying amount of the asset) is included in
the statement of income in the year the asset is derecognised.
(f) Capital Work in Progress
Capital work in progress represents the cost of civil construction
work not completed and property, plant and equipment that are
not ready for their intended use.
2.5.6 Intangible assets
The Group’s intangible assets include the cost of computer
software and goodwill.
An intangible asset is recognised only when its cost can be
measured reliably and it is probable that the expected future
economic benefits that are attributable to it will flow to the
Group.
Intangible assets acquired separately are measured on initial
recognition at cost. The cost of intangible assets acquired in
a business combination is their fair value as at the date of
acquisition. Following the initial recognition, intangible assets
are carried at cost less any accumulated amortisation and any
accumulated impairment losses.
nOTES TO THE FInAnCIAL STATEMEnTS

97
Intangible assets with finite lives are amortised over the useful
economic life. The amortisation period and the amortisation
method for an intangible asset with a finite useful life are
reviewed at least at each financial year–end. Changes in the
expected useful life or the expected pattern of consumption
of future economic benefits embodied in the asset are
accounted for by changing the amortisation period or method,
as appropriate, and they are treated as changes in accounting
estimates. The amortisation expense on intangible assets with
finite lives is presented as a separate line item in the statement
of income.
Amortization is calculated using the straight- line method to
write down the cost of intangible assets to their residual values
over their estimated useful lives of 15 years, for computer
software.
2.5.7 Leases
Finance leases, which transfer substantially all the risks
and benefits incidental to ownership of the leased item, are
capitalized at the inception of the lease at the fair value of the
leased property or, if lower, at the present value of the minimum
lease payments. Lease payments are apportioned between
the finance charges and reduction of the lease liability so as to
achieve a constant rate of interest on the remaining balance of
the liability.
Capitalized leased assets are depreciated over the shorter of the
estimated useful life of the asset and the lease term, if there is no
reasonable certainty that the Group will obtain ownership by the
end of the lease term. The depreciation policy for depreciable
leased assets is consistent with that for depreciable asset that
are owned as described in note 3.19.
The principal/capital element payable to the lessor is shown as
liability/obligation. The lease rentals are treated as consisting of
capital and interest elements. The capital element in the rental
is applied to reduce the outstanding obligation and interest
element is charged against profit, in proportion to the reducing
capital outstanding.
The cost of improvements on leased property is capitalised,
disclosed as improvements to leasehold property and
depreciated over the unexpired period of the lease, or the
estimated useful lives of the improvements, whichever is shorter.
Leases where the lessor effectively retains substantially all
the risks and benefits of ownership over the leased term are
classified as operating leases.
Rentals paid under operating leases are recognized as an
expense in the statement of profit or loss on a straight-line basis
over the lease term. When an operating lease is terminated
before the lease period has expired, any payment required to
be made to the lessor by way of penalty is recognized as an
expense in the period in which termination takes place.
2.5.8 Investment properties
Properties held for capital appreciation and properties held to
earn rental income have been classified as Investment Property.
Basis of RecognitionInvestment Property is recognised if it is probable that future
economic benefits that are associated with the Investment
Property will flow to the Group and cost of the Investment
Property can be reliably measured.
MeasurementInitial MeasurementAn Investment Property is measured initially at its cost. The cost
of a purchased Investment Property comprises of its purchase
price and any directly attributable expenditure. The cost of
a self-constructed investment is its cost at the date when the
construction or development is complete.
98 Royal Ceramics Lanka PLC . Annual Report 2014 - 2015
Subsequent MeasurementThe Group applies the Cost Model for Investment Properties
in accordance with Sri Lanka Accounting Standard 40 (LKAS
40), - “Investment Property”. Accordingly, land and buildings
classified as Investment Properties are stated at cost less any
accumulated depreciation and any accumulated impairment
losses.
DepreciationDepreciation is provided on a straight line basis over the
estimated life of the class of asset from the date of purchase up
to the date of disposal.
Class of tangible assets Useful life
Buildings Over 50 years
2.5.9 Investments In subsidiaries
Investments in subsidiaries in the separate financial statements
have been accounted for at cost, net of any impairment losses
which are charged to the statement of comprehensive income of
the Company.
Income from these investments is recognised only to the extent
of dividend received.
Disposal of investments
On disposal of an investment, the difference between net
disposal proceeds and the carrying amounts are recognized as
income or expense.
2.5.10 Business Combination and goodwill
Acquisitions of subsidiaries are accounted for using the
acquisition method. The cost of an acquisition is measured as
the aggregate of the consideration transferred measured at
acquisition date fair value and the amount of non-controlling
interest in acquiree. For each business combination, the group
elects whether to measure the non-controlling interests in
the acquiree at fair value or at the proportionate share of the
acquiree’s identifiable net assets. Acquisition related costs are
expensed as incurred and included in administrative expenses.
When the Group acquires a business, it assesses the financial
assets and liabilities assumed for appropriate classification and
designation in accordance with the contractual terms, economic
circumstances and pertinent conditions as at the acquisition
date.
Goodwill is initially measured at cost being the excess of
the aggregate of consideration transferred and the amount
recognised for non-controlling interests and any previous
interest held over the net identifiable assets acquired and
liabilities assumed.
After initial recognition, goodwill is measured at cost less any
accumulated impairment losses. Goodwill is reviewed for
impairment, annually or more frequently if events or changes in
circumstances indicate that the carrying value may be impaired.
For the purpose of impairment testing, goodwill acquired in a
business combination is, from the acquisition date, allocated
to each of the Group’s cash generating units that are expected
to benefit from the combination, irrespective of whether other
assets or liabilities of the acquiree are assigned to those units.
Impairment is determined by assessing the recoverable amount
of the cash-generating unit to which the goodwill relates. Where
the recoverable amount of the cash generating unit is less than
the carrying amount, an impairment loss is recognised. The
impairment loss is allocated first to reduce the carrying amount
of any goodwill allocated to the unit and then to the other assets
prorate to the carrying amount of each asset in the unit.
nOTES TO THE FInAnCIAL STATEMEnTS
99
Where goodwill forms part of a cash-generating unit and part
of the operation within that unit is disposed of, the goodwill
associated with the operation disposed of is included in the
carrying amount of the operation when determining the gain or
loss on disposal of the operation. Goodwill disposed of in this
circumstance is measured based on the relative values of the
operation disposed of and the portion of the cash-generating
unit retained.
2.5.11 Financial instruments – initial recognition and subsequent measurement
Financial assets
(a) Initial recognition and measurement
Financial assets within the scope of LKAS 39 are classified as
financial assets at fair value through profit or loss, loans and
receivables, or available-for-sale financial assets as appropriate.
The Group determines the classification of its financial assets at
initial recognition.
All financial assets are recognised initially at fair value plus
transaction costs, except in the case of financial assets recorded
at fair value through profit or loss.
Purchases or sales of financial assets that require delivery
of assets within a time frame established by regulation or
convention in the market place (regular way trades) are
recognised on the trade date, i.e., the date that the Group
commits to purchase or sell the asset.
The Group’s financial assets include investments in equity
securities, trade and other receivables, cash and bank balances.
(b) Subsequent measurement
The subsequent measurement of financial assets depends on
their classification as described below:
Loans and receivables
Loans and receivables are non-derivative financial assets with
fixed or determinable payments that are not quoted in an active
market. After initial measurement, such financial assets are
subsequently measured at amortised cost using the Effective
Interest Rate (“EIR”), less impairment. Amortised cost is
calculated by taking into account any discount or premium on
acquisition and fees or costs that are an integral part of the EIR
method. The amortisation is included in finance income in the
statement of income.
Financial Assets at fair value through profit or loss
Financial assets at fair value through profit or loss includes
financial assets held for trading. Financial assets are classified as
held for trading if those are acquired for the purpose of selling
or repurchasing in the near term. Financial assets at fair value
through profit and loss are carried in the statement of financial
position at fair value with changes in fair value recognised in
finance income or finance costs in the income statement. The
Group has not designated any financial assets upon initial
recognition as financial asset at fair value through profit or loss.
The Group evaluates its financial assets held for trading to
determine whether the intention to sell them in the near term
is still appropriate. When the Group is unable to trade these
financial assets due to inactive markets and management’s
intention to sell them in the foreseeable future significantly
changes, the Group may elect to reclassify these financial assets
in rare circumstances.
Available-for-sale financial investments
For available-for-sale financial investments include equity
securities. Equity investments classified as available-for-sale
are those, which are neither classified as held for trading nor
designated at fair value through profit or loss. Investments in
equity instruments that do not have a quoted market price in an

100 Royal Ceramics Lanka PLC . Annual Report 2014 - 2015
active market and whose fair value cannot be reliably measured
are valued at cost.
(c) Derecognition
A financial asset is derecognised when:
- The rights to receive cash flows from the asset have expired
- The Group has transferred its rights to receive cash flows from
the asset or has assumed an obligation to pay the received
cash flows in full without material delay to a third party under
a ‘pass-through’ arrangement; and either (a) the Group has
transferred substantially all the risks and rewards of the
asset, or (b) the Group has neither transferred nor retained
substantially all the risks and rewards of the asset, but has
transferred control of the asset.
(d) Impairment of financial assets
The Group assesses, at each reporting date, whether there
is any objective evidence that a financial asset or a group of
financial assets is impaired. A financial asset or a group of
financial assets is deemed to be impaired if, and only if, there
is objective evidence of impairment as a result of one or more
events that has occurred after the initial recognition of the asset
(an incurred ‘loss event’) and that loss event has an impact on
the estimated future cash flows of the financial asset or the group
of financial assets that can be reliably estimated.
Financial assets carried at amortised cost
If there is objective evidence that an impairment loss has been
incurred, the amount of the loss is measured as the difference
between the asset’s carrying amount and the present value of
estimated future cash flows. The present value of the estimated
future cash flows is discounted at the financial asset’s original
effective interest rate.
The carrying amount of the asset is reduced through the use of
an allowance account and the amount of the loss is recognised
in the statement of income. Interest income continues to be
accrued on the reduced carrying amount and is accrued using
the rate of interest used to discount the future cash flows for the
purpose of measuring the impairment loss. The interest income
is recorded as part of finance income in the statement of income.
If, in a subsequent year, the amount of the estimated impairment
loss increases or decreases because of an event occurring after
the impairment was recognised, the previously recognised
impairment loss is increased or reduced by adjusting the
allowance account. If a write-off is later recovered, the recovery
is credited to finance costs in the statement of income.
Available-for-sale financial investments
For available-for-sale financial investments, the Company/
Group assesses at each reporting date whether
there is objective evidence that an investment or a group of
investments is impaired.
Financial liabilities
(e) Initial recognition and measurement
Financial liabilities within the scope of LKAS 39 are classified
as financial liabilities at fair value through profit or loss, loans
and borrowings as appropriate. The Group determines the
classification of its financial liabilities at initial recognition.
All financial liabilities are recognised initially at fair value
plus, in the case of loans and borrowings, directly attributable
transaction costs.
The Group’s financial liabilities include trade and other
payables, bank overdrafts, loans and borrowings and financial
guarantee contracts.
nOTES TO THE FInAnCIAL STATEMEnTS

101
(f) Subsequent measurement
The measurement of financial liabilities depends on their
classification as described below:
Loans and borrowings
After initial recognition, interest bearing loans and borrowings
are subsequently measured at amortised cost using the EIR
method. Gains and losses are recognised in the statement of
income when the liabilities are derecognised as well as through
the EIR amortisation process.
Amortised cost is calculated by taking into account any discount
or premium on acquisition and fees or costs that are an integral
part of the EIR. The EIR amortisation is included in finance costs
in the statement of income.
(g) Derecognition
A financial liability is derecognised when the obligation under
the liability is discharged or cancelled or expires.
When an existing financial liability is replaced by another
from the same lender on substantially different terms, or the
terms of an existing liability are substantially modified, such
an exchange or modification is treated as the derecognition of
the original liability and the recognition of a new liability. The
difference in the respective carrying amounts is recognised in
the statement of income.
(h) Offsetting of financial instruments
Financial assets and financial liabilities are offset and the net
amount reported in the statement of financial position if, and
only if:
- There is a currently enforceable legal right to offset the
recognised amounts and
- There is an intention to settle on a net basis, or to realise the
assets and settle the liabilities simultaneously
(i) Fair value of financial instruments
The fair value of financial instruments that are traded in active
markets at each reporting date is determined by reference to
quoted market prices or dealer price quotations (bid price for
long positions and ask price for short positions), without any
deduction for transaction costs.
For financial instruments not traded in an active market, the fair
value is determined using appropriate valuation techniques.
Such techniques may include:
- Using recent arm’s length market transactions
- Reference to the current fair value of another instrument that
is substantially the same
- A discounted cash flow analysis or other valuation models.
An analysis of fair values of financial instruments and further
details as to how they are measured are provided in Note 12.
2.5.12 Trade and Other Receivables
Trade debtors, including amounts owing by subsidiary, deposits
and other debtors (excluding non financial assets classified
under deposits and other receivables which are measured
at cost) classified and accounted for as loans and receivable.
Based on the nature the relevant accounting policy for this
category of financial assets are stated in note 10 above.
2.5.13 Cash and Cash Equivalents
Cash and cash equivalents are cash at bank and in hand,
call deposits and short term highly liquid investments
readily convertible to known amounts of cash and subject to
insignificant risk of changes in value.

102 Royal Ceramics Lanka PLC . Annual Report 2014 - 2015
For the purpose of statement of cash flows, cash and cash
equivalents consist of cash in hand, cash at bank deposits in
banks net of outstanding bank overdrafts. Investments with short
maturities (i.e. three months or less from date of acquisition) are
also treated as cash equivalents. Bank overdrafts are disclosed
under Interest Bearing Liabilities in the statement of financial
position.
2.5.14 Investments in Associates
The Group’s investment in its associate is accounted for using
the equity method. An associate is an entity in which the Group
has significant influence.
Under the equity method, the investment in the associate is
carried in the statement of financial position at cost plus post
acquisition changes in the Group’s share of net assets of the
associate. Goodwill relating to the associate is included in the
carrying amount of the investment and is neither amortised nor
individually tested for impairment.
The statement of income reflects the share of the results of
operations of the associate. Where there has been a change
recognised directly in the equity of the associate, the Group
recognises its share of any changes and discloses this, when
applicable, in the statement of changes in equity. Unrealised
gains and losses resulting from transactions between the Group
and the associate are eliminated to the extent of the interest in
the associate.
The share of profit of an associate is shown on the face of the
statement of income. This is the profit attributable to equity
holders of the associate and therefore is profit after tax and non-
controlling interests in the subsidiaries of the associate.
The financial statements of the associate are prepared for
the same reporting period as the Group. Accounting policies
that are specific to the business of associate companies are
discussed in note 2.9.
After application of the equity method, the Group determines
whether it is necessary to recognise an additional impairment
loss on the Group’s investment in its associate. The Group
determines at each reporting date whether there is any
objective evidence that the investment in the associate is
impaired. If this is the case, the Group calculates the amount of
impairment as the difference between the recoverable amount
of the associate and its carrying value and recognises the
amount in the ‘share of profit of an associate’ in the statement of
income.
2.5.15 Provisions
Provisions are recognized when the Company/Group has
a present obligation (legal or constructive) as a result of a
past event, where it is probable that an outflow of resources
embodying economic benefits will be required to settle the
obligation and a reliable estimate can be made of the amount
of the obligation. When the company expects some or all of a
provision to be reimbursed, the reimbursement is recognised as
a separate assets but only when the reimbursement is virtually
certain. The expense relating to any provision is presented in
the statement of income net of any reimbursement.
If the effect of the time value of money is material, provisions are
determined by discounting the expected future cash flows at a
pre-tax rate that reflects current market assessments of the time
value of money and, where appropriate, the risks specific to the
liability. Where discounting is used, the increase in the provision
due to the passage of time is recognized as an interest expense.
nOTES TO THE FInAnCIAL STATEMEnTS

103
2.5.16 Retirement Benefit Obligations
(a) Defined Benefit Plan – gratuity
A defined benefit plan is a post-employment benefit plan
other than a defined contribution plan. The defined benefit
is calculated by independent actuaries using Projected Unit
Credit (PUC) method as recommended by revised LKAS 19
– “Employee benefits” and resulting actuarial gain/ loss was
recognized in full in the Other Comprehensive Income (OCI).
The present value of the defined benefit obligation is
determined by discounting the estimated future cash outflows
using interest rates that are denominated in the currency in
which the benefits will be paid, and that have terms to maturity
approximating to the terms of the related liability.
The present value of the defined benefit obligations depends
on a number of factors that are determined on an actuarial basis
using a number of assumptions about discount rate, expected
rates of return on assets, future salary increases and mortality
rates. Key assumptions used in determining the defined
retirement benefit obligations are given in Note 16 Any changes
in these assumptions will impact the carrying amount of defined
benefit obligations and all assumptions are reviewed at each
reporting date.
Accordingly, the employee benefit liability is based on the
actuarial valuation as of 31 March 2014, carried out by Messrs
Actuarial and Management Consultants (Private) Limited,
actuaries.
Funding Arrangements
The Gratuity liability is not externally funded.
(b) Defined Contribution Plans- Employees’ Provident Fund and Employees’ Trust Fund
Employees are eligible for Employees’ Provident Fund
Contributions and Employees’ Trust Fund Contributions in line
with respective statutes and regulations. These are recognized
as an expense in the statement of income as incurred.
The Group contributes 12% and 3% of gross emoluments of the
employees to Employees’ Provident Fund and Employees’ Trust
Fund respectively.
2.5.17 Impairment of Non-financial Assets
The Company assesses at each reporting date whether there
is an indication that an asset may be impaired. If any such
indication exists, or when annual impairment testing is required
for an asset, the Company makes an assessment of the assets’
recoverable amount. When the carrying amount of an asset
exceeds its’ recoverable amount, the asset is considered
impaired and is written down to its recoverable amount.
2.6 Statement of profit or loss
2.6.1 Revenue Recognition
Revenue is recognized to the extent that it is probable that the
economic benefits will flow to the group and the revenue and
associated costs incurred or to be incurred can be reliably
measured. Revenue is measured at the fair value of the
consideration received or receivable net of trade discounts
and sales taxes. The following specific criteria are used for the
purpose of recognition of revenue.
(a) Sale of goods
Revenue from sale of goods is recognised when the significant
risks and rewards of ownership of the goods have passed to the
buyer; with the Group retaining neither continuing managerial
involvement to the degree usually associated with ownership,
nor effective control over the goods sold.
104 Royal Ceramics Lanka PLC . Annual Report 2014 - 2015
(b) Interest Income
For all financial instruments measured at amortised cost and
interest bearing financial assets classified as available for sale,
interest income or expense is recorded using the effective
interest rate (EIR), which is the rate that exactly discounts
the estimated future cash payments or receipts through the
expected life of the financial instrument or a shorter period,
where appropriate, to the net carrying amount of the financial
asset or liability. Interest income is included in finance income
in the statement of income.
(c) Dividends
Dividend Income is recognised when the shareholders’ right to
receive the payment is established.
(d) Rendering of Services
Revenue from rendering of services is recognised in the
accounting period in which the services are rendered or
performed.
(e) Rental Income
Rental income is recognised on an accrual basis.
(f) Other
Other income is recognised on an accrual basis.
Net Gains and losses of a revenue nature on the disposal of
property, plant and equipment and other non- current assets
including investments have been accounted for in the statement
of income, having deducted from proceeds on disposal, the
carrying amount of the assets and related selling expenses. On
disposal of revalued property, plant and equipment, amount
remaining in revaluation reserve relating to that asset is
transferred directly to Retained Earnings.
Gains and losses arising from incidental activities to main
revenue generating activities and those arising from a group
of similar transactions which are not material, are aggregated,
reported and presented on a net basis.
2.7 Cash Flow Statement
The Cash Flow Statement has been prepared by using the ‘In
direct Method’ in accordance with LKAS 7 on Statement of Cash
Flows, whereby gross cash receipts and gross cash payments of
operating activities, financing activities and investing activities
have been recognized. Cash and cash equivalents comprise
mainly cash balances and highly liquid investments of which
original maturity of 3 months or less and net amount due from
banks.
2.8 Segment Reporting
A segment is a distinguishable component of the Group that
is engaged either in providing products or services (business
segment) or in providing products or services within a
particular economic environment (geographical segment),
which is subject to risks and rewards that are different from
those of other segments.
Segment information is presented in respect of the Group’s
business and has been prepared in conformation with the
accounting policies adopted for preparing and presenting the
consolidated financial statements of the Group. The business
segments are reported based on Group’s management
and internal reporting structure. Inter segment pricing is
determined at prices mutually agreed by the companies.
Segment result, assets and liabilities include items directly
attributable to a segment as well as those that can be allocated
on a reasonable basis. Unallocated items mainly comprise of
goodwill on consolidation.
nOTES TO THE FInAnCIAL STATEMEnTS

105
The Group’s segmental reporting is based on the following
operating segments: Tiles, Sanitaryware, paints, plantation,
packaging material, finance and other.
2.9 Significant Accounting Policies that are specific to the business of associates
2.9.1 L B Finance PLC
Revenue Recognition
Revenue is recognised to the extent that it is probable that
the economic benefits will flow to the Company and the
revenue and associated costs incurred or to be incurred can
be reliably measured. Revenue is measured at the fair value of
the consideration received or receivable net of trade discounts
and sales taxes. The following specific criteria are used for the
purpose of recognition of revenue.
(a) Interest Income and Interest expense
For all financial assets measured at amortised cost, interest
bearing financial assets classified as available for sale and
financial instruments designated at fair value through profit or
loss, interest income or expense is recorded using the EIR. EIR
is the rate that exactly discounts estimated future cash payments
or receipts through the expected life of the financial instrument
or a shorter period, where appropriate, to the net carrying
amount of the financial asset or financial liability.
The calculation takes into account all contractual terms of the
financial instrument and includes any fees or incremental
costs that are directly attributable to the instrument and are an
integral part of the EIR, but not future credit losses. The carrying
amount of the financial asset or financial liability is adjusted if
the company revises its estimates of payments or receipts. The
adjusted carrying amount is calculated based on the original
EIR and the change in carrying amount is recorded as ’Interest
income’ for financial assets and ’Interest expense’ for financial
liabilities. However, for a reclassified financial asset for which
the company subsequently increases its estimates of future
cash receipts as a result of increased recoverability of those
cash receipts, the effect of that increase is recognised as an
adjustment to the EIR from the date of the change in estimate.
Once the recorded value of a financial asset or a group of similar
financial assets has been reduced due to an impairment loss,
interest income continues to be recognised using the rate of
interest used to discount the future cash flows for the purpose of
measuring the impairment loss.
(b) Fee and commission income
The company earns fee and commission income from a diverse
range of services it provides to its customers. Fee income can be
divided into the following two categories:
(i) Fee income earned from services that are provided over a certain period of time
Fees earned for the provision of services over a period of time
are accrued over that period. These fees include commission
income and asset management, custody and other management
and advisory fees.
(ii) Fee income from providing transaction services
Fees arising from negotiating or participating in the negotiation
of a transaction for a third party, such as the purchase or sale
of business is recognized on completion of the underlying
transaction. Fees or components of fees that are linked to
a certain performance are recognized after fulfilling the
corresponding criteria.
(c) Net trading income
Net trading income includes all gains and losses from changes
in fair value and related dividends for financial assets and
financial liabilities ‘held for trading’ other than interest income.

106 Royal Ceramics Lanka PLC . Annual Report 2014 - 2015
(d) Others
Other income is recognised on an accrual basis.
2.10 Significant accounting policies that are specific to the business of plantation
2.10.1 Basis of Preparation
The Financial Statements have been prepared on historical
cost convention except for the following material items in the
statement of financial position.
(a) Lease hold right to Bare Land and leased assets of JEDB/ SLSPC,
which have been revalued as morefully described in note 3.10.
(b) Consumable Mature Biological Assets are measured at fair value
less cost. (LKAS 41)
(c) Employee Benefits recognized based on actuarial valuation
(LKAS 19)
2.10.2 Property, Plant and Equipment
(a) Permanent Land Development Cost
Permanent land development costs incurred in making major
infrastructure development and building new access roads on
leasehold lands.
These costs have been capitalised and amortised over the
remaining lease period.
Permanent impairments to land development costs are charged
to the Statement of Comprehensive Income in full and reduced
to the net carrying amounts of such assets in the year of
occurrence after ascertaining the loss.
(b) Biological Assets
(i) Bearer Biological Assets & Consumer Biological Assets
Biological assets are classified in to mature biological assets
and immature biological assets. Mature biological assets are
those that have attained harvestable specifications or are able
to sustain regular harvests. Immature biological assets are those
that have not yet attained harvestable specifications. Tea, rubber,
other plantations and nurseries are classified as biological
assets.
The cost of land preparation, rehabilitation, new planting, re-
planting, crop diversifying, inter-planting and fertilizing, etc.,
incurred between the time of planting and harvesting (when
the planted area attains maturity), are classified as immature
plantations. These immature plantations are shown at direct
costs plus attributable overheads, including interest attributable
to long term loans used for financing immature plantations.
Biological assets are further classified as bearer biological
assets and consumable biological assets. Bearer biological
asset includes tea and rubber trees, those that are not intended
to be sold or harvested, however used to grow for harvesting
agricultural produce from such biological assets. Consumable
biological assets includes managed timber trees those that are
to be sold as biological assets.
The expenditure incurred on bearer biological assets (Tea and
Rubber) fields, which come in to bearing during the year, has
been transferred to mature plantations. Expenditure incurred
on consumable biological assets is recorded at cost at initial
recognition and thereafter at fair value at the end of each
reporting period.
nOTES TO THE FInAnCIAL STATEMEnTS
107
The entity recognize the biological assets when, and only
when, the entity controls the assets as a result of past event, it
is probable that future economic benefits associated with the
assets will flow to the entity and the fair value or cost of the
assets can be measured reliably.
The bearer biological assets are measured at cost less
accumulated depreciation and accumulated impairment losses,
if any, in terms of LKAS 16 – Property Plant & Equipment as per
the option provided by the ruling issued by ICASL.
The managed timber trees are measured on initial recognition
and at the end of each reporting period at its fair value less cost
to sell in terms of LKAS 41. The cost is treated as approximation
to fair value of young plants as the impact on biological
transformation of such plants to price during this period is
immaterial. The fair value of timber trees are measured using
DCF method taking in to consideration the current market
prices of timber, applied to expected timber content of a tree at
the maturity by an independent professional valuer.
The main variables in DCF model concerns,
Variable Comment
Timber
content
Estimate based on physical verification of
girth, height and considering the growth of
the each species.
Factor all the prevailing statutory regulations
enforced against harvesting of timber
coupled with forestry plan of the Company.
Economic
useful life
Estimated based on the normal life span of
each species by factoring the forestry plan of
the Company.
Variable Comment
Selling price Estimated based on prevailing Sri Lankan
market price. Factor all the conditions to be
fulfilled in bringing the trees in to saleable
condition
Planting cost Estimated costs for the further development
of immature arrears are deducted.
Discount Rate Discount rate reflects the possible variations
in the Cash flows and the risk related to the
biological assets.
Nursery cost includes the cost of direct materials, direct
labour and an appropriate proportion of directly attributable
overheads, less provision for overgrown plants.
The gain or loss arising on initial recognition of biological assets
at fair value less cost to sell and from a change in fair value less
cost to sell of biological assets are included in the Statement of
Comprehensive Income for the period in which it arises.
Permanent impairments to Biological Assets are charged to the
Statement of Comprehensive Income in full and reduced to the
net carrying amounts of such asset in the year of occurrence
after ascertaining the loss.
(ii) Infilling Cost on Biological Assets
The land development costs incurred in the form of infilling
have been capitalised to the relevant mature field, only if it
increases the expected future benefits from that field, beyond
its pre-infilling performance assessment. Infilling costs so
capitalised are depreciated over the newly assessed remaining
useful economic
life of the relevant mature plantation, or the unexpired lease
period, whichever is lower.

108 Royal Ceramics Lanka PLC . Annual Report 2014 - 2015
Infilling costs that are not capitalized have been charged to the
Statement of Comprehensive Income in the year in which they
are incurred.
2.10.3 Inventories
(a) Agricultural produce harvested from Biological Assets
Agricultural produce harvested from Biological Assets are
measured at their fair value less cost to sell at the point of
harvest. The finished and semi finished inventories from
Agricultural produce are valued by adding the cost of
conservation from agricultural value of agricultural produce.
(b) Agricultural produce after further processing
Further processed output of agricultural produce are valued
at the lower of cost and estimated net realisable value, after
making due allowances for obsolete and slow moving items.
2.10.4 Retirement Benefit Obligation
(a) Defined Benefit Plan
The retirement benefit plan adopted is as required under the
Payment of Gratuity Act No.12 of 1983 and the Indian Repatriate
Act No.34 of 1978 to eligible employees. This item is grouped
under Retirement Benefit Obligations in the Statement of
financial position.
Provision for Gratuity on the Employees of the Company is
based on an actuarial valuation, using the Project Unit Credit
(PUC) method as recommended by LKAS 19 “Retirement
Benefit Costs”. The actuarial valuation was carried out by a
professionally qualified firm of actuaries.
However, according to the Payment of Gratuity Act No.12 of
1983, the liability for payment to an employee arises only after
the completion of 5 years continued services.
The liability is not externally funded.
(b) Defined Contribution Plans - Provident Funds and Trust Fund
The Company contributes 12% on consolidated salary of the
employees to Ceylon Planters’ Provident Society (CPPS)/Estate
Staff’s Provident Society (ESPS)/ Employees’ Provident Fund
(EPF).
All the employees of the Company are members of the
Employees’ Trust Fund, to which the Company contributes 3%
on the consolidated salary of such employees.
2.10.5 Deferred Income
(a) grants and Subsidies
Grants related to Property, Plant and Equipment other than
grants received for consumer biological assets are initially
deferred and allocated to income on a systematic basis over the
useful life of the related Property, Plant and Equipment is more
fully mentioned in Note 17 to the Financial Statements.
Grants related to income are recognized in the Statement
of comprehensive Income in the year which it is receivable.
Unconditional grants received for consumer biological assets
are measured at fair value less cost to sell are recognized in the
Statement of Comprehensive income when and only when such
grants become receivable.
2.10.6 Revenue and Income Recognition
Revenue is recorded at invoice value net of brokerage, sale
expenses and other levies related to revenue. Revenue is
recognised when persuasive evidence exists, usually in the
form of an executed sales agreement, that the significant risks
and rewards of ownership have been transferred to the buyer,
recovery of the consideration is probable, the associated costs
and possible return of goods can be estimated reliably, there is
nOTES TO THE FInAnCIAL STATEMEnTS

109
no continuing management involvement with the goods, and the
amount of revenue can be measured reliably. If it is probable
that discounts will be granted and the amount can be measured
reliably, then the discount is recognised as a reduction of
revenue as the sales are recognised. The fair value gain arising
on the valuation of harvested crops has been separately
disclosed as part of the revenue.
2.11 Standards issued but not yet effective
The following SLFRS have been issued by the Institute of
Chartered Accountants of Sri Lanka that have an effective date
in the future and have not been applied in preparing these
Financial Statements. Those SLFRS will have an effect on the
accounting policies currently adopted by the Group and may
have an impact on the future Financial Statements.
(i) SLFRS 9 - Financial Instruments: Classification and
Measurement
In December2014, the CA Sri Lanka issued the final version
of SLFRS 9 Financial Instruments which reflects all phases
of the financial Instruments project and replaces LKRS 39
Financial Instruments, Recognition and Measurement. The
standard introduces new requirements for classification and
measurement impairment, and hedge accounting . SLFRS 9 is
effective for annual periods beginning on or after 01 January
2018, with early application permitted. Retrospective application
is required. But comparative information is not compulsory.
The adoption of SLFRS 9 will have an effect on the classification
and measurement of the Group’s financial assets, but no impact
on the classification and measurement of the Group’s financial
liabilities.
(ii) SLFRS 15 -Revenue from Contracts with Customers
SLFRS 15 establishes a comprehensive framework for
determining whether, how much and when revenue is
recognised. It replaces existing revenue recognition guidance,
including LKAS 18 Revenue, LKAS 11 Construction Contracts and
IFRIC 13 Customer Loyalty Programs. This standard is effective
for the annual periods beginning on or after 01 January 2017.
In addition to the above, SLFRS 14 -Regulatory Deferral Accounts
will also be effective for the annual periods commencing on
or after 01 January 2016. The Group will adopt these standards
when they become effective. Pending the completion of detailed
review, the financial impact is not reasonably estimable as at the
date of publication of these Financial Statements.

110 Royal Ceramics Lanka PLC . Annual Report 2014 - 2015
nOTES TO THE FInAnCIAL STATEMEnTS
3 PROPERTY, PLANT & EQUIPMENT - COMPANY
3.1 gross Carrying Amounts
Balance Additions/ Transfers/ Disposals Balance As at Transfers Reclassification As at 31.03.2014 31.03.2015 Rs. Rs. Rs. Rs. Rs.
At Cost or Valuation
Land 670,524,270 61,952,931 119,820,000 - 852,297,202
Building 862,757,339 19,860,161 (119,820,000) - 762,797,500
Lab Equipment 5,569,141 - - - 5,569,141
Motor Vehicles 106,796,920 25,480,464 16,322,652 (3,846,116) 144,753,920
Electricity Distribution 25,575,345 - - - 25,575,345
Office Equipment 205,651,477 15,999,190 - - 221,650,667
Communication Equipment 9,691,202 2,039,634 - - 11,730,836
Furniture & Fittings 251,132,305 71,217,955 - - 322,350,260
Tools & Implements 80,279,944 13,273,687 - - 93,553,630
Other Equipment 19,492,713 550,000 - - 20,042,713
Factory Equipment 23,257,990 - - - 23,257,991
Construction Equipment 2,236,047 - - - 2,236,047
Plant and Machinery 1,244,008,648 100,695,899 11,500,000 - 1,356,204,546
Household Item Light 78,830 - - - 78,830
Showroom Fixtures & Fittings 438,597,904 45,811,217 - - 484,409,121
Stores Buildings on Lease hold Land 3,965,135 - - - 3,965,135
3,949,615,210 356,881,138 27,822,652 (3,846,116) 4,330,472,884
Assets on Finance Leases
Plant & Machinery 11,500,000 - (11,500,000) - -
Motor vehicles 16,322,652 - (16,322,652) - -
27,822,652 - - -
3,977,437,862 356,881,138 (27,822,652) (3,846,116) 4,330,472,884

111
Balance Additions Transfers Disposals Balance As at As at 31.03.2014 31.03.2015
Rs. Rs. Rs. Rs. Rs.
In the Course of Construction
Capital Work in Progress 130,169,131 430,883,269 (268,621,497) - 292,430,903
Total Gross Carrying Amount 4,107,606,994 787,764,408 (268,621,497) (3,846,116) 4,622,903,788
3.2 Depreciation
Balance Charge Transfers Disposals/ Balance As at for the Transfers As at 31.03.2014 Year 31.03.2015 Rs. Rs. Rs. Rs. Rs.
At Cost or valuation
Building 37,108,680 30,074,702 - - 67,183,383
Lab Equipment 4,263,331 472,318 - - 4,735,649
Motor Vehicles 67,279,920 19,936,928 12,887,825 (3,846,116) 96,258,557
Electricity Distribution 5,545,130 1,023,014 - - 6,568,144
Office Equipment 141,267,846 16,266,183 - - 157,534,028
Communication Equipment 9,287,526 662,385 - - 9,949,911
Furniture & Fittings 75,191,561 50,400,824 - - 125,592,385
Tools & Implements 71,961,595 7,480,497 - - 79,442,092
Other Equipment 9,195,905 2,403,770 - - 11,599,675
Factory Equipment 23,255,539 1,226 - - 23,256,765
Construction Equipment 2,236,047 - - - 2,236,047
Plant and Machinery 760,380,399 59,747,111 1,629,166 - 821,756,676
Household Item Light 59,092 - - - 59,092
Showroom Fixtures & Fittings 122,103,603 28,523,445 - - 150,627,048
Stores Buildings on Lease hold Land 3,568,628 - - - 3,568,628
1,332,704,802 216,992,402 14,516,991 (3,846,116) 1,560,368,079
Assets on Finance Leases
Plant & Machinery 1,150,000 479,166 (1,629,166) - -
Motor vehicles 11,309,674 1,578,151 (12,887,825) - -
12,459,674 2,057,317 (14,516,991) - -
Total Value of Depreciation 1,345,164,476 219,049,719 - (3,846,116) 1,560,368,079
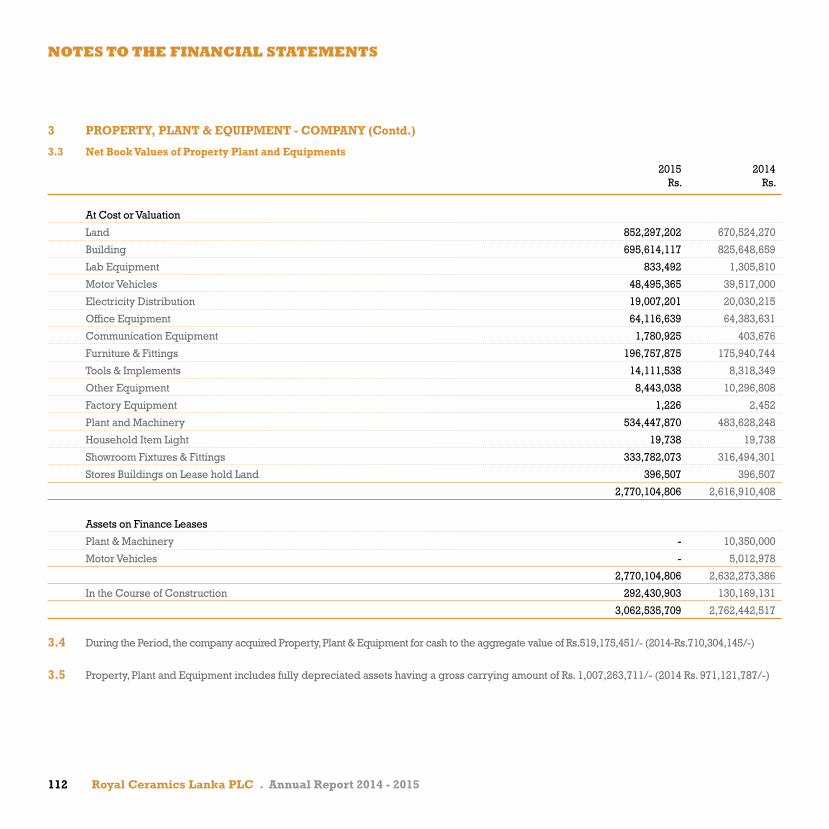
112 Royal Ceramics Lanka PLC . Annual Report 2014 - 2015
3 PROPERTY, PLANT & EQUIPMENT - COMPANY (Contd.)
3.3 Net Book Values of Property Plant and Equipments
2015 2014 Rs. Rs.
At Cost or Valuation
Land 852,297,202 670,524,270
Building 695,614,117 825,648,659
Lab Equipment 833,492 1,305,810
Motor Vehicles 48,495,365 39,517,000
Electricity Distribution 19,007,201 20,030,215
Office Equipment 64,116,639 64,383,631
Communication Equipment 1,780,925 403,676
Furniture & Fittings 196,757,875 175,940,744
Tools & Implements 14,111,538 8,318,349
Other Equipment 8,443,038 10,296,808
Factory Equipment 1,226 2,452
Plant and Machinery 534,447,870 483,628,248
Household Item Light 19,738 19,738
Showroom Fixtures & Fittings 333,782,073 316,494,301
Stores Buildings on Lease hold Land 396,507 396,507
2,770,104,806 2,616,910,408
Assets on Finance Leases
Plant & Machinery - 10,350,000
Motor Vehicles - 5,012,978
2,770,104,806 2,632,273,386
In the Course of Construction 292,430,903 130,169,131
3,062,535,709 2,762,442,517
3.4 During the Period, the company acquired Property, Plant & Equipment for cash to the aggregate value of Rs.519,175,451/- (2014-Rs.710,304,145/-)
3.5 Property, Plant and Equipment includes fully depreciated assets having a gross carrying amount of Rs. 1,007,263,711/- (2014 Rs. 971,121,787/-)
nOTES TO THE FInAnCIAL STATEMEnTS

113
3 PROPERTY, PLANT AND EQUIPMENT - gROUP
3.6 gross Carrying Amounts
Balance Additions / Effect of Increase / Reclassification / Balance As at Transfers Exchange / (Decrease) in Disposals/ As at 01.04.2014 Rates Revaluation Transfers 31.03.2015 Rs. Rs. Rs. Rs. Rs. Rs.
Freehold and Clay Mining Land 2,977,532,091 202,831,491 - 165,260,000 109,560,000 3,455,183,582
Buildings 3,988,145,104 100,381,641 - - (120,366,917) 3,968,159,828
Water Supply Scheme 329,673,568 14,311,325 - - - 343,984,893
Lab Equipment 21,334,604 350,455 - - - 21,685,058
Motor Vehicles 261,412,418 37,450,636 (24,420) - 27,153,935 325,992,569
Electricity Distribution 30,086,845 - - - - 30,086,845
Office Equipment 258,824,468 25,742,077 (85,914) - - 284,480,631
Communication Equipment 433,363,007 45,606,868 - - (36,328,533) 442,641,342
Furniture and Fittings 386,626,495 71,881,453 (1,221) - 12,653,596 471,160,323
Tools & Implements 633,361,643 85,992,085 (1,665) - (55,325,908) 664,026,154
Sundry Equipment 1,205,058 - - - - 1,205,058
Other Equipment 35,485,675 681,016 - - - 36,166,691
Factory Equipment 23,257,991 - - - - 23,257,991
Moulds 128,589,710 190,199 - - - 128,779,909
Construction Equipment 22,113,388 1,943,024 - - - 24,056,412
Plant and Machinery 10,159,352,884 461,678,339 - - 25,878,394 10,646,909,618
Household Item - Light 209,490 - - - - 209,490
Showroom Fixtures & Fittings 487,177,796 50,108,101 - - - 537,285,897
Stores Buildings on Lease hold Land 313,272,127 4,613,980 - - - 317,886,106
20,491,024,363 1,103,762,688 (113,220) 165,260,000 (36,775,432) 21,723,158,399

114 Royal Ceramics Lanka PLC . Annual Report 2014 - 2015
nOTES TO THE FInAnCIAL STATEMEnTS
3 PROPERTY, PLANT AND EQUIPMENT - gROUP (Contd.)
3.6 gross Carrying Amounts
Balance Additions / Effect of Increase / Reclassification / Balance As at Transfers Exchange / (Decrease) in Disposals/ As at 01.04.2014 Rates Revaluation Transfers 31.03.2015 Rs. Rs. Rs. Rs. Rs. Rs.
Assets on Finance Leases
Plant & Machinery 66,972,680 6,099,000 - - (29,856,000) 43,215,680
Leasehold land 14,600,000 - - - - 14,600,000
Furniture and Fittings 12,653,596 - - - (12,653,596) -
Motor vehicles 51,179,187 6,600,000 - - (35,482,534) 22,296,653
Transport & Communication Equipment 44,712,000 17,617,000 - - (3,165,000) 59,164,000
190,117,463 30,316,000 - - (81,157,130) 139,276,333
20,681,141,826 1,134,078,688 (113,220) 165,260,000 (117,932,562) 21,862,434,732
In the Course of Construction
Capital Work in Progress 334,006,859 822,073,753 - - (616,210,188) 539,870,424
Total Gross Carrying Amount 21,015,148,685 1,956,152,441 (113,220) 165,260,000 (734,142,750) 22,402,305,156

115
3.7 Depreciation
Balance Charge Effect of Transfers to Disposals/ Balance As at for the Exchange revaluation Transfers As at 01.04.2014 Year Rate Reserve 31.03.2015 Rs. Rs. Rs. Rs. Rs. Rs.
At Cost or Valuation
Freehold and Clay Mining Land 28,821,000 314,000 - - - 29,135,000
Building 456,953,153 115,571,148 - - (1,897,736) 570,626,564
Water Supply Scheme 200,028,071 22,059,686 - - - 222,087,757
Lab Equipment 15,874,121 1,781,113 - - - 17,655,233
Motor Vehicles 144,751,152 41,298,167 (453) - 13,628,453 199,677,319
Electricity Distribution 7,048,963 1,248,589 - - - 8,297,552
Office Equipment 171,224,474 22,272,470 (2,137) - - 193,494,808
Communication Equipment 276,081,454 39,991,174 - - (26,371,711) 289,700,916
Furniture & Fittings 194,279,605 57,964,966 (26) - 6,010,459 258,255,005
Tools & Implements 464,712,582 68,096,531 (46) - (60,177,615) 472,631,452
Sundry Equipment 991,252 21,298 - - - 1,012,550
Other Equipment 16,164,434 3,803,720 - - - 19,968,154
Factory Equipment 23,255,540 1,226 - - - 23,256,766
Moulds 75,629,841 10,453,389 - - - 86,083,230
Construction Equipment 19,124,093 1,222,334 - - - 20,346,427
Plant and Machinery 4,573,954,802 632,736,350 - - (33,408) 5,206,657,744
Household Item - Light 102,591 26,131 - - - 128,722
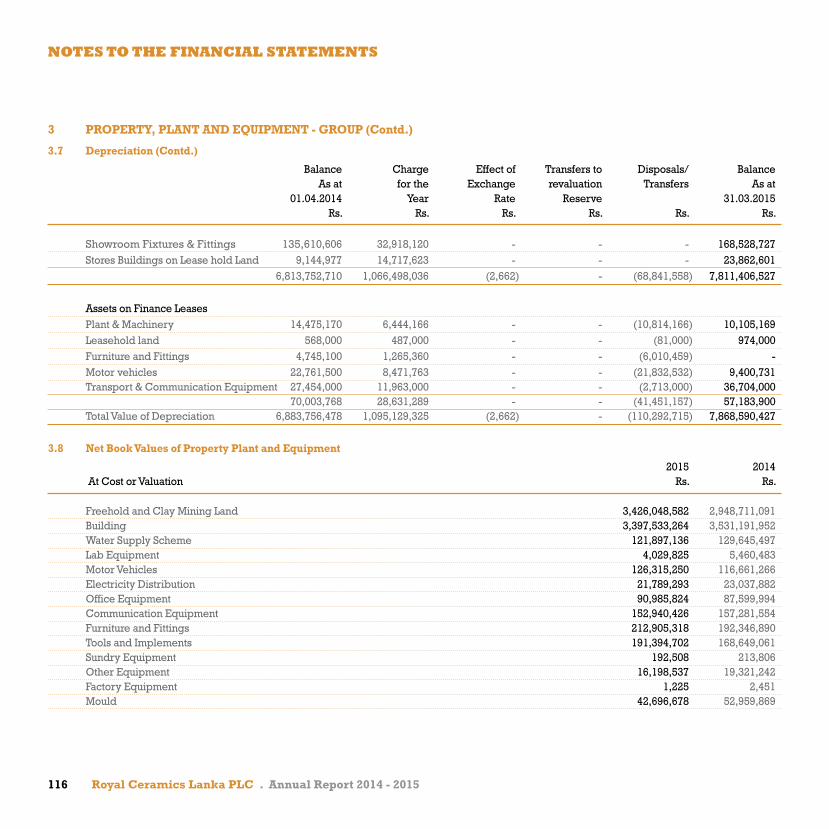
116 Royal Ceramics Lanka PLC . Annual Report 2014 - 2015
3 PROPERTY, PLANT AND EQUIPMENT - gROUP (Contd.)
3.7 Depreciation (Contd.)
Balance Charge Effect of Transfers to Disposals/ Balance As at for the Exchange revaluation Transfers As at 01.04.2014 Year Rate Reserve 31.03.2015 Rs. Rs. Rs. Rs. Rs. Rs.
Showroom Fixtures & Fittings 135,610,606 32,918,120 - - - 168,528,727 Stores Buildings on Lease hold Land 9,144,977 14,717,623 - - - 23,862,601 6,813,752,710 1,066,498,036 (2,662) - (68,841,558) 7,811,406,527
Assets on Finance Leases Plant & Machinery 14,475,170 6,444,166 - - (10,814,166) 10,105,169 Leasehold land 568,000 487,000 - - (81,000) 974,000 Furniture and Fittings 4,745,100 1,265,360 - - (6,010,459) - Motor vehicles 22,761,500 8,471,763 - - (21,832,532) 9,400,731 Transport & Communication Equipment 27,454,000 11,963,000 - - (2,713,000) 36,704,000 70,003,768 28,631,289 - - (41,451,157) 57,183,900 Total Value of Depreciation 6,883,756,478 1,095,129,325 (2,662) - (110,292,715) 7,868,590,427
3.8 Net Book Values of Property Plant and Equipment
2015 2014 At Cost or Valuation Rs. Rs.
Freehold and Clay Mining Land 3,426,048,582 2,948,711,091 Building 3,397,533,264 3,531,191,952 Water Supply Scheme 121,897,136 129,645,497 Lab Equipment 4,029,825 5,460,483 Motor Vehicles 126,315,250 116,661,266 Electricity Distribution 21,789,293 23,037,882 Office Equipment 90,985,824 87,599,994 Communication Equipment 152,940,426 157,281,554 Furniture and Fittings 212,905,318 192,346,890 Tools and Implements 191,394,702 168,649,061 Sundry Equipment 192,508 213,806 Other Equipment 16,198,537 19,321,242 Factory Equipment 1,225 2,451 Mould 42,696,678 52,959,869
nOTES TO THE FInAnCIAL STATEMEnTS

117
3.8 Net Book Values of Property Plant and Equipments (Contd.)
2015 2014 Rs. Rs.
Construction Equipment 3,709,986 2,989,295Plant and Machinery 5,440,251,875 5,585,398,083 Household Item - Light 80,767 106,899 Showroom Fixtures and Fittings 368,757,171 351,567,190
Stores Buildings on Leasehold Land 294,023,505 304,127,149
13,911,751,872 13,677,271,653
Assets on Finance Leases Plant & Machinery 33,110,511 52,497,510 Leasehold land 13,626,000 14,032,000 Furniture and Fittings - 7,908,496 Motor vehicles 12,895,922 28,417,688
Transport & Communication Equipment 22,460,000 17,258,000
82,092,433 120,113,695
In the Course of Construction 539,870,424 334,006,859
14,533,714,729 14,131,392,207
3.9 Net book value of assets
2015 2014
Rs. Rs.
Property, plant and equipment [3.8] 14,533,714,729 14,131,392,207 Leasehold right to bare land of JEDB/SLSPC Estates [3.12] 116,853,000 120,719,000 Immovable JEDB/SLSPC estate assets on finance leases (other than right to bare land) [3.13] 73,160,000 82,342,000 Bearer Biological Assets (3.14) 1,830,608,273 1,648,779,000
Consumable Biological Assets (3.15) 349,513,000 283,928,000
Total 16,903,849,002 16,267,160,207
3.10 During the Period, the group acquired Property, Plant & Equipment for cash to the aggregate value of Rs. 1,389,618,965/- (2014 - Rs. 2,146,459,858/-)
3.11 Property, Plant and Equipment includes fully depreciated assets having a gross carrying amount of Rs. 2,758,815,071/- (2014 Rs. 2,405,201,545/-)

118 Royal Ceramics Lanka PLC . Annual Report 2014 - 2015
3 PROPERTY, PLANT AND EQUIPMENT - gROUP (Contd.)
3.12 Leasehold right to bare land of JEDB/SLSPC estates
For the Year ended 31st March 2015 2014 Rs. Rs.
Capitalised valueAs at 22 June1992 204,931,000 204,931,000
AmortisationAt the beginning of the year 84,212,000 80,345,000 Charge for the year 3,866,000 3,867,000 At the end of the year 88,078,000 84,212,000
Carrying AmountAt the end of the year 116,853,000 120,719,000
The leasehold rights to the bare land on all estates (except for Dumbara Estate which is under an operating lease) have been taken into the books of Horana Plantations PLC.(HPPLC), as at 22 June 1992, immediately after formation of HPPLC, in terms of the opinion obtained from the Urgent Issue Task Force (UITF) of the Institute of Chartered Accountants of Sri Lanka. For this purpose lands have been revalued at Rs.204.931 Mn, being the value established for these lands by Valuation Specialist, D.R.Wickremasinghe just prior to the formation of HPPLC. However Institute of Chartered Accountants of Sri Lanka has withdrawn the UITF ruling with the implementation of LKAS/SLFRs and introduced Statement of Recommended Practices SoRP on leasehold land on 19 December 2013. As per the SoRP right to use land does not permit further revaluation.
3.13 Immovable JEDB/SLSPC estate assets on finance leases (other than right to bare land)
Immature Mature Permanent Buildings Plant & Total Total Plantations Plantations Land Machinery 2015 2014 Development Cost Rs. Rs. Rs. Rs. Rs. Rs. Rs.
Capitalised ValueAs at 22.06.1992 145,993,000 68,817,000 4,014,000 47,173,000 6,818,000 272,815,000 272,815,000
Transfer to matureAt the beginning of the year (145,993,000) 145,993,000 - - - - -At the end of the year - 214,810,000 4,014,000 47,173,000 6,818,000 272,815,000 272,815,000
AmortisationAt the beginning of the year - 139,644,000 2,915,000 41,096,000 6,818,000 190,473,000 181,292,000Amortization during the year - 7,160,000 134,000 1,887,000 - 9,182,000 9,181,000At the end of the year - 146,804,000 3,049,000 42,983,000 6,818,000 199,655,000 190,473,000
Written Down ValueAs at 31.03.14 - 75,166,000 1,099,000 6,077,000 - - 82,342,000As at 31.03.15 - 68,006,000 965,000 4,190,000 - 73,160,000 -
nOTES TO THE FInAnCIAL STATEMEnTS

119
All immovable estate property, plant and equipment under finance leases have been taken into the books of Horana Plantation PLC retrospective to 22nd June 1992. For this purpose all estate immovables have been revalued at their book values as they appear in the books of the lessor (JEDB/SLSPC), as the case may be on the day immediately preceding the date of formation of Horana Plantation PLC.
Investments in Bearer Biological assets which were immature, at the time of handing over to the Company by way of estate lease, are shown under Bearer Biological assets - immature (Revalued as at 22.06.1992). Further investments in such a bearer biological assets (Immature to mature bring them to maturity are shown under “ Note 3.14 Bearer Biological assets (Immature Plantation). When these plantations become mature the additional investment to bring them to maturity will be moved from the Note 3.14 - Bearer Biological assets (Mature plantations)
3.14 Bearer Biological Assets
Tea Rubber Oil Palm Diversi- Total Total -fication 2015 2014 Rs Rs Rs Rs Rs Rs
Immature PlantationsCost or Valuation :At the beginning of the year 182,325,000 505,649,000 41,497,000 5,380,000 734,851,000 627,112,000Additions 69,703,000 133,163,000 23,703,000 5,285,273 231,854,273 277,536,000
Transfers to Mature (82,010,000) (112,814,000) - (4,127,000) (198,951,000) (169,797,000)At the end of the year 170,018,000 525,998,000 65,200,000 6,538,273 767,754,273 734,851,000Mature PlantationsCost or Valuation :At the beginning of the year 494,711,000 686,696,000 - 19,695,000 1,201,102,000 1,031,305,000
Transfers from Immature 82,010,000 112,814,000 - 4,127,000 198,951,000 169,797,000At the end of the year 576,721,000 799,510,000 - 23,822,000 1,400,053,000 1,201,102,000Accumulated AmortizationAt the beginning of the year 91,401,000 190,580,000 - 5,193,000 287,174,000 244,423,000
Charge for the year 14,841,000 34,335,000 - 849,000 50,025,000 42,751,000At the end of the year 106,242,000 224,915,000 - 6,042,000 337,199,000 287,174,000Written Down Value 470,479,000 574,595,000 - 17,780,000 1,062,854,000 913,928,000
Total Bearer Biological Assets 640,497,000 1,100,593,000 65,200,000 24,318,273 1,830,608,273 1,648,779,000
These are investments in immature/mature plantations since the formation of Horana Plantations PLC. The lease liability over the assets (including plantations) taken over by way of estate leases are set out in Note 15. Further investments in the immature plantations taken over by way of these lease are also shown in the above. When such plantations become mature, the additional investments since take over to bring them to maturity have been (or will be ) moved from immature to mature under this category as and when field become mature.

120 Royal Ceramics Lanka PLC . Annual Report 2014 - 2015
3 PROPERTY, PLANT AND EQUIPMENT - gROUP (Contd.)
3.15 Consumable Biological Assets
For the Year ended 31st March 2015 2015 2014 Rs. Rs.
Immature PlantationsCost :At the beginning of the year 20,916,000 14,790,000Additions during the year 8,945,000 11,200,000Transfers to Mature Plantations (6,425,000) (5,074,000)At the end of the year 23,436,000 20,916,000
Mature PlantationsCost :At the beginning of the year 263,012,000 231,886,000Increase due to new plantations 6,425,000 5,074,000Change in Fair Value less costs to sell 56,640,000 26,052,000At the end of the year 326,077,000 263,012,000
Total Consumable Biological Assets 349,513,000 283,928,000
3.16 Basis of Valuation
Under LKAS 41 the company has valued its managed plantations at fair value less cost to sell, Managed timber plantations as at 31st March 2015 comprised approximately 350 hectares.
Managed trees which are less than three years old are considered to be immature consumable biological assets, amounting Rs. 24.43 Mn as at 31st March 2015. The cost of immature trees is treated as approximate fair value, particularly on the ground that little biological transformation has taken place and the impact of the biological transformation on price is not material. When such plantation become mature, the additional investments since taken over to bring them to maturity are transferred from immature to mature.
The mature consumable biological assets were valued by Chartered Valuers Mr.S.M.Wijepala for 2014/15 using Discounted Cash Flow (DFC) method . In ascertaining the fair value of timber, physical verification was carried covering all the estates.
Information about fair value measurement using unobservable inputs (Level 03)
Unobservable Inputs Range of unobservable Inputs Relationship of unobservable inputs to fair value
Discounting Rate 10%-12% The higher the discount rate, the lesser will be the fair value.
Other key assumptions used in valuation:
The price adopted are net of expenditure.
nOTES TO THE FInAnCIAL STATEMEnTS

121
The valuation, as presented in the external valuation model based on the net present value, takes into accounts the long-term exploitation of the
timber plantation. Because of the inherent uncertainty associated with the valuation at fair value of the biological assets due to the volatility of
the variables, their carrying value may differ from their realisable value. The Board of Directors retains their view that commodity markets are
inherently volatile and their long-term price projection are highly unpredictable. Hence, the sensitivity analysis regarding the selling price and
discount rate variation as included in this note allows every investor to reasonably challenge the financial impact of the assumptions used in the
valuation against his own assumptions.
The biological assets of the Company are mainly cultivated in leased lands. When measuring the fair value of the biological assets it was
assumed that these concession can and will be renewed at normal circumstances. Timber content expects to be realised in future and is included
in the calculation of the fair value that takes into account the age of the timber plants and not the expiration date of the lease.
The Company is exposed to the following risks relating to its timber plantation:-
Regulatory and Environmental Risks
The Company is subject to laws and regulations in Sri Lanka. The Company has established environmental policies and procedures aimed at
compliance with local environmental and other laws. Management performs regular reviews to identify environmental risks and to ensure that
the systems in place are adequate to manage those risks.
Supply and Demand Risks
The Company is exposed to risks arising from fluctuations in the price and sales volume of timber. When possible the Company manages this
risk by aligning its harvest volume to market supply and demand. Management performs regular industry trend analyses to ensure that the
Company’s pricing structure is in line with the market and to ensure that projected harvest volumes are consistent with the expected demand.
Climate and Other Risks
The Company’s timber plantations are exposed to the risk of damage from climatic changes, diseases, forest fires and other natural forces. The
Company has extensive processes in place aimed at monitoring and mitigating those risks, including regular forest health inspections and
industry pest and disease surveys.
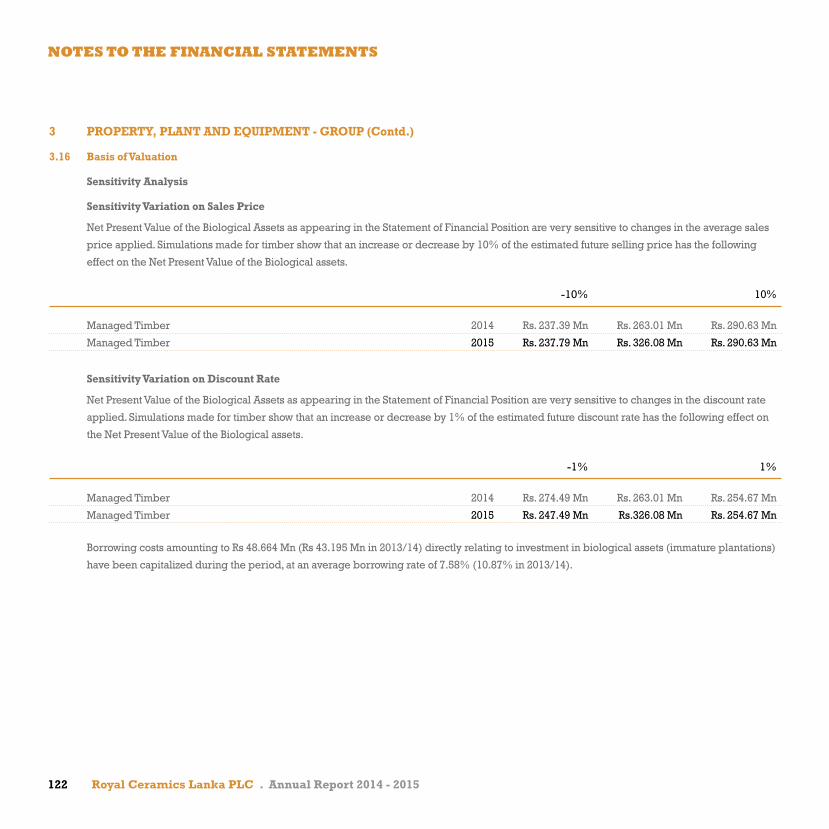
122 Royal Ceramics Lanka PLC . Annual Report 2014 - 2015
3 PROPERTY, PLANT AND EQUIPMENT - gROUP (Contd.)
3.16 Basis of Valuation
Sensitivity Analysis
Sensitivity Variation on Sales Price
Net Present Value of the Biological Assets as appearing in the Statement of Financial Position are very sensitive to changes in the average sales
price applied. Simulations made for timber show that an increase or decrease by 10% of the estimated future selling price has the following
effect on the Net Present Value of the Biological assets.
-10% 10%
Managed Timber 2014 Rs. 237.39 Mn Rs. 263.01 Mn Rs. 290.63 Mn
Managed Timber 2015 Rs. 237.79 Mn Rs. 326.08 Mn Rs. 290.63 Mn
Sensitivity Variation on Discount Rate
Net Present Value of the Biological Assets as appearing in the Statement of Financial Position are very sensitive to changes in the discount rate
applied. Simulations made for timber show that an increase or decrease by 1% of the estimated future discount rate has the following effect on
the Net Present Value of the Biological assets.
-1% 1%
Managed Timber 2014 Rs. 274.49 Mn Rs. 263.01 Mn Rs. 254.67 Mn
Managed Timber 2015 Rs. 247.49 Mn Rs.326.08 Mn Rs. 254.67 Mn
Borrowing costs amounting to Rs 48.664 Mn (Rs 43.195 Mn in 2013/14) directly relating to investment in biological assets (immature plantations)
have been capitalized during the period, at an average borrowing rate of 7.58% (10.87% in 2013/14).
nOTES TO THE FInAnCIAL STATEMEnTS

123
3.17 The following properties are revalued and recorded under freehold land & clay mining land. Fair Value measurement disclosure for revalued land based on un-observable input as follows.
(A) Quoted Price (unadjusted) in active markets for identical assets or liabilities (Level -1).
(B) Inputs other than quoted prices included within level 1 that are observable for the asset or liability, either directly (that is, as prices) or
indirectly (that is derived from prices) (Level - 2)
(C) Input for the asset or liability that are not based on observable market data (that is, unobservable inputs) (Level -3).
No Company Location Extent Valuer Valuation Date
Valuation Details Significant unobservable input : price per perch/ acre/range
FairValue measurement
using Significant
unobservable inputs (Level
3) Rs. Mn
1 Royal Ceramics Lanka PLC
Factory at Ehaliyagoda A49-R1-P29.45 Mr. A.A.M. Fathihu 30-Apr-12 Market based evidence Rs. 31,534/- per perch
247.150 Mn
Showroom and Cutting Center Land at Kottawa
A1-R1-P30.72 Mr. A.A.M. Fathihu 30-Apr-12 Market based evidence Rs. 457,199/- per perch
105.485 Mn
Land at Meegoda Warehouse A2-R2-P24 Mr. A.A.M. Fathihu 30-Apr-12 Market based evidence Rs. 119,043/- per perch
46.6 Mn
Land at Nawala for Nawala New Showroom
P24.96 Mr. A.A.M. Fathihu 30-Apr-12 Market based evidence Rs. 3,491,586/- per perch
87.150 Mn
Land at Nattandiya A10 Mr. A.A.M. Fathihu 30-Apr-12 Market based evidence Rs. 12,500/- per perch
20 Mn
Land at kaluthara A04-R3-P8.16 Mr. A.A.M. Fathihu 30-Apr-12 Market based evidence Rs. 15,003/- per perch
11.525 Mn
2 Royal Porcelain (Pvt) Ltd
Factory Land at Horana A13-R3-P27.07 Mr. A.A.M. Fathihu 31-Mar-12
Market based evidence Rs. 40,000/- per perch
89.088 Mn
3 Rocell Bathware Ltd
Factory land at Homagama A1-R2-P19.60 Mr. A.A.M. Fathihu 1-Apr-12 Market based evidence Rs. 85,000/- per perch
22.066 Mn
Land at Meegoda Warehouse R3 Mr. A.A.M. Fathihu 1-Apr-12 Market based evidence Rs. 90,000/- per perch
10.8 Mn
4 Ever paint And Chemical Industries (Pvt) Ltd
Factory land at Hanwella A1-R2-P22.75 Mr. A.A.M. Fathihu 31-Mar-12
Market based evidence Rs. 24,689/- per perch
6.487 Mn

124 Royal Ceramics Lanka PLC . Annual Report 2014 - 2015
nOTES TO THE FInAnCIAL STATEMEnTS
No Company Location Extent Valuer Valuation Date
Valuation Details Significant unobservable input : price per perch/ acre/range
FairValue measurement
using Significant
unobservable inputs (Level
3) Rs. Mn
5 Lanka Walltiles PLC
No. 215, Nawala Road, Narahenpita, Colombo 05
A1-R1-P2.1 Messrs. Sunil Fernando and Associates (Pvt) Ltd.
28-Dec-12
Market based evidence Rs. 1,750,000/- per perch
353.675 Mn
Plan No 2205 Situated at Mawathagama and Galagedara Village
A23-R1-P24.16 Mr. Ranjan J Samarakone
31 March 2013
Market based evidence Rs. 94,013/- per perch
352 Mn
6 Lanka Tiles PLC
Factory at Jaltara, Ranala & Ball Clay land at Kaluthara
A40-R3-P34 Mr. Ranjan J Samarakone
31 March 2013
Market based evidence Rs. 85,837/-to Rs. 115,321/- per perch
524.639 Mn
Warehouse at Biyagama A2-R0-P16 Mr. Ranjan J Samarakone
31 March 2013
Market based evidence Rs. 649,863/- per perch
218.354 Mn
Land at Madampe A13-R0-P2 Mr. Ranjan J Samarakone
31 March 2013
Market based evidence Rs. 17,187/- per perch
35.784 Mn
7 Uni-Dil Packing Ltd.
Land at Narampola road, Moragala, Deketana
A9-R0-P17.8 Mr. Anton Rich 31 March 2014
Market based evidence Rs. 60,000/- per perch
87.968 Mn
8 Uni-Dil Paper Sacks (Pvt) Ltd.
Land at Narampola road, Moragala, Deketana
A2-R2-P35 Mr. Anton Rich 31 March 2014
Market based evidence Rs. 50,000/- per perch
21.750 Mn
9 Swisstek (Ceylon) PLC
Balummara, Imbulgoda A06-R01-P01 Mr. K. D. T. Tissera 31 March 2015
Market based evidence Rs. 464,535/- per perch
465 Mn
10 Swisstek Aluminium Ltd.
Land at Pahala Dompe, Dompe A08-R02-P20 Mr. T. J. Tissera 18 February 2013
Market based evidence Rs. 98,898/- per perch
160 Mn
11 Lanka Ceramic PLC
Mining Land at Owala 25A-2R-14.2P Mr.B.L.Ariyathilake 22 April 2013
Market based evidence Rs. 450/- to Rs. 1,150/- per perch
3.528 Mn
Mining Land at Meetiyagoda 41A-OR-20.3P Mr.B.L.Ariyathilake 22 April 2013
Market based evidence Rs. 125,000/- to Rs. 1,225,000/- per acre
18.68 Mn
Mining Land at Dediyawala 38A-3R-23.4P Mr.B.L.Ariyathilake 22 April 2013
Market based evidence Rs. 150,000/- to Rs. 160,000/- per acre
5.94Mn
Land situated at Meetiyagoda 4A-2R-12P Messrs.Ariyathilake & Company (Pvt) Limited
18 May 2012
Market based evidence Rs. 400,000/- to Rs. 960,000/- per acre
4.112Mn
Significant increases (decreases) in estimated price per perch in isolation would result in a significantly higher (lower) fair value.
3.17 The following properties are revalued and recorded under freehold land & clay mining land. Fair Value measurement disclosure for revalued land based on un-observable input as follows.
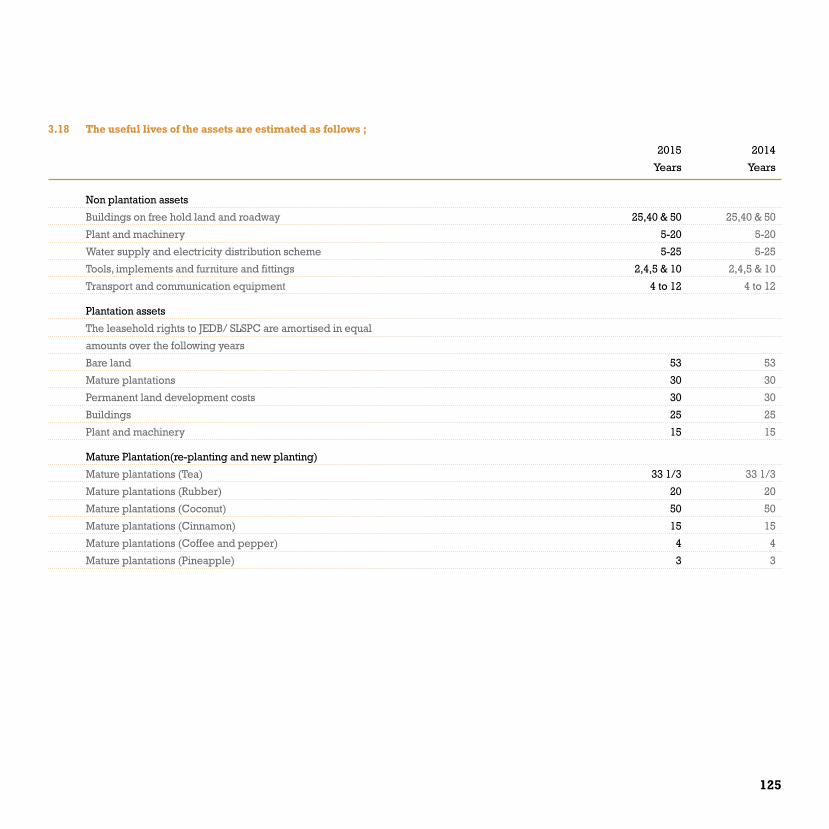
125
3.18 The useful lives of the assets are estimated as follows ;
2015 2014
Years Years
Non plantation assets
Buildings on free hold land and roadway 25,40 & 50 25,40 & 50
Plant and machinery 5-20 5-20
Water supply and electricity distribution scheme 5-25 5-25
Tools, implements and furniture and fittings 2,4,5 & 10 2,4,5 & 10
Transport and communication equipment 4 to 12 4 to 12
Plantation assets
The leasehold rights to JEDB/ SLSPC are amortised in equal
amounts over the following years
Bare land 53 53
Mature plantations 30 30
Permanent land development costs 30 30
Buildings 25 25
Plant and machinery 15 15
Mature Plantation(re-planting and new planting)
Mature plantations (Tea) 33 1/3 33 1/3
Mature plantations (Rubber) 20 20
Mature plantations (Coconut) 50 50
Mature plantations (Cinnamon) 15 15
Mature plantations (Coffee and pepper) 4 4
Mature plantations (Pineapple) 3 3

126 Royal Ceramics Lanka PLC . Annual Report 2014 - 2015
nOTES TO THE FInAnCIAL STATEMEnTS
3.19 Leasehold Right Over Mining Land
group
2015 2014
Rs. Rs.
Cost
At the beginning of the year 7,800,000 27,665,000
Disposals - (19,865,000)
At the end of the year 7,800,000 7,800,000
Accumulated Depreciation
At the beginning of the year 6,573,500 25,186,000
Charge for the year 715,000 1,252,500
Disposals - (19,865,000)
At the end of the year 7,288,500 6,573,500
Written Down Value 511,500 1,226,500
4 INVESTMENT PROPERTY group
2015 2014
Rs. Rs.
At the beginning of the year 240,094,000 -
Acquisition through Subsidiary - 349,294,000
Disposal of investment property - (80,000,000)
Transferred to Property, Plant & Equipment - (29,200,000)
Depreciation of investment property (690,000) -
At the end of the year 239,404,000 240,094,000

127
Lanka Ceramic PLC
As at 31 March 2015, the investment property includes land and building at No 696,696 1/1,696 2/1,696 3/1,696 4/1, Kollupitiya Road, Colombo 03 ( 1R - 1,12 P). The fair value of freehold land and buildings were determined by the by Mr. B.L Ariyathllake an independent professionally qualified valuer in reference to market based evidence (Valuation report dated 21 May 2012 - Rs 240,094 at the time of transferring the property from property plant and equipment to investment property.
Lanka Walltiles PLC
As at 01 April 2013, the investment property includes land and building at Balangoda and the investment property has been sold out in the previous financial year 2013/14.
Swisstek Ceylon PLC
Factory complex at Balummahara,Imbulgoda has transferred to Property, Plant and Equipment during the previous financial year 2013/14.
4.1 Fair Value of Investment Property
The fair value of freehold land and buildings were determined by the by P.B Kalugalagedara & Associates an independent professionally
qualified valuer (Valuation report dated 07 May 2015). The basis of valuation is the Direct Capital Comparison Method using the depreciated
value of buildings and Current Market Value of land.
Group Group
FairValue measurement using FairValue measurement using
Investment Property Significant unobservable inputs (Level 3) Significant unobservable inputs (Level 3)
2015 2014
Rs. Rs.
Date of valuation 07 May 2015 07 May 2015
Land at fair value 370,000,000 329,000,000
Building at fair value 75,000,000 68,500,000
Significant unobservable input :
Price per perch 9,000,000 8,000,000
Price per square feet Rs. 2,000/- -Rs. 3,250/- Rs. 1,750/- -Rs. 3,000/-
Significant increases (decrease) in estimated price per perch/ price per square feet in isolation would result in a significantly higher (lower) fair
value.
4.2 Rental Income earned from Investment Property by the Group amounted Rs. 36. 75 Mn. (2014 - Rs. 36.75 Mn). Direct operating expenses incurred
by the Group amounted to Rs. 1.2 Mn.(2014 - Rs. 1.1 Mn.).

128 Royal Ceramics Lanka PLC . Annual Report 2014 - 2015
5 INVESTMENTS IN SUBSIDIARIES
Holding Country of Cost Cost incorporation 2015 2014 2015 2014 % % Rs. Rs.
Quoted & Non-Quoted
Non-Quoted
Royal Ceramics Distributors (Pvt) Limited 100% 100% Sri Lanka 500,000 500,000
Royal Porcelain (Pvt) Limited 100% 100% Sri Lanka 500,000,000 500,000,000
Rocell Bathware Limited 100% 100% Sri Lanka 929,999,930 929,999,930
Ever Paint and Chemical Industries (Pvt) Ltd 100% 100% Sri Lanka 270,400,000 270,400,000
Rocell Ceramics Limited 100% - Sri Lanka 198,132,251 -
Rocell (Pty) Ltd 100% - Australia 57,543,988 -
Quoted
Lanka Ceramic PLC 76.93% 76.70% Sri Lanka 2,875,557,285 2,866,709,287
Lanka Tiles PLC 2.62% 1.62% Sri Lanka 125,032,515 66,714,575
Lanka Walltile PLC 1.06% 1.06% Sri Lanka 33,932,044 33,932,044
Total Quoted & Non-Quoted Investments in Subsidiaries 4,991,098,013 4,668,255,836
Total Gross Carrying Value of Investments 4,991,098,013 4,668,255,836
Impairment made (500,000) (500,000)
Total Net Carrying Value of Investments 4,990,598,013 4,667,755,836
As at 31 March 2015 Market value of Lanka Ceramic PLC, Lanka Floor tile PLC & Lanka Wall Tile PLC are Rs. 3,076,435,499/-, Rs. 147,178,986/- and Rs. 55,580,286/- respectively.
nOTES TO THE FInAnCIAL STATEMEnTS

129
6. INVESTMENTS IN ASSOCIATES
6.1 Company
Holding Percentage Cost Cost 2015 2014 2015 2014 Rs. Rs.
Quoted Investments
L. B. Finance PLC 26.08% 26.08% 2,499,577,145 2,499,577,145
Non-quoted Investments
Delmage Limited
(Formally known as Lewis Brown & Company Limited) 21.00% 21.00% 663,360,345 663,360,345
3,162,937,490 3,162,937,490
6.2 group
Holding Carrying Value Carrying Value 2015 2014 2015 2014 Rs. Rs.
Quoted Investments
L. B. Finance PLC 26.08% 26.08% 3,617,167,128 3,156,741,754
Non-quoted Investments
Delmage Limited
(Formally known as Lewis Brown & Company Limited) 21.00% 21.00% 605,449,161 647,930,773
4,222,616,289 3,804,672,527
Market value of LB Finance PLC as at 31 March 2015 is Rs 2,711,048,562 (2014 - Rs 1,807,967,762/-).
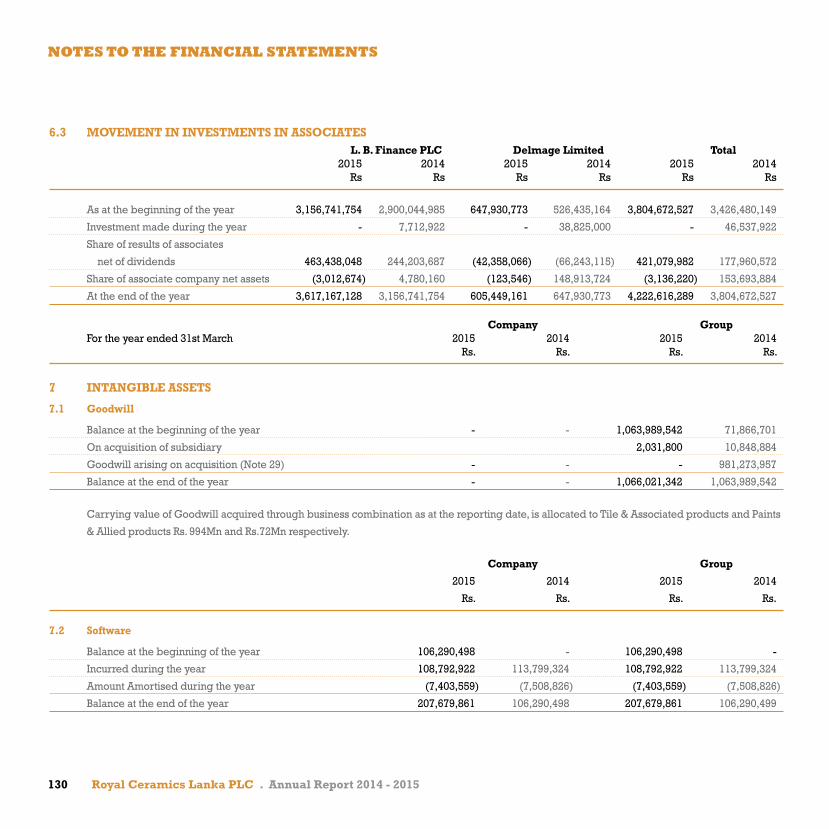
130 Royal Ceramics Lanka PLC . Annual Report 2014 - 2015
6.3 MOVEMENT IN INVESTMENTS IN ASSOCIATES L. B. Finance PLC Delmage Limited Total 2015 2014 2015 2014 2015 2014 Rs Rs Rs Rs Rs Rs
As at the beginning of the year 3,156,741,754 2,900,044,985 647,930,773 526,435,164 3,804,672,527 3,426,480,149
Investment made during the year - 7,712,922 - 38,825,000 - 46,537,922
Share of results of associates
net of dividends 463,438,048 244,203,687 (42,358,066) (66,243,115) 421,079,982 177,960,572
Share of associate company net assets (3,012,674) 4,780,160 (123,546) 148,913,724 (3,136,220) 153,693,884
At the end of the year 3,617,167,128 3,156,741,754 605,449,161 647,930,773 4,222,616,289 3,804,672,527
Company groupFor the year ended 31st March 2015 2014 2015 2014
Rs. Rs. Rs. Rs.
7 INTANgIBLE ASSETS
7.1 goodwill
Balance at the beginning of the year - - 1,063,989,542 71,866,701
On acquisition of subsidiary 2,031,800 10,848,884
Goodwill arising on acquisition (Note 29) - - - 981,273,957
Balance at the end of the year - - 1,066,021,342 1,063,989,542
Carrying value of Goodwill acquired through business combination as at the reporting date, is allocated to Tile & Associated products and Paints
& Allied products Rs. 994Mn and Rs.72Mn respectively.
Company group
2015 2014 2015 2014
Rs. Rs. Rs. Rs.
7.2 Software
Balance at the beginning of the year 106,290,498 - 106,290,498 -
Incurred during the year 108,792,922 113,799,324 108,792,922 113,799,324
Amount Amortised during the year (7,403,559) (7,508,826) (7,403,559) (7,508,826)
Balance at the end of the year 207,679,861 106,290,498 207,679,861 106,290,499
nOTES TO THE FInAnCIAL STATEMEnTS

131
Company group
2015 2014 2015 2014
Rs. Rs. Rs. Rs.
7.3 Software work in progress
Balance at the beginning of the year 50,630,630 111,053,384 50,630,630 111,053,384
Incurred during the year 58,162,291 53,376,571 58,162,291 53,376,571
Amount Capitalized during the year (108,792,921) (113,799,325) (108,792,921) (113,799,324)
Balance at the end of the year - 50,630,630 - 50,630,630
Total intangible assets 207,679,861 156,921,128 1,273,701,203 1,220,910,671
8 LONg TERM RECEIVABLES
group
2015 2014
Rs. Rs.
Advance Company Tax Receivable 27,285,000 27,285,000
27,285,000 27,285,000
9 INVENTORIES
Company group
2015 2014 2015 2014
Rs. Rs. Rs. Rs.
Raw Materials 133,044,846 156,115,875 1,500,852,762 1,109,690,527
Spares & Consumables 227,920,099 197,079,186 830,200,223 1,061,717,932
Accessories - - 410,421,235 223,905,370
Harvested crops - - 196,866,000 213,001,000
Work in Progress 18,110,486 29,084,695 221,888,254 244,134,305
Finished Goods 864,950,417 609,431,770 4,037,300,175 4,034,248,957
Goods in Transit 5,332,971 2,651,335 99,337,332 43,382,143
Other Consumables 5,525,635 8,605,702 11,178,749 14,431,089
1,254,884,454 1,002,968,563 7,308,044,730 6,944,511,323
Less : Provision for Obsolete & Slow Moving Stock (28,665,831) (10,192,871) (180,913,873) (102,171,065)
1,226,218,623 992,775,692 7,127,130,857 6,842,340,259

132 Royal Ceramics Lanka PLC . Annual Report 2014 - 2015
10 TRADE AND OTHER RECEIVABLES 2015 2014 Rs. Rs.
10.1 Company
Trade Debtors (Note 10.1.2) 180,957,192 326,111,987
Other Receivables - Other 33,801,533 26,165,239
- Related Parties (Note 10.1.1) 92,722,614 10,675,835
307,481,339 362,953,061
10.1.1 Amount due from Subsidiaries
2015 2014
Rs. Rs.
Royal Ceramics Distributors (Pvt) Ltd 754,355 589,210
Lanka Tiles PLC 16,871,338 2,939,894
Lanka Wall Tiles 6,431,168 2,923,824
Ever Paint and Chemical Industries (Pvt) Ltd 64,229,987 -
Lanka Ceramic PLC 1,376,675 3,149,071
Horana Plantation PLC 1,888,731 1,073,836
Swisstek Aluminium Limited 626,570 -
Swisstek Ceylon PLC 67,808 -
Uni-Dil Packaging Limited 475,983 -
92,722,614 10,675,835
10.1.2 Trade receivables are non interest bearing and on 30 to 45 days credit terms. As at 31 March 2015, the ageing analysis of trade receivables is as
follows:
Neither past Past due but not impaired due nor Total Impaired Less Than 3 to 12 More Than Rs. Rs. 3 Month Month One Year Rs. Rs. Rs.
Trade debtors 180,957,192 61,299,041 67,356,844 14,874,534 37,426,773
180,957,192 61,299,041 67,356,844 14,874,534 37,426,773
nOTES TO THE FInAnCIAL STATEMEnTS
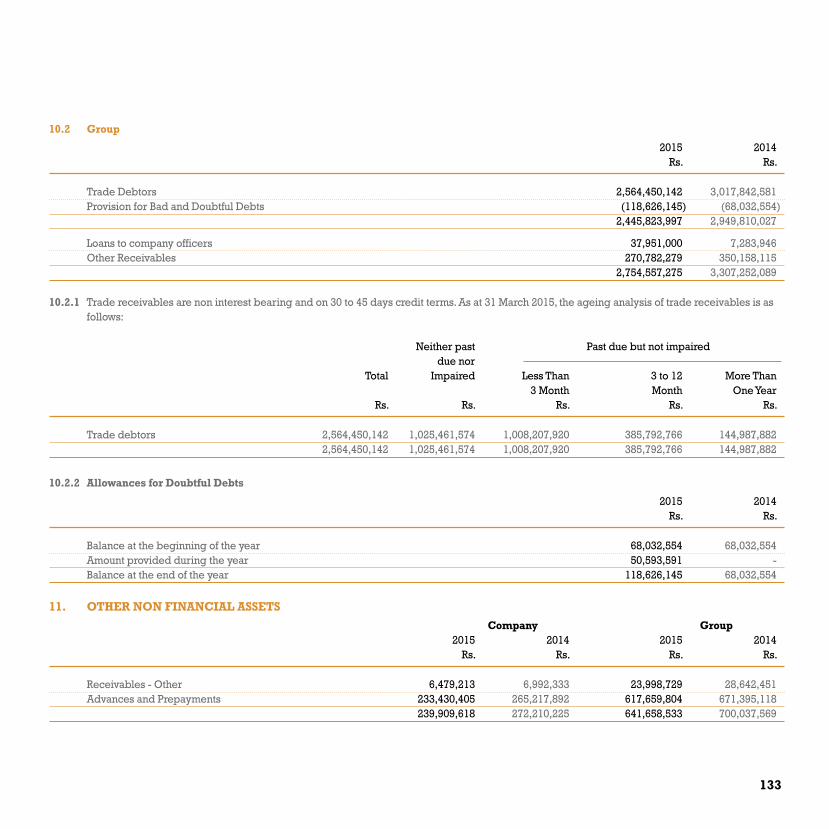
133
10.2 group
2015 2014 Rs. Rs.
Trade Debtors 2,564,450,142 3,017,842,581 Provision for Bad and Doubtful Debts (118,626,145) (68,032,554) 2,445,823,997 2,949,810,027
Loans to company officers 37,951,000 7,283,946Other Receivables 270,782,279 350,158,115 2,754,557,275 3,307,252,089
10.2.1 Trade receivables are non interest bearing and on 30 to 45 days credit terms. As at 31 March 2015, the ageing analysis of trade receivables is as follows:
Neither past Past due but not impaired due nor Total Impaired Less Than 3 to 12 More Than 3 Month Month One Year Rs. Rs. Rs. Rs. Rs.
Trade debtors 2,564,450,142 1,025,461,574 1,008,207,920 385,792,766 144,987,882 2,564,450,142 1,025,461,574 1,008,207,920 385,792,766 144,987,882
10.2.2 Allowances for Doubtful Debts
2015 2014 Rs. Rs.
Balance at the beginning of the year 68,032,554 68,032,554 Amount provided during the year 50,593,591 - Balance at the end of the year 118,626,145 68,032,554
11. OTHER NON FINANCIAL ASSETS Company group 2015 2014 2015 2014 Rs. Rs. Rs. Rs.
Receivables - Other 6,479,213 6,992,333 23,998,729 28,642,451 Advances and Prepayments 233,430,405 265,217,892 617,659,804 671,395,118 239,909,618 272,210,225 641,658,533 700,037,569

134 Royal Ceramics Lanka PLC . Annual Report 2014 - 2015
12 OTHER FINANCIAL ASSETS
12.1 Non Current - Company/group
Investments Available for Sale-Non Quoted Cost Cost 2015 2014 Rs. Rs.
Rocell Ceramics Limited - 197,136,773 Rocell Property Ltd - 73,506 - 197,210,279
SLFRS 10 replaces the parts of previously existing LKAS 27 Consolidated and Separate Financial Statements that dealt with consolidated financial statements and SIC-12 Consolidation – Special Purpose Entities. SLFRS 10 changes the definition of control such that an investor controls an investee when it is exposed, or has rights, to variable returns from its involvement with the investee and has the ability to affect those returns through its power over the investee. To meet the definition of control in SLFRS 10, all three criteria must be met, they include:
(a) an investor has power over an investee;
(b) the investor has exposure, or rights, to variable returns from its involvement with the investee; and
(c) the investor has the ability to use its power over the investee to affect the amount of the investor’s returns.
Upon the satisfaction of above criteria, Rocell Ceramics Limited has been treated as a subsidiary of the group.
12.2 Current - Company/group
Investments at fair Value Through Profit or Loss No. of Shares Fair Value 2015 2014 2015 2014 Rs. Rs.
QuotedThe Fortress Resorts PLC 336,100 336,100 5,108,720 4,470,130Aitken Spence PLC 225,000 225,000 22,387,500 22,027,500Lanka Hospitals Corporation PLC 45,519 45,519 1,816,208 1,893,590Citrus Leisure PLC 2,768,276 2,768,276 35,724,093 45,399,726Citrus Leisure Warrant 2015 10 10 2 11Serendib Hotels PLC 16,000 16,000 448,000 448,000Softlogic Finance PLC 1,414,414 1,042,200 49,363,049 31,995,540Ascot Holdings PLC 30,000 30,000 1,080,000 3,420,000 Waskaduwa Beach Resorts Ltd 1,400,145 1,400,145 7,140,740 10,641,102 123,068,312 120,295,600
Non-QuotedMBSL Insurance 4,666,667 4,666,667 8,666,667 8,666,667 8,666,667 8,666,667 131,734,979 128,962,267
nOTES TO THE FInAnCIAL STATEMEnTS

135
13. STATED CAPITAL - COMPANY/gROUP 2015 2014
Number Rs. Number Rs.
Balance as at 01 April 110,789,384 1,368,673,373 110,789,384 1,368,673,373 Balance as at 31 March 110,789,384 1,368,673,373 110,789,384 1,368,673,373
14. RESERVES Company group 2015 2014 2015 2014 Rs. Rs. Rs. Rs.
SummaryRevaluation Reserve (Note 14.1) 213,634,264 213,634,264 704,876,970 669,505,158
Available for sale reserve (Note 14.2) - - 7,102,730 9,571,387
Exchange Differences on transaction of foreign operations (Note 14.3) - - (4,169,416) - 213,634,264 213,634,264 707,810,284 679,076,545
14.1 Revaluation Reserve
Company group 2015 2014 2015 2014 Rs. Rs. Rs. Rs.
On: Property, Plant and EquipmentAs at 1 April 213,634,264 213,634,264 669,505,158 513,494,300Revaluation of surplus during the year - - 37,694,958 156,010,858Realised Surplus on Disposal Transferred to Retained Earnings - - (2,323,146) -As at 31 March 213,634,264 213,634,264 704,876,970 669,505,158
The above revaluation surplus consists of net surplus resulting from the revaluation of property plant and equipment as described in Note 3.4 and 3.10. The unrealised amount cannot be distributed to shareholders.
14.2 Available for Sale Reserve
group 2015 2014 Rs. Rs.
As at 1 April 9,571,387 1,071,547
Net change in fair value during the year (2,468,658) 8,499,840As at 31 March 7,102,729 9,571,387

136 Royal Ceramics Lanka PLC . Annual Report 2014 - 2015
nOTES TO THE FInAnCIAL STATEMEnTS
For the Year ended 31 March 2015
14.3 Foreign Currency Translation Reserve
group 2015 2014 Rs. Rs.
As at 1 April - -Transferred during the year, net of tax (4,169,416) -As at 31 March (4,169,416) -
15 INTEREST BEARINg LOANS AND BORROWINgS Company group 2015 2014 2015 2014 Rs. Rs. Rs. Rs.
Non CurrentLong term loans (15.1) 3,315,570,610 3,699,996,091 5,870,458,980 6,699,042,090 Finance leases (15.2) - 8,066,943 115,533,037 133,032,021 3,315,570,610 3,708,063,034 5,985,992,017 6,832,074,111 CurrentLong term loans (15.1) 720,101,988 535,697,007 1,609,560,105 1,633,428,516 Finance leases (15.2) - 5,781,203 25,529,327 44,245,979 Short term loans 242,589,466 235,523,279 2,563,770,890 3,351,348,337 Bank overdrafts (20.0) 435,145,226 183,616,842 2,109,451,686 1,796,625,824 1,397,836,680 960,618,331 6,308,312,008 6,825,648,655 Total 4,713,407,290 4,668,681,365 12,294,304,025 13,657,722,766
15.1 Long Term Loans
Company group 2015 2014 2015 2014 Rs. Rs. Rs. Rs.
At the beginning of the year 4,235,693,099 1,633,704,217 8,091,919,753 2,364,569,683 On acquisition of subsidiaries - - - 2,898,417,000 Loans obtained during the year 2,083,995,891 4,400,220,477 2,659,186,166 7,062,848,505 Exchange gain/loss on USD loans 7,405,200 11,173,522 11,422,186 6,870,522 Effect of fair value of loans - - 244,000 (244,000)
Repayments during the year (2,291,421,592) (1,809,405,117) (3,282,753,020) (3,999,991,103)
At the end of the year 4,035,672,598 4,235,693,099 7,480,019,085 8,332,470,608 Payable within 1 year 720,101,988 535,697,007 1,609,560,105 1,633,428,516 Payable after 1 year before 5 years 3,315,570,610 3,699,996,091 5,870,458,980 6,699,042,090 4,035,672,598 4,235,693,098 7,480,019,085 8,332,470,606

137
15.2 Finance Leases
Company group 2015 2014 2015 2014 Rs. Rs. Rs. Rs.
JEDB/SLSPC estates (Note 15.3) - - 156,840,000 162,068,000
Other finance lease creditors (Note 15.4) - 16,810,048 60,151,577 102,684,286
Gross liability - 16,810,048 216,991,577 264,752,286
Finance charges allocated to future periods - (2,961,902) (75,928,562) (87,475,287)
Net liability - 13,848,146 141,063,015 177,277,999
Payable within 1 year - 5,781,203 25,529,327 44,245,979
Payable after 1 year before 5 years - 8,066,943 115,533,037 133,032,021
Total - 13,848,146 141,062,364 177,277,999
15.3 JEDB/SLSPC estates
At the beginning of the year 162,068,000 -
On acquisition of subsidiaries - 167,296,000
New leases obtained during the year 12,393,000 11,287,000
Repayments during the year (17,621,000) (16,515,000)
At the end of the year 156,840,000 162,068,000
15.4 Other Financial lease creditors
At the beginning of the year 16,810,048 25,289,760 102,684,782 56,034,393
On acquisition of subsidiaries - - - 108,077,000
New leases obtained during the year - - 34,109,000 16,282,699
Repayments during the year (16,810,048) (8,479,712) (76,642,205) (77,709,806)
At the end of the year - 16,810,048 60,151,577 102,684,286

138 Royal Ceramics Lanka PLC . Annual Report 2014 - 2015
15.5 The lease rentals have been amended with effect from 22nd June 1996 to an amount substantially higher than the previous nominal lease rental of
Rs.500/-per estate per annum. The basic rental payable under the revised basis is Rs.5.228 Mn per annum. This amount is to be inflated annually
by the Gross Domestic Product(GDP) deflator in the form of contingent rent.
This lease agreement was further amended on 10th June 2005, freezing the annual lease rental at Rs.7.472 Mn for a period of six years
commencing from 22nd June 2002. Hence, the GDP Deflator adjustment is frozen at Rs.2.244 Mn per annum until 21st June 2008. Accordingly, the
Financial Statements have been adjusted, in order to reflect the future net liability in the following manner:-
Future liability on the revised annual lease payment of Rs.7.472 Mn will continue until 21st June 2008, and thereafter from 22nd June 2008, annual
lease payment will remain at Rs.5.228 Mn, until 21st June 2045. The Net Present Value of this liability at a 4% discounting rate would result in a
liability of Rs.89.551 Mn.
Rs. Mn
The net present value as at date is represented by
Gross Liability - Overdue 156,840
- 30 Years at Rs. 5.228 million per annum 156,840
Less : Interest in Suspense (67,289)
Net Present Value 89,551
The contingent rental charged during the current year to Statement of Comprehensive Income amounted to Rs. 12,393.029/- and the gross
liability to make contingent rentals for the remaining 30 years of lease term at the current rate would be estimated to Rs. 371,790,870/- as at
31 March 2015.
nOTES TO THE FInAnCIAL STATEMEnTS
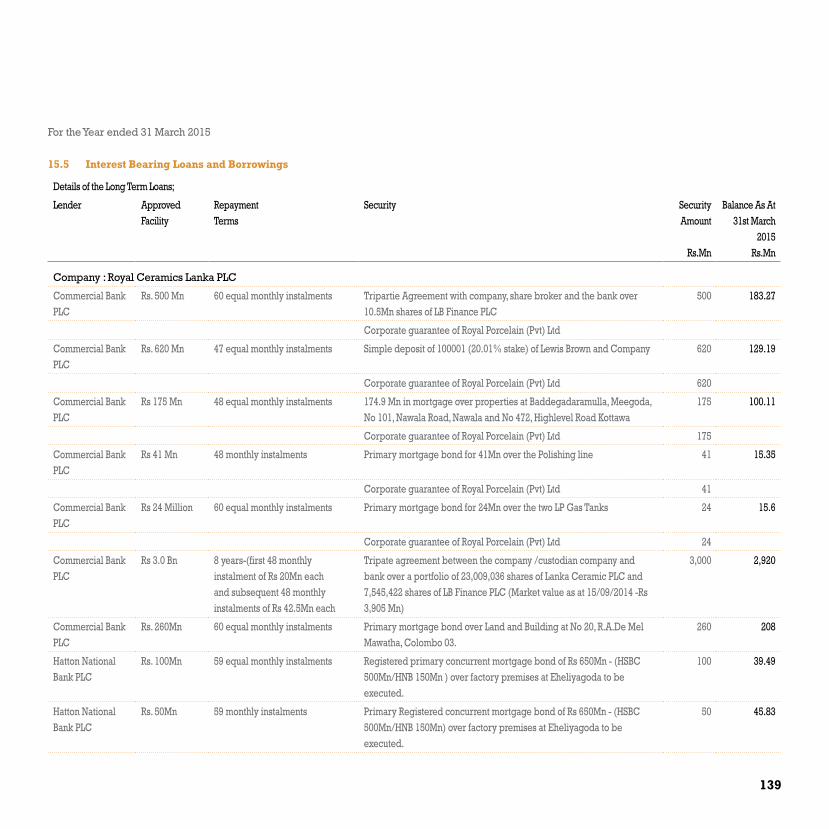
139
For the Year ended 31 March 2015
15.5 Interest Bearing Loans and Borrowings
Details of the Long Term Loans;
Lender ApprovedFacility
RepaymentTerms
Security Security Amount
Rs.Mn
Balance As At31st March
2015Rs.Mn
Company : Royal Ceramics Lanka PLC
Commercial Bank PLC
Rs. 500 Mn 60 equal monthly instalments Tripartie Agreement with company, share broker and the bank over 10.5Mn shares of LB Finance PLC
500 183.27
Corporate guarantee of Royal Porcelain (Pvt) Ltd
Commercial Bank PLC
Rs. 620 Mn 47 equal monthly instalments Simple deposit of 100001 (20.01% stake) of Lewis Brown and Company 620 129.19
Corporate guarantee of Royal Porcelain (Pvt) Ltd 620
Commercial Bank PLC
Rs 175 Mn 48 equal monthly instalments 174.9 Mn in mortgage over properties at Baddegadaramulla, Meegoda, No 101, Nawala Road, Nawala and No 472, Highlevel Road Kottawa
175 100.11
Corporate guarantee of Royal Porcelain (Pvt) Ltd 175
Commercial Bank PLC
Rs 41 Mn 48 monthly instalments Primary mortgage bond for 41Mn over the Polishing line 41 15.35
Corporate guarantee of Royal Porcelain (Pvt) Ltd 41
Commercial Bank PLC
Rs 24 Million 60 equal monthly instalments Primary mortgage bond for 24Mn over the two LP Gas Tanks 24 15.6
Corporate guarantee of Royal Porcelain (Pvt) Ltd 24
Commercial Bank PLC
Rs 3.0 Bn 8 years-(first 48 monthly instalment of Rs 20Mn each and subsequent 48 monthly instalments of Rs 42.5Mn each
Tripate agreement between the company /custodian company and bank over a portfolio of 23,009,036 shares of Lanka Ceramic PLC and 7,545,422 shares of LB Finance PLC (Market value as at 15/09/2014 -Rs 3,905 Mn)
3,000 2,920
Commercial Bank PLC
Rs. 260Mn 60 equal monthly instalments Primary mortgage bond over Land and Building at No 20, R.A.De Mel Mawatha, Colombo 03.
260 208
Hatton National Bank PLC
Rs. 100Mn 59 equal monthly instalments Registered primary concurrent mortgage bond of Rs 650Mn - (HSBC 500Mn/HNB 150Mn ) over factory premises at Eheliyagoda to be executed.
100 39.49
Hatton National Bank PLC
Rs. 50Mn 59 monthly instalments Primary Registered concurrent mortgage bond of Rs 650Mn - (HSBC 500Mn/HNB 150Mn) over factory premises at Eheliyagoda to be executed.
50 45.83
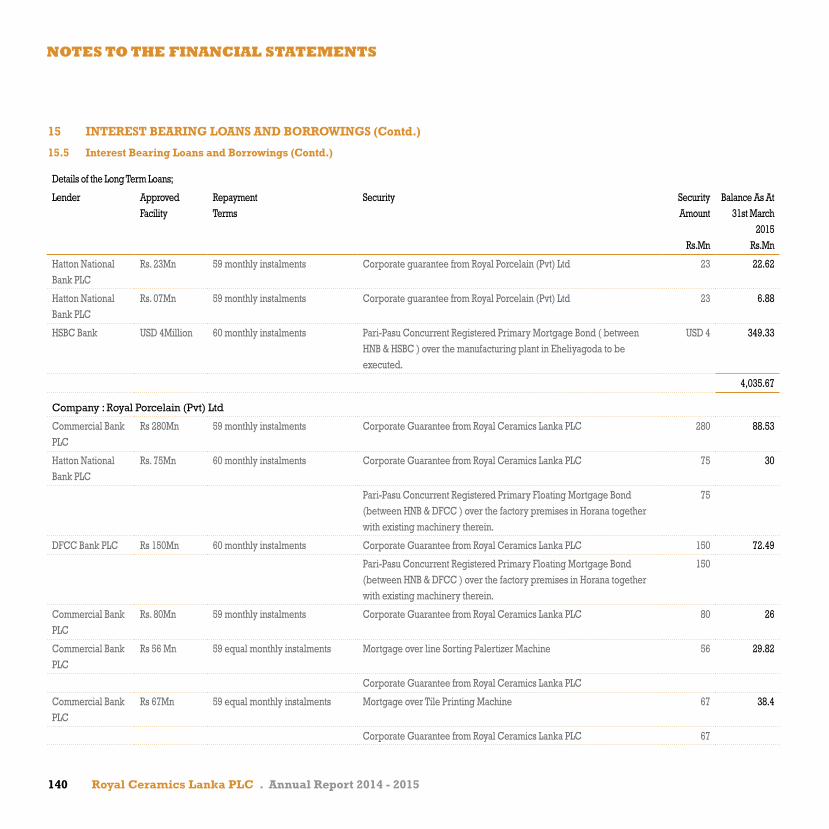
140 Royal Ceramics Lanka PLC . Annual Report 2014 - 2015
nOTES TO THE FInAnCIAL STATEMEnTS
Details of the Long Term Loans;
Lender ApprovedFacility
RepaymentTerms
Security Security Amount
Rs.Mn
Balance As At31st March
2015Rs.Mn
Hatton National Bank PLC
Rs. 23Mn 59 monthly instalments Corporate guarantee from Royal Porcelain (Pvt) Ltd 23 22.62
Hatton National Bank PLC
Rs. 07Mn 59 monthly instalments Corporate guarantee from Royal Porcelain (Pvt) Ltd 23 6.88
HSBC Bank USD 4Million 60 monthly instalments Pari-Pasu Concurrent Registered Primary Mortgage Bond ( between HNB & HSBC ) over the manufacturing plant in Eheliyagoda to be executed.
USD 4 349.33
4,035.67
Company : Royal Porcelain (Pvt) Ltd
Commercial Bank PLC
Rs 280Mn 59 monthly instalments Corporate Guarantee from Royal Ceramics Lanka PLC 280 88.53
Hatton National Bank PLC
Rs. 75Mn 60 monthly instalments Corporate Guarantee from Royal Ceramics Lanka PLC 75 30
Pari-Pasu Concurrent Registered Primary Floating Mortgage Bond (between HNB & DFCC ) over the factory premises in Horana together with existing machinery therein.
75
DFCC Bank PLC Rs 150Mn 60 monthly instalments Corporate Guarantee from Royal Ceramics Lanka PLC 150 72.49
Pari-Pasu Concurrent Registered Primary Floating Mortgage Bond (between HNB & DFCC ) over the factory premises in Horana together with existing machinery therein.
150
Commercial Bank PLC
Rs. 80Mn 59 monthly instalments Corporate Guarantee from Royal Ceramics Lanka PLC 80 26
Commercial Bank PLC
Rs 56 Mn 59 equal monthly instalments Mortgage over line Sorting Palertizer Machine 56 29.82
Corporate Guarantee from Royal Ceramics Lanka PLC
Commercial Bank PLC
Rs 67Mn 59 equal monthly instalments Mortgage over Tile Printing Machine 67 38.4
Corporate Guarantee from Royal Ceramics Lanka PLC 67
15 INTEREST BEARINg LOANS AND BORROWINgS (Contd.)
15.5 Interest Bearing Loans and Borrowings (Contd.)

141
Details of the Long Term Loans;
Lender ApprovedFacility
RepaymentTerms
Security Security Amount
Rs.Mn
Balance As At31st March
2015Rs.Mn
Commercial Bank PLC
Rs.48Mn 60 equal monthly instalments Mortgage over Glazed Polishing Line 48 38.4
Corporate Guarantee from Royal Ceramics Lanka PLC 48
Commercial Bank PLC
Rs 67Mn 60 equal monthly instalments Mortgage over Digital Ceramic Printing Machine 67 55.85
Corporate Guarantee from Royal Ceramics Lanka PLC 67
Commercial Bank PLC
Rs 200Mn 60 equal monthly instalments Mortgage over warehouse premises at Meegoda owned by Rocell Bathware Ltd
200 163.15
Commercial Bank PLC
Rs 48.56Mn 60 equal monthly instalments Mortgage over 4 units 4 wheel Forklifts and 4 units reach trucks 48.6 38.84
Commercial Bank PLC
Rs 53Mn 60 equal monthly instalments commencing from March 2014
Mortgage over the Nano coating line , Unloading Polishing Machine, Batching and mill Feeding Machine and Air Compressor
53 41.52
Corporate Guarantee from Royal Ceramics Lanka PLC 53
Commercial Bank PLC
Rs 37Mn 59 monthly instalments Primary Mortgage over the Automatic easy Line Sorting Line 37 33.36
Corporate Guarantee from Royal Ceramics Lanka PLC 37
656.36
Company : Rocell Bathware Limited
Hatton National Bank
Rs 160Mn 54 monthly instalment Primary Mortgage bond for Rs 250Mn over leasehold land and building and machinery (excluding Unimack) at Templeburg Industrial Estate, Panagoda to be executed.
160 124.44
Corporate guarantee from Royal Ceremics Lanka PLC 160
Hatton National Bank
Rs 70 Mn 54 monthly instalment Primary Mortgage bond for Rs 250Mn over leasehold land and building and machinery (excluding Unimack) at Templeburg Industrial Estate, Panagoda to be executed.
70 60.26
Corporate guarantee from Royal Ceremics Lanka PLC 70
Hatton National Bank
Rs 20 Mn 60 equal monthly instalments Corporate guarantee from Royal Ceremics Lanka PLC 20 9.3
194

142 Royal Ceramics Lanka PLC . Annual Report 2014 - 2015
Details of the Long Term Loans;
Lender ApprovedFacility
RepaymentTerms
Security Security Amount
Rs.Mn
Balance As At31st March
2015Rs.Mn
Company : Ever Paint and Chemical Industries
Commercial Bank PLC
RS 100Mn 59 monthly instalment Primary concurrent Mortgage bond over company factory premise at Hanwella, stocks in trade and assignment over book debts and mortgage over movable machinery equipment,furniture fittings at Malabe
100 65.285
Corporate guarantee from Royal Ceremics Lanka PLC 100
65.285
Lanka Ceramic PLC
Hatton National Bank PLC
500Mn 08 annual instalments Mortgage for Rs, 500 Mn over Lanka Walltiles PLC shares 500 370
370
Company : Lanka Walltiles PLC
Hatton National Bank PLC
300Mn 60 monthly instalments Primary mortgage bond for Rs. 390 million over the project assets comprising land, building and machinery at Meepe.
300 165
Hatton National Bank PLC
USD 1.8Mn 60 monthly instalments Secondary mortgage bond for USD 1.8 million over the project assets comprising land, building and machinery at Meepe.
USD 1.8 173.802
Commercial Bank of Ceylon PLC
200Mn 60 monthly instalments Primary mortgage bond for Rs.200 million over the property situated at 215, Nawala Road, Colombo 5
200 55.95
Commercial Bank of Ceylon PLC
80Mn 60 monthly instalments Primary Mortgage bond for Rs.80Mn over the ceramic printer 80 58.655
DFCC Bank 200Mn 60 monthly instalments Primary mortgage over movable machinery at Meepe 200 110
563.407
Company : Lanka Tiles PLC
DFCC Bank 150Mn 48 monthly instalments A primary mortgage over land, building and plant and machinery of Lanka Tiles PLC at Ranala amounting to Rs.300 million
97.5
DFCC Bank 165Mn 48 monthly instalments A primary mortgage over land, building and plant and machinery of Lanka Tiles PLC at Ranala amounting to Rs.300 million
300 100.179
nOTES TO THE FInAnCIAL STATEMEnTS
15 INTEREST BEARINg LOANS AND BORROWINgS (Contd.)
15.5 Interest Bearing Loans and Borrowings (Contd.)
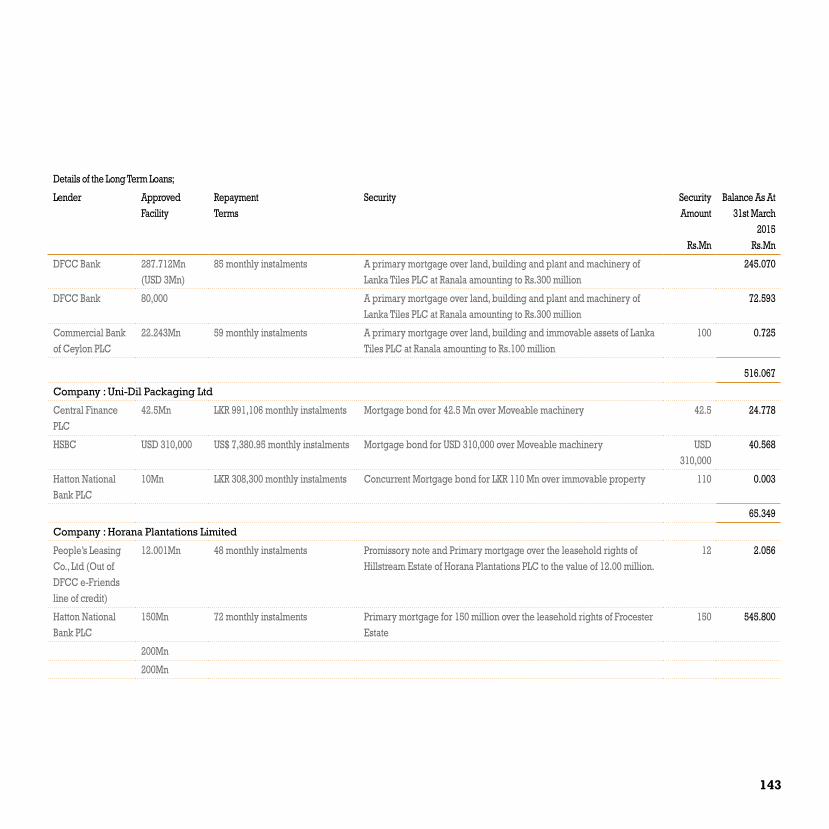
143
Details of the Long Term Loans;
Lender ApprovedFacility
RepaymentTerms
Security Security Amount
Rs.Mn
Balance As At31st March
2015Rs.Mn
DFCC Bank 287.712Mn (USD 3Mn)
85 monthly instalments A primary mortgage over land, building and plant and machinery of Lanka Tiles PLC at Ranala amounting to Rs.300 million
245.070
DFCC Bank 80,000 A primary mortgage over land, building and plant and machinery of Lanka Tiles PLC at Ranala amounting to Rs.300 million
72.593
Commercial Bank of Ceylon PLC
22.243Mn 59 monthly instalments A primary mortgage over land, building and immovable assets of Lanka Tiles PLC at Ranala amounting to Rs.100 million
100 0.725
516.067
Company : Uni-Dil Packaging Ltd
Central Finance PLC
42.5Mn LKR 991,106 monthly instalments Mortgage bond for 42.5 Mn over Moveable machinery 42.5 24.778
HSBC USD 310,000 US$ 7,380.95 monthly instalments Mortgage bond for USD 310,000 over Moveable machinery USD 310,000
40.568
Hatton National Bank PLC
10Mn LKR 308,300 monthly instalments Concurrent Mortgage bond for LKR 110 Mn over immovable property 110 0.003
65.349
Company : Horana Plantations Limited
People’s Leasing Co., Ltd (Out of DFCC e-Friends line of credit)
12.001Mn 48 monthly instalments Promissory note and Primary mortgage over the leasehold rights of Hillstream Estate of Horana Plantations PLC to the value of 12.00 million.
12 2.056
Hatton National Bank PLC
150Mn 72 monthly instalments Primary mortgage for 150 million over the leasehold rights of Frocester Estate
150 545.800
200Mn
200Mn

144 Royal Ceramics Lanka PLC . Annual Report 2014 - 2015
nOTES TO THE FInAnCIAL STATEMEnTS
Details of the Long Term Loans;
Lender ApprovedFacility
RepaymentTerms
Security Security Amount
Rs.Mn
Balance As At31st March
2015Rs.Mn
Indian Bank 75Mn 54 monthly instalments Primary mortgage over leasehold rights of Tillicoultry Estate 42
Hatton National Bank PLC
100Mn Primary mortgage over leasehold rights of Alton, Bambarakelly,Eildon Hall and Gouravilla
100 100
689.856
Company : Swisstek (Ceylon) PLC
Bank of Ceylon 25,817 58 monthly installments Mortgage over immovable property at Balummahara, Imbulgoda 8.202
8.202
Company : Swisstek Aluminium Limited
DFCC Bank 290Mn 78 monthly installments Mortgage over land, building, plant & machinery stocks & book debts 159.872
50Mn 60 monthly installments 32.850
10Mn 60 monthly installments 9.511
202.233
Company: Vallibel Plantation Management Limited
Commercial Bank of Ceylon PLC
144.79Mn 60 monthly installments 12,750,000 shares of Horana Plantation PLC 113.59
113.59
Total Long Term Loans - Group 7,480.019
15 INTEREST BEARINg LOANS AND BORROWINgS (Contd.)
15.5 Interest Bearing Loans and Borrowings (Contd.)

145
16 RETIREMENT BENEFIT OBLIgATIONS Company group 2015 2014 2015 2014 Rs. Rs. Rs. Rs.
At the beginning of the year 151,061,887 124,132,009 883,354,555 157,272,531
Interest cost 15,106,189 12,413,201 88,786,907 80,092,253
Current Service Cost 13,467,340 12,204,414 69,407,017 64,022,265
Benefits Paid (5,136,647) (3,303,378) (79,202,573) (86,088,691)
Benefits Payable (3,303,378) (70,170) (4,390,691) (313,040)
Acturial (gain)/loss 488,076 5,685,811 5,413,130 101,635,437
On acquisition of Subsidiary - - - 566,733,800
At the end of the year 171,683,467 151,061,887 963,368,345 883,354,555
16.1 Maturity Profile of the Defined benefit obligation
Company 2015 2014 Rs. Rs.
Future Working Life Time
Within the next 12 months 43,924,466 37,430,859
Between 1-2 Years 34,713,826 34,767,041
Between 2-5 Years 40,393,018 35,904,385
Between 5-10 Years 36,379,444 29,237,919
Beyond 5-10 Years 16,272,713 13,721,683
Total 171,683,467 151,061,887
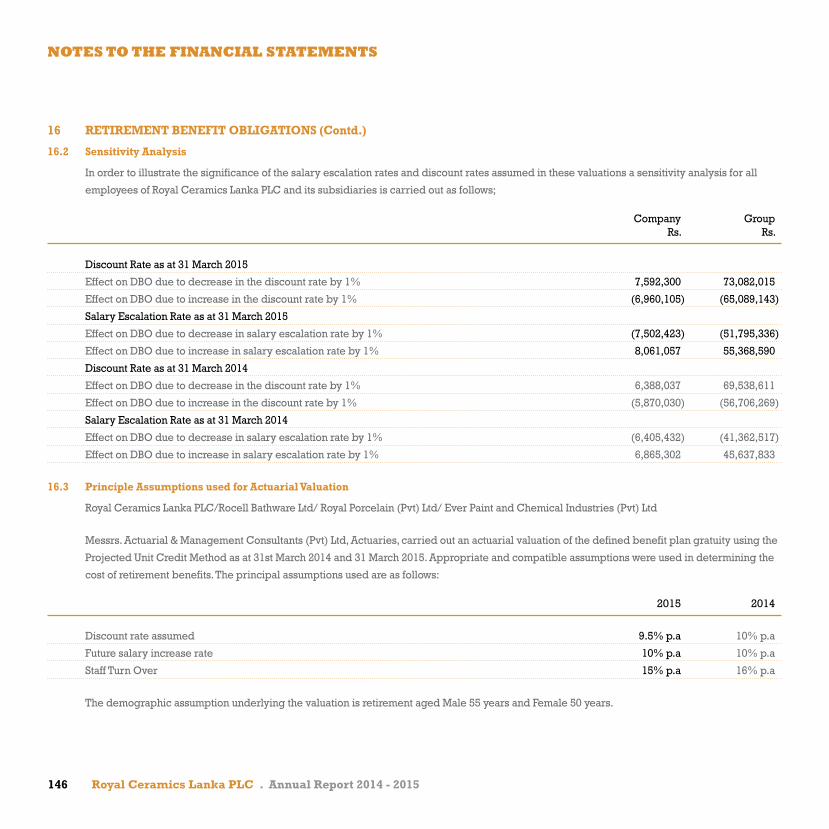
146 Royal Ceramics Lanka PLC . Annual Report 2014 - 2015
16 RETIREMENT BENEFIT OBLIgATIONS (Contd.)
16.2 Sensitivity Analysis
In order to illustrate the significance of the salary escalation rates and discount rates assumed in these valuations a sensitivity analysis for all
employees of Royal Ceramics Lanka PLC and its subsidiaries is carried out as follows;
Company Group Rs. Rs.
Discount Rate as at 31 March 2015
Effect on DBO due to decrease in the discount rate by 1% 7,592,300 73,082,015
Effect on DBO due to increase in the discount rate by 1% (6,960,105) (65,089,143)
Salary Escalation Rate as at 31 March 2015
Effect on DBO due to decrease in salary escalation rate by 1% (7,502,423) (51,795,336)
Effect on DBO due to increase in salary escalation rate by 1% 8,061,057 55,368,590
Discount Rate as at 31 March 2014
Effect on DBO due to decrease in the discount rate by 1% 6,388,037 69,538,611
Effect on DBO due to increase in the discount rate by 1% (5,870,030) (56,706,269)
Salary Escalation Rate as at 31 March 2014
Effect on DBO due to decrease in salary escalation rate by 1% (6,405,432) (41,362,517)
Effect on DBO due to increase in salary escalation rate by 1% 6,865,302 45,637,833
16.3 Principle Assumptions used for Actuarial Valuation
Royal Ceramics Lanka PLC/Rocell Bathware Ltd/ Royal Porcelain (Pvt) Ltd/ Ever Paint and Chemical Industries (Pvt) Ltd
Messrs. Actuarial & Management Consultants (Pvt) Ltd, Actuaries, carried out an actuarial valuation of the defined benefit plan gratuity using the
Projected Unit Credit Method as at 31st March 2014 and 31 March 2015. Appropriate and compatible assumptions were used in determining the
cost of retirement benefits. The principal assumptions used are as follows:
2015 2014
Discount rate assumed 9.5% p.a 10% p.a
Future salary increase rate 10% p.a 10% p.a
Staff Turn Over 15% p.a 16% p.a
The demographic assumption underlying the valuation is retirement aged Male 55 years and Female 50 years.
nOTES TO THE FInAnCIAL STATEMEnTS

147
Lanka Ceramic PLC
Messrs. Actuarial and Management Consultants (Pvt) Ltd., actuaries carried out an actuarial valuation for Lanka Ceramic PLC of the defined
benefit plan gratuity as at 31 March 2014.
The principal assumptions used are as follows:
2015 2014
Discount rate (per annum) 10.0% 10.5%
Future salary increase rate (per annum) - Executives 10.0% 10.0%
- Non Executives 5.0% 5.0%
Retirement Age 55 years 55 years
Lanka Walltiles PLC
The defined benefit liability as of 31 March 2014 and 31 March 2015 was actuarially valued by M/s Piyal S. Goonetilleke and Associates qualified
actuary.
The principal assumptions underlying the valuation are as follows;
2015 2014
Discount rate (per annum) 10.1% 10.5%
Future salary increase rate - Executives 12.8% 12.9%
- Non Executives 11.0% 11.1%
Retirement Age 55 Years 55 Years

148 Royal Ceramics Lanka PLC . Annual Report 2014 - 2015
nOTES TO THE FInAnCIAL STATEMEnTS
16 RETIREMENT BENEFIT OBLIgATIONS (Contd.)
16.3 Principle Assumptions used for Actuarial Valuation (Contd.)
Lanka Tiles PLC
The defined benefit liability of Lanka Tiles PLC was actuarially valued by M/s Piyal S Goonathilake and Associates qualified actuary on 31 March 2015
Principal Actuarial Assumptions are as follows
2015 2014
Discount rate 10.14% 10.3%
Future salary increase rate - Executives 13.65% 11.0%
- Non Executives 8% 8.1%
In addition to above, demographic assumptions such as mortality, withdrawal disability and retirement age were considered for the acturial valuation. GA 1983 mortality table issued by the Society of Actuaries USA was taken as the base for the valuation.
Horana Plantations PLC
An acturial valuation of the retirement benefit obligation was carried out as at 31st March 2015 by Acturial and Management Consultants (Pvt) Ltd.
The valuation method used by the actuary to value the benefit is the “projected Unit Credit Method”.
Principal Actuarial Assumptions are as follows
2015 2014
Rate of interest 10.50% 10.5% per annumRate of future salary increase
Workers 15% 16.0% every two years beyond
Staff 12.50% 12.5% per annum
Head Office Staff 8.00% 8.00% per annum beyond
Retirement age
Workers 60 60 years
Staff 60 60 years
Head Office Staff 55 55 yearsDaily wage rate
Tea Rs.450 Rs.450
Rubber Rs.450 Rs.450

149
Uni-Dil Packaging Ltd and Uni-Dil Paper Sacks (Pvt) Ltd
An acturial valuation of the retirement benefit obligation was carried out as at 31st March 2015 by M/s Acturial and Management Consultants
(Pvt) Ltd.
The valuation method used by the actuaries to value the benefit is the “projected Unit Credit Method”.
Principal Actuarial Assumptions are as follows
2015 2014
Discount rate 10% 10.0%
Future salary increase rate 10% 10%
Staff turnover 8% 8%
Retirement age (Years) 55 55
Swisstek (Ceylon) PLC
Gratuity liability based on the actuarial valuation carried out by Messrs. Piyal S Gunathilake & Associates on 31 March 2015.
Principal Actuarial Assumptions are as follows
2015 2014
Discount rate 9.80% 10.0%
Future salary increase rate 14% 12%
Swisstek Aluminium Limited
Gratuity liability based on the actuarial valuation carried out by Messrs. Piyal S Gunathilake & Associates on 31 March 2015.
Principal Actuarial Assumptions are as follows
2015 2014
Discount rate 9.34% 10.96%
Future Salary increase rate 10% 12%
Retirement age (Years) 55 55
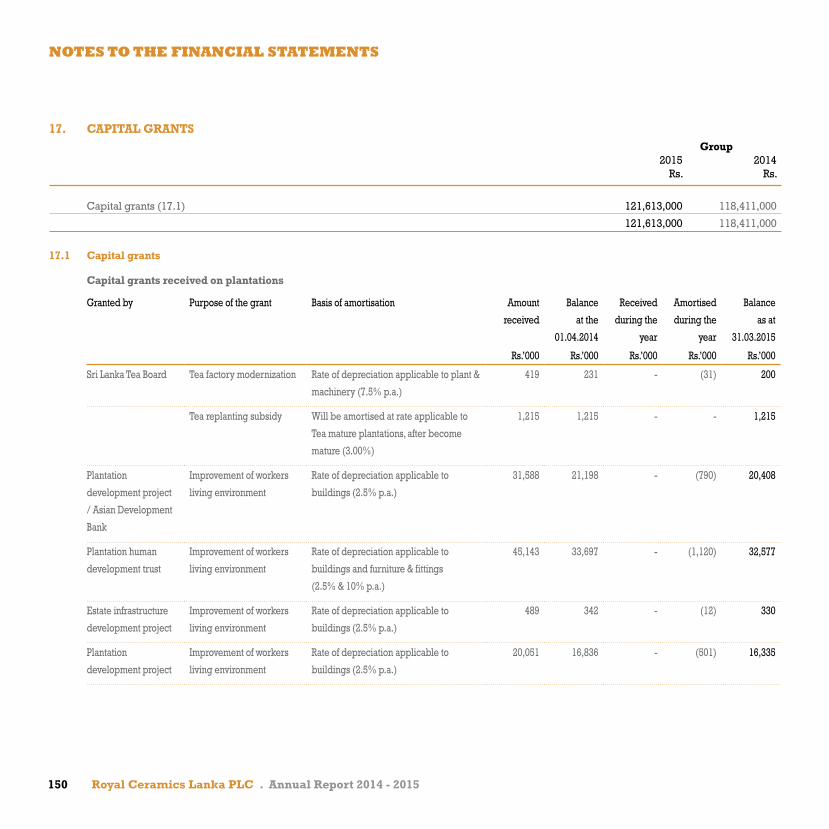
150 Royal Ceramics Lanka PLC . Annual Report 2014 - 2015
17. CAPITAL gRANTS group 2015 2014 Rs. Rs.
Capital grants (17.1) 121,613,000 118,411,000
121,613,000 118,411,000
17.1 Capital grants
Capital grants received on plantations
Granted by Purpose of the grant Basis of amortisation Amount
received
Balance
at the
01.04.2014
Received
during the
year
Amortised
during the
year
Balance
as at
31.03.2015
Rs.’000 Rs.’000 Rs.’000 Rs.’000 Rs.’000
Sri Lanka Tea Board Tea factory modernization Rate of depreciation applicable to plant &
machinery (7.5% p.a.)
419 231 - (31) 200
Tea replanting subsidy Will be amortised at rate applicable to
Tea mature plantations, after become
mature (3.00%)
1,215 1,215 - - 1,215
Plantation
development project
/ Asian Development
Bank
Improvement of workers
living environment
Rate of depreciation applicable to
buildings (2.5% p.a.)
31,588 21,198 - (790) 20,408
Plantation human
development trust
Improvement of workers
living environment
Rate of depreciation applicable to
buildings and furniture & fittings
(2.5% & 10% p.a.)
45,143 33,697 - (1,120) 32,577
Estate infrastructure
development project
Improvement of workers
living environment
Rate of depreciation applicable to
buildings (2.5% p.a.)
489 342 - (12) 330
Plantation
development project
Improvement of workers
living environment
Rate of depreciation applicable to
buildings (2.5% p.a.)
20,051 16,836 - (501) 16,335
nOTES TO THE FInAnCIAL STATEMEnTS
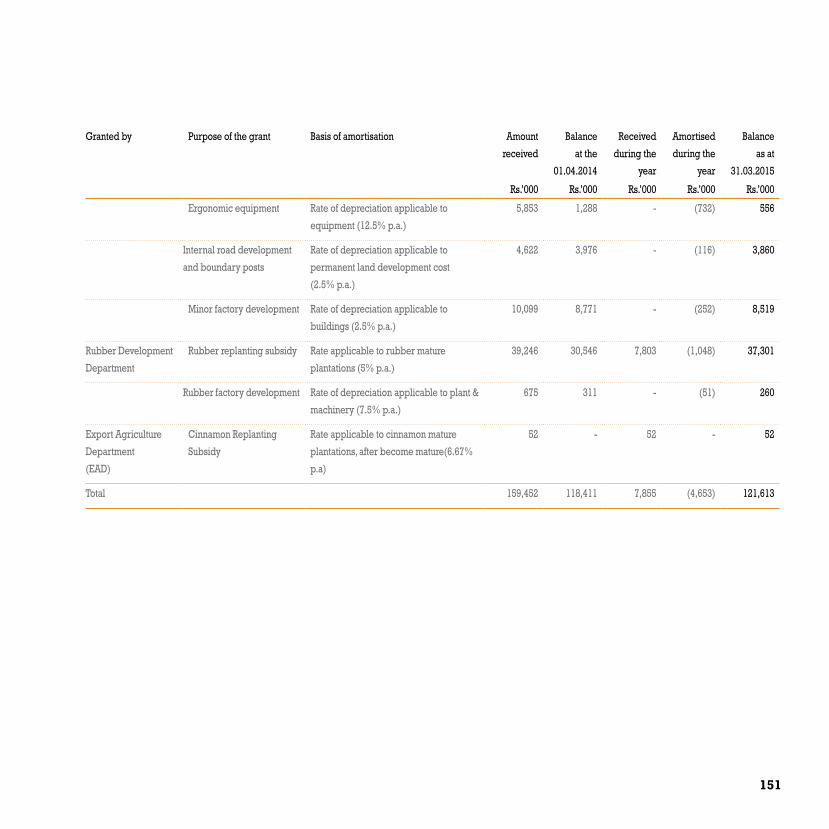
151
Granted by Purpose of the grant Basis of amortisation Amount
received
Balance
at the
01.04.2014
Received
during the
year
Amortised
during the
year
Balance
as at
31.03.2015
Rs.’000 Rs.’000 Rs.’000 Rs.’000 Rs.’000
Ergonomic equipment Rate of depreciation applicable to
equipment (12.5% p.a.)
5,853 1,288 - (732) 556
Internal road development
and boundary posts
Rate of depreciation applicable to
permanent land development cost
(2.5% p.a.)
4,622 3,976 - (116) 3,860
Minor factory development Rate of depreciation applicable to
buildings (2.5% p.a.)
10,099 8,771 - (252) 8,519
Rubber Development
Department
Rubber replanting subsidy Rate applicable to rubber mature
plantations (5% p.a.)
39,246 30,546 7,803 (1,048) 37,301
Rubber factory development Rate of depreciation applicable to plant &
machinery (7.5% p.a.)
675 311 - (51) 260
Export Agriculture
Department
(EAD)
Cinnamon Replanting
Subsidy
Rate applicable to cinnamon mature
plantations, after become mature(6.67%
p.a)
52 - 52 - 52
Total 159,452 118,411 7,855 (4,653) 121,613

152 Royal Ceramics Lanka PLC . Annual Report 2014 - 2015
nOTES TO THE FInAnCIAL STATEMEnTS
18. TRADE AND OTHER PAYABLES Company group 2015 2014 2015 2014 Rs. Rs. Rs. Rs.
Trade Creditors - Others 102,813,788 104,015,615 982,171,198 1,066,353,173
Payables - Other 161,191,575 156,546,563 212,957,384 219,616,173
Sundry Creditors Including Accrued Expenses 92,185,768 80,559,650 899,369,793 747,028,074
Payable to Related Parties (Note 18.1) 1,036,392,262 804,744,818 - -
1,392,583,393 1,145,866,646 2,094,498,375 2,032,997,420
18.1 Payable to Related Parties
Royal Porcelain (Pvt) Ltd 587,885,479 452,631,428
Rocell Bathware Ltd 448,506,783 346,956,922
Ever Paint & Chemical Industries (Pvt) Ltd - 5,156,468
1,036,392,262 804,744,818
19 OTHER CURRENT LIABILITIES Company group 2015 2014 2015 2014 Rs. Rs. Rs. Rs.
Provisions 46,083,470 49,138,252 68,741,982 75,481,298
Advances 426,662,772 166,081,482 427,863,714 174,293,582
Other 34,596,621 47,319,761 85,536,904 119,462,555
507,342,863 262,539,495 582,142,600 369,237,435
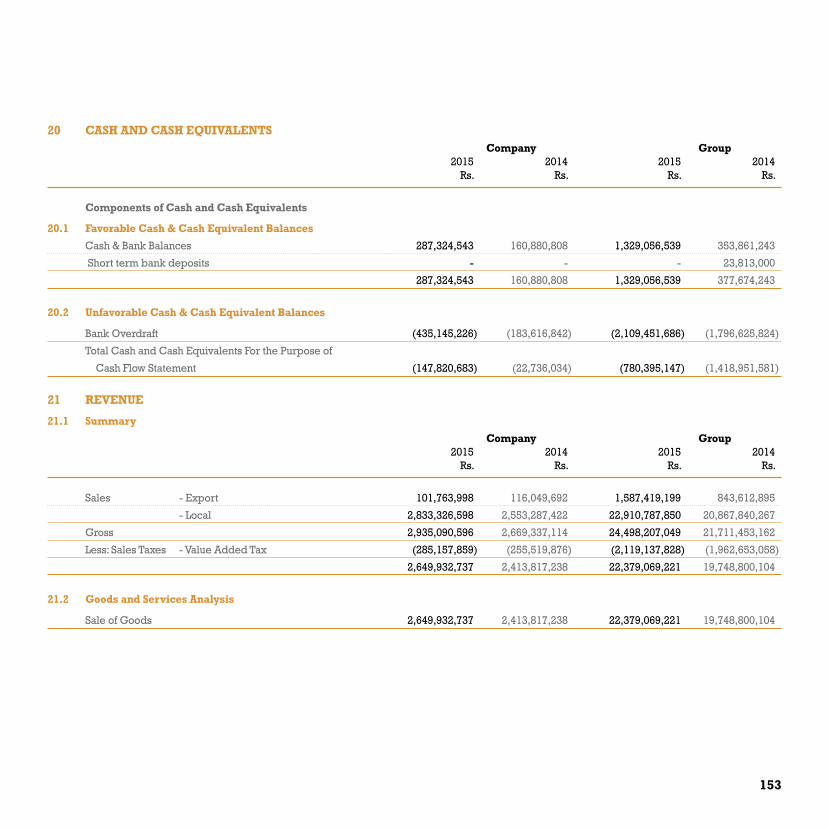
153
20 CASH AND CASH EQUIVALENTS Company group 2015 2014 2015 2014 Rs. Rs. Rs. Rs.
Components of Cash and Cash Equivalents
20.1 Favorable Cash & Cash Equivalent Balances
Cash & Bank Balances 287,324,543 160,880,808 1,329,056,539 353,861,243
Short term bank deposits - - - 23,813,000
287,324,543 160,880,808 1,329,056,539 377,674,243
20.2 Unfavorable Cash & Cash Equivalent Balances
Bank Overdraft (435,145,226) (183,616,842) (2,109,451,686) (1,796,625,824)
Total Cash and Cash Equivalents For the Purpose of
Cash Flow Statement (147,820,683) (22,736,034) (780,395,147) (1,418,951,581)
21 REVENUE
21.1 Summary
Company group 2015 2014 2015 2014 Rs. Rs. Rs. Rs.
Sales - Export 101,763,998 116,049,692 1,587,419,199 843,612,895
- Local 2,833,326,598 2,553,287,422 22,910,787,850 20,867,840,267
Gross 2,935,090,596 2,669,337,114 24,498,207,049 21,711,453,162
Less: Sales Taxes - Value Added Tax (285,157,859) (255,519,876) (2,119,137,828) (1,962,653,058)
2,649,932,737 2,413,817,238 22,379,069,221 19,748,800,104
21.2 goods and Services Analysis
Sale of Goods 2,649,932,737 2,413,817,238 22,379,069,221 19,748,800,104

154 Royal Ceramics Lanka PLC . Annual Report 2014 - 2015
22. OTHER OPERATINg INCOME AND EXPENSES
22.1 Other Operating Income
Company group
2015 2014 2015 2014
Rs. Rs. Rs. Rs.
Income from Investments with Related Parties - Non Quoted 1,093,353,926 1,384,433,286 - -
Dividends on long-term & current investments 472,784 1,835,528 472,784 1,835,528
Net Profit on financial Assets at fair value through profit or loss - 31,302,483 - 31,302,483
Service Fee Income - Related Parties 999,996 999,996 - -
Technical fee - Related Parties 137,774,518 - - -
Sales Commission - Related Party 6,505,618 5,440,482 - -
Rent Income - Related Parties 8,632,618 5,872,500 - -
Rent Income - Others 20,000 1,552,233 26,988,000 38,302,233
Profit/(Loss) on Disposal of Property, Plant & Equipment 1,973,071 - 35,452,552 49,394,612
Sundry Income 5,645,648 2,464,503 120,480,629 76,942,820
Amortisation of capital and revenue grants - - 4,653,000 5,659,000
Reversal of debtors impairment - - - 1,246,000
Change in fair value of consumable biological assets - - 56,640,000 26,052,000
1,255,378,179 1,433,901,011 244,686,965 230,734,677
22.2 Other Operating Expenses
Net loss on financial Assets at fair value through profit or loss 8,393,707 - 8,393,707 -
Loss on Disposal of Short Term Investments - 24,286,617 - 24,286,617
8,393,707 24,286,617 8,393,707 24,286,617
nOTES TO THE FInAnCIAL STATEMEnTS
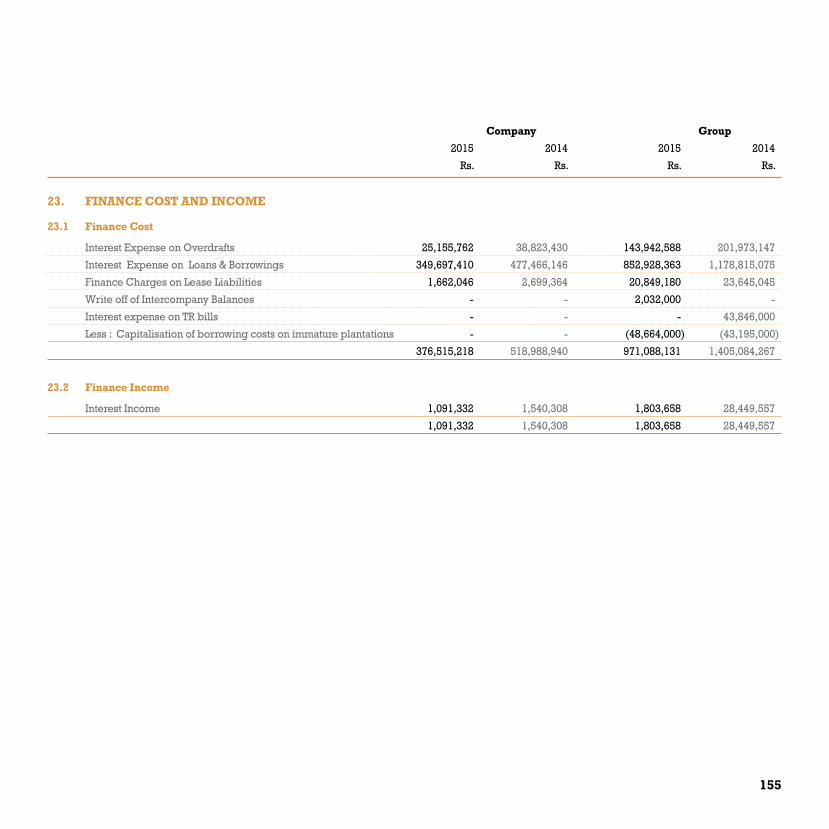
155
Company group
2015 2014 2015 2014
Rs. Rs. Rs. Rs.
23. FINANCE COST AND INCOME
23.1 Finance Cost
Interest Expense on Overdrafts 25,155,762 38,823,430 143,942,588 201,973,147
Interest Expense on Loans & Borrowings 349,697,410 477,466,146 852,928,363 1,178,815,075
Finance Charges on Lease Liabilities 1,662,046 2,699,364 20,849,180 23,645,045
Write off of Intercompany Balances - - 2,032,000 -
Interest expense on TR bills - - - 43,846,000
Less : Capitalisation of borrowing costs on immature plantations - - (48,664,000) (43,195,000)
376,515,218 518,988,940 971,088,131 1,405,084,267
23.2 Finance Income
Interest Income 1,091,332 1,540,308 1,803,658 28,449,557
1,091,332 1,540,308 1,803,658 28,449,557

156 Royal Ceramics Lanka PLC . Annual Report 2014 - 2015
24. PROFIT/(LOSS) FROM OPERATINg ACTIVITIES Company group 2015 2014 2015 2014 Rs. Rs. Rs. Rs.
Stated after Charging /Crediting
Included in Cost of Sales
Depreciation 83,480,989 80,880,511 928,421,484 857,726,525
Employee Benefits including the following 256,911,094 249,007,803 2,754,225,280 2,604,202,679
- Defined Benefit Plan Costs - Gratuity 19,036,821 11,212,799 115,035,508 168,373,241
- Defined Contribution Plan Costs - EPF & ETF 18,784,321 16,960,265 210,306,307 202,517,289
Export duty rebate (2,100,904) (2,038,807) (8,662,402) (8,710,627)
Included in Administrative Expenses
Depreciation 33,377,195 22,992,864 64,466,318 37,733,235
Employee Benefits including the following 180,178,848 171,115,969 469,177,575 325,310,583
- Defined Benefit Plan Costs -Gratuity 4,057,477 9,186,746 28,142,477 33,814,646
- Defined Contribution Plan Costs - EPF & ETF 19,296,906 17,488,905 39,370,080 29,172,276
Auditors’ Fees and Expenses 1,200,000 956,250 8,446,280 7,301,005
Loss on translation of foreign currency 9,553,301 12,838,702 14,919,199 25,052,415
Amortisation of intangible assets 7,403,559 7,403,559 7,403,559 7,403,559
Included in Selling and Distribution Costs
Depreciation 102,191,535 68,764,759 166,004,523 104,768,485
Damage Stocks net of insurance claims received 10,387,189 682,108 33,473,034 21,736,499
Sales Promotion 138,609,298 103,448,122 339,742,258 227,984,007
Employee Benefits including the following 238,634,246 194,803,148 427,900,894 328,550,726
- Defined Benefit Plan Costs -Gratuity 5,479,231 4,218,070 5,479,231 4,272,020
- Defined Contribution Plan Costs - EPF & ETF 20,193,390 16,172,030 28,538,302 23,058,211
nOTES TO THE FInAnCIAL STATEMEnTS

157
25 INCOME TAX EXPENSE
25.1 The major components of income tax expense
Company group
For the years ended 31 March 2015 2014 2015 2014 Rs. Rs. Rs. Rs.
Statement of Profit or Loss
Current Income Tax
Current Income Tax charge - - 348,006,350 227,305,150
Dividend Tax - 279,000 29,257,497 32,581,192
Under/(Over) Provision of current taxes in respect of prior years - - (91,270,455) 1,373,891
Share of Associate Company Income Tax - - 252,839,454 139,257,319
- 279,000 538,832,846 400,517,552
Deferred Income Tax
Deferred Taxation Charge/(Reversal) (Note 25.5) (143,881,333) (186,059,191) (43,828,621) (48,091,021)
Deferred Taxation on Un distributable Associate Profit - - 30,703,810 -
Share of Associate Company Deferred Tax - - 50,966,346 (33,895,219)
Income tax expense reported in the statement of profit or loss (143,881,333) (185,780,191) 576,674,381 318,531,312
Statement of Changes in Equity
Deferred Income Tax related to items charged or
credited directly to equity :
Deferred Tax effect on Employee Benefits (133,662) (1,546,541) (3,416,741) (15,190,923)
Net gain on revaluation of buildings - - - -
Income tax expense reported in equity (133,662) (1,546,541) (3,416,741) (15,190,923)

158 Royal Ceramics Lanka PLC . Annual Report 2014 - 2015
25.2 A reconciliation between tax expense and the product of accounting profit multiplied by the statutory tax rate is as follows :
Company group 2015 2014 2015 2014 Rs. Rs. Rs. Rs.
Accounting Profit ( Profit before Taxation) 635,642,463 668,861,161 3,643,581,631 2,293,814,155
Share of results of associates - - (830,546,236) (388,598,646)
635,642,463 668,861,161 2,813,035,395 1,905,215,509
Exempt Profit (1,093,826,710) (1,386,268,814) (2,437,963,923) (829,180,490)
Non deductible expenses 375,077,285 336,609,672 1,784,217,167 1,345,871,930
Deductible expenses (424,353,418) (431,904,557) (2,409,463,694) (2,116,596,613)
Tax losses utilized - - (181,219,090) (56,789,000)
Interest Income - - - -
Rent Income - - - -
Taxable Income (507,460,380) (812,702,538) (431,394,144) 248,521,336
Income Tax on Profit of the local sales @ 28% - - 332,681,956 217,307,069
Income Tax on Profit of the export sales @ 12% - - 15,324,394 9,998,080
Dividend Tax @ 10% - 279,000 29,257,497 32,581,192
Deferred Taxation on Un distributable Associate Profit - - 30,703,810 -
Current and Deferred Tax share of Associates - - 303,805,800 105,362,100
Charge/(Reversal) of Deferred Tax ( Note 25.5) (143,881,333) (186,059,191) (43,828,622) (48,091,021)
Adjustment of taxes in respect of prior years - - (91,270,455) 1,373,891
(143,881,333) (185,780,191) 576,674,380 318,531,311
nOTES TO THE FInAnCIAL STATEMEnTS

159
25.3 Deferred Tax Assets
Statement of Financial Position Company group 2015 2014 2015 2014 Rs. Rs. Rs. Rs.
At the beginning of the year 165,336,310 - 195,831,689 (3,211,728)
Transferred from Deferred Tax Liability - (22,269,422) (7,767,379)
On acquisition of Subsidiary - 22,369,000
Charge/(Reversal) for the year 143,881,333 186,059,191 173,546,333 173,642,303
Deferred Tax release on components of other comprehensive Income 133,662 1,546,541 90,662 3,032,114
At the end of the year 309,351,305 165,336,310 361,701,305 195,831,689
The closing net deffered tax liability relate to the following;
Capital allowances for tax purposes (252,382,278) (199,071,592) (303,876,278) (213,003,738)
Defined Benefit Obligation 47,016,479 41,088,833 49,085,479 52,324,358
Provision 740,000 145,000
Unutilised tax losses 514,717,104 323,319,069 615,752,104 356,366,069
309,351,305 165,336,310 361,701,305 195,831,689
25.4 Deferred Tax Liability
Statement of Financial Position group 2015 2014 Rs. Rs.
At the beginning of the year 604,138,639 491,105,166
Transferred from Deferred Tax asset (7,767,379)
Recognised in Profit or loss 160,421,540 125,398,282
Recognised in other comprehensive income (3,325,640) (12,364,809)
At the end of the year 753,546,160 604,138,639
The closing net deffered tax liability relate to the following;
Capital allowances for tax purposes 1,165,094,582 1,004,658,017
Defined Benefit Obligation (139,413,636) (120,601,378)
Unutilised tax losses (278,013,322) (254,982,000)
Deferred Taxation on Un distributable Associate Profit 30,703,810
Provisions (24,825,274) (24,936,000)
753,546,160 604,138,639

160 Royal Ceramics Lanka PLC . Annual Report 2014 - 2015
25.5 Statement of Profit or Loss
Company group 2015 2014 2015 2014 Rs. Rs. Rs. Rs.
Deferred tax expense/(reversal) arising from;
Capital allowances for tax purposes 53,310,686 54,408,864 249,848,869 282,973,537
Defined Benefit Obligation (5,793,984) (5,778,386) (10,775,393) (22,470,889)
Provision - - (483,740) 10,392,000
Unutilised tax losses (191,398,035) (234,689,669) (282,418,357) (318,985,669)
(143,881,333) (186,059,191) (43,828,621) (48,091,021)
Deferred Taxation on Un distributable Associate Profit - - 30,703,810 -
Share of Associate Company Deferred Tax - - 50,966,346 (33,895,219)
Total Deferred Tax Charge/(Reversal) for the year (143,881,333) (186,059,191) 37,841,535 (81,986,240)
Deferred tax has been computed at 28% for all standard rate companies and at 12% for export sale business other than Rocell Bathware Ltd
which has been computed at 15%
Royal Ceramics Distributors (Private) Limited which is a fully owned subsidiary of Royal Ceramics Lanka PLC has a tax loss that is available
indefinitely for offset against future taxable profit of the Company subject to the limit of 35% of taxable profit each year of assessment. A deferred
tax asset has not been recognized in respect of this tax loss as it is anticipated that the deferred tax asset will not realize in the foreseeable future.
nOTES TO THE FInAnCIAL STATEMEnTS

161
26. EARNINgS PER SHARE
26.1 Basic Earnings Per Share is calculated by dividing the net profit for the year attributable to ordinary shareholders of the company by the weighted average number of ordinary shares outstanding during the year.
26.2 The following reflects the income and share data used in the basic Earnings Per Share computation.
Company group 2015 2014 2015 2014 Rs. Rs. Rs. Rs.
Amount Used as the Numerator:Net Profit for the year attributable to equity holders of the parent 779,523,796 854,641,351 2,134,584,315 1,125,669,580 779,523,796 854,641,351 2,134,584,315 1,125,669,580
2015 2014 2015 2014 Number Number Number Number
Number of Ordinary Shares Used as the Denominator:Weighted Average number of Ordinary Shares in issueApplicable to basic Earnings Per Share 110,789,384 110,789,384 110,789,384 110,789,384
26.3 There were no potentially dilutive Ordinary Shares outstanding at any time during the year.
27. DIVIDEND PER SHARE
Company/group 2015 2014 Rs. Rs.
Final Dividends for 2013/14: 110,789,384 -1st Interim Dividends for 2014/15 221,578,768 2nd Interim Dividends for 2014/15 110,789,384 Total Gross Dividends 443,157,536 -
No of shares 110,789,384 110,789,384Total Dividend per Share 4.00 -
Proposed for approval at AGM (not recorded as liability as at 31 March 2015)
Equity dividend on ordinary shares
Final dividend for 2014/15 - Rs.2/- per share (2013/2014 Rs. 1/- per share) 221,578,768 110,789,384

162 Royal Ceramics Lanka PLC . Annual Report 2014 - 2015
Tiles &
Associated Items Sanitaryware
Paints and
Allied Products Plantation Packing Material Aluminium Products Finance Other Total Segments
Eliminations/
Adjustments Total
2015 2014 2015 2014 2015 2014 2015 2014 2015 2014 2015 2014 2015 2014 2015 2014 2015 2014 2015 2014 2015 2014
Rs. Rs. Rs. Rs. Rs. Rs. Rs. Rs. Rs. Rs. Rs. Rs. Rs. Rs. Rs. Rs. Rs. Rs. Rs. Rs. Rs. Rs.
Revenue
Sales to external
customers 14,824,351,788 13,946,860,321 1,353,789,249 1,124,666,917 96,191,319 106,654,144 2,164,859,000 2,069,471,000 2,286,461,214 1,967,088,413 1,525,986,652 1,180,893,000 - - 127,430,000 124,109,471 22,379,069,221 20,519,743,267 - - 22,379,069,221 19,748,800,104
Inter-Segment Sales - - - - 2,603,844 - - - 95,823,523 97,234,587 1,477,348 - - - 35,840,713 60,768,095 135,745,428 158,002,682 (135,745,428) (158,002,682) - -
Total Revenue 14,824,351,788 13,946,860,321 1,353,789,249 1,124,666,917 98,795,163 106,654,144 2,164,859,000 2,069,471,000 2,382,284,737 2,064,323,000 1,527,464,000 1,180,893,000 - - 163,270,713 184,877,566 22,514,814,649 20,677,745,949 (135,745,428) (158,002,682) 22,379,069,221 19,748,800,104
Results
Gross Profit 5,950,552,339 5,077,045,017 473,558,628 414,703,426 (1,613,449) 7,577,391 141,576,000 272,475,000 334,465,096 245,737,000 339,245,000 252,214,000 - - 70,246,000 68,594,135 7,308,029,614 6,338,345,969 - - 7,308,029,614 6,338,345,969
Other Income 69,204,298 106,502,194 307,157 592,575 2,729,683 428,063 69,493,000 29,085,000 63,942,827 54,187,000 2,776,000 4,006,000 - - 40,374,000 37,313,845 248,826,965 232,114,677 (4,140,000) (1,380,000) 244,686,965 230,734,677
Distribution Expenses (2,165,089,442) (1,827,516,669) (56,448,823) (33,680,932) (103,866,107) (60,024,075) - - (90,151,087) (78,172,000) (25,524,000) (40,899,000) - - (1,430,000) (1,659,419) (2,442,509,459) (2,041,952,094) - - (2,442,509,458) (2,041,952,095)
Administrative Expenses (989,882,610) (939,037,216) (25,370,917) (20,861,214) (9,440,214) (13,292,208) (87,406,000) (81,770,000) (76,187,805) (62,202,000) (90,536,000) (57,457,000) - - (44,810,000) (47,752,077) (1,323,633,545) (1,222,371,715) 4,140,000 1,380,000 (1,319,493,545) (1,220,991,716)
Other Operating
Expenses (8,393,707) (24,286,617) - - - - - - - - - - - - - - (8,393,707) (24,286,617) - - (8,393,707) (24,286,617)
Finance Costs (759,576,381) (1,074,989,068) (36,204,311) (51,832,407) (20,705,166) (23,234,621) (39,793,000) (58,644,000) (33,785,272) (44,661,000) (45,766,000) (87,141,000) - - (35,258,000) (64,582,171) (971,088,131) (1,405,084,267) - - (971,088,131) (1,405,084,267)
Finance Income 1,244,156 27,481,175 1,501 - - - - 315,000 - - - - - 558,000 653,382 1,803,658 28,449,557 - - 1,803,658 28,449,557
Share of Associate
Company's Profit - - - - - - - - - - - - 868,947,457 487,276,324 (38,401,222) (98,677,678) 830,546,236 388,598,646 - - 830,546,236 388,598,646
Net Profit before
Income Tax 2,098,058,653 1,345,198,818 355,843,236 308,921,447 (132,895,253) (88,545,450) 83,870,000 161,461,000 198,283,759 114,889,000 180,195,000 70,723,000 868,947,457 487,276,324 (8,721,222) (106,109,984) 3,643,581,631 2,293,814,155 - - 3,643,581,632 2,293,814,156
Income Tax Expense (131,798,466) (112,481,718) (16,695,227) (16,916,767) - - (24,576,000) (29,969,000) (25,096,581) (30,130,000) (9,392,000) - (299,848,956) (137,796,663) (9,305,844) 32,434,563 (516,713,074) (294,859,585) (59,961,307) (23,671,727) (576,674,381) (318,531,312)
Net Profit for the Year 1,966,260,187 1,232,717,100 339,148,009 292,004,680 (132,895,253) (88,545,450) 59,294,000 131,492,000 173,187,178 84,759,000 170,803,000 70,723,000 569,098,502 349,479,661 (18,027,066) (73,675,421) 3,126,868,558 1,998,954,569 (59,961,307) (23,671,727) 3,066,907,251 1,975,282,843
nOTES TO THE FInAnCIAL STATEMEnTS
28 SEgMENT INFORMATION
Primary Reporting Format - Business Segments
For management purposes, the group is organised into business units based on its products and services and has seven reportable segments ,as
follows:
- Tile & Associated Items - Paints - Packing Material - Finance
- Sanitary Ware - Plantation - Aluminium - Other
The following tables present revenue and profit and certain assets and liability information regarding the Company’s business segments:

163
Tiles &
Associated Items Sanitaryware
Paints and
Allied Products Plantation Packing Material Aluminium Products Finance Other Total Segments
Eliminations/
Adjustments Total
2015 2014 2015 2014 2015 2014 2015 2014 2015 2014 2015 2014 2015 2014 2015 2014 2015 2014 2015 2014 2015 2014
Rs. Rs. Rs. Rs. Rs. Rs. Rs. Rs. Rs. Rs. Rs. Rs. Rs. Rs. Rs. Rs. Rs. Rs. Rs. Rs. Rs. Rs.
Revenue
Sales to external
customers 14,824,351,788 13,946,860,321 1,353,789,249 1,124,666,917 96,191,319 106,654,144 2,164,859,000 2,069,471,000 2,286,461,214 1,967,088,413 1,525,986,652 1,180,893,000 - - 127,430,000 124,109,471 22,379,069,221 20,519,743,267 - - 22,379,069,221 19,748,800,104
Inter-Segment Sales - - - - 2,603,844 - - - 95,823,523 97,234,587 1,477,348 - - - 35,840,713 60,768,095 135,745,428 158,002,682 (135,745,428) (158,002,682) - -
Total Revenue 14,824,351,788 13,946,860,321 1,353,789,249 1,124,666,917 98,795,163 106,654,144 2,164,859,000 2,069,471,000 2,382,284,737 2,064,323,000 1,527,464,000 1,180,893,000 - - 163,270,713 184,877,566 22,514,814,649 20,677,745,949 (135,745,428) (158,002,682) 22,379,069,221 19,748,800,104
Results
Gross Profit 5,950,552,339 5,077,045,017 473,558,628 414,703,426 (1,613,449) 7,577,391 141,576,000 272,475,000 334,465,096 245,737,000 339,245,000 252,214,000 - - 70,246,000 68,594,135 7,308,029,614 6,338,345,969 - - 7,308,029,614 6,338,345,969
Other Income 69,204,298 106,502,194 307,157 592,575 2,729,683 428,063 69,493,000 29,085,000 63,942,827 54,187,000 2,776,000 4,006,000 - - 40,374,000 37,313,845 248,826,965 232,114,677 (4,140,000) (1,380,000) 244,686,965 230,734,677
Distribution Expenses (2,165,089,442) (1,827,516,669) (56,448,823) (33,680,932) (103,866,107) (60,024,075) - - (90,151,087) (78,172,000) (25,524,000) (40,899,000) - - (1,430,000) (1,659,419) (2,442,509,459) (2,041,952,094) - - (2,442,509,458) (2,041,952,095)
Administrative Expenses (989,882,610) (939,037,216) (25,370,917) (20,861,214) (9,440,214) (13,292,208) (87,406,000) (81,770,000) (76,187,805) (62,202,000) (90,536,000) (57,457,000) - - (44,810,000) (47,752,077) (1,323,633,545) (1,222,371,715) 4,140,000 1,380,000 (1,319,493,545) (1,220,991,716)
Other Operating
Expenses (8,393,707) (24,286,617) - - - - - - - - - - - - - - (8,393,707) (24,286,617) - - (8,393,707) (24,286,617)
Finance Costs (759,576,381) (1,074,989,068) (36,204,311) (51,832,407) (20,705,166) (23,234,621) (39,793,000) (58,644,000) (33,785,272) (44,661,000) (45,766,000) (87,141,000) - - (35,258,000) (64,582,171) (971,088,131) (1,405,084,267) - - (971,088,131) (1,405,084,267)
Finance Income 1,244,156 27,481,175 1,501 - - - - 315,000 - - - - - 558,000 653,382 1,803,658 28,449,557 - - 1,803,658 28,449,557
Share of Associate
Company's Profit - - - - - - - - - - - - 868,947,457 487,276,324 (38,401,222) (98,677,678) 830,546,236 388,598,646 - - 830,546,236 388,598,646
Net Profit before
Income Tax 2,098,058,653 1,345,198,818 355,843,236 308,921,447 (132,895,253) (88,545,450) 83,870,000 161,461,000 198,283,759 114,889,000 180,195,000 70,723,000 868,947,457 487,276,324 (8,721,222) (106,109,984) 3,643,581,631 2,293,814,155 - - 3,643,581,632 2,293,814,156
Income Tax Expense (131,798,466) (112,481,718) (16,695,227) (16,916,767) - - (24,576,000) (29,969,000) (25,096,581) (30,130,000) (9,392,000) - (299,848,956) (137,796,663) (9,305,844) 32,434,563 (516,713,074) (294,859,585) (59,961,307) (23,671,727) (576,674,381) (318,531,312)
Net Profit for the Year 1,966,260,187 1,232,717,100 339,148,009 292,004,680 (132,895,253) (88,545,450) 59,294,000 131,492,000 173,187,178 84,759,000 170,803,000 70,723,000 569,098,502 349,479,661 (18,027,066) (73,675,421) 3,126,868,558 1,998,954,569 (59,961,307) (23,671,727) 3,066,907,251 1,975,282,843
No operating segments have been aggregated to form the reportable operating segments. Management monitors the operating results of its
business units separately for the purpose of making decisions about resource allocation and performance assessment. Segment performance
is evaluated based on operating profit or loss and is measured consistently with operating profit or loss in the consolidated financial statements.
However, Group financing (including finance costs and finance income) and income taxes are managed on a Group basis and are not allocated
to operating segments. Transfer prices between operating segments are on an arm’s length basis in a manner similar to transactions with third
parties.

164 Royal Ceramics Lanka PLC . Annual Report 2014 - 2015
Tiles &
Associated Items Sanitaryware
Paints and
Allied Products Plantation Packing Material Aluminium Products Finance Other Total Segments
Eliminations/
Adjustments Total
2015 2014 2015 2014 2015 2014 2015 2014 2015 2014 2015 2014 2015 2014 2015 2014 2015 2014 2015 2014 2015 2014
Rs. Rs. Rs. Rs. Rs. Rs. Rs. Rs. Rs. Rs. Rs. Rs. Rs. Rs. Rs. Rs. Rs. Rs. Rs. Rs. Rs. Rs.
As at 31st March
Assets and Liabilities
Segment Assets 31,781,805,153 30,281,066,813 3,416,563,244 3,137,785,387 303,057,993 362,269,006 3,705,607,000 3,437,996,000 1,924,649,847 1,342,117,000 1,331,896,000 1,187,087,000 - - 1,136,345,500 1,107,815,057 43,599,924,737 40,856,136,262 (8,503,392,305) (7,462,032,262) 35,096,532,432 33,331,604,152
Total assets 31,781,805,153 30,281,066,813 3,416,563,244 3,137,785,387 303,057,993 362,269,006 3,705,607,000 3,437,996,000 1,924,649,847 1,342,117,000 1,331,896,000 1,187,087,000 - - 1,136,345,500 1,107,815,057 43,599,924,737 40,856,136,262 (8,503,392,305) (7,462,032,262) 35,096,532,432 33,394,104,000
Segment liabilities 14,139,381,598 14,629,721,088 721,123,027 779,365,629 372,714,163 299,173,287 2,070,230,000 1,860,766,000 856,608,058 546,401,000 776,165,000 800,590,000 - - 407,910,000 480,776,550 19,344,131,846 19,396,793,555 (2,258,411,461) (1,657,208,555) 17,085,720,385 17,739,584,692
Total Liabilities 14,139,381,598 14,629,721,088 721,123,027 779,365,629 372,714,163 299,173,287 2,070,230,000 1,860,766,000 856,608,058 546,401,000 776,165,000 800,590,000 - - 407,910,000 480,776,550 19,344,131,846 19,396,793,555 (2,258,411,461) (1,657,208,555 ) 17,085,720,385 17,739,584,692
Other Segment
Information
Total cost incurred
during the period to
acquire
Property, Plant &
Equipment 911,544,791 1,516,007,749 111,748,626 174,324,565 1,314,933 29,048,837 277,779,000 365,921,000 77,193,615 14,919,000 9,693,000 36,238,000 - - 345,000 8,905,000 1,389,618,965 2,145,364,151 - - 1,389,618,965 2,145,364,151
Depreciation &
Amortisation 821,726,763 620,184,416 100,912,895 98,401,388 16,769,651 15,272,440 121,246,000 146,453,000 44,046,574 44,633,000 48,611,000 49,559,000 - - 12,983,000 25,725,000 1,166,295,884 1,000,228,245 - - 1,166,295,884 1,000,228,245
Amortisation of leasehold
right over land - - - - - - - - - - - - - - 715,000 - 715,000 - - - 715,000 1,252,500
Provisions for retirement
benefit liability 89,665,668 82,017,061 321,294 2,379,731 337,776 526,478 62,526,000 153,034,000 6,097,316 5,819,685 3,420,000 617,000 - - 1,239,000 1,356,000 163,607,054 245,749,955 - - 163,607,054 245,749,955
nOTES TO THE FInAnCIAL STATEMEnTS

165
Tiles &
Associated Items Sanitaryware
Paints and
Allied Products Plantation Packing Material Aluminium Products Finance Other Total Segments
Eliminations/
Adjustments Total
2015 2014 2015 2014 2015 2014 2015 2014 2015 2014 2015 2014 2015 2014 2015 2014 2015 2014 2015 2014 2015 2014
Rs. Rs. Rs. Rs. Rs. Rs. Rs. Rs. Rs. Rs. Rs. Rs. Rs. Rs. Rs. Rs. Rs. Rs. Rs. Rs. Rs. Rs.
As at 31st March
Assets and Liabilities
Segment Assets 31,781,805,153 30,281,066,813 3,416,563,244 3,137,785,387 303,057,993 362,269,006 3,705,607,000 3,437,996,000 1,924,649,847 1,342,117,000 1,331,896,000 1,187,087,000 - - 1,136,345,500 1,107,815,057 43,599,924,737 40,856,136,262 (8,503,392,305) (7,462,032,262) 35,096,532,432 33,331,604,152
Total assets 31,781,805,153 30,281,066,813 3,416,563,244 3,137,785,387 303,057,993 362,269,006 3,705,607,000 3,437,996,000 1,924,649,847 1,342,117,000 1,331,896,000 1,187,087,000 - - 1,136,345,500 1,107,815,057 43,599,924,737 40,856,136,262 (8,503,392,305) (7,462,032,262) 35,096,532,432 33,394,104,000
Segment liabilities 14,139,381,598 14,629,721,088 721,123,027 779,365,629 372,714,163 299,173,287 2,070,230,000 1,860,766,000 856,608,058 546,401,000 776,165,000 800,590,000 - - 407,910,000 480,776,550 19,344,131,846 19,396,793,555 (2,258,411,461) (1,657,208,555) 17,085,720,385 17,739,584,692
Total Liabilities 14,139,381,598 14,629,721,088 721,123,027 779,365,629 372,714,163 299,173,287 2,070,230,000 1,860,766,000 856,608,058 546,401,000 776,165,000 800,590,000 - - 407,910,000 480,776,550 19,344,131,846 19,396,793,555 (2,258,411,461) (1,657,208,555 ) 17,085,720,385 17,739,584,692
Other Segment
Information
Total cost incurred
during the period to
acquire
Property, Plant &
Equipment 911,544,791 1,516,007,749 111,748,626 174,324,565 1,314,933 29,048,837 277,779,000 365,921,000 77,193,615 14,919,000 9,693,000 36,238,000 - - 345,000 8,905,000 1,389,618,965 2,145,364,151 - - 1,389,618,965 2,145,364,151
Depreciation &
Amortisation 821,726,763 620,184,416 100,912,895 98,401,388 16,769,651 15,272,440 121,246,000 146,453,000 44,046,574 44,633,000 48,611,000 49,559,000 - - 12,983,000 25,725,000 1,166,295,884 1,000,228,245 - - 1,166,295,884 1,000,228,245
Amortisation of leasehold
right over land - - - - - - - - - - - - - - 715,000 - 715,000 - - - 715,000 1,252,500
Provisions for retirement
benefit liability 89,665,668 82,017,061 321,294 2,379,731 337,776 526,478 62,526,000 153,034,000 6,097,316 5,819,685 3,420,000 617,000 - - 1,239,000 1,356,000 163,607,054 245,749,955 - - 163,607,054 245,749,955
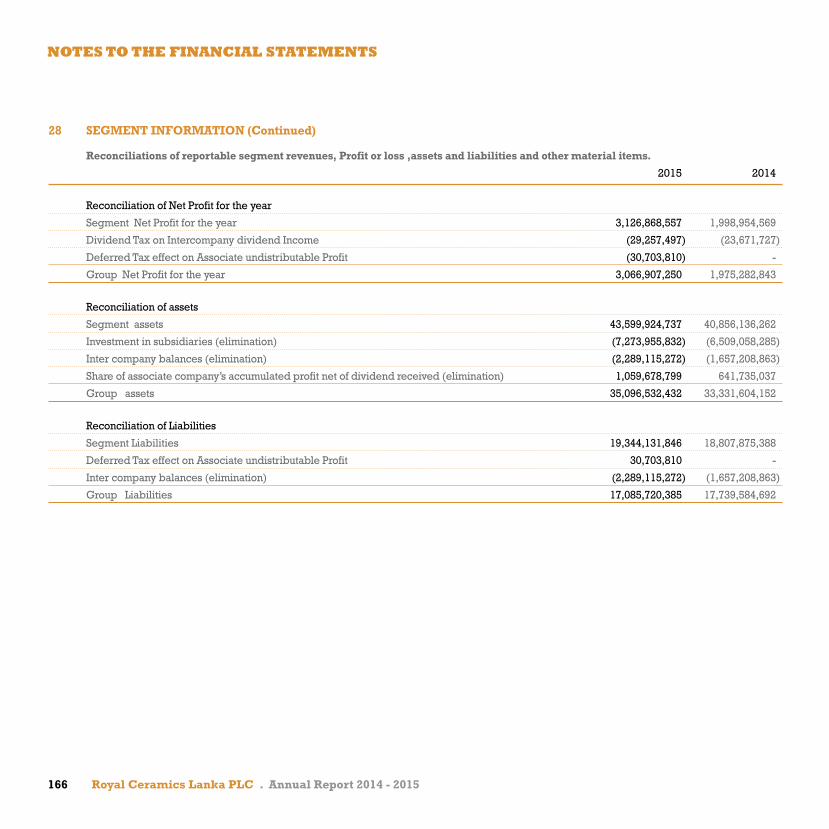
166 Royal Ceramics Lanka PLC . Annual Report 2014 - 2015
28 SEgMENT INFORMATION (Continued)
Reconciliations of reportable segment revenues, Profit or loss ,assets and liabilities and other material items.
2015 2014
Reconciliation of Net Profit for the year
Segment Net Profit for the year 3,126,868,557 1,998,954,569
Dividend Tax on Intercompany dividend Income (29,257,497) (23,671,727)
Deferred Tax effect on Associate undistributable Profit (30,703,810) -
Group Net Profit for the year 3,066,907,250 1,975,282,843
Reconciliation of assets
Segment assets 43,599,924,737 40,856,136,262
Investment in subsidiaries (elimination) (7,273,955,832) (6,509,058,285)
Inter company balances (elimination) (2,289,115,272) (1,657,208,863)
Share of associate company’s accumulated profit net of dividend received (elimination) 1,059,678,799 641,735,037
Group assets 35,096,532,432 33,331,604,152
Reconciliation of Liabilities
Segment Liabilities 19,344,131,846 18,807,875,388
Deferred Tax effect on Associate undistributable Profit 30,703,810 -
Inter company balances (elimination) (2,289,115,272) (1,657,208,863)
Group Liabilities 17,085,720,385 17,739,584,692
nOTES TO THE FInAnCIAL STATEMEnTS

167
29. CONTINgENT LIABILITIES a) Companies with in the group issued corporate guarantees in favour of Royal Ceramics Lanka PLC ,Royal Porcelain (Pvt) Ltd ,Rocell Bathware
Ltd and Ever Paint and Chemical Industries (Pvt) Ltd guaranteeing loans, interest and other charges of the loans as stated in note 15
b) “Super Gain Tax (SGT) - As per the interim Budget 2015 passed in the Parliament of Sri Lanka on 07th February 2015, the government proposed a one off 25% Super Gain Tax (SGT) be imposed on companies which have earned in excess of Sri Lankan Rupees 2,000 million profit before income tax on Group profit as per the Audited Financial Statement in the Financial Year 2013/14. The Gazette notification in respect of the above budget proposal was issued by the Government of Sri Lanka on 30 March 2015.
Accordingly, liable Companies will be assessed for SGT based on taxable income for the year of assessment 2013/14 and would be required to pay such SGT in three installments commencing from 15 May 2015. However, as of date, this bill has not been passed in the Parliament. In the event the Bill is enacted as a law in the future, the Company would become liable to pay the above SGT. The quantum of such have not yet been estimated by the company.
c) The Lanka Walltiles PLC, Ceytea Plantation Management Limited and Horana Plantations PLC are defendants in lawsuits in respect of labour
tribunal cases filed by employees for which maximum liability cannot be reliably measured as at the balance sheet date. Although there can
be no assurance, the directors believe, based on the information currently available, that the ultimate resolution of such legal procedures
would not likely to have a material adverse effect on the results of operations, financial position or liquidity. Accordingly no provision for any
liability has been made in the financial statements.
d) Lanka Walltiles PLC As at the reporting date, the Lanka Walltiles PLC has received assessments issued by the Department of Inland revenue in respect of Income
tax, Value added tax and economic service charge totalling Rs. 224,275,000/- for the year of assessment 2008/09, 2009/10. The Company has appealed against the assessments in the appeal hearing branch.
The Directors believe, based on the information currently available, the ultimate resolution of such assessment is not likely to have a material adverse effect on the Company. Accordingly no provision for liability has been made in these financial statements.
e) Horana Plantation PLC Unfulfilled condition on capital grants received from Ceylon Electricity Board for stand by power generators is subject to a condition of
minimum usage of CEB power as against the Generator power. A liability will arise only if the above condition is not fulfilled.
The case bearing No 27692/L filed by Rev Hadapanagoda Mahinda Thero , claiming the possession of Dumbara Estate, on the basis that the terms of the indenture of the aforesaid lease agreement have been violated. The thero also made the claims for the value of rubber trees excavated together with the interest. Furthermore he claims for the loss incurred due to the non cultivation on the property leased.
There are no other material contingent liabilities as at the reporting date
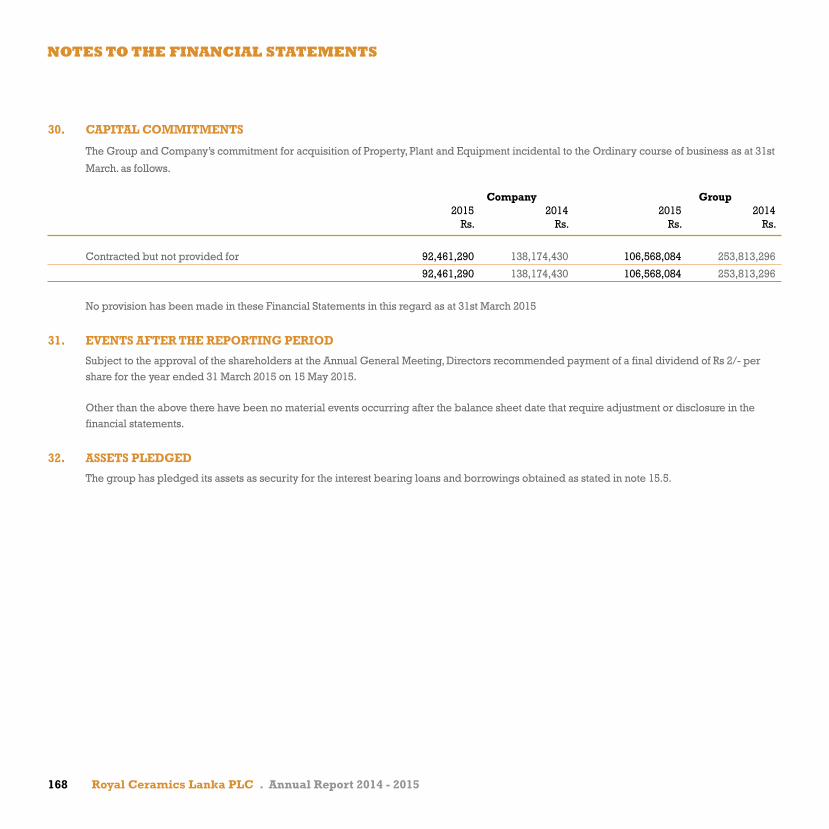
168 Royal Ceramics Lanka PLC . Annual Report 2014 - 2015
30. CAPITAL COMMITMENTS
The Group and Company’s commitment for acquisition of Property, Plant and Equipment incidental to the Ordinary course of business as at 31st
March. as follows.
Company group 2015 2014 2015 2014 Rs. Rs. Rs. Rs.
Contracted but not provided for 92,461,290 138,174,430 106,568,084 253,813,296
92,461,290 138,174,430 106,568,084 253,813,296
No provision has been made in these Financial Statements in this regard as at 31st March 2015
31. EVENTS AFTER THE REPORTINg PERIOD
Subject to the approval of the shareholders at the Annual General Meeting, Directors recommended payment of a final dividend of Rs 2/- per share for the year ended 31 March 2015 on 15 May 2015.
Other than the above there have been no material events occurring after the balance sheet date that require adjustment or disclosure in the financial statements.
32. ASSETS PLEDgED
The group has pledged its assets as security for the interest bearing loans and borrowings obtained as stated in note 15.5.
nOTES TO THE FInAnCIAL STATEMEnTS

169
33. RELATED PARTY DISCLOSURES
Details of significant related party disclosures are as follows:
33.1 Transactions with the Related Entities
Parent Subsidiaries Associates and other 2015 2014 2015 2014 2015 2014 Rs. Rs. Rs. Rs. Rs. Rs.
Nature of Transaction
Statement of Profit or Loss
Sale of Goods/Services - - 23,017,833 23,243,656 - -
Purchase of Goods/Services - - (106,208,486) (120,815,710) - (1,049,616)
Rendering of Services & Commission - - (773,114) - - -
Dividend Income - - 987,693,472 1,278,369,941 105,660,454 105,275,974
Dividend Payment (226,010,400) - - - - -
Technical Fee Income - - 155,768,458 - - -
Service Charges - - 1,140,301 1,142,781 - -
Investments made by the Company - - (124,709,925) (2,879,651,745) - 7,712,921
Reimbursement of Expenses - - 713,887,206 476,592,768 - -
Net of funds Transferred - - (1,937,324,426) (1,934,461,128) - -
Statement of Financial PositionBalance outstanding as at end of the year
Lease Creditors - - - - - (349,858)
Trade Debtors - - - - 183,802 -
Other Receivables - - 92,722,614 2,509,602 - -
Due to Related Parties - - (1,036,240,662) (794,068,984) - -
Trade Creditor - - (16,530,186) - - -

170 Royal Ceramics Lanka PLC . Annual Report 2014 - 2015
Parent company is Vallibel One PLC
Transactions With the Subsidiaries of the Group include Royal Porcelain (Pvt) Limited, Rocell Bathware Limited, Royal Ceramics Distributors (Pvt) Ltd. Ever Paint & Chemical industries (Pvt) Ltd, Lanka Ceramic PLC, Lanka Walltiles PLC, Lanka Tiles PLC,Swisstek Ceylon PLC, Swisstek aluminium Ltd. Horana Plantation PLC and Uni-Dil Packaging Ltd.
Associates of the Group include L. B. Finance PLC and Delmage Limited.
The company carried out above transactions under the ordinary course of its business at commercial rates. Fund transfers represents the sales proceeds of the subsidiaries received by the parent company and it will be settled by transferring of funds back to the relevant companies.
33.2 Transactions with Key Management Personnel (*)
33.2.1 Compensation to Key Management Personnel
Company group 2015 2014 2015 2014 Rs. Rs. Rs. Rs.
Nature of Transaction
Short term Employee Benefits - Executive Directors 59,511,504 54,101,362 110,284,316 104,874,174
- Non Executive Directors 7,550,000 7,304,285 19,897,500 19,651,785
Post Employment Benefits - Executive Directors 12,442,518 10,369,427 12,442,518 13,626,927
79,504,022 71,775,074 142,624,334 138,152,886
33.2.2 Other Transactions with Key Management Personnel
Rent Expenses 8,184,306 6,906,262 8,184,306 6,906,262
Transport Expenses 1,327,500 1,190,155 1,327,500 1,190,155
Sales 61,136 964,770 879,629 1,928,660
(*) Key management personnel include the Board of Directors of the Company and its parent entity.
nOTES TO THE FInAnCIAL STATEMEnTS

171
33.2.3 Transactions, arrangements and agreements involving companies controlled by or with significant influence of the Key Management Personnel**.
a) Statement of Profit or Loss
Company group 2015 2014 2015 2014 Rs. Rs. Rs. Rs.
Sale of Goods/Services 16,000,179 2,587,333 101,317,273 11,701,163
Purchase of Goods/Services 2,198,108 5,963,121 210,962,462 59,250,538
Dividend Income 472,760 - 472,760 -
Investment - 740,276 - 740,276
b) Statement of Financial Position
Company group 2015 2014 2015 2014 Rs. Rs. Rs. Rs.
Balance outstanding as at end of the year
Cash and Cash equivalents 35,148,449 11,524,555 38,652,369 11,524,555
Trade Debtors 2,074,189 9,785,315 4,112,521 11,680,082
Investments - 197,136,773 - 197,136,773
Term Loan - - - 102,499,981
** Other Related Companies as cited below represent transactions of its business at commercial rates under the ordinary course with entities
either controlled or in which significant influence is held by key management personnel or their close family members.
Aitken Spence Hotels PLC, Chemanex PLC, Colombo land and development Company, Douglas and sons Ltd, Expo Lanka Holding PLC, Fentons
Ltd, Haycarb PLC, Hayleys MGT Knitting Mills PLC, Hayleys PLC, Kandyan Resort (Pvt) Ltd, Link Natural Products (Pvt) Ltd, Renuka Hotels Ltd,
Sampath bank PLC and The Kingsbury PLC.

172 Royal Ceramics Lanka PLC . Annual Report 2014 - 2015
34. FINANCIAL RISK MANAgEMENT OBJECTIVES AND POLICIES
The Group’s principal financial liabilities comprise interest bearing loans and borrowings, trade and other payables. The main purpose of these
financial liabilities is to finance the Group’s operations. The Group has trade and other receivables, and cash and short-term deposits that arrive
directly from its operations.
The Group is exposed to market risk, credit risk and liquidity risk.
The senior management of the Group oversees the management of these risks. The Senior management of the Group determine on financial
risks and the appropriate financial risk governance framework for the Group. The financial risk-taking activities are governed by appropriate
policies and procedures and that financial risks are identified, measured and managed in accordance with Group policies and risk appetite.
The Board of Directors reviews and agrees policies for managing each of these risks which are summarised below.
Market risk
Market risk is the risk that the fair value of future cash flows of a financial instrument will fluctuate because of changes in market prices. Market
prices comprise four types of risk: interest rate risk, currency risk, commodity price risk and other price risk such as equity price risk. Financial
instruments affected by market risk include loans and borrowings, equity investments classified as fair value through profit or loss.
Interest rate risk
Interest rate risk is the risk that the fair value or future cash flows of a financial instrument will fluctuate because of changes in market interest rates. The Group’s exposure to the risk of changes in market interest rates relates primarily to the Group’s long term debt and short term borrowings with floating interest rates. The Group manages its risk by striking a balance between long term and short term debts. The company has easy access to funds at competitive interest rates.
Interest rate sensitivity
The following table demonstrates the sensitivity to a reasonably possible change in interest rates on that portion of the long term and short term borrowings. With all other variables held constant, the Groups profit before tax is affected through the impact on floating rate borrowings as follows;
Company group Change in Change in Change in Change in basis points Profit before tax basis points Profit before tax
2015 100 (1%) Rs. 45.1 Mn 100 (1%) Rs. 112.6 Mn2014 100 (1%) Rs. 46.7 Mn 100 (1%) Rs. 114.3 Mn
nOTES TO THE FInAnCIAL STATEMEnTS

173
Foreign currency risk
Foreign currency risk is the risk that the fair value of future cash flows of a financial instrument will fluctuate because of changes in foreign exchange rates. The Group’s exposure to the risk of changes in foreign exchange rates relates primarily to the Group’s operating activities.
Foreign currency sensitivity
The following table demonstrates the sensitivity to a reasonably possible change in United State Dollars (USD), Euro (EUR), Australian Dollars (AUD) rates with all other variables held constant, the Groups profit before tax. The Group exposure to all the other currencies are not material.
Company group Change in Change in Change in Change in basis points Profit before tax basis points Profit before tax
2015 5% Rs. 18.4 Mn 5% Rs. 48.4 Mn2014 5% Rs. 19.3 Mn 5% Rs. 42.1 Mn
The Groups listed and unlisted equity securities are susceptible to market price risk arising from uncertainties about the future values of the investments securities. The Group manages the equity price risk by diversification and placing limits on individual and total investment equity instruments. The group Board of Directors reviews and approves all equity investment decisions.
At the reporting date, the exposure to listed equity securities at fair value was Rs. 123.1 Mn (2014 - 120.3 Mn). A change in 5% of the ASPI could have an impact on approximately Rs. 7.0 Mn (2014 - 13.7 Mn) on the Company/Groups profit before tax.
Credit riskCredit risk is the risk that a counterparty will not meet its obligations under a financial instrument or customer contract, leading to a financial loss. The Group is exposed to credit risk from its operating activities (primarily for trade receivables) and from its financing activities, including deposits with banks,.
Trade receivablesCustomer credit risk is managed in accordance with the Group’s established policy, procedures and control relating to customer credit risk management. Individual credit limits are defined in accordance with the prior experience with the customers. Outstanding customer receivables are regularly monitored. The requirement for an impairment is analysed at each reporting date on an individual basis for major clients. Additionally, a large number of minor receivables are grouped into homogenous groups and assessed for impairment collectively. The calculation is based on actually incurred historical data. Part of the trade receivable of the group are backed by bank guarantees. Hence the Group evaluates the concentration of risk with respect to trade receivables as low.

174 Royal Ceramics Lanka PLC . Annual Report 2014 - 2015
Liquidity riskThe table below summarises the maturity profile of the Company’s financial liabilities based on contractual undiscounted payments.
As at 31 March 2015 On Less than 3 to 12 1 to 5 Over 5 Total demand 3 months months years years Rs Rs Rs Rs Rs Rs
CompanyInterest-bearing loans and borrowings 435,145,225 422,614,963 540,076,492 3,315,570,609 - 4,713,407,289 Trade and other payables - 1,392,583,392 - - - 1,392,583,392 435,145,225 1,815,198,355 540,076,492 3,315,570,609 - 6,105,990,681
GroupInterest-bearing loans and borrowings 2,109,451,678 2,887,091,045 1,313,843,150 5,562,207,415 421,710,736 12,294,304,025 Trade and other payables - 2,094,498,375 - - - 2,094,498,375 2,109,451,678 4,981,589,420 1,313,843,150 5,562,207,415 421,710,736 14,388,802,400
As at 31 March 2014 On Less than 3 to 12 1 to 5 Over 5 Total demand 3 months months years years Rs Rs Rs Rs Rs Rs
CompanyInterest-bearing loans and borrowings 183,616,842 370,892,831 406,108,657 3,708,063,034 - 4,668,681,364 Trade and other payables - 1,145,866,646 - - - 1,145,866,646 183,616,842 1,516,759,477 406,108,657 3,708,063,034 - 5,814,548,010
GroupInterest-bearing loans and borrowings 915,958,824 4,486,313,728 1,423,376,021 6,645,557,193 186,517,000 13,657,722,766Trade and other payables - 2,064,248,125 - - - 2,064,248,125 915,958,824 6,550,561,853 1,423,376,021 6,645,557,193 186,517,000 15,721,970,891
nOTES TO THE FInAnCIAL STATEMEnTS

175
35. CAPITAL MANAgEMENTCapital includes equity attributable to the equity holders of the parent. The primary objective of the Group’s capital management is to ensure that it maintains a healthy capital ratios in order to support its business and maximise shareholder value. The Group manages its capital structure and makes adjustments to it in light of changes in economic conditions.
No changes were made in the objectives, policies or processes for managing capital during the years ended 31 March 2015 and 31 March 2014.
The Company monitors capital using a gearing ratio, which is net debt divided by total capital plus net debt. The Company/Group includes within net debt, interest bearing loans and borrowings trade and other payable less cash and cash equivalents.
Company group 2015 2014 2015 2014 Rs. Rs. Rs. Rs.
Interest Bearing Borrowings 4,713,407,290 4,668,681,365 12,294,304,027 13,657,722,766
Trade and Other payables 1,392,583,393 1,145,866,646 2,094,498,375 2,032,997,420
Less: Cash and Cash Equivalents (287,324,543) (160,880,808) (1,329,056,539) (353,861,243)
Net Debt 5,818,666,140 5,653,667,203 13,059,745,863 15,336,858,943
Equity 7,127,789,045 6,787,688,975 18,010,812,046 15,592,019,463
Gearing ratio 45% 45% 42% 50%
36 MATERIAL PARTLY-OWNED SUBSIDIARIESFinancial information of subsidiaries that have material non-controlling interests is provided below:
Proportion of equity interest held by non-controlling interests:
Company Name Country of incorporation and operation 2015 2014
Lanka Ceramic PLC Sri Lanka 23.07% 23.30%
Lanka Walltile PLC Sri Lanka 51.10% 51.24%
Lanka Tiles PLC Sri Lanka 64.03% 65.36%
Vallibel Plantation Limited Sri Lanka 51.18% 51.33%
Swisstek (Ceylon) PLC Sri Lanka 77.19% 77.85%
Swisstek Aluminium Limited Sri Lanka 80.07% 80.64%
Horana Plantation PLC Sri Lanka 75.10% 75.18%
Uni-Dil Packaging (Private) Limited Sri Lanka 51.18% 51.33%
Uni-Dil Papersacks (Private) Limited Sri Lanka 51.18% 51.33%
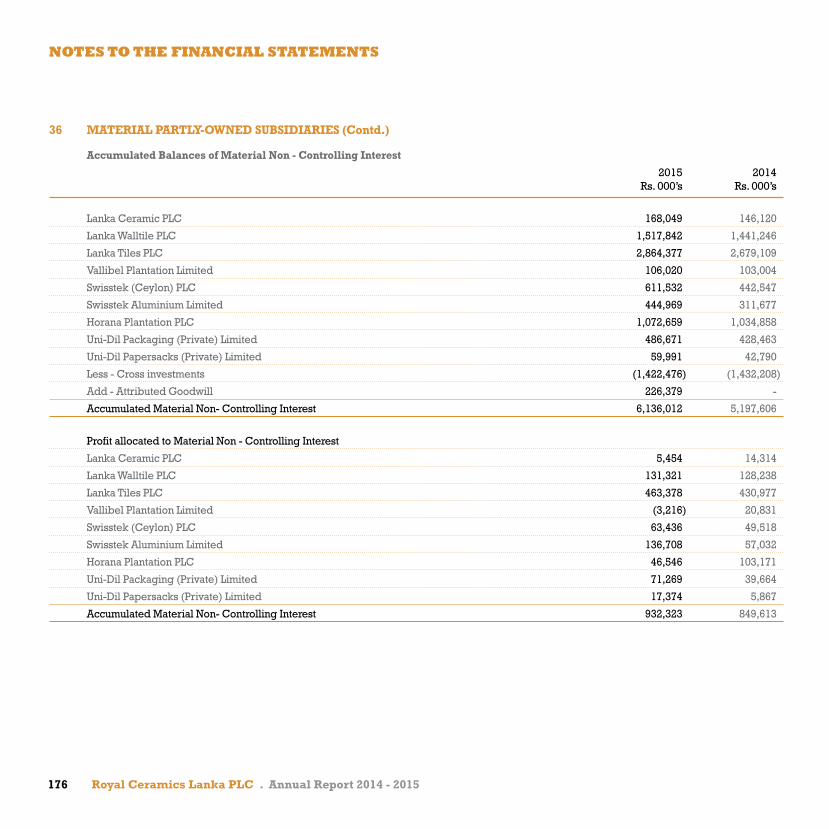
176 Royal Ceramics Lanka PLC . Annual Report 2014 - 2015
36 MATERIAL PARTLY-OWNED SUBSIDIARIES (Contd.)
Accumulated Balances of Material Non - Controlling Interest
2015 2014 Rs. 000’s Rs. 000’s
Lanka Ceramic PLC 168,049 146,120
Lanka Walltile PLC 1,517,842 1,441,246
Lanka Tiles PLC 2,864,377 2,679,109
Vallibel Plantation Limited 106,020 103,004
Swisstek (Ceylon) PLC 611,532 442,547
Swisstek Aluminium Limited 444,969 311,677
Horana Plantation PLC 1,072,659 1,034,858
Uni-Dil Packaging (Private) Limited 486,671 428,463
Uni-Dil Papersacks (Private) Limited 59,991 42,790
Less - Cross investments (1,422,476) (1,432,208)
Add - Attributed Goodwill 226,379 -
Accumulated Material Non- Controlling Interest 6,136,012 5,197,606
Profit allocated to Material Non - Controlling Interest
Lanka Ceramic PLC 5,454 14,314
Lanka Walltile PLC 131,321 128,238
Lanka Tiles PLC 463,378 430,977
Vallibel Plantation Limited (3,216) 20,831
Swisstek (Ceylon) PLC 63,436 49,518
Swisstek Aluminium Limited 136,708 57,032
Horana Plantation PLC 46,546 103,171
Uni-Dil Packaging (Private) Limited 71,269 39,664
Uni-Dil Papersacks (Private) Limited 17,374 5,867
Accumulated Material Non- Controlling Interest 932,323 849,613
nOTES TO THE FInAnCIAL STATEMEnTS
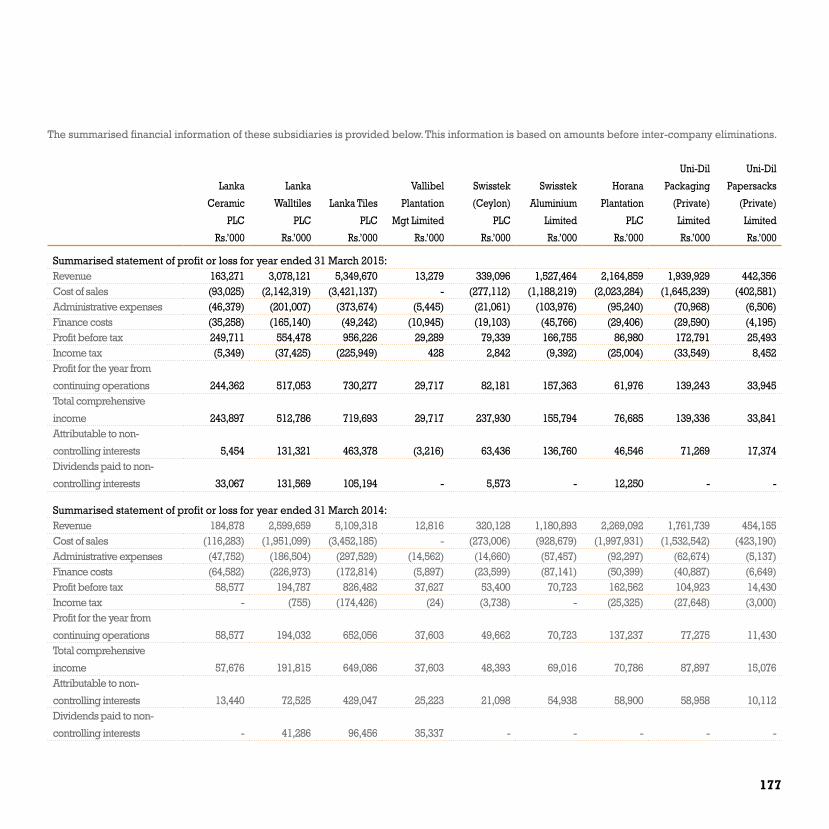
177
The summarised financial information of these subsidiaries is provided below. This information is based on amounts before inter-company eliminations.
Lanka
Ceramic
PLC
Rs.’000
Lanka
Walltiles
PLC
Rs.’000
Lanka Tiles
PLC
Rs.’000
Vallibel
Plantation
Mgt Limited
Rs.’000
Swisstek
(Ceylon)
PLC
Rs.’000
Swisstek
Aluminium
Limited
Rs.’000
Horana
Plantation
PLC
Rs.’000
Uni-Dil
Packaging
(Private)
Limited
Rs.’000
Uni-Dil
Papersacks
(Private)
Limited
Rs.’000
Summarised statement of profit or loss for year ended 31 March 2015:Revenue 163,271 3,078,121 5,349,670 13,279 339,096 1,527,464 2,164,859 1,939,929 442,356 Cost of sales (93,025) (2,142,319) (3,421,137) - (277,112) (1,188,219) (2,023,284) (1,645,239) (402,581)Administrative expenses (46,379) (201,007) (373,674) (5,445) (21,061) (103,976) (95,240) (70,968) (6,506)Finance costs (35,258) (165,140) (49,242) (10,945) (19,103) (45,766) (29,406) (29,590) (4,195)Profit before tax 249,711 554,478 956,226 29,289 79,339 166,755 86,980 172,791 25,493 Income tax (5,349) (37,425) (225,949) 428 2,842 (9,392) (25,004) (33,549) 8,452 Profit for the year from
continuing operations 244,362 517,053 730,277 29,717 82,181 157,363 61,976 139,243 33,945 Total comprehensive
income 243,897 512,786 719,693 29,717 237,930 155,794 76,685 139,336 33,841 Attributable to non-
controlling interests 5,454 131,321 463,378 (3,216) 63,436 136,760 46,546 71,269 17,374 Dividends paid to non-
controlling interests 33,067 131,569 105,194 - 5,573 - 12,250 - -
Summarised statement of profit or loss for year ended 31 March 2014:Revenue 184,878 2,599,659 5,109,318 12,816 320,128 1,180,893 2,269,092 1,761,739 454,155 Cost of sales (116,283) (1,951,099) (3,452,185) - (273,006) (928,679) (1,997,931) (1,532,542) (423,190)Administrative expenses (47,752) (186,504) (297,529) (14,562) (14,660) (57,457) (92,297) (62,674) (5,137)Finance costs (64,582) (226,973) (172,814) (5,897) (23,599) (87,141) (50,399) (40,887) (6,649)Profit before tax 58,577 194,787 826,482 37,627 53,400 70,723 162,562 104,923 14,430 Income tax - (755) (174,426) (24) (3,738) - (25,325) (27,648) (3,000)Profit for the year from
continuing operations 58,577 194,032 652,056 37,603 49,662 70,723 137,237 77,275 11,430 Total comprehensive
income 57,676 191,815 649,086 37,603 48,393 69,016 70,786 87,897 15,076 Attributable to non-
controlling interests 13,440 72,525 429,047 25,223 21,098 54,938 58,900 58,958 10,112 Dividends paid to non-
controlling interests - 41,286 96,456 35,337 - - - - -

178 Royal Ceramics Lanka PLC . Annual Report 2014 - 2015
Lanka
Ceramic
PLC
Rs.’000
Lanka
Walltiles
PLC
Rs.’000
Lanka Tiles
PLC
Rs.’000
Vallibel
Plantation
Mgt Limited
Rs.’000
Swisstek
(Ceylon)
PLC
Rs.’000
Swisstek
Aluminium
Limited
Rs.’000
Horana
Plantation
PLC
Rs.’000
Uni-Dil
Packaging
(Private)
Limited
Rs.’000
Uni-Dil
Papersacks
(Private)
Limited
Rs.’000
Summarised statement of financial position as at 31 March 2015:Current Assets 141,653 2,102,749 2,963,346 4,308 188,508 719,977 393,363 962,649 262,781 Non- Current Assets 994,693 3,509,250 3,416,757 350,189 879,904 611,919 2,957,747 530,550 108,676 Current Liabilities 92,727 2,047,954 1,036,291 64,970 264,746 627,643 494,553 434,585 313,009 Non- Current Liabilities 315,183 593,616 870,037 82,390 11,726 161,962 1,428,316 107,779 1,235 Total equity 728,436 2,970,429 4,473,773 207,137 792,237 542,291 1,428,240 950,835 117,207 Attributable to:Equity holders of parent 715,732 2,104,652 1,807,138 278,420 358,077 97,322 355,581 526,813 57,216 Non-controlling interest 12,703 865,777 2,666,635 (71,283) 434,160 444,969 1,072,659 424,022 59,991
728,436 2,970,429 4,473,773 207,137 792,237 542,291 1,428,240 950,835 117,207
Summarised statement of financial position as at 31 March 2014:Current Assets 98,209 2,131,883 2,957,747 4,081 149,043 535,501 362,557 821,336 282,074 Non- Current Assets 1,009,607 3,582,141 3,579,475 351,607 753,029 651,586 2,719,751 477,780 169,997 Current Liabilities 100,735 2,151,226 1,260,388 41,296 198,658 591,773 516,599 378,097 367,958 Non- Current Liabilities 380,042 750,255 916,758 113,716 134,920 184,392 1,189,155 86,270 748 Total equity 627,039 2,812,543 4,098,909 200,676 568,493 386,497 1,376,554 834,750 83,366 Attributable to:Equity holders of parent 637,836 2,025,214 1,621,667 275,477 304,823 74,820 341,696 469,112 40,576 Non-controlling interest (10,797) 787,329 2,477,242 (74,801) 263,670 311,677 1,034,858 365,638 42,790
627,033 2,812,543 4,098,909 200,676 568,493 386,497 1,376,554 834,750 83,366
Summarised cash flow information for year ending 31 March 2015:Operating Cash Flow 30,852 496,695 1,688,420 21,995 19,135 174,845 105,620 280,461 24,960 Investing Cash Flow 154,767 136,680 (196,896) 32,400 37,863 (7,528) (261,167) (81,457) (1,444)Financing Cash Flow (208,635) (670,495) (563,431) (54,456) (43,042) (140,942) 147,153 (173,073) (30,910)Net increase / (decrease) in
cash and cash equivalents (23,016) (36,760) 928,093 (61) 13,956 26,375 (8,394) 25,931 (7,394)
Summarised cash flow information for year ending 31 March 2014: Operating Cash Flow 14,237 83,964 568,423 8,407 (7,663) 169,431 235,387 8,302 12,991 Investing Cash Flow 58,658 (592,234) (236,793) 45,401 3,363 (35,677) (361,631) (14,706) (213)Financing Cash Flow (67,557) 459,087 (400,977) (55,402) 4,713 (132,984) 8,798 31,046 (16,516)Net increase / (decrease) in
cash and cash equivalents 5,338 (49,183) (69,347) (1,594) 413 770 (117,446) 24,642 (3,738)
nOTES TO THE FInAnCIAL STATEMEnTS
36 MATERIAL PARTLY-OWNED SUBSIDIARIES (Contd.)

179
37. SUMMARISED FINANCIAL INFORMATION OF ASSOCIATES L. B. Finance PLC Delmage Limited 2015 2014 2015 2014 Rs Rs Rs Rs
Revenue / Operating Income 6,818,493,812 4,548,308,648 6,431,803,518 5,309,619,360
Cost of sales / Operating Expenses (3,171,407,968) (2,559,981,444) (4,879,186,997) (4,125,518,881)
Other Income and Gains - - 84,630,263 146,874,775
Administrative expenses - - (737,803,382) (763,993,029)
Selling and Distribution Costs - - (711,066,431) (657,917,975)
Other Operating Expenses - - (9,487,856) (48,359,031)
Finance costs - - (385,531,374) (359,692,031)
Tax on Financial Services (315,232,097) (119,936,392) - -
Profit before tax 3,331,853,747 1,868,390,812 (206,642,259) (498,986,812)
Income tax Expenses (1,149,727,591) (528,361,437) (21,292,323) 154,450,299
Profit for the year 2,182,126,156 1,340,029,375 (227,934,582) (344,536,513)
Other comprehensive income (11,551,663) 18,328,836 (588,319) 796,676,197
Total comprehensive income 2,170,574,493 1,358,358,211 (228,522,901) 452,139,684
Group share of profit for the year 569,098,502 349,479,661 (42,358,066) (66,243,115)
Group share of Total comprehensive
income for the year 566,085,828 354,259,822 (42,481,613) 82,670,610
2015 2014 2015 2014 Rs Rs Rs Rs
Current Assets 39,991,449,703 36,039,520,248 4,535,309,943 3,420,826,149
Non- Current Assets 27,551,069,302 24,774,860,477 2,666,932,902 2,676,652,177
Current Liabilities 42,358,178,246 44,522,343,475 4,795,162,760 4,144,546,104
Non- Current Liabilities 17,257,248,790 10,085,348,352 831,142,500 163,888,916
Total equity 7,927,091,968 6,206,688,898 1,575,937,586 1,789,043,306
Group Carrying amount of the investments 3,617,167,128 3,156,741,754 605,449,161 647,930,774
Group Share of Contingent liabilities 71,094,056 23,401,182 - 22,362,900
Capital and other commitments 217,346,788 142,949,406 - -

180 Royal Ceramics Lanka PLC . Annual Report 2014 - 2015
38 FAIR VALUE MEASUREMENT
Accounting Policy
Fair value is the price that would be received to sell an asset or paid to transfer a liability in an orderly transaction between market participants at the measurement date. The fair value measurement is based on the presumption that the transaction to sell the asset or transfer the liability takes place either:
01 In the principal market for the asset or liability, or
02 In the absence of a principal market, in the most advantageous market for the asset or liability.
The principal or the most advantageous market must be accessible by the Company.
The fair value of an asset or a liability is measured using the assumptions that market participants would use when pricing the asset or liability, assuming that market participants act in their economic best interest. A fair value measurement of a non-financial asset takes into account a market participant’s ability to generate economic benefits by using the asset in its highest and best use or by selling it to another market participant that would use the asset in its highest and best use. The Company uses various valuation methodologies that are appropriate in the circumstances and for which sufficient data are available to measure fair value, maximising the use of relevant observable inputs and minimising the use of unobservable inputs. The use of observable and unobservable inputs and their significance in measuring fair value are reflected in our fair value hierarchy assessment.
Level 1 : Inputs include quoted prices for identical instruments and are the most observable
Level 2 : Inputs include quoted prices for similar instruments and observable inputs such as interest rates, currency exchange rates, and yield curves
Level 3 : Inputs include data not observable in the market and reflect management judgment about the assumptions market participants would use in pricing the instruments
We review the inputs to the fair value measurements to ensure they are appropriately categorized within the fair value hierarchy. Transfers into and transfers out of the hierarchy levels are recognized as if they had taken place at the end of the reporting period.
nOTES TO THE FInAnCIAL STATEMEnTS
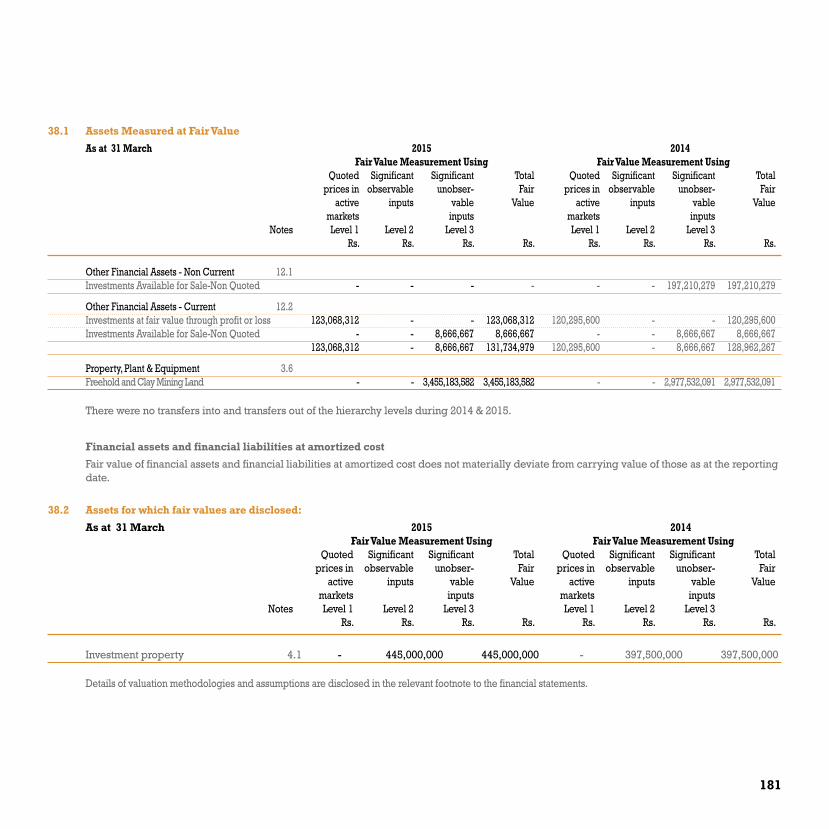
181
38.1 Assets Measured at Fair Value
As at 31 March 2015 2014 Fair Value Measurement Using Fair Value Measurement Using Quoted Significant Significant Total Quoted Significant Significant Total prices in observable unobser- Fair prices in observable unobser- Fair active inputs vable Value active inputs vable Value markets inputs markets inputs Notes Level 1 Level 2 Level 3 Level 1 Level 2 Level 3 Rs. Rs. Rs. Rs. Rs. Rs. Rs. Rs.
Other Financial Assets - Non Current 12.1Investments Available for Sale-Non Quoted - - - - - - 197,210,279 197,210,279
Other Financial Assets - Current 12.2Investments at fair value through profit or loss 123,068,312 - - 123,068,312 120,295,600 - - 120,295,600Investments Available for Sale-Non Quoted - - 8,666,667 8,666,667 - - 8,666,667 8,666,667 123,068,312 - 8,666,667 131,734,979 120,295,600 - 8,666,667 128,962,267
Property, Plant & Equipment 3.6 Freehold and Clay Mining Land - - 3,455,183,582 3,455,183,582 - - 2,977,532,091 2,977,532,091
There were no transfers into and transfers out of the hierarchy levels during 2014 & 2015.
Financial assets and financial liabilities at amortized cost
Fair value of financial assets and financial liabilities at amortized cost does not materially deviate from carrying value of those as at the reporting date.
38.2 Assets for which fair values are disclosed:
As at 31 March 2015 2014 Fair Value Measurement Using Fair Value Measurement Using Quoted Significant Significant Total Quoted Significant Significant Total prices in observable unobser- Fair prices in observable unobser- Fair active inputs vable Value active inputs vable Value markets inputs markets inputs Notes Level 1 Level 2 Level 3 Level 1 Level 2 Level 3 Rs. Rs. Rs. Rs. Rs. Rs. Rs. Rs.
Investment property 4.1 - 445,000,000 445,000,000 - 397,500,000 397,500,000
Details of valuation methodologies and assumptions are disclosed in the relevant footnote to the financial statements.

182 Royal Ceramics Lanka PLC . Annual Report 2014 - 2015
TEn YEARSUMMARY - COMPAnY
Trading results (RS.’000) SLFRS SLAS
2015 2014 2013 2012 2011 2010 2009 2008 2007 2006
Net Turnover 2,649,933 2,413,817 2,296,295 2,178,913 2,180,608 1,529,017 1,435,112 1,484,123 1,362,397 1,193,481
Other Income 1,256,470 1,435,441 1,425,346 2,128,946 1,431,648 876,799 481,761 202,217 200,300 119,820
Profit before interest 1,012,158 1,187,850 1,283,316 2,104,973 1,540,223 879,642 441,083 356,391 337,323 441,354
Interest (376,515) (518,989) (364,554) (834,642) (72,735) (132,419) (215,386) (207,114) (126,998) (76,291)
Profit After Interest Before Tax 635,642 668,861 918,762 1,270,331 1,467,488 747,223 225,697 149,277 210,325 365,063
Tax Reversal/(Expense) 143,881 185,780 67,724 (15,716) (93,663) (36,611) (20,011) (27,310) (57,511) (44,048)
After Tax Profit from Discontinued Operations - 31,386 - - - - - - -
Net Profit 779,524 854,641 1,017,873 1,254,614 1,373,825 710,612 205,686 121,966 152,814 321,015
Statement of Financial Position (RS.’000) SLFRS SLAS
2015 2014 2013 2012 2011 2010 2009 2008 2007 2006
Stated Capital 1,368,673 1,368,673 1,368,673 1,368,673 1,368,673 814,726 814,726 814,726 814,726 814,726
Capital Reserve 213,634 213,634 213,634 - - 365,714 367,343 418,388 4,168 4,168
Retained Earnings 5,545,481 5,205,381 4,354,879 3,558,585 2,747,129 1,150,357 576,602 430,660 415,134 373,109
Shareholders Funds 7,127,789 6,787,689 5,937,187 4,927,259 4,115,802 2,330,797 1,758,671 1,663,775 1,234,028 1,192,003
Fixed Assets 3,270,216 2,919,364 2,348,987 1,338,152 1,224,633 1,034,176 970,404 929,883 489,995 455,546
Investments 8,153,536 7,830,693 4,616,800 4,602,552 1,430,000 1,603,941 1,264,888 1,772,020 1,306,903 979,964
Other Financial Assets - 197,210 196,470 192,395 183,962
Current Assets 2,215,855 1,929,083 2,049,797 2,062,624 3,679,820 1,460,429 1,766,129 919,250 661,905 650,981
Current Liabilities (3,333,914) (2,394,872) (2,048,728) (2,085,282) (1,941,945) (1,446,404) (1,722,431) (1,300,811) (738,180) (515,441)
Non Current Liabilities (3,487,254) (3,859,125) (1,226,138) (1,183,183) (460,667) (321,345) (520,319) (656,568) (486,596) (379,047)
Total Equity 7,127,789 6,787,689 5,937,187 4,927,259 4,115,802 2,330,797 1,785,671 1,663,775 1,234,028 1,192,003

183
Ratios and Statistics 2015 2014 2013 2012 2011 2010 2009 2008 2007 2006
Ordinary Dividends (Rs.’000) 443,158 - 221,579 443,158 276,973 138,487 110,789 55,395 110,789 55,395
Dividend per Share (Rs)* 4.00 - 2.00 4.00 2.50 1.25 1.00 0.50 1.00 0.50
Dividend Payout Ratio(%) 56 - 22 35 20 19 54 45 72 17
Earnings Per Share (Rs.)* 7.04 7.71 9.19 11.32 12.40 6.41 1.86 1.10 1.38 2.90
Market value per share-closing (Rs.) 111.00 79.30 99.50 115.00 157.00 113.00 27.50 42.50 35.00 34.00
Market value per share-Highest (Rs.) 125.00 112.00 118.50 167.50 335.00 116.50 51.00 45.00 43.00 50.00
Price Earnings Ratio (Times) 15.77 10.29 10.83 10.16 12.66 17.62 14.81 38.61 25.37 11.73
Net Assets Per Share (Rs.) 64.40 61.27 53.59 44.47 37.15 21.04 15.87 15.02 11.14 10.76
Return on Equity (%) 11 13 17 25 33 30 12 7 12 27
2006
650,
981
515,
441
661,
905
738,
180
919,
250
1,30
0,81
1
1,76
6,12
9
1,72
2,43
1
1,46
0,42
9
1,44
6,40
4
3,67
9,82
0
1,94
1,94
5
2,06
2,62
4
2,08
5,28
2
2,04
9,79
7
2,04
8,72
8
1,92
9,08
3
2,39
4,87
3
2,21
5,85
5
3,33
3,91
4
Current Assets
2007 2008 2009 2010 2011 2012 2013 2014 2015
CURRENT ASSETS AND LIABILITIES (Rs.’000)Current Liabilities
2006 2007 2008 2009 2010 2011 2012 2013 2014 2015
FIXED ASSETS (Rs.’000)
455,
546
489,
995 92
9,88
3
970,
404
1,03
4,17
6
1,22
4,63
3
1,33
8,15
2
2,34
8,98
7 2,91
9,36
4
3,27
0,21
6

184 Royal Ceramics Lanka PLC . Annual Report 2014 - 2015
2006 2007 2008 2009 2010 2011 2012 2013 2014 2015
EARNINGS PER SHARE (Rs)
3
1 1
2
6
12
11
9
8
7
2006 2007 2008 2009 2010 2011 2012 2013 2014 2015
NET ASSETS PER SHARE (Rs.)
11 11
15 16
21
37
44
54
61
64
2006 2007 2008 2009 2010 2011 2012 2013 2014 2015
PRICE EARNINGS RATIO (Times)
12
25
39
15
18
13
10 11 10
16
2006 2007 2008 2009 2010 2011 2012 2013 2014 2015
RETURN ON EQUITY (%)
27
12
7
12
30
33
25
17
13
11
TEn YEAR SUMMARY
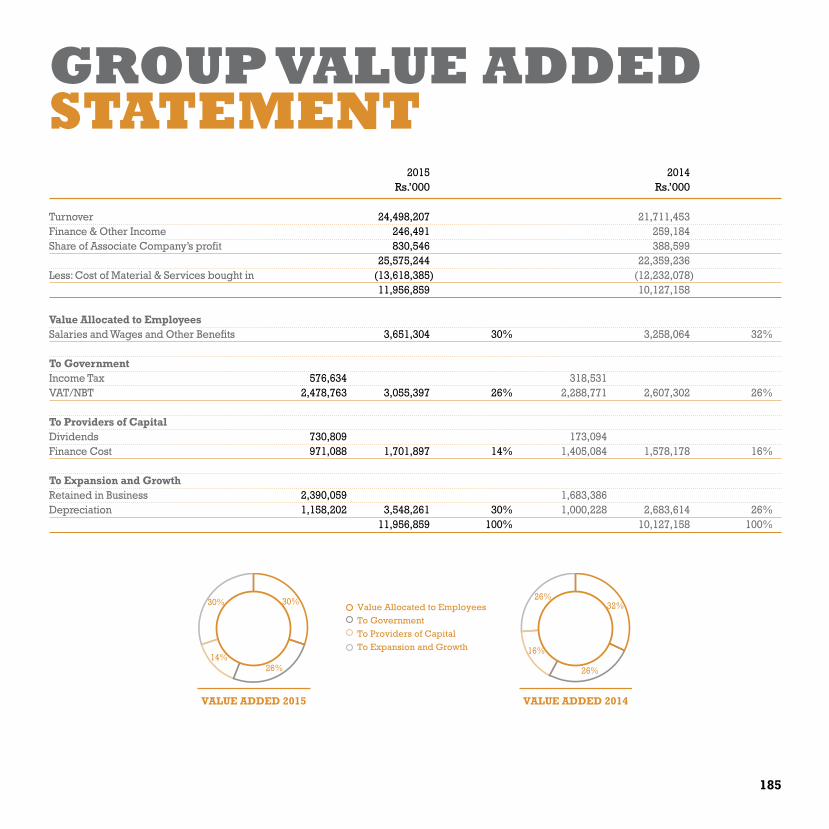
185
GROUP vALUE ADDEDSTATEMEnT 2015 2014 Rs.’000 Rs.’000
Turnover 24,498,207 21,711,453 Finance & Other Income 246,491 259,184 Share of Associate Company’s profit 830,546 388,599 25,575,244 22,359,236 Less: Cost of Material & Services bought in (13,618,385) (12,232,078) 11,956,859 10,127,158
Value Allocated to Employees Salaries and Wages and Other Benefits 3,651,304 30% 3,258,064 32% To government Income Tax 576,634 318,531 VAT/NBT 2,478,763 3,055,397 26% 2,288,771 2,607,302 26% To Providers of Capital Dividends 730,809 173,094 Finance Cost 971,088 1,701,897 14% 1,405,084 1,578,178 16% To Expansion and growth Retained in Business 2,390,059 1,683,386 Depreciation 1,158,202 3,548,261 30% 1,000,228 2,683,614 26% 11,956,859 100% 10,127,158 100%
VALUE ADDED 2015 VALUE ADDED 2014
Value Allocated to EmployeesTo GovernmentTo Providers of CapitalTo Expansion and Growth
30% 32%
26%
16%
26%
26%14%
30%

186 Royal Ceramics Lanka PLC . Annual Report 2014 - 2015
SHAREInFORMATIOnShareholders
There were 10867 registered shareholders as at 31st March 2015, distributed as follows.
Number of shares held Number of shareholders Number of shares % Shareholding
1 - 1000 9,727 2,103,525 1.90
1,001 - 10,000 915 2,991,345 2.70
10,001 - 100,000 173 5,463,936 4.93
100,001 - 1,000,000 42 10,723,175 9.68
1,000,000 - over 10 89,507,403 80.79
Total 10,867 110,789,384 100.00
*47.030% of shares were held by public comprising of 10,855 shareholders as at 31st March 2015.
Shareholder category Number of Shareholders No of shares Total holding %
Local Individuals 10,445 11,122,370 10.04
Local Institutions 311 93,295,740 84.21
Foreign Individuals 97 891,108 0.80
Foreign Institutions 14 5,480,166 4.95
Total 10,867 110,789,384 100
Share prices for the year
2014/2015 2013/2014
Date Price Date Price
Highest during the year 11/02/2015 and 13/11/2014 125.00 13/05/2013 112.00
Lowest during the year 04/04/2014 78.10 27/03/2014 77.00
As at end of the year - 111.00 - 79.30
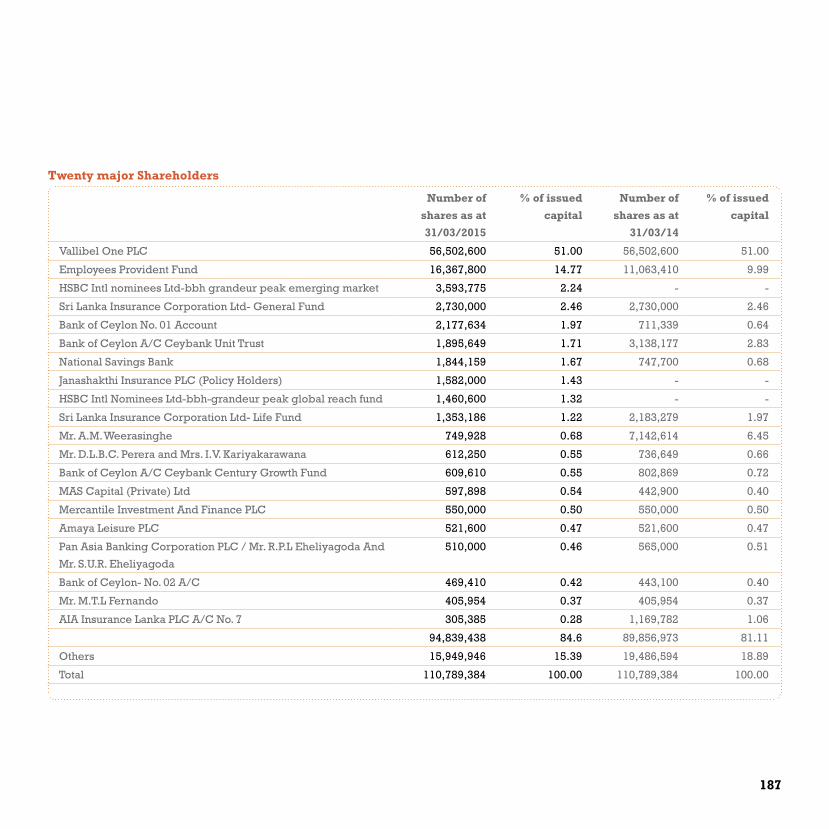
187
Twenty major Shareholders
Number of
shares as at
31/03/2015
% of issued
capital
Number of
shares as at
31/03/14
% of issued
capital
Vallibel One PLC 56,502,600 51.00 56,502,600 51.00
Employees Provident Fund 16,367,800 14.77 11,063,410 9.99
HSBC Intl nominees Ltd-bbh grandeur peak emerging market 3,593,775 2.24 - -
Sri Lanka Insurance Corporation Ltd- General Fund 2,730,000 2.46 2,730,000 2.46
Bank of Ceylon No. 01 Account 2,177,634 1.97 711,339 0.64
Bank of Ceylon A/C Ceybank Unit Trust 1,895,649 1.71 3,138,177 2.83
National Savings Bank 1,844,159 1.67 747,700 0.68
Janashakthi Insurance PLC (Policy Holders) 1,582,000 1.43 - -
HSBC Intl Nominees Ltd-bbh-grandeur peak global reach fund 1,460,600 1.32 - -
Sri Lanka Insurance Corporation Ltd- Life Fund 1,353,186 1.22 2,183,279 1.97
Mr. A.M. Weerasinghe 749,928 0.68 7,142,614 6.45
Mr. D.L.B.C. Perera and Mrs. I.V. Kariyakarawana 612,250 0.55 736,649 0.66
Bank of Ceylon A/C Ceybank Century Growth Fund 609,610 0.55 802,869 0.72
MAS Capital (Private) Ltd 597,898 0.54 442,900 0.40
Mercantile Investment And Finance PLC 550,000 0.50 550,000 0.50
Amaya Leisure PLC 521,600 0.47 521,600 0.47
Pan Asia Banking Corporation PLC / Mr. R.P.L Eheliyagoda And
Mr. S.U.R. Eheliyagoda
510,000 0.46 565,000 0.51
Bank of Ceylon- No. 02 A/C 469,410 0.42 443,100 0.40
Mr. M.T.L Fernando 405,954 0.37 405,954 0.37
AIA Insurance Lanka PLC A/C No. 7 305,385 0.28 1,169,782 1.06
94,839,438 84.6 89,856,973 81.11
Others 15,949,946 15.39 19,486,594 18.89
Total 110,789,384 100.00 110,789,384 100.00

188 Royal Ceramics Lanka PLC . Annual Report 2014 - 2015
GLOSSARY OFFInAnCIAL TERMSAccounting Policies
Specific principles, bases, conventions, rules and practices
adopted by an enterprise in preparing and presenting Financial
Statements.
Capital Employed
Total assets less interest free liabilities
Capital Reserves
Profits of a Company that, for various reasons, are not regarded as
distributable to Shareholders as dividends. These include gains on
revaluation of capital assets and share premium.
Cash and Cash Equivalent
Short-term highly liquid assets those are readily convertible to
known amounts of cash and which are subject to an insignificant
risk of changes in value.
Contingencies
A condition or situation existing at the reporting date where the
outcome will be confirmed only by occurrence or non-occurrence
of one or more future events.
Current Ratio
Current assets divided by current liabilities
Deffered Taxation
Sum set aside for tax in the accounts of an entity that will become
liable in a period other than that under review.
Dividend Cover
Post-Tax profit divided by gross dividend. Measures the number of
times dividend is covered by distributable profit.
Dividend Payout Ratio
Dividends Per Share divided by Earnings Per Share
Earnings Per Share
Profits attributable to ordinary Shareholders divided by the
number of ordinary shares in issue and ranking for dividend.
gross Dividend
Portion of profits, inclusive of tax withheld, distributed to
Shareholders.
Interest Cover
Earnings before interest and tax divided by interest expenses.
Net Assets per Share
Shareholders’ funds divided by the number of ordinary shares
issued.
Operating Profit Margin
Operating profit divided by turnover
Price Earnings Ratio
Market price of a share divided by Earnings per share

189
Related Parties
Parties who could control or significantly influence the financial
and operating policies of the business
Return on Equity
Net profit for the year divided by Equity Shareholders’ fund
Revenue Reserves
Reserves considered as being available for distributions and
investments.
Shareholders’ Funds
Total of issued and fully paid up capital and reserves.
Value Additions
The quantum of wealth generated by the activities of the group and
its application.
Working Capital
Capital required to finance the day-to-day operations (current
assets minus current liabilities)

190 Royal Ceramics Lanka PLC . Annual Report 2014 - 2015
nOTICE OFMEETInGNOTICE IS HEREBY GIVEN THAT the Twenty Fifth (25th)Annual
General Meeting of Royal Ceramics Lanka PLC will be held at the
Victorian, The Kingsbury on the 29th day of June 2015 at 12.00 noon
for the following purposes:
1. ORDINARY BUSINESS
1.1 To receive and consider the Annual Report of the Board of
Directors on the affairs of the Company and its subsidiaries
and the Statement of Accounts for the year ended 31st March
2015 and the Report of the Auditors thereon.
1.2 To declare a dividend as recommended by the directors.
1.3 To re-elect Mr. M D S Goonatilleke,who retires by rotation in
terms of Articles 85 and 86 of the Articles of Association, as a
Director of the Company
1.4 To pass the ordinary resolution set out below to re-appoint
Mr. R N Asirwatham who is 72 years of age, as a Director of the
Company;
“IT IS HEREBY RESOLVED THAT the age limit stipulated in
Section 210 of the Companies Act, No.07 of 2007 shall not
apply to Mr. R N Asirwatham who is 72 years of age and that he
be and is hereby re-appointed a Director of the Company in
terms of Section 211 of the Companies Act No. 07 of 2007”
1.5 To pass the ordinary resolution set out below to re-appoint
Mr. R B Thambiayah who is 70 years of age, as a Director of the
Company;
“IT IS HEREBY RESOLVED THAT the age limit stipulated in
Section 210 of the Companies Act, No.07 of 2007 shall not
apply to Mr. R B Thambiayah who is 70 years of age and that he
be and is hereby re-appointed a Director of the Company in
terms of Section 211 of the Companies Act No. 07 of 2007”
1.6 To re-elect Mr. S H Amarasekara, who retires in terms of
Article 92 of the Articles of Association, as a Director of the
Company
1.7 To re-appoint Messrs Ernst & Young, Chartered Accountants,
the retiring Auditors and to authorize the Directors to
determine their remuneration.
1.8 To authorize the Directors to determine payments for the year
2015/2016 for charitable and other purposes as set out in the
Companies Donations Act (Cap 147).
2 SPECIAL BUSINESS
2.1 To consider and if thought fit to pass the following resolution
as a special resolution as set out below to change the name of
the company.
“IT IS HEREBY RESOLVED THAT the name of the Company be
changed to Rocell PLC.”
2.2 To consider and if thought fit to pass the following resolution
as a Special Resolution as set out below for the amendment to
the Articles of Association:

191
“IT IS HEREBY RESOLVED THAT the Articles of Association be
amended as follows
1. By the deletion of Article 106(i) and the substitution therefore
of the following:
106 (i) Any Director may at any time by notice in writing left
at the Office appoint any person approved by the Directors
to be an Alternate Director of the Company to act in his
place provided that such appointment shall be in compliance
with the applicable Statutory Provisions and the following
provisions of this Article shall apply to any person so
appointed.
2. By the insertion of the following as Article 106 (v):
Where an Alternate Director is appointed in terms of sub
paragraph (i) hereof for a specific period or until the
happening of a specific event; if during such period or prior to
the completion of such event, the appointor acts in the capacity
of a Director, such appointors actions shall take precedence
over the acts of the Alternate Director.
3. By the existing Article 106(v) being renumbered as Article 106 (vi)
By Order of the Board
ROYAL CERAMICS LANKA PLC
P W Corporate Secretarial (Pvt) Ltd
Director / Secretaries
At Colombo
29th May 2015
Notes:
1) A shareholder entitled to attend or attend and vote at the
Meeting is entitled to appoint a Proxy who need not be a
shareholder, to attend or attend and vote instead of him/her.
A Proxy may vote on a poll (and join in demanding a poll) but
not on a show of hands.
2) A Form of Proxy is enclosed in this Report.
3) The completed Form of Proxy should be deposited at the
Registered Office of the Company, No. 10, R.A. de Mel
Mawatha, Colombo 03, by 12.00 noon on 27th June 2015
192 Royal Ceramics Lanka PLC . Annual Report 2014 - 2015
nOTES

193

194 Royal Ceramics Lanka PLC . Annual Report 2014 - 2015
nOTES

195
FORM OFPROxY*I/We……………………………………………………………of…………………………………………………....being a *Shareholder /Shareholders of Royal Ceramics Lanka PLC, do hereby appoint ………………………………………………….…... ...of ………………………………………………or failing him/her
Mr. Dhammika Perera of Colombo or failing him Mr. L. T. Samarawickrama of Colombo or failing himMr. A. M. Weerasinghe of Colombo or failing him Mr. M. D. S. Goonatilleke of Colombo or failing himMr. W. D. N. H. Perera of Colombo or failing him Mr. G. A. R. D. Prasanna of Colombo or failing himMr. T. G. Thoradeniya of Colombo or failing him Mr. R. N. Asirwatham of Colombo or failing himMr. R. B. Thambiayah of Colombo or failing him Mr. S H Amarasekara of Colombo
as *my/our proxy to represent me/us to speak and vote for me/us on my/our behalf at the Annual General Meeting of the Company to be held on 29th June 2015 at 12.00 noon and any adjournment thereof and at every poll which may be taken in consequence thereof.
FOR AGAINST
1. ORDINARY BUSINESS1.1 To receive and consider the Annual Report of the Board of Directors along with the Financial Statements of the
company and its subsidiaries for the year ended 31st March 2015
1.2 To declare a dividend as recommended by the directors.
1.3 To re-elect Mr. M D S Goonatilleke, who retires by rotation in terms of Article 85 and 86 of the Articles of Association as a Director of the Company.
1.4 To pass the ordinary resolution set out below to re-appoint Mr. R N Asirwatham who is 72 years of age, as a Director of the Company;
“IT IS HEREBY RESOLVED THAT the age limit stipulated in Section 210 of the Companies Act, No.07 of 2007 shall not apply to Mr. R N Asirwatham who is 72 years of age and that he be and is hereby re-appointed a Director of the Company in terms of Section 211 of the Companies Act No. 07 of 2007”
1.5 To pass the ordinary resolution set out below to re-appoint Mr. R B Thambiayah who is 70 years of age, as a Director of the Company;
“IT IS HEREBY RESOLVED THAT the age limit stipulated in Section 210 of the Companies Act, No.07 of 2007 shall not apply to Mr. R.B. Thambaiyah who is 70 years of age and that he be and is hereby re-appointed a Director of the Company in terms of Section 211 of the Companies Act No. 07 of 2007”
1.6 To re-elect Mr. S H Amarasekara, who retires in terms of Article 92 of the Articles of Association, as a Director of the Company
1.7 To re-appoint Messrs Ernst & Young, Chartered Accountants, the retiring Auditors and to authorize the Directors to determine their remuneration.
1.8 To authorize the Directors to determine payments for the year 2015/2016 for Charitable and other purposes as set out in the Companies Donations Act (Cap 147).

196 Royal Ceramics Lanka PLC . Annual Report 2014 - 2015
FOR AGAINST
2. SPECIAL BUSINESS
2.1 To consider and if thought fit to pass the following resolution as a special resolution as set out below
to change the name of the company.
“IT IS HEREBY RESOLVED THAT the name of the Company be changed to Rocell PLC.”
2.2 To consider and if thought fit to pass the following resolution as a Special Resolution as set out below for the amendment to the Articles of Association:
“IT IS HEREBY RESOLVED THAT the Articles of Association be amended as follows
1. By the deletion of Article 106(i) and the substitution therefore of the following:106 (i) Any Director may at any time by notice in writing left at the Office appoint any person approved by the Directors to be an Alternate Director of the Company to act in his place provided that such appointment shall be in compliance with the applicable Statutory Provisions and the following provisions of this Article shall apply to any person so appointed.
2. By the insertion of the following as Article 106 (v):Where an Alternate Director is appointed in terms of sub paragraph (i) hereof for a specific period or until the happening of a specific event; if during such period or prior to the completion of such event, the appointor acts in the capacity of a Director, such appointors actions shall take precedence over the acts of the Alternate Director.
3. By the existing Article 106(v) being renumbered as Article 106 (vi)
Signed this…………… day of ………………………. Two Thousand and Fifteen
……………………Signature
1) *Please delete the inappropriate words.
2) Instructions as to completion are noted below.
INSTRUCTIONS AS TO COMPLETION
1. Kindly perfect the Form of Proxy after filling in legibly your full name and address and sign in the space provided. Please fill in the date of signature.
2. If you wish to appoint a person other than Directors as your proxy, please insert the relevant details in the space provided overleaf.
3. In terms of Article 67 of the Articles of Association of the Company;
(i) in the case of an individual shall be signed by the appointer or by his attorney; and
(ii) in the case of a Corporation shall be either under its common seal or signed by its attorney or by an officer on behalf of the Corporation.
4. In terms of Article 62 of the Articles of Association of the Company
In the case of joint-holders of a share the senior who tenders a vote, whether in person or by proxy or by attorney or by representative, shall be accepted to
the exclusion of the votes of the other joint-holders and for this purpose seniority shall be determined by the order in which the names stand in the Register of
Shareholders in respect of the joint holding.
5. To be valid the completed Form of Proxy shall be deposited at the Registered Office of the Company situated at No. 10, R. A. de Mel Mawatha, Colombo 3, by 12.00
noon on 27th June 2015.
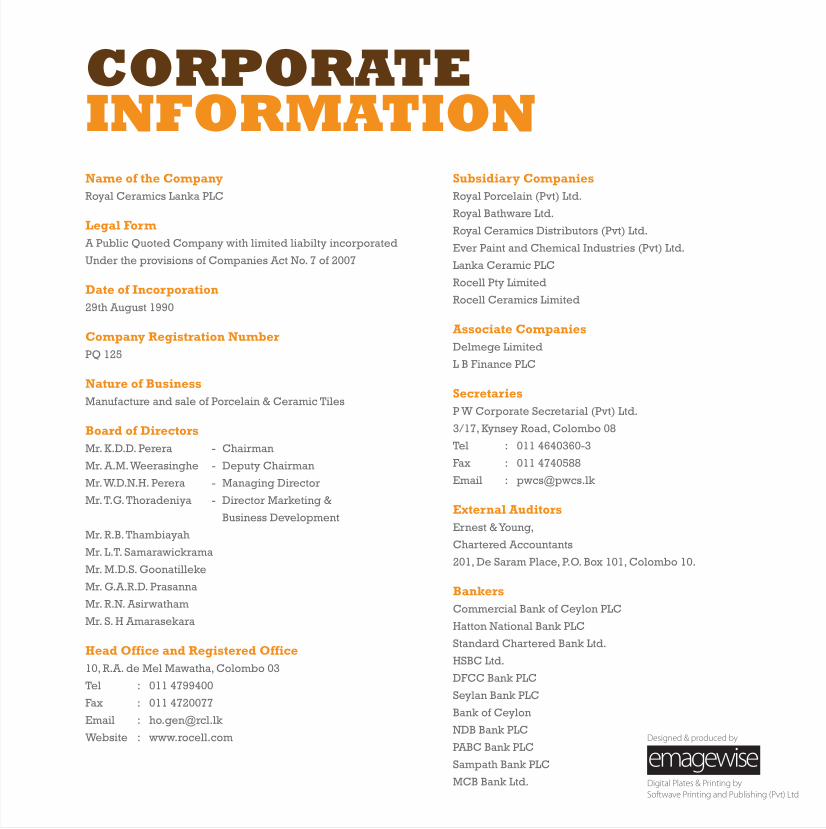
Name of the CompanyRoyal Ceramics Lanka PLC
Legal FormA Public Quoted Company with limited liabilty incorporated
Under the provisions of Companies Act No. 7 of 2007
Date of Incorporation29th August 1990
Company Registration NumberPQ 125
Nature of BusinessManufacture and sale of Porcelain & Ceramic Tiles
Board of DirectorsMr. K.D.D. Perera - Chairman
Mr. A.M. Weerasinghe - Deputy Chairman
Mr. W.D.N.H. Perera - Managing Director
Mr. T.G. Thoradeniya - Director Marketing &
Business Development
Mr. R.B. Thambiayah
Mr. L.T. Samarawickrama
Mr. M.D.S. Goonatilleke
Mr. G.A.R.D. Prasanna
Mr. R.N. Asirwatham
Mr. S. H Amarasekara
Head Office and Registered Office10, R.A. de Mel Mawatha, Colombo 03
Tel : 011 4799400
Fax : 011 4720077
Email : [email protected]
Website : www.rocell.com
Subsidiary CompaniesRoyal Porcelain (Pvt) Ltd.
Royal Bathware Ltd.
Royal Ceramics Distributors (Pvt) Ltd.
Ever Paint and Chemical Industries (Pvt) Ltd.
Lanka Ceramic PLC
Rocell Pty Limited
Rocell Ceramics Limited
Associate CompaniesDelmege Limited
L B Finance PLC
SecretariesP W Corporate Secretarial (Pvt) Ltd.
3/17, Kynsey Road, Colombo 08
Tel : 011 4640360-3
Fax : 011 4740588
Email : [email protected]
External AuditorsErnest & Young,
Chartered Accountants
201, De Saram Place, P.O. Box 101, Colombo 10.
BankersCommercial Bank of Ceylon PLC
Hatton National Bank PLC
Standard Chartered Bank Ltd.
HSBC Ltd.
DFCC Bank PLC
Seylan Bank PLC
Bank of Ceylon
NDB Bank PLC
PABC Bank PLC
Sampath Bank PLC
MCB Bank Ltd.
Corporate information
ContentSFinancial Highlights 07
Chairman’s Statement 08
Managing Director’s Review of Operations 09
The Board of Directors 12
Management Discussion and Analysis 15
Sustainability Report 36
Showroom Network 48
Financial Review 50
Corporate Governance 53
Risk Management 58
Annual Report of the Board of Directors 62
Statement of Directors’ Responsibility 74
Report of the Audit Committee 75
Report of the Remuneration Committee 77
Financial Calendar 78
Independent Auditor’s Report 79
Statement of Financial Position 80
Statement of Profit or Loss 82
Statement of Comprehensive Income 83
Statement of Changes in Equity 84
Cash Flow Statement 86
Notes to the Financial Statements 88
Ten Years Summary - Company 182
Group Value Added Statement 185
Share Information 186
Glossary of Financial Terms 188
Notice of Meeting 190
Form of Proxy 195
Designed & produced by
Digital Plates & Printing by Softwave Printing and Publishing (Pvt) Ltd

Royal C
eramics Lanka PLC
Annual R
eport 2014 - 2015
roYaL CeramiCS LanKa pLCannUaL report 2014 - 2015
www.rocell.com