sberbank · sberbank investor presentation sberbank in brief 4 148.9 assets mln clients worldwide...
TRANSCRIPT

FEBRUARY 2018
SBERBANK
INVESTOR PRESENTATION

DISCLAIMER
This presentation has been prepared by Sberbank of Russia (the
“Bank”) and has not been independently verified. This presentation
does not constitute or form part or all of, and should not be
construed as, any offer of, or any invitation to sell or issue, or any
solicitation of any offer to purchase, subscribe for, underwrite or
otherwise acquire, or a recommendation regarding, any shares or
other securities representing shares in, or any other securities of the
Bank, or any member of the Bank’s group, nor shall it or any part of
it nor the fact of its presentation or distribution form the basis of, or
be relied on in connection with, any contract or any commitment
whatsoever or any investment decision. The information in this
presentation is confidential and is being provided to you solely for
your information and may not be reproduced, retransmitted or
further distributed to any other person or published, in whole or in
part, for any purpose.
This presentation is only being distributed to and is only directed at
(A) persons in member states of the European Economic Area
(other than the United Kingdom) who are “qualified investors” within
the meaning of Article 2(1)(e) of Directive 2003/71/EC (as amended
and together with any applicable implementing measures in that
member state, the “Prospectus Directive”) (“Qualified Investors”);
(B) in the United Kingdom, Qualified Investors who are investment
professionals falling within Article 19(5) of the Financial Services
and Markets Act 2000 (Financial Promotion) Order 2005 (the
“Order”) and/or high net worth companies, and other persons to
whom it may lawfully be communicated, falling within Article 49(2)(a)
to (d) of the Order; and (C) such other persons as to whom this
presentation may be lawfully distributed and directed under
applicable laws (all such persons in (A) to (C) above together being
referred to as “relevant persons”). The shares, or other securities
representing shares, are only available to, and any invitation, offer
or agreement to subscribe, purchase or otherwise acquire such
securities will be engaged in only with, relevant persons. Any
person who is not a relevant person should not act or rely on this
presentation or any of its contents.
The information in this presentation or in oral statements of the
management of the Bank may include forward-looking statements.
Forward-looking statements include all matters that are not
historical facts, statements regarding the Bank’s intentions, beliefs
or current expectations concerning, among other things, the Bank’s
results of operations, financial condition, liquidity, prospects, growth,
targets, strategies, and the industry in which the Bank operates. By
their nature, forward-looking statements involve risks and
uncertainties, because they relate to events and depend on
circumstances that may or may not occur in the future. The Bank
cautions you that forward-looking statements are not guarantees of
future performance and that its actual results of operations, financial
condition and liquidity and the development of the industry in which
the Bank operates may differ materially from those made in or
suggested by the forward looking statements contained in this
presentation or in oral statements of the management of the Bank.
In addition, even if the Bank’s results of operations, financial
condition and liquidity and the development of the industry in which
the Bank operates are consistent with forward-looking statements
contained in this presentation or made in oral statements, those
results or developments may not be indicative of results or
developments in future periods.
Sberbank assumes no obligation to publicly update or revise any
forward-looking statements, whether as a result of new information
or for any other reason.
The information and opinions contained in this presentation or in
oral statements of the management of the Bank are provided as at
the date of this presentation or as at the other date if indicated and
are subject to change without notice.
No reliance may be placed for any purpose whatsoever on the
information contained in this presentation or oral statements of the
management of the Bank or on assumptions made as to its
completeness.
No representation or warranty, express or implied, is given by the
Bank, its subsidiaries or any of their respective advisers, officers,
employees or agents, as to the accuracy of the information or
opinions or for any loss howsoever arising, directly or indirectly,
from any use of this presentation or its contents.
This presentation is not directed to, or intended for distribution to or
use by, any person or entity that is a citizen or resident or located in
any locality, state, country or other jurisdiction where such
distribution, publication, availability or use would be contrary to law
or regulation or which would require any registration or licensing
within such jurisdiction.
By attending or reviewing this presentation, you acknowledge and
agree to be bound by the foregoing.
SBERBANK IN BRIEF
SBERBANK STRATEGY 2020
APPENDIX 1: IFRS FINANCIALS
APPENDIX 2: RECENT DEVELOPMENTS
FINANCIAL MODEL 2020
APPENDIX 3: GUIDANCE 2018
SBERBANK INVESTOR PRESENTATION
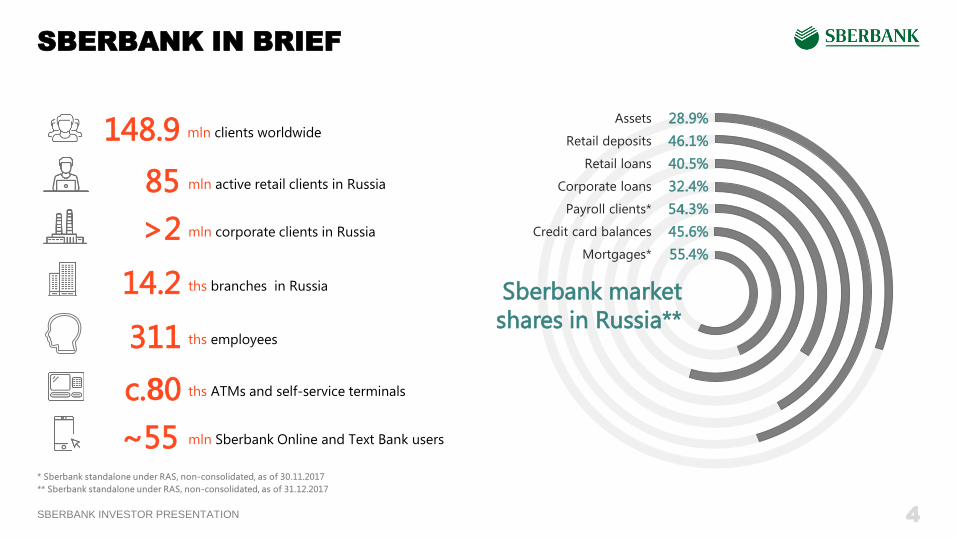
SBERBANK IN BRIEF
4
mln clients worldwide 148.9
mln corporate clients in Russia >2
ths branches in Russia 14.2
ths employees 311
ths ATMs and self-service terminals c.80
mln Sberbank Online and Text Bank users ~55
mln active retail clients in Russia 85
Sberbank market
shares in Russia**
Assets 28.9%
Retail deposits 46.1%
Retail loans 40.5%
Corporate loans 32.4%
Payroll clients* 54.3%
Credit card balances 45.6%
Mortgages* 55.4%
SBERBANK INVESTOR PRESENTATION
SBERBANK IN BRIEF
SBERBANK STRATEGY 2020
APPENDIX 1: IFRS FINANCIALS
APPENDIX 2: RECENT DEVELOPMENTS
FINANCIAL MODEL 2020
APPENDIX 3: GUIDANCE 2018
SBERBANK INVESTOR PRESENTATION
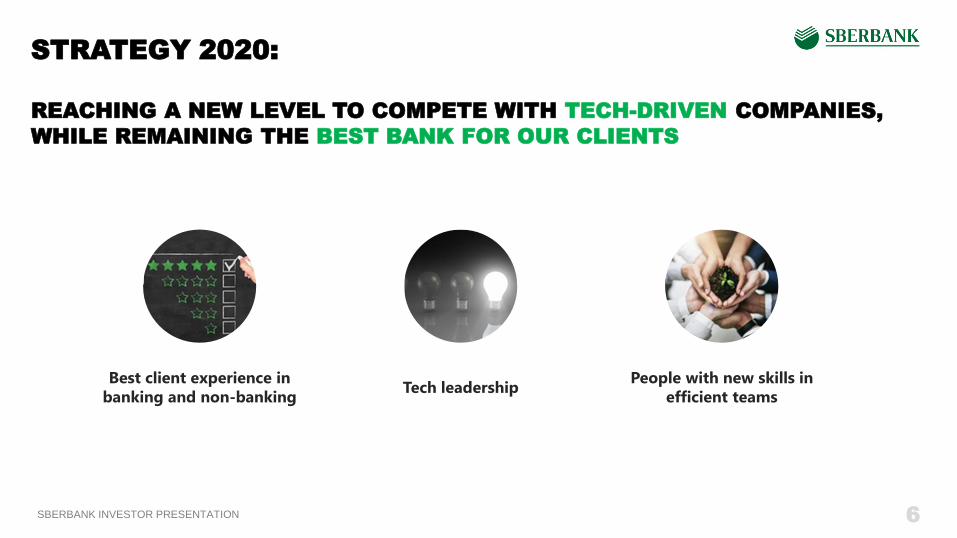
STRATEGY 2020:
REACHING A NEW LEVEL TO COMPETE WITH TECH-DRIVEN COMPANIES,
WHILE REMAINING THE BEST BANK FOR OUR CLIENTS
6
Best client experience in
banking and non-banking Tech leadership
People with new skills in
efficient teams

SBERBANK INVESTOR PRESENTATION
BEST CUSTOMER EXPERIENCE
7
Mass Personalization
Complete customer knowledge, including behavioral
patterns and preferences
Client Product Customer Journey
Improvement of core financial products with modern
technology
Switch from standalone products to clients’ life
scenarios and journeys
Execution
Customer contact point management
Deviation management
Instant feedback
Continuous improvement
Intelligent Management System
>10 million Tasks per year
100 000+ Front-office employees
200+ Products
«Client 360»
Time Channel
Language Offer
WHO?
HOW? WHAT?
WHEN? WHERE? Smart loans
Easy business start
FX-trading
ecosystem One-window
apartment selection
and purchase
Fast & convenient
payments
Life-long PFM
Corporate Retail
SBERBANK INVESTOR PRESENTATION
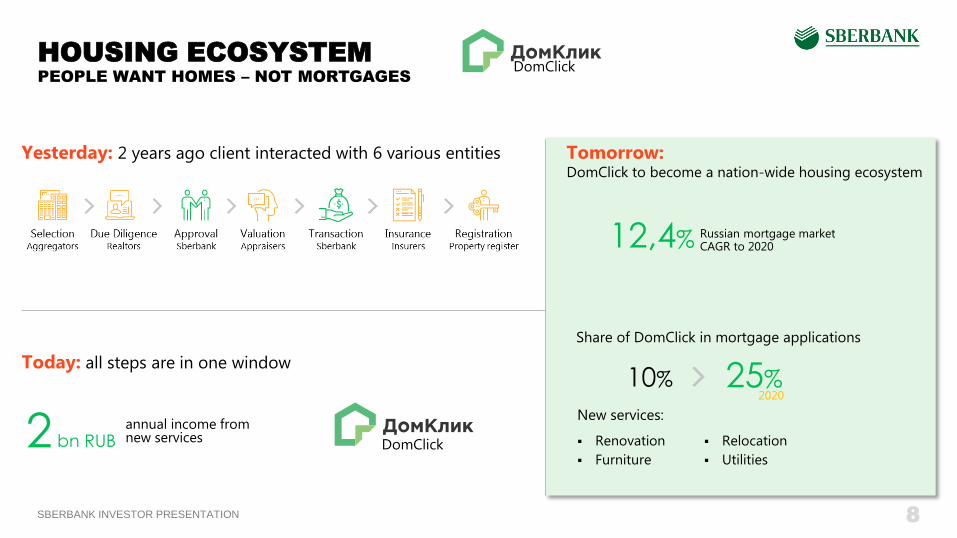
HOUSING ECOSYSTEM
8
PEOPLE WANT HOMES – NOT MORTGAGES
DomClick
Share of DomClick in mortgage applications
Yesterday: 2 years ago client interacted with 6 various entities
Renovation
Furniture
Relocation
Utilities
Today: all steps are in one window
annual income from new services 2 bn RUB
Tomorrow: DomClick to become a nation-wide housing ecosystem
12,4% Russian mortgage market CAGR to 2020
10% 25%
New services:
DomClick
2020

SBERBANK INVESTOR PRESENTATION
SBERBANK ECOSYSTEM:
FOCUS ON GROWING DIGITAL SYSTEMS
9
Criteria for Investments
IPO (unicorn) potential within 5 years
Synergies with Sberbank
Orchestrate economic activity
Growing industries with high potential
Long-term ROE accretive
Focused investments: 8-10 industries
In progress
Future ideas
Cloud
Logistic
Messenger
Identification
Cybersecurity
FinTech
Lifestyles
MarkTech
B2B Services
Telecom
E-Health
B2С E-Commerce
B2B Marketplace
B2B business process outsourcing
E-Travel
IoT
Gaming
E-Education
E-Employment
E-Auto
Current directions
Housing
Identification
3 TOP player
in on
Industries Year horizon
4 5
SBERBANK INVESTOR PRESENTATION
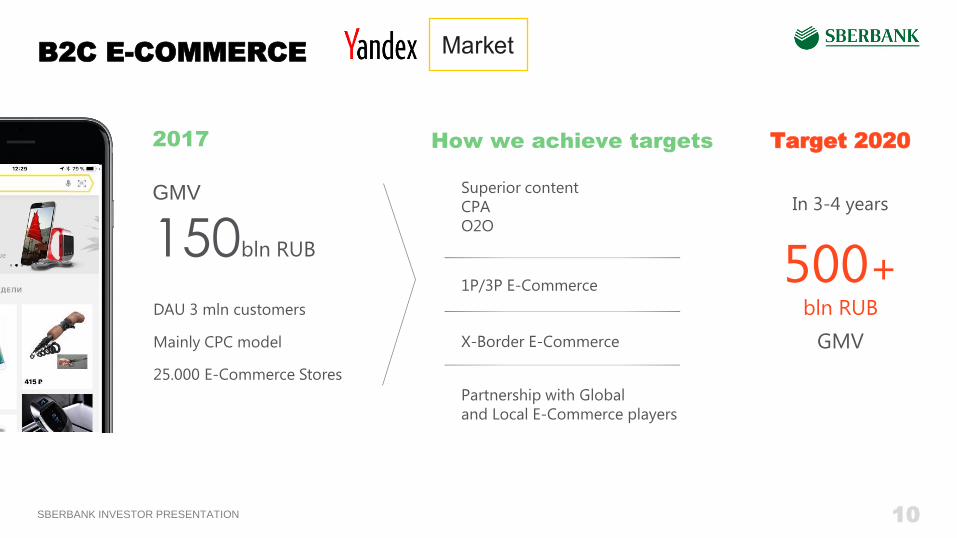
B2C E-COMMERCE
10
Target 2020
In 3-4 years
500+
bln RUB
GMV
How we achieve targets
Superior content
CPA
O2O
1P/3P E-Commerce
X-Border E-Commerce
Partnership with Global
and Local E-Commerce players
2017
GMV
150bln RUB
DAU 3 mln customers
Mainly CPC model
25.000 E-Commerce Stores
SBERBANK INVESTOR PRESENTATION
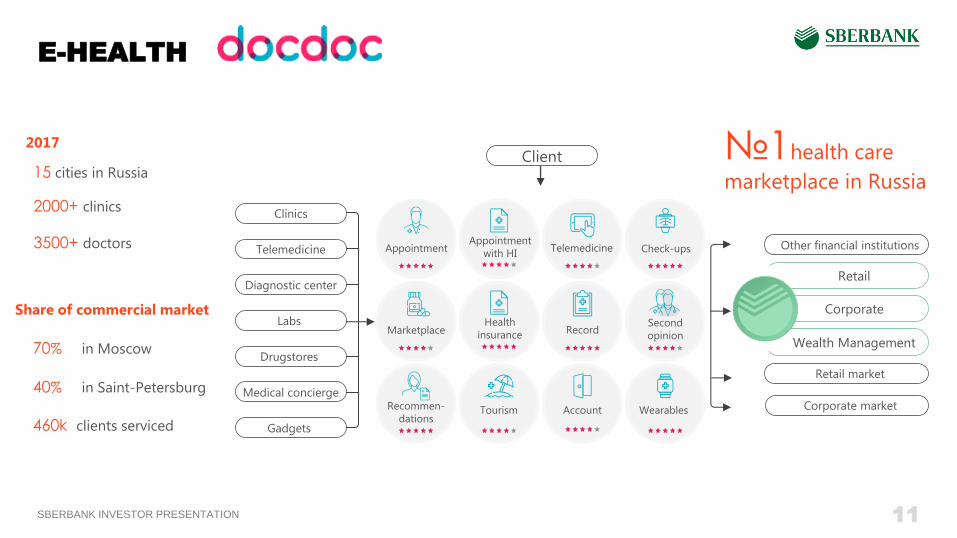
E-HEALTH
11
2017
2000+ clinics
3500+ doctors
15 cities in Russia
Share of commercial market
70% in Moscow
40% in Saint-Petersburg
460k clients serviced
№1health care
marketplace in Russia
Retail
Corporate
Wealth Management
Other financial institutions
Retail market
Corporate market
Clinics
Telemedicine
Labs
Diagnostic center
Drugstores
Gadgets
Medical concierge
Appointment Appointment
with HI Telemedicine Check-ups
Marketplace Record Second
opinion
Recommen-
dations Tourism Account Wearables
Health
insurance
Client
SBERBANK INVESTOR PRESENTATION
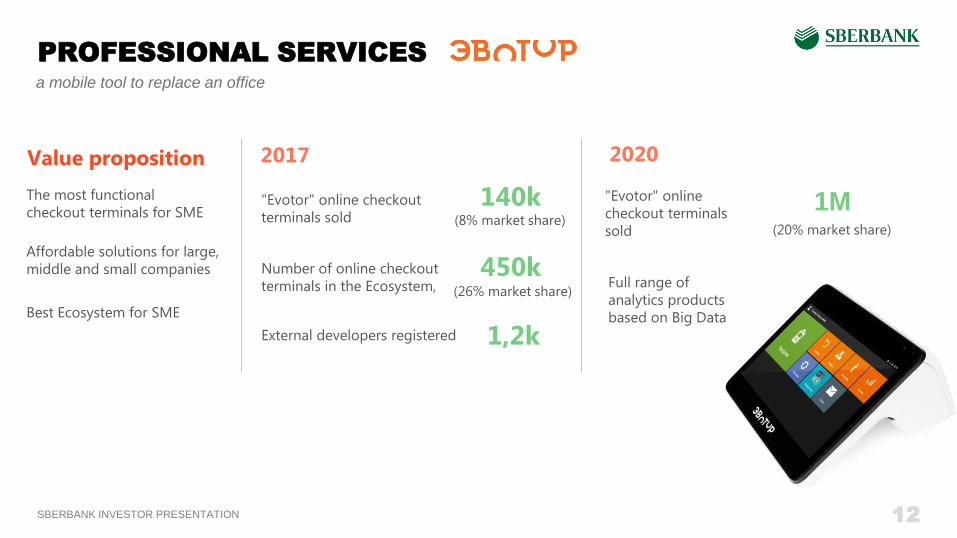
PROFESSIONAL SERVICES
12
a mobile tool to replace an office
Best Ecosystem for SME
Value proposition
The most functional
checkout terminals for SME
Affordable solutions for large,
middle and small companies
"Evotor" online checkout
terminals sold 140k
(8% market share)
External developers registered 1,2k
"Evotor" online
checkout terminals
sold
1M
Full range of
analytics products
based on Big Data
Number of online checkout
terminals in the Ecosystem, 450k
(26% market share)
(20% market share)
SBERBANK INVESTOR PRESENTATION
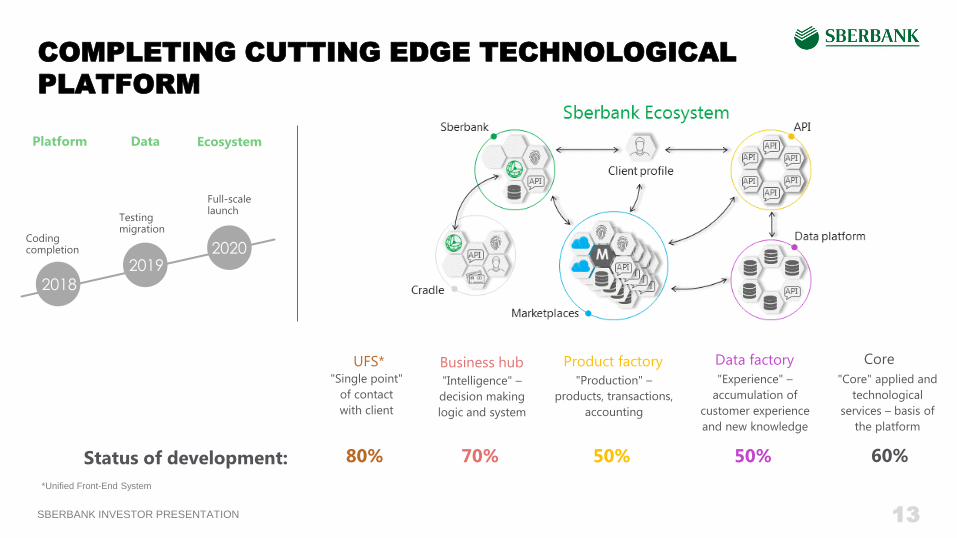
COMPLETING CUTTING EDGE TECHNOLOGICAL
PLATFORM
13
"Production" –
products, transactions,
accounting
"Experience" –
accumulation of
customer experience
and new knowledge
"Intelligence" –
decision making
logic and system
"Core" applied and
technological
services – basis of
the platform
"Single point"
of contact
with client
Product factory Data factory Business hub Core UFS*
Status of development: 80% 70% 50% 50% 60%
Testing migration
Coding completion
2018
Platform
2019
Data
2020
Ecosystem
Full-scale launch
*Unified Front-End System
SBERBANK INVESTOR PRESENTATION
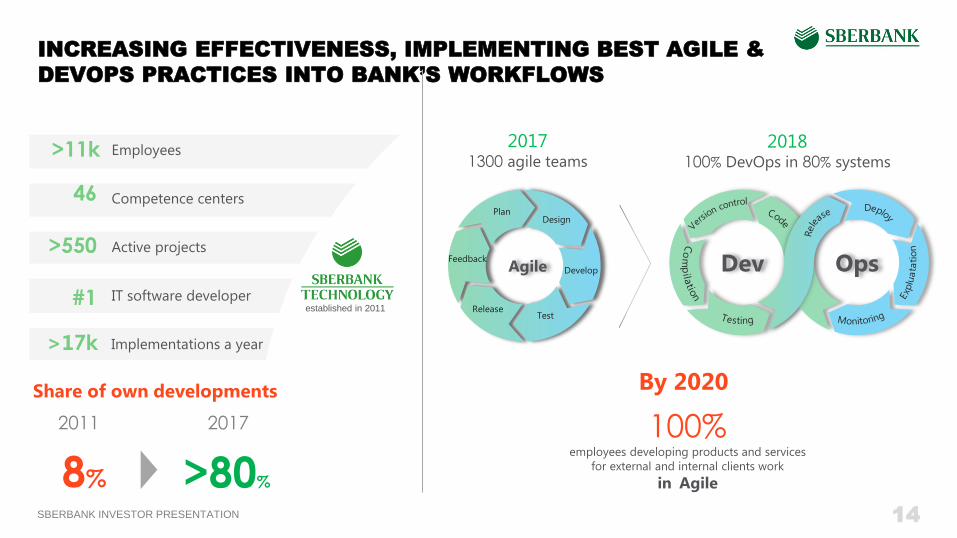
INCREASING EFFECTIVENESS, IMPLEMENTING BEST AGILE &
DEVOPS PRACTICES INTO BANK’S WORKFLOWS
14
established in 2011
Share of own developments
8% >80%
Competence centers
Active projects
>17k Implementations a year
46
>550
IT software developer #1
Employees >11k 2017 1300 agile teams
Agile
Plan Design
Develop
Test Release
Feedback
2018 100% DevOps in 80% systems
Dev Ops
By 2020
100% employees developing products and services
for external and internal clients work
in Agile
SBERBANK INVESTOR PRESENTATION 15
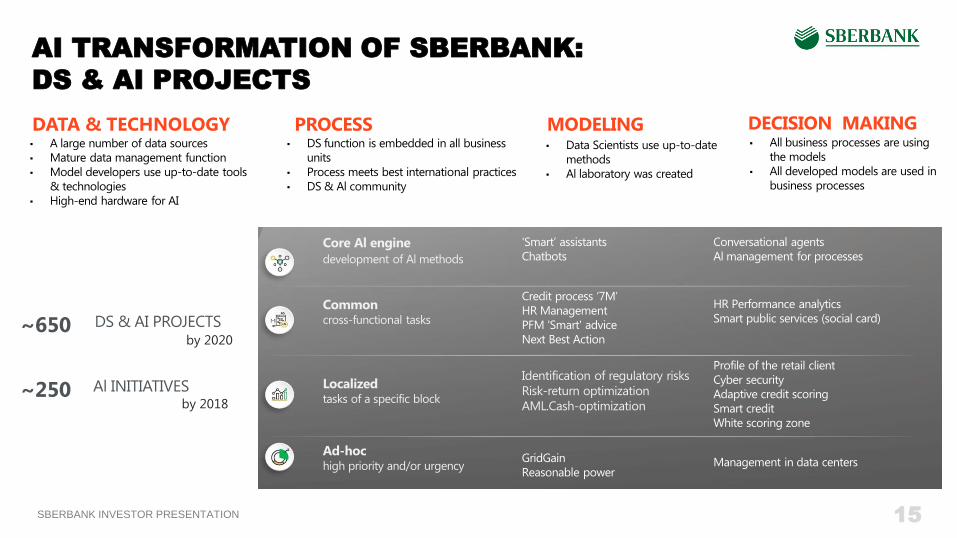
AI TRANSFORMATION OF SBERBANK:
DS & AI PROJECTS
Core Al engine
development of Al methods
'Smart’ assistants
Chatbots
Conversational agents
Al management for processes
Common cross-functional tasks
Credit process ‘7M’
HR Management
PFM 'Smart' advice
Next Best Action
HR Performance analytics
Smart public services (social card)
Localized tasks of a specific block
Identification of regulatory risks
Risk-return optimization
AML.Cash-optimization
Profile of the retail client
Cyber security
Adaptive credit scoring
Smart credit
White scoring zone
Ad-hoc high priority and/or urgency
GridGain
Reasonable power Management in data centers
DS & AI PROJECTS
Al INITIATIVES
~650
~250 by 2018
by 2020
DATA & TECHNOLOGY ▪ A large number of data sources
▪ Mature data management function
▪ Model developers use up-to-date tools
& technologies
▪ High-end hardware for AI
▪ DS function is embedded in all business
units
▪ Process meets best international practices
▪ DS & Al community
PROCESS ▪ Data Scientists use up-to-date
methods
▪ Al laboratory was created
MODELING ▪ All business processes are using
the models
▪ All developed models are used in
business processes
DECISION MAKING
SBERBANK INVESTOR PRESENTATION
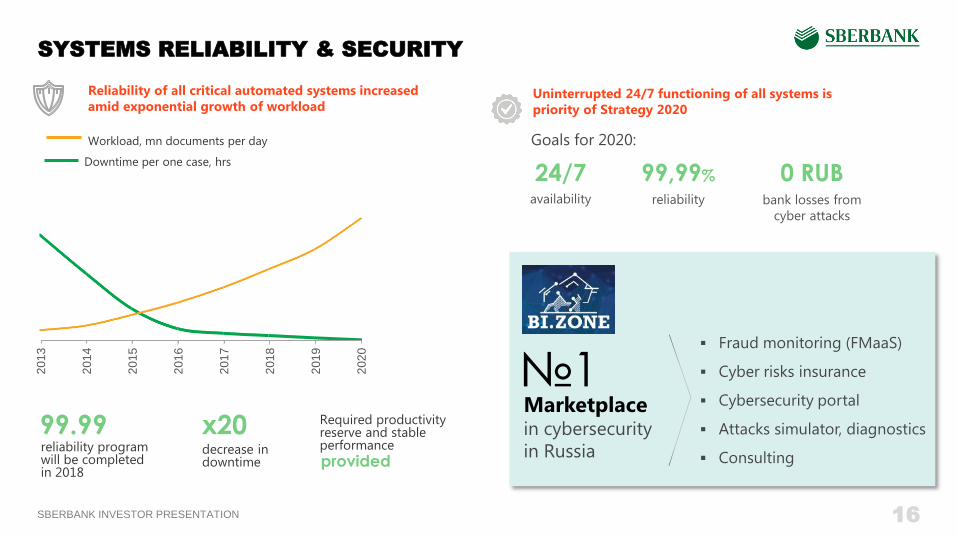
SYSTEMS RELIABILITY & SECURITY
16
Reliability of all critical automated systems increased
amid exponential growth of workload
Workload, mn documents per day
x20 99.99
provided
Required productivity reserve and stable performance
201
3
201
4
201
5
201
6
201
7
201
8
201
9
202
0
Downtime per one case, hrs
reliability program will be completed in 2018
decrease in downtime
Uninterrupted 24/7 functioning of all systems is
priority of Strategy 2020
99,99% 24/7 reliability availability
Goals for 2020:
0 RUB bank losses from
cyber attacks
Fraud monitoring (FMaaS)
Cyber risks insurance
Cybersecurity portal
Attacks simulator, diagnostics
Consulting
Marketplace in cybersecurity
in Russia
№1
SBERBANK INVESTOR PRESENTATION
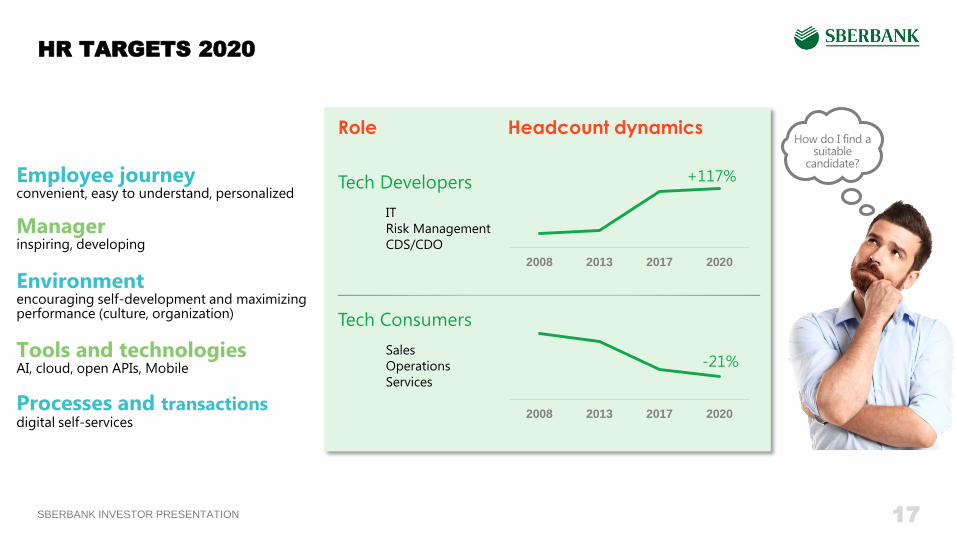
HR TARGETS 2020
17
Environment encouraging self-development and maximizing performance (culture, organization)
Manager inspiring, developing
Tools and technologies AI, cloud, open APIs, Mobile
Processes and transactions digital self-services
Employee journey convenient, easy to understand, personalized
Tech Consumers
Sales
Operations
Services
2008 2013 2017 2020
Tech Developers
IT
Risk Management
CDS/CDO
Headcount dynamics Role
2008 2013 2017 2020
-21%
+117%
How do I find a suitable
candidate?
SBERBANK INVESTOR PRESENTATION
SBERBANK IN BRIEF
SBERBANK STRATEGY 2020
APPENDIX 1: IFRS FINANCIALS
APPENDIX 2: RECENT DEVELOPMENTS
FINANCIAL MODEL 2020
APPENDIX 3: GUIDANCE 2018
SBERBANK INVESTOR PRESENTATION
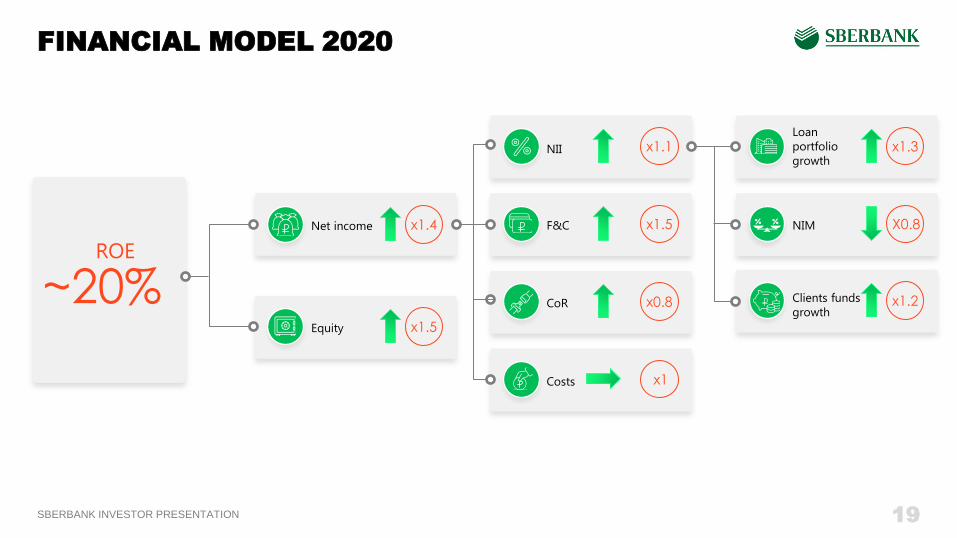
FINANCIAL MODEL 2020
~20% ROE
Equity x1.5
Net income x1.4 F&C х1.5
CoR х0.8
Costs x1
NII х1.1
NIM X0.8
Loan
portfolio
growth х1.3
Clients funds
growth х1.2
19
SBERBANK INVESTOR PRESENTATION
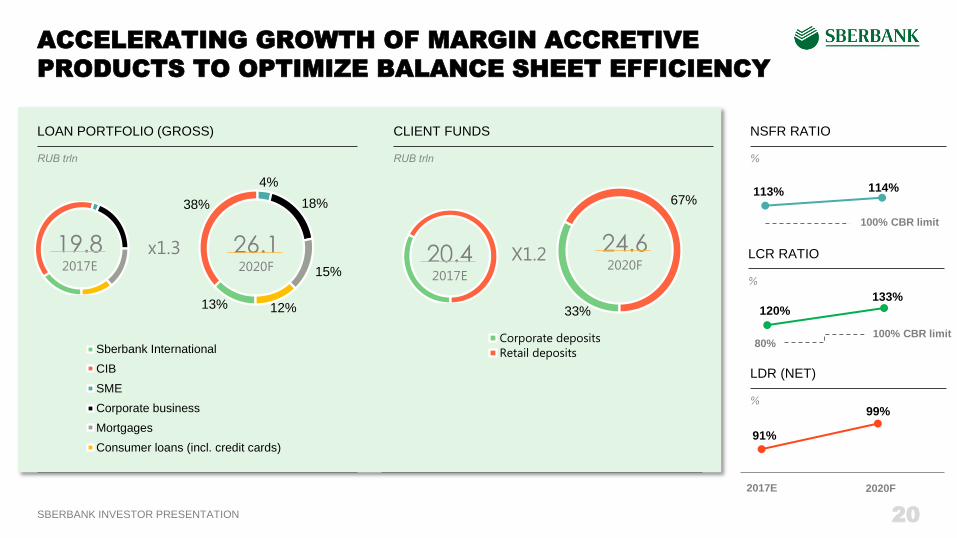
ACCELERATING GROWTH OF MARGIN ACCRETIVE
PRODUCTS TO OPTIMIZE BALANCE SHEET EFFICIENCY
19.8 2017E
26.1 2020F
x1.3 X1.2 20.4 2017E
24.6 2020F
LOAN PORTFOLIO (GROSS) CLIENT FUNDS NSFR RATIO
13%
38%
4%
18%
15%
12%
Sberbank International
CIB
SME
Corporate business
Mortgages
Consumer loans (incl. credit cards)
33%
67%
Corporate deposits
Retail deposits
113% 114%
120% 133%
91%
99%
100% CBR limit
LCR RATIO
LDR (NET)
100% CBR limit 80%
2017E 2020F
20

SBERBANK INVESTOR PRESENTATION
28% 31% 2% 4%
70% 65%
41% 35%
59% 65%
DYNAMIC AI-BASED ASSET & LIABILITIES MANAGEMENT IS
PARTIALLY MITIGATING MARGIN COMPRESSION
NET INTEREST MARGIN OPTIMIZATION
5.7%
~6%
40-50 bps
Slightly
below 5%
SHIFT TO MARGIN ACCRETIVE RUBLE
LENDING
SHIFT TO MARGIN ACCRETIVE RETAIL
AND SME LENDING
64% 61%
36% 39%
TRANSACTIONAL BUSINESS TO REDUCE
COST OF FUNDING
INCREASE SHARE OF LOANS IN TOTAL
ASSETS
FORECAST ACCURACY IMPROVES ASSET
STRUCTURE
66%
71%
91%
99%
OPTIMIZE BALANCE SHEET STRUCTURE
2017E 2020F
Loans to Assets Ratio
Loans to
Deposits Ratio RUB200 bn
2017E 2020F
21
SBERBANK INVESTOR PRESENTATION
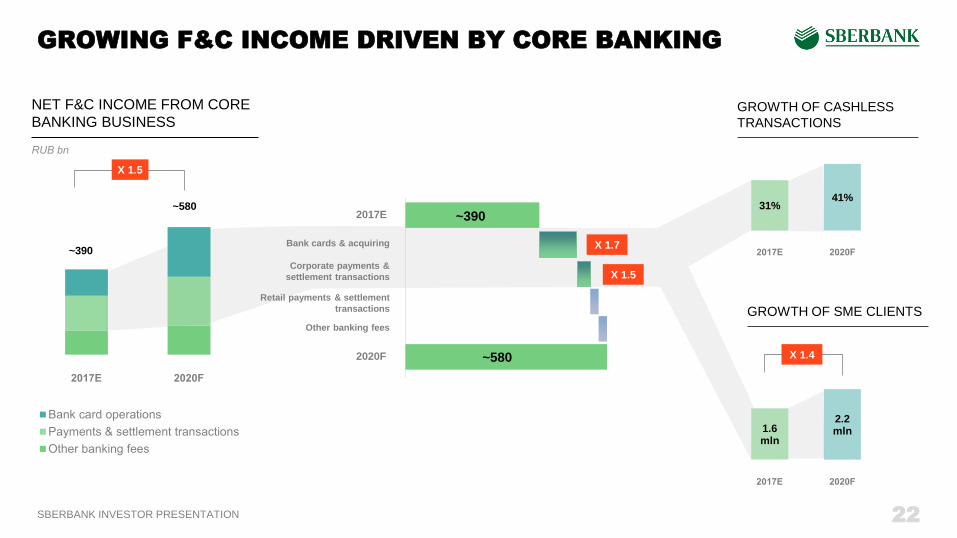
GROWING F&C INCOME DRIVEN BY CORE BANKING
NET F&C INCOME FROM CORE
BANKING BUSINESS
~390
~580
X 1.5
31% 41%
1.6 mln
2.2 mln
X 1.4
GROWTH OF CASHLESS
TRANSACTIONS
GROWTH OF SME CLIENTS
X 1.5
X 1.7
~390
~580
2017E
Corporate payments &
settlement transactions
Retail payments & settlement
transactions
Other banking fees
Bank cards & acquiring
2020F
22

SBERBANK INVESTOR PRESENTATION
INCOME GROWTH OUTSIDE OF CORE BANKING
BUSINESS
25
118
-
20
40
60
80
100
120
140
ASSET MANAGEMENT AND
PENSION FUND MANAGEMENT INSURANCE BROKERAGE
X 5
53
109
-
20
40
60
80
100
120
140
X 2
2.0
7.8
-
10.0
20.0
30.0
40.0
50.0
60.0
X 4
Non-banking financial business
Operating income, RUB bln Revenue from new businesses
Деньги
x11 70 RUB bn
2020
23
SBERBANK INVESTOR PRESENTATION 24
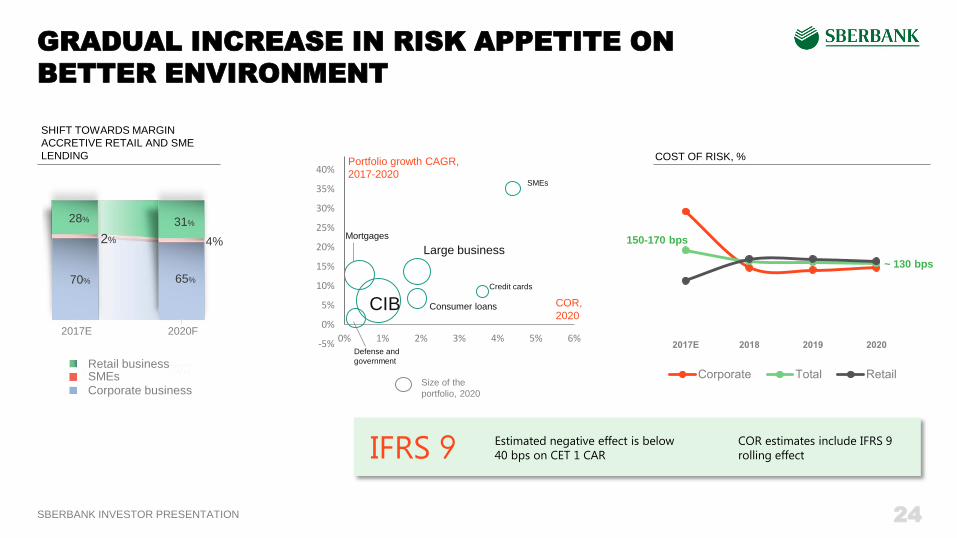
GRADUAL INCREASE IN RISK APPETITE ON
BETTER ENVIRONMENT
IFRS 9 Estimated negative effect is below
40 bps on CET 1 CAR
COR estimates include IFRS 9
rolling effect
31%
4%
65%
28%
2%
70%
SHIFT TOWARDS MARGIN
ACCRETIVE RETAIL AND SME
LENDING
Retail business SMEs Corporate business
Size of the
portfolio, 2020
-5%
0%
5%
10%
15%
20%
25%
30%
35%
40%
0% 1% 2% 3% 4% 5% 6%
COR,
2020
Portfolio growth CAGR,
2017-2020
Large business
SMEs
Credit cards
Consumer loans CIB
Mortgages
Defense and
government
150-170 bps
~ 130 bps
COST OF RISK, %
2017E 2020F
SBERBANK INVESTOR PRESENTATION
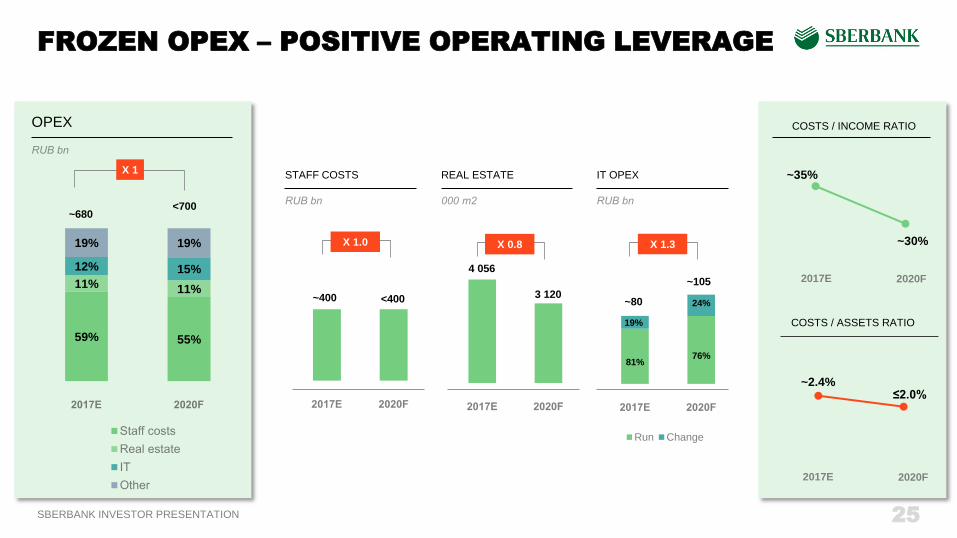
FROZEN OPEX – POSITIVE OPERATING LEVERAGE
OPEX
59% 55%
11% 11%
12% 15%
19% 19%
~680 <700
X 1
COSTS / INCOME RATIO
~35%
~30%
~2.4% ≤2.0%
COSTS / ASSETS RATIO
2017E 2020F
-
50
100
150
200
250
300
350
400
450
X 1.0
-
500
1 000
1 500
2 000
2 500
3 000
3 500
4 000
4 500
X 0.8
81%
76%
19%
24%
-
20.0
40.0
60.0
80.0
100.0
120.0
Run Change
X 1.3
STAFF COSTS REAL ESTATE IT OPEX
~400 <400
4 056
3 120 ~80
~105 2017E 2020F
25
SBERBANK INVESTOR PRESENTATION
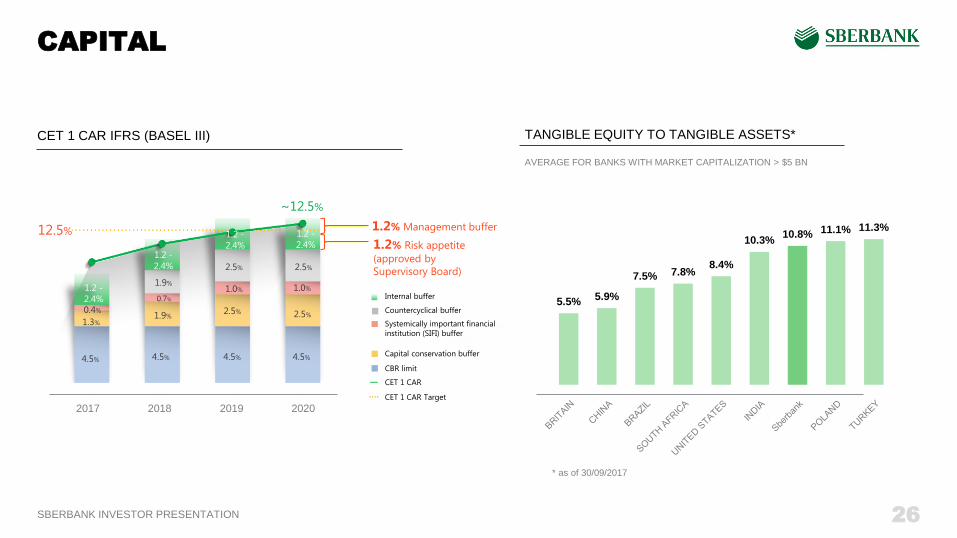
5.5% 5.9%
7.5% 7.8% 8.4%
10.3% 10.8% 11.1% 11.3%
CAPITAL
26
CET 1 CAR IFRS (BASEL III) TANGIBLE EQUITY TO TANGIBLE ASSETS* AVERAGE FOR BANKS WITH MARKET CAPITALIZATION > $5 BN
* as of 30/09/2017
12.5%
~12.5%
1.0%
2.5%
4.5%
0.7%
2.5%
4.5%
1.9%
1.9%
4.5%
1.2 -
2.4%
1.2 -
2.4% 0.4%
1.3%
4.5%
1.2% Management buffer
1.2% Risk appetite
(approved by
Supervisory Board)
1.0%
2017 2018 2019 2020
1.2 -
2.4%
1.2 -
2.4%
2.5% 2.5%
Internal buffer
Systemically important financial
institution (SIFI) buffer
Capital conservation buffer
Countercyclical buffer
CBR limit
CET 1 CAR
CET 1 CAR Target
SBERBANK INVESTOR PRESENTATION
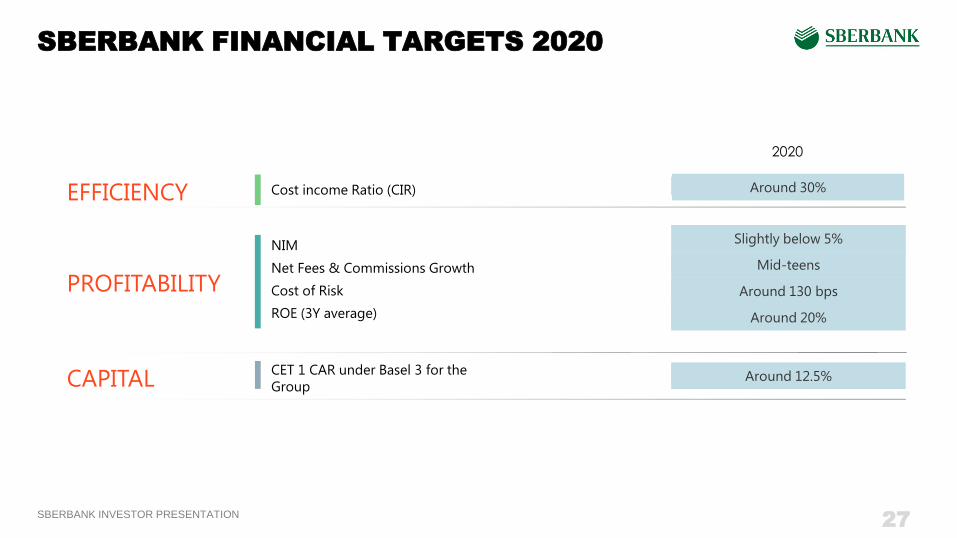
EFFICIENCY Cost income Ratio (CIR)
PROFITABILITY
NIM
Net Fees & Commissions Growth
Cost of Risk
ROE (3Y average)
CAPITAL CET 1 CAR under Basel 3 for the
Group
2020
Around 30%
Slightly below 5%
Mid-teens
Around 130 bps
Around 20%
Around 12.5%
SBERBANK FINANCIAL TARGETS 2020
27
SBERBANK INVESTOR PRESENTATION
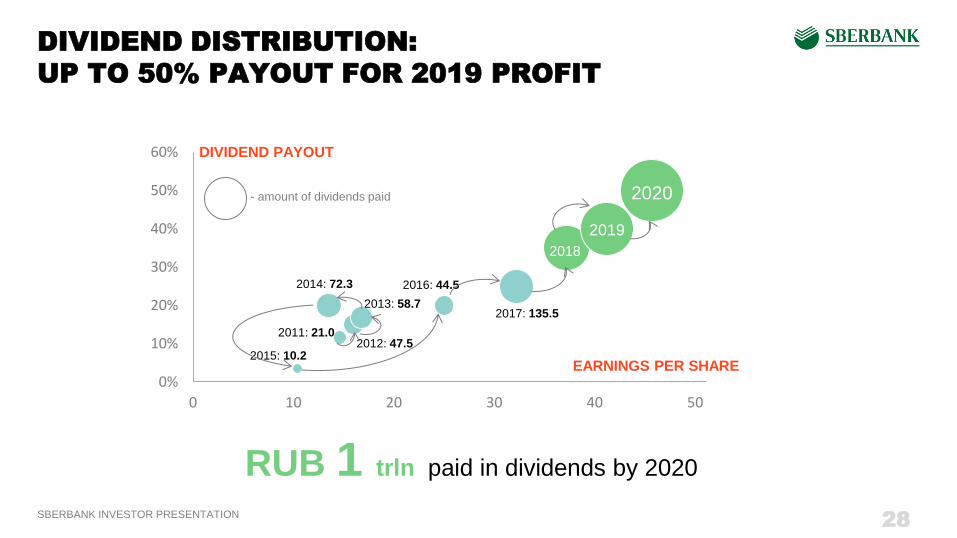
DIVIDEND DISTRIBUTION:
UP TO 50% PAYOUT FOR 2019 PROFIT
RUB 1 trln paid in dividends by 2020
0%
10%
20%
30%
40%
50%
60%
0 10 20 30 40 50 60
2015: 10.2
DIVIDEND PAYOUT
2020 - amount of dividends paid
2011: 21.0 2012: 47.5
2014: 72.3
2013: 58.7
2016: 44.5
2017: 135.5
2019
2018
EARNINGS PER SHARE
28
SBERBANK INVESTOR PRESENTATION
SBERBANK IN BRIEF
SBERBANK STRATEGY 2020
APPENDIX 1: IFRS FINANCIALS
APPENDIX 2: RECENT DEVELOPMENTS
FINANCIAL MODEL 2020
APPENDIX 3: GUIDANCE 2018
SBERBANK INVESTOR PRESENTATION
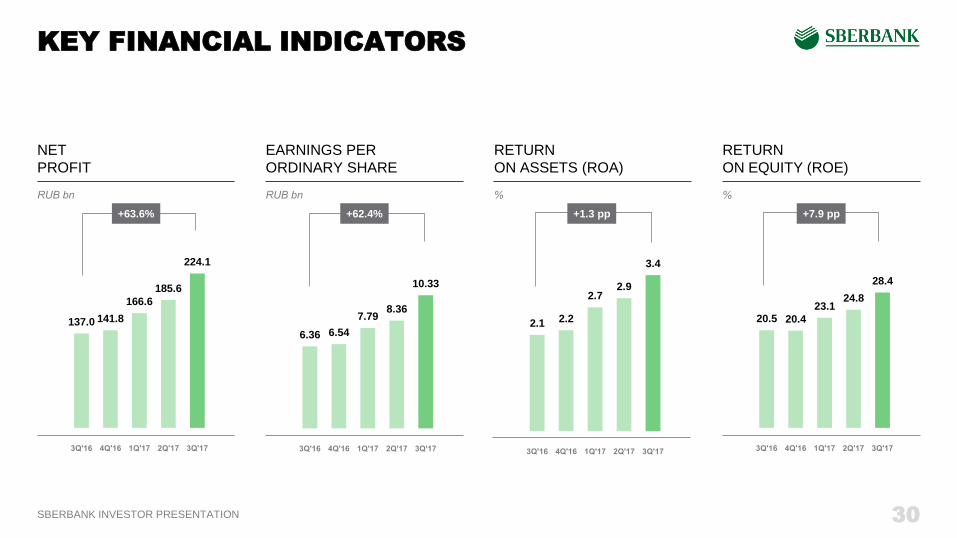
KEY FINANCIAL INDICATORS
30
137.0 141.8
166.6
185.6
224.1
+63.6%
NET
PROFIT
EARNINGS PER
ORDINARY SHARE
RETURN
ON ASSETS (ROA)
RETURN
ON EQUITY (ROE)
6.36 6.54
7.79 8.36
10.33
+62.4%
2.1 2.2
2.7 2.9
3.4
+1.3 pp
20.5 20.4
23.1 24.8
28.4
+7.9 pp
SBERBANK INVESTOR PRESENTATION
OPERATING INCOME
31
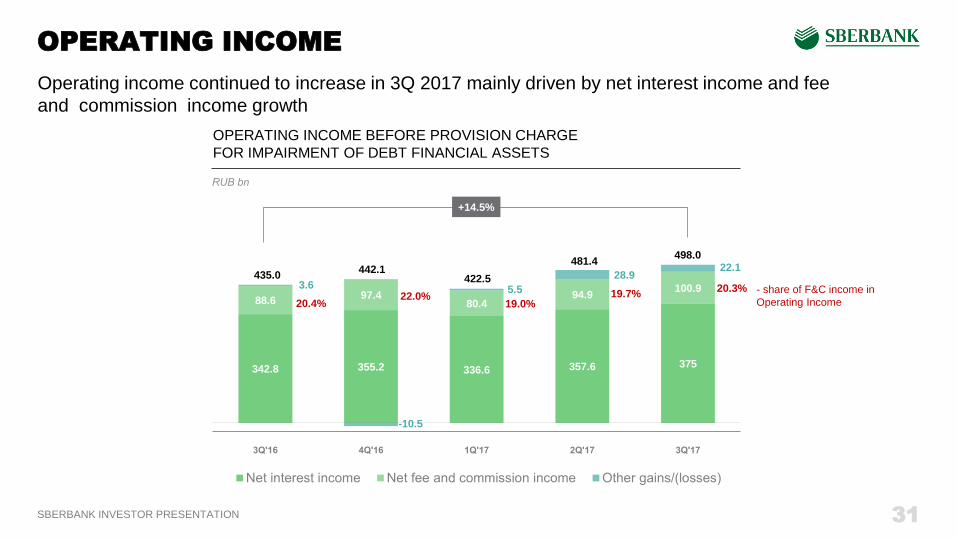
OPERATING INCOME BEFORE PROVISION CHARGE
FOR IMPAIRMENT OF DEBT FINANCIAL ASSETS
342.8 355.2 336.6 357.6 375
88.6 97.4
80.4 94.9
100.9 3.6
-10.5
5.5
28.9 22.1
+14.5%
498.0
20.3%
20.4%
435.0
- share of F&C income in
Operating Income 22.0%
442.1
19.0%
422.5
481.4
19.7%
Operating income continued to increase in 3Q 2017 mainly driven by net interest income and fee
and commission income growth
SBERBANK INVESTOR PRESENTATION
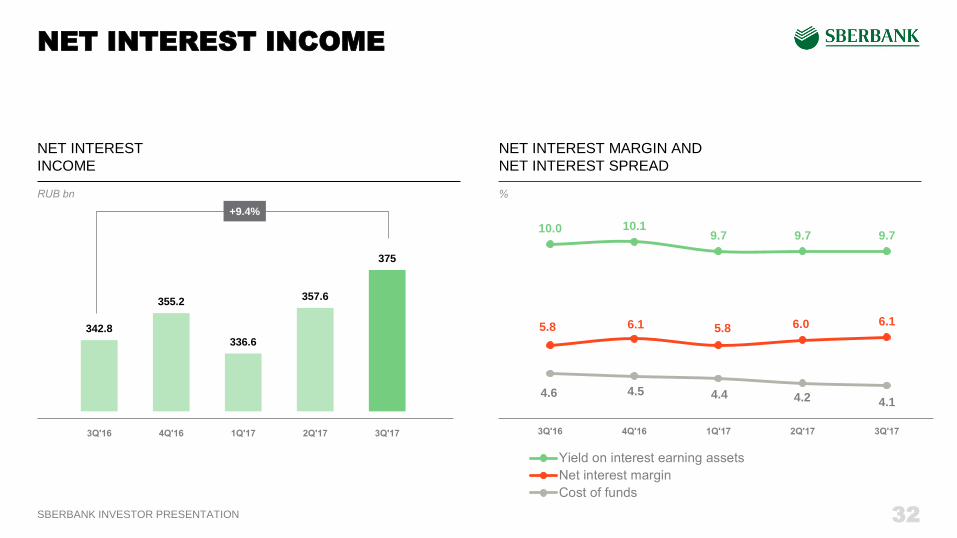
342.8
355.2
336.6
357.6
375
NET INTEREST INCOME
NET INTEREST
INCOME
NET INTEREST MARGIN AND
NET INTEREST SPREAD
10.0 10.1 9.7 9.7 9.7
5.8 6.1 5.8 6.0 6.1
4.6 4.5 4.4 4.2 4.1
+9.4%
32
SBERBANK INVESTOR PRESENTATION
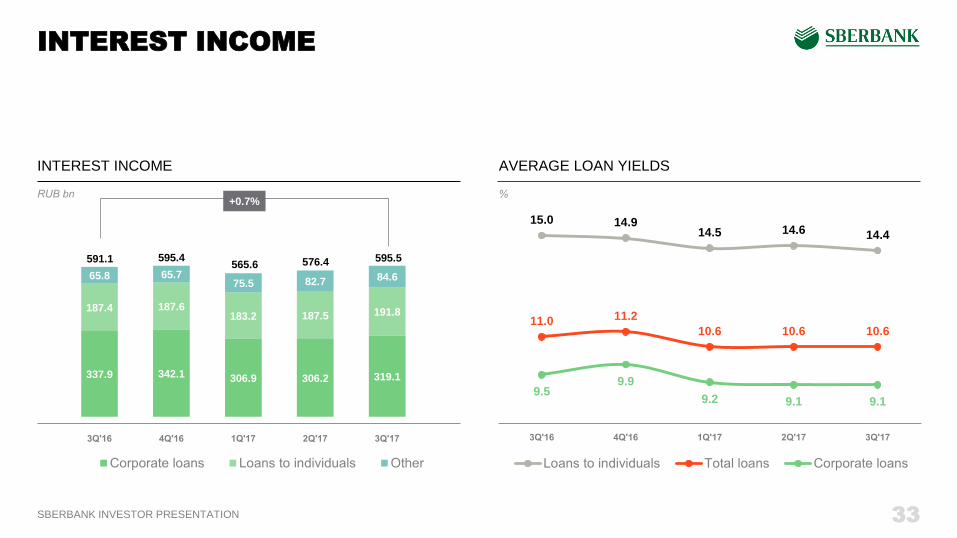
INTEREST INCOME
INTEREST INCOME AVERAGE LOAN YIELDS
15.0 14.9 14.5 14.6 14.4
11.0 11.2
10.6 10.6 10.6
9.5 9.9
9.2 9.1 9.1
337.9 342.1 306.9 306.2 319.1
187.4 187.6 183.2 187.5 191.8
65.8 65.7 75.5 82.7 84.6
+0.7%
33
595.5 591.1 595.4 565.6 576.4
SBERBANK INVESTOR PRESENTATION
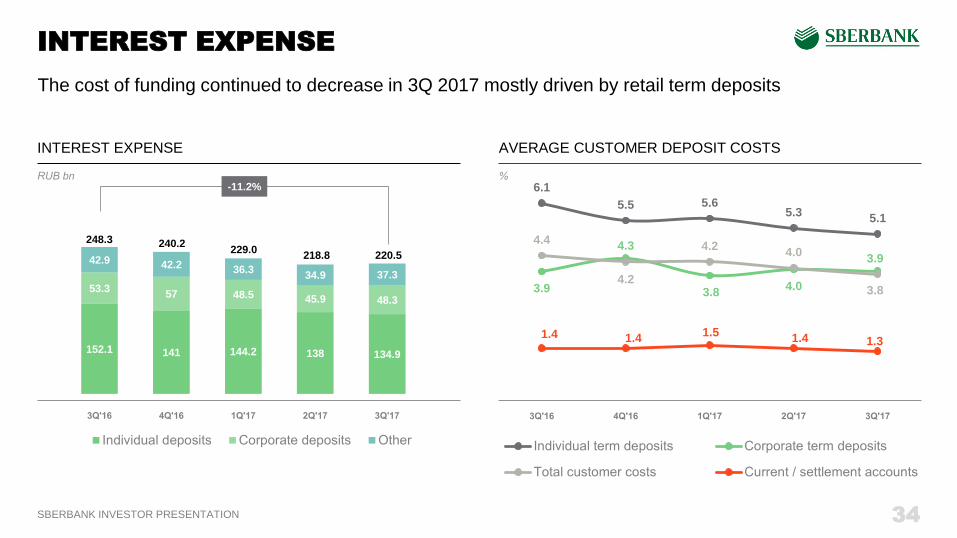
INTEREST EXPENSE
INTEREST EXPENSE AVERAGE CUSTOMER DEPOSIT COSTS
6.1
5.5 5.6 5.3
5.1
3.9
4.3
3.8 4.0
3.9
4.4
4.2
4.2 4.0
3.8
1.4 1.4 1.5
1.4 1.3 152.1 141 144.2 138 134.9
53.3 57 48.5 45.9 48.3
42.9 42.2 36.3 34.9 37.3
-11.2%
34
220.5
248.3
The cost of funding continued to decrease in 3Q 2017 mostly driven by retail term deposits
240.2 229.0
218.8
SBERBANK INVESTOR PRESENTATION
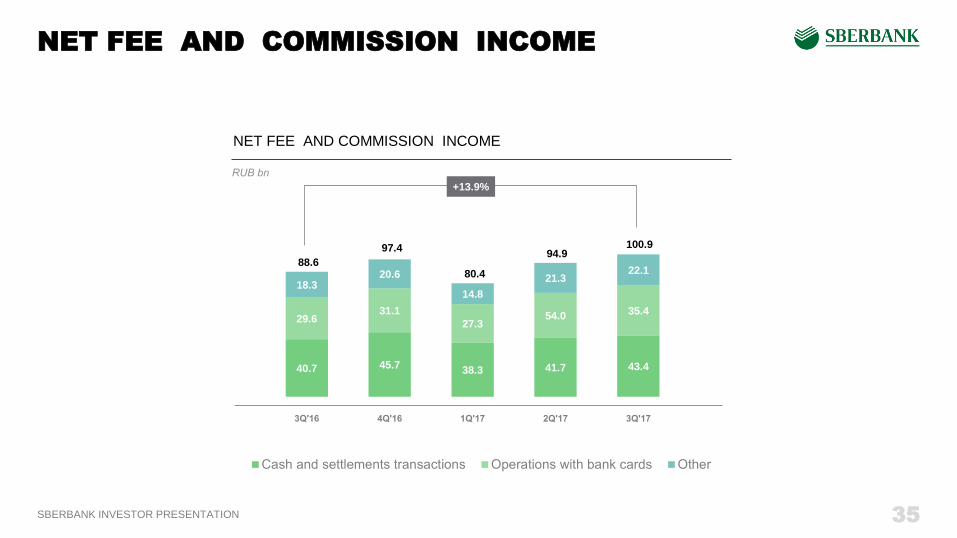
NET FEE AND COMMISSION INCOME
NET FEE AND COMMISSION INCOME
40.7 45.7 38.3 41.7 43.4
29.6 31.1
27.3 54.0 35.4
18.3 20.6
14.8
21.3 22.1
+13.9%
100.9
88.6
97.4
80.4
35
94.9
SBERBANK INVESTOR PRESENTATION
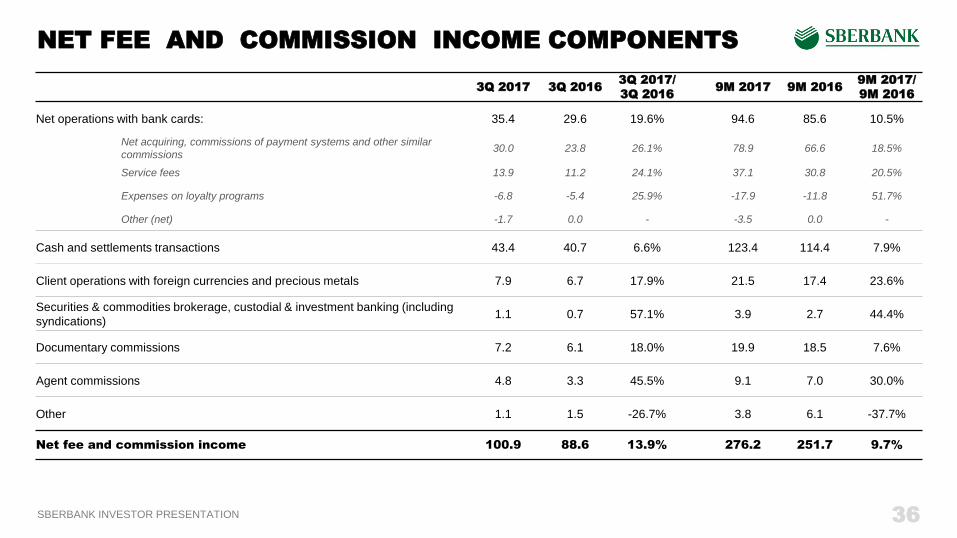
NET FEE AND COMMISSION INCOME COMPONENTS
36
3Q 2017 3Q 2016 3Q 2017/
3Q 2016 9M 2017 9M 2016
9M 2017/
9M 2016
Net operations with bank cards: 35.4 29.6 19.6% 94.6 85.6 10.5%
Net acquiring, commissions of payment systems and other similar
commissions 30.0 23.8 26.1% 78.9 66.6 18.5%
Service fees 13.9 11.2 24.1% 37.1 30.8 20.5%
Expenses on loyalty programs -6.8 -5.4 25.9% -17.9 -11.8 51.7%
Other (net) -1.7 0.0 - -3.5 0.0 -
Cash and settlements transactions 43.4 40.7 6.6% 123.4 114.4 7.9%
Client operations with foreign currencies and precious metals 7.9 6.7 17.9% 21.5 17.4 23.6%
Securities & commodities brokerage, custodial & investment banking (including
syndications) 1.1 0.7 57.1% 3.9 2.7 44.4%
Documentary commissions 7.2 6.1 18.0% 19.9 18.5 7.6%
Agent commissions 4.8 3.3 45.5% 9.1 7.0 30.0%
Other 1.1 1.5 -26.7% 3.8 6.1 -37.7%
Net fee and commission income 100.9 88.6 13.9% 276.2 251.7 9.7%
SBERBANK INVESTOR PRESENTATION
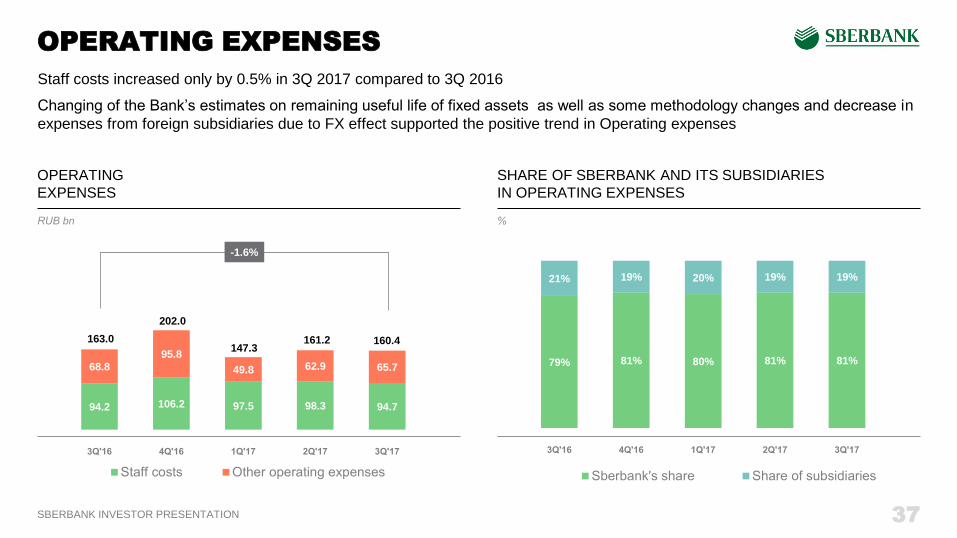
OPERATING EXPENSES
37
OPERATING
EXPENSES
94.2 106.2 97.5 98.3 94.7
68.8
95.8
49.8 62.9 65.7
-1.6%
147.3 160.4
SHARE OF SBERBANK AND ITS SUBSIDIARIES
IN OPERATING EXPENSES
79% 81% 80% 81% 81%
21% 19% 20% 19% 19%
Staff costs increased only by 0.5% in 3Q 2017 compared to 3Q 2016
Changing of the Bank’s estimates on remaining useful life of fixed assets as well as some methodology changes and decrease in
expenses from foreign subsidiaries due to FX effect supported the positive trend in Operating expenses
163.0
202.0
161.2
SBERBANK INVESTOR PRESENTATION
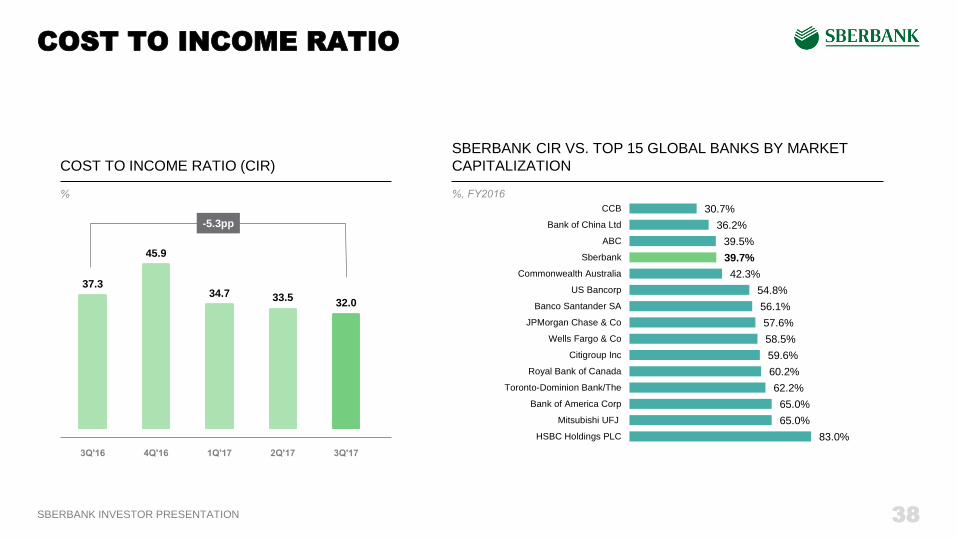
COST TO INCOME RATIO
38
COST TO INCOME RATIO (CIR)
37.3
45.9
34.7 33.5 32.0
30.7%
36.2%
39.5%
39.7%
42.3%
54.8%
56.1%
57.6%
58.5%
59.6%
60.2%
62.2%
65.0%
65.0%
83.0%
CCB
Bank of China Ltd
ABC
Sberbank
Commonwealth Australia
US Bancorp
Banco Santander SA
JPMorgan Chase & Co
Wells Fargo & Co
Citigroup Inc
Royal Bank of Canada
Toronto-Dominion Bank/The
Bank of America Corp
Mitsubishi UFJ
HSBC Holdings PLC
SBERBANK CIR VS. TOP 15 GLOBAL BANKS BY MARKET
CAPITALIZATION
-5.3pp
SBERBANK INVESTOR PRESENTATION
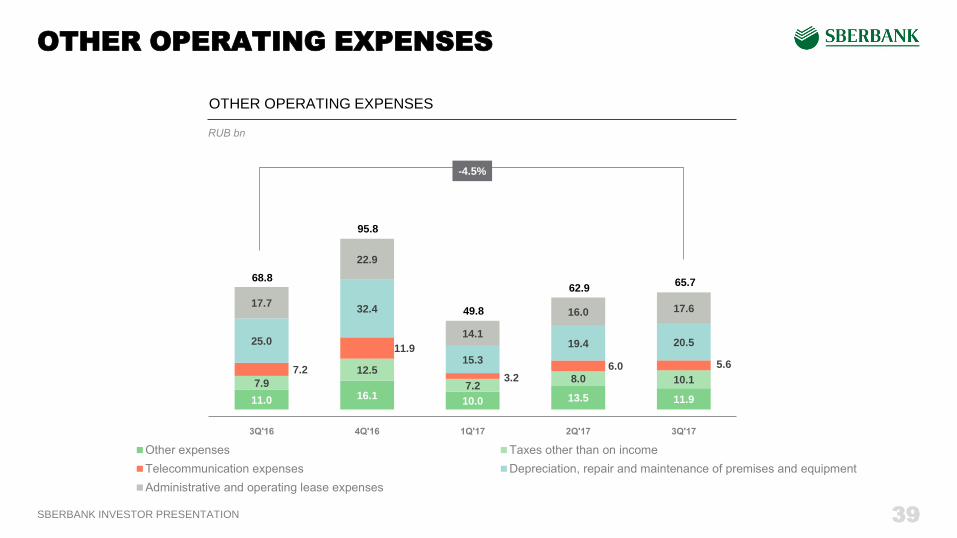
OTHER OPERATING EXPENSES
39
OTHER OPERATING EXPENSES
11.0 16.1 10.0 13.5 11.9
7.9
12.5
7.2 8.0 10.1
7.2
11.9
3.2 6.0 5.6
25.0
32.4
15.3
19.4 20.5
17.7
22.9
14.1
16.0 17.6
-4.5%
49.8
65.7 68.8
95.8
62.9
SBERBANK INVESTOR PRESENTATION
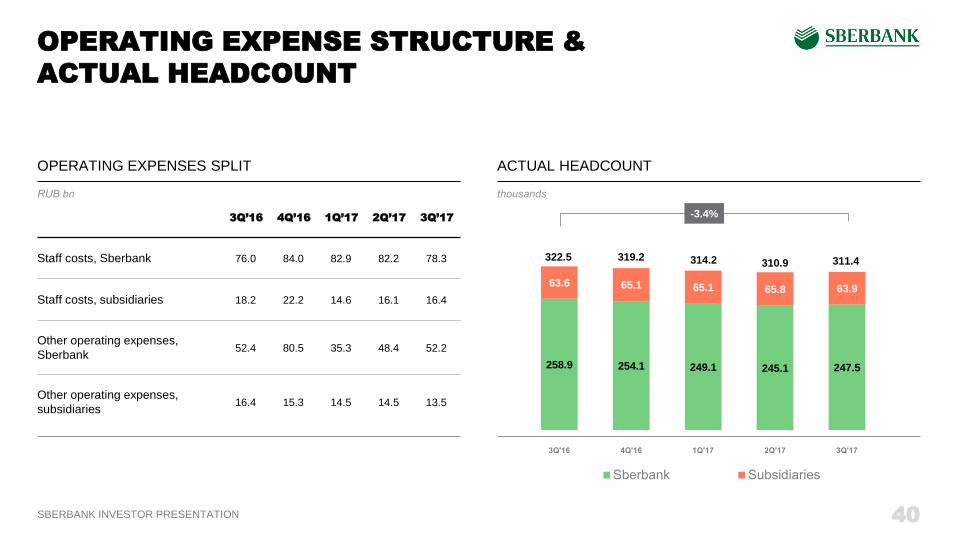
OPERATING EXPENSE STRUCTURE &
ACTUAL HEADCOUNT
40
ACTUAL HEADCOUNT
258.9 254.1 249.1 245.1 247.5
63.6 65.1 65.1 65.8 63.9
-3.4%
311.4
OPERATING EXPENSES SPLIT
3Q’16 4Q’16 1Q’17 2Q’17 3Q’17
Staff costs, Sberbank 76.0 84.0 82.9 82.2 78.3
Staff costs, subsidiaries 18.2 22.2 14.6 16.1 16.4
Other operating expenses,
Sberbank 52.4 80.5 35.3 48.4 52.2
Other operating expenses,
subsidiaries 16.4 15.3 14.5 14.5 13.5
322.5 319.2 314.2 310.9

SBERBANK INVESTOR PRESENTATION
NET PROVISION CHARGE FOR LOAN IMPAIRMENT
41
Cost of risk came in at 152 bp for 9M 2017 within our guidance range
NET PROVISION CHARGE FOR LOAN IMPAIRMENT
102.1
57.7
67.4
88.8
57.8
0
20
40
60
80
100
120
COST OF RISK
2.5
1.5 1.7
2.3
1.4
2.1
1.2
1.5
1.9
1.2 1.1
0.5
0.9 0.9 0.7
-43.4%
SBERBANK INVESTOR PRESENTATION
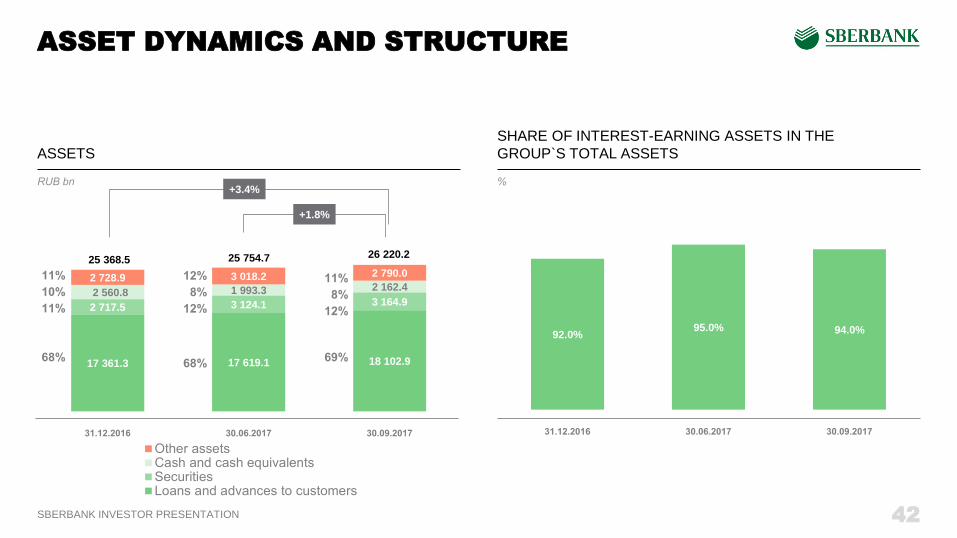
ASSET DYNAMICS AND STRUCTURE
42
ASSETS
17 361.3 17 619.1 18 102.9
2 717.5 3 124.1 3 164.9 2 560.8 1 993.3 2 162.4 2 728.9 3 018.2 2 790.0
+3.4%
26 220.2 25 754.7
+1.8%
SHARE OF INTEREST-EARNING ASSETS IN THE
GROUP`S TOTAL ASSETS
92.0% 95.0% 94.0%
25 368.5
SBERBANK INVESTOR PRESENTATION
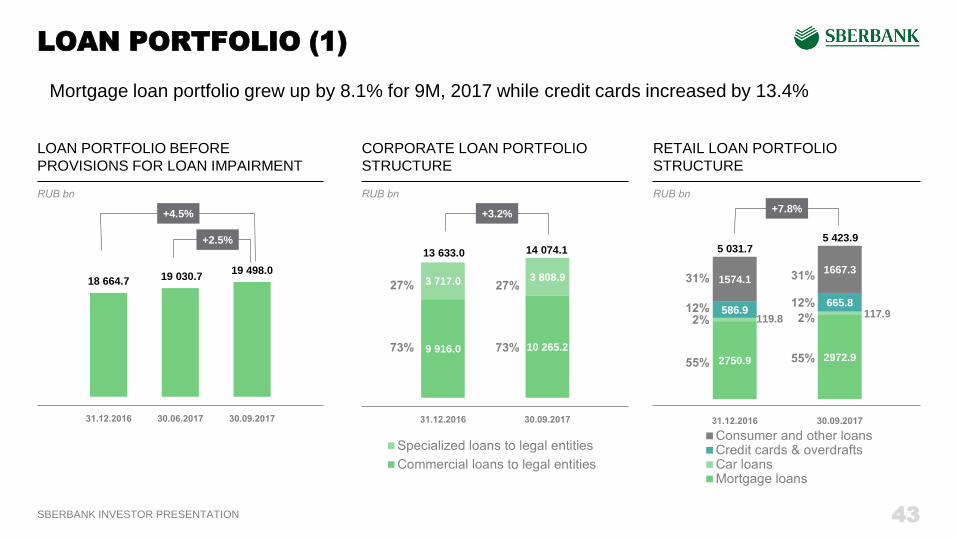
LOAN PORTFOLIO (1)
43
LOAN PORTFOLIO BEFORE
PROVISIONS FOR LOAN IMPAIRMENT
18 664.7 19 030.7 19 498.0
+4.5%
+2.5%
CORPORATE LOAN PORTFOLIO
STRUCTURE
RETAIL LOAN PORTFOLIO
STRUCTURE
9 916.0 10 265.2
3 717.0 3 808.9
13 633.0 14 074.1
+3.2%
2750.9 2972.9
119.8 117.9 586.9
665.8
1574.1 1667.3
5 031.7 5 423.9
+7.8%
Mortgage loan portfolio grew up by 8.1% for 9M, 2017 while credit cards increased by 13.4%
SBERBANK INVESTOR PRESENTATION
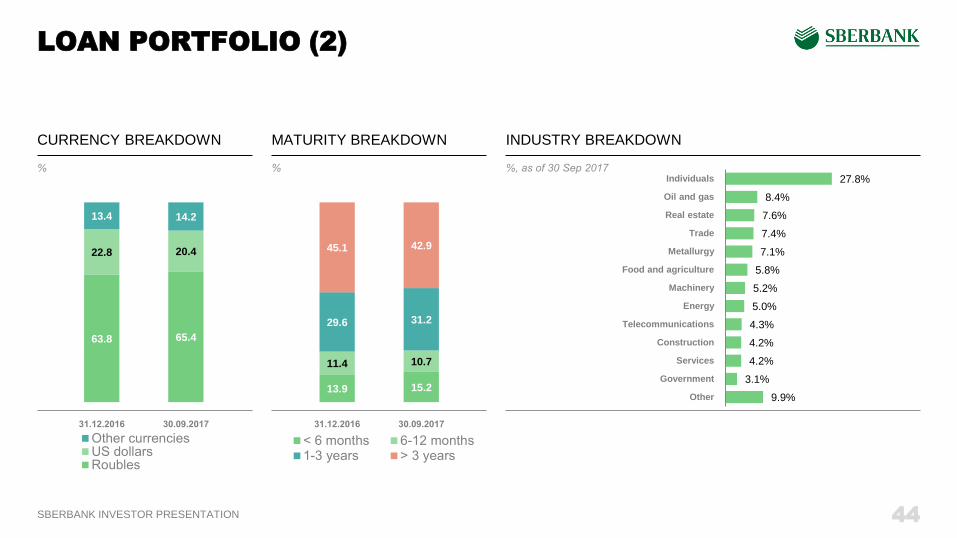
27.8%
8.4%
7.6%
7.4%
7.1%
5.8%
5.2%
5.0%
4.3%
4.2%
4.2%
3.1%
9.9%
Individuals
Oil and gas
Real estate
Trade
Metallurgy
Food and agriculture
Machinery
Energy
Telecommunications
Construction
Services
Government
Other
LOAN PORTFOLIO (2)
44
CURRENCY BREAKDOWN INDUSTRY BREAKDOWN MATURITY BREAKDOWN
13.9 15.2
11.4 10.7
29.6 31.2
45.1 42.9
63.8 65.4
22.8 20.4
13.4 14.2
SBERBANK INVESTOR PRESENTATION
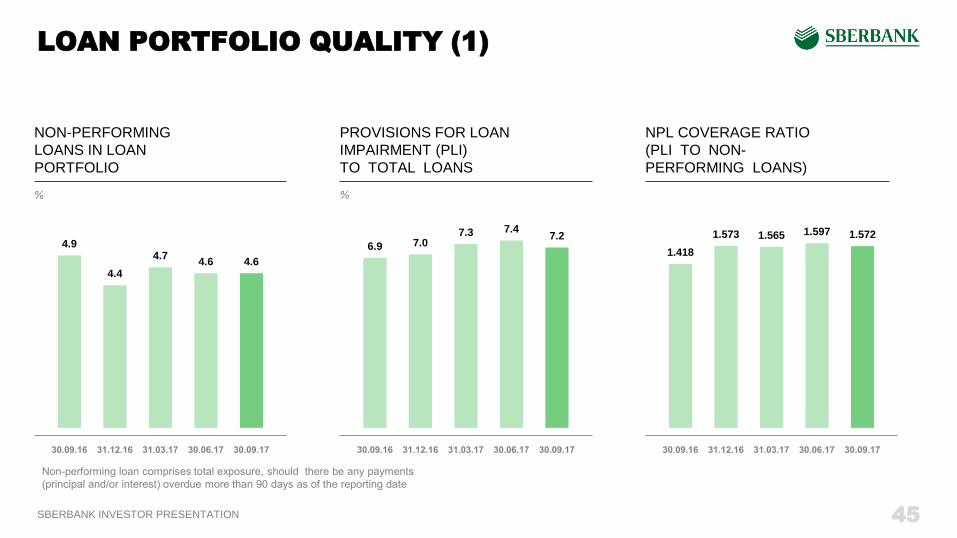
LOAN PORTFOLIO QUALITY (1)
45
NON-PERFORMING
LOANS IN LOAN
PORTFOLIO
PROVISIONS FOR LOAN
IMPAIRMENT (PLI)
TO TOTAL LOANS
NPL COVERAGE RATIO
(PLI TO NON-
PERFORMING LOANS)
4.9
4.4
4.7 4.6 4.6
6.9 7.0 7.3 7.4
7.2
1.418
1.573 1.565 1.597 1.572
SBERBANK INVESTOR PRESENTATION
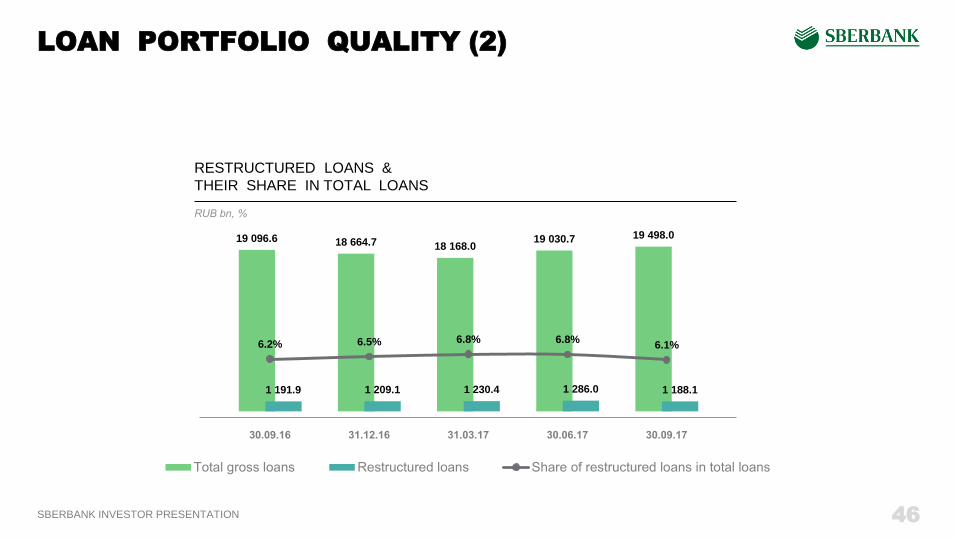
19 096.6 18 664.7 18 168.0 19 030.7 19 498.0
1 191.9 1 209.1 1 230.4 1 286.0 1 188.1
6.2% 6.5% 6.8% 6.8% 6.1%
0
2000
4000
6000
8000
10000
12000
14000
16000
18000
20000
LOAN PORTFOLIO QUALITY (2)
46
RESTRUCTURED LOANS &
THEIR SHARE IN TOTAL LOANS
SBERBANK INVESTOR PRESENTATION
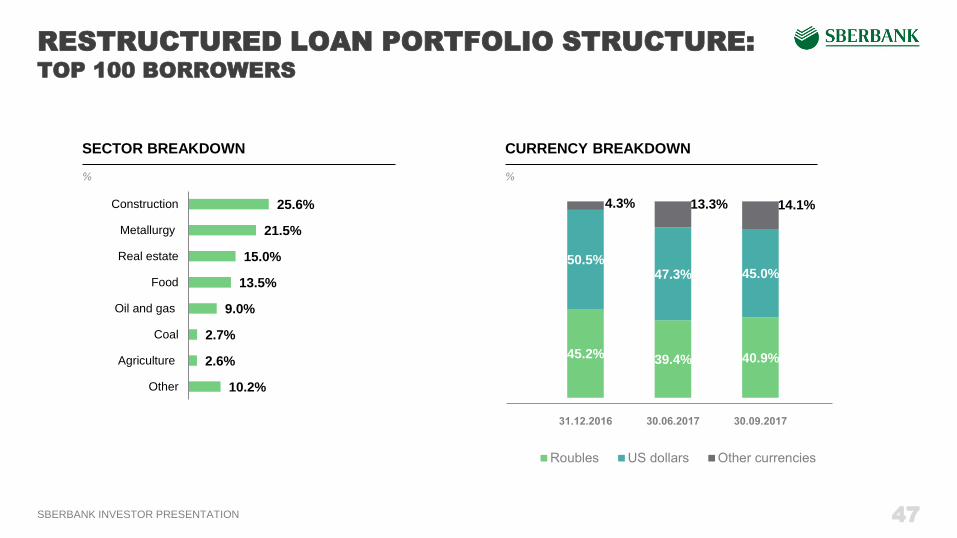
10.2%
2.6%
2.7%
9.0%
13.5%
15.0%
21.5%
25.6%
Other
Agriculture
Coal
Oil and gas
Food
Real estate
Metallurgy
Construction
RESTRUCTURED LOAN PORTFOLIO STRUCTURE:
TOP 100 BORROWERS
47
SECTOR BREAKDOWN CURRENCY BREAKDOWN
45.2% 39.4% 40.9%
50.5% 47.3% 45.0%
4.3% 13.3% 14.1%
SBERBANK INVESTOR PRESENTATION
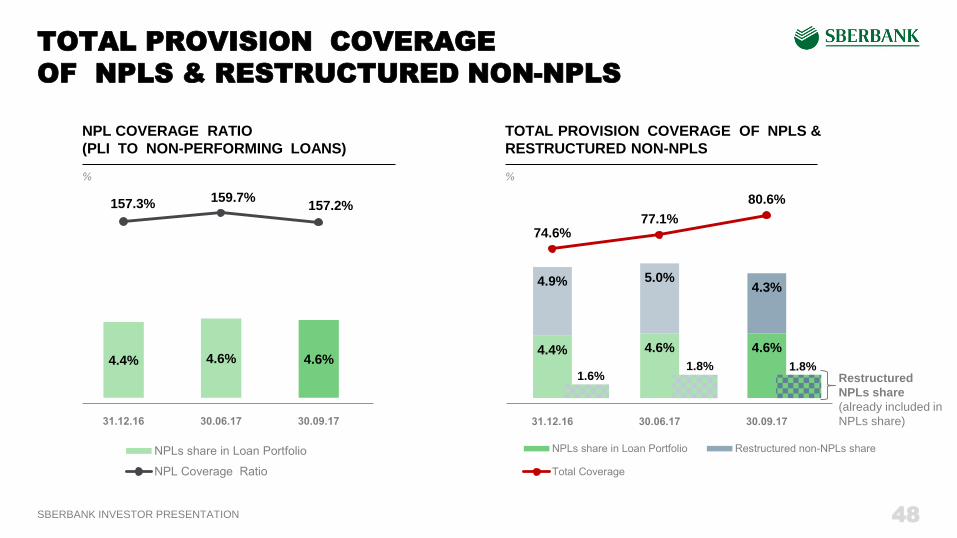
4.4% 4.6% 4.6%
157.3% 159.7%
157.2%
0
0.02
0.04
0.06
0.08
0.1
0.12
TOTAL PROVISION COVERAGE
OF NPLS & RESTRUCTURED NON-NPLS
48
NPL COVERAGE RATIO
(PLI TO NON-PERFORMING LOANS)
TOTAL PROVISION COVERAGE OF NPLS &
RESTRUCTURED NON-NPLS
4.4% 4.6% 4.6%
4.9% 5.0% 4.3%
74.6% 77.1%
80.6%
0.48
0.53
0.58
0.63
0.68
0.73
0.78
0.83
0
0.02
0.04
0.06
0.08
0.1
0.12
0.14
Restructured
NPLs share
(already included in
NPLs share)
1.6% 1.8% 1.8%
SBERBANK INVESTOR PRESENTATION
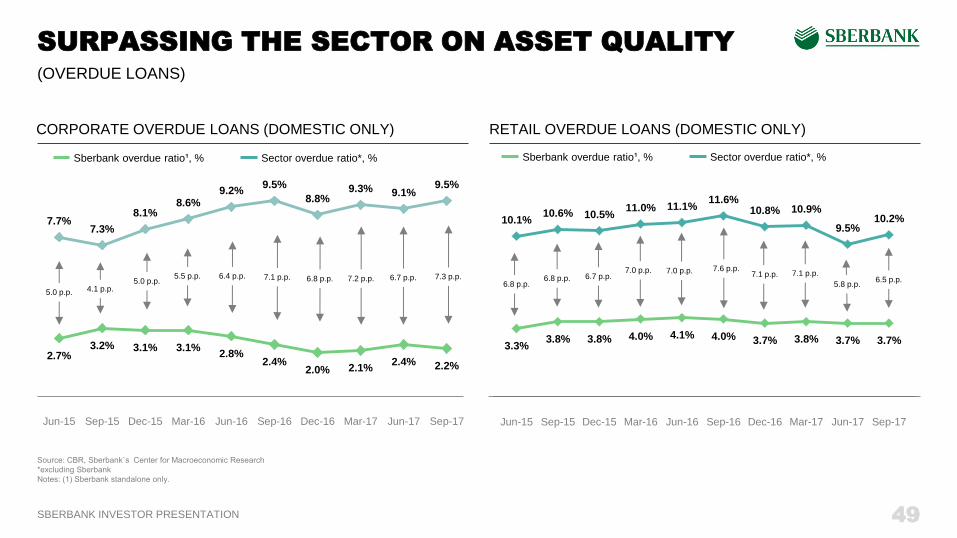
3.3% 3.8% 3.8% 4.0% 4.1% 4.0% 3.7% 3.8% 3.7% 3.7%
10.1% 10.6% 10.5%
11.0% 11.1% 11.6%
10.8% 10.9%
9.5% 10.2%
Jun-15 Sep-15 Dec-15 Mar-16 Jun-16 Sep-16 Dec-16 Mar-17 Jun-17 Sep-17
SURPASSING THE SECTOR ON ASSET QUALITY
49
(OVERDUE LOANS)
CORPORATE OVERDUE LOANS (DOMESTIC ONLY) RETAIL OVERDUE LOANS (DOMESTIC ONLY)
2.7% 3.2% 3.1% 3.1%
2.8% 2.4%
2.0% 2.1% 2.4% 2.2%
7.7% 7.3%
8.1% 8.6%
9.2% 9.5%
8.8% 9.3% 9.1%
9.5%
Jun-15 Sep-15 Dec-15 Mar-16 Jun-16 Sep-16 Dec-16 Mar-17 Jun-17 Sep-17
Sberbank overdue ratio¹, % Sector overdue ratio*, %
5.0 p.p. 4.1 p.p. 5.0 p.p.
5.5 p.p. 6.4 p.p.
Sberbank overdue ratio¹, % Sector overdue ratio*, %
6.8 p.p. 6.5 p.p. 6.8 p.p. 6.7 p.p.
7.0 p.p. 7.0 p.p. 7.1 p.p.
7.6 p.p.
6.8 p.p. 7.1 p.p.
7.2 p.p. 6.7 p.p. 7.1 p.p.
5.8 p.p. 7.3 p.p.
SBERBANK INVESTOR PRESENTATION
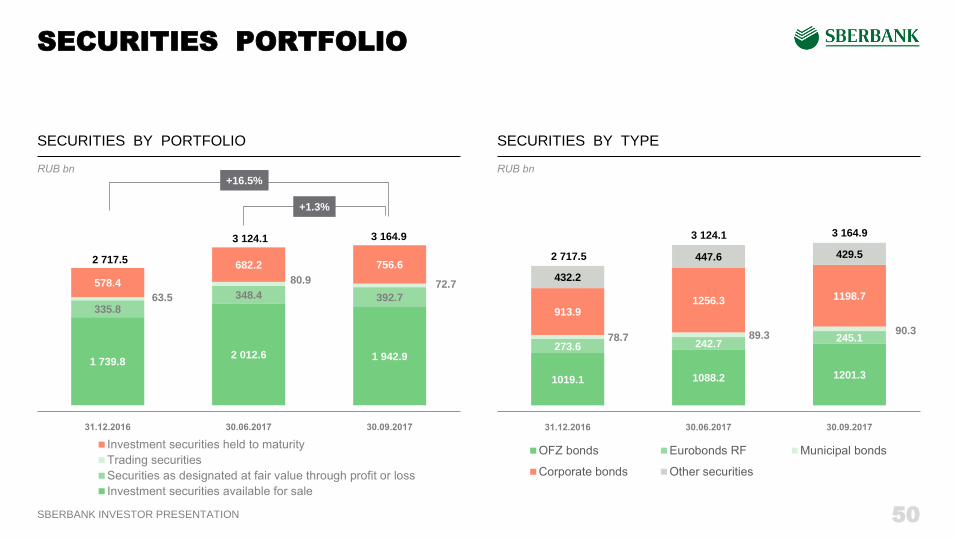
1019.1 1088.2 1201.3
273.6 242.7 245.1 78.7 89.3 90.3
913.9 1256.3 1198.7
432.2
447.6 429.5
1 739.8 2 012.6 1 942.9
335.8
348.4 392.7 63.5
80.9 72.7 578.4
682.2 756.6
SECURITIES PORTFOLIO
50
SECURITIES BY PORTFOLIO
+16.5%
3 164.9
2 717.5
+1.3%
SECURITIES BY TYPE
3 124.1 3 164.9
2 717.5
3 124.1
SBERBANK INVESTOR PRESENTATION
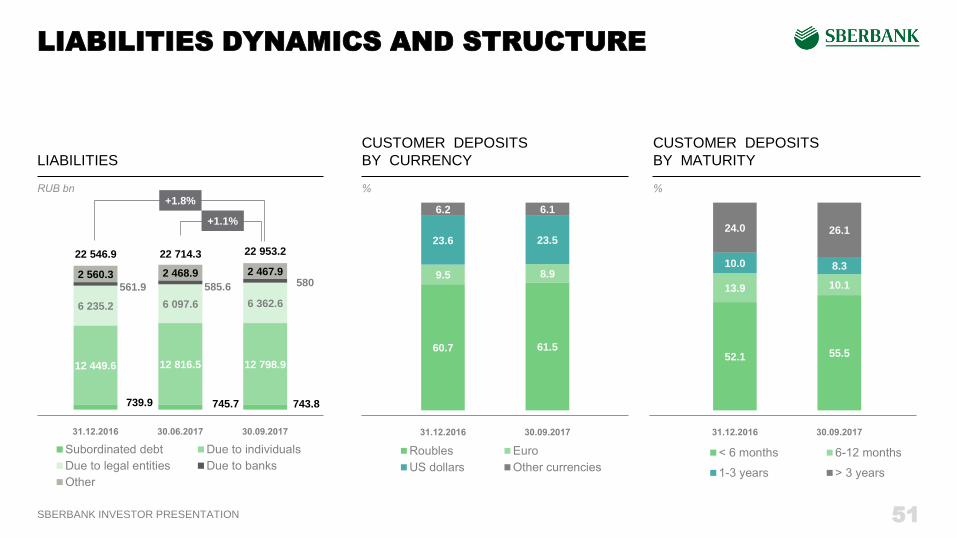
LIABILITIES DYNAMICS AND STRUCTURE
51
LIABILITIES
CUSTOMER DEPOSITS
BY CURRENCY
CUSTOMER DEPOSITS
BY MATURITY
739.9 745.7 743.8
12 449.6 12 816.5 12 798.9
6 235.2 6 097.6 6 362.6
561.9 585.6 580 2 560.3 2 468.9 2 467.9
+1.8%
+1.1%
22 546.9 22 953.2
60.7 61.5
9.5 8.9
23.6 23.5
6.2 6.1
52.1 55.5
13.9 10.1
10.0 8.3
24.0 26.1
22 714.3
SBERBANK INVESTOR PRESENTATION
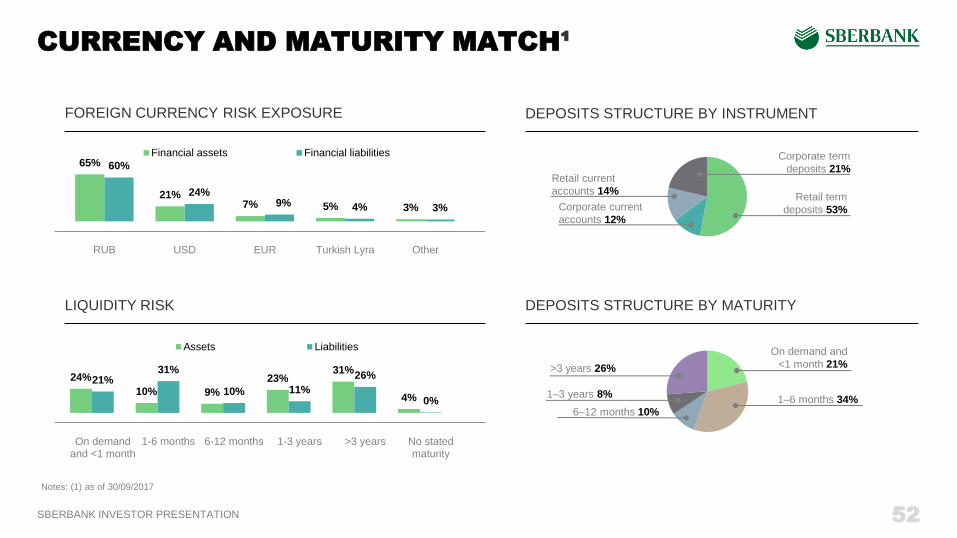
CURRENCY AND MATURITY MATCH¹
52
Retail term
deposits 53%
Retail current
accounts 14%
Corporate current
accounts 12%
Corporate term
deposits 21%
>3 years 26%
On demand and
<1 month 21%
1–3 years 8% 1–6 months 34%
6–12 months 10%
65%
21% 7% 5% 3%
60%
24% 9% 4% 3%
RUB USD EUR Turkish Lyra Other
Financial assets Financial liabilities
24%
10% 9%
23% 31%
4%
21% 31%
10% 11%
26%
0%
On demandand <1 month
1-6 months 6-12 months 1-3 years >3 years No statedmaturity
Assets Liabilities
Notes: (1) as of 30/09/2017
FOREIGN CURRENCY RISK EXPOSURE
LIQUIDITY RISK
DEPOSITS STRUCTURE BY INSTRUMENT
DEPOSITS STRUCTURE BY MATURITY
SBERBANK INVESTOR PRESENTATION
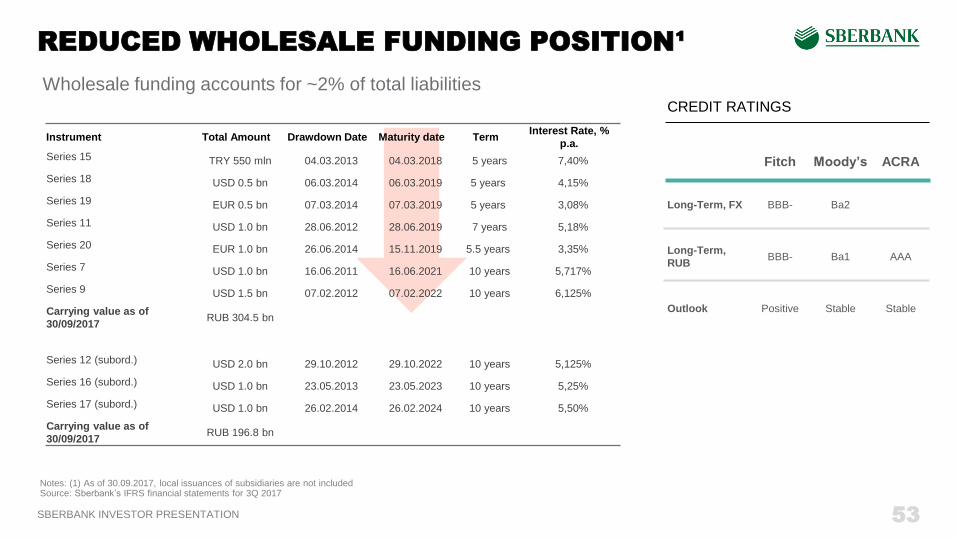
REDUCED WHOLESALE FUNDING POSITION¹
53
Instrument Total Amount Drawdown Date Maturity date Term Interest Rate, %
p.a.
Series 15 TRY 550 mln 04.03.2013 04.03.2018 5 years 7,40%
Series 18 USD 0.5 bn 06.03.2014 06.03.2019 5 years 4,15%
Series 19 EUR 0.5 bn 07.03.2014 07.03.2019 5 years 3,08%
Series 11 USD 1.0 bn 28.06.2012 28.06.2019 7 years 5,18%
Series 20 EUR 1.0 bn 26.06.2014 15.11.2019 5.5 years 3,35%
Series 7 USD 1.0 bn 16.06.2011 16.06.2021 10 years 5,717%
Series 9 USD 1.5 bn 07.02.2012 07.02.2022 10 years 6,125%
Carrying value as of
30/09/2017 RUB 304.5 bn
Series 12 (subord.) USD 2.0 bn 29.10.2012 29.10.2022 10 years 5,125%
Series 16 (subord.) USD 1.0 bn 23.05.2013 23.05.2023 10 years 5,25%
Series 17 (subord.) USD 1.0 bn 26.02.2014 26.02.2024 10 years 5,50%
Carrying value as of
30/09/2017 RUB 196.8 bn
Notes: (1) As of 30.09.2017, local issuances of subsidiaries are not included Source: Sberbank’s IFRS financial statements for 3Q 2017
Wholesale funding accounts for ~2% of total liabilities
Fitch Moody’s ACRA
Long-Term, FX BBB- Ba2
Long-Term,
RUB BBB- Ba1 AAA
Outlook Positive Stable Stable
CREDIT RATINGS
SBERBANK INVESTOR PRESENTATION
WHY SBERBANK
SBERBANK STRATEGY 2020
APPENDIX 2: IFRS FINANCIALS
APPENDIX 3: RECENT DEVELOPMENTS
FINANCIAL MODEL 2020
APPENDIX 4: GUIDANCE 2018
SBERBANK INVESTOR PRESENTATION
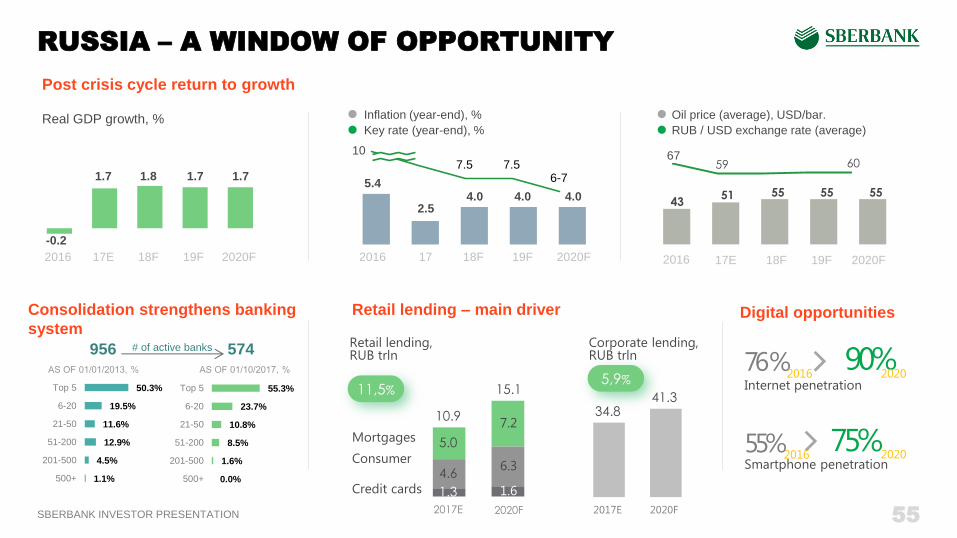
Post crisis cycle return to growth
Real GDP growth, %
59 60
4.0
17 2020F 18F
4.0
19F
4.0
2016
2.5
5.4
7.5 7.5 6-7
10
Key rate (year-end), %
Inflation (year-end), %
43 51 55 55 55
17E 2016 18F 19F 2020F
Oil price (average), USD/bar.
RUB / USD exchange rate (average)
1.8
-0.2
1.7
17E 2016 2020F 19F
1.7
18F
1.7
67
RUSSIA – A WINDOW OF OPPORTUNITY
Digital opportunities
76% Internet penetration
55% Smartphone penetration
Retail lending – main driver
Retail lending, RUB trln
Corporate lending, RUB trln
2017E 2020F 2020F
Credit cards
10.9 7.2
4.6
5.0
6.3
15.1
Consumer
Mortgages
11,5%
34.8 41.3
5,9%
2017Е
1.3 1.6
55
90%
75% 1.1%
4.5%
12.9%
11.6%
19.5%
50.3%
500+
201-500
51-200
21-50
6-20
Top 5
0.0%
1.6%
8.5%
10.8%
23.7%
55.3%
500+
201-500
51-200
21-50
6-20
Top 5
Consolidation strengthens banking
system
956 574 # of active banks
2020
2020
2016
2016

SBERBANK INVESTOR PRESENTATION
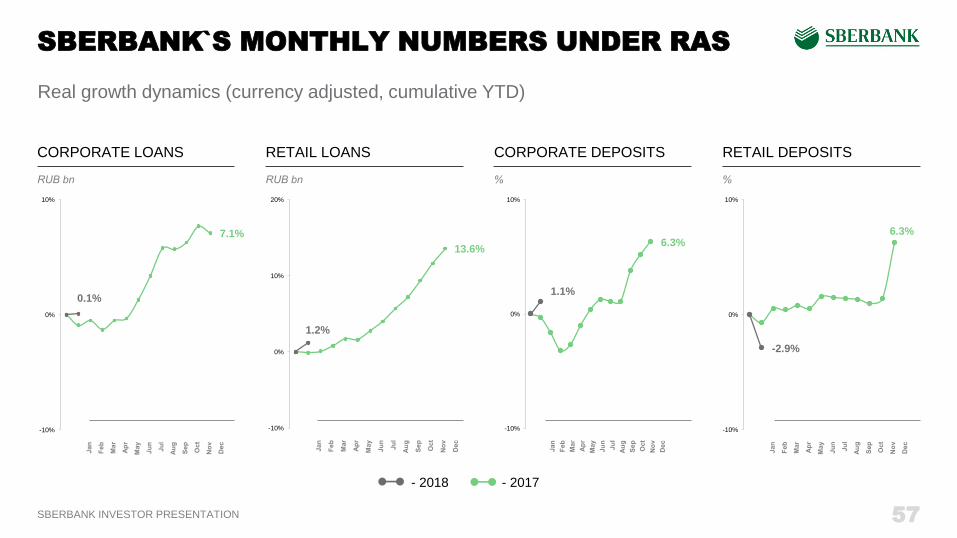
SBERBANK MONTHLY NUMBERS UNDER RAS
56
RUB, mln 1M 2018 1M 2017 1M 2018 vs. 1M 2017
Net interest income 102 827 95 742 7.4%
Net fee and commission income 26 421 21 960 20.3%
Net gain / (loss) from FX revaluation and trading operations 1 035 5 411 -80.9%
Total provision (charge)/gain -13 245 -20 195 34.4%
Cost of risk 0.9% 1.5% -0.6 pp
Operating costs -36 141 -29 024 24.5%
Cost-to-income ratio 27.6% 23.2% 4.4 pp
Pre-tax Profit before provisions 94 786 96 095 -1.4%
Net profit 65 333 57 926 12.8%
Return on assets (ROA) 3.3% 3.1% 0.2 pp
Return of equity (ROE) 22.6% 23.8% -1.2 pp
SBERBANK INVESTOR PRESENTATION
7.1%
0.1%
-10%
0%
10%
SBERBANK`S MONTHLY NUMBERS UNDER RAS
57
Real growth dynamics (currency adjusted, cumulative YTD)
CORPORATE LOANS RETAIL LOANS CORPORATE DEPOSITS RETAIL DEPOSITS
13.6%
1.2%
-10%
0%
10%
20%
6.3%
1.1%
-10%
0%
10%
6.3%
-2.9%
-10%
0%
10%
- 2018 - 2017
SBERBANK INVESTOR PRESENTATION 58
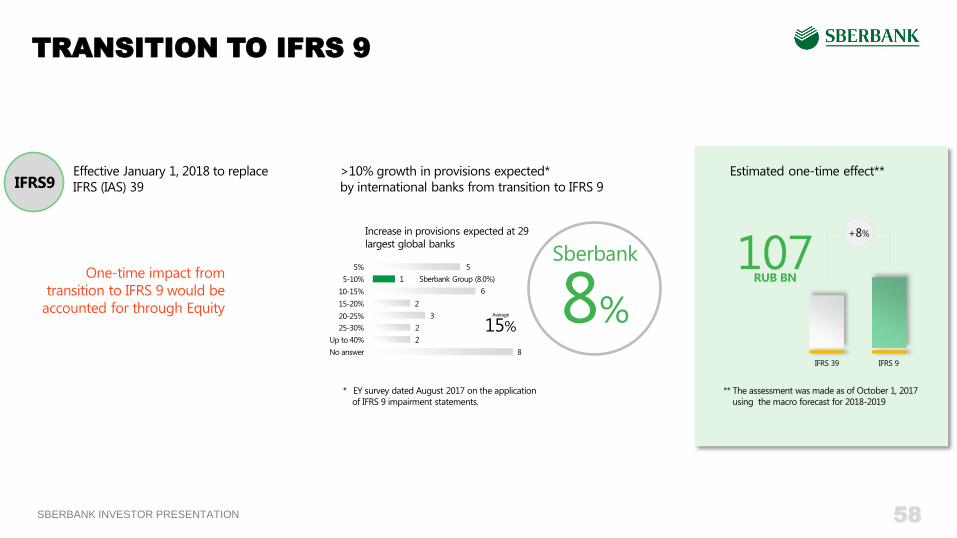
TRANSITION TO IFRS 9
Effective January 1, 2018 to replace
IFRS (IAS) 39
One-time impact from
transition to IFRS 9 would be
accounted for through Equity
>10% growth in provisions expected*
by international banks from transition to IFRS 9
Increase in provisions expected at 29
largest global banks
Average
15%
107 RUB BN
** The assessment was made as of October 1, 2017
using the macro forecast for 2018-2019
Estimated one-time effect**
5%
5-10%
10-15%
15-20%
20-25%
25-30%
Up to 40%
No answer
* EY survey dated August 2017 on the application
of IFRS 9 impairment statements.
IFRS 39 IFRS 9
+8%
5
6
2
3
2
2
8
Sberbank Group (8.0%) 1
IFRS9
Sberbank
8%
SBERBANK INVESTOR PRESENTATION
SBERBANK IN BRIEF
SBERBANK STRATEGY 2020
APPENDIX 1: IFRS FINANCIALS
APPENDIX 2: RECENT DEVELOPMENTS
FINANCIAL MODEL 2020
APPENDIX 3: GUIDANCE 2018
SBERBANK INVESTOR PRESENTATION
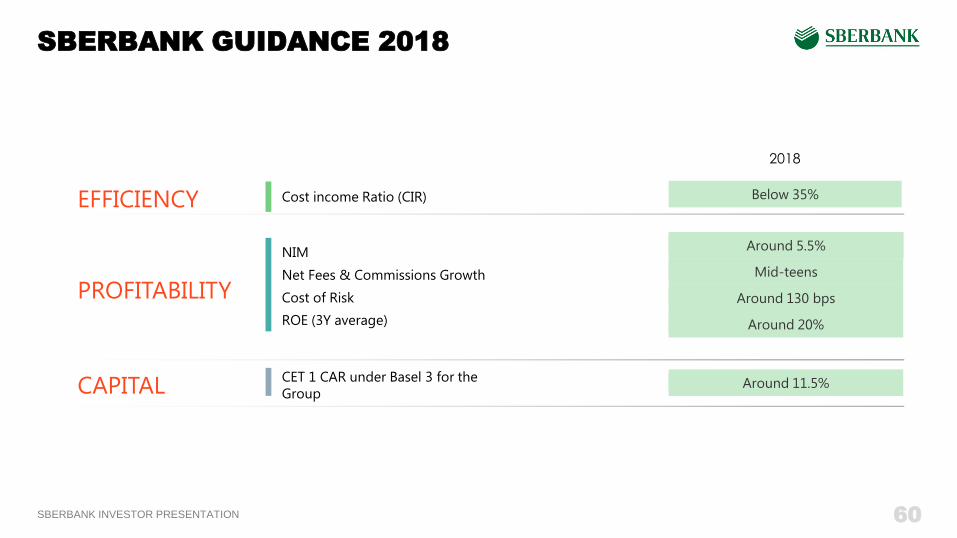
EFFICIENCY Cost income Ratio (CIR)
PROFITABILITY
NIM
Net Fees & Commissions Growth
Cost of Risk
ROE (3Y average)
CAPITAL CET 1 CAR under Basel 3 for the
Group
2018
Below 35%
Around 5.5%
Mid-teens
Around 130 bps
Around 20%
Around 11.5%
SBERBANK GUIDANCE 2018
60

SBERBANK INVESTOR PRESENTATION
IR CONTACT DETAILS
STRATEGIC PARTNERS
AND INVESTORS Jyrki Talvitie
HEAD OF INVESTOR
RELATIONS
Anastasia Belyanina
IR TEAM Maria Shevtsova
Kirill Sokolov
CONTACTS Address: 19, Vavilova Street
Moscow, 117997
Russia
Phone: +7 (495) 957-59-60
Email : [email protected]
www.sberbank.com
SBERBANK IR APP
Sberbank IR App allows investors, analysts, the media and other interested
parties to remain up to date with current financial and corporate information on
Sberbank
Ekaterina Khromova
Andrey Raevskiy
Best Investor
Relations App
2017
Grand prix for best overall
investor relations, large
cap 2017