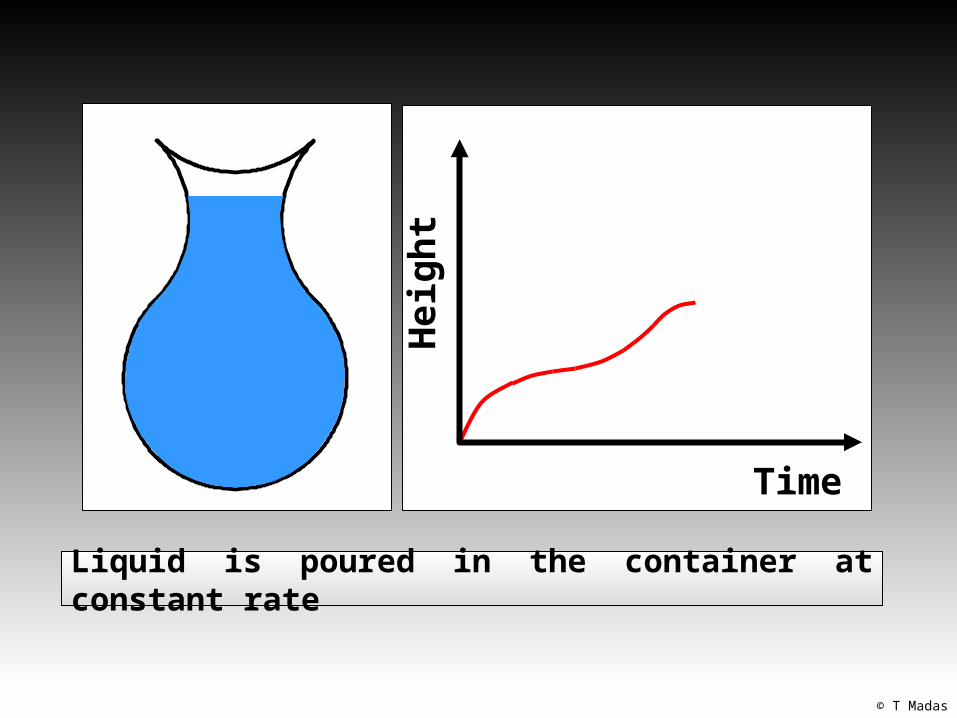
© t madas time height © t madas time height liquid is poured in the container at constant rate
TRANSCRIPT

© T Madas
Time
Heig
ht
© T Madas
Time
Heig
ht
Liquid is poured in the container at constant rate

© T Madas
Time
Heig
ht
The slope of the graph indicates the speed at which the container fills up in different sections
© T Madas
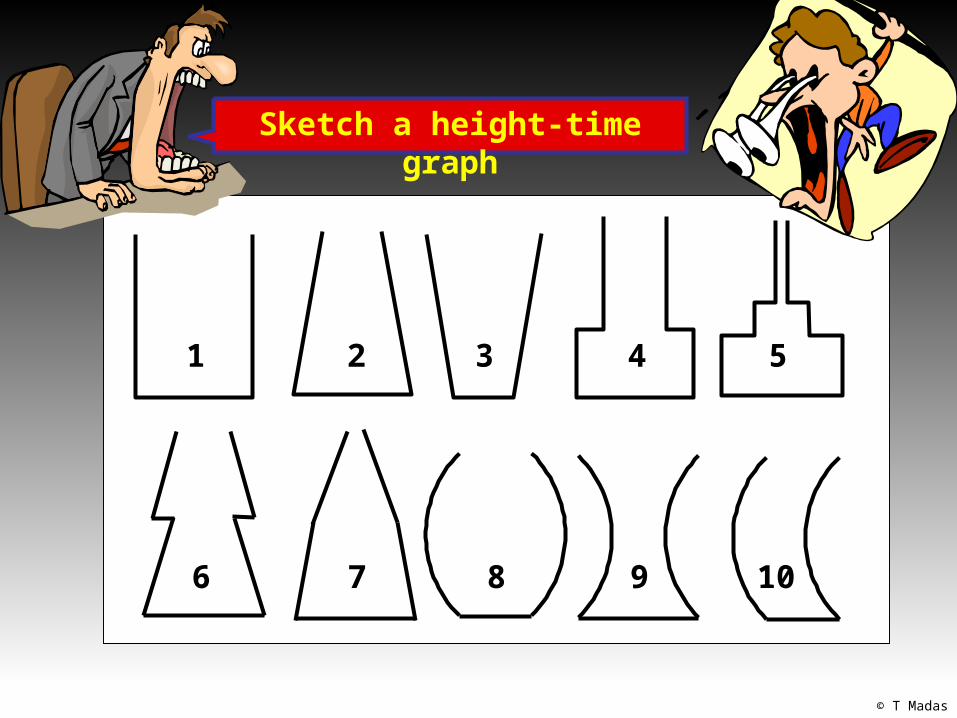
Sketch a height-time graph
1 2 3 4 5
6 7 8 9 10
© T Madas
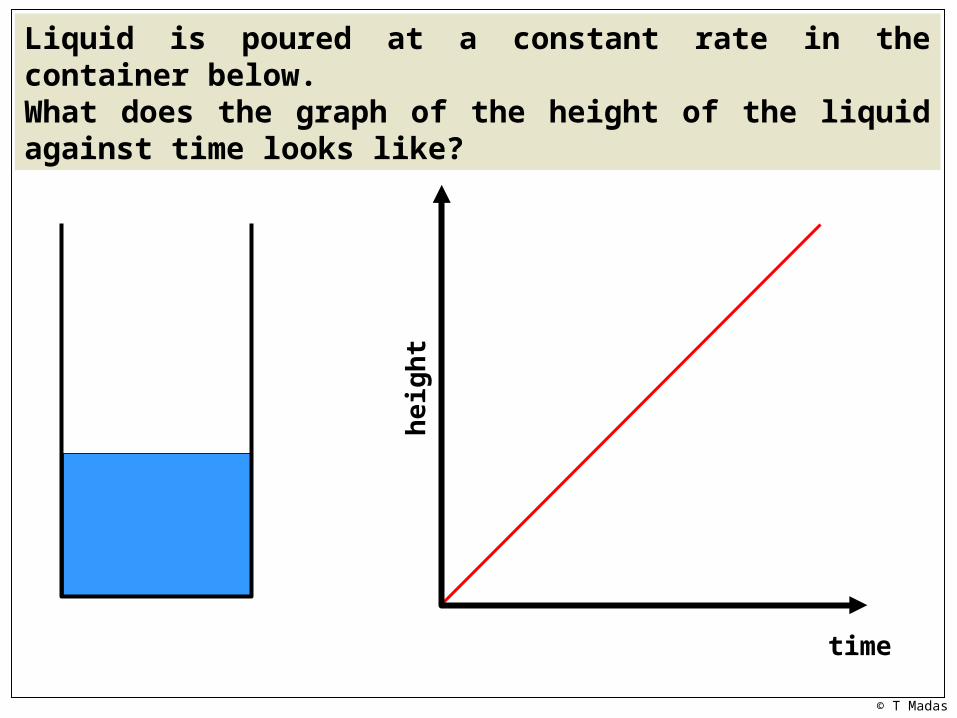
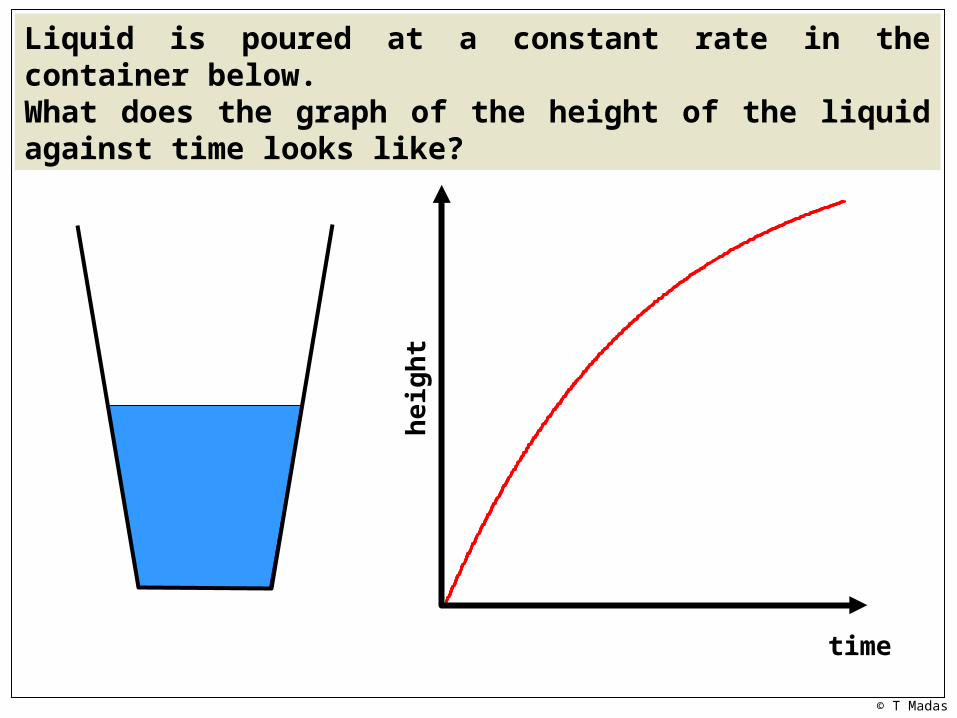
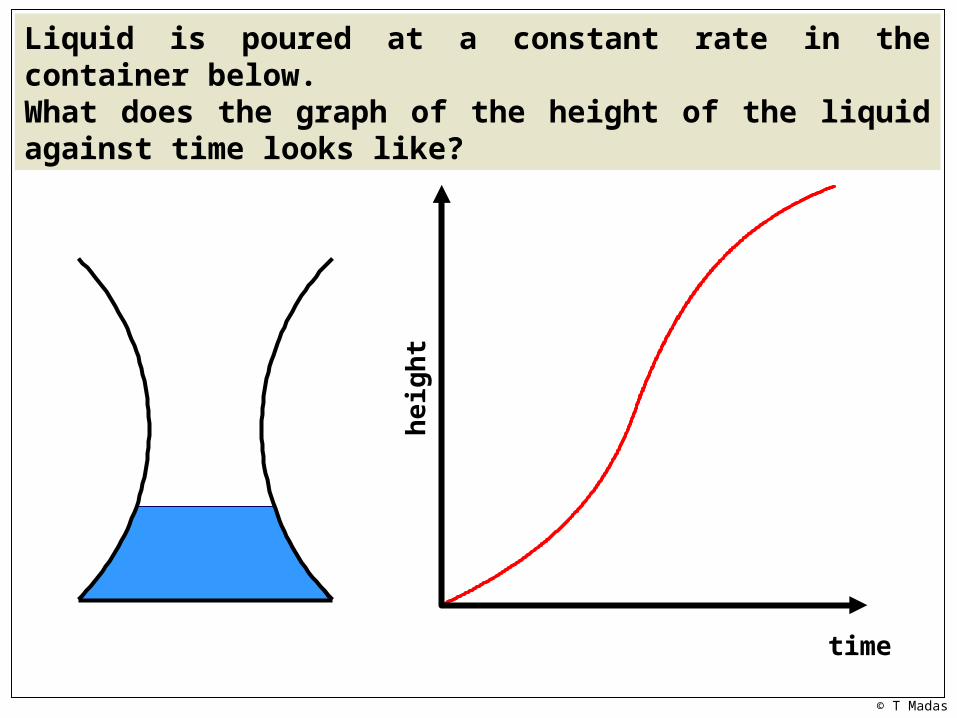
Liquid is poured at a constant rate in the container below.What does the graph of the height of the liquid against time looks like?
time
heig
ht
© T Madas
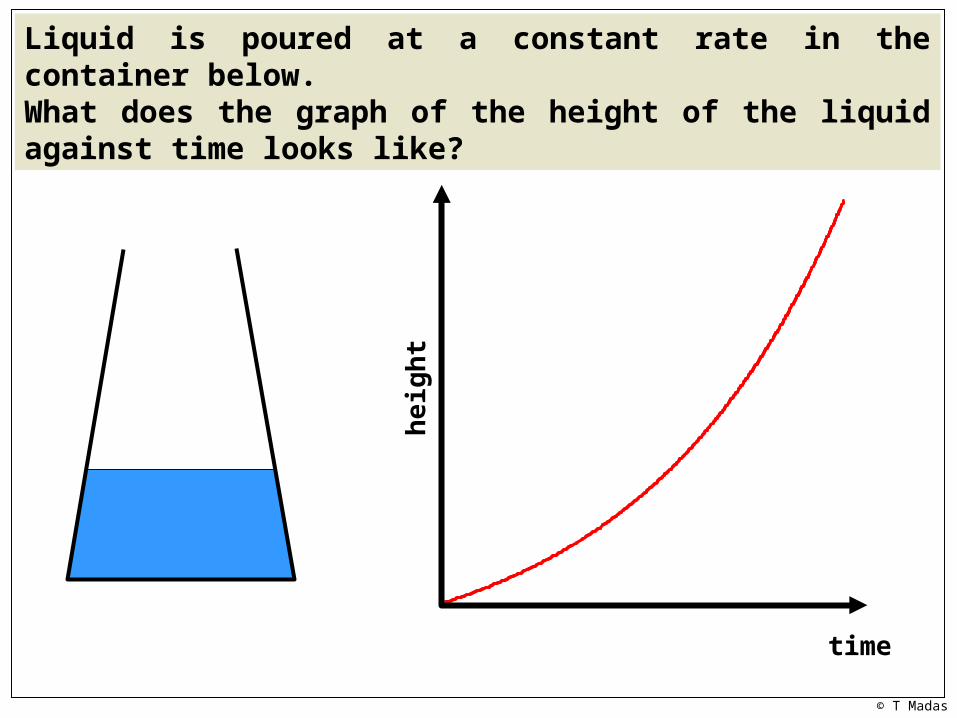
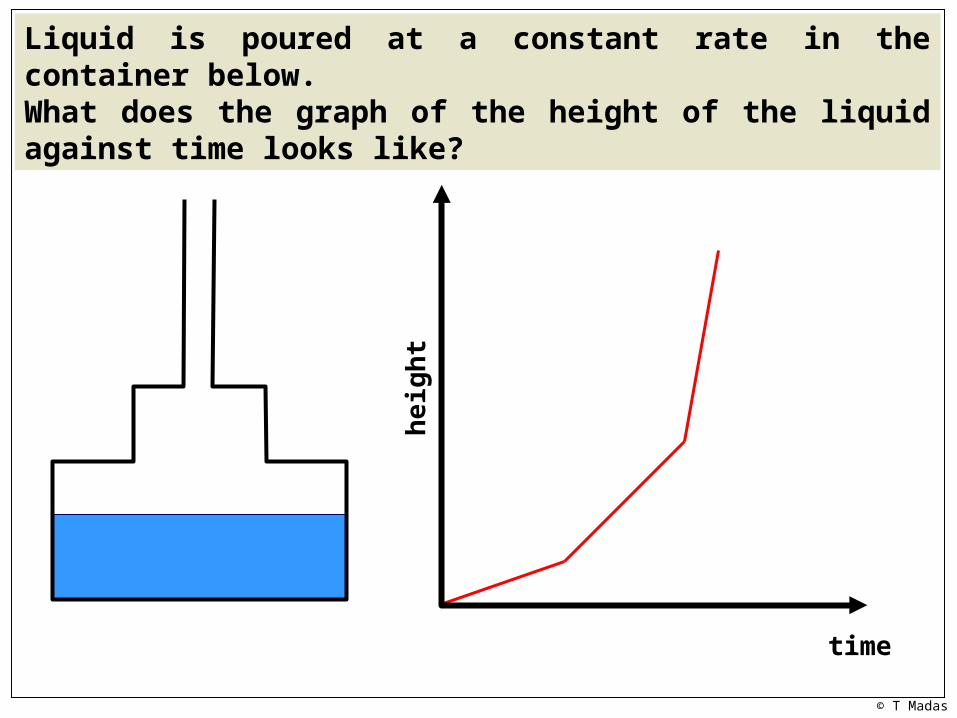
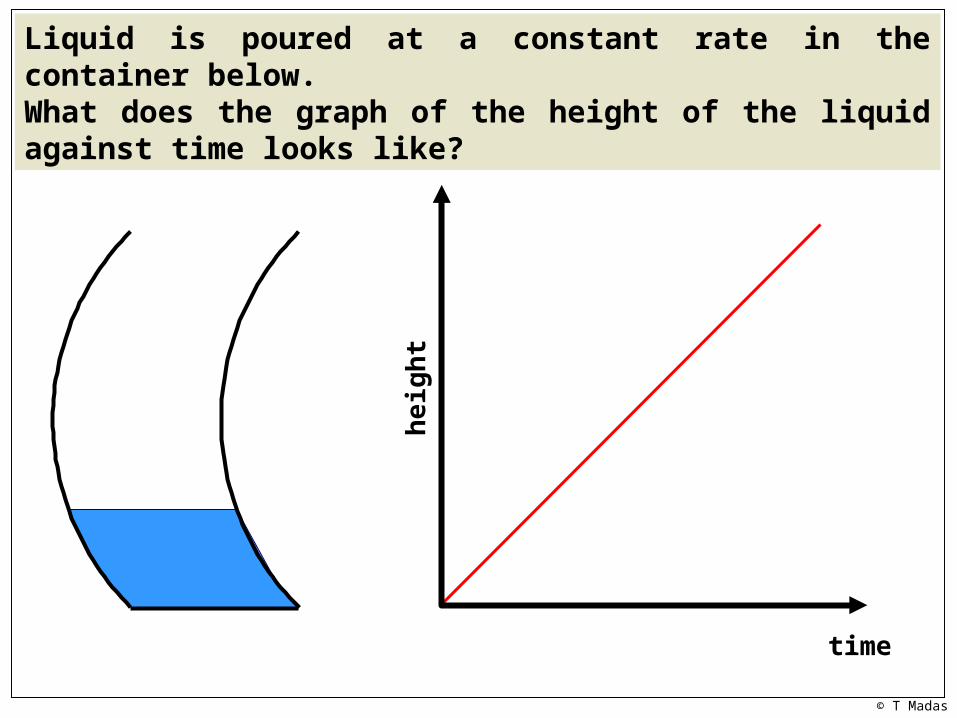
Liquid is poured at a constant rate in the container below.What does the graph of the height of the liquid against time looks like?
time
heig
ht
© T Madas
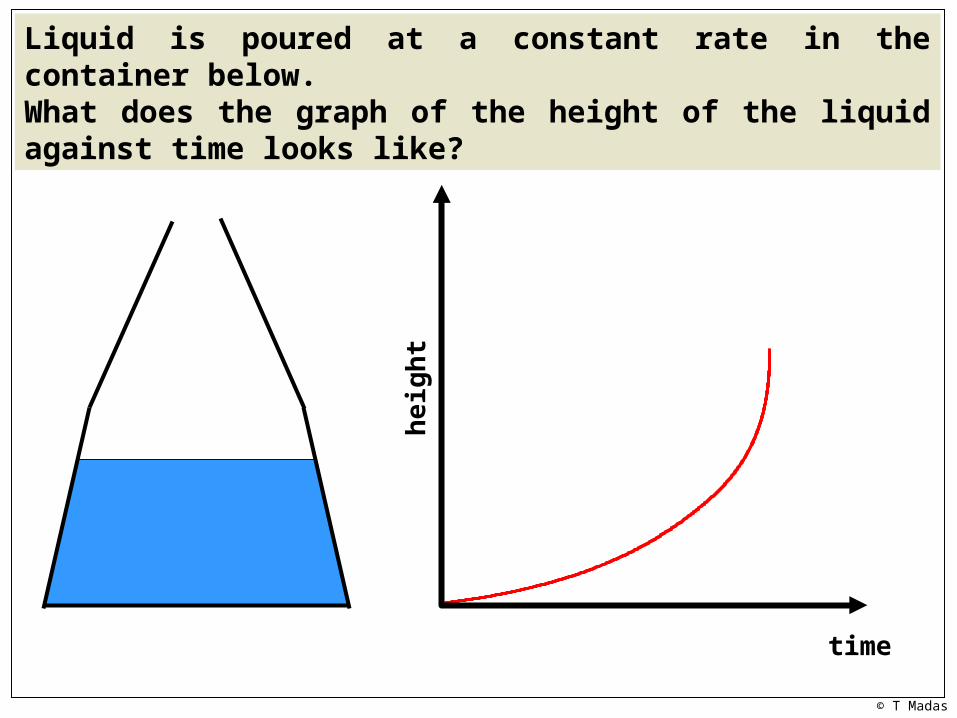
Liquid is poured at a constant rate in the container below.What does the graph of the height of the liquid against time looks like?
time
heig
ht

© T Madas
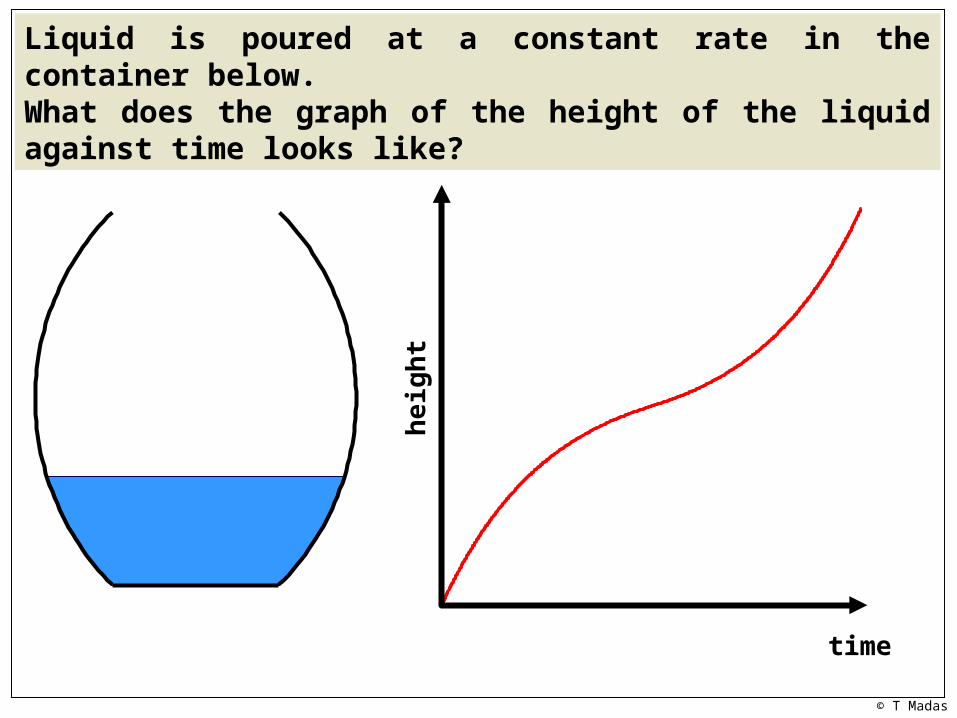
Liquid is poured at a constant rate in the container below.What does the graph of the height of the liquid against time looks like?
time
heig
ht
© T Madas
Liquid is poured at a constant rate in the container below.What does the graph of the height of the liquid against time looks like?
time
heig
ht

© T Madas
Liquid is poured at a constant rate in the container below.What does the graph of the height of the liquid against time looks like?
time
heig
ht
© T Madas
Liquid is poured at a constant rate in the container below.What does the graph of the height of the liquid against time looks like?
time
heig
ht
© T Madas
Liquid is poured at a constant rate in the container below.What does the graph of the height of the liquid against time looks like?
time
heig
ht
© T Madas
Liquid is poured at a constant rate in the container below.What does the graph of the height of the liquid against time looks like?
time
heig
ht
© T Madas
Liquid is poured at a constant rate in the container below.What does the graph of the height of the liquid against time looks like?
time
heig
ht

© T Madas

© T Madas
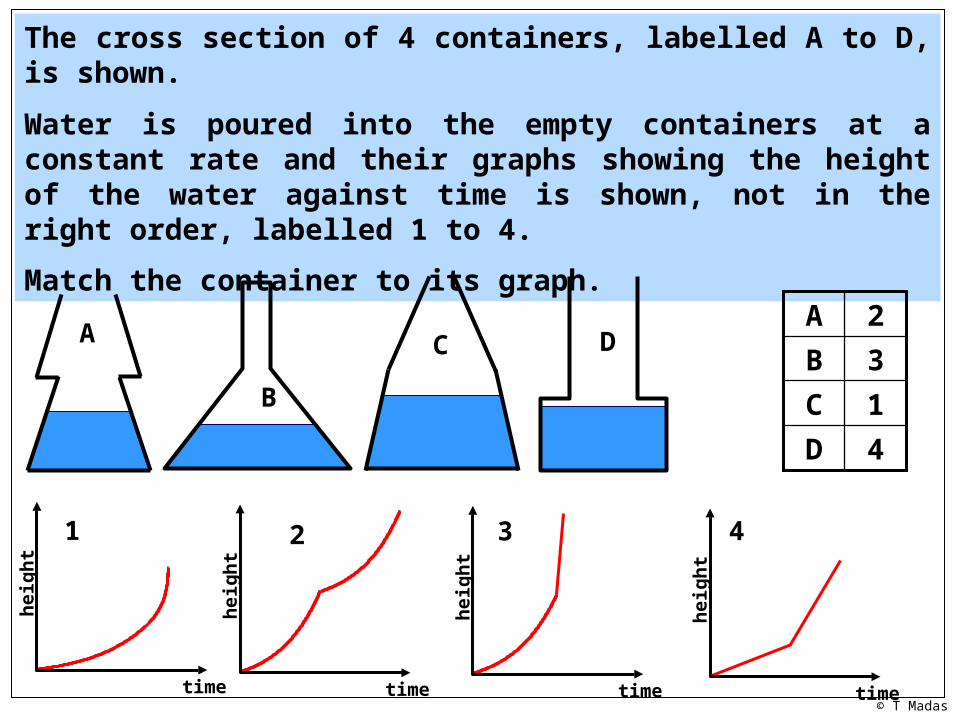
The cross section of 4 containers, labelled A to D, is shown.
Water is poured into the empty containers at a constant rate and their graphs showing the height of the water against time is shown, not in the right order, labelled 1 to 4.
Match the container to its graph.
time
heig
ht
time
heig
ht
time
heig
ht
timeh
eig
ht
A B CD
1 2 3 4
3D
1C
4B
2A

© T Madas

© T Madas
The cross section of 4 containers, labelled A to D, is shown.
Water is poured into the empty containers at a constant rate and their graphs showing the height of the water against time is shown, not in the right order, labelled 1 to 4.
Match the container to its graph.
A B CD
1 2 3 4
4D
2C
1B
3A
time
heig
ht
time
heig
ht
time
heig
ht
timeh
eig
ht

© T Madas
© T Madas
The cross section of 4 containers, labelled A to D, is shown.
Water is poured into the empty containers at a constant rate and their graphs showing the height of the water against time is shown, not in the right order, labelled 1 to 4.
Match the container to its graph.
A
B
C D
1 2 3 4
4D
1C
3B
2A
time
heig
ht
time
heig
ht
timeh
eig
ht
time
heig
ht
© T Madas