bestmillerz.org/prophets/proxy/pdf/rpm2017annualreport.pdf• tamms • tci • testor • tor •...
TRANSCRIPT

AD Fire • Adhere Industrial Tapes • API • Applied Polymerics • Arnette Polymers • Ascoat • Betumat • Bomat • Boral • Canam • Carboline • Chemical Coatings, Inc. • Chemspec • Chemtec • Chemtron • Citadel • Dane Group • DAP • Day-Glo • Dryvit • Duram • Euclid Chemical • Eucomex • Expanko • Fibregrid • Finishworks • Firetherm • Flecto • Flowcrete • Grupo PV • Guardian Products • HiChem • Holton Food Products • Hummervoll • illbruck • Increte • Kop-Coat • Krud Kutter • Legend Brands • Mameco • Mantrose-Haeuser • Martin Mathys N.V. • Modern Masters • Mohawk • Multicolor Specialties • Nu-Chem • Nullifire • Okon • Paper Tiger • Parks • Permaquik • Pipeline & Drainage Systems • Plastic Wood • Prime Resins • Prochem • Productos CAVE • Prosytec • PSI Packaging • Radiant Color • Rust-Oleum • Seal-Krete • Sierra Performance Coatings • Specialty Polymer Coatings • Spraymate • SPS Group • Star Maling • Stonhard • Tamms • TCI • Testor • Tor • Touch ‘n Foam • Toxement • Tremco • Triarch • Ultra-Tex • Universal Sealants • Vandex • Viapol • Watco • Westfield Coatings • XIM • Zehrung • Zinsser • AD Fire • Adhere Industrial Tapes • API • Applied Polymerics • Arnette Polymers • Ascoat • Betumat • Bomat • Boral • Canam • Carboline • Chemical Coatings, Inc. • Chemspec • Chemtec • Chemtron • Citadel • Dane Group • DAP • Day-Glo • Dryvit • Duram • Euclid Chemical • Eucomex • Expanko • Fibregrid • Finishworks • Firetherm • Flecto • Flowcrete • Grupo PV • Guardian Products • HiChem • Holton Food Products • Hummervoll • illbruck • Increte • Kop-Coat • Krud Kutter • Legend Brands • Mameco • Mantrose-Haeuser • Martin Mathys N.V. • Modern Masters • Mohawk • Multicolor Specialties • Nu-Chem • Nullifire • Okon • Paper Tiger • Parks • Permaquik • Pipeline & Drainage Systems • Plastic Wood • Prime Resins • Prochem • Productos CAVE • Prosytec • PSI Packaging • Radiant Color • Rust-Oleum • Seal-Krete • Sierra Performance Coatings • Specialty Polymer Coatings • Spraymate • SPS Group • Star Maling • Stonhard • Tamms • TCI • Testor • Tor • Touch ‘n Foam • Toxement • Tremco • Triarch • Ultra-Tex • Universal Sealants • Vandex • Viapol • Watco • Westfield Coatings • XIM • Zehrung • Zinsser • AD Fire • Adhere Industrial Tapes • API • Applied Polymerics • Arnette Polymers • Ascoat • Betumat • Bomat • Boral • Canam • Carboline • Chemical Coatings, Inc. • Chemspec • Chemtec • Chemtron • Citadel • Dane Group • DAP • Day-Glo • Dryvit • Duram • Euclid Chemical • Eucomex • Expanko • Fibregrid • Finishworks • Firetherm • Flecto • Flowcrete • Grupo PV • Guardian Products • HiChem • Holton Food Products • Hummervoll • illbruck • Increte • Kop-Coat • Krud Kutter • Legend Brands • Mameco • Mantrose-Haeuser • Martin Mathys N.V. • Modern Masters • Mohawk • Multicolor Specialties • Nu-Chem • Nullifire • Okon • Paper Tiger • Parks • Permaquik • Pipeline & Drainage Systems • Plastic Wood • Prime Resins • Prochem • Productos CAVE • Prosytec • PSI Packaging • Radiant Color • Rust-Oleum • Seal-Krete • Sierra Performance Coatings • Specialty Polymer Coatings • Spraymate • SPS Group • Star Maling • Stonhard • Tamms • TCI • Testor • Tor • Touch ‘n Foam • Toxement • Tremco • Triarch • Ultra-Tex • Universal Sealants • Vandex • Viapol • Watco • Westfield Coatings • XIM • Zehrung • Zinsser • AD Fire • Adhere Industrial Tapes • API • Applied Polymerics • Arnette Polymers • Ascoat • Betumat • Bomat • Boral • Canam • Carboline • Chemical Coatings, Inc. • Chemspec • Chemtec • Chemtron • Citadel • Dane Group • DAP • Day-Glo • Dryvit • Duram • Euclid Chemical • Eucomex • Expanko • Fibregrid • Finishworks • Firetherm • Flecto • Flowcrete • Grupo PV • Guardian Products • HiChem • Holton Food Products • Hummervoll • illbruck • Increte • Kop-Coat • Krud Kutter • Legend Brands • Mameco • Mantrose-Haeuser • Martin Mathys N.V. • Modern Masters • Mohawk • Multicolor Specialties • Nu-Chem • Nullifire • Okon • Paper Tiger • Parks • Permaquik • Pipeline & Drainage Systems • Plastic Wood • Prime Resins • Prochem • Productos CAVE • Prosytec • PSI Packaging • Radiant Color • Rust-Oleum • Seal-Krete • Sierra Performance Coatings • Specialty Polymer Coatings • Spraymate • SPS Group • Star Maling • Stonhard • Tamms • TCI • Testor • Tor • Touch ‘n Foam • Toxement • Tremco • Triarch • Ultra-Tex • Universal Sealants • Vandex • Viapol • Watco • Westfield Coatings • XIM • Zehrung • Zinsser • AD Fire • Adhere Industrial Tapes • API • Applied Polymerics • Arnette Polymers • Ascoat • Betumat • Bomat • Boral • Canam • Carboline • Chemical Coatings, Inc. • Chemspec • Chemtec • Chemtron • Citadel • Dane Group • DAP • Day-Glo • Dryvit • Duram • Euclid Chemical • Eucomex • Expanko • Fibregrid • Finishworks • Firetherm • Flecto • Flowcrete • Grupo PV • Guardian Products • HiChem • Holton Food Products • Hummervoll • illbruck • Increte • Kop-Coat • Krud Kutter • Legend Brands • Mameco • Mantrose-Haeuser • Martin Mathys N.V. • Modern Masters • Mohawk • Multicolor Specialties • Nu-Chem • Nullifire • Okon • Paper Tiger • Parks • Permaquik • Pipeline & Drainage Systems • Plastic Wood • Prime Resins • Prochem • Productos CAVE • Prosytec • PSI Packaging • Radiant Color • Rust-Oleum • Seal-Krete • Sierra Performance Coatings • Specialty Polymer Coatings • Spraymate • SPS Group • Star Maling • Stonhard • Tamms • TCI • Testor • Tor • Touch ‘n Foam • Toxement • Tremco • Triarch • Ultra-Tex • Universal Sealants • Vandex • Viapol • Watco • Westfield Coatings • XIM • Zehrung • Zinsser • AD Fire • Adhere Industrial Tapes • API • Applied Polymerics • Arnette Polymers • Ascoat • Betumat • Bomat • Boral • Canam • Carboline • Chemical Coatings, Inc. • Chemspec • Chemtec • Chemtron • Citadel • Dane Group • DAP • Day-Glo • Dryvit • Duram • Euclid Chemical • Eucomex • Expanko • Fibregrid • Finishworks • Firetherm • Flecto • Flowcrete • Grupo PV • Guardian Products • HiChem • Holton Food Products • Hummervoll • illbruck • Increte • Kop-Coat • Krud Kutter • Legend Brands • Mameco • Mantrose-Haeuser • Martin Mathys N.V. • Modern Masters • Mohawk • Multicolor Specialties • Nu-Chem • Nullifire • Okon • Paper Tiger • Parks • Permaquik • Pipeline & Drainage Systems • Plastic Wood • Prime Resins • Prochem • Productos CAVE • Prosytec • PSI Packag-ing • Radiant Color • Rust-Oleum • Seal-Krete • Sierra Performance Coatings • Specialty Polymer Coatings • Spraymate • SPS Group • Star Maling • Stonhard • Tamms • TCI • Testor • Tor • Touch ‘n Foam • Toxement • Tremco • Triarch • Ultra-Tex • Universal Sealants • Vandex • Viapol • Watco • Westfield Coatings • XIM • Zehrung • Zinsser • AD Fire • Adhere Industrial Tapes • API • Applied Polymerics • Arnette Polymers • Ascoat • Betumat • Bomat • Boral • Canam • Carboline • Chemical Coatings, Inc. • Chemspec • Chemtec • Chemtron • Citadel • Dane Group • DAP • Day-Glo • Dryvit • Duram • Euclid Chemical • Eucomex • Expanko • Fibregrid • Finishworks • Firetherm • Flecto • Flowcrete • Grupo PV • Guardian Products • HiChem • Holton Food Products • Hummervoll • illbruck • Increte • Kop-Coat • Krud Kutter • Legend Brands • Mameco • Mantrose-Haeuser • Martin Mathys N.V. • Modern Masters • Mohawk • Multicolor Specialties • Nu-Chem • Nullifire • Okon • Paper Tiger • Parks • Permaquik • Pipeline & Drainage Systems • Plastic Wood • Prime Resins • Prochem • Productos CAVE • Prosytec • PSI Packaging • Radiant Color • Rust-Oleum • Seal-Krete • Sierra Performance Coatings • Specialty Polymer Coatings • Spraymate • SPS Group • Star Maling • Stonhard • Tamms • TCI • Testor • Tor • Touch ‘n Foam • Toxement • Tremco • Triarch • Ultra-Tex • Universal Sealants • Vandex • Viapol • Watco • Westfield Coatings • XIM • Zehrung • Zinsser • AD Fire • Adhere Industrial Tapes • API • Applied Polymerics • Arnette Polymers • Ascoat • Betumat • Bomat • Boral • Canam • Carboline • Chemical Coatings, Inc. • Chemspec • Chemtec • Chemtron • Citadel • Dane Group • DAP • Day-Glo • Dryvit • Duram • Euclid Chemical • Eucomex • Expanko • Fibregrid • Finishworks • Firetherm • Flecto • Flowcrete • Grupo PV • Guardian Products • HiChem • Holton Food Products • Hummervoll • illbruck • Increte • Kop-Coat • Krud Kutter • Legend Brands • Mameco • Mantrose-Haeuser • Martin Mathys N.V. • Modern Masters • Mohawk • Multicolor Specialties • Nu-Chem • Nullifire • Okon • Paper Tiger • Parks • Permaquik • Pipeline & Drainage Systems • Plastic Wood • Prime Resins • Prochem • Productos CAVE • Prosytec • PSI Packaging • Radiant Color • Rust-Oleum • Seal-Krete • Sierra Performance Coatings • Specialty Polymer Coatings • Spraymate • SPS Group • Star Maling • Stonhard • Tamms • TCI • Testor • Tor • Touch ‘n Foam • Toxement • Tremco • Triarch • Ultra-Tex • Universal Sealants • Vandex • Viapol • Watco • Westfield Coatings • XIM • Zehrung • Zinsser • AD Fire • Adhere Industrial Tapes • API • Applied Polymerics • Arnette Polymers • Ascoat • Betumat • Bomat • Boral • Canam • Carboline • Chemical Coatings, Inc. • Chemspec • Chemtec • Chemtron • Citadel • Dane Group • DAP • Day-Glo • Dryvit • Duram • Euclid Chemical • Eucomex • Expanko • Fibregrid • Finishworks • Firetherm • Flecto • Flowcrete • Grupo PV • Guardian Products • HiChem • Holton Food Products • Hummervoll • illbruck • Increte • Kop-Coat • Krud Kutter • Legend Brands • Mameco • Mantrose-Haeuser • Martin Mathys N.V. • Modern Masters • Mohawk • Multicolor Specialties • Nu-Chem • Nullifire • Okon • Paper Tiger • Parks • Permaquik • Pipeline & Drainage Systems • Plastic Wood • Prime Resins • Prochem • Productos CAVE • Prosytec • PSI Packaging • Radiant Color • Rust-Oleum • Seal-Krete • Sierra Performance Coatings • Specialty Polymer Coatings • Spraymate • SPS Group • Star Maling • Stonhard • Tamms • TCI • Testor • Tor • Touch ‘n Foam • Toxement • Tremco • Triarch • Ul-tra-Tex • Universal Sealants • Vandex • Viapol • Watco • Westfield Coatings • XIM • Zehrung • Zinsser • AD Fire • Adhere Industrial Tapes • API • Applied Polymerics • Arnette Polymers • Ascoat • Betumat • Bomat • Boral • Canam • Carboline • Chemical Coatings, Inc. • Chemspec • Chemtec • Chemtron • Citadel • Dane Group • DAP • Day-Glo • Dryvit • Duram • Euclid Chemical • Eucomex • Expanko • Fi-bregrid • Finishworks • Firetherm • Flecto • Flowcrete • Grupo PV • Guardian Products • HiChem • Holton Food Products • Hummervoll • illbruck • Increte • Kop-Coat • Krud Kutter • Legend Brands • Mameco • Mantrose-Haeuser • Martin Mathys N.V. • Modern Masters • Mohawk • Multicolor Specialties • Nu-Chem • Nullifire • Okon • Paper Tiger • Parks • Permaquik • Pipeline & Drainage Systems • Plastic Wood • Prime Resins • Prochem • Productos CAVE • Prosytec • PSI Packaging • Radiant Color • Rust-Oleum • Seal-Krete • Sierra Performance Coatings • Specialty Polymer Coatings • Spraymate • SPS Group • Star Maling • Stonhard • Tamms • TCI • Testor • Tor • Touch ‘n Foam • Toxement • Tremco • Triarch • Ultra-Tex • Universal Sealants • Vandex • Viapol • Watco • Westfield Coatings • XIM • Zehrung • Zinsser • AD Fire • Adhere Industrial Tapes • API • Applied Polymerics • Arnette Polymers • Ascoat • Betumat • Bomat • Boral • Canam • Carboline • Chemical Coatings, Inc. • Chemspec • Chemtec • Chemtron • Citadel • Dane Group • DAP • Day-Glo • Dryvit • Duram • Euclid Chemical • Eucomex • Expanko • Fibregrid • Finishworks • Firetherm • Flecto • Flowcrete • Grupo PV • Guardian Products • HiChem • Holton Food Products • Hummervoll • illbruck • Increte • Kop-Coat • Krud Kutter • Legend Brands • Mameco • Mantrose-Haeuser • Martin Mathys N.V. • Modern Masters • Mohawk • Multicolor Specialties • Nu-Chem • Nullifire • Okon • Paper Tiger • Parks • Permaquik • Pipeline & Drainage Systems • Plastic Wood • Prime Resins • Prochem • Productos CAVE • Prosytec • PSI Packag-ing • Radiant Color • Rust-Oleum • Seal-Krete • Sierra Performance Coatings • Specialty Polymer Coatings • Spraymate • SPS Group • Star Maling • Stonhard • Tamms • TCI • Testor • Tor • Touch ‘n Foam • Toxement • Tremco • Triarch • Ultra-Tex • Universal Sealants • Vandex • Viapol • Watco • Westfield Coatings • XIM • Zehrung • Zinsser • AD Fire • Adhere Industrial Tapes • API • Applied Polymerics • Arnette Polymers • Ascoat • Betumat • Bomat • Boral • Canam • Carboline • Chemical Coatings, Inc. • Chemspec • Chemtec • Chemtron • Citadel • Dane Group • DAP • Day-Glo • Dryvit • Duram • Euclid Chemical • Eucomex • Expanko • Fibregrid • Finishworks • Firetherm • Flecto • Flowcrete • Grupo PV • Guardian Products • HiChem • Holton Food Products • Hummervoll • illbruck • Increte • Kop-Coat • Krud Kutter • Legend Brands • Mameco • Mantrose-Haeuser • Martin Mathys N.V. • Modern Masters • Mohawk • Multicolor Specialties • Nu-Chem • Nullifire • Okon • Paper Tiger • Parks • Permaquik • Pipeline & Drainage Systems • Plastic Wood • Prime Resins • Prochem • Productos CAVE • Prosytec • PSI Packaging • Radiant Color • Rust-Oleum • Seal-Krete • Sierra Performance Coatings • Specialty Polymer Coatings • Spraymate • SPS Group • Star Maling • Stonhard • Tamms • TCI • Testor • Tor • Touch ‘n Foam • Toxement • Tremco • Triarch • Ultra-Tex • Universal Sealants • Vandex • Viapol • Watco • Westfield Coatings • XIM • Zehrung • Zinsser • AD Fire • Adhere Industrial Tapes • API • Applied Polymerics • Arnette Polymers • Ascoat • Betumat • Bomat • Boral • Canam • Carboline • Chemical Coatings, Inc. • Chemspec • Chemtec • Chemtron • Citadel • Dane Group • DAP • Day-Glo • Dryvit • Duram • Euclid Chemical • Eucomex • Expanko • Fibregrid • Finishworks • Firetherm • Flecto • Flowcrete • Grupo PV • Guardian Products • HiChem • Holton Food Products • Hummervoll • illbruck • Increte • Kop-Coat • Krud Kutter • Legend Brands • Mameco • Mantrose-Haeuser • Martin Mathys N.V. • Modern Masters • Mohawk • Multicolor Specialties • Nu-Chem • Nullifire • Okon • Paper Tiger • Parks • Permaquik • Pipeline & Drainage Systems • Plastic Wood • Prime Resins • Prochem • Productos CAVE • Prosytec • PSI Packaging • Radiant Color • Rust-Oleum • Seal-Krete • Sierra Performance Coatings • Specialty Polymer Coatings • Spraymate • SPS Group • Star Maling • Stonhard • Tamms • TCI • Testor • Tor • Touch ‘n Foam • Toxement • Tremco • Triarch • Ultra-Tex • Universal Sealants • Vandex • Viapol • Watco • Westfield Coatings • XIM • Zehrung • Zinsser • AD Fire • Adhere Industrial Tapes • API • Applied Polymerics • Arnette Polymers • Ascoat • Betumat • Bomat • Boral • Canam • Carboline • Chemical Coatings, Inc. • Chemspec • Chemtec • Chemtron • Citadel • Dane Group • DAP • Day-Glo • Dryvit • Duram • Euclid Chemical • Eucomex • Expanko • Fibregrid • Finishworks • Firetherm • Flecto • Flowcrete • Grupo PV • Guardian Products • HiChem • Holton Food Products • Hummervoll • illbruck • Increte • Kop-Coat • Krud Kutter • Legend Brands • Mameco • Mantrose-Haeuser • Martin Mathys N.V. • Modern Masters • Mohawk • Multicolor Specialties • Nu-Chem • Nullifire • Okon • Paper Tiger • Parks • Permaquik • Pipeline & Drainage Systems • Plastic Wood • Prime Resins • Prochem • Productos CAVE • Prosytec • PSI Packaging • Radiant Color • Rust-Oleum • Seal-Krete • Sierra Performance Coatings • Specialty Polymer Coatings • Spraymate • SPS Group • Star Maling • Stonhard • Tamms • TCI • Testor • Tor • Touch ‘n Foam • Toxement • Tremco • Triarch • Ul-tra-Tex • Universal Sealants • Vandex • Viapol • Watco • Westfield Coatings • XIM • Zehrung • Zinsser • AD Fire • Adhere Industrial Tapes • API • Applied Polymerics • Arnette Polymers • Ascoat • Betumat • Bomat • Boral • Canam • Carboline • Chemical Coatings, Inc. • Chemspec • Chemtec • Chemtron • Citadel • Dane Group • DAP • Day-Glo • Dryvit • Duram • Euclid Chemical • Eucomex • Expanko • Fi-bregrid • Finishworks • Firetherm • Flecto • Flowcrete • Grupo PV • Guardian Products • HiChem • Holton Food Products • Hummervoll • illbruck • Increte • Kop-Coat • Krud Kutter • Legend Brands • Mameco • Mantrose-Haeuser • Martin Mathys N.V. • Modern Masters • Mohawk • Multicolor Specialties • Nu-Chem • Nullifire • Okon • Paper Tiger • Parks • Permaquik • Pipeline & Drainage Systems • Plastic Wood • Prime Resins • Prochem • Productos CAVE • Prosytec • PSI Packaging • Radiant Color • Rust-Oleum • Seal-Krete • Sierra Performance Coatings • Specialty Polymer Coatings • Spraymate • SPS Group • Star Maling • Stonhard • Tamms • TCI • Testor • Tor • Touch ‘n Foam • Toxement • Tremco • Triarch • Ultra-Tex • Universal Sealants • Vandex • Viapol • Watco • Westfield Coatings • XIM • Zehrung • Zinsser • AD Fire • Adhere Industrial Tapes • API • Applied Polymerics • Arnette Polymers • Ascoat • Betumat • Bomat • Boral • Canam • Carboline • Chemical Coatings, Inc. • Chemspec • Chemtec • Chemtron • Citadel • Dane Group • DAP • Day-Glo • Dryvit • Duram • Euclid Chemical • Eucomex • Expanko • Fibregrid • Finishworks • Firetherm • Flecto • Flowcrete • Grupo PV • Guardian Products • HiChem • Holton Food Products • Hummervoll • illbruck • Increte • Kop-Coat • Krud Kutter • Legend Brands • Mameco • Mantrose-Haeuser • Martin Mathys N.V. • Modern Masters • Mohawk • Multicolor Specialties • Nu-Chem • Nullifire • Okon • Paper Tiger • Parks • Permaquik • Pipeline & Drainage Systems • Plastic Wood • Prime Resins • Prochem • Productos CAVE • Prosytec • PSI Packag-ing • Radiant Color • Rust-Oleum • Seal-Krete • Sierra Performance Coatings • Specialty Polymer Coatings • Spraymate • SPS Group • Star Maling • Stonhard • Tamms • TCI • Testor • Tor • Touch ‘n Foam • Toxement • Tremco • Triarch • Ultra-Tex • Universal Sealants • Vandex • Viapol • Watco • Westfield Coatings • XIM • Zehrung • Zinsser • AD Fire • Adhere Industrial Tapes • API • Applied Polymerics • Arnette Polymers • Ascoat • Betumat • Bomat • Boral • Canam • Carboline • Chemical Coatings, Inc. • Chemspec • Chemtec • Chemtron • Citadel • Dane Group • DAP • Day-Glo • Dryvit • Duram • Euclid Chemical • Eucomex • Expanko • Fibregrid • Finishworks • Firetherm • Flecto • Flowcrete • Grupo PV • Guardian Products • HiChem • Holton Food Products • Hummervoll • illbruck • Increte • Kop-Coat • Krud Kutter • Legend Brands • Mameco • Mantrose-Haeuser • Martin Mathys N.V. • Modern Masters • Mohawk • Multicolor Specialties • Nu-Chem • Nullifire • Okon • Paper Tiger • Parks • Permaquik • Pipeline & Drainage Systems • Plastic Wood • Prime Resins • Prochem • Productos CAVE • Prosytec • PSI Packaging • Radiant Color • Rust-Oleum • Seal-Krete • Sierra Performance Coatings • Specialty Polymer Coatings • Spraymate • SPS Group • Star Maling • Stonhard • Tamms • TCI • Testor • Tor • Touch ‘n Foam • Toxement • Tremco • Triarch • Ultra-Tex • Universal Sealants • Vandex • Viapol • Watco • Westfield Coatings • XIM • Zehrung • Zinsser • AD Fire • Adhere Industrial Tapes • API • Applied Polymerics • Arnette Polymers • Ascoat • Betumat • Bomat • Boral • Canam • Carboline • Chemical Coatings, Inc. • Chemspec • Chemtec • Chemtron • Citadel • Dane Group • DAP • Day-Glo • Dryvit • Duram • Euclid Chemical • Eucomex • Expanko • Fibregrid • Finishworks • Firetherm • Flecto • Flowcrete • Grupo PV • Guardian Products • HiChem • Holton Food Products • Hummervoll • illbruck • Increte • Kop-Coat • Krud Kutter • Legend Brands • Mameco • Mantrose-Haeuser • Martin Mathys N.V. • Modern Masters • Mohawk • Multicolor Specialties • Nu-Chem • Nullifire • Okon • Paper Tiger • Parks • Permaquik • Pipeline & Drainage Systems • Plastic Wood • Prime Resins • Prochem • Productos CAVE • Prosytec • PSI Packaging • Radiant Color • Rust-Oleum • Seal-Krete • Sierra Performance Coatings • Specialty Polymer Coatings • Spraymate • SPS Group • Star Maling • Stonhard • Tamms • TCI • Testor • Tor • Touch ‘n Foam • Toxement • Tremco • Triarch • Ultra-Tex • Universal Sealants • Vandex • Viapol • Watco • Westfield Coatings • XIM • Zehrung • Zinsser • AD Fire • Adhere Industrial Tapes • API • Applied Polymerics • Arnette Polymers • Ascoat • Betumat • Bomat • Boral • Canam • Carboline • Chemical Coatings, Inc. • Chemspec • Chemtec • Chemtron • Citadel • Dane Group • DAP • Day-Glo • Dryvit • Duram • Euclid Chemical • Eucomex • Expanko • Fibregrid • Finishworks • Firetherm • Flecto • Flowcrete • Grupo PV • Guardian Products • HiChem • Holton Food Products • Hummervoll • illbruck • Increte • Kop-Coat • Krud Kutter • Legend Brands • Mameco • Mantrose-Haeuser • Martin Mathys N.V. • Modern Masters • Mohawk • Multicolor Specialties • Nu-Chem • Nullifire • Okon • Paper Tiger • Parks • Permaquik • Pipeline & Drainage Systems • Plastic Wood • Prime Resins • Prochem • Productos CAVE • Prosytec • PSI Packaging • Radiant Color • Rust-Oleum • Seal-Krete • Sierra Performance Coatings • Specialty Polymer Coatings • Spraymate • SPS Group • Star Maling • Stonhard • Tamms • TCI • Testor • Tor • Touch ‘n Foam • Toxement • Tremco • Triarch • Ul-tra-Tex • Universal Sealants • Vandex • Viapol • Watco • Westfield Coatings • XIM • Zehrung • Zinsser • AD Fire • Adhere Industrial Tapes • API • Applied Polymerics • Arnette Polymers • Ascoat • Betumat • Bomat • Boral • Canam • Carboline • Chemical Coatings, Inc. • Chemspec • Chemtec • Chemtron • Citadel • Dane Group • DAP • Day-Glo • Dryvit • Duram • Euclid Chemical • Eucomex • Expanko • Fi-bregrid • Finishworks • Firetherm • Flecto • Flowcrete • Grupo PV • Guardian Products • HiChem • Holton Food Products • Hummervoll • illbruck • Increte • Kop-Coat • Krud Kutter • Legend Brands • Mameco • Mantrose-Haeuser • Martin Mathys N.V. • Modern Masters • Mohawk • Multicolor Specialties • Nu-Chem • Nullifire • Okon • Paper Tiger • Parks • Permaquik • Pipeline & Drainage Systems • Plastic Wood • Prime Resins • Prochem • Productos CAVE • Prosytec • PSI Packaging • Radiant Color • Rust-Oleum • Seal-Krete • Sierra Performance Coatings • Specialty Polymer Coatings • Spraymate • SPS Group • Star Maling • Stonhard • Tamms • TCI • Testor • Tor • Touch ‘n Foam • Toxement • Tremco • Triarch • Ultra-Tex • Universal Sealants • Vandex • Viapol • Watco • Westfield Coatings • XIM • Zehrung • Zinsser • AD Fire • Adhere Industrial Tapes • API • Applied Polymerics • Arnette Polymers • Ascoat • Betumat • Bomat • Boral • Canam • Carboline • Chemical Coatings, Inc. • Chemspec • Chemtec • Chemtron • Citadel • Dane Group • DAP • Day-Glo • Dryvit • Duram • Euclid Chemical • Eucomex • Expanko • Fibregrid • Finishworks • Firetherm • Flecto • Flowcrete • Grupo PV • Guardian Products • HiChem • Holton Food Products • Hummervoll • illbruck • Increte • Kop-Coat • Krud Kutter • Legend Brands • Mameco • Mantrose-Haeuser • Martin Mathys N.V. • Modern Masters • Mohawk • Multicolor Specialties • Nu-Chem • Nullifire • Okon • Paper Tiger • Parks • Permaquik • Pipeline & Drainage Systems • Plastic Wood • Prime Resins • Prochem • Productos CAVE • Prosytec • PSI Packag-ing • Radiant Color • Rust-Oleum • Seal-Krete • Sierra Performance Coatings • Specialty Polymer Coatings • Spraymate • SPS Group • Star Maling • Stonhard • Tamms • TCI • Testor • Tor • Touch ‘n Foam • Toxement • Tremco • Triarch • Ultra-Tex • Universal Sealants • Vandex • Viapol • Watco • Westfield Coatings • XIM • Zehrung • Zinsser • AD Fire • Adhere Industrial Tapes • API • Applied Polymerics • Arnette Polymers • Ascoat • Betumat • Bomat • Boral • Canam • Carboline • Chemical Coatings, Inc. • Chemspec • Chemtec • Chemtron • Citadel • Dane Group • DAP • Day-Glo • Dryvit • Duram • Euclid Chemical • Eucomex • Expanko • Fibregrid • Finishworks • Firetherm • Flecto • Flowcrete • Grupo PV • Guardian Products • HiChem • Holton Food Products • Hummervoll • illbruck • Increte • Kop-Coat • Krud Kutter • Legend Brands • Mameco • Mantrose-Haeuser • Martin Mathys N.V. • Modern Masters • Mohawk • Multicolor Specialties • Nu-Chem • Nullifire • Okon • Paper Tiger • Parks • Permaquik • Pipeline & Drainage Systems • Plastic Wood • Prime Resins • Prochem • Productos CAVE • Prosytec • PSI Packaging • Radiant Color • Rust-Oleum • Seal-Krete • Sierra Performance Coatings • Specialty Polymer Coatings • Spraymate • SPS Group • Star Maling • Stonhard • Tamms • TCI • Testor • Tor • Touch ‘n Foam • Toxement • Tremco • Triarch • Ultra-Tex • Universal Sealants • Vandex • Viapol • Watco • Westfield Coatings • XIM • Zehrung • Zinsser • AD Fire • Adhere Industrial Tapes • API • Applied Polymerics • Arnette Polymers • Ascoat • Betumat • Bomat • Boral • Canam • Carboline • Chemical Coatings, Inc. • Chemspec • Chemtec • Chemtron • Citadel • Dane Group • DAP • Day-Glo • Dryvit • Duram • Euclid Chemical • Eucomex • Expanko • Fibregrid • Finishworks • Firetherm • Flecto • Flowcrete • Grupo PV • Guardian Products • HiChem • Holton Food Products • Hummervoll • illbruck • Increte • Kop-Coat • Krud Kutter • Legend Brands • Mameco • Mantrose-Haeuser • Martin Mathys N.V. • Modern Masters • Mohawk • Multicolor Specialties • Nu-Chem • Nullifire • Okon • Paper Tiger • Parks • Permaquik • Pipeline & Drainage Systems • Plastic Wood • Prime Resins • Prochem • Productos CAVE • Prosytec • PSI Packaging • Radiant Color • Rust-Oleum • Seal-Krete • Sierra Performance Coatings • Specialty Polymer Coatings • Spraymate • SPS Group • Star Maling • Stonhard • Tamms • TCI • Testor • Tor • Touch ‘n Foam • Toxement • Tremco • Triarch • Ultra-Tex • Universal Sealants • Vandex • Viapol • Watco • Westfield Coatings • XIM • Zehrung • Zinsser • AD Fire • Adhere Industrial Tapes • API • Applied Polymerics • Arnette Polymers • Ascoat • Betumat • Bomat • Boral • Canam • Carboline • Chemical Coatings, Inc. • Chemspec • Chemtec • Chemtron • Citadel • Dane Group • DAP • Day-Glo • Dryvit • Duram • Euclid Chemical • Eucomex • Expanko • Fibregrid • Finishworks • Firetherm • Flecto • Flowcrete • Grupo PV • Guardian Products • HiChem • Holton Food Products • Hummervoll • illbruck • Increte • Kop-Coat • Krud Kutter • Legend Brands • Mameco • Mantrose-Haeuser • Martin Mathys N.V. • Modern Masters • Mohawk • Multicolor Specialties • Nu-Chem • Nullifire • Okon • Paper Tiger • Parks • Permaquik • Pipeline & Drainage Systems • Plastic Wood • Prime Resins • Prochem • Productos CAVE • Prosytec • PSI Packaging • Radiant Color • Rust-Oleum • Seal-Krete • Sierra Performance Coatings • Specialty Polymer Coatings • Spraymate • SPS Group • Star Maling • Stonhard • Tamms • TCI • Testor • Tor • Touch ‘n Foam • Toxement • Tremco • Triarch • Ul-tra-Tex • Universal Sealants • Vandex • Viapol • Watco • Westfield Coatings • XIM • Zehrung • Zinsser • AD Fire • Adhere Industrial Tapes • API • Applied Polymerics • Arnette Polymers • Ascoat • Betumat • Bomat • Boral • Canam • Carboline • Chemical Coatings, Inc. • Chemspec • Chemtec • Chemtron • Citadel • Dane Group • DAP • Day-Glo • Dryvit • Duram • Euclid Chemical • Eucomex • Expanko • Fi-bregrid • Finishworks • Firetherm • Flecto • Flowcrete • Grupo PV • Guardian Products • HiChem • Holton Food Products • Hummervoll • illbruck • Increte • Kop-Coat • Krud Kutter • Legend Brands • Mameco • Mantrose-Haeuser • Martin Mathys N.V. • Modern Masters • Mohawk • Multicolor Specialties • Nu-Chem • Nullifire • Okon • Paper Tiger • Parks • Permaquik • Pipeline & Drainage Systems • Plastic Wood • Prime Resins • Prochem • Productos CAVE • Prosytec • PSI Packaging • Radiant Color • Rust-Oleum • Seal-Krete • Sierra Performance Coatings • Specialty Polymer Coatings • Spraymate • SPS Group • Star Maling • Stonhard • Tamms • TCI • Testor • Tor • Touch ‘n Foam • Toxement • Tremco • Triarch • Ultra-Tex • Universal Sealants • Vandex • Viapol • Watco • Westfield Coatings • XIM • Zehrung • Zinsser • AD Fire • Adhere Industrial Tapes • API • Applied Polymerics • Arnette Polymers • Ascoat • Betumat • Bomat • Boral • Canam • Carboline • Chemical Coatings, Inc. • Chemspec • Chemtec • Chemtron • Citadel • Dane Group • DAP • Day-Glo • Dryvit • Duram • Euclid Chemical • Eucomex • Expanko • Fibregrid • Finishworks • Firetherm • Flecto • Flowcrete • Grupo PV • Guardian Products • HiChem • Holton Food Products • Hummervoll • illbruck • Increte • Kop-Coat • Krud Kutter • Legend Brands • Mameco • Mantrose-Haeuser • Martin Mathys N.V. • Modern Masters • Mohawk • Multicolor Specialties • Nu-Chem • Nullifire • Okon • Paper Tiger • Parks • Permaquik • Pipeline & Drainage Systems • Plastic Wood • Prime Resins • Prochem • Productos CAVE • Prosytec • PSI Packag-ing • Radiant Color • Rust-Oleum • Seal-Krete • Sierra Performance Coatings • Specialty Polymer Coatings • Spraymate • SPS Group • Star Maling • Stonhard • Tamms • TCI • Testor • Tor • Touch ‘n Foam • Toxement • Tremco • Triarch • Ultra-Tex • Universal Sealants • Vandex • Viapol • Watco • Westfield Coatings • XIM • Zehrung • Zinsser • AD Fire • Adhere Industrial Tapes • API • Applied Polymerics • Arnette Polymers • Ascoat • Betumat • Bomat • Boral • Canam • Carboline • Chemical Coatings, Inc. • Chemspec • Chemtec • Chemtron • Citadel • Dane Group • DAP • Day-Glo • Dryvit • Duram • Euclid Chemical • Eucomex • Expanko • Fibregrid • Finishworks • Firetherm • Flecto • Flowcrete • Grupo PV • Guardian Products • HiChem • Holton Food Products • Hummervoll • illbruck • Increte • Kop-Coat • Krud Kutter • Legend Brands • Mameco • Mantrose-Haeuser • Martin Mathys N.V. • Modern Masters • Mohawk • Multicolor Specialties • Nu-Chem • Nullifire • Okon • Paper Tiger • Parks • Permaquik • Pipeline & Drainage Systems • Plastic Wood • Prime Resins • Prochem • Productos CAVE • Prosytec • PSI Packaging • Radiant Color • Rust-Oleum • Seal-Krete • Sierra Performance Coatings • Specialty Polymer Coatings • Spraymate • SPS Group • Star Maling • Stonhard • Tamms • TCI • Testor • Tor • Touch ‘n Foam • Toxement • Tremco • Triarch • Ultra-Tex • Universal Sealants • Vandex • Viapol • Watco • Westfield Coatings • XIM • Zehrung • Zinsser • AD Fire • Adhere Industrial Tapes • API • Applied Polymerics • Arnette Polymers • Ascoat • Betumat • Bomat • Boral • Canam • Carboline • Chemical Coatings, Inc. • Chemspec • Chemtec • Chemtron • Citadel • Dane Group • DAP • Day-Glo • Dryvit • Duram • Euclid Chemical • Eucomex • Expanko • Fibregrid • Finishworks • Firetherm • Flecto • Flowcrete • Grupo PV • Guardian Products • HiChem • Holton Food Products • Hummervoll • illbruck • Increte • Kop-Coat • Krud Kutter • Legend Brands • Mameco • Mantrose-Haeuser • Martin Mathys N.V. • Modern Masters • Mohawk • Multicolor Specialties • Nu-Chem • Nullifire • Okon • Paper Tiger • Parks • Permaquik • Pipeline & Drainage Systems • Plastic Wood • Prime Resins • Prochem • Productos CAVE • Prosytec • PSI Packaging • Radiant Color • Rust-Oleum • Seal-Krete • Sierra Performance Coatings • Specialty Polymer Coatings • Spraymate • SPS Group • Star Maling • Stonhard • Tamms • TCI • Testor • Tor • Touch ‘n Foam • Toxement • Tremco • Triarch • Ultra-Tex • Universal Sealants • Vandex • Viapol • Watco • Westfield Coatings • XIM • Zehrung • Zinsser • AD Fire • Adhere Industrial Tapes • API • Applied Polymerics • Arnette Polymers • Ascoat • Betumat • Bomat • Boral • Canam • Carboline • Chemical Coatings, Inc. • Chemspec • Chemtec • Chemtron • Citadel • Dane Group • DAP • Day-Glo • Dryvit • Duram • Euclid Chemical • Eucomex • Expanko • Fibregrid • Finishworks • Firetherm • Flecto • Flowcrete • Grupo PV • Guardian Products • HiChem • Holton Food Products • Hummervoll • illbruck • Increte • Kop-Coat • Krud Kutter • Legend Brands • Mameco • Mantrose-Haeuser • Martin Mathys N.V. • Modern Masters • Mohawk • Multicolor Specialties • Nu-Chem • Nullifire • Okon • Paper Tiger • Parks • Permaquik • Pipeline & Drainage Systems • Plastic Wood • Prime Resins • Prochem • Productos CAVE • Prosytec • PSI Packaging • Radiant Color • Rust-Oleum • Seal-Krete • Sierra Performance Coatings • Specialty Polymer Coatings • Spraymate • SPS Group • Star Maling • Stonhard • Tamms • TCI • Testor • Tor • Touch ‘n Foam • Toxement • Tremco • Triarch • Ul-tra-Tex • Universal Sealants • Vandex • Viapol • Watco • Westfield Coatings • XIM • Zehrung • Zinsser • AD Fire • Adhere Industrial Tapes • API • Applied Polymerics • Arnette Polymers • Ascoat • Betumat • Bomat • Boral • Canam • Carboline • Chemical Coatings, Inc. • Chemspec • Chemtec • Chemtron • Citadel • Dane Group • DAP • Day-Glo • Dryvit • Duram • Euclid Chemical • Eucomex • Expanko • Fi-bregrid • Finishworks • Firetherm • Flecto • Flowcrete • Grupo PV • Guardian Products • HiChem • Holton Food Products • Hummervoll • illbruck • Increte • Kop-Coat • Krud Kutter • Legend Brands • Mameco • Mantrose-Haeuser • Martin Mathys N.V. • Modern Masters • Mohawk • Multicolor Specialties • Nu-Chem • Nullifire • Okon • Paper Tiger • Parks • Permaquik • Pipeline & Drainage Systems • Plastic Wood • Prime Resins • Prochem • Productos CAVE • Prosytec • PSI Packaging • Radiant Color • Rust-Oleum • Seal-Krete • Sierra Performance Coatings • Specialty Polymer Coatings • Spraymate • SPS Group • Star Maling • Stonhard • Tamms • TCI • Testor • Tor • Touch ‘n Foam • Toxement • Tremco • Triarch • Ultra-Tex • Universal Sealants • Vandex • Viapol • Watco • Westfield Coatings •
Th
e Best H
om
e for E
ntrep
reneu
rial Co
mp
anies
RP
M IN
TE
RN
AT
ION
AL IN
C. 2017 A
NN
UA
L RE
PO
RT
A
Wo
rld Lead
er in S
pecialty C
oatin
gs an
d S
ealants
H MEBest
for
The
Companies
Annual Report
RPM International Inc.
2017

Financial Highlights • RPM International Inc. • Fiscal 2017
Refer to the consolidated figures in the table above for as-reported data, as well as explanatory footnotes discussing the impact of one-time items.
1 Reflects the pretax impact of (i) $12.3 million in charges related to Flowcrete’s decision to exit the Middle East, (ii) $15.0 million in severance expenses incurred during the fourth quarter of fiscal 2017 pursuant to a plan to reduce future SG&A expense, and (iii) goodwill and other intangible asset impairment charges of $188.3 million related to our Kirker reporting unit (See Note B to the Consolidated Financial Statements). • 2 Reflects (i) the reconsolidation of Specialty Products Holding Corp. (SPHC) effective January 1, 2015 (See Note A[2] to the Consolidated Financial Statements) and (ii) adjustments related to the recognition of an ASC 740-30 tax liability for the potential repatriation of foreign earnings and related impact on net income attributable to noncontrolling interests (See Note F to the Consolidated Financial Statements). • 3 Reflects (i) revised cost estimates and exit costs on unprofitable contracts related to the industrial segment totaling $11.0 million ($8.4 million after-tax), (ii) the write-off of the company’s various investments in Kemrock Industries and Exports Ltd. totaling $78.6 million ($75.0 million after-tax), (iii) the loss on the settlement between the Building Solutions Group and the GSA for $65.1 million ($46.1 million after-tax), (iv) the strategic repositioning of certain operations in Brazil for $6.1 million ($1.6 million benefit after-tax), and (v) restructuring expense for $23.9 million ($14.8 million after-tax). • 4 Reflects the loss recorded upon deconsolidation of SPHC on May 31, 2010 (See Note A[2] to the Consolidated Financial Statements). • 5 Excluding the impact of the loss recognized upon deconsolidation of SPHC and assuming that the deconsolidation of SPHC had occurred prior to fiscal 2010, pro-forma results for fiscal 2010 would have resulted in consolidated net sales of $3.12 billion, income before income taxes of $260.2 million, net income attributable to RPM International Inc. stockholders of $162.9 million and diluted earnings per share of $1.26. • 6 Reflects the impact of goodwill and other intangible asset impairment charge of $15.5 million ($15.3 million after-tax) in 2009. • 7 Reflects the impact of asbestos-related insurance settlement of $15.0 million ($9.7 million after tax) in 2007, and asbestos charges of $288.1 million ($185.1 million after-tax) in 2008. • 8 Fiscal 2012 excludes $5.2 million in income related to the recognition of RPM’s equity method investment in Kemrock, with a $0.04 impact on diluted earnings per share; and fiscal 2013 excludes (i) revised cost estimates and exit costs on unprofitable contracts related to the industrial segment totaling $11.0 million ($8.4 million after-tax), (ii) the write-off of the company’s various investments in Kemrock Industries and Exports Ltd. totaling $78.6 million ($75.0 million after-tax), (iii) the loss on the settlement between the Building Solutions Group and the GSA for $65.1 million ($46.1 million after-tax), (iv) the strategic repositioning of certain operations in Brazil for $6.1 million ($1.6 million benefit after tax), and (v) restructuring expense for $23.9 million ($14.8 million after tax); collectively, these items had a $1.08 impact on diluted earnings per share. Fiscal 2015 excludes adjustments related to the recognition of an ASC 740-30 liability for the potential repatriation of foreign earnings and related after-tax impact on net income attributable to noncontrolling interests of $83.5 million and an impact on diluted earnings per share of $0.60. Fiscal 2016 excludes the reversal of contingent obligations for earnout targets that were not met at our Kirker reporting unit for $14.5 million ($9.2 million after-tax) with a $0.06 impact on diluted earnings per share. Fiscal 2017 excludes (i) a charge of $12.3 million related to the Flowcrete decision to exit the Middle East with a $0.09 impact on diluted earnings per share; (ii) a pretax charge of $188.3 million ($129.0 million after-tax) of goodwill and intangible asset impairment losses related to our Kirker reporting unit with a $0.94 impact on diluted earnings per share; and (iii) pretax impact of $15.0 million ($10.2 million after-tax) for severance charges incurred during the fourth quarter of fiscal 2017 pursuant to a plan to reduce future SG&A expense with a $0.08 impact on diluted earnings per share. • 9 Earnings Before Interest & Taxes for business segments is reconciled to Income (Loss) Before Income Taxes on page 23 for each of the three years ended May 31, 2017. Further, we have provided Adjusted Net Income and Adjusted Earnings Per Share in the table above as certain items are not necessarily representative of the core operations of our businesses and, accordingly, we have provided adjusted results that we believe are useful to investors in evaluating the core operations of our business and are used in the management of the business, including decisions concerning the allocation of resources and assessment of performance. • 10 Return on sales % is calculated as Net income (loss) attributable to RPM International Inc. stockholders divided by Net sales; Return on total RPM International Inc. stockholders’ equity % is calculated as Net income (loss) attributable to RPM International Inc. stockholders divided by the average of the current and prior year Total RPM International Inc. stockholders’ equity; and Total RPM International Inc. stockholders’ equity per share is calculated as Total RPM International Inc. stockholders’ equity divided by Average shares outstanding. • Acquisitions made by the company during the periods presented may impact comparability from year to year (See Note A[4] to the Consolidated Financial Statements). • Certain reclassifications have been made to prior-year amounts to conform to the current-year presentation. • See Notes to Consolidated Financial Statements.
Selected Financial Data (In thousands, except per share and percent data)
$1.24$1.44
$1.61$1.60
$1.64$1.68
1712 13 14 15 16
$160$191
$251$274
$268
17
$59
12 13 14 15 16
$1.18$1.58
$1.65$1.63
$1.73$1.82
1712 13 14 15 16
$3.78$4.08
$4.38$4.59
$4.81$4.96
1712 13 14 15 16
$211$241
$292$323
$346$333
1712 13 14 15 160.000
0.526
1.052
1.578
2.104
2.630
$1.61$1.82
$2.18$2.38
$2.57 $2.47
1712 13 14 15 16
Net Sales $ in billions
Earnings Before Interest & Taxes9
$ in millions
Identifiable Assets $ in billions
All financial data based on fiscal years ended May 31 20171 2016 20152 2014 20133 2012 2011 20104,5 20096 20087 20077
RESULTS FROM OPERATIONS Net sales $ 4,958,175 $ 4,813,649 $ 4,594,550 $ 4,376,353 $ 4,078,655 $ 3,777,416 $ 3,381,841 $ 3,412,716 $ 3,368,167 $ 3,643,791 $ 3,338,764 Income (loss) before income taxes 244,333 483,466 453,253 424,487 176,891 328,289 295,053 268,454 180,868 34,007 307,535 Net income (loss) attributable to RPM International Inc. stockholders 181,823 354,725 239,484 291,660 98,603 215,936 189,058 180,037 119,616 44,428 208,289
PERFORMANCE MEASURES Return on sales %10 3.7 7.4 5.2 6.7 2.4 5.7 5.6 5.3 3.6 1.2 6.2 Return on total RPM International Inc. stockholders’ equity %10 12.9 26.6 17.9 22.6 8.3 17.7 16.1 16.2 10.5 4.0 20.7
PER SHARE DATA Basic earnings (loss) per common share attributable to RPM International Inc. stockholders $ 1.37 $ 2.70 $ 1.81 $ 2.20 $ 0.75 $ 1.65 $ 1.46 $ 1.40 $ 0.93 $ 0.36 $ 1.71 Diluted earnings (loss) per common share attributable to RPM International Inc. stockholders 1.36 2.63 1.78 2.18 0.74 1.65 1.45 1.39 0.93 0.36 1.64 Cash dividends declared per share 1.175 1.085 1.020 0.945 0.890 0.855 0.835 0.815 0.790 0.745 0.685 Total RPM International Inc. stockholders’ equity per share10 10.99 10.61 9.94 10.68 9.31 9.24 9.91 8.50 9.05 9.46 9.20
BALANCE SHEET HIGHLIGHTS Total RPM International Inc. stockholders’ equity $ 1,436,061 $ 1,372,335 $ 1,291,392 $ 1,382,844 $ 1,200,858 $ 1,183,656 $ 1,263,164 $ 1,079,473 $ 1,143,671 $ 1,136,556 $ 1,086,870 Retained earnings 1,172,442 1,147,371 936,996 833,691 667,774 686,818 583,035 502,562 427,955 412,314 475,676 Working capital 1,162,042 1,133,157 1,193,612 1,122,386 955,856 1,011,177 1,171,509 817,444 702,653 935,783 703,603 Total assets 5,090,449 4,764,969 4,680,062 4,365,657 4,110,019 3,553,733 3,510,852 2,995,541 3,402,181 3,756,108 3,326,254 Long-term debt 1,836,437 1,635,260 1,639,859 1,333,257 1,358,349 1,104,873 1,095,970 915,826 754,555 1,059,229 879,521
OTHER DATA Cash from operating activities $ 386,127 $ 474,706 $ 330,448 $ 278,149 $ 368,454 $ 294,872 $ 238,166 $ 203,936 $ 266,995 $ 234,714 $ 202,305 Depreciation and amortization 116,773 111,039 99,176 90,069 86,336 76,023 75,656 84,253 85,144 85,366 81,607 Average shares outstanding 130,662 129,383 129,933 129,438 128,956 128,130 127,403 127,047 126,373 120,151 118,179
Consumer Segment(as reported)
Net Sales $ in billions
Net Income8,9 $ in millions
Diluted Earnings8,9 $ per share
RPM International Inc. (as adjusted)

Refer to the consolidated figures in the table above for as-reported data, as well as explanatory footnotes discussing the impact of one-time items.
1 Reflects the pretax impact of (i) $12.3 million in charges related to Flowcrete’s decision to exit the Middle East, (ii) $15.0 million in severance expenses incurred during the fourth quarter of fiscal 2017 pursuant to a plan to reduce future SG&A expense, and (iii) goodwill and other intangible asset impairment charges of $188.3 million related to our Kirker reporting unit (See Note B to the Consolidated Financial Statements). • 2 Reflects (i) the reconsolidation of Specialty Products Holding Corp. (SPHC) effective January 1, 2015 (See Note A[2] to the Consolidated Financial Statements) and (ii) adjustments related to the recognition of an ASC 740-30 tax liability for the potential repatriation of foreign earnings and related impact on net income attributable to noncontrolling interests (See Note F to the Consolidated Financial Statements). • 3 Reflects (i) revised cost estimates and exit costs on unprofitable contracts related to the industrial segment totaling $11.0 million ($8.4 million after-tax), (ii) the write-off of the company’s various investments in Kemrock Industries and Exports Ltd. totaling $78.6 million ($75.0 million after-tax), (iii) the loss on the settlement between the Building Solutions Group and the GSA for $65.1 million ($46.1 million after-tax), (iv) the strategic repositioning of certain operations in Brazil for $6.1 million ($1.6 million benefit after-tax), and (v) restructuring expense for $23.9 million ($14.8 million after-tax). • 4 Reflects the loss recorded upon deconsolidation of SPHC on May 31, 2010 (See Note A[2] to the Consolidated Financial Statements). • 5 Excluding the impact of the loss recognized upon deconsolidation of SPHC and assuming that the deconsolidation of SPHC had occurred prior to fiscal 2010, pro-forma results for fiscal 2010 would have resulted in consolidated net sales of $3.12 billion, income before income taxes of $260.2 million, net income attributable to RPM International Inc. stockholders of $162.9 million and diluted earnings per share of $1.26. • 6 Reflects the impact of goodwill and other intangible asset impairment charge of $15.5 million ($15.3 million after-tax) in 2009. • 7 Reflects the impact of asbestos-related insurance settlement of $15.0 million ($9.7 million after tax) in 2007, and asbestos charges of $288.1 million ($185.1 million after-tax) in 2008. • 8 Fiscal 2012 excludes $5.2 million in income related to the recognition of RPM’s equity method investment in Kemrock, with a $0.04 impact on diluted earnings per share; and fiscal 2013 excludes (i) revised cost estimates and exit costs on unprofitable contracts related to the industrial segment totaling $11.0 million ($8.4 million after-tax), (ii) the write-off of the company’s various investments in Kemrock Industries and Exports Ltd. totaling $78.6 million ($75.0 million after-tax), (iii) the loss on the settlement between the Building Solutions Group and the GSA for $65.1 million ($46.1 million after-tax), (iv) the strategic repositioning of certain operations in Brazil for $6.1 million ($1.6 million benefit after tax), and (v) restructuring expense for $23.9 million ($14.8 million after tax); collectively, these items had a $1.08 impact on diluted earnings per share. Fiscal 2015 excludes adjustments related to the recognition of an ASC 740-30 liability for the potential repatriation of foreign earnings and related after-tax impact on net income attributable to noncontrolling interests of $83.5 million and an impact on diluted earnings per share of $0.60. Fiscal 2016 excludes the reversal of contingent obligations for earnout targets that were not met at our Kirker reporting unit for $14.5 million ($9.2 million after-tax) with a $0.06 impact on diluted earnings per share. Fiscal 2017 excludes (i) a charge of $12.3 million related to the Flowcrete decision to exit the Middle East with a $0.09 impact on diluted earnings per share; (ii) a pretax charge of $188.3 million ($129.0 million after-tax) of goodwill and intangible asset impairment losses related to our Kirker reporting unit with a $0.94 impact on diluted earnings per share; and (iii) pretax impact of $15.0 million ($10.2 million after-tax) for severance charges incurred during the fourth quarter of fiscal 2017 pursuant to a plan to reduce future SG&A expense with a $0.08 impact on diluted earnings per share. • 9 Earnings Before Interest & Taxes for business segments is reconciled to Income (Loss) Before Income Taxes on page 23 for each of the three years ended May 31, 2017. Further, we have provided Adjusted Net Income and Adjusted Earnings Per Share in the table above as certain items are not necessarily representative of the core operations of our businesses and, accordingly, we have provided adjusted results that we believe are useful to investors in evaluating the core operations of our business and are used in the management of the business, including decisions concerning the allocation of resources and assessment of performance. • 10 Return on sales % is calculated as Net income (loss) attributable to RPM International Inc. stockholders divided by Net sales; Return on total RPM International Inc. stockholders’ equity % is calculated as Net income (loss) attributable to RPM International Inc. stockholders divided by the average of the current and prior year Total RPM International Inc. stockholders’ equity; and Total RPM International Inc. stockholders’ equity per share is calculated as Total RPM International Inc. stockholders’ equity divided by Average shares outstanding. • Acquisitions made by the company during the periods presented may impact comparability from year to year (See Note A[4] to the Consolidated Financial Statements). • Certain reclassifications have been made to prior-year amounts to conform to the current-year presentation. • See Notes to Consolidated Financial Statements.
$2.37$2.42
$2.51$2.58
$2.49$2.56
1712 13 14 15 16
$245$131
$249$260
$263 $251
1712 13 14 15 16
$1.98$2.24
$2.27 $2.15$2.21
$2.38
1712 13 14 15 16
$255$409
$685
$164$214
$714
1712 13 14 15 16
$37
$57$63
$107
$44
$107
1712 13 14 15 16
$214$223
$237$758$755$760
1712 13 14 15 16
Net Sales $ in millions
Net Sales $ in billions
Earnings Before Interest & Taxes9
$ in millions
Earnings Before Interest & Taxes9
$ in millions
Identifiable Assets $ in millions
Identifiable Assets $ in billions
All financial data based on fiscal years ended May 31 20171 2016 20152 2014 20133 2012 2011 20104,5 20096 20087 20077
RESULTS FROM OPERATIONS Net sales $ 4,958,175 $ 4,813,649 $ 4,594,550 $ 4,376,353 $ 4,078,655 $ 3,777,416 $ 3,381,841 $ 3,412,716 $ 3,368,167 $ 3,643,791 $ 3,338,764 Income (loss) before income taxes 244,333 483,466 453,253 424,487 176,891 328,289 295,053 268,454 180,868 34,007 307,535 Net income (loss) attributable to RPM International Inc. stockholders 181,823 354,725 239,484 291,660 98,603 215,936 189,058 180,037 119,616 44,428 208,289
PERFORMANCE MEASURES Return on sales %10 3.7 7.4 5.2 6.7 2.4 5.7 5.6 5.3 3.6 1.2 6.2 Return on total RPM International Inc. stockholders’ equity %10 12.9 26.6 17.9 22.6 8.3 17.7 16.1 16.2 10.5 4.0 20.7
PER SHARE DATA Basic earnings (loss) per common share attributable to RPM International Inc. stockholders $ 1.37 $ 2.70 $ 1.81 $ 2.20 $ 0.75 $ 1.65 $ 1.46 $ 1.40 $ 0.93 $ 0.36 $ 1.71 Diluted earnings (loss) per common share attributable to RPM International Inc. stockholders 1.36 2.63 1.78 2.18 0.74 1.65 1.45 1.39 0.93 0.36 1.64 Cash dividends declared per share 1.175 1.085 1.020 0.945 0.890 0.855 0.835 0.815 0.790 0.745 0.685 Total RPM International Inc. stockholders’ equity per share10 10.99 10.61 9.94 10.68 9.31 9.24 9.91 8.50 9.05 9.46 9.20
BALANCE SHEET HIGHLIGHTS Total RPM International Inc. stockholders’ equity $ 1,436,061 $ 1,372,335 $ 1,291,392 $ 1,382,844 $ 1,200,858 $ 1,183,656 $ 1,263,164 $ 1,079,473 $ 1,143,671 $ 1,136,556 $ 1,086,870 Retained earnings 1,172,442 1,147,371 936,996 833,691 667,774 686,818 583,035 502,562 427,955 412,314 475,676 Working capital 1,162,042 1,133,157 1,193,612 1,122,386 955,856 1,011,177 1,171,509 817,444 702,653 935,783 703,603 Total assets 5,090,449 4,764,969 4,680,062 4,365,657 4,110,019 3,553,733 3,510,852 2,995,541 3,402,181 3,756,108 3,326,254 Long-term debt 1,836,437 1,635,260 1,639,859 1,333,257 1,358,349 1,104,873 1,095,970 915,826 754,555 1,059,229 879,521
OTHER DATA Cash from operating activities $ 386,127 $ 474,706 $ 330,448 $ 278,149 $ 368,454 $ 294,872 $ 238,166 $ 203,936 $ 266,995 $ 234,714 $ 202,305 Depreciation and amortization 116,773 111,039 99,176 90,069 86,336 76,023 75,656 84,253 85,144 85,366 81,607 Average shares outstanding 130,662 129,383 129,933 129,438 128,956 128,130 127,403 127,047 126,373 120,151 118,179
Industrial Segment(as reported)
Specialty Segment(as reported)
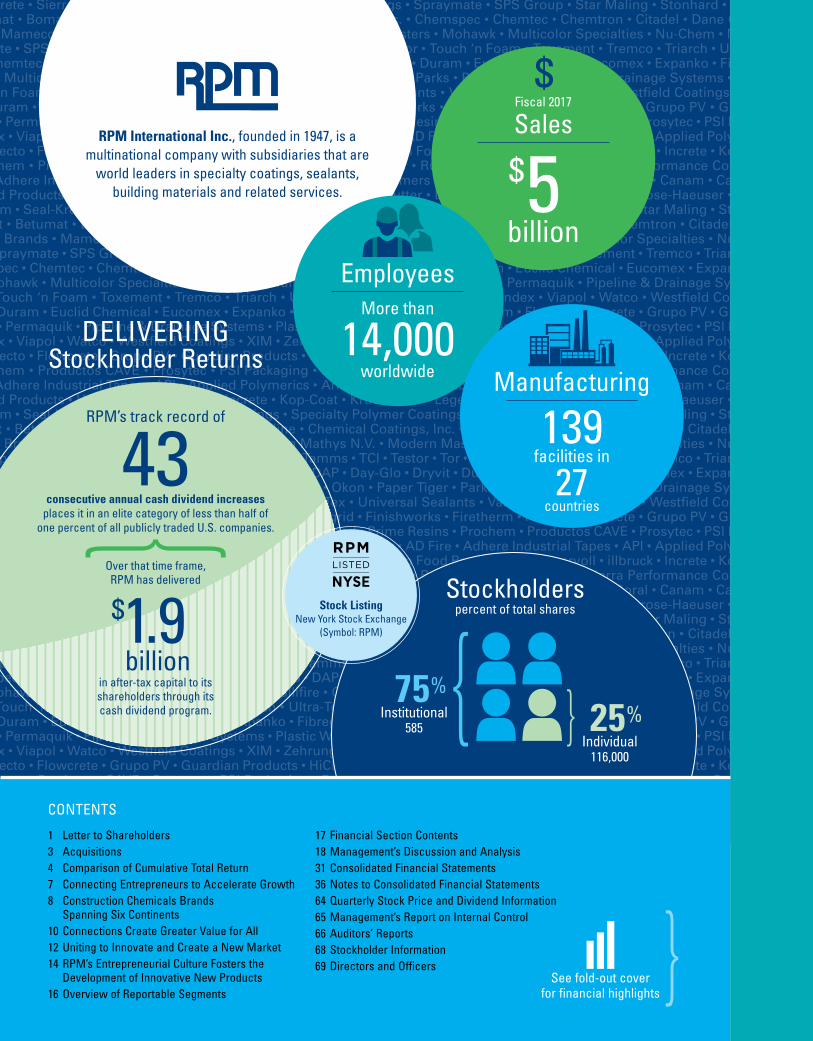
AD Fire • Adhere Industrial Tapes • API • Applied Polymerics • Arnette Polymers • Ascoat • Betumat • Bomat • Boral • Canam • Carboline • Chemical Coatings, Inc. • Chemspec • Chemtec • Chemtron • Citadel • Dane Group • DAP • Day-Glo • Dryvit • Duram • Euclid Chemical • Eucomex • Expanko • Fibregrid • Finishworks • Firetherm • Flecto • Flowcrete • Grupo PV • Guardian Products • HiChem • Holton Food Products • Hummervoll • illbruck • Increte • Kop-Coat • Krud Kutter • Legend Brands • Mameco • Mantrose-Haeuser • Martin Mathys N.V. • Modern Masters • Mohawk • Multicolor Specialties • Nu-Chem • Nullifire • Okon • Paper Tiger • Parks • Permaquik • Pipeline & Drainage Systems • Plastic Wood • Prime Resins • Prochem • Productos CAVE • Prosytec • PSI Packaging • Radiant Color • Rust-Oleum • Seal-Krete • Sierra Performance Coatings • Specialty Polymer Coatings • Spraymate • SPS Group • Star Maling • Stonhard • Tamms • TCI • Testor • Tor • Touch ‘n Foam • Toxement • Tremco • Triarch • Ultra-Tex • Universal Sealants • Vandex • Viapol • Watco • Westfield Coatings • XIM • Zehrung • Zinsser • AD Fire • Adhere Industrial Tapes • API • Applied Polymerics • Arnette Polymers • Ascoat • Betumat • Bomat • Boral • Canam • Carboline • Chemical Coatings, Inc. • Chemspec • Chemtec • Chemtron • Citadel • Dane Group • DAP • Day-Glo • Dryvit • Duram • Euclid Chemical • Eucomex • Expanko • Fibregrid • Finishworks • Firetherm • Flecto • Flowcrete • Grupo PV • Guardian Products • HiChem • Holton Food Products • Hummervoll • illbruck • Increte • Kop-Coat • Krud Kutter • Legend Brands • Mameco • Mantrose-Haeuser • Martin Mathys N.V. • Modern Masters • Mohawk • Multicolor Specialties • Nu-Chem • Nullifire • Okon • Paper Tiger • Parks • Permaquik • Pipeline & Drainage Systems • Plastic Wood • Prime Resins • Prochem • Productos CAVE • Prosytec • PSI Packaging • Radiant Color • Rust-Oleum • Seal-Krete • Sierra Performance Coatings • Specialty Polymer Coatings • Spraymate • SPS Group • Star Maling • Stonhard • Tamms • TCI • Testor • Tor • Touch ‘n Foam • Toxement • Tremco • Triarch • Ultra-Tex • Universal Sealants • Vandex • Viapol • Watco • Westfield Coatings • XIM • Zehrung • Zinsser • AD Fire • Adhere Industrial Tapes • API • Applied Polymerics • Arnette Polymers • Ascoat • Betumat • Bomat • Boral • Canam • Carboline • Chemical Coatings, Inc. • Chemspec • Chemtec • Chemtron • Citadel • Dane Group • DAP • Day-Glo • Dryvit • Duram • Euclid Chemical • Eucomex • Expanko • Fibregrid • Finishworks • Firetherm • Flecto • Flowcrete • Grupo PV • Guardian Products • HiChem • Holton Food Products • Hummervoll • illbruck • Increte • Kop-Coat • Krud Kutter • Legend Brands • Mameco • Mantrose-Haeuser • Martin Mathys N.V. • Modern Masters • Mohawk • Multicolor Specialties • Nu-Chem • Nullifire • Okon • Paper Tiger • Parks • Permaquik • Pipeline & Drainage Systems • Plastic Wood • Prime Resins • Prochem • Productos CAVE • Prosytec • PSI Packaging • Radiant Color • Rust-Oleum • Seal-Krete • Sierra Performance Coatings • Specialty Polymer Coatings • Spraymate • SPS Group • Star Maling • Stonhard • Tamms • TCI • Testor • Tor • Touch ‘n Foam • Toxement • Tremco • Triarch • Ultra-Tex • Universal Sealants • Vandex • Viapol • Watco • Westfield Coatings • XIM • Zehrung • Zinsser • AD Fire • Adhere Industrial Tapes • API • Applied Polymerics • Arnette Polymers • Ascoat • Betumat • Bomat • Boral • Canam • Carboline • Chemical Coatings, Inc. • Chemspec • Chemtec • Chemtron • Citadel • Dane Group • DAP • Day-Glo • Dryvit • Duram • Euclid Chemical • Eucomex • Expanko • Fibregrid • Finishworks • Firetherm • Flecto • Flowcrete • Grupo PV • Guardian Products • HiChem • Holton Food Products • Hummervoll • illbruck • Increte • Kop-Coat • Krud Kutter • Legend Brands • Mameco • Mantrose-Haeuser • Martin Mathys N.V. • Modern Masters • Mohawk • Multicolor Specialties • Nu-Chem • Nullifire • Okon • Paper Tiger • Parks • Permaquik • Pipeline & Drainage Systems • Plastic Wood • Prime Resins • Prochem • Productos CAVE • Prosytec • PSI Packaging • Radiant Color • Rust-Oleum • Seal-Krete • Sierra Performance Coatings • Specialty Polymer Coatings • Spraymate • SPS Group • Star Maling • Stonhard • Tamms • TCI • Testor • Tor • Touch ‘n Foam • Toxement • Tremco • Triarch • Ultra-Tex • Universal Sealants • Vandex • Viapol • Watco • Westfield Coatings • XIM • Zehrung • Zinsser • AD Fire • Adhere Industrial Tapes • API • Applied Polymerics • Arnette Polymers • Ascoat • Betumat • Bomat • Boral • Canam • Carboline • Chemical Coatings, Inc. • Chemspec • Chemtec • Chemtron • Citadel • Dane Group • DAP • Day-Glo • Dryvit • Duram • Euclid Chemical • Eucomex • Expanko • Fibregrid • Finishworks • Firetherm • Flecto • Flowcrete • Grupo PV • Guardian Products • HiChem • Holton Food Products • Hummervoll • illbruck • Increte • Kop-Coat • Krud Kutter • Legend Brands • Mameco • Mantrose-Haeuser • Martin Mathys N.V. • Modern Masters • Mohawk • Multicolor Specialties • Nu-Chem • Nullifire • Okon • Paper Tiger • Parks • Permaquik • Pipeline & Drainage Systems • Plastic Wood • Prime Resins • Prochem • Productos CAVE • Prosytec • PSI Packaging • Radiant Color • Rust-Oleum • Seal-Krete • Sierra Performance Coatings • Specialty Polymer Coatings • Spraymate • SPS Group • Star Maling • Stonhard • Tamms • TCI • Testor • Tor • Touch ‘n Foam • Toxement • Tremco • Triarch • Ultra-Tex • Universal Sealants • Vandex • Viapol • Watco • Westfield Coatings • XIM • Zehrung • Zinsser • AD Fire • Adhere Industrial Tapes • API • Applied Polymerics • Arnette Polymers • Ascoat • Betumat • Bomat • Boral • Canam • Carboline • Chemical Coatings, Inc. • Chemspec • Chemtec • Chemtron • Citadel • Dane Group • DAP • Day-Glo • Dryvit • Duram • Euclid Chemical • Eucomex • Expanko • Fibregrid • Finishworks • Firetherm • Flecto • Flowcrete • Grupo PV • Guardian Products • HiChem • Holton Food Products • Hummervoll • illbruck • Increte • Kop-Coat • Krud Kutter • Legend Brands • Mameco • Mantrose-Haeuser • Martin Mathys N.V. • Modern Masters • Mohawk • Multicolor Specialties • Nu-Chem • Nullifire • Okon • Paper Tiger • Parks • Permaquik • Pipeline & Drainage Systems • Plastic Wood • Prime Resins • Prochem • Productos CAVE • Prosytec • PSI Packag-ing • Radiant Color • Rust-Oleum • Seal-Krete • Sierra Performance Coatings • Specialty Polymer Coatings • Spraymate • SPS Group • Star Maling • Stonhard • Tamms • TCI • Testor • Tor • Touch ‘n Foam • Toxement • Tremco • Triarch • Ultra-Tex • Universal Sealants • Vandex • Viapol • Watco • Westfield Coatings • XIM • Zehrung • Zinsser • AD Fire • Adhere Industrial Tapes • API • Applied Polymerics • Arnette Polymers • Ascoat • Betumat • Bomat • Boral • Canam • Carboline • Chemical Coatings, Inc. • Chemspec • Chemtec • Chemtron • Citadel • Dane Group • DAP • Day-Glo • Dryvit • Duram • Euclid Chemical • Eucomex • Expanko • Fibregrid • Finishworks • Firetherm • Flecto • Flowcrete • Grupo PV • Guardian Products • HiChem • Holton Food Products • Hummervoll • illbruck • Increte • Kop-Coat • Krud Kutter • Legend Brands • Mameco • Mantrose-Haeuser • Martin Mathys N.V. • Modern Masters • Mohawk • Multicolor Specialties • Nu-Chem • Nullifire • Okon • Paper Tiger • Parks • Permaquik • Pipeline & Drainage Systems • Plastic Wood • Prime Resins • Prochem • Productos CAVE • Prosytec • PSI Packaging • Radiant Color • Rust-Oleum • Seal-Krete • Sierra Performance Coatings • Specialty Polymer Coatings • Spraymate • SPS Group • Star Maling • Stonhard • Tamms • TCI • Testor • Tor • Touch ‘n Foam • Toxement • Tremco • Triarch • Ultra-Tex • Universal Sealants • Vandex • Viapol • Watco • Westfield Coatings • XIM • Zehrung • Zinsser • AD Fire • Adhere Industrial Tapes • API • Applied Polymerics • Arnette Polymers • Ascoat • Betumat • Bomat • Boral • Canam • Carboline • Chemical Coatings, Inc. • Chemspec • Chemtec • Chemtron • Citadel • Dane Group • DAP • Day-Glo • Dryvit • Duram • Euclid Chemical • Eucomex • Expanko • Fibregrid • Finishworks • Firetherm • Flecto • Flowcrete • Grupo PV • Guardian Products • HiChem • Holton Food Products • Hummervoll • illbruck • Increte • Kop-Coat • Krud Kutter • Legend Brands • Mameco • Mantrose-Haeuser • Martin Mathys N.V. • Modern Masters • Mohawk • Multicolor Specialties • Nu-Chem • Nullifire • Okon • Paper Tiger • Parks • Permaquik • Pipeline & Drainage Systems • Plastic Wood • Prime Resins • Prochem • Productos CAVE • Prosytec • PSI Packaging • Radiant Color • Rust-Oleum • Seal-Krete • Sierra Performance Coatings • Specialty Polymer Coatings • Spraymate • SPS Group • Star Maling • Stonhard • Tamms • TCI • Testor • Tor • Touch ‘n Foam • Toxement • Tremco • Triarch • Ultra-Tex • Universal Sealants • Vandex • Viapol • Watco • Westfield Coatings • XIM • Zehrung • Zinsser • AD Fire • Adhere Industrial Tapes • API • Applied Polymerics • Arnette Polymers • Ascoat • Betumat • Bomat • Boral • Canam • Carboline • Chemical Coatings, Inc. • Chemspec • Chemtec • Chemtron • Citadel • Dane Group • DAP • Day-Glo • Dryvit • Duram • Euclid Chemical • Eucomex • Expanko • Fibregrid • Finishworks • Firetherm • Flecto • Flowcrete • Grupo PV • Guardian Products • HiChem • Holton Food Products • Hummervoll • illbruck • Increte • Kop-Coat • Krud Kutter • Legend Brands • Mameco • Mantrose-Haeuser • Martin Mathys N.V. • Modern Masters • Mohawk • Multicolor Specialties • Nu-Chem • Nullifire • Okon • Paper Tiger • Parks • Permaquik • Pipeline & Drainage Systems • Plastic Wood • Prime Resins • Prochem • Productos CAVE • Prosytec • PSI Packaging • Radiant Color • Rust-Oleum • Seal-Krete • Sierra Performance Coatings • Specialty Polymer Coatings • Spraymate • SPS Group • Star Maling • Stonhard • Tamms • TCI • Testor • Tor • Touch ‘n Foam • Toxement • Tremco • Triarch • Ul-tra-Tex • Universal Sealants • Vandex • Viapol • Watco • Westfield Coatings • XIM • Zehrung • Zinsser • AD Fire • Adhere Industrial Tapes • API • Applied Polymerics • Arnette Polymers • Ascoat • Betumat • Bomat • Boral • Canam • Carboline • Chemical Coatings, Inc. • Chemspec • Chemtec • Chemtron • Citadel • Dane Group • DAP • Day-Glo • Dryvit • Duram • Euclid Chemical • Eucomex • Expanko • Fi-bregrid • Finishworks • Firetherm • Flecto • Flowcrete • Grupo PV • Guardian Products • HiChem • Holton Food Products • Hummervoll • illbruck • Increte • Kop-Coat • Krud Kutter • Legend Brands • Mameco • Mantrose-Haeuser • Martin Mathys N.V. • Modern Masters • Mohawk • Multicolor Specialties • Nu-Chem • Nullifire • Okon • Paper Tiger • Parks • Permaquik • Pipeline & Drainage Systems • Plastic Wood • Prime Resins • Prochem • Productos CAVE • Prosytec • PSI Packaging • Radiant Color • Rust-Oleum • Seal-Krete • Sierra Performance Coatings • Specialty Polymer Coatings • Spraymate • SPS Group • Star Maling • Stonhard • Tamms • TCI • Testor • Tor • Touch ‘n Foam • Toxement • Tremco • Triarch • Ultra-Tex • Universal Sealants • Vandex • Viapol • Watco • Westfield Coatings • XIM • Zehrung • Zinsser • AD Fire • Adhere Industrial Tapes • API • Applied Polymerics • Arnette Polymers • Ascoat • Betumat • Bomat • Boral • Canam • Carboline • Chemical Coatings, Inc. • Chemspec • Chemtec • Chemtron • Citadel • Dane Group • DAP • Day-Glo • Dryvit • Duram • Euclid Chemical • Eucomex • Expanko • Fibregrid • Finishworks • Firetherm • Flecto • Flowcrete • Grupo PV • Guardian Products • HiChem • Holton Food Products • Hummervoll • illbruck • Increte • Kop-Coat • Krud Kutter • Legend Brands • Mameco • Mantrose-Haeuser • Martin Mathys N.V. • Modern Masters • Mohawk • Multicolor Specialties • Nu-Chem • Nullifire • Okon • Paper Tiger • Parks • Permaquik • Pipeline & Drainage Systems • Plastic Wood • Prime Resins • Prochem • Productos CAVE • Prosytec • PSI Packag-ing • Radiant Color • Rust-Oleum • Seal-Krete • Sierra Performance Coatings • Specialty Polymer Coatings • Spraymate • SPS Group • Star Maling • Stonhard • Tamms • TCI • Testor • Tor • Touch ‘n Foam • Toxement • Tremco • Triarch • Ultra-Tex • Universal Sealants • Vandex • Viapol • Watco • Westfield Coatings • XIM • Zehrung • Zinsser • AD Fire • Adhere Industrial Tapes • API • Applied Polymerics • Arnette Polymers • Ascoat • Betumat • Bomat • Boral • Canam • Carboline • Chemical Coatings, Inc. • Chemspec • Chemtec • Chemtron • Citadel • Dane Group • DAP • Day-Glo • Dryvit • Duram • Euclid Chemical • Eucomex • Expanko • Fibregrid • Finishworks • Firetherm • Flecto • Flowcrete • Grupo PV • Guardian Products • HiChem • Holton Food Products • Hummervoll • illbruck • Increte • Kop-Coat • Krud Kutter • Legend Brands • Mameco • Mantrose-Haeuser • Martin Mathys N.V. • Modern Masters • Mohawk • Multicolor Specialties • Nu-Chem • Nullifire • Okon • Paper Tiger • Parks • Permaquik • Pipeline & Drainage Systems • Plastic Wood • Prime Resins • Prochem • Productos CAVE • Prosytec • PSI Packaging • Radiant Color • Rust-Oleum • Seal-Krete • Sierra Performance Coatings • Specialty Polymer Coatings • Spraymate • SPS Group • Star Maling • Stonhard • Tamms • TCI • Testor • Tor • Touch ‘n Foam • Toxement • Tremco • Triarch • Ultra-Tex • Universal Sealants • Vandex • Viapol • Watco • Westfield Coatings • XIM • Zehrung • Zinsser • AD Fire • Adhere Industrial Tapes • API • Applied Polymerics • Arnette Polymers • Ascoat • Betumat • Bomat • Boral • Canam • Carboline • Chemical Coatings, Inc. • Chemspec • Chemtec • Chemtron • Citadel • Dane Group • DAP • Day-Glo • Dryvit • Duram • Euclid Chemical • Eucomex • Expanko • Fibregrid • Finishworks • Firetherm • Flecto • Flowcrete • Grupo PV • Guardian Products • HiChem • Holton Food Products • Hummervoll • illbruck • Increte • Kop-Coat • Krud Kutter • Legend Brands • Mameco • Mantrose-Haeuser • Martin Mathys N.V. • Modern Masters • Mohawk • Multicolor Specialties • Nu-Chem • Nullifire • Okon • Paper Tiger • Parks • Permaquik • Pipeline & Drainage Systems • Plastic Wood • Prime Resins • Prochem • Productos CAVE • Prosytec • PSI Packaging • Radiant Color • Rust-Oleum • Seal-Krete • Sierra Performance Coatings • Specialty Polymer Coatings • Spraymate • SPS Group • Star Maling • Stonhard • Tamms • TCI • Testor • Tor • Touch ‘n Foam • Toxement • Tremco • Triarch • Ultra-Tex • Universal Sealants • Vandex • Viapol • Watco • Westfield Coatings • XIM • Zehrung • Zinsser • AD Fire • Adhere Industrial Tapes • API • Applied Polymerics • Arnette Polymers • Ascoat • Betumat • Bomat • Boral • Canam • Carboline • Chemical Coatings, Inc. • Chemspec • Chemtec • Chemtron • Citadel • Dane Group • DAP • Day-Glo • Dryvit • Duram • Euclid Chemical • Eucomex • Expanko • Fibregrid • Finishworks • Firetherm • Flecto • Flowcrete • Grupo PV • Guardian Products • HiChem • Holton Food Products • Hummervoll • illbruck • Increte • Kop-Coat • Krud Kutter • Legend Brands • Mameco • Mantrose-Haeuser • Martin Mathys N.V. • Modern Masters • Mohawk • Multicolor Specialties • Nu-Chem • Nullifire • Okon • Paper Tiger • Parks • Permaquik • Pipeline & Drainage Systems • Plastic Wood • Prime Resins • Prochem • Productos CAVE • Prosytec • PSI Packaging • Radiant Color • Rust-Oleum • Seal-Krete • Sierra Performance Coatings • Specialty Polymer Coatings • Spraymate • SPS Group • Star Maling • Stonhard • Tamms • TCI • Testor • Tor • Touch ‘n Foam • Toxement • Tremco • Triarch • Ul-tra-Tex • Universal Sealants • Vandex • Viapol • Watco • Westfield Coatings • XIM • Zehrung • Zinsser • AD Fire • Adhere Industrial Tapes • API • Applied Polymerics • Arnette Polymers • Ascoat • Betumat • Bomat • Boral • Canam • Carboline • Chemical Coatings, Inc. • Chemspec • Chemtec • Chemtron • Citadel • Dane Group • DAP • Day-Glo • Dryvit • Duram • Euclid Chemical • Eucomex • Expanko • Fi-bregrid • Finishworks • Firetherm • Flecto • Flowcrete • Grupo PV • Guardian Products • HiChem • Holton Food Products • Hummervoll • illbruck • Increte • Kop-Coat • Krud Kutter • Legend Brands • Mameco • Mantrose-Haeuser • Martin Mathys N.V. • Modern Masters • Mohawk • Multicolor Specialties • Nu-Chem • Nullifire • Okon • Paper Tiger • Parks • Permaquik • Pipeline & Drainage Systems • Plastic Wood • Prime Resins • Prochem • Productos CAVE • Prosytec • PSI Packaging • Radiant Color • Rust-Oleum • Seal-Krete • Sierra Performance Coatings • Specialty Polymer Coatings • Spraymate • SPS Group • Star Maling • Stonhard • Tamms • TCI • Testor • Tor • Touch ‘n Foam • Toxement • Tremco • Triarch • Ultra-Tex • Universal Sealants • Vandex • Viapol • Watco • Westfield Coatings • XIM • Zehrung • Zinsser • AD Fire • Adhere Industrial Tapes • API • Applied Polymerics • Arnette Polymers • Ascoat • Betumat • Bomat • Boral • Canam • Carboline • Chemical Coatings, Inc. • Chemspec • Chemtec • Chemtron • Citadel • Dane Group • DAP • Day-Glo • Dryvit • Duram • Euclid Chemical • Eucomex • Expanko • Fibregrid • Finishworks • Firetherm • Flecto • Flowcrete • Grupo PV • Guardian Products • HiChem • Holton Food Products • Hummervoll • illbruck • Increte • Kop-Coat • Krud Kutter • Legend Brands • Mameco • Mantrose-Haeuser • Martin Mathys N.V. • Modern Masters • Mohawk • Multicolor Specialties • Nu-Chem • Nullifire • Okon • Paper Tiger • Parks • Permaquik • Pipeline & Drainage Systems • Plastic Wood • Prime Resins • Prochem • Productos CAVE • Prosytec • PSI Packag-ing • Radiant Color • Rust-Oleum • Seal-Krete • Sierra Performance Coatings • Specialty Polymer Coatings • Spraymate • SPS Group • Star Maling • Stonhard • Tamms • TCI • Testor • Tor • Touch ‘n Foam • Toxement • Tremco • Triarch • Ultra-Tex • Universal Sealants • Vandex • Viapol • Watco • Westfield Coatings • XIM • Zehrung • Zinsser • AD Fire • Adhere Industrial Tapes • API • Applied Polymerics • Arnette Polymers • Ascoat • Betumat • Bomat • Boral • Canam • Carboline • Chemical Coatings, Inc. • Chemspec • Chemtec • Chemtron • Citadel • Dane Group • DAP • Day-Glo • Dryvit • Duram • Euclid Chemical • Eucomex • Expanko • Fibregrid • Finishworks • Firetherm • Flecto • Flowcrete • Grupo PV • Guardian Products • HiChem • Holton Food Products • Hummervoll • illbruck • Increte • Kop-Coat • Krud Kutter • Legend Brands • Mameco • Mantrose-Haeuser • Martin Mathys N.V. • Modern Masters • Mohawk • Multicolor Specialties • Nu-Chem • Nullifire • Okon • Paper Tiger • Parks • Permaquik • Pipeline & Drainage Systems • Plastic Wood • Prime Resins • Prochem • Productos CAVE • Prosytec • PSI Packaging • Radiant Color • Rust-Oleum • Seal-Krete • Sierra Performance Coatings • Specialty Polymer Coatings • Spraymate • SPS Group • Star Maling • Stonhard • Tamms • TCI • Testor • Tor • Touch ‘n Foam • Toxement • Tremco • Triarch • Ultra-Tex • Universal Sealants • Vandex • Viapol • Watco • Westfield Coatings • XIM • Zehrung • Zinsser • AD Fire • Adhere Industrial Tapes • API • Applied Polymerics • Arnette Polymers • Ascoat • Betumat • Bomat • Boral • Canam • Carboline • Chemical Coatings, Inc. • Chemspec • Chemtec • Chemtron • Citadel • Dane Group • DAP • Day-Glo • Dryvit • Duram • Euclid Chemical • Eucomex • Expanko • Fibregrid • Finishworks • Firetherm • Flecto • Flowcrete • Grupo PV • Guardian Products • HiChem • Holton Food Products • Hummervoll • illbruck • Increte • Kop-Coat • Krud Kutter • Legend Brands • Mameco • Mantrose-Haeuser • Martin Mathys N.V. • Modern Masters • Mohawk • Multicolor Specialties • Nu-Chem • Nullifire • Okon • Paper Tiger • Parks • Permaquik • Pipeline & Drainage Systems • Plastic Wood • Prime Resins • Prochem • Productos CAVE • Prosytec • PSI Packaging • Radiant Color • Rust-Oleum • Seal-Krete • Sierra Performance Coatings • Specialty Polymer Coatings • Spraymate • SPS Group • Star Maling • Stonhard • Tamms • TCI • Testor • Tor • Touch ‘n Foam • Toxement • Tremco • Triarch • Ultra-Tex • Universal Sealants • Vandex • Viapol • Watco • Westfield Coatings • XIM • Zehrung • Zinsser • AD Fire • Adhere Industrial Tapes • API • Applied Polymerics • Arnette Polymers • Ascoat • Betumat • Bomat • Boral • Canam • Carboline • Chemical Coatings, Inc. • Chemspec • Chemtec • Chemtron • Citadel • Dane Group • DAP • Day-Glo • Dryvit • Duram • Euclid Chemical • Eucomex • Expanko • Fibregrid • Finishworks • Firetherm • Flecto • Flowcrete • Grupo PV • Guardian Products • HiChem • Holton Food Products • Hummervoll • illbruck • Increte • Kop-Coat • Krud Kutter • Legend Brands • Mameco • Mantrose-Haeuser • Martin Mathys N.V. • Modern Masters • Mohawk • Multicolor Specialties • Nu-Chem • Nullifire • Okon • Paper Tiger • Parks • Permaquik • Pipeline & Drainage Systems • Plastic Wood • Prime Resins • Prochem • Productos CAVE • Prosytec • PSI Packaging • Radiant Color • Rust-Oleum • Seal-Krete • Sierra Performance Coatings • Specialty Polymer Coatings • Spraymate • SPS Group • Star Maling • Stonhard • Tamms • TCI • Testor • Tor • Touch ‘n Foam • Toxement • Tremco • Triarch • Ul-tra-Tex • Universal Sealants • Vandex • Viapol • Watco • Westfield Coatings • XIM • Zehrung • Zinsser • AD Fire • Adhere Industrial Tapes • API • Applied Polymerics • Arnette Polymers • Ascoat • Betumat • Bomat • Boral • Canam • Carboline • Chemical Coatings, Inc. • Chemspec • Chemtec • Chemtron • Citadel • Dane Group • DAP • Day-Glo • Dryvit • Duram • Euclid Chemical • Eucomex • Expanko • Fi-bregrid • Finishworks • Firetherm • Flecto • Flowcrete • Grupo PV • Guardian Products • HiChem • Holton Food Products • Hummervoll • illbruck • Increte • Kop-Coat • Krud Kutter • Legend Brands • Mameco • Mantrose-Haeuser • Martin Mathys N.V. • Modern Masters • Mohawk • Multicolor Specialties • Nu-Chem • Nullifire • Okon • Paper Tiger • Parks • Permaquik • Pipeline & Drainage Systems • Plastic Wood • Prime Resins • Prochem • Productos CAVE • Prosytec • PSI Packaging • Radiant Color • Rust-Oleum • Seal-Krete • Sierra Performance Coatings • Specialty Polymer Coatings • Spraymate • SPS Group • Star Maling • Stonhard • Tamms • TCI • Testor • Tor • Touch ‘n Foam • Toxement • Tremco • Triarch • Ultra-Tex • Universal Sealants • Vandex • Viapol • Watco • Westfield Coatings • XIM • Zehrung • Zinsser • AD Fire • Adhere Industrial Tapes • API • Applied Polymerics • Arnette Polymers • Ascoat • Betumat • Bomat • Boral • Canam • Carboline • Chemical Coatings, Inc. • Chemspec • Chemtec • Chemtron • Citadel • Dane Group • DAP • Day-Glo • Dryvit • Duram • Euclid Chemical • Eucomex • Expanko • Fibregrid • Finishworks • Firetherm • Flecto • Flowcrete • Grupo PV • Guardian Products • HiChem • Holton Food Products • Hummervoll • illbruck • Increte • Kop-Coat • Krud Kutter • Legend Brands • Mameco • Mantrose-Haeuser • Martin Mathys N.V. • Modern Masters • Mohawk • Multicolor Specialties • Nu-Chem • Nullifire • Okon • Paper Tiger • Parks • Permaquik • Pipeline & Drainage Systems • Plastic Wood • Prime Resins • Prochem • Productos CAVE • Prosytec • PSI Packag-ing • Radiant Color • Rust-Oleum • Seal-Krete • Sierra Performance Coatings • Specialty Polymer Coatings • Spraymate • SPS Group • Star Maling • Stonhard • Tamms • TCI • Testor • Tor • Touch ‘n Foam • Toxement • Tremco • Triarch • Ultra-Tex • Universal Sealants • Vandex • Viapol • Watco • Westfield Coatings • XIM • Zehrung • Zinsser • AD Fire • Adhere Industrial Tapes • API • Applied Polymerics • Arnette Polymers • Ascoat • Betumat • Bomat • Boral • Canam • Carboline • Chemical Coatings, Inc. • Chemspec • Chemtec • Chemtron • Citadel • Dane Group • DAP • Day-Glo • Dryvit • Duram • Euclid Chemical • Eucomex • Expanko • Fibregrid • Finishworks • Firetherm • Flecto • Flowcrete • Grupo PV • Guardian Products • HiChem • Holton Food Products • Hummervoll • illbruck • Increte • Kop-Coat • Krud Kutter • Legend Brands • Mameco • Mantrose-Haeuser • Martin Mathys N.V. • Modern Masters • Mohawk • Multicolor Specialties • Nu-Chem • Nullifire • Okon • Paper Tiger • Parks • Permaquik • Pipeline & Drainage Systems • Plastic Wood • Prime Resins • Prochem • Productos CAVE • Prosytec • PSI Packaging • Radiant Color • Rust-Oleum • Seal-Krete • Sierra Performance Coatings • Specialty Polymer Coatings • Spraymate • SPS Group • Star Maling • Stonhard • Tamms • TCI • Testor • Tor • Touch ‘n Foam • Toxement • Tremco • Triarch • Ultra-Tex • Universal Sealants • Vandex • Viapol • Watco • Westfield Coatings • XIM • Zehrung • Zinsser • AD Fire • Adhere Industrial Tapes • API • Applied Polymerics • Arnette Polymers • Ascoat • Betumat • Bomat • Boral • Canam • Carboline • Chemical Coatings, Inc. • Chemspec • Chemtec • Chemtron • Citadel • Dane Group • DAP • Day-Glo • Dryvit • Duram • Euclid Chemical • Eucomex • Expanko • Fibregrid • Finishworks • Firetherm • Flecto • Flowcrete • Grupo PV • Guardian Products • HiChem • Holton Food Products • Hummervoll • illbruck • Increte • Kop-Coat • Krud Kutter • Legend Brands • Mameco • Mantrose-Haeuser • Martin Mathys N.V. • Modern Masters • Mohawk • Multicolor Specialties • Nu-Chem • Nullifire • Okon • Paper Tiger • Parks • Permaquik • Pipeline & Drainage Systems • Plastic Wood • Prime Resins • Prochem • Productos CAVE • Prosytec • PSI Packaging • Radiant Color • Rust-Oleum • Seal-Krete • Sierra Performance Coatings • Specialty Polymer Coatings • Spraymate • SPS Group • Star Maling • Stonhard • Tamms • TCI • Testor • Tor • Touch ‘n Foam • Toxement • Tremco • Triarch • Ultra-Tex • Universal Sealants • Vandex • Viapol • Watco • Westfield Coatings • XIM • Zehrung • Zinsser • AD Fire • Adhere Industrial Tapes • API • Applied Polymerics • Arnette Polymers • Ascoat • Betumat • Bomat • Boral • Canam • Carboline • Chemical Coatings, Inc. • Chemspec • Chemtec • Chemtron • Citadel • Dane Group • DAP • Day-Glo • Dryvit • Duram • Euclid Chemical • Eucomex • Expanko • Fibregrid • Finishworks • Firetherm • Flecto • Flowcrete • Grupo PV • Guardian Products • HiChem • Holton Food Products • Hummervoll • illbruck • Increte • Kop-Coat • Krud Kutter • Legend Brands • Mameco • Mantrose-Haeuser • Martin Mathys N.V. • Modern Masters • Mohawk • Multicolor Specialties • Nu-Chem • Nullifire • Okon • Paper Tiger • Parks • Permaquik • Pipeline & Drainage Systems • Plastic Wood • Prime Resins • Prochem • Productos CAVE • Prosytec • PSI Packaging • Radiant Color • Rust-Oleum • Seal-Krete • Sierra Performance Coatings • Specialty Polymer Coatings • Spraymate • SPS Group • Star Maling • Stonhard • Tamms • TCI • Testor • Tor • Touch ‘n Foam • Toxement • Tremco • Triarch • Ul-tra-Tex • Universal Sealants • Vandex • Viapol • Watco • Westfield Coatings • XIM • Zehrung • Zinsser • AD Fire • Adhere Industrial Tapes • API • Applied Polymerics • Arnette Polymers • Ascoat • Betumat • Bomat • Boral • Canam • Carboline • Chemical Coatings, Inc. • Chemspec • Chemtec • Chemtron • Citadel • Dane Group • DAP • Day-Glo • Dryvit • Duram • Euclid Chemical • Eucomex • Expanko • Fi-bregrid • Finishworks • Firetherm • Flecto • Flowcrete • Grupo PV • Guardian Products • HiChem • Holton Food Products • Hummervoll • illbruck • Increte • Kop-Coat • Krud Kutter • Legend Brands • Mameco • Mantrose-Haeuser • Martin Mathys N.V. • Modern Masters • Mohawk • Multicolor Specialties • Nu-Chem • Nullifire • Okon • Paper Tiger • Parks • Permaquik • Pipeline & Drainage Systems • Plastic Wood • Prime Resins • Prochem • Productos CAVE • Prosytec • PSI Packaging • Radiant Color • Rust-Oleum • Seal-Krete • Sierra Performance Coatings • Specialty Polymer Coatings • Spraymate • SPS Group • Star Maling • Stonhard • Tamms • TCI • Testor • Tor • Touch ‘n Foam • Toxement • Tremco • Triarch • Ultra-Tex • Universal Sealants • Vandex • Viapol • Watco • Westfield Coatings • XIM • Zehrung • Zinsser • AD Fire • Adhere Industrial Tapes • API • Applied Polymerics • Arnette Polymers • Ascoat • Betumat • Bomat • Boral • Canam • Carboline • Chemical Coatings, Inc. • Chemspec • Chemtec • Chemtron • Citadel • Dane Group • DAP • Day-Glo • Dryvit • Duram • Euclid Chemical • Eucomex • Expanko • Fibregrid • Finishworks • Firetherm • Flecto • Flowcrete • Grupo PV • Guardian Products • HiChem • Holton Food Products • Hummervoll • illbruck • Increte • Kop-Coat • Krud Kutter • Legend Brands • Mameco • Mantrose-Haeuser • Martin Mathys N.V. • Modern Masters • Mohawk • Multicolor Specialties • Nu-Chem • Nullifire • Okon • Paper Tiger • Parks • Permaquik • Pipeline & Drainage Systems • Plastic Wood • Prime Resins • Prochem • Productos CAVE • Prosytec • PSI Packag-ing • Radiant Color • Rust-Oleum • Seal-Krete • Sierra Performance Coatings • Specialty Polymer Coatings • Spraymate • SPS Group • Star Maling • Stonhard • Tamms • TCI • Testor • Tor • Touch ‘n Foam • Toxement • Tremco • Triarch • Ultra-Tex • Universal Sealants • Vandex • Viapol • Watco • Westfield Coatings • XIM • Zehrung • Zinsser • AD Fire • Adhere Industrial Tapes • API • Applied Polymerics • Arnette Polymers • Ascoat • Betumat • Bomat • Boral • Canam • Carboline • Chemical Coatings, Inc. • Chemspec • Chemtec • Chemtron • Citadel • Dane Group • DAP • Day-Glo • Dryvit • Duram • Euclid Chemical • Eucomex • Expanko • Fibregrid • Finishworks • Firetherm • Flecto • Flowcrete • Grupo PV • Guardian Products • HiChem • Holton Food Products • Hummervoll • illbruck • Increte • Kop-Coat • Krud Kutter • Legend Brands • Mameco • Mantrose-Haeuser • Martin Mathys N.V. • Modern Masters • Mohawk • Multicolor Specialties • Nu-Chem • Nullifire • Okon • Paper Tiger • Parks • Permaquik • Pipeline & Drainage Systems • Plastic Wood • Prime Resins • Prochem • Productos CAVE • Prosytec • PSI Packaging • Radiant Color • Rust-Oleum • Seal-Krete • Sierra Performance Coatings • Specialty Polymer Coatings • Spraymate • SPS Group • Star Maling • Stonhard • Tamms • TCI • Testor • Tor • Touch ‘n Foam • Toxement • Tremco • Triarch • Ultra-Tex • Universal Sealants • Vandex • Viapol • Watco • Westfield Coatings • XIM • Zehrung • Zinsser • AD Fire • Adhere Industrial Tapes • API • Applied Polymerics • Arnette Polymers • Ascoat • Betumat • Bomat • Boral • Canam • Carboline • Chemical Coatings, Inc. • Chemspec • Chemtec • Chemtron • Citadel • Dane Group • DAP • Day-Glo • Dryvit • Duram • Euclid Chemical • Eucomex • Expanko • Fibregrid • Finishworks • Firetherm • Flecto • Flowcrete • Grupo PV • Guardian Products • HiChem • Holton Food Products • Hummervoll • illbruck • Increte • Kop-Coat • Krud Kutter • Legend Brands • Mameco • Mantrose-Haeuser • Martin Mathys N.V. • Modern Masters • Mohawk • Multicolor Specialties • Nu-Chem • Nullifire • Okon • Paper Tiger • Parks • Permaquik • Pipeline & Drainage Systems • Plastic Wood • Prime Resins • Prochem • Productos CAVE • Prosytec • PSI Packaging • Radiant Color • Rust-Oleum • Seal-Krete • Sierra Performance Coatings • Specialty Polymer Coatings • Spraymate • SPS Group • Star Maling • Stonhard • Tamms • TCI • Testor • Tor • Touch ‘n Foam • Toxement • Tremco • Triarch • Ultra-Tex • Universal Sealants • Vandex • Viapol • Watco • Westfield Coatings • XIM • Zehrung • Zinsser • AD Fire • Adhere Industrial Tapes • API • Applied Polymerics • Arnette Polymers • Ascoat • Betumat • Bomat • Boral • Canam • Carboline • Chemical Coatings, Inc. • Chemspec • Chemtec • Chemtron • Citadel • Dane Group • DAP • Day-Glo • Dryvit • Duram • Euclid Chemical • Eucomex • Expanko • Fibregrid • Finishworks • Firetherm • Flecto • Flowcrete • Grupo PV • Guardian Products • HiChem • Holton Food Products • Hummervoll • illbruck • Increte • Kop-Coat • Krud Kutter • Legend Brands • Mameco • Mantrose-Haeuser • Martin Mathys N.V. • Modern Masters • Mohawk • Multicolor Specialties • Nu-Chem • Nullifire • Okon • Paper Tiger • Parks • Permaquik • Pipeline & Drainage Systems • Plastic Wood • Prime Resins • Prochem • Productos CAVE • Prosytec • PSI Packaging • Radiant Color • Rust-Oleum • Seal-Krete • Sierra Performance Coatings • Specialty Polymer Coatings • Spraymate • SPS Group • Star Maling • Stonhard • Tamms • TCI • Testor • Tor • Touch ‘n Foam • Toxement • Tremco • Triarch • Ul-tra-Tex • Universal Sealants • Vandex • Viapol • Watco • Westfield Coatings • XIM • Zehrung • Zinsser • AD Fire • Adhere Industrial Tapes • API • Applied Polymerics • Arnette Polymers • Ascoat • Betumat • Bomat • Boral • Canam • Carboline • Chemical Coatings, Inc. • Chemspec • Chemtec • Chemtron • Citadel • Dane Group • DAP • Day-Glo • Dryvit • Duram • Euclid Chemical • Eucomex • Expanko • Fi-bregrid • Finishworks • Firetherm • Flecto • Flowcrete • Grupo PV • Guardian Products • HiChem • Holton Food Products • Hummervoll • illbruck • Increte • Kop-Coat • Krud Kutter • Legend Brands • Mameco • Mantrose-Haeuser • Martin Mathys N.V. • Modern Masters • Mohawk • Multicolor Specialties • Nu-Chem • Nullifire • Okon • Paper Tiger • Parks • Permaquik • Pipeline & Drainage Systems • Plastic Wood • Prime Resins • Prochem • Productos CAVE • Prosytec • PSI Packaging • Radiant Color • Rust-Oleum • Seal-Krete • Sierra Performance Coatings • Specialty Polymer Coatings • Spraymate • SPS Group • Star Maling • Stonhard • Tamms • TCI • Testor • Tor • Touch ‘n Foam • Toxement • Tremco • Triarch • Ultra-Tex • Universal Sealants • Vandex • Viapol • Watco • Westfield Coatings •
Stock ListingNew York Stock Exchange
(Symbol: RPM)
Institutional585
Individual116,000
75%
25%
Stockholderspercent of total shares
5billion
$
$
EmployeesMore than
14,000worldwide Manufacturing
139 facilities in
27 countries
RPM International Inc., founded in 1947, is a multinational company with subsidiaries that are
world leaders in specialty coatings, sealants, building materials and related services.
1 Letter to Shareholders 3 Acquisitions 4 Comparison of Cumulative Total Return 7 Connecting Entrepreneurs to Accelerate Growth 8 Construction Chemicals Brands
Spanning Six Continents10 Connections Create Greater Value for All 12 Uniting to Innovate and Create a New Market 14 RPM’s Entrepreneurial Culture Fosters the
Development of Innovative New Products16 Overview of Reportable Segments
17 Financial Section Contents18 Management’s Discussion and Analysis 31 Consolidated Financial Statements 36 Notes to Consolidated Financial Statements64 Quarterly Stock Price and Dividend Information 65 Management’s Report on Internal Control 66 Auditors’ Reports68 Stockholder Information 69 Directors and Officers
See fold-out cover for financial highlights
consecutive annual cash dividend increases places it in an elite category of less than half of
one percent of all publicly traded U.S. companies.
RPM’s track record of
CONTENTS
Over that time frame, RPM has delivered
in after-tax capital to its shareholders through its cash dividend program.
$1.9billion
43
DELIVERING Stockholder Returns
SalesFiscal 2017

AD Fire • Adhere Industrial Tapes • API • Applied Polymerics • Arnette Polymers • Ascoat • Betumat • Bomat • Boral • Canam • Carboline • Chemical Coatings, Inc. • Chemspec • Chemtec • Chemtron • Citadel • Dane Group • DAP • Day-Glo • Dryvit • Duram • Euclid Chemical • Eucomex • Expanko • Fibregrid • Finishworks • Firetherm • Flecto • Flowcrete • Grupo PV • Guardian Products • HiChem • Holton Food Products • Hummervoll • illbruck • Increte • Kop-Coat • Krud Kutter • Legend Brands • Mameco • Mantrose-Haeuser • Martin Mathys N.V. • Modern Masters • Mohawk • Multicolor Specialties • Nu-Chem • Nullifire • Okon • Paper Tiger • Parks • Permaquik • Pipeline & Drainage Systems • Plastic Wood • Prime Resins • Prochem • Productos CAVE • Prosytec • PSI Packaging • Radiant Color • Rust-Oleum • Seal-Krete • Sierra Performance Coatings • Specialty Polymer Coatings • Spraymate • SPS Group • Star Maling • Stonhard • Tamms • TCI • Testor • Tor • Touch ‘n Foam • Toxement • Tremco • Triarch • Ultra-Tex • Universal Sealants • Vandex • Viapol • Watco • Westfield Coatings • XIM • Zehrung • Zinsser • AD Fire • Adhere Industrial Tapes • API • Applied Polymerics • Arnette Polymers • Ascoat • Betumat • Bomat • Boral • Canam • Carboline • Chemical Coatings, Inc. • Chemspec • Chemtec • Chemtron • Citadel • Dane Group • DAP • Day-Glo • Dryvit • Duram • Euclid Chemical • Eucomex • Expanko • Fibregrid • Finishworks • Firetherm • Flecto • Flowcrete • Grupo PV • Guardian Products • HiChem • Holton Food Products • Hummervoll • illbruck • Increte • Kop-Coat • Krud Kutter • Legend Brands • Mameco • Mantrose-Haeuser • Martin Mathys N.V. • Modern Masters • Mohawk • Multicolor Specialties • Nu-Chem • Nullifire • Okon • Paper Tiger • Parks • Permaquik • Pipeline & Drainage Systems • Plastic Wood • Prime Resins • Prochem • Productos CAVE • Prosytec • PSI Packaging • Radiant Color • Rust-Oleum • Seal-Krete • Sierra Performance Coatings • Specialty Polymer Coatings • Spraymate • SPS Group • Star Maling • Stonhard • Tamms • TCI • Testor • Tor • Touch ‘n Foam • Toxement • Tremco • Triarch • Ultra-Tex • Universal Sealants • Vandex • Viapol • Watco • Westfield Coatings • XIM • Zehrung • Zinsser • AD Fire • Adhere Industrial Tapes • API • Applied Polymerics • Arnette Polymers • Ascoat • Betumat • Bomat • Boral • Canam • Carboline • Chemical Coatings, Inc. • Chemspec • Chemtec • Chemtron • Citadel • Dane Group • DAP • Day-Glo • Dryvit • Duram • Euclid Chemical • Eucomex • Expanko • Fibregrid • Finishworks • Firetherm • Flecto • Flowcrete • Grupo PV • Guardian Products • HiChem • Holton Food Products • Hummervoll • illbruck • Increte • Kop-Coat • Krud Kutter • Legend Brands • Mameco • Mantrose-Haeuser • Martin Mathys N.V. • Modern Masters • Mohawk • Multicolor Specialties • Nu-Chem • Nullifire • Okon • Paper Tiger • Parks • Permaquik • Pipeline & Drainage Systems • Plastic Wood • Prime Resins • Prochem • Productos CAVE • Prosytec • PSI Packaging • Radiant Color • Rust-Oleum • Seal-Krete • Sierra Performance Coatings • Specialty Polymer Coatings • Spraymate • SPS Group • Star Maling • Stonhard • Tamms • TCI • Testor • Tor • Touch ‘n Foam • Toxement • Tremco • Triarch • Ultra-Tex • Universal Sealants • Vandex • Viapol • Watco • Westfield Coatings • XIM • Zehrung • Zinsser • AD Fire • Adhere Industrial Tapes • API • Applied Polymerics • Arnette Polymers • Ascoat • Betumat • Bomat • Boral • Canam • Carboline • Chemical Coatings, Inc. • Chemspec • Chemtec • Chemtron • Citadel • Dane Group • DAP • Day-Glo • Dryvit • Duram • Euclid Chemical • Eucomex • Expanko • Fibregrid • Finishworks • Firetherm • Flecto • Flowcrete • Grupo PV • Guardian Products • HiChem • Holton Food Products • Hummervoll • illbruck • Increte • Kop-Coat • Krud Kutter • Legend Brands • Mameco • Mantrose-Haeuser • Martin Mathys N.V. • Modern Masters • Mohawk • Multicolor Specialties • Nu-Chem • Nullifire • Okon • Paper Tiger • Parks • Permaquik • Pipeline & Drainage Systems • Plastic Wood • Prime Resins • Prochem • Productos CAVE • Prosytec • PSI Packaging • Radiant Color • Rust-Oleum • Seal-Krete • Sierra Performance Coatings • Specialty Polymer Coatings • Spraymate • SPS Group • Star Maling • Stonhard • Tamms • TCI • Testor • Tor • Touch ‘n Foam • Toxement • Tremco • Triarch • Ultra-Tex • Universal Sealants • Vandex • Viapol • Watco • Westfield Coatings • XIM • Zehrung • Zinsser • AD Fire • Adhere Industrial Tapes • API • Applied Polymerics • Arnette Polymers • Ascoat • Betumat • Bomat • Boral • Canam • Carboline • Chemical Coatings, Inc. • Chemspec • Chemtec • Chemtron • Citadel • Dane Group • DAP • Day-Glo • Dryvit • Duram • Euclid Chemical • Eucomex • Expanko • Fibregrid • Finishworks • Firetherm • Flecto • Flowcrete • Grupo PV • Guardian Products • HiChem • Holton Food Products • Hummervoll • illbruck • Increte • Kop-Coat • Krud Kutter • Legend Brands • Mameco • Mantrose-Haeuser • Martin Mathys N.V. • Modern Masters • Mohawk • Multicolor Specialties • Nu-Chem • Nullifire • Okon • Paper Tiger • Parks • Permaquik • Pipeline & Drainage Systems • Plastic Wood • Prime Resins • Prochem • Productos CAVE • Prosytec • PSI Packaging • Radiant Color • Rust-Oleum • Seal-Krete • Sierra Performance Coatings • Specialty Polymer Coatings • Spraymate • SPS Group • Star Maling • Stonhard • Tamms • TCI • Testor • Tor • Touch ‘n Foam • Toxement • Tremco • Triarch • Ultra-Tex • Universal Sealants • Vandex • Viapol • Watco • Westfield Coatings • XIM • Zehrung • Zinsser • AD Fire • Adhere Industrial Tapes • API • Applied Polymerics • Arnette Polymers • Ascoat • Betumat • Bomat • Boral • Canam • Carboline • Chemical Coatings, Inc. • Chemspec • Chemtec • Chemtron • Citadel • Dane Group • DAP • Day-Glo • Dryvit • Duram • Euclid Chemical • Eucomex • Expanko • Fibregrid • Finishworks • Firetherm • Flecto • Flowcrete • Grupo PV • Guardian Products • HiChem • Holton Food Products • Hummervoll • illbruck • Increte • Kop-Coat • Krud Kutter • Legend Brands • Mameco • Mantrose-Haeuser • Martin Mathys N.V. • Modern Masters • Mohawk • Multicolor Specialties • Nu-Chem • Nullifire • Okon • Paper Tiger • Parks • Permaquik • Pipeline & Drainage Systems • Plastic Wood • Prime Resins • Prochem • Productos CAVE • Prosytec • PSI Packag-ing • Radiant Color • Rust-Oleum • Seal-Krete • Sierra Performance Coatings • Specialty Polymer Coatings • Spraymate • SPS Group • Star Maling • Stonhard • Tamms • TCI • Testor • Tor • Touch ‘n Foam • Toxement • Tremco • Triarch • Ultra-Tex • Universal Sealants • Vandex • Viapol • Watco • Westfield Coatings • XIM • Zehrung • Zinsser • AD Fire • Adhere Industrial Tapes • API • Applied Polymerics • Arnette Polymers • Ascoat • Betumat • Bomat • Boral • Canam • Carboline • Chemical Coatings, Inc. • Chemspec • Chemtec • Chemtron • Citadel • Dane Group • DAP • Day-Glo • Dryvit • Duram • Euclid Chemical • Eucomex • Expanko • Fibregrid • Finishworks • Firetherm • Flecto • Flowcrete • Grupo PV • Guardian Products • HiChem • Holton Food Products • Hummervoll • illbruck • Increte • Kop-Coat • Krud Kutter • Legend Brands • Mameco • Mantrose-Haeuser • Martin Mathys N.V. • Modern Masters • Mohawk • Multicolor Specialties • Nu-Chem • Nullifire • Okon • Paper Tiger • Parks • Permaquik • Pipeline & Drainage Systems • Plastic Wood • Prime Resins • Prochem • Productos CAVE • Prosytec • PSI Packaging • Radiant Color • Rust-Oleum • Seal-Krete • Sierra Performance Coatings • Specialty Polymer Coatings • Spraymate • SPS Group • Star Maling • Stonhard • Tamms • TCI • Testor • Tor • Touch ‘n Foam • Toxement • Tremco • Triarch • Ultra-Tex • Universal Sealants • Vandex • Viapol • Watco • Westfield Coatings • XIM • Zehrung • Zinsser • AD Fire • Adhere Industrial Tapes • API • Applied Polymerics • Arnette Polymers • Ascoat • Betumat • Bomat • Boral • Canam • Carboline • Chemical Coatings, Inc. • Chemspec • Chemtec • Chemtron • Citadel • Dane Group • DAP • Day-Glo • Dryvit • Duram • Euclid Chemical • Eucomex • Expanko • Fibregrid • Finishworks • Firetherm • Flecto • Flowcrete • Grupo PV • Guardian Products • HiChem • Holton Food Products • Hummervoll • illbruck • Increte • Kop-Coat • Krud Kutter • Legend Brands • Mameco • Mantrose-Haeuser • Martin Mathys N.V. • Modern Masters • Mohawk • Multicolor Specialties • Nu-Chem • Nullifire • Okon • Paper Tiger • Parks • Permaquik • Pipeline & Drainage Systems • Plastic Wood • Prime Resins • Prochem • Productos CAVE • Prosytec • PSI Packaging • Radiant Color • Rust-Oleum • Seal-Krete • Sierra Performance Coatings • Specialty Polymer Coatings • Spraymate • SPS Group • Star Maling • Stonhard • Tamms • TCI • Testor • Tor • Touch ‘n Foam • Toxement • Tremco • Triarch • Ultra-Tex • Universal Sealants • Vandex • Viapol • Watco • Westfield Coatings • XIM • Zehrung • Zinsser • AD Fire • Adhere Industrial Tapes • API • Applied Polymerics • Arnette Polymers • Ascoat • Betumat • Bomat • Boral • Canam • Carboline • Chemical Coatings, Inc. • Chemspec • Chemtec • Chemtron • Citadel • Dane Group • DAP • Day-Glo • Dryvit • Duram • Euclid Chemical • Eucomex • Expanko • Fibregrid • Finishworks • Firetherm • Flecto • Flowcrete • Grupo PV • Guardian Products • HiChem • Holton Food Products • Hummervoll • illbruck • Increte • Kop-Coat • Krud Kutter • Legend Brands • Mameco • Mantrose-Haeuser • Martin Mathys N.V. • Modern Masters • Mohawk • Multicolor Specialties • Nu-Chem • Nullifire • Okon • Paper Tiger • Parks • Permaquik • Pipeline & Drainage Systems • Plastic Wood • Prime Resins • Prochem • Productos CAVE • Prosytec • PSI Packaging • Radiant Color • Rust-Oleum • Seal-Krete • Sierra Performance Coatings • Specialty Polymer Coatings • Spraymate • SPS Group • Star Maling • Stonhard • Tamms • TCI • Testor • Tor • Touch ‘n Foam • Toxement • Tremco • Triarch • Ul-tra-Tex • Universal Sealants • Vandex • Viapol • Watco • Westfield Coatings • XIM • Zehrung • Zinsser • AD Fire • Adhere Industrial Tapes • API • Applied Polymerics • Arnette Polymers • Ascoat • Betumat • Bomat • Boral • Canam • Carboline • Chemical Coatings, Inc. • Chemspec • Chemtec • Chemtron • Citadel • Dane Group • DAP • Day-Glo • Dryvit • Duram • Euclid Chemical • Eucomex • Expanko • Fi-bregrid • Finishworks • Firetherm • Flecto • Flowcrete • Grupo PV • Guardian Products • HiChem • Holton Food Products • Hummervoll • illbruck • Increte • Kop-Coat • Krud Kutter • Legend Brands • Mameco • Mantrose-Haeuser • Martin Mathys N.V. • Modern Masters • Mohawk • Multicolor Specialties • Nu-Chem • Nullifire • Okon • Paper Tiger • Parks • Permaquik • Pipeline & Drainage Systems • Plastic Wood • Prime Resins • Prochem • Productos CAVE • Prosytec • PSI Packaging • Radiant Color • Rust-Oleum • Seal-Krete • Sierra Performance Coatings • Specialty Polymer Coatings • Spraymate • SPS Group • Star Maling • Stonhard • Tamms • TCI • Testor • Tor • Touch ‘n Foam • Toxement • Tremco • Triarch • Ultra-Tex • Universal Sealants • Vandex • Viapol • Watco • Westfield Coatings • XIM • Zehrung • Zinsser • AD Fire • Adhere Industrial Tapes • API • Applied Polymerics • Arnette Polymers • Ascoat • Betumat • Bomat • Boral • Canam • Carboline • Chemical Coatings, Inc. • Chemspec • Chemtec • Chemtron • Citadel • Dane Group • DAP • Day-Glo • Dryvit • Duram • Euclid Chemical • Eucomex • Expanko • Fibregrid • Finishworks • Firetherm • Flecto • Flowcrete • Grupo PV • Guardian Products • HiChem • Holton Food Products • Hummervoll • illbruck • Increte • Kop-Coat • Krud Kutter • Legend Brands • Mameco • Mantrose-Haeuser • Martin Mathys N.V. • Modern Masters • Mohawk • Multicolor Specialties • Nu-Chem • Nullifire • Okon • Paper Tiger • Parks • Permaquik • Pipeline & Drainage Systems • Plastic Wood • Prime Resins • Prochem • Productos CAVE • Prosytec • PSI Packag-ing • Radiant Color • Rust-Oleum • Seal-Krete • Sierra Performance Coatings • Specialty Polymer Coatings • Spraymate • SPS Group • Star Maling • Stonhard • Tamms • TCI • Testor • Tor • Touch ‘n Foam • Toxement • Tremco • Triarch • Ultra-Tex • Universal Sealants • Vandex • Viapol • Watco • Westfield Coatings • XIM • Zehrung • Zinsser • AD Fire • Adhere Industrial Tapes • API • Applied Polymerics • Arnette Polymers • Ascoat • Betumat • Bomat • Boral • Canam • Carboline • Chemical Coatings, Inc. • Chemspec • Chemtec • Chemtron • Citadel • Dane Group • DAP • Day-Glo • Dryvit • Duram • Euclid Chemical • Eucomex • Expanko • Fibregrid • Finishworks • Firetherm • Flecto • Flowcrete • Grupo PV • Guardian Products • HiChem • Holton Food Products • Hummervoll • illbruck • Increte • Kop-Coat • Krud Kutter • Legend Brands • Mameco • Mantrose-Haeuser • Martin Mathys N.V. • Modern Masters • Mohawk • Multicolor Specialties • Nu-Chem • Nullifire • Okon • Paper Tiger • Parks • Permaquik • Pipeline & Drainage Systems • Plastic Wood • Prime Resins • Prochem • Productos CAVE • Prosytec • PSI Packaging • Radiant Color • Rust-Oleum • Seal-Krete • Sierra Performance Coatings • Specialty Polymer Coatings • Spraymate • SPS Group • Star Maling • Stonhard • Tamms • TCI • Testor • Tor • Touch ‘n Foam • Toxement • Tremco • Triarch • Ultra-Tex • Universal Sealants • Vandex • Viapol • Watco • Westfield Coatings • XIM • Zehrung • Zinsser • AD Fire • Adhere Industrial Tapes • API • Applied Polymerics • Arnette Polymers • Ascoat • Betumat • Bomat • Boral • Canam • Carboline • Chemical Coatings, Inc. • Chemspec • Chemtec • Chemtron • Citadel • Dane Group • DAP • Day-Glo • Dryvit • Duram • Euclid Chemical • Eucomex • Expanko • Fibregrid • Finishworks • Firetherm • Flecto • Flowcrete • Grupo PV • Guardian Products • HiChem • Holton Food Products • Hummervoll • illbruck • Increte • Kop-Coat • Krud Kutter • Legend Brands • Mameco • Mantrose-Haeuser • Martin Mathys N.V. • Modern Masters • Mohawk • Multicolor Specialties • Nu-Chem • Nullifire • Okon • Paper Tiger • Parks • Permaquik • Pipeline & Drainage Systems • Plastic Wood • Prime Resins • Prochem • Productos CAVE • Prosytec • PSI Packaging • Radiant Color • Rust-Oleum • Seal-Krete • Sierra Performance Coatings • Specialty Polymer Coatings • Spraymate • SPS Group • Star Maling • Stonhard • Tamms • TCI • Testor • Tor • Touch ‘n Foam • Toxement • Tremco • Triarch • Ultra-Tex • Universal Sealants • Vandex • Viapol • Watco • Westfield Coatings • XIM • Zehrung • Zinsser • AD Fire • Adhere Industrial Tapes • API • Applied Polymerics • Arnette Polymers • Ascoat • Betumat • Bomat • Boral • Canam • Carboline • Chemical Coatings, Inc. • Chemspec • Chemtec • Chemtron • Citadel • Dane Group • DAP • Day-Glo • Dryvit • Duram • Euclid Chemical • Eucomex • Expanko • Fibregrid • Finishworks • Firetherm • Flecto • Flowcrete • Grupo PV • Guardian Products • HiChem • Holton Food Products • Hummervoll • illbruck • Increte • Kop-Coat • Krud Kutter • Legend Brands • Mameco • Mantrose-Haeuser • Martin Mathys N.V. • Modern Masters • Mohawk • Multicolor Specialties • Nu-Chem • Nullifire • Okon • Paper Tiger • Parks • Permaquik • Pipeline & Drainage Systems • Plastic Wood • Prime Resins • Prochem • Productos CAVE • Prosytec • PSI Packaging • Radiant Color • Rust-Oleum • Seal-Krete • Sierra Performance Coatings • Specialty Polymer Coatings • Spraymate • SPS Group • Star Maling • Stonhard • Tamms • TCI • Testor • Tor • Touch ‘n Foam • Toxement • Tremco • Triarch • Ul-tra-Tex • Universal Sealants • Vandex • Viapol • Watco • Westfield Coatings • XIM • Zehrung • Zinsser • AD Fire • Adhere Industrial Tapes • API • Applied Polymerics • Arnette Polymers • Ascoat • Betumat • Bomat • Boral • Canam • Carboline • Chemical Coatings, Inc. • Chemspec • Chemtec • Chemtron • Citadel • Dane Group • DAP • Day-Glo • Dryvit • Duram • Euclid Chemical • Eucomex • Expanko • Fi-bregrid • Finishworks • Firetherm • Flecto • Flowcrete • Grupo PV • Guardian Products • HiChem • Holton Food Products • Hummervoll • illbruck • Increte • Kop-Coat • Krud Kutter • Legend Brands • Mameco • Mantrose-Haeuser • Martin Mathys N.V. • Modern Masters • Mohawk • Multicolor Specialties • Nu-Chem • Nullifire • Okon • Paper Tiger • Parks • Permaquik • Pipeline & Drainage Systems • Plastic Wood • Prime Resins • Prochem • Productos CAVE • Prosytec • PSI Packaging • Radiant Color • Rust-Oleum • Seal-Krete • Sierra Performance Coatings • Specialty Polymer Coatings • Spraymate • SPS Group • Star Maling • Stonhard • Tamms • TCI • Testor • Tor • Touch ‘n Foam • Toxement • Tremco • Triarch • Ultra-Tex • Universal Sealants • Vandex • Viapol • Watco • Westfield Coatings • XIM • Zehrung • Zinsser • AD Fire • Adhere Industrial Tapes • API • Applied Polymerics • Arnette Polymers • Ascoat • Betumat • Bomat • Boral • Canam • Carboline • Chemical Coatings, Inc. • Chemspec • Chemtec • Chemtron • Citadel • Dane Group • DAP • Day-Glo • Dryvit • Duram • Euclid Chemical • Eucomex • Expanko • Fibregrid • Finishworks • Firetherm • Flecto • Flowcrete • Grupo PV • Guardian Products • HiChem • Holton Food Products • Hummervoll • illbruck • Increte • Kop-Coat • Krud Kutter • Legend Brands • Mameco • Mantrose-Haeuser • Martin Mathys N.V. • Modern Masters • Mohawk • Multicolor Specialties • Nu-Chem • Nullifire • Okon • Paper Tiger • Parks • Permaquik • Pipeline & Drainage Systems • Plastic Wood • Prime Resins • Prochem • Productos CAVE • Prosytec • PSI Packag-ing • Radiant Color • Rust-Oleum • Seal-Krete • Sierra Performance Coatings • Specialty Polymer Coatings • Spraymate • SPS Group • Star Maling • Stonhard • Tamms • TCI • Testor • Tor • Touch ‘n Foam • Toxement • Tremco • Triarch • Ultra-Tex • Universal Sealants • Vandex • Viapol • Watco • Westfield Coatings • XIM • Zehrung • Zinsser • AD Fire • Adhere Industrial Tapes • API • Applied Polymerics • Arnette Polymers • Ascoat • Betumat • Bomat • Boral • Canam • Carboline • Chemical Coatings, Inc. • Chemspec • Chemtec • Chemtron • Citadel • Dane Group • DAP • Day-Glo • Dryvit • Duram • Euclid Chemical • Eucomex • Expanko • Fibregrid • Finishworks • Firetherm • Flecto • Flowcrete • Grupo PV • Guardian Products • HiChem • Holton Food Products • Hummervoll • illbruck • Increte • Kop-Coat • Krud Kutter • Legend Brands • Mameco • Mantrose-Haeuser • Martin Mathys N.V. • Modern Masters • Mohawk • Multicolor Specialties • Nu-Chem • Nullifire • Okon • Paper Tiger • Parks • Permaquik • Pipeline & Drainage Systems • Plastic Wood • Prime Resins • Prochem • Productos CAVE • Prosytec • PSI Packaging • Radiant Color • Rust-Oleum • Seal-Krete • Sierra Performance Coatings • Specialty Polymer Coatings • Spraymate • SPS Group • Star Maling • Stonhard • Tamms • TCI • Testor • Tor • Touch ‘n Foam • Toxement • Tremco • Triarch • Ultra-Tex • Universal Sealants • Vandex • Viapol • Watco • Westfield Coatings • XIM • Zehrung • Zinsser • AD Fire • Adhere Industrial Tapes • API • Applied Polymerics • Arnette Polymers • Ascoat • Betumat • Bomat • Boral • Canam • Carboline • Chemical Coatings, Inc. • Chemspec • Chemtec • Chemtron • Citadel • Dane Group • DAP • Day-Glo • Dryvit • Duram • Euclid Chemical • Eucomex • Expanko • Fibregrid • Finishworks • Firetherm • Flecto • Flowcrete • Grupo PV • Guardian Products • HiChem • Holton Food Products • Hummervoll • illbruck • Increte • Kop-Coat • Krud Kutter • Legend Brands • Mameco • Mantrose-Haeuser • Martin Mathys N.V. • Modern Masters • Mohawk • Multicolor Specialties • Nu-Chem • Nullifire • Okon • Paper Tiger • Parks • Permaquik • Pipeline & Drainage Systems • Plastic Wood • Prime Resins • Prochem • Productos CAVE • Prosytec • PSI Packaging • Radiant Color • Rust-Oleum • Seal-Krete • Sierra Performance Coatings • Specialty Polymer Coatings • Spraymate • SPS Group • Star Maling • Stonhard • Tamms • TCI • Testor • Tor • Touch ‘n Foam • Toxement • Tremco • Triarch • Ultra-Tex • Universal Sealants • Vandex • Viapol • Watco • Westfield Coatings • XIM • Zehrung • Zinsser • AD Fire • Adhere Industrial Tapes • API • Applied Polymerics • Arnette Polymers • Ascoat • Betumat • Bomat • Boral • Canam • Carboline • Chemical Coatings, Inc. • Chemspec • Chemtec • Chemtron • Citadel • Dane Group • DAP • Day-Glo • Dryvit • Duram • Euclid Chemical • Eucomex • Expanko • Fibregrid • Finishworks • Firetherm • Flecto • Flowcrete • Grupo PV • Guardian Products • HiChem • Holton Food Products • Hummervoll • illbruck • Increte • Kop-Coat • Krud Kutter • Legend Brands • Mameco • Mantrose-Haeuser • Martin Mathys N.V. • Modern Masters • Mohawk • Multicolor Specialties • Nu-Chem • Nullifire • Okon • Paper Tiger • Parks • Permaquik • Pipeline & Drainage Systems • Plastic Wood • Prime Resins • Prochem • Productos CAVE • Prosytec • PSI Packaging • Radiant Color • Rust-Oleum • Seal-Krete • Sierra Performance Coatings • Specialty Polymer Coatings • Spraymate • SPS Group • Star Maling • Stonhard • Tamms • TCI • Testor • Tor • Touch ‘n Foam • Toxement • Tremco • Triarch • Ul-tra-Tex • Universal Sealants • Vandex • Viapol • Watco • Westfield Coatings • XIM • Zehrung • Zinsser • AD Fire • Adhere Industrial Tapes • API • Applied Polymerics • Arnette Polymers • Ascoat • Betumat • Bomat • Boral • Canam • Carboline • Chemical Coatings, Inc. • Chemspec • Chemtec • Chemtron • Citadel • Dane Group • DAP • Day-Glo • Dryvit • Duram • Euclid Chemical • Eucomex • Expanko • Fi-bregrid • Finishworks • Firetherm • Flecto • Flowcrete • Grupo PV • Guardian Products • HiChem • Holton Food Products • Hummervoll • illbruck • Increte • Kop-Coat • Krud Kutter • Legend Brands • Mameco • Mantrose-Haeuser • Martin Mathys N.V. • Modern Masters • Mohawk • Multicolor Specialties • Nu-Chem • Nullifire • Okon • Paper Tiger • Parks • Permaquik • Pipeline & Drainage Systems • Plastic Wood • Prime Resins • Prochem • Productos CAVE • Prosytec • PSI Packaging • Radiant Color • Rust-Oleum • Seal-Krete • Sierra Performance Coatings • Specialty Polymer Coatings • Spraymate • SPS Group • Star Maling • Stonhard • Tamms • TCI • Testor • Tor • Touch ‘n Foam • Toxement • Tremco • Triarch • Ultra-Tex • Universal Sealants • Vandex • Viapol • Watco • Westfield Coatings • XIM • Zehrung • Zinsser • AD Fire • Adhere Industrial Tapes • API • Applied Polymerics • Arnette Polymers • Ascoat • Betumat • Bomat • Boral • Canam • Carboline • Chemical Coatings, Inc. • Chemspec • Chemtec • Chemtron • Citadel • Dane Group • DAP • Day-Glo • Dryvit • Duram • Euclid Chemical • Eucomex • Expanko • Fibregrid • Finishworks • Firetherm • Flecto • Flowcrete • Grupo PV • Guardian Products • HiChem • Holton Food Products • Hummervoll • illbruck • Increte • Kop-Coat • Krud Kutter • Legend Brands • Mameco • Mantrose-Haeuser • Martin Mathys N.V. • Modern Masters • Mohawk • Multicolor Specialties • Nu-Chem • Nullifire • Okon • Paper Tiger • Parks • Permaquik • Pipeline & Drainage Systems • Plastic Wood • Prime Resins • Prochem • Productos CAVE • Prosytec • PSI Packag-ing • Radiant Color • Rust-Oleum • Seal-Krete • Sierra Performance Coatings • Specialty Polymer Coatings • Spraymate • SPS Group • Star Maling • Stonhard • Tamms • TCI • Testor • Tor • Touch ‘n Foam • Toxement • Tremco • Triarch • Ultra-Tex • Universal Sealants • Vandex • Viapol • Watco • Westfield Coatings • XIM • Zehrung • Zinsser • AD Fire • Adhere Industrial Tapes • API • Applied Polymerics • Arnette Polymers • Ascoat • Betumat • Bomat • Boral • Canam • Carboline • Chemical Coatings, Inc. • Chemspec • Chemtec • Chemtron • Citadel • Dane Group • DAP • Day-Glo • Dryvit • Duram • Euclid Chemical • Eucomex • Expanko • Fibregrid • Finishworks • Firetherm • Flecto • Flowcrete • Grupo PV • Guardian Products • HiChem • Holton Food Products • Hummervoll • illbruck • Increte • Kop-Coat • Krud Kutter • Legend Brands • Mameco • Mantrose-Haeuser • Martin Mathys N.V. • Modern Masters • Mohawk • Multicolor Specialties • Nu-Chem • Nullifire • Okon • Paper Tiger • Parks • Permaquik • Pipeline & Drainage Systems • Plastic Wood • Prime Resins • Prochem • Productos CAVE • Prosytec • PSI Packaging • Radiant Color • Rust-Oleum • Seal-Krete • Sierra Performance Coatings • Specialty Polymer Coatings • Spraymate • SPS Group • Star Maling • Stonhard • Tamms • TCI • Testor • Tor • Touch ‘n Foam • Toxement • Tremco • Triarch • Ultra-Tex • Universal Sealants • Vandex • Viapol • Watco • Westfield Coatings • XIM • Zehrung • Zinsser • AD Fire • Adhere Industrial Tapes • API • Applied Polymerics • Arnette Polymers • Ascoat • Betumat • Bomat • Boral • Canam • Carboline • Chemical Coatings, Inc. • Chemspec • Chemtec • Chemtron • Citadel • Dane Group • DAP • Day-Glo • Dryvit • Duram • Euclid Chemical • Eucomex • Expanko • Fibregrid • Finishworks • Firetherm • Flecto • Flowcrete • Grupo PV • Guardian Products • HiChem • Holton Food Products • Hummervoll • illbruck • Increte • Kop-Coat • Krud Kutter • Legend Brands • Mameco • Mantrose-Haeuser • Martin Mathys N.V. • Modern Masters • Mohawk • Multicolor Specialties • Nu-Chem • Nullifire • Okon • Paper Tiger • Parks • Permaquik • Pipeline & Drainage Systems • Plastic Wood • Prime Resins • Prochem • Productos CAVE • Prosytec • PSI Packaging • Radiant Color • Rust-Oleum • Seal-Krete • Sierra Performance Coatings • Specialty Polymer Coatings • Spraymate • SPS Group • Star Maling • Stonhard • Tamms • TCI • Testor • Tor • Touch ‘n Foam • Toxement • Tremco • Triarch • Ultra-Tex • Universal Sealants • Vandex • Viapol • Watco • Westfield Coatings • XIM • Zehrung • Zinsser • AD Fire • Adhere Industrial Tapes • API • Applied Polymerics • Arnette Polymers • Ascoat • Betumat • Bomat • Boral • Canam • Carboline • Chemical Coatings, Inc. • Chemspec • Chemtec • Chemtron • Citadel • Dane Group • DAP • Day-Glo • Dryvit • Duram • Euclid Chemical • Eucomex • Expanko • Fibregrid • Finishworks • Firetherm • Flecto • Flowcrete • Grupo PV • Guardian Products • HiChem • Holton Food Products • Hummervoll • illbruck • Increte • Kop-Coat • Krud Kutter • Legend Brands • Mameco • Mantrose-Haeuser • Martin Mathys N.V. • Modern Masters • Mohawk • Multicolor Specialties • Nu-Chem • Nullifire • Okon • Paper Tiger • Parks • Permaquik • Pipeline & Drainage Systems • Plastic Wood • Prime Resins • Prochem • Productos CAVE • Prosytec • PSI Packaging • Radiant Color • Rust-Oleum • Seal-Krete • Sierra Performance Coatings • Specialty Polymer Coatings • Spraymate • SPS Group • Star Maling • Stonhard • Tamms • TCI • Testor • Tor • Touch ‘n Foam • Toxement • Tremco • Triarch • Ul-tra-Tex • Universal Sealants • Vandex • Viapol • Watco • Westfield Coatings • XIM • Zehrung • Zinsser • AD Fire • Adhere Industrial Tapes • API • Applied Polymerics • Arnette Polymers • Ascoat • Betumat • Bomat • Boral • Canam • Carboline • Chemical Coatings, Inc. • Chemspec • Chemtec • Chemtron • Citadel • Dane Group • DAP • Day-Glo • Dryvit • Duram • Euclid Chemical • Eucomex • Expanko • Fi-bregrid • Finishworks • Firetherm • Flecto • Flowcrete • Grupo PV • Guardian Products • HiChem • Holton Food Products • Hummervoll • illbruck • Increte • Kop-Coat • Krud Kutter • Legend Brands • Mameco • Mantrose-Haeuser • Martin Mathys N.V. • Modern Masters • Mohawk • Multicolor Specialties • Nu-Chem • Nullifire • Okon • Paper Tiger • Parks • Permaquik • Pipeline & Drainage Systems • Plastic Wood • Prime Resins • Prochem • Productos CAVE • Prosytec • PSI Packaging • Radiant Color • Rust-Oleum • Seal-Krete • Sierra Performance Coatings • Specialty Polymer Coatings • Spraymate • SPS Group • Star Maling • Stonhard • Tamms • TCI • Testor • Tor • Touch ‘n Foam • Toxement • Tremco • Triarch • Ultra-Tex • Universal Sealants • Vandex • Viapol • Watco • Westfield Coatings • XIM • Zehrung • Zinsser • AD Fire • Adhere Industrial Tapes • API • Applied Polymerics • Arnette Polymers • Ascoat • Betumat • Bomat • Boral • Canam • Carboline • Chemical Coatings, Inc. • Chemspec • Chemtec • Chemtron • Citadel • Dane Group • DAP • Day-Glo • Dryvit • Duram • Euclid Chemical • Eucomex • Expanko • Fibregrid • Finishworks • Firetherm • Flecto • Flowcrete • Grupo PV • Guardian Products • HiChem • Holton Food Products • Hummervoll • illbruck • Increte • Kop-Coat • Krud Kutter • Legend Brands • Mameco • Mantrose-Haeuser • Martin Mathys N.V. • Modern Masters • Mohawk • Multicolor Specialties • Nu-Chem • Nullifire • Okon • Paper Tiger • Parks • Permaquik • Pipeline & Drainage Systems • Plastic Wood • Prime Resins • Prochem • Productos CAVE • Prosytec • PSI Packag-ing • Radiant Color • Rust-Oleum • Seal-Krete • Sierra Performance Coatings • Specialty Polymer Coatings • Spraymate • SPS Group • Star Maling • Stonhard • Tamms • TCI • Testor • Tor • Touch ‘n Foam • Toxement • Tremco • Triarch • Ultra-Tex • Universal Sealants • Vandex • Viapol • Watco • Westfield Coatings • XIM • Zehrung • Zinsser • AD Fire • Adhere Industrial Tapes • API • Applied Polymerics • Arnette Polymers • Ascoat • Betumat • Bomat • Boral • Canam • Carboline • Chemical Coatings, Inc. • Chemspec • Chemtec • Chemtron • Citadel • Dane Group • DAP • Day-Glo • Dryvit • Duram • Euclid Chemical • Eucomex • Expanko • Fibregrid • Finishworks • Firetherm • Flecto • Flowcrete • Grupo PV • Guardian Products • HiChem • Holton Food Products • Hummervoll • illbruck • Increte • Kop-Coat • Krud Kutter • Legend Brands • Mameco • Mantrose-Haeuser • Martin Mathys N.V. • Modern Masters • Mohawk • Multicolor Specialties • Nu-Chem • Nullifire • Okon • Paper Tiger • Parks • Permaquik • Pipeline & Drainage Systems • Plastic Wood • Prime Resins • Prochem • Productos CAVE • Prosytec • PSI Packaging • Radiant Color • Rust-Oleum • Seal-Krete • Sierra Performance Coatings • Specialty Polymer Coatings • Spraymate • SPS Group • Star Maling • Stonhard • Tamms • TCI • Testor • Tor • Touch ‘n Foam • Toxement • Tremco • Triarch • Ultra-Tex • Universal Sealants • Vandex • Viapol • Watco • Westfield Coatings • XIM • Zehrung • Zinsser • AD Fire • Adhere Industrial Tapes • API • Applied Polymerics • Arnette Polymers • Ascoat • Betumat • Bomat • Boral • Canam • Carboline • Chemical Coatings, Inc. • Chemspec • Chemtec • Chemtron • Citadel • Dane Group • DAP • Day-Glo • Dryvit • Duram • Euclid Chemical • Eucomex • Expanko • Fibregrid • Finishworks • Firetherm • Flecto • Flowcrete • Grupo PV • Guardian Products • HiChem • Holton Food Products • Hummervoll • illbruck • Increte • Kop-Coat • Krud Kutter • Legend Brands • Mameco • Mantrose-Haeuser • Martin Mathys N.V. • Modern Masters • Mohawk • Multicolor Specialties • Nu-Chem • Nullifire • Okon • Paper Tiger • Parks • Permaquik • Pipeline & Drainage Systems • Plastic Wood • Prime Resins • Prochem • Productos CAVE • Prosytec • PSI Packaging • Radiant Color • Rust-Oleum • Seal-Krete • Sierra Performance Coatings • Specialty Polymer Coatings • Spraymate • SPS Group • Star Maling • Stonhard • Tamms • TCI • Testor • Tor • Touch ‘n Foam • Toxement • Tremco • Triarch • Ultra-Tex • Universal Sealants • Vandex • Viapol • Watco • Westfield Coatings • XIM • Zehrung • Zinsser • AD Fire • Adhere Industrial Tapes • API • Applied Polymerics • Arnette Polymers • Ascoat • Betumat • Bomat • Boral • Canam • Carboline • Chemical Coatings, Inc. • Chemspec • Chemtec • Chemtron • Citadel • Dane Group • DAP • Day-Glo • Dryvit • Duram • Euclid Chemical • Eucomex • Expanko • Fibregrid • Finishworks • Firetherm • Flecto • Flowcrete • Grupo PV • Guardian Products • HiChem • Holton Food Products • Hummervoll • illbruck • Increte • Kop-Coat • Krud Kutter • Legend Brands • Mameco • Mantrose-Haeuser • Martin Mathys N.V. • Modern Masters • Mohawk • Multicolor Specialties • Nu-Chem • Nullifire • Okon • Paper Tiger • Parks • Permaquik • Pipeline & Drainage Systems • Plastic Wood • Prime Resins • Prochem • Productos CAVE • Prosytec • PSI Packaging • Radiant Color • Rust-Oleum • Seal-Krete • Sierra Performance Coatings • Specialty Polymer Coatings • Spraymate • SPS Group • Star Maling • Stonhard • Tamms • TCI • Testor • Tor • Touch ‘n Foam • Toxement • Tremco • Triarch • Ul-tra-Tex • Universal Sealants • Vandex • Viapol • Watco • Westfield Coatings • XIM • Zehrung • Zinsser • AD Fire • Adhere Industrial Tapes • API • Applied Polymerics • Arnette Polymers • Ascoat • Betumat • Bomat • Boral • Canam • Carboline • Chemical Coatings, Inc. • Chemspec • Chemtec • Chemtron • Citadel • Dane Group • DAP • Day-Glo • Dryvit • Duram • Euclid Chemical • Eucomex • Expanko • Fi-bregrid • Finishworks • Firetherm • Flecto • Flowcrete • Grupo PV • Guardian Products • HiChem • Holton Food Products • Hummervoll • illbruck • Increte • Kop-Coat • Krud Kutter • Legend Brands • Mameco • Mantrose-Haeuser • Martin Mathys N.V. • Modern Masters • Mohawk • Multicolor Specialties • Nu-Chem • Nullifire • Okon • Paper Tiger • Parks • Permaquik • Pipeline & Drainage Systems • Plastic Wood • Prime Resins • Prochem • Productos CAVE • Prosytec • PSI Packaging • Radiant Color • Rust-Oleum • Seal-Krete • Sierra Performance Coatings • Specialty Polymer Coatings • Spraymate • SPS Group • Star Maling • Stonhard • Tamms • TCI • Testor • Tor • Touch ‘n Foam • Toxement • Tremco • Triarch • Ultra-Tex • Universal Sealants • Vandex • Viapol • Watco • Westfield Coatings •
“As I continued to learn more about RPM and the culture of ‘The Value of 168,’
instilled by your grandfather, it seemed to me that our company might be a good fit
as an RPM subsidiary.”
~ Dave Barton President and Owner, Prime Resins
H MEBest
for
The
EntrepreneurialCompanies
To the Associates, Customers and Shareholders of RPM
About a year ago, I received a letter from a gentleman named David Barton, the president and owner of Prime Resins. He explained that his company was a manufacturer of specialty chemicals used to maintain and repair infrastructure. Dave had been researching RPM and wrote, “As I continued to learn more about RPM and the culture of ‘The Value of 168,’ instilled by your grandfather, it seemed to me that our company might be a good fit as an RPM subsidiary.” Financial information, an analysis of the company’s performance versus its competitors, a map of where it conducted business around the world and some product literature were enclosed with his letter.
I had never met Dave and was not familiar with Prime Resins. Yet here he was, sharing all this confidential information with me. Periodically, I get unsolicited letters like the one Dave sent me. I suspect few CEOs in our industry, or any other industry for that matter, receive such overtures. These letters are born from RPM’s incredible reputation in the specialty coatings industry as being the best home for entrepreneurial companies. It’s a reputation my father, Tom, spent decades building by being open, honest and trustworthy in his dealings with entrepreneurial business owners like Dave. It’s something I strive to maintain because it is an incredible competitive advantage that enables us to attract the best businesses and people in the industry.
1

So, I picked up the phone and called Dave. I learned that he was in his early 70s and, typical of an entrepreneur fueled by passion for his business, was just starting to consider slowing down. Two weeks later, I visited him outside of Atlanta and we had a good conversation. I genuinely liked what I saw from Dave, his people and the company. I got some of our operating people involved and said to them, “If it’s a good fit and we can negotiate a full, fair price, we’ll do it, and if it’s not a good fit, let’s be straightforward with him.” A team then evaluated the business and how it would mesh with our Performance Coatings Group. It found that Prime Resins’ products could fill a gap within RPM’s product portfolio. At the same time, we felt we could accelerate Prime Resins’ growth through shared technologies and connections with other RPM operating companies. Six months later, we closed the deal.
This story inspired the theme for this year’s annual report. I share it because, while we’ve just concluded a sub-par fiscal year by RPM’s standards (after seven straight years of strong sales and earnings growth), it’s indicative that being the best home for entrepreneurial companies is a strategy that continues to work over the long term. In fact, counting Prime Resins, we acquired a total of nine businesses this fiscal year. They are comprised of passionate entrepreneurs, like Dave, who will continue running their businesses as part of RPM. We are providing them with resources to develop new products and services, and connecting them to like-minded entrepreneurs within the RPM family of companies worldwide so they can share technologies, manufacturing facilities and distribution channels. You will find success stories that have resulted from the implementation of this strategy on the pages following this letter.
Full-Year Results For our fiscal year that ended May 31, 2017, consolidated net sales increased 3.0 percent to $4.96 billion from $4.81 billion in fiscal 2016. Net income declined 48.7 percent to $181.8 million from $354.7 million reported in fiscal 2016. Diluted earnings per share of $1.36 were down 48.3 percent from $2.63 a year ago. Income before income taxes (IBT) was down 49.5 percent to $244.3 million from $483.5 million in fiscal 2016. Consolidated earnings before interest and taxes (EBIT) was down 42.0 percent to $327.3 million from $564.8 million last year.
A number of factors weighed on our results this fiscal year. As a result, we implemented a plan of $27.3 million in expense reduction and restructuring actions across our businesses.
Among them was the closure of underperforming businesses in the Middle East and Europe. We expect that these cost reduction measures will be one element in our return to solid top- and bottom-line growth in fiscal 2018.
Additionally, we took a goodwill impairment charge of $188.3 million as a result of underperformance at our Kirker nail enamel business. After completing more than 170 successful acquisitions over the past 30 years, Kirker was a rare miss for us. We bought the company at the peak of its cycle and poor management decisions led to market share losses in a declining market. A new senior management team has been put in place, which stabilized the business and established a base from which it can resume growth.
Excluding these items, as well as last fiscal year’s Kirker earnout reversal of $14.5 million, adjusted net income for the year declined 3.5 percent to $333.4 million from $345.5 million in fiscal 2016 and adjusted EPS declined 3.9 percent to $2.47 from $2.57 last fiscal year. Adjusted EBIT declined 1.3 percent in fiscal 2017 to $542.9 million from $550.3 million a year ago.
Fiscal 2017 Results by SegmentDuring fiscal 2017, sales in our industrial segment improved 2.9 percent to $2.56 billion from $2.49 billion in fiscal 2016. The improvement in industrial sales was driven predominately by fiscal 2017 acquisitions, which contributed 2.9 percent, along with organic growth of 2.0 percent. Foreign currency translation offset sales growth by 2.0 percent. The industrial segment’s IBT declined 5.4 percent to $243.3 million from $257.2 million in fiscal 2016. EBIT in the segment dropped 4.5 percent to $251.3 million from $263.3 million in fiscal 2016. Excluding the $12.3 million charge to shut down the Flowcrete facility in the Middle East during the second quarter and a severance charge in the fourth quarter of $7.7 million, industrial EBIT increased 3.1 percent to $271.3 million from a year ago.
Specialty segment sales increased 4.2 percent in fiscal 2017 to $713.6 million from $684.6 million the prior year. Organic sales improved by a solid 2.8 percent and recent acquisitions added 3.1 percent to growth. Foreign currency translation
RPM HAS COMPLETED
70+170+
Acquisitions OVER THE PAST DECADE
Acquisitions OVER THE PAST 30 YEARS
Being the best home for entrepreneurial companies is a strategy that continues to work over the long term. In fact, counting Prime Resins, we
acquired a total of nine businesses this fiscal year.
2

COMPLETED IN FISCAL 2017
Adhere Industrial Tapes Ltd.In November 2016, tremco illbruck acquired Adhere Industrial Tapes, a UK-based manufacturer of foam tapes for use in construction and industrial applications with annual net sales of $6 million.
Applied Polymerics, Inc. & Marketing Associates, Inc. (API/MAI)RPM acquired API/MAI in July 2016 as part of its USL business. API/MAI, a North Carolina-based manufacturer, supplier and installer of specialist construction products for use in major structures, has annual net sales of $14 million. It will enable USL to introduce its products in the U.S.
Arnette Polymers, LLCRPM, in January 2017, acquired 80 percent of Arnette Polymers as part of its RPM Performance Coatings Group. Located in Richmond, Missouri, Arnette Polymers is a manufacturer and supplier of specialty chemical raw materials with annual net sales of $20 million.
Duram Industries Pty LimitedIn July 2016, Tremco Group acquired the assets of Duram Industries, an Australian manufacturer of commercial waterproofing products with annual net sales of $6 million.
Prime ResinsRPM acquired Prime Resins in January 2017 as part of its USL business. Prime Resins, a Georgia-based manufacturer of specialty chemicals and equipment for use in infrastructure construction and repair, has annual net sales of $7 million.
ProchemLegend Brands, in January 2017, acquired Prochem. Located in Chandler, Arizona, Prochem is a manufacturer of commercial carpet and floor cleaning equipment and chemicals with annual net sales of $22 million.
Specialty Polymer Coatings, Inc. (SPC)In September 2016, RPM acquired SPC as part of its RPM Performance Coatings Group. SPC is a Canadian manufacturer of high-performance coatings for the global oil and gas pipeline market with annual net sales of $26 million.
SPS GroupRPM acquired SPS Group in February 2017 as part of its Rust-Oleum European business. SPS Group, a Netherlands-based manufacturer of decorative and specialty coatings for maintenance and renovation applications, has annual net sales of $60 million.
Touch ’n FoamRPM, in January 2017, acquired the foam division of Missouri-based Clayton Corporation as part of its DAP group. Best known for its consumer spray-polyurethane foam brand Touch ’n Foam and its industrial brand Touch ’n Seal, the foam division has annual net sales of $60 million.
9Acquisitions
3

50
100
150
200
250
300
350
100
150
200
250
1714 15 1612 13
RPM
S&P 500
Prior Peer GroupCurrent Peer Group
$
RPM
S&P 500
Prior Peer GroupCurrent Peer Group
$
15 16 1712 13 1409 10 1107 08
50
100
150
200
250
300
350
100
150
200
250
1714 15 1612 13
RPM
S&P 500
Prior Peer GroupCurrent Peer Group
$
RPM
S&P 500
Prior Peer GroupCurrent Peer Group
$
15 16 1712 13 1409 10 1107 08
These graphs compare the cumulative five- and ten-year total return provided shareholders on RPM International Inc.’s common stock
relative to the cumulative total returns of the S&P 500 Index and two customized peer groups whose individual companies are listed in footnotes 1 and 2 below. An investment
of $100 (with reinvestment of all dividends) is assumed to have been made in RPM common stock, in each of the peer groups, and the index on 5/31/2012 and 5/31/2007, and their
relative performance is tracked through 5/31/2017.
(1) The prior peer group includes: Akzo Nobel N.V., Ferro Corporation, GCP Applied Technologies Inc., H.B. Fuller Company, Masco Corporation, PPG Industries, Inc. and The Sherwin-Williams Company.
(2) The current peer group includes: Akzo Nobel N.V., Axalta Coating Systems Ltd, Ferro Corporation, GCP Applied Technologies Inc., H.B. Fuller Company, Masco Corporation, PPG Industries, Inc. and The Sherwin-Williams Company.
RPM outpaced
the S&P 500 by
over the past ten years
70%
Among RPM International Inc., the S&P 500 Index and Two Peer Groups
Cumulative Total ReturnComparison of
reduced sales by 1.7 percent. Specialty segment IBT was up 0.3 percent to $107.9 million from $107.5 million a year ago. EBIT increased 0.6 percent to $107.4 million from $106.7 million in fiscal 2016. Excluding a severance charge in the fourth quarter of $2.9 million, specialty EBIT increased 3.3 percent to $110.3 million from fiscal 2016.
Sales in our consumer segment for fiscal 2017 increased 2.6 percent to $1.68 billion from $1.64 billion in fiscal 2016. Organic sales increased by 0.6 percent and acquisition growth added 3.4 percent. Currency translation negatively impacted sales by 1.4 percent. Weighing on consumer sales was continued underperformance at our Kirker nail enamel business, as well as higher rainfall and cooler temperatures during the fourth quarter, which slowed home maintenance
and repair activities. Consumer IBT declined 78.1 percent to $58.7 million from $268.2 million in fiscal 2016. Consumer segment EBIT decreased 78.0 percent, to $59.0 million from $268.2 million a year ago. Excluding the Kirker goodwill impairment charge in the second quarter and a severance charge of $4.3 million in the fourth quarter, as well as the Kirker earnout reversal last year, consumer EBIT decreased 0.8 percent to $251.6 million from $253.7 million a year ago.
Financial Position Remains StrongWe maintain a strong financial position, allowing continuation of our robust acquisition program and capital spending for plant improvements. During the fourth quarter, we prepaid the December 2017 524(g) trust obligation in the amount of $120.0 million, as well as the fiscal 2018 U.S. Pension Plan contribution in the amount of $52.8 million.
4
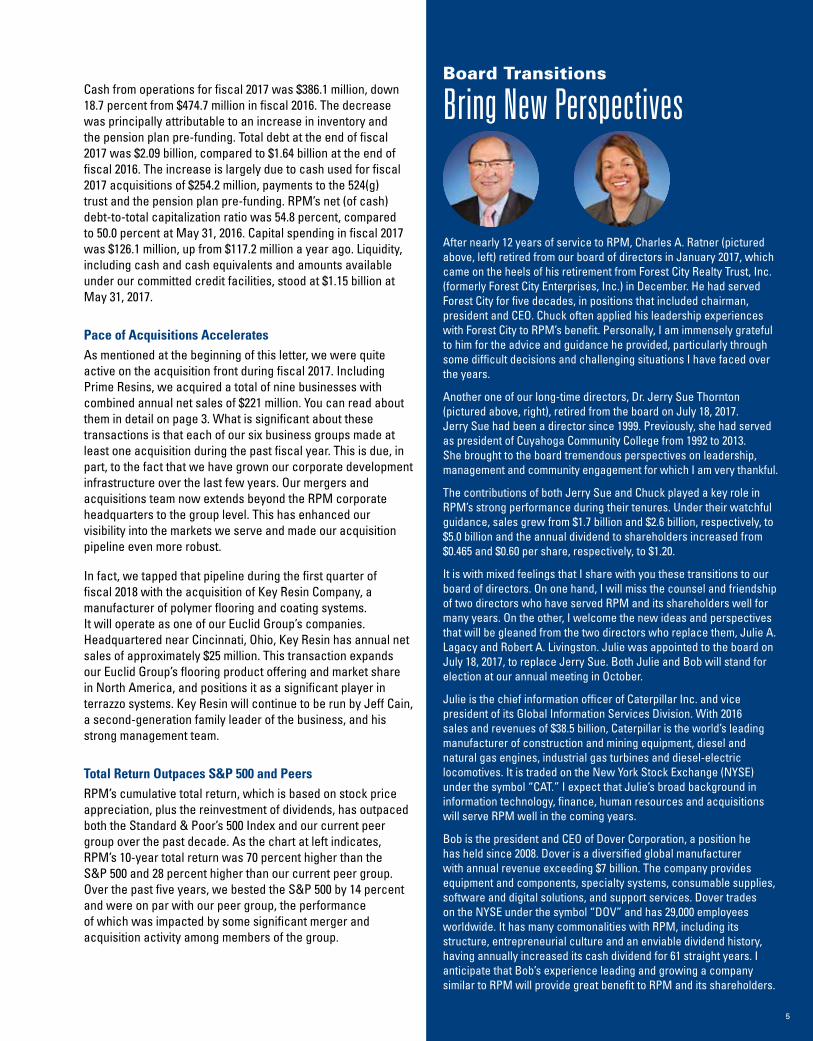
Cash from operations for fiscal 2017 was $386.1 million, down 18.7 percent from $474.7 million in fiscal 2016. The decrease was principally attributable to an increase in inventory and the pension plan pre-funding. Total debt at the end of fiscal 2017 was $2.09 billion, compared to $1.64 billion at the end of fiscal 2016. The increase is largely due to cash used for fiscal 2017 acquisitions of $254.2 million, payments to the 524(g) trust and the pension plan pre-funding. RPM’s net (of cash) debt-to-total capitalization ratio was 54.8 percent, compared to 50.0 percent at May 31, 2016. Capital spending in fiscal 2017 was $126.1 million, up from $117.2 million a year ago. Liquidity, including cash and cash equivalents and amounts available under our committed credit facilities, stood at $1.15 billion at May 31, 2017.
Pace of Acquisitions AcceleratesAs mentioned at the beginning of this letter, we were quite active on the acquisition front during fiscal 2017. Including Prime Resins, we acquired a total of nine businesses with combined annual net sales of $221 million. You can read about them in detail on page 3. What is significant about these transactions is that each of our six business groups made at least one acquisition during the past fiscal year. This is due, in part, to the fact that we have grown our corporate development infrastructure over the last few years. Our mergers and acquisitions team now extends beyond the RPM corporate headquarters to the group level. This has enhanced our visibility into the markets we serve and made our acquisition pipeline even more robust.
In fact, we tapped that pipeline during the first quarter of fiscal 2018 with the acquisition of Key Resin Company, a manufacturer of polymer flooring and coating systems. It will operate as one of our Euclid Group’s companies. Headquartered near Cincinnati, Ohio, Key Resin has annual net sales of approximately $25 million. This transaction expands our Euclid Group’s flooring product offering and market share in North America, and positions it as a significant player in terrazzo systems. Key Resin will continue to be run by Jeff Cain, a second-generation family leader of the business, and his strong management team.
Total Return Outpaces S&P 500 and PeersRPM’s cumulative total return, which is based on stock price appreciation, plus the reinvestment of dividends, has outpaced both the Standard & Poor’s 500 Index and our current peer group over the past decade. As the chart at left indicates, RPM’s 10-year total return was 70 percent higher than the S&P 500 and 28 percent higher than our current peer group. Over the past five years, we bested the S&P 500 by 14 percent and were on par with our peer group, the performance of which was impacted by some significant merger and acquisition activity among members of the group.
Bring New PerspectivesBoard Transitions
After nearly 12 years of service to RPM, Charles A. Ratner (pictured above, left) retired from our board of directors in January 2017, which came on the heels of his retirement from Forest City Realty Trust, Inc. (formerly Forest City Enterprises, Inc.) in December. He had served Forest City for five decades, in positions that included chairman, president and CEO. Chuck often applied his leadership experiences with Forest City to RPM’s benefit. Personally, I am immensely grateful to him for the advice and guidance he provided, particularly through some difficult decisions and challenging situations I have faced over the years.
Another one of our long-time directors, Dr. Jerry Sue Thornton (pictured above, right), retired from the board on July 18, 2017. Jerry Sue had been a director since 1999. Previously, she had served as president of Cuyahoga Community College from 1992 to 2013. She brought to the board tremendous perspectives on leadership, management and community engagement for which I am very thankful.
The contributions of both Jerry Sue and Chuck played a key role in RPM’s strong performance during their tenures. Under their watchful guidance, sales grew from $1.7 billion and $2.6 billion, respectively, to $5.0 billion and the annual dividend to shareholders increased from $0.465 and $0.60 per share, respectively, to $1.20.
It is with mixed feelings that I share with you these transitions to our board of directors. On one hand, I will miss the counsel and friendship of two directors who have served RPM and its shareholders well for many years. On the other, I welcome the new ideas and perspectives that will be gleaned from the two directors who replace them, Julie A. Lagacy and Robert A. Livingston. Julie was appointed to the board on July 18, 2017, to replace Jerry Sue. Both Julie and Bob will stand for election at our annual meeting in October.
Julie is the chief information officer of Caterpillar Inc. and vice president of its Global Information Services Division. With 2016 sales and revenues of $38.5 billion, Caterpillar is the world’s leading manufacturer of construction and mining equipment, diesel and natural gas engines, industrial gas turbines and diesel-electric locomotives. It is traded on the New York Stock Exchange (NYSE) under the symbol “CAT.” I expect that Julie’s broad background in information technology, finance, human resources and acquisitions will serve RPM well in the coming years.
Bob is the president and CEO of Dover Corporation, a position he has held since 2008. Dover is a diversified global manufacturer with annual revenue exceeding $7 billion. The company provides equipment and components, specialty systems, consumable supplies, software and digital solutions, and support services. Dover trades on the NYSE under the symbol “DOV” and has 29,000 employees worldwide. It has many commonalities with RPM, including its structure, entrepreneurial culture and an enviable dividend history, having annually increased its cash dividend for 61 straight years. I anticipate that Bob’s experience leading and growing a company similar to RPM will provide great benefit to RPM and its shareholders.
5

Paying a dividend and increasing it annually, which we have done for 43 consecutive years, is a key to the impressive total return we have been able to deliver to our shareholders. Very few companies can boast of such a record. In fact, less than half of one percent of all 19,000 publicly traded companies have paid an increasing cash dividend for this period of time or longer, according to the Mergent Handbook of Dividend Achievers. We last increased the dividend on October 6, 2016, by 9.1 percent to $1.20 per share annually. It is a track record of which we are very proud and intend to continue, rewarding our long-term shareholders for their loyalty.
Outlook Optimistic for Fiscal 2018In our industrial segment, we expect economic activity in North America to continue its current steady pace and benefit our companies serving commercial construction markets. We believe our businesses serving the oil and gas sector will bottom out during the first half of the fiscal year, start positive growth in the back half and, ultimately, end the year neutral. Our European businesses should contribute positively to top- and bottom-line results in the coming fiscal year. With this backdrop, we expect our industrial segment to grow sales in the low-to-mid-single-digit range.
In our specialty segment, we forecast low-single-digit sales growth with fiscal 2017 acquisitions contributing 2.0 percent and the balance as organic growth, driven by our fluorescent pigment and wood treatment businesses. Included in the specialty segment’s projections for fiscal 2018 are the anticipated lower sales resulting from a patent expiration in our edible coatings business.
Our consumer segment should experience favorable market conditions, enabling its growth to continue at a steady pace in fiscal 2018. We expect that consumer businesses in the U.S., UK and mainland Europe will contribute favorably to results, as will recent acquisitions. Organic sales growth is expected to be in the low-to-mid-single-digit range, supported by new product introductions and further market penetration. Our DAP business’ capacity issues have been resolved, allowing it to manage the recent uptick in growth momentum. The Kirker business, which has underperformed in recent years, has been stabilized with a new management team and should no longer mask core consumer segment sales growth and profitability. Given these assumptions, we anticipate sales in the consumer segment to grow in the mid-single-digit range for fiscal 2018.
Our diluted earnings per share guidance for fiscal 2018 is a range of $2.85 to $2.95. Our ability to achieve the upper end of this target is based on the variability of organic sales growth, with a baseline goal of 3.0 percent, and how effectively we manage the impact of rising raw material costs.
When I was RPM’s chief financial officer, I tracked our various financial ratios – such as return on equity, return on invested capital and others – and gauged where RPM stood against its industry peers. It was my desire that RPM be among the best in class in every category. When I became CEO in 2002, it took me a few years to realize that while understanding these ratios is helpful, they simply reflect where we stand at a given point in time. What is most important is momentum. It is my job, and that of RPM’s leadership team, to affect positive momentum in all categories. Doing so has served us well, most recently resulting in the run of seven consecutive years of adjusted double-digit earnings growth and, of course, our enviable dividend track record. In fiscal 2017, we lost that momentum for the several reasons identified in this letter. Through a combination of the actions taken during fiscal 2017, a continuation of our industry-leading acquisition program and the proven entrepreneurial operating philosophy of RPM, we are positioned to regain momentum and return to double-digit earnings growth in fiscal 2018 and beyond.
In closing, I would like to thank our 14,000 associates worldwide for competing and winning in the markets they serve. Thanks also to our customers for your ongoing support. We will continue to work hard to earn your business every day. Lastly, I extend my gratitude to our investors for your trust and confidence that we will continue to generate solid returns and make your investment in RPM a rewarding one.
Very truly yours,
Frank C. Sullivan Chairman and Chief Executive Officer
August 24, 2017
6

AD Fire • Adhere Industrial Tapes • API • Applied Polymerics • Arnette Polymers • Ascoat • Betumat • Bomat • Boral • Canam • Carboline • Chemical Coatings, Inc. • Chemspec • Chemtec • Chemtron • Citadel • Dane Group • DAP • Day-Glo • Dryvit • Duram • Euclid Chemical • Eucomex • Expanko • Fibregrid • Finishworks • Firetherm • Flecto • Flowcrete • Grupo PV • Guardian Products • HiChem • Holton Food Products • Hummervoll • illbruck • Increte • Kop-Coat • Krud Kutter • Legend Brands • Mameco • Mantrose-Haeuser • Martin Mathys N.V. • Modern Masters • Mohawk • Multicolor Specialties • Nu-Chem • Nullifire • Okon • Paper Tiger • Parks • Permaquik • Pipeline & Drainage Systems • Plastic Wood • Prime Resins • Prochem • Productos CAVE • Prosytec • PSI Packaging • Radiant Color • Rust-Oleum • Seal-Krete • Sierra Performance Coatings • Specialty Polymer Coatings • Spraymate • SPS Group • Star Maling • Stonhard • Tamms • TCI • Testor • Tor • Touch ‘n Foam • Toxement • Tremco • Triarch • Ultra-Tex • Universal Sealants • Vandex • Viapol • Watco • Westfield Coatings • XIM • Zehrung • Zinsser • AD Fire • Adhere Industrial Tapes • API • Applied Polymerics • Arnette Polymers • Ascoat • Betumat • Bomat • Boral • Canam • Carboline • Chemical Coatings, Inc. • Chemspec • Chemtec • Chemtron • Citadel • Dane Group • DAP • Day-Glo • Dryvit • Duram • Euclid Chemical • Eucomex • Expanko • Fibregrid • Finishworks • Firetherm • Flecto • Flowcrete • Grupo PV • Guardian Products • HiChem • Holton Food Products • Hummervoll • illbruck • Increte • Kop-Coat • Krud Kutter • Legend Brands • Mameco • Mantrose-Haeuser • Martin Mathys N.V. • Modern Masters • Mohawk • Multicolor Specialties • Nu-Chem • Nullifire • Okon • Paper Tiger • Parks • Permaquik • Pipeline & Drainage Systems • Plastic Wood • Prime Resins • Prochem • Productos CAVE • Prosytec • PSI Packaging • Radiant Color • Rust-Oleum • Seal-Krete • Sierra Performance Coatings • Specialty Polymer Coatings • Spraymate • SPS Group • Star Maling • Stonhard • Tamms • TCI • Testor • Tor • Touch ‘n Foam • Toxement • Tremco • Triarch • Ultra-Tex • Universal Sealants • Vandex • Viapol • Watco • Westfield Coatings • XIM • Zehrung • Zinsser • AD Fire • Adhere Industrial Tapes • API • Applied Polymerics • Arnette Polymers • Ascoat • Betumat • Bomat • Boral • Canam • Carboline • Chemical Coatings, Inc. • Chemspec • Chemtec • Chemtron • Citadel • Dane Group • DAP • Day-Glo • Dryvit • Duram • Euclid Chemical • Eucomex • Expanko • Fibregrid • Finishworks • Firetherm • Flecto • Flowcrete • Grupo PV • Guardian Products • HiChem • Holton Food Products • Hummervoll • illbruck • Increte • Kop-Coat • Krud Kutter • Legend Brands • Mameco • Mantrose-Haeuser • Martin Mathys N.V. • Modern Masters • Mohawk • Multicolor Specialties • Nu-Chem • Nullifire • Okon • Paper Tiger • Parks • Permaquik • Pipeline & Drainage Systems • Plastic Wood • Prime Resins • Prochem • Productos CAVE • Prosytec • PSI Packaging • Radiant Color • Rust-Oleum • Seal-Krete • Sierra Performance Coatings • Specialty Polymer Coatings • Spraymate • SPS Group • Star Maling • Stonhard • Tamms • TCI • Testor • Tor • Touch ‘n Foam • Toxement • Tremco • Triarch • Ultra-Tex • Universal Sealants • Vandex • Viapol • Watco • Westfield Coatings • XIM • Zehrung • Zinsser • AD Fire • Adhere Industrial Tapes • API • Applied Polymerics • Arnette Polymers • Ascoat • Betumat • Bomat • Boral • Canam • Carboline • Chemical Coatings, Inc. • Chemspec • Chemtec • Chemtron • Citadel • Dane Group • DAP • Day-Glo • Dryvit • Duram • Euclid Chemical • Eucomex • Expanko • Fibregrid • Finishworks • Firetherm • Flecto • Flowcrete • Grupo PV • Guardian Products • HiChem • Holton Food Products • Hummervoll • illbruck • Increte • Kop-Coat • Krud Kutter • Legend Brands • Mameco • Mantrose-Haeuser • Martin Mathys N.V. • Modern Masters • Mohawk • Multicolor Specialties • Nu-Chem • Nullifire • Okon • Paper Tiger • Parks • Permaquik • Pipeline & Drainage Systems • Plastic Wood • Prime Resins • Prochem • Productos CAVE • Prosytec • PSI Packaging • Radiant Color • Rust-Oleum • Seal-Krete • Sierra Performance Coatings • Specialty Polymer Coatings • Spraymate • SPS Group • Star Maling • Stonhard • Tamms • TCI • Testor • Tor • Touch ‘n Foam • Toxement • Tremco • Triarch • Ultra-Tex • Universal Sealants • Vandex • Viapol • Watco • Westfield Coatings • XIM • Zehrung • Zinsser • AD Fire • Adhere Industrial Tapes • API • Applied Polymerics • Arnette Polymers • Ascoat • Betumat • Bomat • Boral • Canam • Carboline • Chemical Coatings, Inc. • Chemspec • Chemtec • Chemtron • Citadel • Dane Group • DAP • Day-Glo • Dryvit • Duram • Euclid Chemical • Eucomex • Expanko • Fibregrid • Finishworks • Firetherm • Flecto • Flowcrete • Grupo PV • Guardian Products • HiChem • Holton Food Products • Hummervoll • illbruck • Increte • Kop-Coat • Krud Kutter • Legend Brands • Mameco • Mantrose-Haeuser • Martin Mathys N.V. • Modern Masters • Mohawk • Multicolor Specialties • Nu-Chem • Nullifire • Okon • Paper Tiger • Parks • Permaquik • Pipeline & Drainage Systems • Plastic Wood • Prime Resins • Prochem • Productos CAVE • Prosytec • PSI Packaging • Radiant Color • Rust-Oleum • Seal-Krete • Sierra Performance Coatings • Specialty Polymer Coatings • Spraymate • SPS Group • Star Maling • Stonhard • Tamms • TCI • Testor • Tor • Touch ‘n Foam • Toxement • Tremco • Triarch • Ultra-Tex • Universal Sealants • Vandex • Viapol • Watco • Westfield Coatings • XIM • Zehrung • Zinsser • AD Fire • Adhere Industrial Tapes • API • Applied Polymerics • Arnette Polymers • Ascoat • Betumat • Bomat • Boral • Canam • Carboline • Chemical Coatings, Inc. • Chemspec • Chemtec • Chemtron • Citadel • Dane Group • DAP • Day-Glo • Dryvit • Duram • Euclid Chemical • Eucomex • Expanko • Fibregrid • Finishworks • Firetherm • Flecto • Flowcrete • Grupo PV • Guardian Products • HiChem • Holton Food Products • Hummervoll • illbruck • Increte • Kop-Coat • Krud Kutter • Legend Brands • Mameco • Mantrose-Haeuser • Martin Mathys N.V. • Modern Masters • Mohawk • Multicolor Specialties • Nu-Chem • Nullifire • Okon • Paper Tiger • Parks • Permaquik • Pipeline & Drainage Systems • Plastic Wood • Prime Resins • Prochem • Productos CAVE • Prosytec • PSI Packag-ing • Radiant Color • Rust-Oleum • Seal-Krete • Sierra Performance Coatings • Specialty Polymer Coatings • Spraymate • SPS Group • Star Maling • Stonhard • Tamms • TCI • Testor • Tor • Touch ‘n Foam • Toxement • Tremco • Triarch • Ultra-Tex • Universal Sealants • Vandex • Viapol • Watco • Westfield Coatings • XIM • Zehrung • Zinsser • AD Fire • Adhere Industrial Tapes • API • Applied Polymerics • Arnette Polymers • Ascoat • Betumat • Bomat • Boral • Canam • Carboline • Chemical Coatings, Inc. • Chemspec • Chemtec • Chemtron • Citadel • Dane Group • DAP • Day-Glo • Dryvit • Duram • Euclid Chemical • Eucomex • Expanko • Fibregrid • Finishworks • Firetherm • Flecto • Flowcrete • Grupo PV • Guardian Products • HiChem • Holton Food Products • Hummervoll • illbruck • Increte • Kop-Coat • Krud Kutter • Legend Brands • Mameco • Mantrose-Haeuser • Martin Mathys N.V. • Modern Masters • Mohawk • Multicolor Specialties • Nu-Chem • Nullifire • Okon • Paper Tiger • Parks • Permaquik • Pipeline & Drainage Systems • Plastic Wood • Prime Resins • Prochem • Productos CAVE • Prosytec • PSI Packaging • Radiant Color • Rust-Oleum • Seal-Krete • Sierra Performance Coatings • Specialty Polymer Coatings • Spraymate • SPS Group • Star Maling • Stonhard • Tamms • TCI • Testor • Tor • Touch ‘n Foam • Toxement • Tremco • Triarch • Ultra-Tex • Universal Sealants • Vandex • Viapol • Watco • Westfield Coatings • XIM • Zehrung • Zinsser • AD Fire • Adhere Industrial Tapes • API • Applied Polymerics • Arnette Polymers • Ascoat • Betumat • Bomat • Boral • Canam • Carboline • Chemical Coatings, Inc. • Chemspec • Chemtec • Chemtron • Citadel • Dane Group • DAP • Day-Glo • Dryvit • Duram • Euclid Chemical • Eucomex • Expanko • Fibregrid • Finishworks • Firetherm • Flecto • Flowcrete • Grupo PV • Guardian Products • HiChem • Holton Food Products • Hummervoll • illbruck • Increte • Kop-Coat • Krud Kutter • Legend Brands • Mameco • Mantrose-Haeuser • Martin Mathys N.V. • Modern Masters • Mohawk • Multicolor Specialties • Nu-Chem • Nullifire • Okon • Paper Tiger • Parks • Permaquik • Pipeline & Drainage Systems • Plastic Wood • Prime Resins • Prochem • Productos CAVE • Prosytec • PSI Packaging • Radiant Color • Rust-Oleum • Seal-Krete • Sierra Performance Coatings • Specialty Polymer Coatings • Spraymate • SPS Group • Star Maling • Stonhard • Tamms • TCI • Testor • Tor • Touch ‘n Foam • Toxement • Tremco • Triarch • Ultra-Tex • Universal Sealants • Vandex • Viapol • Watco • Westfield Coatings • XIM • Zehrung • Zinsser • AD Fire • Adhere Industrial Tapes • API • Applied Polymerics • Arnette Polymers • Ascoat • Betumat • Bomat • Boral • Canam • Carboline • Chemical Coatings, Inc. • Chemspec • Chemtec • Chemtron • Citadel • Dane Group • DAP • Day-Glo • Dryvit • Duram • Euclid Chemical • Eucomex • Expanko • Fibregrid • Finishworks • Firetherm • Flecto • Flowcrete • Grupo PV • Guardian Products • HiChem • Holton Food Products • Hummervoll • illbruck • Increte • Kop-Coat • Krud Kutter • Legend Brands • Mameco • Mantrose-Haeuser • Martin Mathys N.V. • Modern Masters • Mohawk • Multicolor Specialties • Nu-Chem • Nullifire • Okon • Paper Tiger • Parks • Permaquik • Pipeline & Drainage Systems • Plastic Wood • Prime Resins • Prochem • Productos CAVE • Prosytec • PSI Packaging • Radiant Color • Rust-Oleum • Seal-Krete • Sierra Performance Coatings • Specialty Polymer Coatings • Spraymate • SPS Group • Star Maling • Stonhard • Tamms • TCI • Testor • Tor • Touch ‘n Foam • Toxement • Tremco • Triarch • Ul-tra-Tex • Universal Sealants • Vandex • Viapol • Watco • Westfield Coatings • XIM • Zehrung • Zinsser • AD Fire • Adhere Industrial Tapes • API • Applied Polymerics • Arnette Polymers • Ascoat • Betumat • Bomat • Boral • Canam • Carboline • Chemical Coatings, Inc. • Chemspec • Chemtec • Chemtron • Citadel • Dane Group • DAP • Day-Glo • Dryvit • Duram • Euclid Chemical • Eucomex • Expanko • Fi-bregrid • Finishworks • Firetherm • Flecto • Flowcrete • Grupo PV • Guardian Products • HiChem • Holton Food Products • Hummervoll • illbruck • Increte • Kop-Coat • Krud Kutter • Legend Brands • Mameco • Mantrose-Haeuser • Martin Mathys N.V. • Modern Masters • Mohawk • Multicolor Specialties • Nu-Chem • Nullifire • Okon • Paper Tiger • Parks • Permaquik • Pipeline & Drainage Systems • Plastic Wood • Prime Resins • Prochem • Productos CAVE • Prosytec • PSI Packaging • Radiant Color • Rust-Oleum • Seal-Krete • Sierra Performance Coatings • Specialty Polymer Coatings • Spraymate • SPS Group • Star Maling • Stonhard • Tamms • TCI • Testor • Tor • Touch ‘n Foam • Toxement • Tremco • Triarch • Ultra-Tex • Universal Sealants • Vandex • Viapol • Watco • Westfield Coatings • XIM • Zehrung • Zinsser • AD Fire • Adhere Industrial Tapes • API • Applied Polymerics • Arnette Polymers • Ascoat • Betumat • Bomat • Boral • Canam • Carboline • Chemical Coatings, Inc. • Chemspec • Chemtec • Chemtron • Citadel • Dane Group • DAP • Day-Glo • Dryvit • Duram • Euclid Chemical • Eucomex • Expanko • Fibregrid • Finishworks • Firetherm • Flecto • Flowcrete • Grupo PV • Guardian Products • HiChem • Holton Food Products • Hummervoll • illbruck • Increte • Kop-Coat • Krud Kutter • Legend Brands • Mameco • Mantrose-Haeuser • Martin Mathys N.V. • Modern Masters • Mohawk • Multicolor Specialties • Nu-Chem • Nullifire • Okon • Paper Tiger • Parks • Permaquik • Pipeline & Drainage Systems • Plastic Wood • Prime Resins • Prochem • Productos CAVE • Prosytec • PSI Packag-ing • Radiant Color • Rust-Oleum • Seal-Krete • Sierra Performance Coatings • Specialty Polymer Coatings • Spraymate • SPS Group • Star Maling • Stonhard • Tamms • TCI • Testor • Tor • Touch ‘n Foam • Toxement • Tremco • Triarch • Ultra-Tex • Universal Sealants • Vandex • Viapol • Watco • Westfield Coatings • XIM • Zehrung • Zinsser • AD Fire • Adhere Industrial Tapes • API • Applied Polymerics • Arnette Polymers • Ascoat • Betumat • Bomat • Boral • Canam • Carboline • Chemical Coatings, Inc. • Chemspec • Chemtec • Chemtron • Citadel • Dane Group • DAP • Day-Glo • Dryvit • Duram • Euclid Chemical • Eucomex • Expanko • Fibregrid • Finishworks • Firetherm • Flecto • Flowcrete • Grupo PV • Guardian Products • HiChem • Holton Food Products • Hummervoll • illbruck • Increte • Kop-Coat • Krud Kutter • Legend Brands • Mameco • Mantrose-Haeuser • Martin Mathys N.V. • Modern Masters • Mohawk • Multicolor Specialties • Nu-Chem • Nullifire • Okon • Paper Tiger • Parks • Permaquik • Pipeline & Drainage Systems • Plastic Wood • Prime Resins • Prochem • Productos CAVE • Prosytec • PSI Packaging • Radiant Color • Rust-Oleum • Seal-Krete • Sierra Performance Coatings • Specialty Polymer Coatings • Spraymate • SPS Group • Star Maling • Stonhard • Tamms • TCI • Testor • Tor • Touch ‘n Foam • Toxement • Tremco • Triarch • Ultra-Tex • Universal Sealants • Vandex • Viapol • Watco • Westfield Coatings • XIM • Zehrung • Zinsser • AD Fire • Adhere Industrial Tapes • API • Applied Polymerics • Arnette Polymers • Ascoat • Betumat • Bomat • Boral • Canam • Carboline • Chemical Coatings, Inc. • Chemspec • Chemtec • Chemtron • Citadel • Dane Group • DAP • Day-Glo • Dryvit • Duram • Euclid Chemical • Eucomex • Expanko • Fibregrid • Finishworks • Firetherm • Flecto • Flowcrete • Grupo PV • Guardian Products • HiChem • Holton Food Products • Hummervoll • illbruck • Increte • Kop-Coat • Krud Kutter • Legend Brands • Mameco • Mantrose-Haeuser • Martin Mathys N.V. • Modern Masters • Mohawk • Multicolor Specialties • Nu-Chem • Nullifire • Okon • Paper Tiger • Parks • Permaquik • Pipeline & Drainage Systems • Plastic Wood • Prime Resins • Prochem • Productos CAVE • Prosytec • PSI Packaging • Radiant Color • Rust-Oleum • Seal-Krete • Sierra Performance Coatings • Specialty Polymer Coatings • Spraymate • SPS Group • Star Maling • Stonhard • Tamms • TCI • Testor • Tor • Touch ‘n Foam • Toxement • Tremco • Triarch • Ultra-Tex • Universal Sealants • Vandex • Viapol • Watco • Westfield Coatings • XIM • Zehrung • Zinsser • AD Fire • Adhere Industrial Tapes • API • Applied Polymerics • Arnette Polymers • Ascoat • Betumat • Bomat • Boral • Canam • Carboline • Chemical Coatings, Inc. • Chemspec • Chemtec • Chemtron • Citadel • Dane Group • DAP • Day-Glo • Dryvit • Duram • Euclid Chemical • Eucomex • Expanko • Fibregrid • Finishworks • Firetherm • Flecto • Flowcrete • Grupo PV • Guardian Products • HiChem • Holton Food Products • Hummervoll • illbruck • Increte • Kop-Coat • Krud Kutter • Legend Brands • Mameco • Mantrose-Haeuser • Martin Mathys N.V. • Modern Masters • Mohawk • Multicolor Specialties • Nu-Chem • Nullifire • Okon • Paper Tiger • Parks • Permaquik • Pipeline & Drainage Systems • Plastic Wood • Prime Resins • Prochem • Productos CAVE • Prosytec • PSI Packaging • Radiant Color • Rust-Oleum • Seal-Krete • Sierra Performance Coatings • Specialty Polymer Coatings • Spraymate • SPS Group • Star Maling • Stonhard • Tamms • TCI • Testor • Tor • Touch ‘n Foam • Toxement • Tremco • Triarch • Ul-tra-Tex • Universal Sealants • Vandex • Viapol • Watco • Westfield Coatings • XIM • Zehrung • Zinsser • AD Fire • Adhere Industrial Tapes • API • Applied Polymerics • Arnette Polymers • Ascoat • Betumat • Bomat • Boral • Canam • Carboline • Chemical Coatings, Inc. • Chemspec • Chemtec • Chemtron • Citadel • Dane Group • DAP • Day-Glo • Dryvit • Duram • Euclid Chemical • Eucomex • Expanko • Fi-bregrid • Finishworks • Firetherm • Flecto • Flowcrete • Grupo PV • Guardian Products • HiChem • Holton Food Products • Hummervoll • illbruck • Increte • Kop-Coat • Krud Kutter • Legend Brands • Mameco • Mantrose-Haeuser • Martin Mathys N.V. • Modern Masters • Mohawk • Multicolor Specialties • Nu-Chem • Nullifire • Okon • Paper Tiger • Parks • Permaquik • Pipeline & Drainage Systems • Plastic Wood • Prime Resins • Prochem • Productos CAVE • Prosytec • PSI Packaging • Radiant Color • Rust-Oleum • Seal-Krete • Sierra Performance Coatings • Specialty Polymer Coatings • Spraymate • SPS Group • Star Maling • Stonhard • Tamms • TCI • Testor • Tor • Touch ‘n Foam • Toxement • Tremco • Triarch • Ultra-Tex • Universal Sealants • Vandex • Viapol • Watco • Westfield Coatings • XIM • Zehrung • Zinsser • AD Fire • Adhere Industrial Tapes • API • Applied Polymerics • Arnette Polymers • Ascoat • Betumat • Bomat • Boral • Canam • Carboline • Chemical Coatings, Inc. • Chemspec • Chemtec • Chemtron • Citadel • Dane Group • DAP • Day-Glo • Dryvit • Duram • Euclid Chemical • Eucomex • Expanko • Fibregrid • Finishworks • Firetherm • Flecto • Flowcrete • Grupo PV • Guardian Products • HiChem • Holton Food Products • Hummervoll • illbruck • Increte • Kop-Coat • Krud Kutter • Legend Brands • Mameco • Mantrose-Haeuser • Martin Mathys N.V. • Modern Masters • Mohawk • Multicolor Specialties • Nu-Chem • Nullifire • Okon • Paper Tiger • Parks • Permaquik • Pipeline & Drainage Systems • Plastic Wood • Prime Resins • Prochem • Productos CAVE • Prosytec • PSI Packag-ing • Radiant Color • Rust-Oleum • Seal-Krete • Sierra Performance Coatings • Specialty Polymer Coatings • Spraymate • SPS Group • Star Maling • Stonhard • Tamms • TCI • Testor • Tor • Touch ‘n Foam • Toxement • Tremco • Triarch • Ultra-Tex • Universal Sealants • Vandex • Viapol • Watco • Westfield Coatings • XIM • Zehrung • Zinsser • AD Fire • Adhere Industrial Tapes • API • Applied Polymerics • Arnette Polymers • Ascoat • Betumat • Bomat • Boral • Canam • Carboline • Chemical Coatings, Inc. • Chemspec • Chemtec • Chemtron • Citadel • Dane Group • DAP • Day-Glo • Dryvit • Duram • Euclid Chemical • Eucomex • Expanko • Fibregrid • Finishworks • Firetherm • Flecto • Flowcrete • Grupo PV • Guardian Products • HiChem • Holton Food Products • Hummervoll • illbruck • Increte • Kop-Coat • Krud Kutter • Legend Brands • Mameco • Mantrose-Haeuser • Martin Mathys N.V. • Modern Masters • Mohawk • Multicolor Specialties • Nu-Chem • Nullifire • Okon • Paper Tiger • Parks • Permaquik • Pipeline & Drainage Systems • Plastic Wood • Prime Resins • Prochem • Productos CAVE • Prosytec • PSI Packaging • Radiant Color • Rust-Oleum • Seal-Krete • Sierra Performance Coatings • Specialty Polymer Coatings • Spraymate • SPS Group • Star Maling • Stonhard • Tamms • TCI • Testor • Tor • Touch ‘n Foam • Toxement • Tremco • Triarch • Ultra-Tex • Universal Sealants • Vandex • Viapol • Watco • Westfield Coatings • XIM • Zehrung • Zinsser • AD Fire • Adhere Industrial Tapes • API • Applied Polymerics • Arnette Polymers • Ascoat • Betumat • Bomat • Boral • Canam • Carboline • Chemical Coatings, Inc. • Chemspec • Chemtec • Chemtron • Citadel • Dane Group • DAP • Day-Glo • Dryvit • Duram • Euclid Chemical • Eucomex • Expanko • Fibregrid • Finishworks • Firetherm • Flecto • Flowcrete • Grupo PV • Guardian Products • HiChem • Holton Food Products • Hummervoll • illbruck • Increte • Kop-Coat • Krud Kutter • Legend Brands • Mameco • Mantrose-Haeuser • Martin Mathys N.V. • Modern Masters • Mohawk • Multicolor Specialties • Nu-Chem • Nullifire • Okon • Paper Tiger • Parks • Permaquik • Pipeline & Drainage Systems • Plastic Wood • Prime Resins • Prochem • Productos CAVE • Prosytec • PSI Packaging • Radiant Color • Rust-Oleum • Seal-Krete • Sierra Performance Coatings • Specialty Polymer Coatings • Spraymate • SPS Group • Star Maling • Stonhard • Tamms • TCI • Testor • Tor • Touch ‘n Foam • Toxement • Tremco • Triarch • Ultra-Tex • Universal Sealants • Vandex • Viapol • Watco • Westfield Coatings • XIM • Zehrung • Zinsser • AD Fire • Adhere Industrial Tapes • API • Applied Polymerics • Arnette Polymers • Ascoat • Betumat • Bomat • Boral • Canam • Carboline • Chemical Coatings, Inc. • Chemspec • Chemtec • Chemtron • Citadel • Dane Group • DAP • Day-Glo • Dryvit • Duram • Euclid Chemical • Eucomex • Expanko • Fibregrid • Finishworks • Firetherm • Flecto • Flowcrete • Grupo PV • Guardian Products • HiChem • Holton Food Products • Hummervoll • illbruck • Increte • Kop-Coat • Krud Kutter • Legend Brands • Mameco • Mantrose-Haeuser • Martin Mathys N.V. • Modern Masters • Mohawk • Multicolor Specialties • Nu-Chem • Nullifire • Okon • Paper Tiger • Parks • Permaquik • Pipeline & Drainage Systems • Plastic Wood • Prime Resins • Prochem • Productos CAVE • Prosytec • PSI Packaging • Radiant Color • Rust-Oleum • Seal-Krete • Sierra Performance Coatings • Specialty Polymer Coatings • Spraymate • SPS Group • Star Maling • Stonhard • Tamms • TCI • Testor • Tor • Touch ‘n Foam • Toxement • Tremco • Triarch • Ul-tra-Tex • Universal Sealants • Vandex • Viapol • Watco • Westfield Coatings • XIM • Zehrung • Zinsser • AD Fire • Adhere Industrial Tapes • API • Applied Polymerics • Arnette Polymers • Ascoat • Betumat • Bomat • Boral • Canam • Carboline • Chemical Coatings, Inc. • Chemspec • Chemtec • Chemtron • Citadel • Dane Group • DAP • Day-Glo • Dryvit • Duram • Euclid Chemical • Eucomex • Expanko • Fi-bregrid • Finishworks • Firetherm • Flecto • Flowcrete • Grupo PV • Guardian Products • HiChem • Holton Food Products • Hummervoll • illbruck • Increte • Kop-Coat • Krud Kutter • Legend Brands • Mameco • Mantrose-Haeuser • Martin Mathys N.V. • Modern Masters • Mohawk • Multicolor Specialties • Nu-Chem • Nullifire • Okon • Paper Tiger • Parks • Permaquik • Pipeline & Drainage Systems • Plastic Wood • Prime Resins • Prochem • Productos CAVE • Prosytec • PSI Packaging • Radiant Color • Rust-Oleum • Seal-Krete • Sierra Performance Coatings • Specialty Polymer Coatings • Spraymate • SPS Group • Star Maling • Stonhard • Tamms • TCI • Testor • Tor • Touch ‘n Foam • Toxement • Tremco • Triarch • Ultra-Tex • Universal Sealants • Vandex • Viapol • Watco • Westfield Coatings • XIM • Zehrung • Zinsser • AD Fire • Adhere Industrial Tapes • API • Applied Polymerics • Arnette Polymers • Ascoat • Betumat • Bomat • Boral • Canam • Carboline • Chemical Coatings, Inc. • Chemspec • Chemtec • Chemtron • Citadel • Dane Group • DAP • Day-Glo • Dryvit • Duram • Euclid Chemical • Eucomex • Expanko • Fibregrid • Finishworks • Firetherm • Flecto • Flowcrete • Grupo PV • Guardian Products • HiChem • Holton Food Products • Hummervoll • illbruck • Increte • Kop-Coat • Krud Kutter • Legend Brands • Mameco • Mantrose-Haeuser • Martin Mathys N.V. • Modern Masters • Mohawk • Multicolor Specialties • Nu-Chem • Nullifire • Okon • Paper Tiger • Parks • Permaquik • Pipeline & Drainage Systems • Plastic Wood • Prime Resins • Prochem • Productos CAVE • Prosytec • PSI Packag-ing • Radiant Color • Rust-Oleum • Seal-Krete • Sierra Performance Coatings • Specialty Polymer Coatings • Spraymate • SPS Group • Star Maling • Stonhard • Tamms • TCI • Testor • Tor • Touch ‘n Foam • Toxement • Tremco • Triarch • Ultra-Tex • Universal Sealants • Vandex • Viapol • Watco • Westfield Coatings • XIM • Zehrung • Zinsser • AD Fire • Adhere Industrial Tapes • API • Applied Polymerics • Arnette Polymers • Ascoat • Betumat • Bomat • Boral • Canam • Carboline • Chemical Coatings, Inc. • Chemspec • Chemtec • Chemtron • Citadel • Dane Group • DAP • Day-Glo • Dryvit • Duram • Euclid Chemical • Eucomex • Expanko • Fibregrid • Finishworks • Firetherm • Flecto • Flowcrete • Grupo PV • Guardian Products • HiChem • Holton Food Products • Hummervoll • illbruck • Increte • Kop-Coat • Krud Kutter • Legend Brands • Mameco • Mantrose-Haeuser • Martin Mathys N.V. • Modern Masters • Mohawk • Multicolor Specialties • Nu-Chem • Nullifire • Okon • Paper Tiger • Parks • Permaquik • Pipeline & Drainage Systems • Plastic Wood • Prime Resins • Prochem • Productos CAVE • Prosytec • PSI Packaging • Radiant Color • Rust-Oleum • Seal-Krete • Sierra Performance Coatings • Specialty Polymer Coatings • Spraymate • SPS Group • Star Maling • Stonhard • Tamms • TCI • Testor • Tor • Touch ‘n Foam • Toxement • Tremco • Triarch • Ultra-Tex • Universal Sealants • Vandex • Viapol • Watco • Westfield Coatings • XIM • Zehrung • Zinsser • AD Fire • Adhere Industrial Tapes • API • Applied Polymerics • Arnette Polymers • Ascoat • Betumat • Bomat • Boral • Canam • Carboline • Chemical Coatings, Inc. • Chemspec • Chemtec • Chemtron • Citadel • Dane Group • DAP • Day-Glo • Dryvit • Duram • Euclid Chemical • Eucomex • Expanko • Fibregrid • Finishworks • Firetherm • Flecto • Flowcrete • Grupo PV • Guardian Products • HiChem • Holton Food Products • Hummervoll • illbruck • Increte • Kop-Coat • Krud Kutter • Legend Brands • Mameco • Mantrose-Haeuser • Martin Mathys N.V. • Modern Masters • Mohawk • Multicolor Specialties • Nu-Chem • Nullifire • Okon • Paper Tiger • Parks • Permaquik • Pipeline & Drainage Systems • Plastic Wood • Prime Resins • Prochem • Productos CAVE • Prosytec • PSI Packaging • Radiant Color • Rust-Oleum • Seal-Krete • Sierra Performance Coatings • Specialty Polymer Coatings • Spraymate • SPS Group • Star Maling • Stonhard • Tamms • TCI • Testor • Tor • Touch ‘n Foam • Toxement • Tremco • Triarch • Ultra-Tex • Universal Sealants • Vandex • Viapol • Watco • Westfield Coatings • XIM • Zehrung • Zinsser • AD Fire • Adhere Industrial Tapes • API • Applied Polymerics • Arnette Polymers • Ascoat • Betumat • Bomat • Boral • Canam • Carboline • Chemical Coatings, Inc. • Chemspec • Chemtec • Chemtron • Citadel • Dane Group • DAP • Day-Glo • Dryvit • Duram • Euclid Chemical • Eucomex • Expanko • Fibregrid • Finishworks • Firetherm • Flecto • Flowcrete • Grupo PV • Guardian Products • HiChem • Holton Food Products • Hummervoll • illbruck • Increte • Kop-Coat • Krud Kutter • Legend Brands • Mameco • Mantrose-Haeuser • Martin Mathys N.V. • Modern Masters • Mohawk • Multicolor Specialties • Nu-Chem • Nullifire • Okon • Paper Tiger • Parks • Permaquik • Pipeline & Drainage Systems • Plastic Wood • Prime Resins • Prochem • Productos CAVE • Prosytec • PSI Packaging • Radiant Color • Rust-Oleum • Seal-Krete • Sierra Performance Coatings • Specialty Polymer Coatings • Spraymate • SPS Group • Star Maling • Stonhard • Tamms • TCI • Testor • Tor • Touch ‘n Foam • Toxement • Tremco • Triarch • Ul-tra-Tex • Universal Sealants • Vandex • Viapol • Watco • Westfield Coatings • XIM • Zehrung • Zinsser • AD Fire • Adhere Industrial Tapes • API • Applied Polymerics • Arnette Polymers • Ascoat • Betumat • Bomat • Boral • Canam • Carboline • Chemical Coatings, Inc. • Chemspec • Chemtec • Chemtron • Citadel • Dane Group • DAP • Day-Glo • Dryvit • Duram • Euclid Chemical • Eucomex • Expanko • Fi-bregrid • Finishworks • Firetherm • Flecto • Flowcrete • Grupo PV • Guardian Products • HiChem • Holton Food Products • Hummervoll • illbruck • Increte • Kop-Coat • Krud Kutter • Legend Brands • Mameco • Mantrose-Haeuser • Martin Mathys N.V. • Modern Masters • Mohawk • Multicolor Specialties • Nu-Chem • Nullifire • Okon • Paper Tiger • Parks • Permaquik • Pipeline & Drainage Systems • Plastic Wood • Prime Resins • Prochem • Productos CAVE • Prosytec • PSI Packaging • Radiant Color • Rust-Oleum • Seal-Krete • Sierra Performance Coatings • Specialty Polymer Coatings • Spraymate • SPS Group • Star Maling • Stonhard • Tamms • TCI • Testor • Tor • Touch ‘n Foam • Toxement • Tremco • Triarch • Ultra-Tex • Universal Sealants • Vandex • Viapol • Watco • Westfield Coatings • XIM • Zehrung • Zinsser • AD Fire • Adhere Industrial Tapes • API • Applied Polymerics • Arnette Polymers • Ascoat • Betumat • Bomat • Boral • Canam • Carboline • Chemical Coatings, Inc. • Chemspec • Chemtec • Chemtron • Citadel • Dane Group • DAP • Day-Glo • Dryvit • Duram • Euclid Chemical • Eucomex • Expanko • Fibregrid • Finishworks • Firetherm • Flecto • Flowcrete • Grupo PV • Guardian Products • HiChem • Holton Food Products • Hummervoll • illbruck • Increte • Kop-Coat • Krud Kutter • Legend Brands • Mameco • Mantrose-Haeuser • Martin Mathys N.V. • Modern Masters • Mohawk • Multicolor Specialties • Nu-Chem • Nullifire • Okon • Paper Tiger • Parks • Permaquik • Pipeline & Drainage Systems • Plastic Wood • Prime Resins • Prochem • Productos CAVE • Prosytec • PSI Packag-ing • Radiant Color • Rust-Oleum • Seal-Krete • Sierra Performance Coatings • Specialty Polymer Coatings • Spraymate • SPS Group • Star Maling • Stonhard • Tamms • TCI • Testor • Tor • Touch ‘n Foam • Toxement • Tremco • Triarch • Ultra-Tex • Universal Sealants • Vandex • Viapol • Watco • Westfield Coatings • XIM • Zehrung • Zinsser • AD Fire • Adhere Industrial Tapes • API • Applied Polymerics • Arnette Polymers • Ascoat • Betumat • Bomat • Boral • Canam • Carboline • Chemical Coatings, Inc. • Chemspec • Chemtec • Chemtron • Citadel • Dane Group • DAP • Day-Glo • Dryvit • Duram • Euclid Chemical • Eucomex • Expanko • Fibregrid • Finishworks • Firetherm • Flecto • Flowcrete • Grupo PV • Guardian Products • HiChem • Holton Food Products • Hummervoll • illbruck • Increte • Kop-Coat • Krud Kutter • Legend Brands • Mameco • Mantrose-Haeuser • Martin Mathys N.V. • Modern Masters • Mohawk • Multicolor Specialties • Nu-Chem • Nullifire • Okon • Paper Tiger • Parks • Permaquik • Pipeline & Drainage Systems • Plastic Wood • Prime Resins • Prochem • Productos CAVE • Prosytec • PSI Packaging • Radiant Color • Rust-Oleum • Seal-Krete • Sierra Performance Coatings • Specialty Polymer Coatings • Spraymate • SPS Group • Star Maling • Stonhard • Tamms • TCI • Testor • Tor • Touch ‘n Foam • Toxement • Tremco • Triarch • Ultra-Tex • Universal Sealants • Vandex • Viapol • Watco • Westfield Coatings • XIM • Zehrung • Zinsser • AD Fire • Adhere Industrial Tapes • API • Applied Polymerics • Arnette Polymers • Ascoat • Betumat • Bomat • Boral • Canam • Carboline • Chemical Coatings, Inc. • Chemspec • Chemtec • Chemtron • Citadel • Dane Group • DAP • Day-Glo • Dryvit • Duram • Euclid Chemical • Eucomex • Expanko • Fibregrid • Finishworks • Firetherm • Flecto • Flowcrete • Grupo PV • Guardian Products • HiChem • Holton Food Products • Hummervoll • illbruck • Increte • Kop-Coat • Krud Kutter • Legend Brands • Mameco • Mantrose-Haeuser • Martin Mathys N.V. • Modern Masters • Mohawk • Multicolor Specialties • Nu-Chem • Nullifire • Okon • Paper Tiger • Parks • Permaquik • Pipeline & Drainage Systems • Plastic Wood • Prime Resins • Prochem • Productos CAVE • Prosytec • PSI Packaging • Radiant Color • Rust-Oleum • Seal-Krete • Sierra Performance Coatings • Specialty Polymer Coatings • Spraymate • SPS Group • Star Maling • Stonhard • Tamms • TCI • Testor • Tor • Touch ‘n Foam • Toxement • Tremco • Triarch • Ultra-Tex • Universal Sealants • Vandex • Viapol • Watco • Westfield Coatings • XIM • Zehrung • Zinsser • AD Fire • Adhere Industrial Tapes • API • Applied Polymerics • Arnette Polymers • Ascoat • Betumat • Bomat • Boral • Canam • Carboline • Chemical Coatings, Inc. • Chemspec • Chemtec • Chemtron • Citadel • Dane Group • DAP • Day-Glo • Dryvit • Duram • Euclid Chemical • Eucomex • Expanko • Fibregrid • Finishworks • Firetherm • Flecto • Flowcrete • Grupo PV • Guardian Products • HiChem • Holton Food Products • Hummervoll • illbruck • Increte • Kop-Coat • Krud Kutter • Legend Brands • Mameco • Mantrose-Haeuser • Martin Mathys N.V. • Modern Masters • Mohawk • Multicolor Specialties • Nu-Chem • Nullifire • Okon • Paper Tiger • Parks • Permaquik • Pipeline & Drainage Systems • Plastic Wood • Prime Resins • Prochem • Productos CAVE • Prosytec • PSI Packaging • Radiant Color • Rust-Oleum • Seal-Krete • Sierra Performance Coatings • Specialty Polymer Coatings • Spraymate • SPS Group • Star Maling • Stonhard • Tamms • TCI • Testor • Tor • Touch ‘n Foam • Toxement • Tremco • Triarch • Ul-tra-Tex • Universal Sealants • Vandex • Viapol • Watco • Westfield Coatings • XIM • Zehrung • Zinsser • AD Fire • Adhere Industrial Tapes • API • Applied Polymerics • Arnette Polymers • Ascoat • Betumat • Bomat • Boral • Canam • Carboline • Chemical Coatings, Inc. • Chemspec • Chemtec • Chemtron • Citadel • Dane Group • DAP • Day-Glo • Dryvit • Duram • Euclid Chemical • Eucomex • Expanko • Fi-bregrid • Finishworks • Firetherm • Flecto • Flowcrete • Grupo PV • Guardian Products • HiChem • Holton Food Products • Hummervoll • illbruck • Increte • Kop-Coat • Krud Kutter • Legend Brands • Mameco • Mantrose-Haeuser • Martin Mathys N.V. • Modern Masters • Mohawk • Multicolor Specialties • Nu-Chem • Nullifire • Okon • Paper Tiger • Parks • Permaquik • Pipeline & Drainage Systems • Plastic Wood • Prime Resins • Prochem • Productos CAVE • Prosytec • PSI Packaging • Radiant Color • Rust-Oleum • Seal-Krete • Sierra Performance Coatings • Specialty Polymer Coatings • Spraymate • SPS Group • Star Maling • Stonhard • Tamms • TCI • Testor • Tor • Touch ‘n Foam • Toxement • Tremco • Triarch • Ultra-Tex • Universal Sealants • Vandex • Viapol • Watco • Westfield Coatings •
RPM creates shareholder value by attracting successful, entrepreneurial companies and applying a disciplined approach to investing in their
continued growth. As part of this approach, RPM promotes a culture of collaboration among its operating companies – a strategy that has resulted in innovative new products, increased market penetration, shared technological
resources and improved efficiencies in manufacturing and distribution. Many of RPM’s businesses routinely leverage these tighter connections,
leading to a win-win situation for all involved.
growthto
Connecting
ACCELERATEentrepreneurs
7

8

Spanning Continents6
A world leader in specialty chemicals for the global construction and engineering market, The Euclid Group was formed during the 2017 fiscal year by uniting several of the world’s most trusted specialty construction chemical brands under a new umbrella. This strategic union includes RPM businesses Euclid Chemical, Flowcrete, RPM Belgium Vandex, Increte Systems, Toxement, Cave, Viapol and Eucomex.
By joining forces, these businesses can now leverage The Euclid Group’s market share, sales channels, production and logistic operations across the globe to rapidly introduce their product lines to new markets based on demand and manufacturing capabilities. Having positioned itself as a progressive, one-stop solutions provider, The Euclid Group empowers its businesses to better service customers worldwide by supplying additional solutions from other members of The Euclid Group that complement their existing portfolio base. It also allows specifiers and customers to more easily source a comprehensive range of construction chemical products, including admixtures, adhesives, protective coatings, sealants and waterproofing membranes.
With the goal of global expansion, The Euclid Group has a geographical sales and manufacturing footprint that spans more than 75 countries on six continents, including North and South America, Europe, Asia, Australia and Africa. Uniquely tailored to address the ever-evolving challenges of the global construction industry, The Euclid Group companies boast 34 production facilities in strategic locations worldwide that operate 73 different manufacturing processes.
Since its inception less than a year ago, The Euclid Group has successfully facilitated a number of strategic relationships. For example, Flowcrete moved to penetrate a new market by joining forces with Viapol. Flowcrete was able to leverage Viapol’s existing infrastructure and strong sales presence in this market as a platform to launch the Flowcrete product line in Brazil. In addition, Flowcrete helped introduce Increte Systems to the emerging Malaysian market – where it previously lacked a presence – by collaborating on a flooring project at Genting Highlands, an integrated resort development comprised of hotels, casinos and a theme park.
Construction Chemicals Brands
9
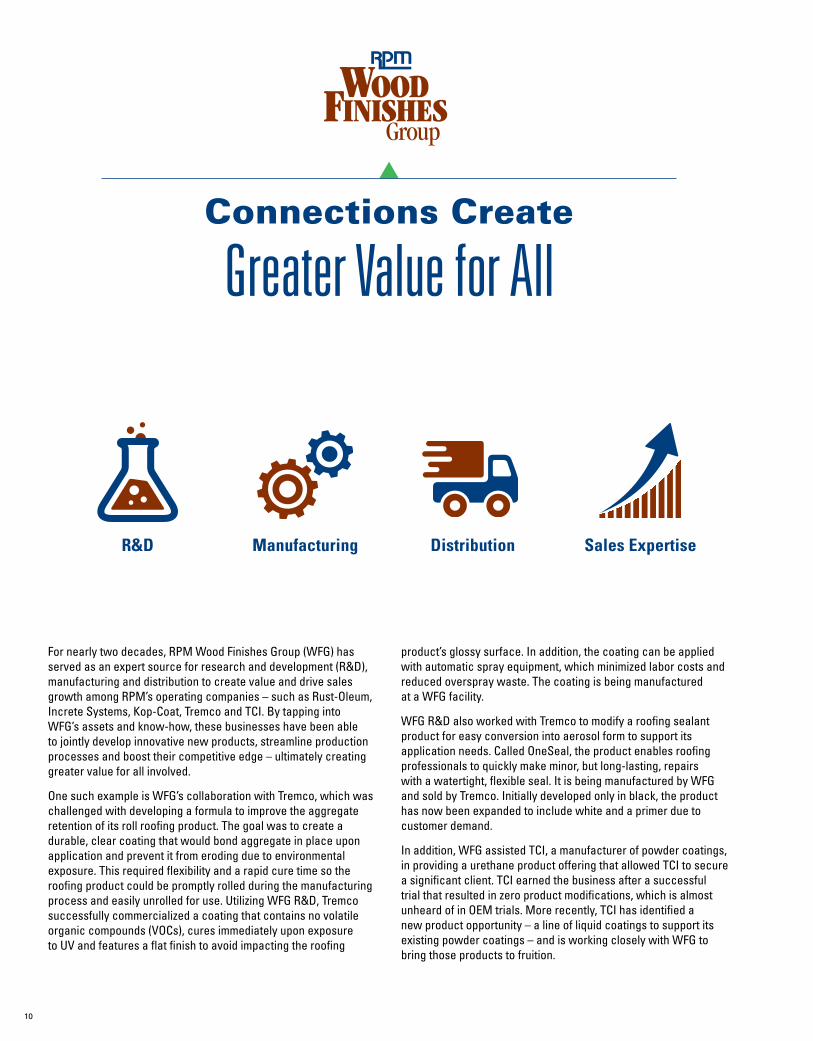
Connections Create
R&D Distribution Sales ExpertiseManufacturing
For nearly two decades, RPM Wood Finishes Group (WFG) has served as an expert source for research and development (R&D), manufacturing and distribution to create value and drive sales growth among RPM’s operating companies – such as Rust-Oleum, Increte Systems, Kop-Coat, Tremco and TCI. By tapping into WFG’s assets and know-how, these businesses have been able to jointly develop innovative new products, streamline production processes and boost their competitive edge – ultimately creating greater value for all involved.
One such example is WFG’s collaboration with Tremco, which was challenged with developing a formula to improve the aggregate retention of its roll roofing product. The goal was to create a durable, clear coating that would bond aggregate in place upon application and prevent it from eroding due to environmental exposure. This required flexibility and a rapid cure time so the roofing product could be promptly rolled during the manufacturing process and easily unrolled for use. Utilizing WFG R&D, Tremco successfully commercialized a coating that contains no volatile organic compounds (VOCs), cures immediately upon exposure to UV and features a flat finish to avoid impacting the roofing
product’s glossy surface. In addition, the coating can be applied with automatic spray equipment, which minimized labor costs and reduced overspray waste. The coating is being manufactured at a WFG facility.
WFG R&D also worked with Tremco to modify a roofing sealant product for easy conversion into aerosol form to support its application needs. Called OneSeal, the product enables roofing professionals to quickly make minor, but long-lasting, repairs with a watertight, flexible seal. It is being manufactured by WFG and sold by Tremco. Initially developed only in black, the product has now been expanded to include white and a primer due to customer demand.
In addition, WFG assisted TCI, a manufacturer of powder coatings, in providing a urethane product offering that allowed TCI to secure a significant client. TCI earned the business after a successful trial that resulted in zero product modifications, which is almost unheard of in OEM trials. More recently, TCI has identified a new product opportunity – a line of liquid coatings to support its existing powder coatings – and is working closely with WFG to bring those products to fruition.
Greater Value for All
10

CONNECTIONSRPM WOOD FINISHES GROUP
RPM Wood Finishes Group has been an R&D and production source for
its fellow RPM companies for more than
15years
11

RoofTec Systems combines the expertise of
a roofing innovator with
a cleaning systems leader.
During time trial side-by-side comparisons, the RoofTec Systems
cleaning process outperformed traditional power washing by
Tremco’s roof coating product lines have been its fastest growing material segment
over the past 4 years, growing at a CAGR of
and RoofTec is integral to achieving this growth.
50-60%
28.7%
12

Create a New Market
By uniting their roof restoration and cleaning expertise, world leaders Tremco Roofing & Building Maintenance and Legend Brands teamed up to develop the innovative, high-performance RoofTec Systems roof cleaning process. With its non-abrasive, rotating water jets, the process eliminates dirt, mold and mildew from single-ply and coated roof surfaces without the negative effects of traditional power-washing methods.
As North America’s first true roof restoration system, the RoofTec Systems process creates a revolutionary new market for roof cleaning and restoration. More than just a cleaning system, this process fully integrates roof cleaning with surface preparation, while addressing the growing need to comply with wastewater discharge regulations.
Traditional roof cleaning methods often require a large crew to operate, use an excessive amount of water and result in tiger striping due to uneven cleaning. In addition, these methods produce water runoff, which may result in the improper discharge of contaminants into the building’s storm drains.
Unlike traditional power-washing systems, the highly efficient, eco-friendly RoofTec Systems process extends the life cycle of a roof by returning it to peak performance, reduces water usage
by 60-70 percent and maximizes energy savings by restoring a roof’s reflectivity. In addition, it cleans and restores roofs up to 70 percent faster and requires only a two-person crew to operate – cutting overall labor costs.
In order to comply with wastewater discharge regulations, the RoofTec Systems process virtually eliminates water runoff by capturing wastewater and contaminants – leaving the roof surface dry and residue free. It also uses only EcoLogo-certified, detergent-free cleaners.
In a recent project, the Sierra Community College District needed to replace 10 single-ply roofs at its Rocklin, California campus. Due to its emphasis on environmental issues, the school wanted to avoid landfill use by saving raw materials, reduce water usage and minimize VOC discharge into the atmosphere. At half the cost of replacement, the RoofTec Systems process was used to clean and prepare the roof surfaces before the existing roofs were restored with Tremco Roofing’s AlphaGuard bio-based coating system. By using the RoofTec Systems cleaning and restoration process, the wastewater and contaminants were captured and discharged to a collection tank for filtering, and then reused for watering the campus landscape.
Uniting to Innovate and
13
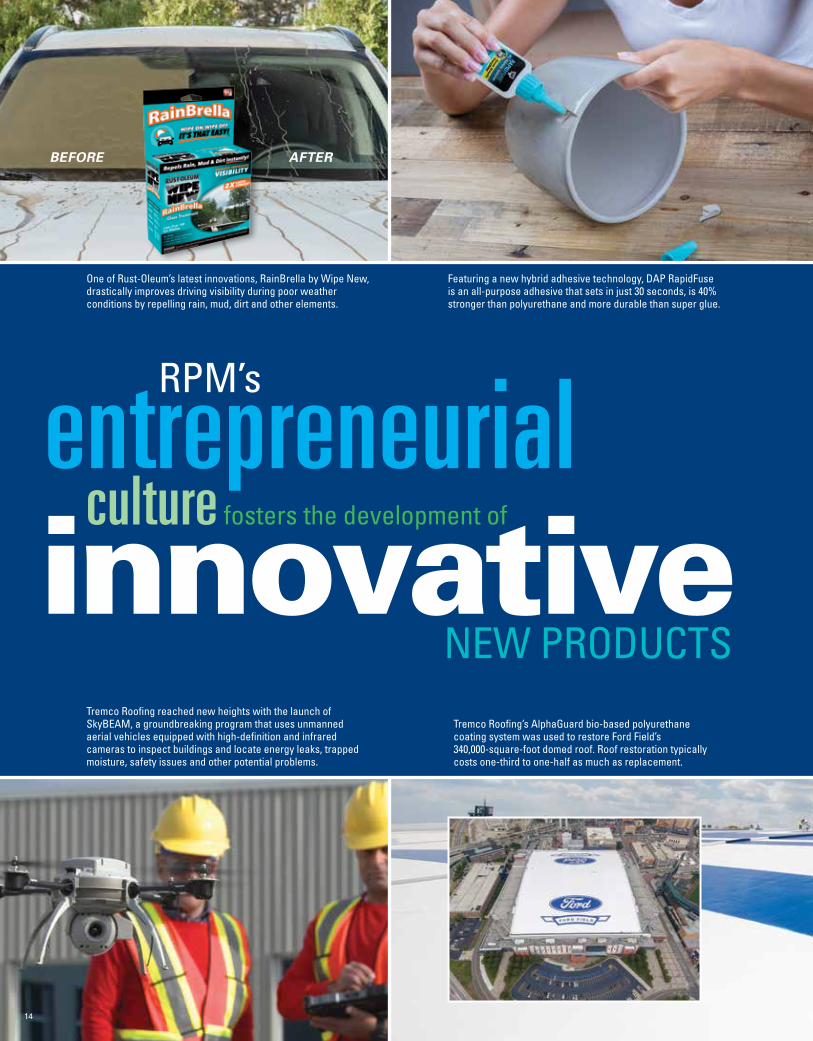
entrepreneurial culture
innovativeNEW PRODUCTS
fosters the development of
RPM’s
Featuring a new hybrid adhesive technology, DAP RapidFuse is an all-purpose adhesive that sets in just 30 seconds, is 40% stronger than polyurethane and more durable than super glue.
One of Rust-Oleum’s latest innovations, RainBrella by Wipe New, drastically improves driving visibility during poor weather conditions by repelling rain, mud, dirt and other elements.
BEFORE AFTER
Tremco Roofing reached new heights with the launch of SkyBEAM, a groundbreaking program that uses unmanned aerial vehicles equipped with high-definition and infrared cameras to inspect buildings and locate energy leaks, trapped moisture, safety issues and other potential problems.
Tremco Roofing’s AlphaGuard bio-based polyurethane coating system was used to restore Ford Field’s 340,000-square-foot domed roof. Roof restoration typically costs one-third to one-half as much as replacement.
14

Given RPM’s entrepreneurial culture, the spirit of innovation is deeply embedded throughout the organization. Its research and development professionals frequently meet to share knowledge on next-generation technologies and combine resources in the pursuit of new innovations. RPM’s operating company sales and marketing personnel gain insights directly from customers, which enable them to identify and address emerging needs in the marketplace.
Some new products are game-changing innovations, such as Tremco Roofing & Building Maintenance’s groundbreaking SkyBEAM program. Others are the result of improvements to existing products, such as new colors and textures, enhanced formulations, and advanced packaging and delivery systems.
An example of new product development efforts is at Dryvit, which brought innovation to the exterior insulation and finish systems (EIFS) industry with its game-changing product, NewBrick (shown above). Designed with the appearance of brick, NewBrick is a lightweight, insulated, energy-efficient wall system that can be easily installed over almost any solid substrate, such as
concrete and masonry, as well as over any Dryvit Outsulation system. Thermal insulation is built right into NewBrick, resulting in improved thermal comfort and increased energy savings. Its lightweight veneer also helps speed the construction schedule and reduce costs in multi-story structures. Available in a wide variety of standard colors, textures and blends, NewBrick designs run the gamut from modern to traditional – and everything in between.
In response to a growing customer demand for safer chemicals in everyday products, Day-Glo Color Corp. introduced Ezentus (EZ), a line of innovative, formaldehyde-free pigments. Unlike many fluorescent pigments, EZ (shown below) is based on cutting-edge polymer technology that is environmentally friendly, with improved thermal stability and superior lightfastness. The EZ product line includes four colors: Aurora Pink, Blaze Orange, Saturn Yellow and Corona Magenta. Most recently, Day-Glo partnered with Reebok to launch ZOKU RUNNER ULTK DAY-GLO – a neon spin on the classic Reebok ZOKU RUNNER lifestyle shoe – using EZ pigments. Ideal for athletic wear, EZ enhances safety due to increased visibility while also providing a variety of bold color choices to express one’s personal style.
A major driving force behind its organic growth, RPM pioneers
cutting-edge product innovations that are designed to penetrate new markets, drive sales growth and build brand loyalty.
Dryvit introduces
the first major innovation to the
U.S. brick market in centuries.
8.9billion
$
NewBrick
15

• Rust-Oleum rust-preventative and small project paints; high-performance garage and basement floor, deck and concrete coatings; and specialty paints and coatings
• DAP caulks, sealants, adhesives, and patch and repair products
• Zinsser primer-sealers, wallcovering preparation and removal products, and mildew-resistant paints
• Rust-Oleum, RockSolid, Varathane and Wolman wood stains and finishes
• Tor, Blackfriar and HiChem specialty coatings • Testors hobby products • Kirker nail enamels and coatings components
• Construction Sealants & Chemicals• Roofing Systems• Flooring Systems• Corrosion Control Coatings• Fiberglass Reinforced Plastic Gratings• Waterproofing Coatings & Sealants• Concrete Admixtures & Repair Products• Fireproofing Coatings
• Small-Project Paints & Coatings• Primer-Sealers• Specialty Paints• Caulks & Sealants• Hobby & Craft Products• Wood Stains & Finishes• Rust-Preventative Paints• Wallcovering Preparation &
Removal Products• Garage & Basement Floor Coatings• Deck & Driveway Coatings
• Exterior Insulation & Finish Systems (EIFS)• Fluorescent Pigments• Powder Coatings• Marine Coatings• Wood Stains, Finishes & Treatments• Restoration & Cleaning Solutions• Edible Coatings
of net sales34%
of net sales14%
of net sales52%
RPM’s consumer brands are sold primarily in North America, Australia, South Africa and the United Kingdom, with an increasing presence in Europe.
RPM’s specialty brands are sold primarily in the United States, with a growing presence throughout Europe.
RPM’s industrial brands comprise a large geographic footprint, with sales in approximately 170 countries and territories.
LEADING BRANDS
PRODUCT CATEGORIES
SALES AND GEOGRAPHY
CONSUMERSEGMENT
SPECIALTYSEGMENT
INDUSTRIALSEGMENT
• Tremco and illbruck construction sealants, waterproofing systems, air barriers and firestopping systems
• Tremco roofing materials and services • Euco admixtures and other products for
the concrete and masonry industries • Stonhard, Flowcrete, API and Expanko
flooring systems • Carboline high-performance corrosion
control and fireproofing coatings • Viapol building materials and
construction products • Universal Sealants expansion joints and
waterproofing for bridge decks • Fibergrate fiberglass reinforced
plastic grating
• Dryvit outsulation exterior cladding systems • Legend Brands products for water and
smoke damage restoration • Day-Glo, Dane and Radiant Color
fluorescent pigments • Pettit, Woolsey and Z-Spar marine coatings • Tru-Core lumber treatments • CCI, Guardian, Mohawk and Morrells
wood and furniture coatings, cleaners and protection products
• TCI powder coatings • Mantrose-Haeuser food and
pharmaceutical coatings
3Reportable Segments
Overview of Reportable SegmentsRPM has a diverse portfolio of name-brand products – many of which are leaders in their respective markets – that span across three reportable segments: consumer, specialty and industrial. A key element of RPM’s growth strategy, brand leadership allows operating companies to command premium pricing, shorten sales cycles and gain repeat purchases due to brand loyalty. In fiscal 2017, RPM’s industrial products accounted for more than half of total sales, with specialty and consumer products representing the remainder.
16

H MEBest
for
The
EntrepreneurialCompanies
18 Management’s Discussion and Analysis 31 Consolidated Financial Statements 36 Notes to Consolidated Financial Statements 64 Quarterly Stock Price and Dividend Information 65 Management’s Report on Internal Control 66 Auditors’ Reports 68 Stockholder Information 69 Directors and Officers
RPM International Inc.
Alex Plus® - AlphaGuard® - Alumanation® - American Accents® - AMPED™ - API™ - Arnette Polymers LLC® - Aurora Pink® - Betumat™ - B-I-N® - Biosan™ - Biosolv® - Blaze Orange™ - Bulls Eye 1-2-3® - CCI/Finishworks® - Carboline® - Cave™ - Chemspec® - Corona Magenta™ - Dane™ - DAP® - DAP 3.0™ - Day-Glo® - DIF™ - DryDex® - Dryvit® - Duram™ - Dymonic® - Elastaseal™ - Euclid™ - EUCO® - Expanko® - Ezentus™ - EZ™ - Fast ’N Final® - Fibergrate® - Finisher’s Choice™ - Flowcrete™ - Furniture Transformations® - G Guardian Protection Products, Inc.® - HiChem™ - Horizon Blue™ - Hydrocoat® - illbruck® - Increte Systems® - Kick Fast™ - Kirker® - Kop-Coat® - Krud-Kutter® - LeakSeal® - Legend Brands® - Mantrose-Haeuser™ - Metal FX™ - MM Modern Masters® - Mohawk® - Morrells™ - Nature Seal® - NewBrick® - Nullifire® - OneSeal™ - Outsulation® - Painter’s Touch® - Pettit™ - Phenoseal® - PlasticWood® - Prime Resins™ - Prime Flex™ - Prochem® - Pyroclad® - Radiant Color™ - RainBrella™ - RainCoat® - RapidFuse® - Restore® - RockSolid® - RoofTec Systems™ - RPM Belgium Vandex Group® - Rust-Oleum® - Sapphire Scientific® - Saturn Yellow® - ShimmerStone® - SkyBEAM™ - SmartBond® - SPS™ - SPC® - SpraySmart® - Stonhard® - Stops Rust® - Super Diamond Clear™ - TCI® - Testors® - The Euclid Chemical Company® - TOR™ - Touch ‘n Foam® - Touch ‘n Seal® - Toxement™ - Tremco® - Tru-Core® - TUF-STRAND™ - Universal® - Universal Sealants™ - USL™ - ValvTect® - Vandex® - Varathane® - Viapol™ - Vulkem® - Watco® - Woolsey® - Zinsser® - Z-Spar® - 2X Ultra Cover®
NeverWet® is a registered trademark of Ross Nanotechnology LLC used under a license by subsidiary corporations of RPM International Inc. - WipeNew® is a registered trademark of Wipe New LLC used under a license by subsidiary corporations of RPM International Inc. - Wolman® is a registered trademark of Arch Wood Protection Inc. used under a license by subsidiary corporations of RPM International Inc.
Any marks appearing in this annual report that are not the trademarks of RPM International Inc. or its subsidiaries are the property of their respective owners.
Trademarks appearing in this annual report:
17

CRITICAL ACCOUNTING POLICIES AND ESTIMATES
Our financial statements include all of our majority-owned subsidiaries, except for certain subsidiaries that were deconsolidated during the period from May 31, 2010 through December 31, 2014. We reconsolidated such subsidiaries as of January 1, 2015 (refer to Note A[2] to the Consolidated Financial Statements for further information). Investments in less-than-majority-owned joint ventures for which we have the ability to exercise significant influence over are accounted for under the equity method. Preparation of our financial statements requires the use of estimates and assumptions that affect the reported amounts of our assets and liabilities at the date of the financial statements and the reported amounts of revenues and expenses during the reporting period. We continually evaluate these estimates, including those related to our allowances for doubtful accounts; inventories; allowances for recoverable taxes; uncertain tax positions; useful lives of property, plant and equipment; goodwill and other intangible assets; environmental, warranties and other contingent liabilities; income tax valuation allowances; pension plans; and the fair value of financial instruments. We base our estimates on historical experience, our most recent facts, and other assumptions that we believe to be reasonable under the circumstances. These estimates form the basis for making judgments about the carrying values of our assets and liabilities. Actual results, which are shaped by actual market conditions, may differ materially from our estimates.
We have identified below the accounting policies and estimates that are the most critical to our financial statements.
REVENUE RECOGNITION
Revenues are recognized when realized or realizable, and when earned. In general, this is when title and risk of loss pass to the customer. Further, revenues are realizable when we have persuasive evidence of a sales arrangement, the product has been shipped or the services have been provided to the customer, the sales price is fixed or determinable and collectibility is reasonably assured. We reduce our revenues for estimated customer returns and allowances, certain rebates, sales incentives and promotions in the same period the related sales are recorded.
We also record revenues generated under long-term construction contracts, mainly in connection with the installation of specialized roofing and flooring systems, and related services. In general, we account for long-term construction contracts under the percentage-of-completion method, and therefore record contract revenues and related costs as our contracts progress. This method recognizes the economic results of contract performance on a timelier basis than does the completed-contract method; however, application of this method requires reasonably dependable estimates of progress toward completion, as well as other dependable estimates. When reasonably dependable estimates cannot be made, or if other factors make estimates doubtful, the completed-contract method is applied. Under the completed-contract method, billings and costs are accumulated in the balance sheet as the contract progresses, but no revenue is recognized until the contract is complete or substantially complete.
TRANSLATION OF FOREIGN CURRENCY FINANCIAL STATEMENTS AND FOREIGN CURRENCY TRANSACTIONS
Our reporting currency is the U.S. dollar. However, the functional currency for each of our foreign subsidiaries is its principal operating currency. We translate the amounts included in our Consolidated Statements of Income from our foreign subsidiaries into U.S. dollars at weighted-average exchange rates, which we believe are representative of the actual exchange rates on the dates of the transactions. Our foreign subsidiaries’ assets and liabilities are translated into U.S. dollars from local currency at the actual exchange rates as of the end of each reporting period, and we record the resulting foreign exchange translation adjustments in our Consolidated Balance Sheets as a component of accumulated other comprehensive income (loss). If the U.S. dollar strengthens, we reflect the resulting losses as a component of accumulated other comprehensive income (loss). Conversely, if the U.S. dollar weakens, foreign exchange translation gains result, which favorably impact accumulated other comprehensive income (loss). Translation adjustments may be included in net earnings in the event of a sale or liquidation of certain of our underlying foreign investments. If we determine that the functional currency of any of our foreign subsidiaries should be the U.S. dollar, our financial statements will be affected. Should this occur, we will adjust our reporting to appropriately account for any such changes.
As appropriate, we use permanently invested intercompany loans as a source of capital to reduce exposure to foreign currency fluctuations at our foreign subsidiaries. These loans, on a consolidated basis, are treated as being analogous to equity for accounting purposes. Therefore, foreign exchange gains or losses on these intercompany loans are recorded in accumulated other comprehensive income (loss).
GOODWILL
We test our goodwill balances at least annually, or more frequently as impairment indicators arise, at the reporting unit level. Our annual impairment assessment date has been designated as the first day of our fourth fiscal quarter. Our reporting units have been identified at the component level, which is the operating segment level or one level below our operating segments.
We follow the Financial Accounting Standards Board (“FASB”) guidance found in Accounting Standards Codification (“ASC”) 350 that simplifies how an entity tests goodwill for impairment. It provides an option to first assess qualitative factors to determine whether it is more likely than not that the fair value of a reporting unit is less than its carrying amount, and whether it is necessary to perform the two-step goodwill impairment test.
We assess qualitative factors in each of our reporting units that carry goodwill. Among other relevant events and circumstances that affect the fair value of our reporting units, we assess individual factors such as:
• a significant adverse change in legal factors or the business climate;
• an adverse action or assessment by a regulator;
• unanticipated competition;
• a loss of key personnel; and
• a more-likely-than-not expectation that a reporting unit or a significant portion of a reporting unit will be sold or otherwise disposed of.
Management’s Discussion and Analysis of Financial Condition and Results of Operations
RPM International Inc. and Subsidiaries18

We assess these qualitative factors to determine whether it is necessary to perform the two-step quantitative goodwill impairment test. The traditional two-step quantitative process is required only if we conclude that it is more likely than not that a reporting unit’s fair value is less than its carrying amount. However, we have an unconditional option to bypass a qualitative assessment and proceed directly to performing the traditional two-step quantitative analysis.
In applying the first step of the quantitative test, we compare the fair value of a reporting unit to its carrying value. Calculating the fair value of a reporting unit requires our use of estimates and assumptions. We use significant judgment in determining the most appropriate method to establish the fair value of a reporting unit. We estimate the fair value of a reporting unit by employing various valuation techniques, depending on the availability and reliability of comparable market value indicators, and employ methods and assumptions that include the application of third-party market value indicators and the computation of discounted future cash flows for a reporting unit’s annual projected earnings before interest, taxes, depreciation and amortization (“EBITDA”).
We evaluate discounted future cash flows for a reporting unit’s projected EBITDA. Under this approach, we calculate the fair value of a reporting unit based on the present value of estimated future cash flows. If the fair value of the reporting unit exceeds the carrying value of the net assets of the reporting unit, goodwill is not impaired. An indication that goodwill may be impaired results when the carrying value of the net assets of a reporting unit exceeds the fair value of the reporting unit. At that point, the second step of the impairment test is performed, which requires a fair value estimate of each tangible and intangible asset in order to determine the implied fair value of the reporting unit’s goodwill. If the carrying value of a reporting unit’s goodwill exceeds its implied fair value, then we record an impairment loss equal to the difference.
In applying the discounted cash flow methodology, we rely on a number of factors, including future business plans, actual and forecasted operating results, and market data. The significant assumptions employed under this method include discount rates; revenue growth rates, including assumed terminal growth rates; and operating margins used to project future cash flows for a reporting unit. The discount rates utilized reflect market-based estimates of capital costs and discount rates adjusted for management’s assessment of a market participant’s view with respect to other risks associated with the projected cash flows of the individual reporting unit. Our estimates are based upon assumptions we believe to be reasonable, but which by nature are uncertain and unpredictable. We believe we incorporate ample sensitivity ranges into our analysis of goodwill impairment testing for a reporting unit, such that actual experience would need to be materially out of the range of expected assumptions in order for an impairment to remain undetected.
During the second quarter of fiscal 2017, we identified certain factors that we considered important in assessing the requirement to perform an interim impairment evaluation for our Kirker reporting unit. First, Kirker’s three-month operating results for the second quarter of fiscal 2017 were significantly below historical and expected operating results and downward adjustments were recently made regarding our expectations for Kirker’s performance. Also during that quarter, Kirker experienced market share losses at several key customers, including the loss of its largest customer, which accounted for over 15% of Kirker’s fiscal 2016 sales. In addition, some problematic customer relationship issues surfaced during the second quarter of fiscal 2017, which resulted in a personnel change in a key leadership position at Kirker. After considering the totality of these recent events, we determined that an interim step one goodwill impairment assessment was required, as
well as an impairment assessment for our intangible and other long-lived assets. Accordingly, during our fiscal 2017 second quarter we recorded a loss totaling $188.3 million for the impairment of goodwill and intangibles at our Kirker reporting unit. Refer to Note B, “Goodwill and Other Intangible Assets,” for further discussion.
Our annual goodwill impairment analysis for fiscal 2017, which was performed as of March 1, 2017, did not result in any additional indicators of impairment. Should the future earnings and cash flows at our reporting units decline and/or discount rates increase, future impairment charges to goodwill and other intangible assets may be required.
OTHER LONG-LIVED ASSETS
We assess identifiable, amortizable intangibles and other long-lived assets for impairment whenever events or changes in facts and circumstances indicate the possibility that the carrying values of these assets may not be recoverable over their estimated remaining useful lives. Factors considered important in our assessment, which might trigger an impairment evaluation, include the following:
• significant under-performance relative to historical or projected future operating results;
• significant changes in the manner of our use of the acquired assets;
• significant changes in the strategy for our overall business; and
• significant negative industry or economic trends.
Measuring a potential impairment of amortizable intangibles and other long-lived assets requires the use of various estimates and assumptions, including the determination of which cash flows are directly related to the assets being evaluated, the respective useful lives over which those cash flows will occur and potential residual values, if any. If we determine that the carrying values of these assets may not be recoverable based upon the existence of one or more of the above-described indicators or other factors, any impairment amounts would be measured based on the projected net cash flows expected from these assets, including any net cash flows related to eventual disposition activities. The determination of any impairment losses would be based on the best information available, including internal estimates of discounted cash flows; market participant assumptions; quoted market prices, when available; and independent appraisals, as appropriate, to determine fair values. Cash flow estimates would be based on our historical experience and our internal business plans, with appropriate discount rates applied.
During the third quarter of fiscal 2017, we identified certain factors that we considered important in assessing the requirement to perform an interim impairment evaluation for our Restore indefinite tradename asset. First, sales of our Restore product line during the three-month period ended February 28, 2017 were below historical and expected operating results and significant downward adjustments were recently made to sales projections for Restore products. In the quarter ended February 28, 2017, we became aware that it was highly likely that Restore’s largest customer would discontinue sales of the Restore product line in its retail stores, which was evidenced by this customer’s significant reduction in future orders based on its historical order pattern. We determined that this was significant to consider for the purposes of impairment testing, as sales of Restore products to this customer accounted for over 60% of total sales of Restore products for fiscal 2016. After considering the magnitude of the loss in sales volume from this key customer, we determined that it was necessary to perform an interim assessment for our Restore intangible assets. Accordingly, for the third quarter of fiscal 2017, we recorded
RPM International Inc. and Subsidiaries 19
Managem
ent’s Discussion and A
nalysis Consolidated Financial Statements N
otes to Consolidated Financial Statements Q
uarterly Stock Price and Dividend Inform
ation Managem
ent’s Report Auditors’ Reports Stockholder Inform
ation
a loss totaling $4.9 million for the impairment of the Restore tradename. Refer to Note B, “Goodwill and Other Intangible Assets,” for further discussion.
Additionally, we test all indefinite-lived intangible assets for impairment at least annually during our fiscal fourth quarter. We follow the guidance provided by ASC 350 that simplifies how an entity tests indefinite-lived intangible assets for impairment. It provides an option to first assess qualitative factors to determine whether it is more likely than not that the fair value of an indefinite-lived intangible asset is less than its carrying amount. Our fiscal 2017 annual impairment tests of each of our indefinite-lived intangible assets did not result in any additional impairment loss.
INCOME TAXES
Our provision for income taxes is calculated using the asset and liability method, which requires the recognition of deferred income taxes. Deferred income taxes reflect the net tax effect of temporary differences between the carrying amounts of assets and liabilities for financial reporting purposes and the amounts used for income tax purposes and certain changes in valuation allowances. We provide valuation allowances against deferred tax assets if, based on available evidence, it is more likely than not that some portion or all of the deferred tax assets will not be realized.
In determining the adequacy of valuation allowances, we consider cumulative and anticipated amounts of domestic and international earnings or losses of the appropriate character, anticipated amounts of foreign source income, as well as the anticipated taxable income resulting from the reversal of future taxable temporary differences. We intend to maintain any recorded valuation allowances until sufficient positive evidence (for example, cumulative positive foreign earnings or capital gain income) exists to support a reversal of the tax valuation allowances.
Further, at each interim reporting period, we estimate an effective income tax rate that is expected to be applicable for the full year. Significant judgment is involved regarding the application of global income tax laws and regulations and when projecting the jurisdictional mix of income. Additionally, interpretation of tax laws, court decisions or other guidance provided by taxing authorities influences our estimate of the effective income tax rates. As a result, our actual effective income tax rates and related income tax liabilities may differ materially from our estimated effective tax rates and related income tax liabilities. Any resulting differences are recorded in the period they become known.
CONTINGENCIES
We are party to various claims and lawsuits arising in the normal course of business. Although we cannot precisely predict the amount of any liability that may ultimately arise with respect to any of these matters, we record provisions when we consider the liability probable and estimable. Our provisions are based on historical experience and legal advice, reviewed quarterly and adjusted according to developments. In general, our accruals, including our accruals for environmental, warranty and tax liabilities, discussed further below, represent the best estimate of a range of probable losses. Estimating probable losses requires the analysis of multiple factors that often depend on judgments about potential actions by third parties, such as regulators, courts, and state and federal legislatures. Changes in the amounts of our loss provisions, which can be material, affect our Consolidated Statements of Income. To the extent there is a reasonable possibility that potential losses could exceed the amounts already accrued, we believe that the amount of
any such additional loss would be immaterial to our results of operations, liquidity and consolidated financial position. We evaluate our accruals at the end of each quarter, or sometimes more frequently, based on available facts, and may revise our estimates in the future based on any new information becoming available.
Our environmental-related accruals are similarly established and/or adjusted as more information becomes available upon which costs can be reasonably estimated. Actual costs may vary from these estimates because of the inherent uncertainties involved, including the identification of new sites and the development of new information about contamination. Certain sites are still being investigated; therefore, we have been unable to fully evaluate the ultimate costs for those sites. As a result, accruals have not been estimated for certain of these sites and costs may ultimately exceed existing estimated accruals for other sites. We have received indemnities for potential environmental issues from purchasers of certain of our properties and businesses and from sellers of some of the properties or businesses we have acquired. If the indemnifying party fails to, or becomes unable to, fulfill its obligations under those agreements, we may incur environmental costs in addition to any amounts accrued, which may have a material adverse effect on our financial condition, results of operations or cash flows.
We offer warranties on many of our products, as well as long term warranty programs at certain of our businesses, and thus have established corresponding warranty liabilities. Warranty expense is impacted by variations in local construction practices, installation conditions, and geographic and climate differences. Although we believe that appropriate liabilities have been recorded for our warranty expense, actual results may differ materially from our estimates.
Additionally, our operations are subject to various federal, state, local and foreign tax laws and regulations that govern, among other things, taxes on worldwide income. The calculation of our income tax expense is based on the best information available, including the application of currently enacted income tax laws and regulations, and involves our significant judgment. The actual income tax liability for each jurisdiction in any year can ultimately be determined, in some instances, several years after the financial statements have been published.
We also maintain accruals for estimated income tax exposures for many different jurisdictions. Tax exposures are settled primarily through the resolution of audits within each tax jurisdiction or the closing of a statute of limitation. Tax exposures and actual income tax liabilities can also be affected by changes in applicable tax laws, retroactive tax law changes, or other factors, which may cause us to believe revisions of past estimates are appropriate. Although we believe that appropriate liabilities have been recorded for our income tax expense and income tax exposures, actual results may differ materially from our estimates.
ALLOWANCE FOR DOUBTFUL ACCOUNTS RECEIVABLE
An allowance for anticipated uncollectible trade receivable amounts is established using a combination of specifically identified accounts to be reserved and a reserve covering trends in collectibility. These estimates are based on an analysis of trends in collectibility and past experience, but are primarily made up of individual account balances identified as doubtful based on specific facts and conditions. Receivable losses are charged against the allowance when we confirm uncollectibility. Actual collections of trade receivables could differ from our estimates due to changes in future economic or industry conditions or specific customer’s financial conditions.
RPM International Inc. and Subsidiaries20
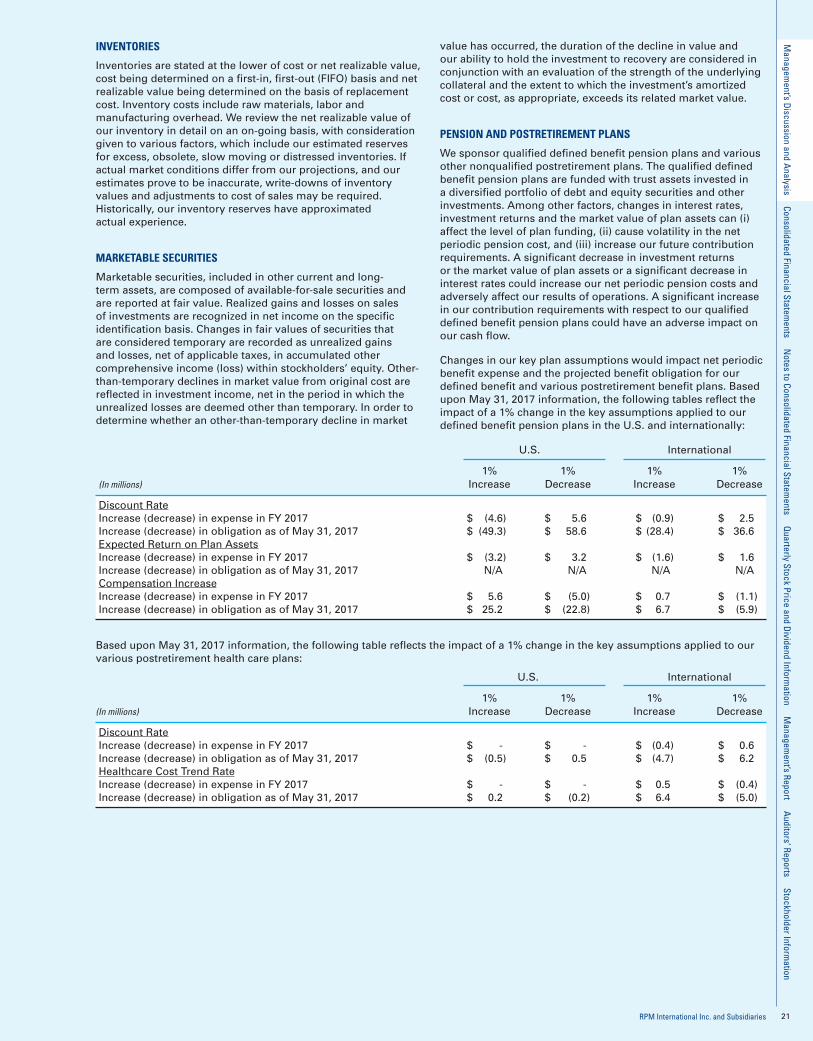
INVENTORIES
Inventories are stated at the lower of cost or net realizable value, cost being determined on a first-in, first-out (FIFO) basis and net realizable value being determined on the basis of replacement cost. Inventory costs include raw materials, labor and manufacturing overhead. We review the net realizable value of our inventory in detail on an on-going basis, with consideration given to various factors, which include our estimated reserves for excess, obsolete, slow moving or distressed inventories. If actual market conditions differ from our projections, and our estimates prove to be inaccurate, write-downs of inventory values and adjustments to cost of sales may be required. Historically, our inventory reserves have approximated actual experience.
MARKETABLE SECURITIES
Marketable securities, included in other current and long-term assets, are composed of available-for-sale securities and are reported at fair value. Realized gains and losses on sales of investments are recognized in net income on the specific identification basis. Changes in fair values of securities that are considered temporary are recorded as unrealized gains and losses, net of applicable taxes, in accumulated other comprehensive income (loss) within stockholders’ equity. Other-than-temporary declines in market value from original cost are reflected in investment income, net in the period in which the unrealized losses are deemed other than temporary. In order to determine whether an other-than-temporary decline in market
value has occurred, the duration of the decline in value and our ability to hold the investment to recovery are considered in conjunction with an evaluation of the strength of the underlying collateral and the extent to which the investment’s amortized cost or cost, as appropriate, exceeds its related market value.
PENSION AND POSTRETIREMENT PLANS
We sponsor qualified defined benefit pension plans and various other nonqualified postretirement plans. The qualified defined benefit pension plans are funded with trust assets invested in a diversified portfolio of debt and equity securities and other investments. Among other factors, changes in interest rates, investment returns and the market value of plan assets can (i) affect the level of plan funding, (ii) cause volatility in the net periodic pension cost, and (iii) increase our future contribution requirements. A significant decrease in investment returns or the market value of plan assets or a significant decrease in interest rates could increase our net periodic pension costs and adversely affect our results of operations. A significant increase in our contribution requirements with respect to our qualified defined benefit pension plans could have an adverse impact on our cash flow.
Changes in our key plan assumptions would impact net periodic benefit expense and the projected benefit obligation for our defined benefit and various postretirement benefit plans. Based upon May 31, 2017 information, the following tables reflect the impact of a 1% change in the key assumptions applied to our defined benefit pension plans in the U.S. and internationally:
U.S. International
1% 1% 1% 1% (In millions) Increase Decrease Increase Decrease
Discount Rate Increase (decrease) in expense in FY 2017 $ (4.6) $ 5.6 $ (0.9) $ 2.5 Increase (decrease) in obligation as of May 31, 2017 $ (49.3) $ 58.6 $ (28.4) $ 36.6Expected Return on Plan AssetsIncrease (decrease) in expense in FY 2017 $ (3.2) $ 3.2 $ (1.6) $ 1.6 Increase (decrease) in obligation as of May 31, 2017 N/A N/A N/A N/ACompensation Increase Increase (decrease) in expense in FY 2017 $ 5.6 $ (5.0) $ 0.7 $ (1.1)Increase (decrease) in obligation as of May 31, 2017 $ 25.2 $ (22.8) $ 6.7 $ (5.9)
Based upon May 31, 2017 information, the following table reflects the impact of a 1% change in the key assumptions applied to our various postretirement health care plans:
U.S. International
1% 1% 1% 1% (In millions) Increase Decrease Increase Decrease
Discount RateIncrease (decrease) in expense in FY 2017 $ - $ - $ (0.4) $ 0.6 Increase (decrease) in obligation as of May 31, 2017 $ (0.5) $ 0.5 $ (4.7) $ 6.2Healthcare Cost Trend Rate Increase (decrease) in expense in FY 2017 $ - $ - $ 0.5 $ (0.4)Increase (decrease) in obligation as of May 31, 2017 $ 0.2 $ (0.2) $ 6.4 $ (5.0)
RPM International Inc. and Subsidiaries 21
Managem
ent’s Discussion and A
nalysis Consolidated Financial Statements N
otes to Consolidated Financial Statements Q
uarterly Stock Price and Dividend Inform
ation Managem
ent’s Report Auditors’ Reports Stockholder Inform
ation

BUSINESS SEGMENT INFORMATION
We changed the composition of our operating and reportable segments in order to reflect management’s view of the operating results for each segment during the quarter ended August 31, 2016. Under our new composition, we made the determination to move a group of businesses serving the industrial flooring, concrete repair and specialty waterproofing markets out of our specialty reportable segment into our Performance Coatings Group operating segment, which better aligns with our management structure and reports through our industrial reportable segment. For the fiscal year ended May 31, 2016, this group of businesses represented less than 1% of our consolidated net sales, income before income taxes and identifiable assets. Information for all periods presented has been recast to reflect this change.
We operate a portfolio of businesses and product lines that manufacture and sell a variety of specialty paints, protective coatings and roofing systems, sealants and adhesives. We manage our portfolio by organizing our businesses and product lines into three reportable segments: the industrial reportable segment, the specialty reportable segment and the consumer reportable segment. Within each reportable segment, we aggregate operating segments or product lines that consist of individual companies or groups of companies and product lines, which generally address common markets, share similar economic characteristics, utilize similar technologies and can share manufacturing or distribution capabilities. Our seven operating segments represent components of our business for which separate financial information is available that is utilized on a regular basis by our chief operating decision maker in determining how to allocate the assets of the company and evaluate performance. These seven operating segments are each managed by an operating segment manager, who is responsible for the day-to-day operating decisions and performance evaluation of the operating segment’s underlying businesses. We evaluate the profit performance of our segments primarily based on income before income taxes, but also look to earnings (loss) before interest and taxes (“EBIT”) as a performance evaluation measure because interest expense is essentially related to acquisitions, as opposed to segment operations.
Our industrial reportable segment products are sold throughout North America and also account for the majority of our international sales. Our industrial product lines are sold directly to contractors, distributors and end-users, such as industrial manufacturing facilities, public institutions and other commercial customers. The industrial reportable segment
comprises three separate operating segments — Tremco Group, tremco illbruck Group and Performance Coatings Group. Products and services within this reportable segment include construction chemicals, roofing systems, weatherproofing and other sealants, and polymer flooring.
Our specialty reportable segment products are sold throughout North America and a few international locations, primarily in Europe. Our specialty product lines are sold directly to contractors, distributors and end-users, such as industrial manufacturing facilities, public institutions and other commercial customers. The specialty reportable segment is a single operating segment, which offers products that include industrial cleaners, restoration services equipment, colorants, exterior finishes, edible coatings and specialty glazes for pharmaceutical and food industries, and other specialty OEM coatings.
Our consumer reportable segment manufactures and markets professional use and do-it-yourself (“DIY”) products for a variety of mainly consumer applications, including home improvement and personal leisure activities. Our consumer segment’s major manufacturing and distribution operations are located primarily in North America, along with a few locations in Europe and other parts of the world. Our consumer reportable segment products are primarily sold directly to mass merchandisers, home improvement centers, hardware stores, paint stores, craft shops, cosmetic companies and through distributors. This reportable segment comprises three operating segments — Rust-Oleum Group, DAP Group and SPG-Consumer Group. Products within this reportable segment include specialty, hobby and professional paints; nail enamels; caulks; adhesives; silicone sealants and wood stains.
In addition to our three reportable segments, there is a category of certain business activities and expenses, referred to as corporate/other, that does not constitute an operating segment. This category includes our corporate headquarters and related administrative expenses, results of our captive insurance companies, gains or losses on the sales of certain assets and other expenses not directly associated with any reportable segment. Assets related to the corporate/other category consist primarily of investments, prepaid expenses and headquarters’ property and equipment. These corporate and other assets and expenses reconcile reportable segment data to total consolidated income before income taxes, interest expense and earnings before interest and taxes.
We reflect income from our joint ventures on the equity method, and receive royalties from our licensees.
RPM International Inc. and Subsidiaries22
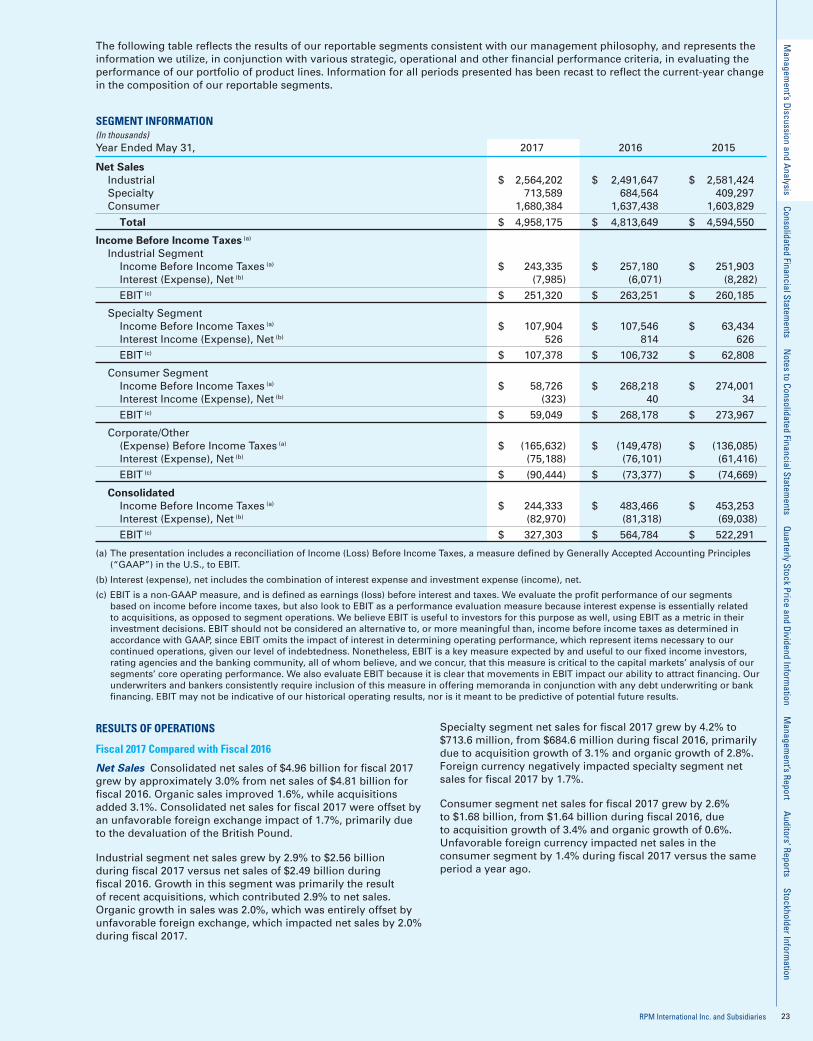
The following table reflects the results of our reportable segments consistent with our management philosophy, and represents the information we utilize, in conjunction with various strategic, operational and other financial performance criteria, in evaluating the performance of our portfolio of product lines. Information for all periods presented has been recast to reflect the current-year change in the composition of our reportable segments.
SEGMENT INFORMATION (In thousands) Year Ended May 31, 2017 2016 2015
Net Sales Industrial $ 2,564,202 $ 2,491,647 $ 2,581,424 Specialty 713,589 684,564 409,297 Consumer 1,680,384 1,637,438 1,603,829
Total $ 4,958,175 $ 4,813,649 $ 4,594,550
Income Before Income Taxes (a)
Industrial Segment Income Before Income Taxes (a) $ 243,335 $ 257,180 $ 251,903 Interest (Expense), Net (b) (7,985) (6,071) (8,282)
EBIT (c) $ 251,320 $ 263,251 $ 260,185
Specialty Segment Income Before Income Taxes (a) $ 107,904 $ 107,546 $ 63,434 Interest Income (Expense), Net (b) 526 814 626
EBIT (c) $ 107,378 $ 106,732 $ 62,808
Consumer Segment Income Before Income Taxes (a) $ 58,726 $ 268,218 $ 274,001 Interest Income (Expense), Net (b) (323) 40 34
EBIT (c) $ 59,049 $ 268,178 $ 273,967
Corporate/Other (Expense) Before Income Taxes (a) $ (165,632) $ (149,478) $ (136,085) Interest (Expense), Net (b) (75,188) (76,101) (61,416)
EBIT (c) $ (90,444) $ (73,377) $ (74,669)
Consolidated Income Before Income Taxes (a) $ 244,333 $ 483,466 $ 453,253 Interest (Expense), Net (b) (82,970) (81,318) (69,038)
EBIT (c) $ 327,303 $ 564,784 $ 522,291
(a) The presentation includes a reconciliation of Income (Loss) Before Income Taxes, a measure defined by Generally Accepted Accounting Principles (“GAAP”) in the U.S., to EBIT.
(b) Interest (expense), net includes the combination of interest expense and investment expense (income), net.
(c) EBIT is a non-GAAP measure, and is defined as earnings (loss) before interest and taxes. We evaluate the profit performance of our segments based on income before income taxes, but also look to EBIT as a performance evaluation measure because interest expense is essentially related to acquisitions, as opposed to segment operations. We believe EBIT is useful to investors for this purpose as well, using EBIT as a metric in their investment decisions. EBIT should not be considered an alternative to, or more meaningful than, income before income taxes as determined in accordance with GAAP, since EBIT omits the impact of interest in determining operating performance, which represent items necessary to our continued operations, given our level of indebtedness. Nonetheless, EBIT is a key measure expected by and useful to our fixed income investors, rating agencies and the banking community, all of whom believe, and we concur, that this measure is critical to the capital markets’ analysis of our segments’ core operating performance. We also evaluate EBIT because it is clear that movements in EBIT impact our ability to attract financing. Our underwriters and bankers consistently require inclusion of this measure in offering memoranda in conjunction with any debt underwriting or bank financing. EBIT may not be indicative of our historical operating results, nor is it meant to be predictive of potential future results.
RESULTS OF OPERATIONS
Fiscal 2017 Compared with Fiscal 2016
Net Sales Consolidated net sales of $4.96 billion for fiscal 2017 grew by approximately 3.0% from net sales of $4.81 billion for fiscal 2016. Organic sales improved 1.6%, while acquisitions added 3.1%. Consolidated net sales for fiscal 2017 were offset by an unfavorable foreign exchange impact of 1.7%, primarily due to the devaluation of the British Pound.
Industrial segment net sales grew by 2.9% to $2.56 billion during fiscal 2017 versus net sales of $2.49 billion during fiscal 2016. Growth in this segment was primarily the result of recent acquisitions, which contributed 2.9% to net sales. Organic growth in sales was 2.0%, which was entirely offset by unfavorable foreign exchange, which impacted net sales by 2.0% during fiscal 2017.
Specialty segment net sales for fiscal 2017 grew by 4.2% to $713.6 million, from $684.6 million during fiscal 2016, primarily due to acquisition growth of 3.1% and organic growth of 2.8%. Foreign currency negatively impacted specialty segment net sales for fiscal 2017 by 1.7%.
Consumer segment net sales for fiscal 2017 grew by 2.6% to $1.68 billion, from $1.64 billion during fiscal 2016, due to acquisition growth of 3.4% and organic growth of 0.6%. Unfavorable foreign currency impacted net sales in the consumer segment by 1.4% during fiscal 2017 versus the same period a year ago.
RPM International Inc. and Subsidiaries 23
Managem
ent’s Discussion and A
nalysis Consolidated Financial Statements N
otes to Consolidated Financial Statements Q
uarterly Stock Price and Dividend Inform
ation Managem
ent’s Report Auditors’ Reports Stockholder Inform
ation

Gross Profit Margin Our consolidated gross profit margin improved slightly to 43.7% of net sales for fiscal 2017 from a consolidated gross profit margin of 43.4% for fiscal 2016. Items favorably impacting our fiscal 2017 gross profit margin versus fiscal 2016 included overall lower manufacturing costs for 0.3% and an approximate impact of 0.4% from price increases recently implemented, particularly in certain international markets where margins had been unfavorably impacted by the strengthening U.S. dollar. Items unfavorably impacting our fiscal 2017 gross profit margin versus fiscal 2016 included the impact of recent acquisitions and associated inventory step-up expense for 0.3%, with the remaining 0.1% impact resulting from unfavorable foreign exchange.
Selling, General and Administrative Expenses (“SG&A”) Our consolidated SG&A expense increased by approximately $122.6 million during fiscal 2017 versus fiscal 2016, and increased to 33.1% of net sales from 31.6% of net sales for fiscal 2016. The main source of the increase was the number of recently acquired companies during the last year, which added approximately $36.2 million to SG&A expense during fiscal 2017. During the second quarter of fiscal 2017, we made the decision to exit the Flowcrete polymer flooring business located in the Middle East. In connection with the decision to exit that business, we determined it was appropriate to reassess the collectibility of accounts receivable, and accordingly, we incurred a loss of $11.4 million for increased bad debt reserves. We also incurred higher severance expense versus the prior year for approximately $23.1 million, which includes $3.6 million in relation to the closing of a European manufacturing facility. Additionally, during fiscal 2017, SG&A increased due to higher compensation, commissions, distribution expense and professional services expense. Warranty expense for the year ended May 31, 2017 increased by approximately $4.2 million from the amount recorded during fiscal 2016, and it is typical that warranty expense will fluctuate from period to period. Partially offsetting those increased expenses was the impact of approximately $0.3 million of unfavorable transactional foreign exchange during fiscal 2017 versus approximately $7.5 million of expense during fiscal 2016. Additionally, SG&A expense during fiscal 2016 was reduced by a $14.5 million reversal of a contingent consideration obligation.
Our industrial segment SG&A increased by approximately $43.8 million for fiscal 2017 versus fiscal 2016, and increased as a percentage of net sales, as well. Recent acquisitions increased SG&A expense during fiscal 2017 in this segment by approximately $19.5 million. During the second quarter of fiscal 2017, we made the decision to exit the Flowcrete polymer flooring business located in the Middle East. In connection with the decision to exit that business, we reassessed the collectibility of accounts receivable, and accordingly, we incurred a loss of $11.4 million for increased bad debt reserves. Additionally, during fiscal 2017, there were increases in compensation, professional services expense and warranty expense. We incurred approximately $16.1 million of higher severance expense during fiscal 2017 versus fiscal 2016. Partially offsetting these increased expenses was the impact of approximately $0.9 million of favorable transactional foreign exchange during fiscal 2017 versus the unfavorable impact of $3.0 million during fiscal 2016.
Our specialty segment SG&A was approximately $7.7 million higher during fiscal 2017 versus fiscal 2016, and was slightly lower as a percentage of net sales. Reflected in the increased expense was higher employee compensation and benefits expense versus fiscal 2016, partially offset by a favorable impact from translational foreign exchange. Recent acquisitions increased SG&A expense during fiscal 2017 in this segment by approximately $5.6 million. Additionally, we incurred severance expense for approximately $3.6 million in relation to the closing of a European manufacturing facility.
Our consumer segment SG&A increased by approximately $54.0 million during fiscal 2017 versus fiscal 2016, and was higher as a percentage of net sales, reflecting higher distribution expense. Recent acquisitions increased SG&A expense during fiscal 2017 in this segment by approximately $11.1 million. Additionally, during fiscal 2017, there was higher compensation and employee benefits expense, higher freight expense, as well as increased professional services expense, some of which related to recent acquisitions, versus fiscal 2016. Additionally, severance expense was approximately $5.0 million higher in fiscal 2017 versus fiscal 2016. Lastly, SG&A expense during fiscal 2016 was reduced by a $14.5 million reversal of a contingent consideration obligation.
SG&A expenses in our corporate/other category of $90.4 million during fiscal 2017 increased by $17.0 million from $73.4 million recorded during fiscal 2016, resulting principally from higher pension expense and acquisition costs incurred during fiscal 2017 versus fiscal 2016.
We recorded total net periodic pension and postretirement benefit costs of $59.1 million and $47.6 million for fiscal 2017 and 2016, respectively. The $11.5 million increase in pension expense resulted from higher service and interest cost of $3.7 million during fiscal 2017 versus fiscal 2016. Additionally, there was an unfavorable impact of approximately $5.8 million and $0.8 million resulting from larger actuarial losses and plan settlements, respectively, recognized during fiscal 2017 versus fiscal 2016. Lastly, during fiscal 2017, the expected return on plan assets was approximately $1.2 million lower than during fiscal 2016.
We expect that pension and postretirement expense will fluctuate on a year-to-year basis, depending primarily upon the investment performance of plan assets and potential changes in interest rates, which may have a material impact on our consolidated financial results in the future. A decrease of 1% in the discount rate or the expected return on plan assets assumptions would result in $8.7 million and $4.8 million higher expense, respectively. The assumptions and estimates used to determine the discount rate and expected return on plan assets are more fully described in Note L, “Pension Plans,” and Note M, “Postretirement Benefits,” to our Consolidated Financial Statements. Further discussion and analysis of the sensitivity surrounding our most critical assumptions under our pension and postretirement plans is discussed on page 21 of this report under, “Critical Accounting Policies and Estimates — Pension and Postretirement Plans.”
Goodwill and Other Intangible Asset Impairments As described in Note B, “Goodwill and Other Intangible Assets,” to the consolidated financial statements, we recorded impairment charges related to a reduction of the carrying value of goodwill and other intangible assets totaling $193.2 million during the year ended May 31, 2017. For additional information, refer to Note B to the consolidated financial statements and the Critical Accounting Policies discussed herein.
Interest Expense Interest expense was $97.0 million for fiscal 2017 versus $91.7 million for fiscal 2016. Higher average borrowings, related to recent acquisitions, increased interest expense during fiscal 2017 by approximately $3.2 million versus fiscal 2016. Excluding acquisition-related borrowings, lower average borrowings year-over-year decreased interest expense by approximately $5.0 million. Higher interest rates, which averaged 4.27% overall for fiscal 2017 compared with 4.11% for fiscal 2016, increased interest expense by approximately $7.1 million during fiscal 2017 versus fiscal 2016.
RPM International Inc. and Subsidiaries24

Investment (Income), Net Net investment income of approximately $14.0 million for fiscal 2017 compares to net investment income of $10.4 million during fiscal 2016. Dividend and interest income totaled $6.2 million and $7.7 million for fiscal 2017 and 2016, respectively. Net realized gains on the sales of investments totaled $8.2 million during fiscal 2017, while those gains were $6.5 million during fiscal 2016. Impairments recognized on securities that management has determined are other-than-temporary declines in value approximated $0.4 million and $3.8 million during fiscal 2017 and 2016, respectively.
Other Expense (Income), Net Other expense of $1.7 million for fiscal 2017 compared with other income of $1.3 million for fiscal 2016. Other expense (income), net includes net royalty expense of approximately $2.7 million for fiscal 2017, while fiscal 2016 net royalty expense was $2.0 million. Also included in this balance is our equity in earnings of unconsolidated affiliates totaling approximately $1.0 million and $2.1 million for fiscal 2017 and 2016, respectively. Additionally, during the fourth quarter of fiscal 2016, we incurred a legal settlement charge of approximately $9.3 million, which was in relation to certain deck coating products. Lastly, during fiscal 2016 we acquired the remaining 51% interest in our Chinese joint venture, Carboline Dalian Paint Production Co., Ltd (“Carboline Dalian”), which increased our ownership to 100%. During the fourth quarter of fiscal 2016, we retained an independent, third-party valuation firm to assist us in determining the fair value of Carboline Dalian, and as proscribed by ASC 805, we recorded a remeasurement gain for approximately $8.0 million during fiscal 2016.
Income Before Income Taxes (“IBT”) Our consolidated pretax income for fiscal 2017 of $244.3 million compares with $483.5 million for fiscal 2016.
Our industrial segment had pretax income of $243.3 million, or 9.5% of net sales, for fiscal 2017, versus pretax income of $257.2 million, or 10.3% of net sales, for fiscal 2016. Our specialty segment had pretax income of $107.9 million, or 15.1% of net sales, for fiscal 2017, versus pretax income of $107.5 million, or 15.7% of net sales, for fiscal 2016. During the first half of fiscal 2018, an edible coatings patent will be expiring in the U.S., and as a result, we currently anticipate the impact of the patent expiration on fiscal 2018 IBT to approximate at least $10.0 million. Our consumer segment pretax income of $58.7 million for fiscal 2017 compares with fiscal 2016 pretax income of $268.2 million, primarily as a result of fiscal 2017 goodwill and other intangible asset impairment charges totaling $193.2 million, as discussed previously.
Income Tax Rate The effective income tax rate was 24.4% for fiscal 2017 compared to an effective income tax rate of 26.1% for fiscal 2016. The decrease in the effective income tax rate is primarily due to a discrete benefit resulting from the adoption of ASU 2016-09, “Improvements to Employee Share-Based Payment Accounting” in the first quarter of fiscal 2017. Refer to Note A(20) - “Other Recent Accounting Pronouncements” for additional discussion regarding adoption of the standard. This benefit was partially offset by a decrease in the domestic manufacturing deduction and the unfavorable impact due to increases in valuation allowances, as compared to fiscal 2016.
Net Income Net income of $184.7 million for the year ended May 31, 2017 compares to net income of $357.5 million for the year ended May 31, 2016. During fiscal 2017 and 2016, we had net income attributable to noncontrolling interests of $2.9 million and $2.7 million, respectively. Net income attributable to RPM International Inc. stockholders for fiscal 2017 was $181.8 million, or 3.7% of consolidated net sales, which compared to net income of $354.7 million, or 7.4% of consolidated net sales for fiscal 2016.
Diluted earnings per share of common stock for the year ended May 31, 2017 of $1.36 compares with diluted earnings per share of common stock of $2.63 for year ended May 31, 2016.
Fiscal 2016 Compared with Fiscal 2015
Net Sales Consolidated net sales of $4.81 billion for fiscal 2016 grew by approximately 4.8% from net sales of $4.59 billion for fiscal 2015. Organic sales improved 2.8%, while acquisitions added 6.7%. Our SPHC businesses, all of which are included in our specialty segment, were reconsolidated as of January 1, 2015. Therefore, year-to-date results through December 2015 for the SPHC group are reflected in fiscal 2016 acquisition growth. Consolidated net sales for fiscal 2016 were offset by an unfavorable foreign exchange impact of 4.7%.
Industrial segment net sales declined by 3.5%, to $2.49 billion for fiscal 2016 versus net sales of $2.58 billion during fiscal 2015. The decline was due to unfavorable foreign exchange, which impacted net sales by 6.6% during fiscal 2016. Many of our international businesses continued to feel the impact of the strengthening of the U.S. dollar against most foreign currencies throughout fiscal 2016. Additionally, there was a continued slowdown during fiscal 2016 in net sales for our industrial segment businesses serving the energy sector. The impact of these unfavorable items was partially offset by organic growth in net sales of 2.5%, which included growth throughout fiscal 2016 in our North American-based industrial companies serving the commercial construction market. Lastly, recent acquisitions contributed 0.6% to net sales during fiscal 2016.
Specialty segment net sales for fiscal 2016 grew by 67.3% to $684.6 million, primarily due to acquisition growth of 67.6%, which includes the reconsolidated SPHC businesses and a few other small product line acquisitions during the year. Organic growth in net sales provided 2.1% to the specialty segment during fiscal 2016, while foreign currency negatively impacted net sales for fiscal 2016 by 2.4%.
Consumer segment net sales for fiscal 2016 grew by 2.1% to $1.64 billion from $1.60 billion during fiscal 2015, primarily reflecting organic growth in sales of 3.3%, which relate to new product introductions and strategic product placements early in the year. The consumer segment benefited from continued strength in the U.S. housing market and sales growth at many of our major retail customers. Despite an overall decline in demand in the nail enamel market year-over-year, we saw growth during the last quarter of fiscal 2016. Acquisitions provided 0.9% growth in net sales for fiscal 2016 in the consumer segment. Foreign currency negatively impacted consumer segment net sales for fiscal 2016 by 2.1%.
Gross Profit Margin Our consolidated gross profit margin improved to 43.4% of net sales for fiscal 2016 from a consolidated gross profit margin of 42.3% for fiscal 2015. The fiscal 2016 improvement reflects a favorable impact from selling price increases of approximately 0.4% and lower manufacturing costs of approximately 1.1% during fiscal 2016 versus fiscal 2015. Unfavorable foreign exchange impacted fiscal 2016 gross profit margin by approximately 0.4%. Foreign exchange had a significant impact upon the costs of sales, since several of our foreign operations pay their suppliers in U.S. dollars. Additionally, although certain petroleum-based raw materials have eased lately, the costs of the raw materials we use are under generally upward pressure, and over the longer term we expect raw materials costs to increase, due to escalating energy and related feedstock costs, increased levels of global demand, and improved levels of supplier pricing discipline.
RPM International Inc. and Subsidiaries 25
Managem
ent’s Discussion and A
nalysis Consolidated Financial Statements N
otes to Consolidated Financial Statements Q
uarterly Stock Price and Dividend Inform
ation Managem
ent’s Report Auditors’ Reports Stockholder Inform
ation

SG&A Our consolidated SG&A expense increased by approximately $98.0 million during fiscal 2016 versus fiscal 2015, and increased to 31.6% of net sales from 31.0% of net sales for fiscal 2015. SG&A for fiscal 2016 reflects overall added expenses recorded by our recently acquired businesses, mainly our recent reconsolidation of SPHC and its subsidiaries, all of which are included in our specialty segment. SG&A expense for fiscal 2016 and 2015 was favorably impacted by the reversal of certain contingent consideration obligations relating to recent acquisitions, and totaled $14.5 million and $29.7 million, respectively. During fiscal 2016, there was also higher employee compensation expense, including commissions on higher sales, as well as increases in advertising, promotional and professional services expense. Warranty expense for fiscal 2016 decreased by $3.8 million from the amount recorded during fiscal 2015, and it is typical that warranty expense will fluctuate from period to period.
Our industrial segment SG&A expense was approximately $19.9 million lower during fiscal 2016 versus fiscal 2015, but slightly higher as a percentage of net sales. This reflects the strengthening of the U.S. dollar versus nearly all foreign currencies, which unfavorably impacted fiscal 2016 industrial segment sales by 6.6%.
Our specialty segment SG&A expense was approximately $92.8 million higher during fiscal 2016 versus fiscal 2015, and higher as a percentage of net sales, primarily reflecting the recent reconsolidation of SPHC and its subsidiaries, as well as a few small product line acquisitions.
Our consumer segment SG&A expense was $26.4 million higher during fiscal 2016 versus fiscal 2015, and it was also slightly higher as a percentage of net sales, reflecting higher advertising and promotional expense during fiscal 2016 versus fiscal 2015. Consumer segment SG&A expense for fiscal 2016 and 2015 was favorably impacted by the reversal of certain contingent consideration obligations relating to recent acquisitions, and totaled $14.5 million and $29.7 million, respectively.
SG&A expenses in our corporate/other category of $73.4 million during fiscal 2016 was slightly lower versus $74.7 million during fiscal 2015, reflecting favorable experience in benefit costs.
We recorded total net periodic pension and postretirement benefit costs of $47.6 million and $48.2 million for fiscal 2016 and 2015, respectively. The $0.6 million decrease in pension expense was primarily the result of lower service and interest cost of $2.8 million during fiscal 2016 versus fiscal 2015 combined with a favorable impact of $0.4 million from larger returns on higher plan asset levels during fiscal 2016. The reduction in service and interest cost also impacted deferred actuarial losses to be amortized in future periods. Partially offsetting those reductions in costs was an unfavorable impact of approximately $2.6 million resulting from larger actuarial losses recognized during fiscal 2016 versus fiscal 2015. During fiscal 2016, we elected to change our approach in estimating the service and interest cost components of net periodic benefit expense by applying the split discount rate approach, which reduced pension expense for fiscal 2016 by approximately $6.4 million.
Interest Expense Interest expense was $91.7 million for fiscal 2016 versus $87.6 million for fiscal 2015. Included in interest expense in fiscal 2015 was a $4.0 million make-whole payment related to the early redemption of our 6.7% Senior Notes. Higher average borrowings increased interest expense during fiscal 2016 by approximately $4.6 million versus fiscal 2015. Our average borrowings were higher due to recent acquisitions, primarily from our $450.0 million payment to the 524(g) trust for the reconsolidation of SPHC, which was paid in December 2014. The payment was funded from our New Revolving Credit Facility and AR Program, part of which was ultimately replaced with a 30-year bond issued in May 2015. Despite the decrease
in interest rates, which averaged 4.11% overall for fiscal 2016 compared with 4.26% for fiscal 2015, interest expense increased by approximately $3.5 million due to the overall higher average borrowings outstanding during fiscal 2016 versus fiscal 2015.
Investment (Income), Net Net investment income of approximately $10.4 million for fiscal 2016 compares to net investment income of $18.6 million during fiscal 2015. Dividend and interest income totaled $7.7 million and $9.9 million during fiscal 2016 and 2015, respectively. Net realized gains on the sales of investments totaled $6.5 million during fiscal 2016, while those gains were $8.7 million during fiscal 2015. Impairments recognized on securities that management has determined are other-than-temporary declines in value totaled $3.8 million during fiscal 2016, compared with $0.02 million of such losses recorded during fiscal 2015.
Other Expense (Income), Net Other expense of $1.3 million for fiscal 2016 compared with other income of $3.9 million for fiscal 2015. Items reflected in this balance include net royalty expense of $2.0 million for fiscal 2016 and net royalty income of $1.9 million during fiscal 2015. Also included in this balance is our equity in earnings of unconsolidated affiliates totaling approximately $2.1 million and $2.0 million for fiscal 2016 and 2015, respectively. Additionally, during the fourth quarter of fiscal 2016, we incurred a legal settlement charge of approximately $9.3 million, which was in relation to certain deck coating products. Lastly, during fiscal 2016 we acquired the remaining 51% interest in our Chinese joint venture, Carboline Dalian Paint Production Co., Ltd (“Carboline Dalian”), which increased our ownership to 100%. During the fourth quarter of fiscal 2016, we retained an independent, third-party valuation firm to assist us in determining the fair value of Carboline Dalian. Under ASC 805, a step up to fair value is required when an equity interest changes from a non-controlling interest to a controlling interest. Based on the step up from our 49% to a 100% interest in Carboline Dalian, we recorded a remeasurement gain for approximately $8.0 million during fiscal 2016.
IBT Our consolidated pretax income for fiscal 2016 of $483.5 million compares with $453.3 million for fiscal 2015.
Our industrial segment had IBT of $257.2 million, or 10.3% of industrial net sales, for fiscal 2016, versus IBT of $251.9 million, or 9.8% of industrial net sales, for fiscal 2015. Our industrial segment experienced the continuing impact of unfavorable foreign exchange. Our specialty segment had IBT of $107.5 million, or 15.7% of net sales, during fiscal 2016, versus IBT of $63.4 million, or 15.5% of net sales, for fiscal 2015. Our consumer segment IBT increased to $268.2 million, or 16.4% of net sales for fiscal 2016, compared with $274.0 million, or 17.1% of net sales, for fiscal 2015.
Income Tax Rate The effective income tax rate was 26.1% for fiscal 2016 compared to an effective income tax rate of 49.6% for fiscal 2015. The decrease in the effective tax rate from fiscal 2015 to fiscal 2016 was primarily attributable to a fiscal 2015 deferred income tax charge of $106.2 million for the estimated tax cost associated with unremitted foreign earnings not considered to be permanently reinvested. The comparable provision amount in fiscal 2016 is a benefit of $3.7 million.
RPM International Inc. and Subsidiaries26

Net Income Net income of $357.5 million for fiscal 2016 compares to net income of $228.3 million for fiscal 2015. During fiscal 2016, we elected to change our approach in estimating the service and interest cost components of net periodic benefit cost by applying the split discount rate approach, which resulted in an increase in net income of approximately $4.7 million. During fiscal 2016, we recognized net income attributable to noncontrolling interests of $2.7 million versus net loss attributable to noncontrolling interests of $11.2 million during fiscal 2015. The loss from noncontrolling interests during fiscal 2015 resulted from the $106.2 million tax charge for the potential repatriation of foreign earnings. Net income attributable to RPM International Inc. stockholders for fiscal 2016 was $354.7 million, which compared to net income of $239.5 million for fiscal 2015.
Diluted earnings per share of common stock for fiscal 2016 of $2.63 compares with diluted earnings per share of common stock of $1.78 for fiscal 2015. As discussed above, we changed our approach in estimating the service and interest cost components of net periodic benefit expense, which resulted in an increase in diluted earnings per share of $0.03 during fiscal 2016.
LIQUIDITY AND CAPITAL RESOURCES
Operating Activities
Fiscal 2017 Compared with Fiscal 2016
Approximately $386.1 million of cash was provided by operating activities during fiscal 2017, compared with $474.7 million during fiscal 2016.
The net change in cash from operations includes the change in net income, which decreased by $172.8 million during fiscal 2017 versus fiscal 2016. Current-year net income included the goodwill and other intangible asset impairment charges of $193.2 million ($132.2 million after tax), as well as $12.3 million in charges related to the decision to exit the Flowcrete polymer flooring business in the Middle East and $4.2 million in charges related to the closure of a European manufacturing facility. Changes in working capital accounts and all other accruals used approximately $147.1 million more cash flow during fiscal 2017 versus fiscal 2016.
The change in accounts receivable during fiscal 2017 used approximately $18.9 million less cash than during fiscal 2016. Days sales outstanding (“DSO”) at May 31, 2017 decreased to 56.6 days from 57.7 days sales outstanding at May 31, 2016.
During fiscal 2017, we spent approximately $53.0 million more cash for inventory purchases compared to our spending during fiscal 2016. This resulted from the combination of timing of purchases by retail customers, the building of additional inventory to service customers’ needs and also geographic expansion. Days of inventory outstanding at May 31, 2017 increased to 85.5 days from 79.2 days of inventory outstanding at May 31, 2016.
The change in accounts payable during fiscal 2017 provided approximately $22.2 million more cash than fiscal 2016, resulting principally from the timing of certain payments. Accrued compensation and benefits used approximately $22.3 million more cash during fiscal 2017 versus fiscal 2016, due to higher bonus payouts made during fiscal 2017 versus fiscal 2016. Other accruals and prepaids, including those for other short-term and long-term items and changes in accrued loss reserves, used $101.8 million more cash during fiscal 2017 versus fiscal 2016, primarily from the timing of pension plan contributions and upfront funds used for long-term customer contracts.
Fiscal 2016 Compared with Fiscal 2015
Approximately $474.7 million of cash was provided by operating activities during fiscal 2016, compared with $330.4 million of cash provided by operating activities during fiscal 2015. Net income increased by $129.1 million during fiscal 2016 versus fiscal 2015, primarily reflecting the $106.2 million tax charge taken during fiscal 2015 for the estimated future tax cost of repatriating undistributed foreign earnings. Other items impacting the net change in cash from operations were items adjusting net income for non-cash expenses and income, which increased by $53.7 million during fiscal 2016 versus fiscal 2015. Changes in working capital accounts and all other accruals provided approximately $68.9 million more cash flow during fiscal 2016 than fiscal 2015.
The change in accounts receivable during fiscal 2016 used approximately $65.6 million less cash than fiscal 2015, which resulted primarily from the timing of sales and collections on accounts receivable during fiscal 2015. During fiscal 2016, we also experienced an increase in foreign sales and receivables from our expansion into places such as the Middle East and Far East, which typically have longer collection periods, versus fiscal 2015. Days sales outstanding at May 31, 2016 decreased to 57.7 days from 60.0 days sales outstanding at May 31, 2015. Inventory balances used $13.6 million less cash during fiscal 2016 versus fiscal 2015, which resulted from the timing of purchases by retail customers. Days of inventory outstanding at May 31, 2016 increased to 79.2 days from 78.4 days of inventory outstanding at May 31, 2015. The change in accounts payable during fiscal 2016 versus fiscal 2015 used approximately $10.2 million less cash, resulting from a change in the timing of certain payments. Accrued compensation and benefits provided approximately $19.0 million more cash during fiscal 2016 versus fiscal 2015, due to higher bonus accruals made during fiscal 2016 versus fiscal 2015. Other accruals and prepaids, including those for other short-term and long-term items and changes, used $64.8 million more cash during fiscal 2016 versus fiscal 2015, primarily from the timing of pension plan contributions and upfront funds used for long-term customer contracts.
Cash provided from operations, along with the use of available credit lines, as required, remain our primary sources of liquidity.
Investing Activities
Capital expenditures, other than for ordinary repairs and replacements, are made to accommodate our continued growth to achieve production and distribution efficiencies, expand capacity, introduce new technology, improve environmental health and safety capabilities, improve information systems, and enhance our administration capabilities. During fiscal 2017, we paid $254.2 million for acquisitions, net of cash acquired, versus $52.0 million during fiscal 2016. Capital expenditures of $126.1 million during fiscal 2017 compared with depreciation of $71.9 million. During fiscal 2016, capital expenditures of $117.2 million compared with depreciation of $66.7 million. During fiscal 2015, capital expenditures of $85.4 million compared with depreciation of $62.2 million. We increased our current production capacity in our consumer segment during fiscal 2017, specifically with regard to our DAP operating segment, to meet our needs based on anticipated growth rates. Besides those capacity additions, we have increased our capital spending in fiscal 2017 in an effort to more aggressively invest in our internal growth initiatives, especially in overseas markets. We anticipate that additional shifts at our production facilities, coupled with the capacity added through acquisition activity and our planned increase in future capital spending levels, will enable us to meet increased demand into fiscal 2018 and beyond.
RPM International Inc. and Subsidiaries 27
Managem
ent’s Discussion and A
nalysis Consolidated Financial Statements N
otes to Consolidated Financial Statements Q
uarterly Stock Price and Dividend Inform
ation Managem
ent’s Report Auditors’ Reports Stockholder Inform
ation

Our captive insurance companies invest their excess cash in marketable securities in the ordinary course of conducting their operations, and this activity will continue. Differences in the amounts related to these activities on a year-over-year basis are primarily attributable to differences in the timing and performance of their investments balanced against amounts required to satisfy claims. At May 31, 2017, the fair value of our investments in marketable securities totaled $164.5 million, of which investments with a fair value of $60.0 million were in an unrealized loss position. At May 31, 2016, the fair value of our investments in marketable securities totaled $147.0 million, of which investments with a fair value of $89.4 million were in an unrealized loss position. The fair value of our portfolio of marketable securities is based on quoted market prices for identical, or similar, instruments in active or non-active markets or model-derived-valuations with observable inputs. We have no marketable securities whose fair value is subject to unobservable inputs. Total pretax unrealized losses recorded in accumulated other comprehensive income at May 31, 2017 and May 31, 2016 were $3.5 million and $10.2 million, respectively.
We regularly review our marketable securities in unrealized loss positions in order to determine whether or not we have the ability and intent to hold these investments. That determination is based upon the severity and duration of the decline, in addition to our evaluation of the cash flow requirements of our businesses. Unrealized losses at May 31, 2017 were generally related to the normal volatility in valuations over the past several months for a portion of our portfolio of investments in marketable securities. The unrealized losses generally relate to investments whose fair values at May 31, 2017 were less than 15% below their original cost or that have been in a loss position for less than six consecutive months. From time to time, we may experience significant volatility in general economic and market conditions. If we were to experience unrealized losses that were to continue for longer periods of time, or arise to more significant levels of unrealized losses within our portfolio of investments in marketable securities in the future, we may recognize additional other-than-temporary impairment losses. Such potential losses could have a material impact on our results of operations in any given reporting period. As such, we continue to closely evaluate the status of our investments and our ability and intent to hold these investments.
As of May 31, 2017, approximately $278.8 million of our consolidated cash and cash equivalents were held at various foreign subsidiaries, compared with approximately $243.8 million as of May 31, 2016. Undistributed earnings held at our foreign subsidiaries that are considered permanently reinvested will be used, for instance, to expand operations organically or for acquisitions in foreign jurisdictions. Further, our operations in the U.S. generate sufficient cash flow to satisfy U.S. operating requirements. Refer to Note F, “Income Taxes,” to the Consolidated Financial Statements for additional information regarding unremitted foreign earnings.
Financing Activities
Our available liquidity, including our cash and cash equivalents and amounts available under our committed credit facilities, stood at $1.15 billion at May 31, 2017, compared with $1.06 billion at May 31, 2016. Our debt-to-capital ratio was 59.3% at May 31, 2017, compared with 54.4% at May 31, 2016.
5.250% Notes due 2045 and 3.750% Notes due 2027
On March 2, 2017, we issued $50.0 million aggregate principal amount of 5.250% Notes due 2045 (the “2045 Notes”) and $400.0 million aggregate principal amount of 3.750% Notes due 2027 (the “2027 Notes”). The 2045 Notes are a further issuance of the $250 million aggregate principal amount of 5.250% Notes due 2045 initially issued by us on May 29, 2015. Interest on the 2045 Notes accrues from December 1, 2016 and is payable semiannually in arrears on June 1st and December 1st of each year, beginning June 1, 2017, at a rate of 5.250% per year.
The 2045 Notes mature on June 1, 2045. Interest on the 2027 Notes accrues from March 2, 2017 and is payable semiannually in arrears on March 15th and September 15th of each year, beginning September 15, 2017, at a rate of 3.750% per year. The 2027 Notes mature on March 15, 2027. The indenture governing this indebtedness includes cross-acceleration provisions. Under certain circumstances, where an event of default under our other instruments results in acceleration of the indebtedness under such instruments, holders of the indebtedness under the indenture are entitled to declare amounts outstanding immediately due and payable.
Revolving Credit Agreement
During fiscal 2015, we entered into an $800.0 million unsecured syndicated revolving credit facility (the “New Revolving Credit Facility”), which expires on December 5, 2019. The New Revolving Credit Facility replaced our prior $600.0 million revolving credit facility.
The New Revolving Credit Facility includes sublimits for the issuance of swingline loans, which are comparatively short-term loans used for working capital purposes and letters of credit. The aggregate maximum principal amount of the commitments under the New Revolving Credit Facility may be expanded upon our request, subject to certain conditions, up to $1.0 billion. The New Revolving Credit Facility is available to refinance existing indebtedness, to finance working capital and capital expenditures, to satisfy all or a portion of our obligations relating to the plan of reorganization for our SPHC subsidiary, and for general corporate purposes.
The New Revolving Credit Facility requires us to comply with various customary affirmative and negative covenants, including a leverage covenant and interest coverage ratio, which are calculated in accordance with the terms as defined by the credit agreement. Under the terms of the leverage covenant, we may not permit our consolidated indebtedness as of any fiscal quarter end to exceed 65% of the sum of such indebtedness and our consolidated shareholders’ equity on such date. The minimum required consolidated interest coverage ratio for EBITDA to interest expense is 3.50 to 1. The interest coverage ratio is calculated at the end of each fiscal quarter for the four fiscal quarters then ended using an EBITDA as defined in the credit agreement.
As of May 31, 2017, we were in compliance with all financial covenants contained in our New Revolving Credit Facility, including the leverage and interest coverage ratio covenants. At that date, our leverage ratio was 58.1%, while our interest coverage ratio was 9.2 to 1. Our available liquidity under our New Revolving Credit Facility stood at $599.1 million at May 31, 2017.
Our access to funds under our New Revolving Credit Facility is dependent on the ability of the financial institutions that are parties to the New Revolving Credit Facility to meet their funding commitments. Those financial institutions may not be able to meet their funding commitments if they experience shortages of capital and liquidity or if they experience excessive volumes of borrowing requests within a short period of time. Moreover, the obligations of the financial institutions under our New Revolving Credit Facility are several and not joint and, as a result, a funding default by one or more institutions does not need to be made up by the others.
As previously reported, during fiscal 2015, a plan of reorganization was confirmed (the “Bankruptcy Plan”) and, effective as of December 23, 2014, Bondex, SPHC, Republic and NMBFiL emerged from bankruptcy. Accordingly, trusts were established under Section 524(g) of the United States Bankruptcy Code (together, the “Trust”) and were funded with first installments. Borrowings under our New Revolving Credit Facility were used to fund the initial trust payment of $450 million, which is classified as long-term debt in our
RPM International Inc. and Subsidiaries28
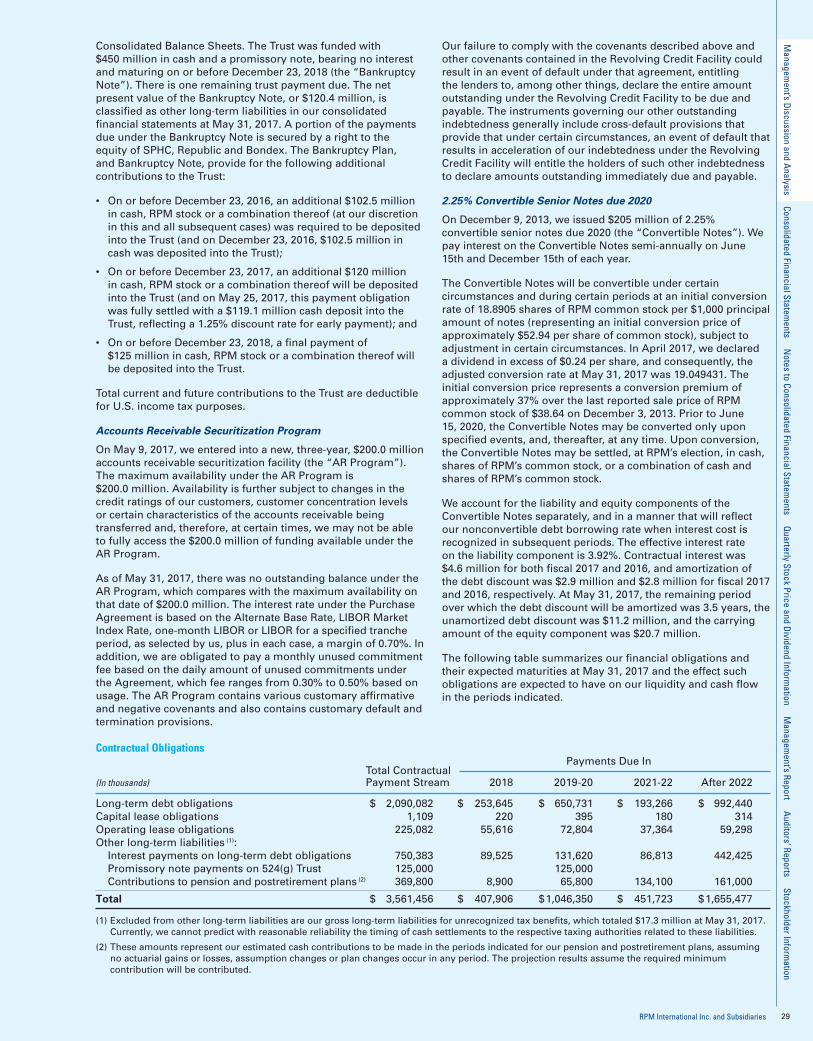
Consolidated Balance Sheets. The Trust was funded with $450 million in cash and a promissory note, bearing no interest and maturing on or before December 23, 2018 (the “Bankruptcy Note”). There is one remaining trust payment due. The net present value of the Bankruptcy Note, or $120.4 million, is classified as other long-term liabilities in our consolidated financial statements at May 31, 2017. A portion of the payments due under the Bankruptcy Note is secured by a right to the equity of SPHC, Republic and Bondex. The Bankruptcy Plan, and Bankruptcy Note, provide for the following additional contributions to the Trust:
• On or before December 23, 2016, an additional $102.5 million in cash, RPM stock or a combination thereof (at our discretion in this and all subsequent cases) was required to be deposited into the Trust (and on December 23, 2016, $102.5 million in cash was deposited into the Trust);
• On or before December 23, 2017, an additional $120 million in cash, RPM stock or a combination thereof will be deposited into the Trust (and on May 25, 2017, this payment obligation was fully settled with a $119.1 million cash deposit into the Trust, reflecting a 1.25% discount rate for early payment); and
• On or before December 23, 2018, a final payment of $125 million in cash, RPM stock or a combination thereof will be deposited into the Trust.
Total current and future contributions to the Trust are deductible for U.S. income tax purposes.
Accounts Receivable Securitization Program
On May 9, 2017, we entered into a new, three-year, $200.0 million accounts receivable securitization facility (the “AR Program”). The maximum availability under the AR Program is $200.0 million. Availability is further subject to changes in the credit ratings of our customers, customer concentration levels or certain characteristics of the accounts receivable being transferred and, therefore, at certain times, we may not be able to fully access the $200.0 million of funding available under the AR Program.
As of May 31, 2017, there was no outstanding balance under the AR Program, which compares with the maximum availability on that date of $200.0 million. The interest rate under the Purchase Agreement is based on the Alternate Base Rate, LIBOR Market Index Rate, one-month LIBOR or LIBOR for a specified tranche period, as selected by us, plus in each case, a margin of 0.70%. In addition, we are obligated to pay a monthly unused commitment fee based on the daily amount of unused commitments under the Agreement, which fee ranges from 0.30% to 0.50% based on usage. The AR Program contains various customary affirmative and negative covenants and also contains customary default and termination provisions.
Our failure to comply with the covenants described above and other covenants contained in the Revolving Credit Facility could result in an event of default under that agreement, entitling the lenders to, among other things, declare the entire amount outstanding under the Revolving Credit Facility to be due and payable. The instruments governing our other outstanding indebtedness generally include cross-default provisions that provide that under certain circumstances, an event of default that results in acceleration of our indebtedness under the Revolving Credit Facility will entitle the holders of such other indebtedness to declare amounts outstanding immediately due and payable.
2.25% Convertible Senior Notes due 2020
On December 9, 2013, we issued $205 million of 2.25% convertible senior notes due 2020 (the “Convertible Notes”). We pay interest on the Convertible Notes semi-annually on June 15th and December 15th of each year.
The Convertible Notes will be convertible under certain circumstances and during certain periods at an initial conversion rate of 18.8905 shares of RPM common stock per $1,000 principal amount of notes (representing an initial conversion price of approximately $52.94 per share of common stock), subject to adjustment in certain circumstances. In April 2017, we declared a dividend in excess of $0.24 per share, and consequently, the adjusted conversion rate at May 31, 2017 was 19.049431. The initial conversion price represents a conversion premium of approximately 37% over the last reported sale price of RPM common stock of $38.64 on December 3, 2013. Prior to June 15, 2020, the Convertible Notes may be converted only upon specified events, and, thereafter, at any time. Upon conversion, the Convertible Notes may be settled, at RPM’s election, in cash, shares of RPM’s common stock, or a combination of cash and shares of RPM’s common stock.
We account for the liability and equity components of the Convertible Notes separately, and in a manner that will reflect our nonconvertible debt borrowing rate when interest cost is recognized in subsequent periods. The effective interest rate on the liability component is 3.92%. Contractual interest was $4.6 million for both fiscal 2017 and 2016, and amortization of the debt discount was $2.9 million and $2.8 million for fiscal 2017 and 2016, respectively. At May 31, 2017, the remaining period over which the debt discount will be amortized was 3.5 years, the unamortized debt discount was $11.2 million, and the carrying amount of the equity component was $20.7 million.
The following table summarizes our financial obligations and their expected maturities at May 31, 2017 and the effect such obligations are expected to have on our liquidity and cash flow in the periods indicated.
Contractual Obligations
Total Contractual Payments Due In
(In thousands) Payment Stream 2018 2019-20 2021-22 After 2022
Long-term debt obligations $ 2,090,082 $ 253,645 $ 650,731 $ 193,266 $ 992,440Capital lease obligations 1,109 220 395 180 314Operating lease obligations 225,082 55,616 72,804 37,364 59,298Other long-term liabilities (1): Interest payments on long-term debt obligations 750,383 89,525 131,620 86,813 442,425 Promissory note payments on 524(g) Trust 125,000 125,000 Contributions to pension and postretirement plans (2) 369,800 8,900 65,800 134,100 161,000
Total $ 3,561,456 $ 407,906 $ 1,046,350 $ 451,723 $ 1,655,477
(1) Excluded from other long-term liabilities are our gross long-term liabilities for unrecognized tax benefits, which totaled $17.3 million at May 31, 2017. Currently, we cannot predict with reasonable reliability the timing of cash settlements to the respective taxing authorities related to these liabilities.
(2) These amounts represent our estimated cash contributions to be made in the periods indicated for our pension and postretirement plans, assuming no actuarial gains or losses, assumption changes or plan changes occur in any period. The projection results assume the required minimum contribution will be contributed.
RPM International Inc. and Subsidiaries 29
Managem
ent’s Discussion and A
nalysis Consolidated Financial Statements N
otes to Consolidated Financial Statements Q
uarterly Stock Price and Dividend Inform
ation Managem
ent’s Report Auditors’ Reports Stockholder Inform
ation

The U.S. dollar fluctuated throughout the year, and was stronger against other major currencies where we conduct operations at the fiscal year end versus the previous year end, causing an unfavorable change in the accumulated other comprehensive income (loss) (refer to Note I to the Consolidated Financial Statements) component of stockholders’ equity of $(17.2) million this year versus an unfavorable change of $(59.6) million last year. The change in fiscal 2017 was in addition to favorable net changes of $41.5 million and $3.7 million related to adjustments required for minimum pension and other postretirement liabilities and unrealized gains on securities, respectively.
Off-Balance Sheet Arrangements
We do not have any off-balance sheet financings, other than the minimum operating lease commitments included in the above Contractual Obligations table and further described in Note K, “Leases,” to the Consolidated Financial Statements. We have no subsidiaries that are not included in our financial statements, nor do we have any interests in, or relationships with, any special purpose entities that are not reflected in our financial statements.
QUALITATIVE AND QUANTITATIVE DISCLOSURES ABOUT MARKET RISK
We are exposed to market risk from changes in interest rates and foreign currency exchange rates because we fund our operations through long- and short-term borrowings and denominate our business transactions in a variety of foreign currencies. We utilize a sensitivity analysis to measure the potential loss in earnings based on a hypothetical 1% increase in interest rates and a 10% change in foreign currency rates. A summary of our primary market risk exposures follows.
Interest Rate Risk
Our primary interest rate risk exposure results from our floating rate debt, including various revolving and other lines of credit (refer to Note E, “Borrowings,” to the Consolidated Financial Statements). At May 31, 2017, approximately 9.62% of our debt was subject to floating interest rates.
If interest rates were to increase 100 bps from May 31, 2017 and, assuming no changes in debt from the May 31, 2017 levels, the additional annual interest expense would amount to approximately $2.0 million on a pretax basis. A similar increase in interest rates in fiscal 2016 would have resulted in approximately $2.0 million in additional interest expense.
All derivative instruments are recognized on the balance sheet and measured at fair value. Changes in the fair values of derivative instruments that do not qualify as hedges and/or any ineffective portion of hedges are recognized as a gain or loss in our Consolidated Statement of Income in the current period. Changes in the fair value of derivative instruments used effectively as fair value hedges are recognized in earnings (losses), along with the change in the value of the hedged item. Such derivative transactions are accounted for in accordance with Accounting Standards Codification (“ASC”) 815, “Derivatives and Hedging.” We do not hold or issue derivative instruments for speculative purposes.
Foreign Currency Risk
Our foreign sales and results of operations are subject to the impact of foreign currency fluctuations (refer to Note A, “Summary of Significant Accounting Policies,” to the Consolidated Financial Statements). Because our Consolidated Financial Statements are presented in U.S. dollars, increases or decreases in the value of the U.S. dollar relative to other currencies in which we transact business could materially adversely affect our net revenues, net income and the carrying values of our assets located outside the U.S. Global economic uncertainty continues to exist. Strengthening of the U.S. dollar
relative to other currencies may adversely affect our operating results. However, our foreign debt is denominated in the respective foreign currency, thereby eliminating any related translation impact on earnings.
If the U.S. dollar were to strengthen, our foreign results of operations would be unfavorably impacted, but the effect is not expected to be material. A 10% change in foreign currency exchange rates would not have resulted in a material impact to net income for the years ended May 31, 2017 and 2016. We do not currently use financial derivative instruments for trading purposes, nor do we engage in foreign currency, commodity or interest rate speculation.
FORWARD-LOOKING STATEMENTS
The foregoing discussion includes forward-looking statements relating to our business. These forward-looking statements, or other statements made by us, are made based on our expectations and beliefs concerning future events impacting us and are subject to uncertainties and factors (including those specified below), which are difficult to predict and, in many instances, are beyond our control. As a result, our actual results could differ materially from those expressed in or implied by any such forward-looking statements. These uncertainties and factors include (a) global markets and general economic conditions, including uncertainties surrounding the volatility in financial markets, the availability of capital and the effect of changes in interest rates, and the viability of banks and other financial institutions; (b) the prices, supply and capacity of raw materials, including assorted pigments, resins, solvents, and other natural gas- and oil-based materials; packaging, including plastic containers; and transportation services, including fuel surcharges; (c) continued growth in demand for our products; (d) legal, environmental and litigation risks inherent in our construction and chemicals businesses and risks related to the adequacy of our insurance coverage for such matters; (e) the effect of changes in interest rates; (f) the effect of fluctuations in currency exchange rates upon our foreign operations; (g) the effect of non-currency risks of investing in and conducting operations in foreign countries, including those relating to domestic and international political, social, economic and regulatory factors; (h) risks and uncertainties associated with our ongoing acquisition and divestiture activities; (i) risks related to the adequacy of our contingent liability reserves; and (j) other risks detailed in our filings with the Securities and Exchange Commission, including the risk factors set forth in our Annual Report on Form 10-K for the year ended May 31, 2017, as the same may be updated from time to time. We do not undertake any obligation to publicly update or revise any forward-looking statements to reflect future events, information or circumstances that arise after the filing date of this document.
RPM International Inc. and Subsidiaries30

May 31, 2017 2016
Assets Current Assets Cash and cash equivalents $ 350,497 $ 265,152 Trade accounts receivable (less allowances of $44,138 and $24,600, respectively) 995,330 963,092 Inventories 788,197 685,818 Prepaid expenses and other current assets 263,412 221,286
Total current assets 2,397,436 2,135,348
Property, Plant and Equipment, at Cost 1,484,579 1,344,830 Allowance for depreciation (741,893) (715,377)
Property, plant and equipment, net 742,686 629,453
Other Assets Goodwill 1,143,913 1,219,630 Other intangible assets, net of amortization 573,092 575,401 Deferred income taxes 19,793 19,771 Other 213,529 185,366
Total other assets 1,950,327 2,000,168
Total Assets $ 5,090,449 $ 4,764,969
Liabilities and Stockholders’ EquityCurrent Liabilities Accounts payable $ 534,718 $ 500,506 Current portion of long-term debt 253,645 4,713 Accrued compensation and benefits 181,084 183,768 Accrued losses 31,735 35,290 Other accrued liabilities 234,212 277,914
Total current liabilities 1,235,394 1,002,191
Long-Term Liabilities Long-term debt, less current maturities 1,836,437 1,635,260 Other long-term liabilities 482,491 702,979 Deferred income taxes 97,427 49,791
Total long-term liabilities 2,416,355 2,388,030
Commitments and contingencies (Note N) Stockholders’ Equity Preferred stock, par value $0.01; authorized 50,000 shares; none issued Common stock, par value $0.01; authorized 300,000 shares; issued 141,242 and outstanding 133,563 as of May 2017; issued 140,195 and outstanding 132,944 as of May 2016 1,336 1,329 Paid-in capital 954,491 921,956 Treasury stock, at cost (218,222) (196,274) Accumulated other comprehensive (loss) (473,986) (502,047) Retained earnings 1,172,442 1,147,371
Total RPM International Inc. stockholders’ equity 1,436,061 1,372,335Noncontrolling Interest 2,639 2,413
Total equity 1,438,700 1,374,748
Total Liabilities and Stockholders’ Equity $ 5,090,449 $ 4,764,969
Consolidated Financial Statements
CONSOLIDATED BALANCE SHEETS (In thousands, except per share amounts)
The accompanying Notes to Consolidated Financial Statements are an integral part of these statements.
RPM International Inc. and Subsidiaries 31
Managem
ent’s Discussion and A
nalysis Consolidated Financial Statements N
otes to Consolidated Financial Statements Q
uarterly Stock Price and Dividend Inform
ation Managem
ent’s Report Auditors’ Reports Stockholder Inform
ation

The accompanying Notes to Consolidated Financial Statements are an integral part of these statements.
Year Ended May 31, 2017 2016 2015
Net Sales $ 4,958,175 $ 4,813,649 $ 4,594,550Cost of Sales 2,792,487 2,726,601 2,653,181
Gross Profit 2,165,688 2,087,048 1,941,369Selling, General and Administrative Expenses 1,643,520 1,520,977 1,422,944Goodwill and Other Intangible Asset Impairments 193,198 Interest Expense 96,954 91,683 87,615Investment (Income), Net (13,984) (10,365) (18,577)Other Expense (Income), Net 1,667 1,287 (3,866)
Income Before Income Taxes 244,333 483,466 453,253Provision for Income Taxes 59,662 126,008 224,925
Net Income 184,671 357,458 228,328Less: Net Income (Loss) Attributable to Noncontrolling Interests 2,848 2,733 (11,156)
Net Income Attributable to RPM International Inc. Stockholders $ 181,823 $ 354,725 $ 239,484
Average Number of Shares of Common Stock Outstanding: Basic 130,662 129,383 129,933 Diluted 135,165 136,716 134,893Earnings per Share of Common Stock Attributable to RPM International Inc. Stockholders: Basic $ 1.37 $ 2.70 $ 1.81 Diluted $ 1.36 $ 2.63 $ 1.78Cash Dividends Declared per Share of Common Stock $ 1.175 $ 1.085 $ 1.020
Year Ended May 31, 2017 2016 2015
Net Income $ 184,671 $ 357,458 $ 228,328Other Comprehensive Income, Before Tax: Foreign Currency Translation Adjustments (20,402) (65,607) (222,255) Pension and Other Postretirement Benefit Liabilities Net (Loss) Gain Arising During the Period 38,679 (83,770) (34,949) Prior Service Cost Arising During the Period 196 349 - Less: Amortization of Prior Service Cost Included in Net Periodic Pension Cost (41) (6) 86 Less: Amortization of Net Loss and Settlement Recognition 25,444 18,898 16,149 Effect of Exchange Rates on Amounts Included for Pensions 1,986 2,009 8,842
Pension and Other Postretirement Benefit Liability Adjustments 66,264 (62,520) (9,872) Unrealized Gains on Available-For-Sale Securities Unrealized Holding (Losses) Gains During the Period 8,250 (9,049) (2,025) Less: Reclassification Adjustments for (Gains) Included in Net Income (2,248) (2,793) (6,068)
Unrealized Gain (Loss) on Securities 6,002 (11,842) (8,093) Unrealized (Loss) on Derivatives 16 - (946)
Other Comprehensive (Loss) Income, Before Tax 51,880 (139,969) (241,166)Income Tax Expense (Benefit) Related to Components of Other Comprehensive Income (23,863) 32,030 8,927
Other Comprehensive (Loss) Income, After Tax 28,017 (107,939) (232,239)
Comprehensive (Loss) Income 212,688 249,519 (3,911)Less: Comprehensive (Loss) Income Attributable to Noncontrolling Interests 2,804 2,706 (15,742)
Comprehensive Income Attributable to RPM International Inc. Stockholders $ 209,884 $ 246,813 $ 11,831
CONSOLIDATED STATEMENTS OF INCOME (In thousands, except per share amounts)
CONSOLIDATED STATEMENTS OF COMPREHENSIVE INCOME (In thousands)
RPM International Inc. and Subsidiaries32

Year Ended May 31, 2017 2016 2015
Cash Flows From Operating Activities: Net income $ 184,671 $ 357,458 $ 228,328 Adjustments to reconcile net income to net cash provided by operating activities: Depreciation 71,870 66,732 62,188 Amortization 44,903 44,307 36,988 Goodwill and other intangible asset impairments 193,198 Adjustments to contingent consideration obligations 3,000 (14,500) (29,665) Other asset impairment charge 4,471 818 Other-than-temporary impairments on marketable securities 420 3,811 22 Deferred income taxes 24,049 9,399 97,502 Stock-based compensation expense 32,541 31,287 31,741 Other non-cash interest expense 9,986 9,750 5,624 Gain on remeasurement of joint venture ownership (7,972) Realized (gains) on sales of marketable securities (8,174) (6,457) (8,692) Other 280 (15) (1,954) Changes in assets and liabilities, net of effect from purchases and sales of businesses: (Increase) in receivables (5,690) (24,582) (90,230) (Increase) in inventory (70,726) (17,733) (31,348) (Increase) in prepaid expenses and other current and long-term assets (38,130) (25,617) (4,590) Increase (decrease) in accounts payable 16,247 (5,958) (16,249) (Decrease) increase in accrued compensation and benefits (4,577) 17,681 (1,297) (Decrease) increase in accrued loss reserves (3,422) 13,514 (7,218) (Decrease) increase in other accrued liabilities (64,322) 8,011 51,761 Other 3 11,119 6,719
Cash Provided By Operating Activities 386,127 474,706 330,448
Cash Flows From Investing Activities: Capital expenditures (126,109) (117,183) (85,363) Acquisition of businesses, net of cash acquired (254,200) (51,992) (467,573) Purchase of marketable securities (38,062) (32,280) (61,511) Proceeds from sales of marketable securities 76,588 32,631 48,971 Proceeds from sales of assets and businesses 866 4,079 Other 2,118 2,092 1,944
Cash (Used For) Investing Activities (339,665) (165,866) (559,453)
Cash Flows From Financing Activities: Additions to long-term and short-term debt 597,633 142,130 460,560 Reductions of long-term and short-term debt (154,348) (147,155) (162,318) Cash dividends (156,752) (144,350) (136,179) Shares of common stock repurchased and returned for taxes (21,948) (71,346) (39,528) Payments of acquisition-related contingent consideration (4,284) (2,088) (22,179) Exercise of stock options and awards, including tax benefit 18,540 8,560 Payments for 524(g) trust (221,638) Other (2,692) (1,836) 1,277
Cash Provided By (Used For) Financing Activities 35,971 (206,105) 110,193
Effect of Exchange Rate Changes on Cash and Cash Equivalents 2,912 (12,294) (39,345)
Net Change in Cash and Cash Equivalents 85,345 90,441 (158,157)Cash and Cash Equivalents at Beginning of Period 265,152 174,711 332,868
Cash and Cash Equivalents at End of Period $ 350,497 $ 265,152 $ 174,711
Supplemental Disclosures of Cash Flows Information: Cash paid during the year for: Interest $ 78,685 $ 73,087 $ 79,371 Income taxes $ 71,236 $ 63,208 $ 27,486
The accompanying Notes to Consolidated Financial Statements are an integral part of these statements.
CONSOLIDATED STATEMENTS OF CASH FLOWS (In thousands)
RPM International Inc. and Subsidiaries 33
Managem
ent’s Discussion and A
nalysis Consolidated Financial Statements N
otes to Consolidated Financial Statements Q
uarterly Stock Price and Dividend Inform
ation Managem
ent’s Report Auditors’ Reports Stockholder Inform
ation

Common Stock Accumulated Total RPM Number of Par/Stated Paid-In Treasury Other Comprehensive Retained International Non-Controlling Total Shares Value Capital Stock Income/(Loss) Earnings Inc. Equity Interests Equity
Balance at June 1, 2014 133,273 $ 1,333 $ 790,102 $ (85,400) $ (156,882) $ 833,691 $ 1,382,844 $ 195,750 $ 1,578,594 Net income - - - - - 239,484 239,484 (11,156) 228,328 Other comprehensive income - - - - (227,653) - (227,653) (4,586) (232,239) Dividends paid - - - - - (136,179) (136,179) - (136,179) Other noncontrolling interest activity - - - - - - - (668) (668) Increase in equity ownership of SPHC - - 41,724 - (9,600) - 32,124 (177,267) (145,143) Shares repurchased (595) (6) 6 (27,588) - - (27,588) - (27,588) Stock option exercises 59 1 8,560 - - - 8,561 - 8,561 Stock compensation expense, shares granted less shares returned for taxes 466 4 31,735 (11,940) - - 19,799 - 19,799
Balance at May 31, 2015 133,203 1,332 872,127 (124,928) (394,135) 936,996 1,291,392 2,073 1,293,465 Net income - - - - - 354,725 354,725 2,733 357,458 Other comprehensive income - - - - (107,912) - (107,912) (27) (107,939) Dividends paid - - - - - (144,350) (144,350) - (144,350) Other noncontrolling interest activity - - - - - - - (2,366) (2,366) Shares repurchased (800) (8) 8 (35,098) - - (35,098) - (35,098) Stock option exercises - - 18,540 - - - 18,540 - 18,540 Stock compensation expense, shares granted less shares returned for taxes 541 5 31,281 (36,248) - - (4,962) - (4,962)
Balance at May 31, 2016 132,944 1,329 921,956 (196,274) (502,047) 1,147,371 1,372,335 2,413 1,374,748 Net income - - - - - 181,823 181,823 2,848 184,671 Other comprehensive income - - - - 28,061 - 28,061 (44) 28,017 Dividends paid - - - - - (156,752) (156,752) - (156,752) Other noncontrolling interest activity - - - - - - - (2,578) (2,578) Stock compensation expense, shares granted less shares returned for taxes 619 7 32,535 (21,948) - - 10,594 - 10,594
Balance at May 31, 2017 133,563 $ 1,336 $ 954,491 $ (218,222) $ (473,986) $ 1,172,442 $ 1,436,061 $ 2,639 $ 1,438,700
The accompanying Notes to Consolidated Financial Statements are an integral part of these statements.
CONSOLIDATED STATEMENTS OF STOCKHOLDERS’ EQUITY (In thousands)
RPM International Inc. and Subsidiaries34

Common Stock Accumulated Total RPM Number of Par/Stated Paid-In Treasury Other Comprehensive Retained International Non-Controlling Total Shares Value Capital Stock Income/(Loss) Earnings Inc. Equity Interests Equity
Balance at June 1, 2014 133,273 $ 1,333 $ 790,102 $ (85,400) $ (156,882) $ 833,691 $ 1,382,844 $ 195,750 $ 1,578,594 Net income - - - - - 239,484 239,484 (11,156) 228,328 Other comprehensive income - - - - (227,653) - (227,653) (4,586) (232,239) Dividends paid - - - - - (136,179) (136,179) - (136,179) Other noncontrolling interest activity - - - - - - - (668) (668) Increase in equity ownership of SPHC - - 41,724 - (9,600) - 32,124 (177,267) (145,143) Shares repurchased (595) (6) 6 (27,588) - - (27,588) - (27,588) Stock option exercises 59 1 8,560 - - - 8,561 - 8,561 Stock compensation expense, shares granted less shares returned for taxes 466 4 31,735 (11,940) - - 19,799 - 19,799
Balance at May 31, 2015 133,203 1,332 872,127 (124,928) (394,135) 936,996 1,291,392 2,073 1,293,465 Net income - - - - - 354,725 354,725 2,733 357,458 Other comprehensive income - - - - (107,912) - (107,912) (27) (107,939) Dividends paid - - - - - (144,350) (144,350) - (144,350) Other noncontrolling interest activity - - - - - - - (2,366) (2,366) Shares repurchased (800) (8) 8 (35,098) - - (35,098) - (35,098) Stock option exercises - - 18,540 - - - 18,540 - 18,540 Stock compensation expense, shares granted less shares returned for taxes 541 5 31,281 (36,248) - - (4,962) - (4,962)
Balance at May 31, 2016 132,944 1,329 921,956 (196,274) (502,047) 1,147,371 1,372,335 2,413 1,374,748 Net income - - - - - 181,823 181,823 2,848 184,671 Other comprehensive income - - - - 28,061 - 28,061 (44) 28,017 Dividends paid - - - - - (156,752) (156,752) - (156,752) Other noncontrolling interest activity - - - - - - - (2,578) (2,578) Stock compensation expense, shares granted less shares returned for taxes 619 7 32,535 (21,948) - - 10,594 - 10,594
Balance at May 31, 2017 133,563 $ 1,336 $ 954,491 $ (218,222) $ (473,986) $ 1,172,442 $ 1,436,061 $ 2,639 $ 1,438,700
RPM International Inc. and Subsidiaries 35
Managem
ent’s Discussion and A
nalysis Consolidated Financial Statements N
otes to Consolidated Financial Statements Q
uarterly Stock Price and Dividend Inform
ation Managem
ent’s Report Auditors’ Reports Stockholder Inform
ation
Notes to Consolidated Financial Statements May 31, 2017, 2016, 2015NOTE A — SUMMARY OF SIGNIFICANT ACCOUNTING POLICIES
1) Consolidation, Noncontrolling Interests and Basis of Presentation
Our financial statements include all of our majority-owned subsidiaries, except for certain subsidiaries that were deconsolidated for the period from May 31, 2010 through December 31, 2014 (refer to Note A[2]). We account for our investments in less-than-majority-owned joint ventures, for which we have the ability to exercise significant influence, under the equity method. Effects of transactions between related companies are eliminated in consolidation.
Noncontrolling interests are presented in our Consolidated Financial Statements as if parent company investors (controlling interests) and other minority investors (noncontrolling interests) in partially owned subsidiaries have similar economic interests in a single entity. As a result, investments in noncontrolling interests are reported as equity in our Consolidated Financial Statements. Additionally, our Consolidated Financial Statements include 100% of a controlled subsidiary’s earnings, rather than only our share. Transactions between the parent company and noncontrolling interests are reported in equity as transactions between stockholders, provided that these transactions do not create a change in control.
Our business is dependent on external weather factors. Historically, we have experienced strong sales and net income in our first, second and fourth fiscal quarters comprising the three-month periods ending August 31, November 30 and May 31, respectively, with weaker performance in our third fiscal quarter (December through February).
Certain prior-year amounts have been reclassified to conform with current-year presentation. See Note A(20), “Other Recent Accounting Pronouncements,” for discussion relating to the reclassification of deferred debt issuance costs. Also, see Note O, “Segment Information,” for discussion surrounding the change in composition of operating and reportable segments during fiscal 2017.
2) Specialty Products Holding Corp. (“SPHC”)
Prior to May 31, 2010, Bondex International, Inc. (“Bondex”) and its parent, SPHC, were defendants in various asbestos-related bodily injury lawsuits filed in various state courts. These cases generally sought unspecified damages for asbestos-related diseases based on alleged exposures to asbestos-containing products. On May 31, 2010, Bondex and SPHC, filed voluntary petitions in the United States Bankruptcy Court for the District of Delaware (the “Bankruptcy Court”) to reorganize under chapter 11 of the Bankruptcy Code. SPHC and Bondex took this action in an effort to permanently and comprehensively resolve all pending and future asbestos-related liability claims associated with Bondex and SPHC.
Similarly, Republic Powdered Metals, Inc. (“Republic”) and NMBFiL, Inc. (“NMBFiL”), both of which are indirect wholly owned subsidiaries of RPM International Inc. (“RPM”), filed to reorganize under chapter 11 of the Bankruptcy Code in August 2014 to resolve all their pending and future asbestos-related liability claims. Both Republic and NMBFiL remained consolidated subsidiaries of RPM, considering the short-term nature of the bankruptcy and that RPM maintained control of them from a participating rights perspective.
On December 10, 2014 the Bankruptcy Plan was confirmed, and, effective as of December 23, 2014, Bondex, SPHC, Republic and NMBFiL emerged from bankruptcy. In accordance with the Bankruptcy Plan, the Trust was established and funded
with first installments. Pursuant to the Bankruptcy Plan, the Trust assumed all liability and responsibility for current and future asbestos personal injury claims of Bondex, SPHC, Republic and NMBFiL, and such entities will have no further liability or responsibility for, and will (along with affiliates) be permanently protected from, such asbestos claims. See Note E, “Borrowings,” for further discussion of the details regarding the timing and funding of contributions to the Trust.
Effective with the filing of the Notice of Entry of Order confirming the Bankruptcy Plan, which required the funding of the Trust, we regained control of SPHC and its subsidiaries, and accordingly, we have accounted for the event as a business combination. The funding of the Trust represents the total consideration transferred in the transaction, or $772.6 million. The opening balance sheets are based upon closing balances as of December 31, 2014 and results of operations have been included in our Consolidated Financial Statements beginning on January 1, 2015 (the “Accounting Effective Date”) forward, as we concluded that the activity occurring between the date control was obtained (December 23, 2014) and the Accounting Effective Date was not significant.
The fair values of SPHC and its subsidiaries were determined as of January 1, 2015. Additionally, the fair value of RPM Holdco, of which SPHC owns 21.39% of the outstanding common stock, was determined in order to account for our increase in ownership of the noncontrolling interest as an equity transaction. The total consideration was allocated on a relative fair value basis between the noncontrolling interest in RPM Holdco, or approximately $208.4 million, and the net assets of SPHC, or approximately $564.2 million. The difference between the fair value of the noncontrolling interest in RPM Holdco and the carrying value of the noncontrolling interest was recorded as an equity transaction. The portion of the transaction accounted for as a business combination resulted in goodwill of $118.7 million and intangible assets of $176.0 million. The acquired intangible assets totaling $176.0 million comprise the following: $118.7 million of customer and distributor relationships, $2.0 million of definite-lived tradenames, $52.7 million of indefinite-lived tradenames and $2.6 million of formulas. Income tax assets of $271.7 million were recorded in connection with the deductibility of current and future contributions to the Trust. Additionally, deferred tax liabilities of $72.3 million were recorded for the excess of the fair value book basis of certain assets over the corresponding tax basis. The fair values of net tangible assets, intangible assets and the noncontrolling interest were based upon valuations, which required our significant use of estimates and assumptions.
3) Use of Estimates
The preparation of financial statements in conformity with GAAP requires us to make estimates and assumptions that affect reported amounts of assets and liabilities, disclosure of contingent assets and liabilities at the date of the financial statements, and reported amounts of revenues and expenses during the reporting period. Actual results could differ from those estimates.
4) Acquisitions/Divestitures
We account for business combinations and asset acquisitions using the acquisition method of accounting and, accordingly, the assets and liabilities of the acquired entities are recorded at their estimated fair values at the acquisition date.
During the fiscal year ended May 31, 2017, we completed acquisitions within each of our three reportable segments. Two of the current-year acquisitions report through our consumer
RPM International Inc. and Subsidiaries36
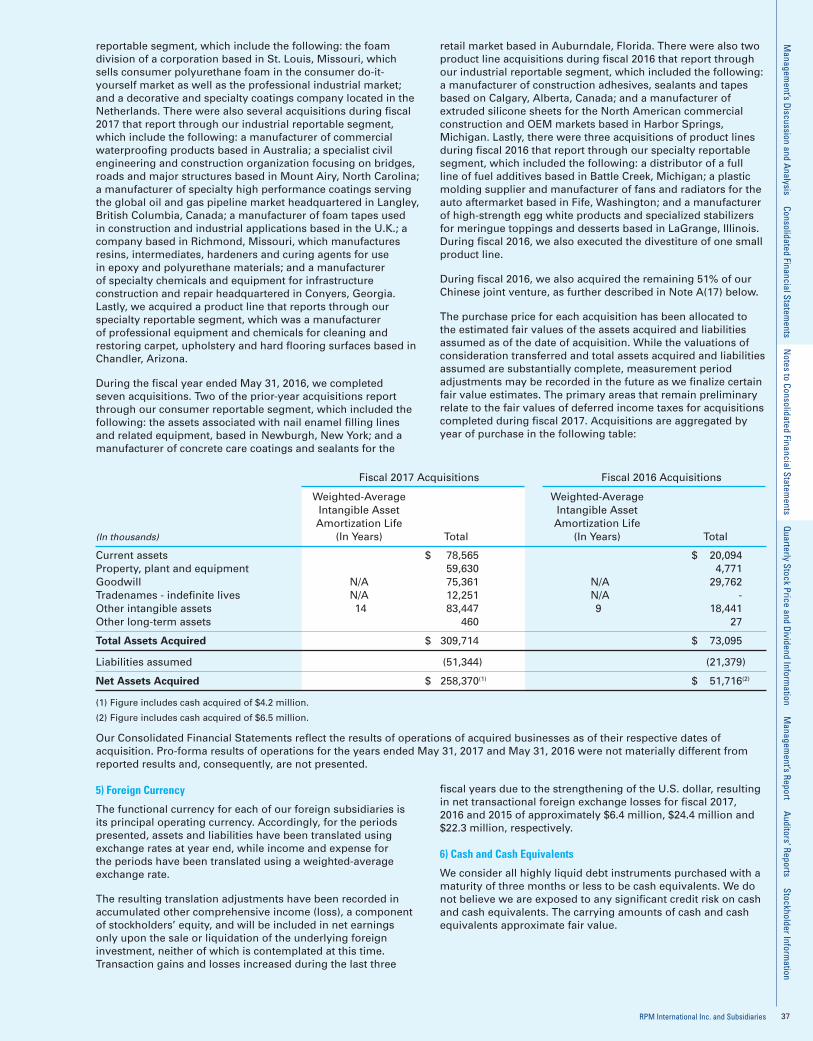
reportable segment, which include the following: the foam division of a corporation based in St. Louis, Missouri, which sells consumer polyurethane foam in the consumer do-it-yourself market as well as the professional industrial market; and a decorative and specialty coatings company located in the Netherlands. There were also several acquisitions during fiscal 2017 that report through our industrial reportable segment, which include the following: a manufacturer of commercial waterproofing products based in Australia; a specialist civil engineering and construction organization focusing on bridges, roads and major structures based in Mount Airy, North Carolina; a manufacturer of specialty high performance coatings serving the global oil and gas pipeline market headquartered in Langley, British Columbia, Canada; a manufacturer of foam tapes used in construction and industrial applications based in the U.K.; a company based in Richmond, Missouri, which manufactures resins, intermediates, hardeners and curing agents for use in epoxy and polyurethane materials; and a manufacturer of specialty chemicals and equipment for infrastructure construction and repair headquartered in Conyers, Georgia. Lastly, we acquired a product line that reports through our specialty reportable segment, which was a manufacturer of professional equipment and chemicals for cleaning and restoring carpet, upholstery and hard flooring surfaces based in Chandler, Arizona.
During the fiscal year ended May 31, 2016, we completed seven acquisitions. Two of the prior-year acquisitions report through our consumer reportable segment, which included the following: the assets associated with nail enamel filling lines and related equipment, based in Newburgh, New York; and a manufacturer of concrete care coatings and sealants for the
retail market based in Auburndale, Florida. There were also two product line acquisitions during fiscal 2016 that report through our industrial reportable segment, which included the following: a manufacturer of construction adhesives, sealants and tapes based on Calgary, Alberta, Canada; and a manufacturer of extruded silicone sheets for the North American commercial construction and OEM markets based in Harbor Springs, Michigan. Lastly, there were three acquisitions of product lines during fiscal 2016 that report through our specialty reportable segment, which included the following: a distributor of a full line of fuel additives based in Battle Creek, Michigan; a plastic molding supplier and manufacturer of fans and radiators for the auto aftermarket based in Fife, Washington; and a manufacturer of high-strength egg white products and specialized stabilizers for meringue toppings and desserts based in LaGrange, Illinois. During fiscal 2016, we also executed the divestiture of one small product line.
During fiscal 2016, we also acquired the remaining 51% of our Chinese joint venture, as further described in Note A(17) below.
The purchase price for each acquisition has been allocated to the estimated fair values of the assets acquired and liabilities assumed as of the date of acquisition. While the valuations of consideration transferred and total assets acquired and liabilities assumed are substantially complete, measurement period adjustments may be recorded in the future as we finalize certain fair value estimates. The primary areas that remain preliminary relate to the fair values of deferred income taxes for acquisitions completed during fiscal 2017. Acquisitions are aggregated by year of purchase in the following table:
Fiscal 2017 Acquisitions Fiscal 2016 Acquisitions
Weighted-Average Weighted-Average Intangible Asset Intangible Asset Amortization Life Amortization Life (In thousands) (In Years) Total (In Years) Total
Current assets $ 78,565 $ 20,094Property, plant and equipment 59,630 4,771Goodwill N/A 75,361 N/A 29,762Tradenames - indefinite lives N/A 12,251 N/A -Other intangible assets 14 83,447 9 18,441Other long-term assets 460 27
Total Assets Acquired $ 309,714 $ 73,095
Liabilities assumed (51,344) (21,379)
Net Assets Acquired $ 258,370(1) $ 51,716(2)
(1) Figure includes cash acquired of $4.2 million.
(2) Figure includes cash acquired of $6.5 million.
Our Consolidated Financial Statements reflect the results of operations of acquired businesses as of their respective dates of acquisition. Pro-forma results of operations for the years ended May 31, 2017 and May 31, 2016 were not materially different from reported results and, consequently, are not presented.
5) Foreign Currency
The functional currency for each of our foreign subsidiaries is its principal operating currency. Accordingly, for the periods presented, assets and liabilities have been translated using exchange rates at year end, while income and expense for the periods have been translated using a weighted-average exchange rate.
The resulting translation adjustments have been recorded in accumulated other comprehensive income (loss), a component of stockholders’ equity, and will be included in net earnings only upon the sale or liquidation of the underlying foreign investment, neither of which is contemplated at this time. Transaction gains and losses increased during the last three
fiscal years due to the strengthening of the U.S. dollar, resulting in net transactional foreign exchange losses for fiscal 2017, 2016 and 2015 of approximately $6.4 million, $24.4 million and $22.3 million, respectively.
6) Cash and Cash Equivalents
We consider all highly liquid debt instruments purchased with a maturity of three months or less to be cash equivalents. We do not believe we are exposed to any significant credit risk on cash and cash equivalents. The carrying amounts of cash and cash equivalents approximate fair value.
RPM International Inc. and Subsidiaries 37
Managem
ent’s Discussion and A
nalysis Consolidated Financial Statements N
otes to Consolidated Financial Statements Q
uarterly Stock Price and Dividend Inform
ation Managem
ent’s Report Auditors’ Reports Stockholder Inform
ation

7) Property, Plant & Equipment
May 31, 2017 2016
(In thousands)
Land $ 82,184 $ 60,223
Buildings and leasehold improvements 427,304 363,036
Machinery and equipment 975,091 921,571
Total property, plant and equipment, at cost 1,484,579 1,344,830
Less: allowance for depreciation and amortization 741,893 715,377
Property, plant and equipment, net $ 742,686 $ 629,453
We review long-lived assets for impairment when circumstances indicate that the carrying values of these assets may not be recoverable. For assets that are to be held and used, an impairment charge is recognized when the estimated undiscounted future cash flows associated with the asset or group of assets are less than their carrying value. If impairment exists, an adjustment is made to write the asset down to its fair value, and a loss is recorded for the difference between the carrying value and the fair value. Fair values are determined based on quoted market values, discounted cash flows, internal appraisals or external appraisals, as applicable. Assets to be disposed of are carried at the lower of their carrying value or estimated net realizable value.
Depreciation is computed primarily using the straight-line method over the following ranges of useful lives:
Land improvements 1 to 50 years Buildings and improvements 1 to 80 years Machinery and equipment 1 to 30 years
Total depreciation expense for each fiscal period includes the charges to income that result from the amortization of assets recorded under capital leases.
8) Revenue Recognition
Revenues are recognized when realized or realizable, and when earned. In general, this is when title and risk of loss pass to the customer. Further, revenues are realizable when we have persuasive evidence of a sales arrangement, the product has been shipped or the services have been provided to the customer, the sales price is fixed or determinable, and collectibility is reasonably assured. We reduce our revenues for estimated customer returns and allowances, certain rebates, sales incentives, and promotions in the same period the related sales are recorded.
We also record revenues generated under long-term construction contracts, mainly in connection with the installation of specialized roofing and flooring systems, and related services. Certain long-term construction contracts are accounted for under the percentage-of-completion method, and therefore we record contract revenues and related costs as our contracts progress. This method recognizes the economic results of contract performance on a timelier basis than does the completed-contract method; however, application of this method requires reasonably dependable estimates of progress toward completion, as well as other dependable estimates. When reasonably dependable estimates cannot be made, or if other factors make estimates doubtful, the completed-contract method is applied. Under the completed-contract method, billings and costs are accumulated on the balance sheet as the contract progresses, but no revenue is recognized until the contract is complete or substantially complete.
9) Shipping Costs
Shipping costs paid to third-party shippers for transporting products to customers are included in SG&A expenses. For the years ended May 31, 2017, 2016 and 2015, shipping costs were $148.9 million, $145.3 million and $142.9 million, respectively.
10) Allowance for Doubtful Accounts Receivable
An allowance for anticipated uncollectible trade receivable amounts is established using a combination of specifically identified accounts to be reserved and a reserve covering trends in collectibility. These estimates are based on an analysis of trends in collectibility and past experience, but are primarily made up of individual account balances identified as doubtful based on specific facts and conditions. Receivable losses are charged against the allowance when we confirm uncollectibility. Actual collections of trade receivables could differ from our estimates due to changes in future economic or industry conditions or specific customer’s financial conditions. For the periods ended May 31, 2017, 2016 and 2015, bad debt expense approximated $16.0 million, $8.7 million and $4.9 million, respectively. The increase in bad debt expense during fiscal 2017 was primarily the result of our reassessment of the collectibility of accounts receivable, particularly in emerging markets.
11) Inventories
Inventories are stated at the lower of cost or net realizable value, cost being determined on a first-in, first-out (FIFO) basis and net realizable value being determined on the basis of replacement cost. Inventory costs include raw materials, labor and manufacturing overhead. We review the net realizable value of our inventory in detail on an on-going basis, with consideration given to various factors, which include our estimated reserves for excess, obsolete, slow moving or distressed inventories. If actual market conditions differ from our projections, and our estimates prove to be inaccurate, write-downs of inventory values and adjustments to cost of sales may be required. Historically, our inventory reserves have approximated actual experience. Inventories were composed of the following major classes:
May 31, 2017 2016
(In thousands)
Raw material and supplies $ 248,426 $ 227,900
Finished goods 539,771 457,918
Total Inventory $ 788,197 $ 685,818
12) Goodwill and Other Intangible Assets
We account for goodwill and other intangible assets in accordance with the provisions of ASC 350 and account for business combinations using the acquisition method of accounting and accordingly, the assets and liabilities of the entities acquired are recorded at their estimated fair values at the acquisition date. Goodwill represents the excess of the purchase price paid over the fair value of net assets acquired, including the amount assigned to identifiable intangible assets.
We performed the required annual goodwill impairment assessments as of the first day of our fourth fiscal quarter at the reporting unit level. Our reporting units have been identified at the component level, which is the operating segment level or one level below. First, we assess qualitative factors to determine whether it is more likely than not that the fair value of a reporting unit is less than its carrying amount. The traditional two-step quantitative process is required only if we conclude that it is more likely than not that a reporting unit’s fair value is less than its carrying amount. However, we have an unconditional option to bypass a qualitative assessment and proceed directly to performing the traditional two-step quantitative analysis. We applied both the qualitative and traditional two-step quantitative processes during our annual goodwill impairment assessment performed during the fourth quarters of fiscal 2017, 2016 and 2015.
RPM International Inc. and Subsidiaries38
The traditional two-step quantitative goodwill impairment assessment involves estimating the fair value of a reporting unit and comparing it with its carrying amount. If the carrying amount of the reporting unit exceeds its fair value, additional steps are followed to determine and recognize, if appropriate, an impairment loss. Calculating the fair value of the reporting units requires our significant use of estimates and assumptions. We estimate the fair values of our reporting units by applying a combination of third-party market-value indicators, when observable market data is available, and discounted future cash flows to each of our reporting unit’s projected EBITDA. In applying this methodology, we rely on a number of factors, including actual and forecasted operating results and market data.
As a result of the assessments performed for fiscal 2016 and 2015, there were no goodwill impairments, including no reporting units that were at risk of failing step one of the traditional two-step quantitative analysis, except for our Kirker reporting unit, which had an estimated fair value that exceeded its carrying value by approximately 8% at May 31, 2016.
As described further in Note B, “Goodwill and Other Intangible Assets,” during the second quarter of fiscal 2017, we identified certain factors that we considered important in assessing the requirement to perform an interim impairment evaluation for our Kirker reporting unit. First, Kirker’s three-month operating results for the period ended November 30, 2016 were significantly below historical and expected operating results and downward adjustments were made regarding our expectations for Kirker’s performance. Second, Kirker experienced market share losses at several key customers, including the loss of its largest customer, which accounted for over 15% of Kirker’s fiscal 2016 sales. Third, some problematic customer relationship issues surfaced, which resulted in a personnel change in a key leadership position at Kirker. After considering the totality of these events, we determined that an interim step one goodwill impairment assessment was required, as well as an impairment assessment for our intangible and other long-lived assets. Accordingly, during our second fiscal quarter we recorded a loss totaling $188.3 million for the impairment of goodwill and intangibles at our Kirker reporting unit. After recording the goodwill impairment loss, no goodwill remained at the Kirker reporting unit at November 30, 2016. As a result of the required annual assessments performed during the fourth quarter of fiscal 2017, there were no additional goodwill impairments, including no other reporting units that were at risk of failing step one of the traditional two-step quantitative analysis.
Additionally, we test all indefinite-lived intangible assets for impairment annually. We perform the required annual impairment assessments as of the first day of our fourth fiscal quarter. We may elect to first assess qualitative factors to determine whether it is more likely than not that the fair value of an indefinite-lived intangible asset is less than its carrying amount before applying traditional quantitative tests. We applied both qualitative and quantitative processes during our annual indefinite-lived intangible asset impairment assessments performed during the fourth quarters of fiscal 2017, 2016 and 2015.
The annual impairment assessment involves estimating the fair value of each indefinite-lived asset and comparing it with its carrying amount. If the carrying amount of the intangible asset exceeds its fair value, we record an impairment loss equal to the difference. Calculating the fair value of the indefinite-lived assets requires our significant use of estimates and assumptions. We estimate the fair values of our intangible assets by applying a relief-from-royalty calculation, which includes discounted future cash flows related to each of our intangible asset’s projected revenues. In applying this methodology, we rely on a number of factors, including actual and forecasted revenues and market data. As a result of the assessments performed for fiscal 2016 and 2015, there were no impairments. Results of intangible
asset impairment assessments performed during fiscal 2017 are outlined below.
As further described in Note B, “Goodwill and Other Intangible Assets,” during the quarter ended February 28, 2017, we identified certain factors that we considered important in assessing the requirement to perform an interim impairment evaluation for our Restore indefinite tradename asset. First, sales of our Restore product line during the three-month period ended February 28, 2017 were below historical and expected operating results and significant downward adjustments were recently made to sales projections for Restore products. In the quarter ended February 28, 2017, we became aware that it was highly likely that Restore’s largest customer would discontinue sales of the Restore product line in its retail stores, which was evidenced by this customer’s significant reduction in future orders based on its historical order pattern. We determined that this was significant to consider for the purposes of impairment testing, as sales of Restore products to this customer accounted for over 60% of total sales of Restore products for fiscal 2016. After considering the magnitude of the loss in sales volume from this key customer, we determined that it was necessary to perform an interim assessment for our Restore intangible assets. Accordingly, during the third quarter of fiscal 2017, we recorded a preliminary loss totaling $4.9 million for the impairment of the Restore tradename. After performing the required annual assessments of indefinite-lived intangible assets during the fourth quarter of fiscal 2017, we finalized the Restore tradename valuation with no adjustment and there were no additional impairments.
Should the future earnings and cash flows at our reporting units decline and/or discount rates increase, future impairment charges to goodwill and other intangible assets may be required.
13) Advertising Costs
Advertising costs are charged to operations when incurred and are included in SG&A expenses. For the years ended May 31, 2017, 2016 and 2015, advertising costs were $52.3 million, $49.7 million and $40.8 million, respectively.
14) Research and Development
Research and development costs are charged to operations when incurred and are included in SG&A expenses. The amounts charged to expense for the years ended May 31, 2017, 2016 and 2015 were $64.9 million, $61.5 million and $56.7 million, respectively.
15) Stock-Based Compensation
Stock-based compensation represents the cost related to stock-based awards granted to our employees and directors, which may include restricted stock and stock appreciation rights (“SARs”). We measure stock-based compensation cost at the date of grant, based on the estimated fair value of the award. We recognize the cost as expense on a straight-line basis (net of estimated forfeitures) over the related vesting period. Refer to Note H, “Stock-Based Compensation,” for further information.
16) Investment (Income), Net
Investment (income), net, consists of the following components:
Year Ended May 31, 2017 2016 2015
(In thousands) Interest (income) $ (4,620) $ (5,975) $ (8,304)(Gain) on sale of marketable securities (8,174) (6,457) (8,692)Other-than-temporary impairment on securities 420 3,811 22Dividend (income) (1,610) (1,744) (1,603)
Investment (income), net $ (13,984) $ (10,365) $ (18,577)
RPM International Inc. and Subsidiaries 39
Managem
ent’s Discussion and A
nalysis Consolidated Financial Statements N
otes to Consolidated Financial Statements Q
uarterly Stock Price and Dividend Inform
ation Managem
ent’s Report Auditors’ Reports Stockholder Inform
ation
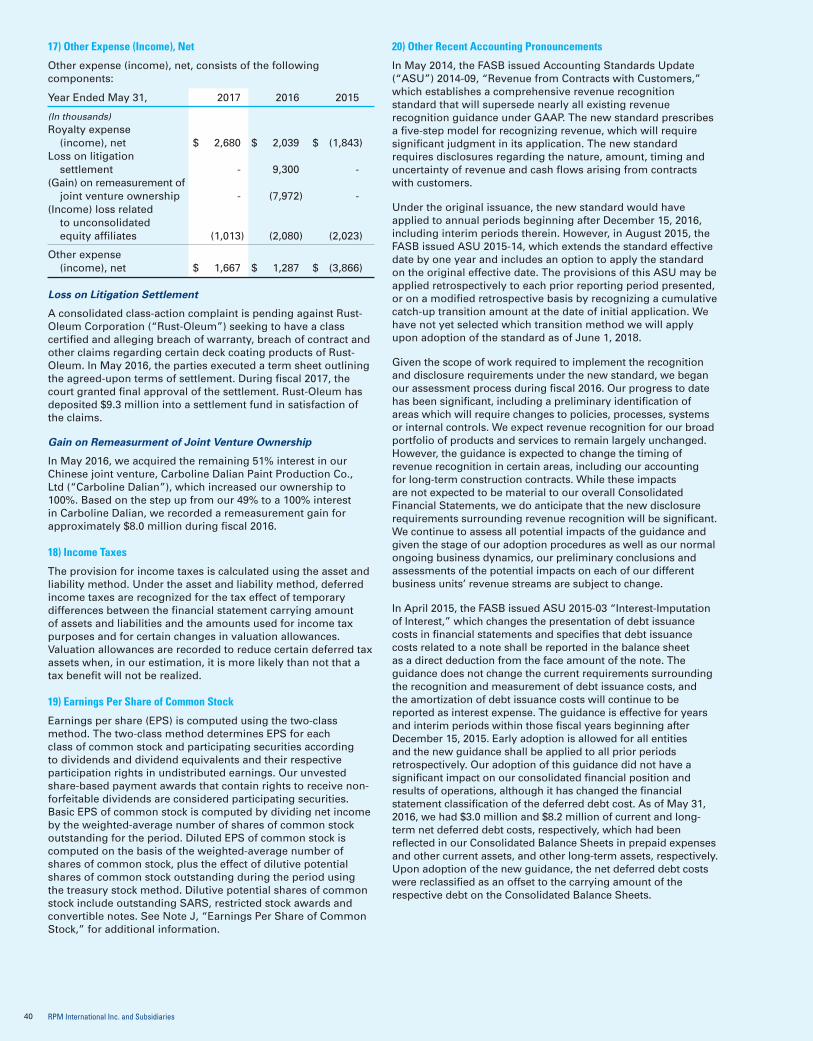
17) Other Expense (Income), Net
Other expense (income), net, consists of the following components:
Year Ended May 31, 2017 2016 2015
(In thousands) Royalty expense (income), net $ 2,680 $ 2,039 $ (1,843)Loss on litigation settlement - 9,300 -(Gain) on remeasurement of joint venture ownership - (7,972) -(Income) loss related to unconsolidated equity affiliates (1,013) (2,080) (2,023)
Other expense (income), net $ 1,667 $ 1,287 $ (3,866)
Loss on Litigation Settlement
A consolidated class-action complaint is pending against Rust-Oleum Corporation (“Rust-Oleum”) seeking to have a class certified and alleging breach of warranty, breach of contract and other claims regarding certain deck coating products of Rust-Oleum. In May 2016, the parties executed a term sheet outlining the agreed-upon terms of settlement. During fiscal 2017, the court granted final approval of the settlement. Rust-Oleum has deposited $9.3 million into a settlement fund in satisfaction of the claims.
Gain on Remeasurment of Joint Venture Ownership
In May 2016, we acquired the remaining 51% interest in our Chinese joint venture, Carboline Dalian Paint Production Co., Ltd (“Carboline Dalian”), which increased our ownership to 100%. Based on the step up from our 49% to a 100% interest in Carboline Dalian, we recorded a remeasurement gain for approximately $8.0 million during fiscal 2016.
18) Income Taxes
The provision for income taxes is calculated using the asset and liability method. Under the asset and liability method, deferred income taxes are recognized for the tax effect of temporary differences between the financial statement carrying amount of assets and liabilities and the amounts used for income tax purposes and for certain changes in valuation allowances. Valuation allowances are recorded to reduce certain deferred tax assets when, in our estimation, it is more likely than not that a tax benefit will not be realized.
19) Earnings Per Share of Common Stock
Earnings per share (EPS) is computed using the two-class method. The two-class method determines EPS for each class of common stock and participating securities according to dividends and dividend equivalents and their respective participation rights in undistributed earnings. Our unvested share-based payment awards that contain rights to receive non-forfeitable dividends are considered participating securities. Basic EPS of common stock is computed by dividing net income by the weighted-average number of shares of common stock outstanding for the period. Diluted EPS of common stock is computed on the basis of the weighted-average number of shares of common stock, plus the effect of dilutive potential shares of common stock outstanding during the period using the treasury stock method. Dilutive potential shares of common stock include outstanding SARS, restricted stock awards and convertible notes. See Note J, “Earnings Per Share of Common Stock,” for additional information.
20) Other Recent Accounting Pronouncements
In May 2014, the FASB issued Accounting Standards Update (“ASU”) 2014-09, “Revenue from Contracts with Customers,” which establishes a comprehensive revenue recognition standard that will supersede nearly all existing revenue recognition guidance under GAAP. The new standard prescribes a five-step model for recognizing revenue, which will require significant judgment in its application. The new standard requires disclosures regarding the nature, amount, timing and uncertainty of revenue and cash flows arising from contracts with customers.
Under the original issuance, the new standard would have applied to annual periods beginning after December 15, 2016, including interim periods therein. However, in August 2015, the FASB issued ASU 2015-14, which extends the standard effective date by one year and includes an option to apply the standard on the original effective date. The provisions of this ASU may be applied retrospectively to each prior reporting period presented, or on a modified retrospective basis by recognizing a cumulative catch-up transition amount at the date of initial application. We have not yet selected which transition method we will apply upon adoption of the standard as of June 1, 2018.
Given the scope of work required to implement the recognition and disclosure requirements under the new standard, we began our assessment process during fiscal 2016. Our progress to date has been significant, including a preliminary identification of areas which will require changes to policies, processes, systems or internal controls. We expect revenue recognition for our broad portfolio of products and services to remain largely unchanged. However, the guidance is expected to change the timing of revenue recognition in certain areas, including our accounting for long-term construction contracts. While these impacts are not expected to be material to our overall Consolidated Financial Statements, we do anticipate that the new disclosure requirements surrounding revenue recognition will be significant. We continue to assess all potential impacts of the guidance and given the stage of our adoption procedures as well as our normal ongoing business dynamics, our preliminary conclusions and assessments of the potential impacts on each of our different business units’ revenue streams are subject to change.
In April 2015, the FASB issued ASU 2015-03 “Interest-Imputation of Interest,” which changes the presentation of debt issuance costs in financial statements and specifies that debt issuance costs related to a note shall be reported in the balance sheet as a direct deduction from the face amount of the note. The guidance does not change the current requirements surrounding the recognition and measurement of debt issuance costs, and the amortization of debt issuance costs will continue to be reported as interest expense. The guidance is effective for years and interim periods within those fiscal years beginning after December 15, 2015. Early adoption is allowed for all entities and the new guidance shall be applied to all prior periods retrospectively. Our adoption of this guidance did not have a significant impact on our consolidated financial position and results of operations, although it has changed the financial statement classification of the deferred debt cost. As of May 31, 2016, we had $3.0 million and $8.2 million of current and long-term net deferred debt costs, respectively, which had been reflected in our Consolidated Balance Sheets in prepaid expenses and other current assets, and other long-term assets, respectively. Upon adoption of the new guidance, the net deferred debt costs were reclassified as an offset to the carrying amount of the respective debt on the Consolidated Balance Sheets.
RPM International Inc. and Subsidiaries40

In September 2015, the FASB issued ASU No. 2015-16, “Simplifying the Accounting for Measurement-Period Adjustments,” which simplifies the treatment of adjustments to provisional amounts recognized in the period for items in a business combination for which the accounting is incomplete at the end of the reporting period. The amendments in this ASU were effective for fiscal years beginning after December 15, 2015 and for interim periods therein. We began applying the provisions of this ASU as of June 1, 2016. Adoption of this ASU did not have a material impact on our Consolidated Financial Statements.
In February 2016, the FASB issued ASU 2016-02, “Leases (Topic 842),” which increases lease transparency and comparability among organizations. Under the new standard, lessees will be required to recognize all assets and liabilities arising from leases on the balance sheet, with the exception of leases with a term of 12 months or less, which permits a lessee to make an accounting policy election by class of underlying asset not to recognize lease assets and liabilities. ASU 2016-02 is effective for fiscal years beginning after December 15, 2018, including interim periods within those fiscal years, and early adoption is permitted. The new standard requires the recognition and measurement of leases at the beginning of the earliest period presented using a modified retrospective approach, which includes a number of optional practical expedients that entities may elect to apply. We are currently evaluating the impact this guidance will have on our Consolidated Financial Statements. At a minimum, total assets and total liabilities will increase in the period the ASU is adopted. At May 31, 2017, our total undiscounted future minimum payments outstanding for operating lease obligations approximated $225.0 million.
In March 2016, the FASB issued ASU 2016-09, “Improvements to Employee Share-Based Payment Accounting,” which makes a number of changes meant to simplify and improve accounting for share-based payments. The new guidance includes amendments to share-based accounting for income taxes, the related classification in the statement of cash flows and share award forfeiture accounting. ASU 2016-09 is effective for public companies for annual reporting periods beginning after December 15, 2016, and interim periods within those reporting periods. Early adoption is permitted. We elected to early adopt ASU 2016-09 in the first quarter of fiscal 2017. The primary impact of our adoption was the recognition of excess tax benefits related to equity compensation in our provision for income taxes rather than paid-in capital, which is a change required to be applied on a prospective basis in accordance with the new guidance. Accordingly, we recorded income tax benefits in the consolidated statement of income of $12.1 million during the fiscal year ended May 31, 2017 for excess tax benefits related to equity compensation. The corresponding cash flows are reflected in operating activities instead of financing activities, as was previously required.
Additionally, under ASU 2016-09, we have elected to continue to estimate equity award forfeitures expected to occur to determine the amount of compensation cost to be recognized in each period. Additional amendments to the accounting for income taxes and minimum statutory withholding tax requirements had no impact on our results of operations. The presentation requirements for cash flows related to employee taxes paid for withheld shares also had no impact to any of the periods presented in our consolidated statements of cash flows since such cash flows have historically been presented as a financing activity.
In August 2016, the FASB issued ASU 2016-15, “Classification of Certain Cash Receipts and Cash Payments,” which makes a number of changes meant to add or clarify guidance on the classification of certain cash receipts and payments in the statement of cash flows. The new guidance is effective for fiscal years beginning after December 15, 2017, including interim periods within those fiscal years, with early adoption permitted. Upon adoption, entities must apply the guidance retrospectively to all periods presented. We are currently evaluating the impact this guidance will have on our Consolidated Financial Statements.
In January 2017, the FASB issued ASU 2017-01, “Business Combinations: Clarifying the Definition of a Business,” with the objective of adding guidance to assist entities in evaluating whether transactions should be accounted for as acquisitions (disposals) of assets or of businesses. The guidance is effective for fiscal years beginning after December 15, 2017, including interim periods within those fiscal years, with early adoption permitted. We are currently reviewing the impact this revised guidance will have on our Consolidated Financial Statements.
In January 2017, the FASB issued ASU 2017-04, “Simplifying the Test for Goodwill Impairment,” to eliminate step two from the goodwill impairment test in order to simplify the subsequent measurement of goodwill. The guidance is effective for fiscal years beginning after December 15, 2019. Early application is permitted for interim or annual goodwill impairment tests performed on testing dates after January 1, 2017. Adoption of this guidance is not expected to have a material impact on our Consolidated Financial Statements.
In March 2017, the FASB issued ASU 2017-07, “Improving the Presentation of Net Periodic Pension Cost and Net Periodic Postretirement Benefit Cost,” which requires that an employer report the service cost component in the same line item or items as other compensation costs arising from services rendered by the pertinent employees during the period. The other components of net benefit cost are required to be presented in the income statement separately from the service cost component and outside a subtotal of income from operations, if one is presented. The guidance is effective for fiscal years beginning after December 15, 2017, including interim periods within those fiscal years. We are currently reviewing the impact this guidance will have on our Consolidated Financial Statements.
NOTE B — GOODWILL AND OTHER INTANGIBLE ASSETS
The changes in the carrying amount of goodwill, by reportable segment, for the years ended May 31, 2017 and 2016, are as follows:
Industrial Specialty Consumer (In thousands) Segment Segment Segment Total
Balance as of June 1, 2015 $ 476,700 $ 165,934 $ 573,054 $ 1,215,688Acquisitions 18,834 7,168 3,760 29,762Translation adjustments (20,125) (1,388) (4,307) (25,820)
Balance as of May 31, 2016 475,409 171,714 572,507 1,219,630Acquisitions 41,268 3,273 30,820 75,361Impairments (141,394) (141,394)Translation adjustments (342) (1,009) (8,333) (9,684)
Balance as of May 31, 2017 $ 516,335 $ 173,978 $ 453,600 $ 1,143,913
RPM International Inc. and Subsidiaries 41
Managem
ent’s Discussion and A
nalysis Consolidated Financial Statements N
otes to Consolidated Financial Statements Q
uarterly Stock Price and Dividend Inform
ation Managem
ent’s Report Auditors’ Reports Stockholder Inform
ation

Total accumulated impairment losses were $156.3 million and $14.9 million at May 31, 2017 and 2016. Of the accumulated balance, $141.4 million was recorded during the fiscal year ended May 31, 2017 by our consumer segment, and $14.9 million was recorded during the fiscal year ended May 31, 2009 by our industrial reportable segment.
Other intangible assets consist of the following major classes:
Gross Accumulated Net Other Amortization Carrying Accumulated Impairment Intangible (In thousands) Period (In Years) Amount Amortization Charge Assets
As of May 31, 2017Amortized intangible assets Formulae 5 to 33 $ 230,140 $ (128,825) $ (15,463) $ 85,852 Customer-related intangibles 5 to 33 370,255 (122,772) (30,363) 217,120 Trademarks/names 5 to 40 36,461 (15,480) 20,981 Other 2 to 20 37,743 (21,288) (198) 16,257
Total Amortized Intangibles 674,599 (288,365) (46,024) 340,210 Indefinite-lived intangible assets Trademarks/names 240,456 (7,574) 232,882
Total Other Intangible Assets $ 915,055 $ (288,365) $ (53,598) $ 573,092
As of May 31, 2016Amortized intangible assets Formulae 3 to 33 $ 234,483 $ (140,376) $ - $ 94,107 Customer-related intangibles 3 to 33 331,008 (114,469) 216,539 Trademarks/names 5 to 40 30,742 (15,817) 14,925 Other 2 to 20 47,744 (27,745) 19,999
Total Amortized Intangibles 643,977 (298,407) - 345,570Indefinite-lived intangible assets Trademarks/names 230,431 (600) 229,831
Total Other Intangible Assets $ 874,408 $ (298,407) $ (600) $ 575,401
The aggregate intangible asset amortization expense for the fiscal years ended May 31, 2017, 2016 and 2015 was $41.9 million, $40.5 million and $32.9 million, respectively. For the next five fiscal years, we estimate annual intangible asset amortization expense related to our existing intangible assets to approximate the following: 2018 — $40.3 million, 2019 — $38.1 million, 2020 — $35.8 million, 2021 — $33.0 million and 2022 — $32.2 million.
The gross amount of other intangible asset accumulated impairment losses at May 31, 2016 totaled $0.6 million, all of which was recorded during the fiscal year ended May 31, 2009 by our industrial reportable segment. For the May 31, 2017, we recorded other intangible asset impairment losses of approximately $53.0 million, all of which was recorded by our consumer reportable segment.
As previously reported, we had monitored the performance of our Kirker nail enamel business throughout fiscal 2016. During the third quarter of fiscal 2016, we reported that performance shortfalls for Kirker were attributable to a delay in new business. We performed our annual goodwill impairment analysis during the fourth quarter of fiscal 2016, which resulted in an excess of fair value over carrying value of 8% for our Kirker reporting unit. During our first quarter ended August 31, 2016, we reported that while Kirker’s first quarter results were below the comparable prior year period, their performance was in line with expectations, and our assessment of the Kirker business did not indicate the presence of any goodwill impairment triggering events.
During the second quarter of fiscal 2017, we identified certain factors that we considered important in assessing the requirement to perform an interim impairment evaluation for our Kirker reporting unit. First, Kirker’s three month operating results for the period ended November 30, 2016 were significantly below historical and expected operating results and downward adjustments were recently made regarding our expectations for Kirker’s performance. In the quarter ended November 30, 2016, Kirker experienced market share losses at several key customers, including the loss of its largest customer,
which accounted for over 15% of Kirker’s fiscal 2016 sales. In addition, some problematic customer relationship issues surfaced during the quarter ended November 30, 2016, which resulted in a personnel change in a key leadership position at Kirker. After considering the totality of these recent events, we determined that an interim step one goodwill impairment assessment was required, as well as an impairment assessment for our intangible and other long-lived assets. Our testing resulted in the preliminary impairment charges reflected above for goodwill and other intangible assets.
Our goodwill impairment assessment included estimating the fair value of our Kirker reporting unit and comparing it with its carrying amount at November 30, 2016. Since the carrying amount of Kirker exceeded its fair value, additional steps were required to determine and recognize a preliminary impairment loss. Calculating the fair value of a reporting unit requires our significant use of estimates and assumptions, which are generally considered Level 3 inputs based on our review of the fair value hierarchy. We estimated the fair value of our Kirker reporting unit by applying a discounted future cash flow calculation to Kirker’s projected earnings before interest, taxes, depreciation and amortization (“EBITDA”). In applying this methodology, we relied on a number of factors, including actual and forecasted operating results and market data for the nail enamel industry. Discounted cash flow calculations represent a common measure used to value and buy or sell businesses in our industry. The discounted cash flow used in the goodwill impairment test for Kirker assumed discrete period revenue growth through fiscal 2021 that was reflective of recent downward revisions to previous expectations for future growth from market opportunities related to contracting with certain retailers to fill nail polish for their respective private label brands as well as downward revisions to growth expectations for the Kirker liquid nail polish business below the expected liquid nail polish growth rates for the markets in which Kirker operates. In the terminal year we assumed a long-term earnings growth rate of 3.0% that we believe is appropriate given the current industry specific expectations. As of the valuation date, we utilized a weighted-average cost of capital of 8.0%, which we believe is appropriate as it reflects the relative risk, the time
RPM International Inc. and Subsidiaries42

value of money, and is consistent with Kirker’s peer group. After recording the goodwill impairment charge of $140.5 million, no goodwill remained on the Kirker balance sheets as of November 30, 3016.
Our other intangible asset impairment assessment involved estimating the fair value of each of Kirker’s amortizable intangibles and other long-lived assets as well as the indefinite-lived tradename asset and comparing it with its carrying amount. Measuring a potential impairment of amortizable intangibles and other long-lived assets requires the use of various estimates and assumptions, including the determination of which cash flows are directly related to the assets being evaluated, the respective useful lives over which those cash flows will occur and potential residual values, if any. As the results of our testing indicated that the carrying values of certain of these assets would not be recoverable, as outlined in further detail in the table above, we recorded other intangible asset impairments of approximately $46.0 million during the fiscal year ended May 31, 2017.
Calculating the fair value of the Kirker indefinite-lived tradename required our significant use of estimates and assumptions. We estimated the fair value of Kirker’s indefinite-lived tradename by applying a relief-from-royalty calculation, which included discounted future cash flows related to its projected revenues. In applying this methodology, we relied on a number of factors, including actual and forecasted revenues and market data for the nail enamel industry. As the carrying amount of the tradename exceeded its fair value, we recorded an impairment loss of approximately $2.1 million during the fiscal year ended May 31, 2017.
Certain assets and liabilities are subject to nonrecurring fair value measurements, which typically are remeasured at fair value as a result of impairment charges. As a result of the impairment testing described above, the fair value of Kirker’s identifiable intangible assets and indefinite-lived tradename were recalculated, and the resulting fair value approximated $5.8 million. Based upon our review of the fair value hierarchy,
the inputs used in these fair value measurements were considered Level 3 inputs.
During the third quarter of fiscal 2017, we identified certain factors that we considered important in assessing the requirement to perform an interim impairment evaluation for our Restore indefinite tradename asset. First, sales of our Restore product line during the quarter ended February 28, 2017 were below historical and expected operating results and significant downward adjustments were recently made to sales projections for Restore products. In the quarter ended February 28, 2017, we became aware that it was highly likely that Restore’s largest customer would discontinue sales of the Restore product line in its retail stores, which was evidenced by this customer’s significant reduction in future orders based on its historical order pattern. We determined that this was significant to consider for the purposes of impairment testing, as sales of Restore products to this customer accounted for over 60% of total sales of Restore products for fiscal 2016. After considering the magnitude of the loss in sales volume from this key customer, we determined that it was necessary to perform an interim assessment for the other intangible assets and indefinite-lived tradename related to the Restore product line.
Our impairment assessment involved estimating the fair value of the indefinite-lived tradename and comparing it with its carrying amount. Calculating the fair value of the Restore indefinite-lived tradename required our significant use of estimates and assumptions. We estimated the fair value of the Restore indefinite-lived tradename by applying a relief-from-royalty calculation, which included discounted future cash flows related to its projected revenues. In applying this methodology, we relied on a number of factors, including actual and forecasted revenues for sales of the Restore product line. As the carrying amount of the tradename exceeded its fair value, we recorded an impairment charge of $4.9 million during the fiscal year ended May 31, 2017. Additionally, a further assessment of the remaining useful life of the Restore tradename was performed, which resulted in a change to its remaining economic useful life, from an indefinite-life to a 10-year amortizable life.
NOTE C — MARKETABLE SECURITIES
The following tables summarize marketable securities held at May 31, 2017 and 2016 by asset type:
Available-For-Sale Securities
Gross Gross Fair Value Amortized Unrealized Unrealized (Net Carrying (In thousands) Cost Gains Losses Amount)
May 31, 2017 Equity securities: Stocks - domestic $ 2,391 $ 76 $ - $ 2,467 Mutual funds - foreign 35,169 2,470 (204) 37,435 Mutual funds - domestic 102,671 2,084 (3,118) 101,637
Total equity securities 140,231 4,630 (3,322) 141,539Fixed maturity: U.S. treasury and other government 22,176 120 (177) 22,119 Corporate bonds 706 97 (6) 797
Total fixed maturity securities 22,882 217 (183) 22,916
Total $ 163,113 $ 4,847 $ (3,505) $ 164,455
RPM International Inc. and Subsidiaries 43
Managem
ent’s Discussion and A
nalysis Consolidated Financial Statements N
otes to Consolidated Financial Statements Q
uarterly Stock Price and Dividend Inform
ation Managem
ent’s Report Auditors’ Reports Stockholder Inform
ation

Available-For-Sale Securities
Gross Gross Fair Value Amortized Unrealized Unrealized (Net Carrying (In thousands) Cost Gains Losses Amount)
May 31, 2016 Equity securities: Stocks - foreign $ 5,051 $ 439 $ (247) $ 5,243 Stocks - domestic 27,717 3,831 (911) 30,637 Mutual funds - foreign 35,903 802 (4,357) 32,348 Mutual funds - domestic 60,354 99 (4,587) 55,866
Total equity securities 129,025 5,171 (10,102) 124,094Fixed maturity: U.S. treasury and other government 21,704 214 (80) 21,838 Corporate bonds 887 137 - 1,024
Total fixed maturity securities 22,591 351 (80) 22,862
Total $ 151,616 $ 5,522 $ (10,182) $ 146,956
Marketable securities, included in other current and long-term assets totaling $89.5 million and $75.0 million at May 31, 2017, respectively, and included in other current and long-term assets totaling $74.2 million and $72.8 million at May 31, 2016, respectively, are composed of available-for-sale securities and are reported at fair value. We carry a portion of our marketable securities portfolio in long-term assets since they are generally held for the settlement of our general and product liability insurance claims processed through our wholly owned captive insurance subsidiaries.
Marketable securities are composed of available-for-sale securities and are reported at fair value. Realized gains and losses on sales of investments are recognized in net income on the specific identification basis. Changes in the fair values of securities that are considered temporary are recorded as unrealized gains and losses, net of applicable taxes, in accumulated other comprehensive income (loss) within stockholders’ equity. Other-than-temporary declines in market value from original cost are reflected in investment income, net in the period in which the unrealized losses are deemed other than temporary. In order to determine whether other-
than-temporary declines in market value have occurred, the duration of the decline in value and our ability to hold the investment are considered in conjunction with an evaluation of the strength of the underlying collateral and the extent to which the investment’s amortized cost or cost, as appropriate, exceeds its related market value. During May 2017, we made the decision to shift a portion of our investments away from active equity portfolio management and into index funds, and from time to time, we may make additional changes to our investment portfolio and its management.
Gross gains realized on sales of investments were $12.6 million, $6.9 million and $8.8 million for the years ended May 31, 2017, 2016 and 2015, respectively. During fiscal 2017, 2016 and 2015, we recognized gross realized losses on sales of investments of $4.4 million, $0.4 million and $0.1 million, respectively. During fiscal 2017 and 2016, we recognized losses of approximately $0.4 million and $3.8 million, respectively, for securities deemed to have other-than-temporary impairments. During fiscal 2015, such losses were insignificant. These amounts are included in investment (income), net in the Consolidated Statements of Income.
Summarized below are the securities we held at May 31, 2017 and May 31, 2016 that were in an unrealized loss position and that were included in accumulated other comprehensive income (loss), aggregated by the length of time the investments had been in that position:
May 31, 2017 May 31, 2016
Gross Gross Unrealized Unrealized (In thousands) Fair Value Losses Fair Value Losses
Total investments with unrealized losses $ 59,987 $ (3,505) $ 89,360 $ (10,182)Unrealized losses with a loss position for less than 12 months 40,854 (2,983) 41,762 (4,856)Unrealized losses with a loss position for more than 12 months 19,133 (522) 47,598 (5,326)
We have reviewed all of the securities included in the table above and have concluded that we have the ability and intent to hold these investments until their cost can be recovered, based upon the severity and duration of the decline. Therefore, we did not recognize any other-than-temporary impairment losses on these investments. The unrealized losses generally relate to investments whose fair values at May 31, 2017 were less than 15% below their original cost. From time to time, we may experience significant volatility in general economic and market conditions. If we were to experience unrealized losses that were to continue for longer periods of time, or arise to more significant levels of unrealized losses within our portfolio of investments in marketable securities in the future, we may recognize additional other-than-temporary impairment losses. Such potential losses could have a material impact on our results of operations in any given reporting period. As such, we continue to closely evaluate the status of our investments and our ability and intent to hold these investments.
The net carrying values of debt securities at May 31, 2017, by contractual maturity, are shown below. Expected maturities may differ from contractual maturities because the issuers of the securities may have the right to prepay obligations without prepayment penalties.
(In thousands) Amortized Cost Fair Value
Due: Less than one year $ 4,618 $ 4,617 One year through five years 13,894 13,824 Six years through ten years 3,149 3,152 After ten years 1,221 1,323
$ 22,882 $ 22,916
RPM International Inc. and Subsidiaries44

NOTE D — FAIR VALUE MEASUREMENTS
Financial instruments recorded in the balance sheet include cash and cash equivalents, trade accounts receivable, marketable securities, notes and accounts payable, and debt.
An allowance for anticipated uncollectible trade receivable amounts is established using a combination of specifically identified accounts to be reserved, and a reserve covering trends in collectibility. These estimates are based on an analysis of trends in collectibility and past experience, but are primarily made up of individual account balances identified as doubtful based on specific facts and conditions. Receivable losses are charged against the allowance when we confirm uncollectibility.
All derivative instruments are recognized in our Consolidated Balance Sheets and measured at fair value. Changes in the fair values of derivative instruments that do not qualify as hedges and/or any ineffective portion of hedges are recognized as a gain or (loss) in our Consolidated Statements of Income in the current period. Changes in the fair value of derivative instruments used effectively as cash flow hedges are recognized in other comprehensive income (loss), along with the change in
the value of the hedged item. We do not hold or issue derivative instruments for speculative purposes.
The valuation techniques utilized for establishing the fair values of assets and liabilities are based on observable and unobservable inputs. Observable inputs reflect readily obtainable data from independent sources, while unobservable inputs reflect management’s market assumptions. The fair value hierarchy has three levels based on the reliability of the inputs used to determine fair value, as follows:
Level 1 Inputs — Quoted prices for identical instruments in active markets.
Level 2 Inputs — Quoted prices for similar instruments in active markets; quoted prices for identical or similar instruments in markets that are not active; and model-derived valuations whose inputs are observable or whose significant value drivers are observable.
Level 3 Inputs — Instruments with primarily unobservable value drivers.
The following tables present our assets and liabilities that are measured at fair value on a recurring basis and are categorized using the fair value hierarchy.
Quoted Prices Significant in Active Markets Other Significant for Identical Observable Unobservable Fair Value at (In thousands) Assets (Level 1) Inputs (Level 2) Inputs (Level 3) May 31, 2017
U.S. Treasury and other government $ - $ 22,119 $ - $ 22,119 Corporate bonds 797 797Stocks - domestic 2,467 2,467Mutual funds - foreign 37,435 37,435Mutual funds - domestic 101,637 101,637Contingent consideration (17,979) (17,979)
Total $ 2,467 $ 161,988 $ (17,979) $ 146,476
Quoted Prices Significant in Active Markets Other Significant for Identical Observable Unobservable Fair Value at (In thousands) Assets (Level 1) Inputs (Level 2) Inputs (Level 3) May 31, 2016
U.S. Treasury and other government $ - $ 21,838 $ - $ 21,838 Corporate bonds 1,024 1,024Stocks - foreign 5,243 5,243Stocks - domestic 30,637 30,637Mutual funds - foreign 32,348 32,348Mutual funds - domestic 55,866 55,866Foreign currency forward contract (159) (159)Contingent consideration (11,771) (11,771)
Total $ 35,880 $ 110,917 $ (11,771) $ 135,026
Our marketable securities are primarily composed of available-for-sale securities, and are valued using a market approach. The availability of inputs observable in the market varies from instrument to instrument and depends on a variety of factors including the type of instrument, whether the instrument is actively traded, and other characteristics particular to the transaction. For most of our financial instruments, pricing inputs are readily observable in the market, the valuation methodology used is widely accepted by market participants, and the valuation does not require significant management discretion. For other financial instruments, pricing inputs are less observable in the market and may require management judgment.
At May 31, 2016, we had a foreign currency forward contract with a fair value of approximately $0.2 million, which is classified in other accrued liabilities in our Consolidated Balance Sheets. The balance for this foreign currency forward contract was not significant at May 31, 2017. Our foreign currency forward contract, which has not been designated as a hedge,
was designed to reduce our exposure to the changes in the cash flows of intercompany foreign-currency-denominated loans related to changes in foreign currency exchange rates by fixing the functional currency cash flows. The foreign exchange rates included in the forward contract are based upon observable market data, but are not quoted market prices, and therefore, the forward currency forward contract is considered a Level 2 liability on the fair value hierarchy.
The contingent consideration represents the estimated fair value of the additional variable cash consideration payable in connection with recent acquisitions that is contingent upon the achievement of certain performance milestones. We estimated the fair value using expected future cash flows over the period in which the obligation is expected to be settled, and applied a discount rate that appropriately captures a market participant’s view of the risk associated with the obligation, which are considered to be Level 3 inputs. During fiscal 2017, we accrued approximately $7.4 million for additional contingent payments related to new acquisitions, which included the estimated
RPM International Inc. and Subsidiaries 45
Managem
ent’s Discussion and A
nalysis Consolidated Financial Statements N
otes to Consolidated Financial Statements Q
uarterly Stock Price and Dividend Inform
ation Managem
ent’s Report Auditors’ Reports Stockholder Inform
ation

amount for the mandatory purchase of a step-acquisitions, and $3.0 million for fair value adjustments to existing accruals. Additionally during fiscal 2017, we paid approximately $4.2 million for settlements of contingent consideration obligations relating to certain performance milestones that were established in prior periods and achieved during the current period. These amounts are reported in payments of acquisition-related contingent consideration in the Consolidated Statements of Cash Flows.
The carrying value of our current financial instruments, which include cash and cash equivalents, marketable securities, trade accounts receivable, accounts payable and short-term debt approximates fair value because of the short-term maturity of these financial instruments. At May 31, 2017 and May 31, 2016, the fair value of our long-term debt was estimated using active market quotes, based on our current incremental borrowing rates for similar types of borrowing arrangements, which are considered to be Level 2 inputs. Based on the analysis performed, the fair value and the carrying value of our financial instruments and long-term debt as of May 31, 2017 and May 31, 2016 are as follows:
At May 31, 2017
(In thousands) Carrying Value Fair Value
Cash and cash equivalents $ 350,497 $ 350,497
Marketable equity securities 141,539 141,539
Marketable debt securities 22,916 22,916
Long-term debt, including current portion 2,090,082 2,243,167
At May 31, 2016
(In thousands) Carrying Value Fair Value
Cash and cash equivalents $ 265,152 $ 265,152
Marketable equity securities 124,094 124,094
Marketable debt securities 22,862 22,862
Long-term debt, including current portion 1,639,973 1,769,601
NOTE E — BORROWINGS
A description of long-term debt follows:
May 31, 2017 2016
(In thousands) Revolving credit facility with a syndicate of banks, through December 5, 2019 (1) $ 198,280 $ 199,037 Unsecured 6.50% senior notes due February 14, 2018 (2) 249,555 248,940Unsecured 6.125% senior notes due October 15, 2019 (3) 452,778 453,821Unsecured $205,000 face value at maturity 2.25% senior convertible notes due December 15, 2020 193,260 189,265Unsecured 3.45% senior notes due November 15, 2022 298,370 298,067Unsecured 5.25% notes due June 1, 2045 (4) 298,433 245,889Unsecured 3.75% notes due March 15, 2027 (5) 395,638 Other obligations, including capital leases and unsecured notes payable at various rates of interest due in installments through 2018 3,768 4,954
2,090,082 1,639,973Less: current portion 253,645 4,713
Total Long-Term Debt, Less Current Maturities $ 1,836,437 $ 1,635,260
(1) Interest was tied to AUD LIBOR at May 31, 2017, and averaged 2.705% for AUD denominated debt ($17,311) and 1.075% on EUR denominated debt ($183,012). Interest was tied to AUD LIBOR at May 31, 2016, and averaged 2.92% for AUD denominated debt ($13,050), 1.075% on EUR denominated debt ($131,692) and 1.544% on our swing-line ($57,139). At May 31, 2017 and 2016, the revolving credit facility is adjusted for debt issuance costs, net of amortization, for approximately $2.0 million and $2.8 million, respectively.
(2) The $250.0 million aggregate principal amount of the notes due 2018 is adjusted for the amortization of the original issue discount, which approximated $0.3 million and $0.6 million at May 31, 2017 and 2016, respectively. The original issue discount effectively reduced the ultimate proceeds from the financing. The effective interest rate on the notes, including the amortization of the discount, is 6.704% for both years presented. At May 31, 2017 and 2016, the notes are adjusted for debt issuance costs, net of amortization, for approximately $0.2 million and $0.4 million, respectively.
(3) Includes the combination of the October 2009 initial issuance of $300.0 million aggregate principal amount and the May 2011 issuance of an additional $150.0 million aggregate principal amount of these notes. The $300.0 million aggregate principal amount of the notes due 2019 from the initial issuance is adjusted for the amortization of the original issue discount, which approximated $0.1 million and $0.1 million at May 31, 2017 and 2016. The original issue discount effectively reduced the ultimate proceeds from the October 2009 financing. The effective interest rate on the notes issued in October 2009, including the amortization of the discount, is 6.139%. The additional $150.0 million aggregate principal amount of the notes due 2019 issued in May 2011 is adjusted for the unamortized premium received at issuance, which approximated $3.9 million and $5.5 million at May 31, 2017 and 2016, respectively. The premium effectively increased the proceeds from the financing. The effective interest rate on the $150.0 million notes issued in May 2011 is 4.934%. At May 31, 2017 and 2016, the notes are adjusted for debt issuance costs, net of amortization, for approximately $1.1 million and $1.6 million, respectively.
(4) The $250.0 million face amount of the notes due 2045 is adjusted for the amortization of the original issue discount, which approximated $1.5 million at May 31, 2017 and 2016. The original issue discount effectively reduced the ultimate proceeds from the financing. The effective interest rate on the notes, including the amortization of the discount, is 5.29%. In March 2017, as a further issuance of the 5.25% notes due 2045, we closed an offering of $50.0 million aggregate principal, which is adjusted for the unamortized premium received at issuance, which approximated $3.1 million at May 31, 2017. The premium effectively increased the proceeds from the financing. The effective interest rate on the $50.0 million notes issued March 2017 is 4.839%. At May 31, 2017 and 2016, the notes are adjusted for debt issuance costs, net of amortization, for approximately $3.2 million and $2.6 million, respectively.
(5) The $400.0 million face amount of the notes due 2027 is adjusted for the amortization of the original issue discount and debt issuance cost, net of amortization, which approximated $0.5 million and $3.8 million, respectively, at May 31, 2017. The original issue discount effectively reduced the ultimate proceeds from the financing. The effective interest rate on the notes, including the amortization of the discount, is 3.750%.
The aggregate maturities of long-term debt for the five years subsequent to May 31, 2017 are as follows: 2018 — $253.6 million; 2019 — none; 2020 — $650.8 million; 2021 — $193.3 million; 2022 — none and thereafter $992.4 million. Additionally, at May 31, 2017, we had unused lines of credit totaling $799.1 million.
RPM International Inc. and Subsidiaries46

Our available liquidity, including our cash and cash equivalents and amounts available under our committed credit facilities, stood at $1.15 billion at May 31, 2017. Our debt-to-capital ratio was 59.3% at May 31, 2017, compared with 54.4% at May 31, 2016.
5.250% Notes due 2045 and 3.750% Notes due 2027
On March 2, 2017, we issued $50.0 million aggregate principal amount of 5.250% Notes due 2045 (the “2045 Notes”) and $400.0 million aggregate principal amount of 3.750% Notes due 2027 (the “2027 Notes”). The 2045 Notes are a further issuance of the $250 million aggregate principal amount of 5.250% Notes due 2045 initially issued by us on May 29, 2015. Interest on the 2045 Notes accrues from December 1, 2016 and is payable semiannually in arrears on June 1st and December 1st of each year, beginning June 1, 2017, at a rate of 5.250% per year. The 2045 Notes mature on June 1, 2045. Interest on the 2027 Notes accrues from March 2, 2017 and is payable semiannually in arrears on March 15th and September 15th of each year, beginning September 15, 2017, at a rate of 3.750% per year. The 2027 Notes mature on March 15, 2027. The indenture governing this indebtedness includes cross-acceleration provisions. Under certain circumstances, where an event of default under our other instruments results in acceleration of the indebtedness under such instruments, holders of the indebtedness under the indenture are entitled to declare amounts outstanding immediately due and payable.
Revolving Credit Agreement
During fiscal 2015, we entered into an $800.0 million unsecured syndicated revolving credit facility (the “New Revolving Credit Facility”), which expires on December 5, 2019. The New Revolving Credit Facility replaced our prior $600.0 million revolving credit facility.
The New Revolving Credit Facility includes sublimits for the issuance of swingline loans, which are comparatively short-term loans used for working capital purposes and letters of credit. The aggregate maximum principal amount of the commitments under the New Revolving Credit Facility may be expanded upon our request, subject to certain conditions, up to $1.0 billion. The New Revolving Credit Facility is available to refinance existing indebtedness, to finance working capital and capital expenditures, to satisfy all or a portion of our obligations relating to the plan of reorganization for our SPHC subsidiary, and for general corporate purposes.
The New Revolving Credit Facility requires us to comply with various customary affirmative and negative covenants, including a leverage covenant and interest coverage ratio, which are calculated in accordance with the terms as defined by the credit agreement. Under the terms of the leverage covenant, we may not permit our consolidated indebtedness as of any fiscal quarter end to exceed 65% of the sum of such indebtedness and our consolidated shareholders’ equity on such date. The minimum required consolidated interest coverage ratio for EBITDA to interest expense is 3.50 to 1. The interest coverage ratio is calculated at the end of each fiscal quarter for the four fiscal quarters then ended using an EBITDA as defined in the credit agreement.
As of May 31, 2017, we were in compliance with all financial covenants contained in our New Revolving Credit Facility, including the leverage and interest coverage ratio covenants. At that date, our leverage ratio was 58.1%, while our interest coverage ratio was 9.2 to 1. Our available liquidity under our New Revolving Credit Facility stood at $599.1 million at May 31, 2017.
Our access to funds under our New Revolving Credit Facility is dependent on the ability of the financial institutions that are parties to the New Revolving Credit Facility to meet their funding commitments. Those financial institutions may not be able to
meet their funding commitments if they experience shortages of capital and liquidity or if they experience excessive volumes of borrowing requests within a short period of time. Moreover, the obligations of the financial institutions under our New Revolving Credit Facility are several and not joint and, as a result, a funding default by one or more institutions does not need to be made up by the others.
As previously reported, during fiscal 2015, a plan of reorganization was confirmed (the “Bankruptcy Plan”) and, effective as of December 23, 2014, Bondex, SPHC, Republic and NMBFiL emerged from bankruptcy. Accordingly, trusts were established under Section 524(g) of the United States Bankruptcy Code (together, the “Trust”) and were funded with first installments. Borrowings under our New Revolving Credit Facility were used to fund the initial trust payment of $450 million, which is classified as long-term debt in our Consolidated Balance Sheets. The Trust was funded with $450 million in cash and a promissory note, bearing no interest and maturing on or before December 23, 2018 (the “Bankruptcy Note”). There is one remaining trust payment due. The net present value of the Bankruptcy Note, or $120.4 million, is classified as other long-term liabilities in our consolidated financial statements at May 31, 2017. A portion of the payments due under the Bankruptcy Note is secured by a right to the equity of SPHC, Republic and Bondex. The Bankruptcy Plan, and Bankruptcy Note, provide for the following additional contributions to the Trust:
• On or before December 23, 2016, an additional $102.5 million in cash, RPM stock or a combination thereof (at our discretion in this and all subsequent cases) was required to be deposited into the Trust (and on December 23, 2016, $102.5 million in cash was deposited into the Trust);
• On or before December 23, 2017, an additional $120 million in cash, RPM stock or a combination thereof will be deposited into the Trust (and on May 25, 2017, this payment obligation was fully settled with a $119.1 million cash deposit into the Trust, reflecting a 1.25% discount rate for early payment); and
• On or before December 23, 2018, a final payment of $125 million in cash, RPM stock or a combination thereof will be deposited into the Trust.
Total current and future contributions to the Trust are deductible for U.S. income tax purposes.
Accounts Receivable Securitization Program
On May 9, 2017, we entered into a new, three-year, $200.0 million accounts receivable securitization facility (the “AR Program”). The maximum availability under the AR Program is $200.0 million. Availability is further subject to changes in the credit ratings of our customers, customer concentration levels or certain characteristics of the accounts receivable being transferred and therefore at certain times we may not be able to fully access the $200.0 million of funding available under the AR Program.
As of May 31, 2017, there was no outstanding balance under the AR Program, which compares with the maximum availability on that date of $200.0 million. The interest rate under the Purchase Agreement is based on the Alternate Base Rate, LIBOR Market Index Rate, one-month LIBOR or LIBOR for a specified tranche period, as selected by us, plus in each case, a margin of 0.70%. In addition, we are obligated to pay a monthly unused commitment fee based on the daily amount of unused commitments under the Agreement, which fee ranges from 0.30% to 0.50% based on usage. The AR Program contains various customary affirmative and negative covenants and also contains customary default and termination provisions.
RPM International Inc. and Subsidiaries 47
Managem
ent’s Discussion and A
nalysis Consolidated Financial Statements N
otes to Consolidated Financial Statements Q
uarterly Stock Price and Dividend Inform
ation Managem
ent’s Report Auditors’ Reports Stockholder Inform
ation
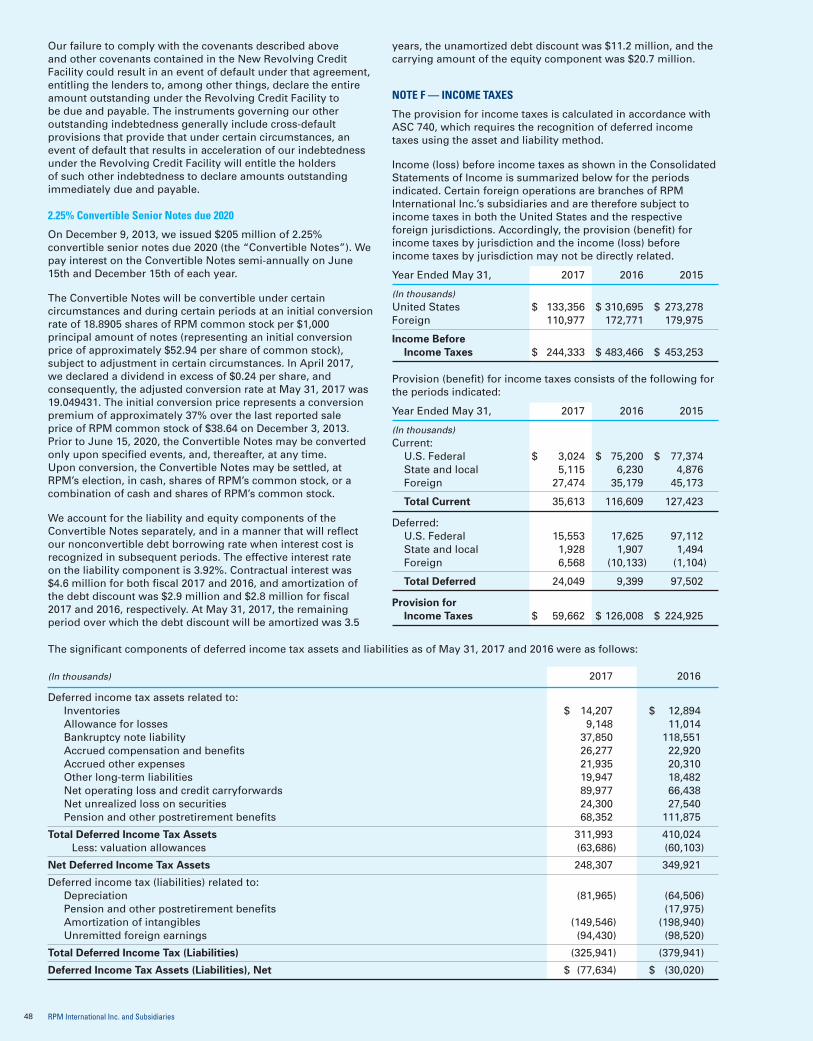
Our failure to comply with the covenants described above and other covenants contained in the New Revolving Credit Facility could result in an event of default under that agreement, entitling the lenders to, among other things, declare the entire amount outstanding under the Revolving Credit Facility to be due and payable. The instruments governing our other outstanding indebtedness generally include cross-default provisions that provide that under certain circumstances, an event of default that results in acceleration of our indebtedness under the Revolving Credit Facility will entitle the holders of such other indebtedness to declare amounts outstanding immediately due and payable.
2.25% Convertible Senior Notes due 2020
On December 9, 2013, we issued $205 million of 2.25% convertible senior notes due 2020 (the “Convertible Notes”). We pay interest on the Convertible Notes semi-annually on June 15th and December 15th of each year.
The Convertible Notes will be convertible under certain circumstances and during certain periods at an initial conversion rate of 18.8905 shares of RPM common stock per $1,000 principal amount of notes (representing an initial conversion price of approximately $52.94 per share of common stock), subject to adjustment in certain circumstances. In April 2017, we declared a dividend in excess of $0.24 per share, and consequently, the adjusted conversion rate at May 31, 2017 was 19.049431. The initial conversion price represents a conversion premium of approximately 37% over the last reported sale price of RPM common stock of $38.64 on December 3, 2013. Prior to June 15, 2020, the Convertible Notes may be converted only upon specified events, and, thereafter, at any time. Upon conversion, the Convertible Notes may be settled, at RPM’s election, in cash, shares of RPM’s common stock, or a combination of cash and shares of RPM’s common stock.
We account for the liability and equity components of the Convertible Notes separately, and in a manner that will reflect our nonconvertible debt borrowing rate when interest cost is recognized in subsequent periods. The effective interest rate on the liability component is 3.92%. Contractual interest was $4.6 million for both fiscal 2017 and 2016, and amortization of the debt discount was $2.9 million and $2.8 million for fiscal 2017 and 2016, respectively. At May 31, 2017, the remaining period over which the debt discount will be amortized was 3.5
years, the unamortized debt discount was $11.2 million, and the carrying amount of the equity component was $20.7 million.
NOTE F — INCOME TAXES
The provision for income taxes is calculated in accordance with ASC 740, which requires the recognition of deferred income taxes using the asset and liability method.
Income (loss) before income taxes as shown in the Consolidated Statements of Income is summarized below for the periods indicated. Certain foreign operations are branches of RPM International Inc.’s subsidiaries and are therefore subject to income taxes in both the United States and the respective foreign jurisdictions. Accordingly, the provision (benefit) for income taxes by jurisdiction and the income (loss) before income taxes by jurisdiction may not be directly related.
Year Ended May 31, 2017 2016 2015
(In thousands) United States $ 133,356 $ 310,695 $ 273,278Foreign 110,977 172,771 179,975
Income Before Income Taxes $ 244,333 $ 483,466 $ 453,253
Provision (benefit) for income taxes consists of the following for the periods indicated:
Year Ended May 31, 2017 2016 2015
(In thousands) Current: U.S. Federal $ 3,024 $ 75,200 $ 77,374 State and local 5,115 6,230 4,876 Foreign 27,474 35,179 45,173
Total Current 35,613 116,609 127,423
Deferred: U.S. Federal 15,553 17,625 97,112 State and local 1,928 1,907 1,494 Foreign 6,568 (10,133) (1,104)
Total Deferred 24,049 9,399 97,502
Provision for Income Taxes $ 59,662 $ 126,008 $ 224,925
The significant components of deferred income tax assets and liabilities as of May 31, 2017 and 2016 were as follows:
(In thousands) 2017 2016
Deferred income tax assets related to: Inventories $ 14,207 $ 12,894 Allowance for losses 9,148 11,014 Bankruptcy note liability 37,850 118,551 Accrued compensation and benefits 26,277 22,920 Accrued other expenses 21,935 20,310 Other long-term liabilities 19,947 18,482 Net operating loss and credit carryforwards 89,977 66,438 Net unrealized loss on securities 24,300 27,540 Pension and other postretirement benefits 68,352 111,875
Total Deferred Income Tax Assets 311,993 410,024 Less: valuation allowances (63,686) (60,103)
Net Deferred Income Tax Assets 248,307 349,921
Deferred income tax (liabilities) related to: Depreciation (81,965) (64,506) Pension and other postretirement benefits (17,975) Amortization of intangibles (149,546) (198,940) Unremitted foreign earnings (94,430) (98,520)
Total Deferred Income Tax (Liabilities) (325,941) (379,941)
Deferred Income Tax Assets (Liabilities), Net $ (77,634) $ (30,020)
RPM International Inc. and Subsidiaries48

At May 31, 2017, we had U.S. federal foreign tax credit carryforwards of approximately $33.4 million, which expire in various years ending in 2027. Additionally, at May 31, 2017, we had approximately $68.8 million of state net operating loss carryforwards that expire at various dates beginning in 2018 and foreign net operating loss carryforwards of approximately $170.0 million, of which approximately $22.2 million will expire at various dates beginning in 2018 and approximately $147.8 million that have an indefinite carryforward period. Also, as of May 31, 2017, we had foreign capital loss carryforwards of approximately $14.2 million that can be carried forward indefinitely. These net operating loss, capital loss and foreign tax credit carryforwards may be used to offset a portion of future taxable income and, thereby, reduce or eliminate our U.S. federal, state or foreign income taxes otherwise payable.
When evaluating the realizability of deferred income tax assets, we consider, among other items, whether a jurisdiction has experienced cumulative pretax losses and whether a jurisdiction will generate the appropriate character of income to recognize a deferred income tax asset. More specifically, if a jurisdiction experiences cumulative pretax losses for a period of three years, including the current fiscal year, or if a jurisdiction does not have sufficient income of the appropriate character in the relevant carryback or projected carryforward periods, we generally conclude that it is more likely than not that the respective deferred tax asset will not be realized unless factors such as expected operational changes, availability of prudent and feasible tax planning strategies, reversal of taxable temporary differences or other information exists that would lead us to conclude otherwise. If, after we have evaluated these factors, the deferred income tax assets are not expected to be realized within the carryforward or carryback periods allowed for that jurisdiction, we would conclude that a valuation allowance is required. To the extent that the deferred income tax asset is expected to be utilized within the carryback or carryforward periods, we would conclude that a valuation allowance would not be required.
In applying the above, we determined, based on the available evidence that future taxable income from certain of our foreign subsidiaries will be sufficient to recognize corresponding deferred tax asset that were previously subject to valuation allowances. As a result, during this fiscal year, we recorded income tax expense of $0.9 million in connection with a net increase in valuation allowances associated with the estimated utilization of foreign net operating loss carryforwards and other foreign deferred tax assets. For the year ended May 31, 2016, we recorded net reduction in valuation allowances associated with the estimated utilization of foreign net operating loss carryforwards of $5.8 million. This benefit was partially offset by $2.4 million of additions to valuation allowances for other foreign deferred tax assets. For the year ended May 31, 2015, we determined that future U.S. taxable income along with anticipated foreign source income, will be sufficient to recognize foreign tax and other credit carryforwards of approximately $12.0 million that were previously subject to valuation allowances. The benefit was partially offset by approximately $1.5 million of other incremental adjustments to the valuation allowances. Further, we believe it is uncertain whether future taxable income of certain of our foreign subsidiaries and future taxable income of the appropriate character will be sufficient to recognize the remaining corresponding deferred tax assets. Accordingly, we intend to maintain the recorded valuation allowances until sufficient positive evidence exists to support a reversal of the tax valuation allowances.
Total valuation allowances of approximately $63.7 million and $60.1 million have been recorded as of May 31, 2017 and 2016, respectively. The recorded valuation allowances relate to foreign capital loss carryforwards, certain foreign net operating losses, net foreign deferred tax assets and unrealized losses on securities.
The following table reconciles income tax expense (benefit) computed by applying the U.S. statutory federal income tax rate against income (loss) before income taxes to the provision (benefit) for income taxes:
Year Ended May 31, 2017 2016 2015
(In thousands) Income tax expense at the U.S. statutory federal income tax rate $ 85,517 $ 169,213 $ 158,638Impact of foreign operations (20,156) (29,969) (32,706)State and local income taxes, net of federal income tax benefit 4,734 4,310 4,140Tax benefits from the domestic manufacturing deduction (2,537) (8,030) -Nondeductible business expense 2,394 2,224 1,782Valuation allowance 933 (3,357) (10,455)Unremitted foreign earnings (621) (3,712) 106,227Non-taxable gain from joint venture remeasurement - (2,790) -Tax Benefits from Employee Share-Based Payments (12,078)Other 1,476 (1,881) (2,701)
Provision for Income Tax Expense $ 59,662 $ 126,008 $ 224,925
Effective Income Tax Rate 24.4% 26.1% 49.6%
Uncertain income tax positions are accounted for in accordance with ASC 740. The following table summarizes the activity related to unrecognized tax benefits:
(In millions) 2017 2016 2015
Balance at June 1 $ 13.7 $ 12.9 $ 15.7 Additions based on tax positions related to current year 0.2 0.3 - Additions for tax positions of prior years 2.9 2.6 0.9 Reductions for tax positions of prior years (3.2) (1.4) (1.5) Foreign currency translation (0.4) (0.7) (2.2)
Balance at May 31 $ 13.2 $ 13.7 $ 12.9
The total amount of unrecognized tax benefits that would impact the effective tax rate, if recognized, was $4.6 million at May 31, 2017, $2.5 million at May 31, 2016 and $3.9 million at May 31, 2015. We do not anticipate any significant changes to the above total unrecognized tax benefits within the next 12 months.
We recognize interest and penalties related to unrecognized tax benefits in income tax expense. At May 31, 2017, 2016 and 2015, the accrual for interest and penalties was $3.1 million, $2.8 million and $3.8 million, respectively. Unrecognized tax benefits, including interest and penalties, have been classified as other long-term liabilities unless expected to be paid in one year.
We, or our subsidiaries, file income tax returns in the U.S. and in various state, local and foreign jurisdictions. The Internal Revenue Service (“IRS”) has notified us of an examination of our 2015 federal income tax return and the statutory audit period has expired for all years through 2013. Further, with limited
RPM International Inc. and Subsidiaries 49
Managem
ent’s Discussion and A
nalysis Consolidated Financial Statements N
otes to Consolidated Financial Statements Q
uarterly Stock Price and Dividend Inform
ation Managem
ent’s Report Auditors’ Reports Stockholder Inform
ation

exceptions, we, or our subsidiaries, are generally subject to state and local or non-U.S. income tax examinations by tax authorities for the fiscal years 2010 through 2016.
We are currently under examination, or have been notified of an upcoming tax examination for various non-U.S. and domestic state and local jurisdictions. Although it is possible that certain tax examinations could be resolved during the next 12 months, the timing and outcomes are uncertain.
At May 31, 2016, we determined that it was possible that we could repatriate approximately $377.3 million of unremitted foreign earnings in the foreseeable future. Accordingly, as of May 31, 2016, we recorded a deferred income tax liability of $98.5 million, which represented our estimate of the U.S. income and foreign withholding tax associated with the $377.3 million of undistributed foreign earnings not considered permanently reinvested. As of May 31, 2017, the amount of undistributed earnings that may be repatriated is $324.1 million and the corresponding deferred tax liability has been reduced to $94.4 million. This reduction in the amount of unremitted foreign earnings that are not considered permanently reinvested is primarily due to foreign currency revaluations and actual distributions of foreign earnings during the year. The reduction to the deferred tax liability related to foreign currency revaluation was approximately $3.5 million, which was recorded in accumulated other comprehensive income (loss).
We have not provided for U.S. income taxes or foreign withholding taxes on the remaining $1.4 billion of foreign undistributed earnings because such earnings have been retained and reinvested by the foreign subsidiaries as of May 31, 2017. Accordingly, no provision has been made for U.S. income taxes or foreign withholding taxes, which may become payable if the remaining undistributed earnings of foreign subsidiaries were distributed to the U.S. Due to the uncertainties and complexities involved in the various options for repatriation of foreign earnings, it is not practical to calculate the deferred taxes associated with the remaining foreign earnings.
NOTE G — COMMON STOCK
On January 8, 2008, we announced our authorization of a stock repurchase program under which we may repurchase shares of RPM International Inc. common stock at management’s discretion for general corporate purposes. Our current intent is to limit our repurchases to approximately one to two million shares per year, which would include amounts required to offset dilution created by stock issued in connection with our equity-based compensation plans and other repurchases. As a result of this authorization, we may repurchase shares from time to time in the open market or in private transactions at various times and in amounts and for prices that our management deems appropriate, subject to insider trading rules and other securities law restrictions. The timing of our purchases will depend upon prevailing market conditions, alternative uses of capital and other factors. We may limit or terminate the repurchase program at any time. During the fiscal year ended May 31, 2017, we did not repurchase any shares of our common stock under this program. During the fiscal year ended May 31, 2016, we repurchased 800,000 shares of our common stock at a cost of approximately $35.1 million, or an average cost of $43.88 per share, under this program. During the fiscal year ended May 31, 2015, we repurchased 595,106 shares of our common stock at a cost of approximately $27.6 million, or an average cost of $46.36 per share, under this program.
NOTE H — STOCK-BASED COMPENSATION
Stock-based compensation represents the cost related to stock-based awards granted to our employees and directors; these awards include restricted stock, restricted stock units and SARs. We grant stock-based incentive awards to our employees and/
or our directors under various share-based compensation plans. Plans that are active or provide for stock option grants or share-based payment awards include the Amended and Restated 2004 Omnibus Equity and Incentive Plan (the “2004 Omnibus Plan”) and the 2014 Omnibus Equity and Incentive Plan (the “2014 Omnibus Plan”), which includes provisions for grants of restricted stock, restricted stock units, performance stock, performance stock units and SARs. Other plans, which provide for restricted stock grants only, include the 2003 Restricted Stock Plan for Directors (the “2003 Plan”) and the 2007 Restricted Stock Plan (the “2007 Plan”).
We measure stock-based compensation cost at the date of grant, based on the estimated fair value of the award. We recognize the cost as expense on a straight-line basis (net of estimated forfeitures) over the related vesting period.
The following table represents total stock-based compensation expense included in our Consolidated Statements of Income:
Year Ended May 31, 2017 2016 2015
(In thousands) Selling, general and administrative expense $ 32,541 $ 31,287 $ 31,741Income tax (benefit) (10,159) (9,184) (10,027)
Total stock-based compensation cost $ 22,382 $ 22,103 $ 21,714
SARs
SARs are awards that allow our employees to receive shares of our common stock at a fixed price. We grant SARs at an exercise price equal to the stock price on the date of the grant. The fair value of SARs granted is estimated as of the date of grant using a Black-Scholes option-pricing model. The Black-Scholes option-pricing model was developed for use in estimating the fair value of traded options that have no vesting restrictions and are fully transferable. The risk-free rate for periods within the contractual life of the option is based on the U.S. Treasury yield curve in effect at the time of grant. The expected life of options granted is derived from the input of the option-pricing model and represents the period of time that options granted are expected to be outstanding. Expected volatility rates are based on historical volatility of shares of our common stock.
The following is a summary of our weighted-average assumptions related to SARs grants made during the last three fiscal years:
Year Ended May 31, 2017 2016 2015
Risk-free interest rate 1.5% 2.2% 2.3%Expected life of option 7.0 yrs 7.0 yrs 7.5 yrsExpected dividend yield 2.2% 2.2% 2.2%Expected volatility rate 25.7% 25.6% 25.7%
The 2014 Omnibus Plan was approved by our stockholders on October 9, 2014. The 2014 Omnibus Plan provides us with the flexibility to grant a wide variety of stock and stock-based awards, as well as dollar-denominated performance-based awards, and is intended to be the primary stock-based award program for covered employees. This plan replaces the 2004 Omnibus Plan, which expired under its own terms on October 7, 2014. A wide variety of stock and stock-based awards, as well as dollar-denominated performance-based awards, may be granted under these plans. SARs are issued at fair value at the date of grant, have up to ten-year terms and have graded-vesting terms over four years. Compensation cost for these awards is recognized on a straight-line basis over the related vesting period. Currently all SARs outstanding are to be settled with stock. As of May 31, 2017, there were 3,055,000 SARs outstanding.
RPM International Inc. and Subsidiaries50
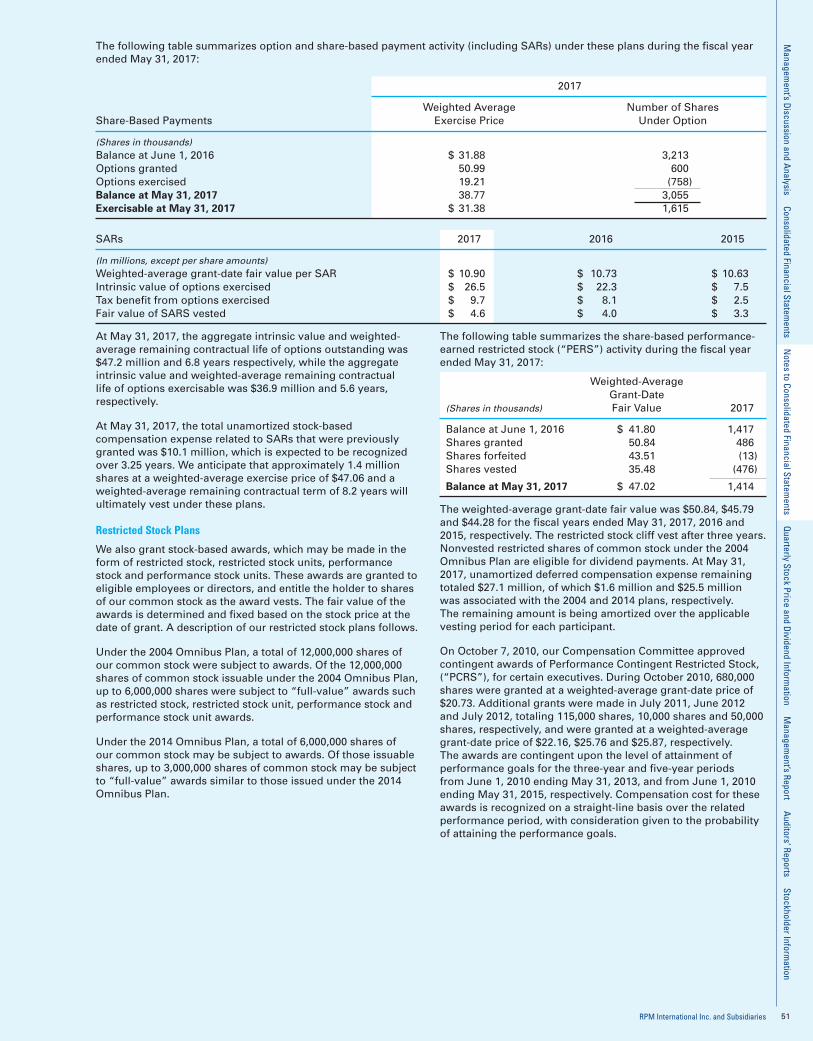
The following table summarizes option and share-based payment activity (including SARs) under these plans during the fiscal year ended May 31, 2017:
2017
Weighted Average Number of Shares Share-Based Payments Exercise Price Under Option
(Shares in thousands) Balance at June 1, 2016 $ 31.88 3,213Options granted 50.99 600Options exercised 19.21 (758)Balance at May 31, 2017 38.77 3,055Exercisable at May 31, 2017 $ 31.38 1,615
SARs 2017 2016 2015
(In millions, except per share amounts) Weighted-average grant-date fair value per SAR $ 10.90 $ 10.73 $ 10.63Intrinsic value of options exercised $ 26.5 $ 22.3 $ 7.5Tax benefit from options exercised $ 9.7 $ 8.1 $ 2.5Fair value of SARS vested $ 4.6 $ 4.0 $ 3.3
At May 31, 2017, the aggregate intrinsic value and weighted-average remaining contractual life of options outstanding was $47.2 million and 6.8 years respectively, while the aggregate intrinsic value and weighted-average remaining contractual life of options exercisable was $36.9 million and 5.6 years, respectively.
At May 31, 2017, the total unamortized stock-based compensation expense related to SARs that were previously granted was $10.1 million, which is expected to be recognized over 3.25 years. We anticipate that approximately 1.4 million shares at a weighted-average exercise price of $47.06 and a weighted-average remaining contractual term of 8.2 years will ultimately vest under these plans.
Restricted Stock Plans
We also grant stock-based awards, which may be made in the form of restricted stock, restricted stock units, performance stock and performance stock units. These awards are granted to eligible employees or directors, and entitle the holder to shares of our common stock as the award vests. The fair value of the awards is determined and fixed based on the stock price at the date of grant. A description of our restricted stock plans follows.
Under the 2004 Omnibus Plan, a total of 12,000,000 shares of our common stock were subject to awards. Of the 12,000,000 shares of common stock issuable under the 2004 Omnibus Plan, up to 6,000,000 shares were subject to “full-value” awards such as restricted stock, restricted stock unit, performance stock and performance stock unit awards.
Under the 2014 Omnibus Plan, a total of 6,000,000 shares of our common stock may be subject to awards. Of those issuable shares, up to 3,000,000 shares of common stock may be subject to “full-value” awards similar to those issued under the 2014 Omnibus Plan.
The following table summarizes the share-based performance-earned restricted stock (“PERS”) activity during the fiscal year ended May 31, 2017:
Weighted-Average Grant-Date (Shares in thousands) Fair Value 2017
Balance at June 1, 2016 $ 41.80 1,417Shares granted 50.84 486Shares forfeited 43.51 (13)Shares vested 35.48 (476)
Balance at May 31, 2017 $ 47.02 1,414
The weighted-average grant-date fair value was $50.84, $45.79 and $44.28 for the fiscal years ended May 31, 2017, 2016 and 2015, respectively. The restricted stock cliff vest after three years. Nonvested restricted shares of common stock under the 2004 Omnibus Plan are eligible for dividend payments. At May 31, 2017, unamortized deferred compensation expense remaining totaled $27.1 million, of which $1.6 million and $25.5 million was associated with the 2004 and 2014 plans, respectively. The remaining amount is being amortized over the applicable vesting period for each participant.
On October 7, 2010, our Compensation Committee approved contingent awards of Performance Contingent Restricted Stock, (“PCRS”), for certain executives. During October 2010, 680,000 shares were granted at a weighted-average grant-date price of $20.73. Additional grants were made in July 2011, June 2012 and July 2012, totaling 115,000 shares, 10,000 shares and 50,000 shares, respectively, and were granted at a weighted-average grant-date price of $22.16, $25.76 and $25.87, respectively. The awards are contingent upon the level of attainment of performance goals for the three-year and five-year periods from June 1, 2010 ending May 31, 2013, and from June 1, 2010 ending May 31, 2015, respectively. Compensation cost for these awards is recognized on a straight-line basis over the related performance period, with consideration given to the probability of attaining the performance goals.
RPM International Inc. and Subsidiaries 51
Managem
ent’s Discussion and A
nalysis Consolidated Financial Statements N
otes to Consolidated Financial Statements Q
uarterly Stock Price and Dividend Inform
ation Managem
ent’s Report Auditors’ Reports Stockholder Inform
ation

On July 31, 2015, our Compensation Committee approved contingent awards of PCRS, (the “2015 PCRS”), for certain executives. During July 2015, 329,000 shares were granted at a weighted-average grant-date price of $46.87. The awards are contingent upon the level of attainment of performance goals for the three-year performance period from June 1, 2015 ending May 31, 2018. Vesting of 67% of the 2015 PCRS relates to an increase in EBIT for the period, and vesting of the remaining 33% relates to an increase in EBIT margin for the period. Compensation cost for these awards is recognized on a straight-line basis over the related performance period, with consideration given to the probability of attaining the performance goals. As of May 31, 2017, there were 324,000 2015 PCRS shares outstanding and $2.6 million unamortized stock-based compensation expense assuming attaining 46% of the goal.
The 2003 Plan was approved on October 10, 2003 by our stockholders, and was established primarily for the purpose of recruiting and retaining directors, and to align the interests of directors with the interests of our stockholders. Only directors who are not our employees are eligible to participate. Under the 2003 Plan, up to 500,000 shares of our common stock may be awarded, with awards cliff vesting over a three-year period. The following table summarizes the share-based activity under the 2003 Plan during fiscal 2017:
Weighted-Average Grant-Date (Shares in thousands) Fair Value 2017
Balance at June 1, 2016 $ 41.51 86Shares granted to Directors 50.61 24Shares vested 39.23 (40)
Balance at May 31, 2017 $ 45.92 70
The weighted-average grant-date fair value was $50.61, $43.71 and $43.89 for the fiscal years ended May 31, 2017, 2016 and 2015, respectively. Unamortized deferred compensation expense relating to restricted stock grants for directors of $1.5 million at May 31, 2017, is being amortized over the applicable remaining vesting period for each director. Nonvested restricted shares of common stock under the 2003 Plan are eligible for dividend payments. As of May 31, 2017, there were 77,350 shares available for future grant.
During fiscal 2017, a total of 48,041 shares were awarded under the 2007 Plan and the 2014 Omnibus Plan to certain employees as supplemental retirement benefits, generally subject to forfeiture. The shares vest upon the latter of attainment of age 55 and the fifth anniversary of the May 31st immediately preceding the date of the grant. The following table sets forth such awards for the year ended May 31, 2017:
Weighted-Average Grant-Date (Shares in thousands) Fair Value 2017
Balance at June 1, 2016 $ 23.27 793Shares granted 50.99 48Shares exercised 21.06 (39)
Balance at May 31, 2017 $ 25.04 802
The weighted-average grant-date fair value was $50.99, $46.63 and $44.60 for the fiscal years ended May 31, 2017, 2016 and 2015, respectively. As of May 31, 2017, no shares remain available for future grant under the 2007 Plan, and future issuances of shares as supplemental retirement benefits are intended to be made under the 2014 Omnibus Plan. At May 31, 2017, unamortized stock-based compensation expense of $4.9 million, $0.5 million and $25.5 million relating to the 2007 Plan, the Restricted Stock Units and the 2014 Omnibus Plan, respectively, are being amortized over the applicable vesting period associated with each participant.
The following table summarizes the activity for all nonvested restricted shares during the year ended May 31, 2017:
Weighted-Average Grant-Date Fair Number of (Shares in thousands) Value Shares
Balance at June 1, 2016 $ 39.07 2,356Granted 50.84 558Vested 33.75 (602)Forfeited 43.51 (12)
Balance at May 31, 2017 $ 43.32 2,300
The remaining weighted-average contractual term of nonvested restricted shares at May 31, 2017 is the same as the period over which the remaining cost of the awards will be recognized, which is approximately 3.3 years. The fair value of the nonvested restricted share awards have been calculated using the market value of the shares on the date of issuance. For the years ended May 31, 2017, 2016 and 2015, the weighted-average grant-date fair value for restricted share grants was $50.84, $46.17 and $44.29, respectively. The total fair value of shares that vested during the years ended May 31, 2017, 2016 and 2015 was $20.3 million, $34.2 million and $14.7 million, respectively. We anticipate that approximately 1.9 million shares at a weighted-average grant-date fair value of $43.32 and a weighted-average remaining contractual term of 3.3 years will ultimately vest, based upon the unique terms and participants of each plan. Approximately 263,857 shares of restricted stock were vested at May 31, 2017, with 310,238 restricted shares vested as of May 31, 2016. The total intrinsic value of restricted shares converted during the years ended May 31, 2017, 2016 and 2015 was $9.0 million, $32.3 million and $13.9 million, respectively.
Total unrecognized compensation cost related to all nonvested awards of restricted shares of common stock was $37.7 million as of May 31, 2017. That cost is expected to be recognized over a weighted-average period of 3.3 years. We did not receive any cash from employees as a result of employee vesting and release of restricted shares for the year ended May 31, 2017.
RPM International Inc. and Subsidiaries52

NOTE I — ACCUMULATED OTHER COMPREHENSIVE INCOME (LOSS)
Accumulated other comprehensive income (loss) consists of the following components:
Pension And Other Postretirement Unrealized Unrealized Foreign Benefit Gain Gain (Loss) Currency Liability (Loss) On On Translation Adjustments, Derivatives, Securities, (In thousands) Adjustments Net of Tax Net of Tax Net of Tax Total
Balance at June 1, 2014 $ (14,895) $ (153,648) $ 285 $ 11,376 $ (156,882) Reclassification adjustments for gains included in net income, net of tax benefit of $2,307 (125) (4,209) (4,334) Increase in equity ownership - SPHC (9,600) (9,600) Other comprehensive income (216,755) (10,817) (341) (3,884) (231,797) Deferred taxes 5,733 181 2,564 8,478
Balance at May 31, 2015 (231,650) (168,332) - 5,847 (394,135) Reclassification adjustments for gains included in net income, net of tax benefit of $946 - (1,847) (1,847) Other comprehensive income (65,580) (62,520) - (9,995) (138,095) Deferred taxes 5,997 22,646 - 3,387 32,030
Balance at May 31, 2016 (291,233) (208,206) - (2,608) (502,047) Reclassification adjustments for gains included in net income, net of tax benefit of $401 - (1,847) (1,847) Other comprehensive income (20,358) 66,264 16 7,849 53,771 Deferred taxes 3,176 (24,782) - (2,257) (23,863)
Balance at May 31, 2017 $ (308,415) $ (166,724) $ 16 $ 1,137 $ (473,986)
NOTE J — EARNINGS PER SHARE
The following table sets forth the reconciliation of the numerator and denominator of basic and diluted earnings per share for the years ended May 31, 2017, 2016 and 2015:
Year Ended May 31, 2017 2016 2015
(In thousands, except per share amounts) Numerator for earnings per share: Net income attributable to RPM International Inc. stockholders $ 181,823 $ 354,725 $ 239,484 Less: Allocation of earnings and dividends to participating securities (2,795) (5,770) (4,954)
Net income available to common shareholders - basic 179,028 348,955 234,530 Add: Undistributed earnings reallocated to unvested shareholders 2 18 Reverse: Allocation of earnings and dividends to participating securities 5,770 Add: Income effect of contingently issuable shares 5,457 5,430 5,374
Net income available to common shareholders - diluted $ 184,487 $ 360,155 $ 239,922
Denominator for basic and diluted earnings per share: Basic weighted average common shares (1) 130,662 129,383 129,933 Average diluted options 598 3,445 1,082 Net issuable common share equivalents (2) 3,905 3,888 3,878
Total shares for diluted earnings per share (1) 135,165 136,716 134,893
Earnings Per Share of Common Stock Attributable to RPM International Inc. Stockholders: Basic Earnings Per Share of Common Stock $ 1.37 $ 2.70 $ 1.81
Diluted Earnings Per Share of Common Stock $ 1.36 $ 2.63 $ 1.78
(1) Basic and diluted earnings per share are calculated using the two-class method for the years ended May 31, 2017 and 2015. For the year ended May 31, 2016, basic and diluted earnings per share are calculated under the two-class method and the treasury method, respectively, as those methods resulted in the most dilutive earnings per share.
(2) Represents the number of shares that would be issued if our contingently convertible notes were converted. We include these shares in the calculation of diluted EPS as the conversion of the notes may be settled, at our election, in cash, shares of our common stock, or a combination of cash and shares of our common stock.
RPM International Inc. and Subsidiaries 53
Managem
ent’s Discussion and A
nalysis Consolidated Financial Statements N
otes to Consolidated Financial Statements Q
uarterly Stock Price and Dividend Inform
ation Managem
ent’s Report Auditors’ Reports Stockholder Inform
ation
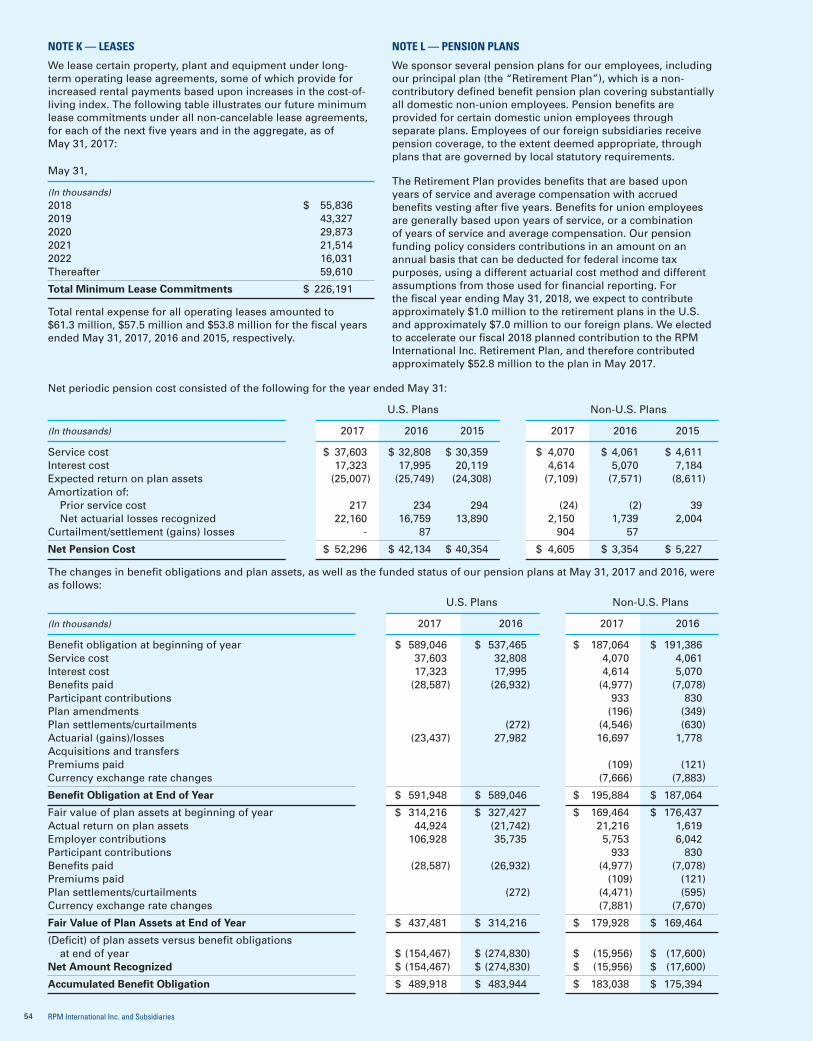
NOTE K — LEASES
We lease certain property, plant and equipment under long-term operating lease agreements, some of which provide for increased rental payments based upon increases in the cost-of-living index. The following table illustrates our future minimum lease commitments under all non-cancelable lease agreements, for each of the next five years and in the aggregate, as of May 31, 2017:
May 31,
(In thousands)2018 $ 55,8362019 43,3272020 29,8732021 21,5142022 16,031Thereafter 59,610
Total Minimum Lease Commitments $ 226,191
Total rental expense for all operating leases amounted to $61.3 million, $57.5 million and $53.8 million for the fiscal years ended May 31, 2017, 2016 and 2015, respectively.
NOTE L — PENSION PLANS
We sponsor several pension plans for our employees, including our principal plan (the “Retirement Plan”), which is a non-contributory defined benefit pension plan covering substantially all domestic non-union employees. Pension benefits are provided for certain domestic union employees through separate plans. Employees of our foreign subsidiaries receive pension coverage, to the extent deemed appropriate, through plans that are governed by local statutory requirements.
The Retirement Plan provides benefits that are based upon years of service and average compensation with accrued benefits vesting after five years. Benefits for union employees are generally based upon years of service, or a combination of years of service and average compensation. Our pension funding policy considers contributions in an amount on an annual basis that can be deducted for federal income tax purposes, using a different actuarial cost method and different assumptions from those used for financial reporting. For the fiscal year ending May 31, 2018, we expect to contribute approximately $1.0 million to the retirement plans in the U.S. and approximately $7.0 million to our foreign plans. We elected to accelerate our fiscal 2018 planned contribution to the RPM International Inc. Retirement Plan, and therefore contributed approximately $52.8 million to the plan in May 2017.
Net periodic pension cost consisted of the following for the year ended May 31:
U.S. Plans Non-U.S. Plans
(In thousands) 2017 2016 2015 2017 2016 2015
Service cost $ 37,603 $ 32,808 $ 30,359 $ 4,070 $ 4,061 $ 4,611Interest cost 17,323 17,995 20,119 4,614 5,070 7,184Expected return on plan assets (25,007) (25,749) (24,308) (7,109) (7,571) (8,611)Amortization of: Prior service cost 217 234 294 (24) (2) 39 Net actuarial losses recognized 22,160 16,759 13,890 2,150 1,739 2,004Curtailment/settlement (gains) losses - 87 904 57
Net Pension Cost $ 52,296 $ 42,134 $ 40,354 $ 4,605 $ 3,354 $ 5,227
The changes in benefit obligations and plan assets, as well as the funded status of our pension plans at May 31, 2017 and 2016, were as follows:
U.S. Plans Non-U.S. Plans
(In thousands) 2017 2016 2017 2016
Benefit obligation at beginning of year $ 589,046 $ 537,465 $ 187,064 $ 191,386Service cost 37,603 32,808 4,070 4,061Interest cost 17,323 17,995 4,614 5,070Benefits paid (28,587) (26,932) (4,977) (7,078)Participant contributions 933 830Plan amendments (196) (349)Plan settlements/curtailments (272) (4,546) (630)Actuarial (gains)/losses (23,437) 27,982 16,697 1,778Acquisitions and transfers Premiums paid (109) (121)Currency exchange rate changes (7,666) (7,883)
Benefit Obligation at End of Year $ 591,948 $ 589,046 $ 195,884 $ 187,064
Fair value of plan assets at beginning of year $ 314,216 $ 327,427 $ 169,464 $ 176,437Actual return on plan assets 44,924 (21,742) 21,216 1,619Employer contributions 106,928 35,735 5,753 6,042Participant contributions 933 830Benefits paid (28,587) (26,932) (4,977) (7,078)Premiums paid (109) (121)Plan settlements/curtailments (272) (4,471) (595)Currency exchange rate changes (7,881) (7,670)
Fair Value of Plan Assets at End of Year $ 437,481 $ 314,216 $ 179,928 $ 169,464
(Deficit) of plan assets versus benefit obligations at end of year $ (154,467) $ (274,830) $ (15,956) $ (17,600)Net Amount Recognized $ (154,467) $ (274,830) $ (15,956) $ (17,600)
Accumulated Benefit Obligation $ 489,918 $ 483,944 $ 183,038 $ 175,394
RPM International Inc. and Subsidiaries54
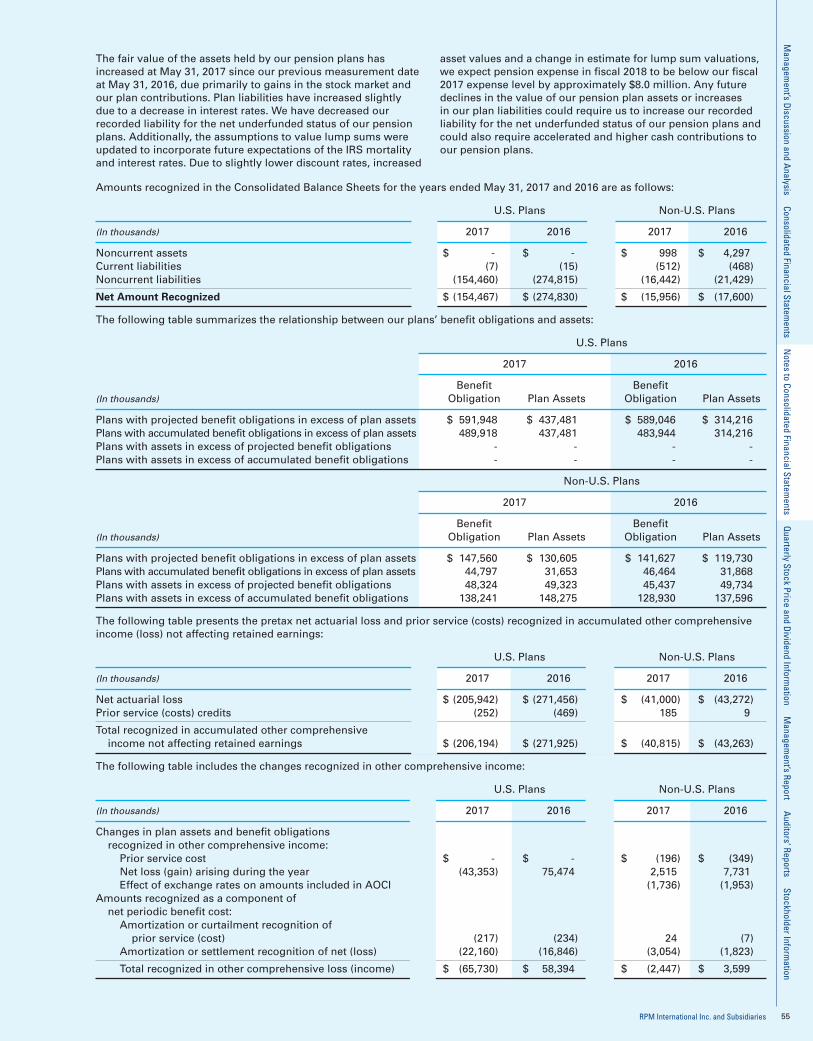
The fair value of the assets held by our pension plans has increased at May 31, 2017 since our previous measurement date at May 31, 2016, due primarily to gains in the stock market and our plan contributions. Plan liabilities have increased slightly due to a decrease in interest rates. We have decreased our recorded liability for the net underfunded status of our pension plans. Additionally, the assumptions to value lump sums were updated to incorporate future expectations of the IRS mortality and interest rates. Due to slightly lower discount rates, increased
asset values and a change in estimate for lump sum valuations, we expect pension expense in fiscal 2018 to be below our fiscal 2017 expense level by approximately $8.0 million. Any future declines in the value of our pension plan assets or increases in our plan liabilities could require us to increase our recorded liability for the net underfunded status of our pension plans and could also require accelerated and higher cash contributions to our pension plans.
Amounts recognized in the Consolidated Balance Sheets for the years ended May 31, 2017 and 2016 are as follows:
U.S. Plans Non-U.S. Plans
(In thousands) 2017 2016 2017 2016
Noncurrent assets $ - $ - $ 998 $ 4,297 Current liabilities (7) (15) (512) (468)Noncurrent liabilities (154,460) (274,815) (16,442) (21,429)
Net Amount Recognized $ (154,467) $ (274,830) $ (15,956) $ (17,600)
The following table summarizes the relationship between our plans’ benefit obligations and assets:
U.S. Plans
2017 2016
Benefit Benefit (In thousands) Obligation Plan Assets Obligation Plan Assets
Plans with projected benefit obligations in excess of plan assets $ 591,948 $ 437,481 $ 589,046 $ 314,216Plans with accumulated benefit obligations in excess of plan assets 489,918 437,481 483,944 314,216Plans with assets in excess of projected benefit obligations - - - -Plans with assets in excess of accumulated benefit obligations - - - -
Non-U.S. Plans
2017 2016
Benefit Benefit (In thousands) Obligation Plan Assets Obligation Plan Assets
Plans with projected benefit obligations in excess of plan assets $ 147,560 $ 130,605 $ 141,627 $ 119,730 Plans with accumulated benefit obligations in excess of plan assets 44,797 31,653 46,464 31,868 Plans with assets in excess of projected benefit obligations 48,324 49,323 45,437 49,734 Plans with assets in excess of accumulated benefit obligations 138,241 148,275 128,930 137,596
The following table presents the pretax net actuarial loss and prior service (costs) recognized in accumulated other comprehensive income (loss) not affecting retained earnings:
U.S. Plans Non-U.S. Plans
(In thousands) 2017 2016 2017 2016
Net actuarial loss $ (205,942) $ (271,456) $ (41,000) $ (43,272)Prior service (costs) credits (252) (469) 185 9
Total recognized in accumulated other comprehensive income not affecting retained earnings $ (206,194) $ (271,925) $ (40,815) $ (43,263)
The following table includes the changes recognized in other comprehensive income:
U.S. Plans Non-U.S. Plans
(In thousands) 2017 2016 2017 2016
Changes in plan assets and benefit obligations recognized in other comprehensive income: Prior service cost $ - $ - $ (196) $ (349) Net loss (gain) arising during the year (43,353) 75,474 2,515 7,731 Effect of exchange rates on amounts included in AOCI (1,736) (1,953)Amounts recognized as a component of net periodic benefit cost: Amortization or curtailment recognition of prior service (cost) (217) (234) 24 (7) Amortization or settlement recognition of net (loss) (22,160) (16,846) (3,054) (1,823)
Total recognized in other comprehensive loss (income) $ (65,730) $ 58,394 $ (2,447) $ 3,599
RPM International Inc. and Subsidiaries 55
Managem
ent’s Discussion and A
nalysis Consolidated Financial Statements N
otes to Consolidated Financial Statements Q
uarterly Stock Price and Dividend Inform
ation Managem
ent’s Report Auditors’ Reports Stockholder Inform
ation

The following table presents the amounts in accumulated other comprehensive income (loss) as of May 31, 2017 that have not yet been recognized in net periodic pension cost, but will be recognized in our Consolidated Statements of Income during the fiscal year ending May 31, 2018:
(In thousands) U.S. Plans Non-U.S. Plans
Net actuarial loss $ (14,325) $ (1,675)Prior service (cost) credit $ (117) $ 25
In measuring the projected benefit obligation and net periodic pension cost for our plans, we utilize actuarial valuations. These valuations include specific information pertaining to individual plan participants, such as salary, age and years of service, along with certain assumptions. The most significant assumptions applied include discount rates, expected return on plan assets and rate of compensation increases. We evaluate these assumptions, at a minimum, on an annual basis, and make required changes, as applicable. In developing our expected long-term rate of return on pension plan assets, we consider
the current and expected target asset allocations of the pension portfolio, as well as historical returns and future expectations for returns on various categories of plan assets. Expected return on assets is determined by using the weighted-average return on asset classes based on expected return for the target asset allocations of the principal asset categories held by each plan. In determining expected return, we consider both historical performance and an estimate of future long-term rates of return. Actual experience is used to develop the assumption for compensation increases.
The following weighted-average assumptions were used to determine our year-end benefit obligations and net periodic pension cost under the plans:
U.S. Plans Non-U.S. Plans
Year-End Benefit Obligations 2017 2016 2017 2016
Discount rate 3.81% 3.85% 2.79% 3.13%Rate of compensation increase 3.80% 3.80% 3.00% 2.81%
U.S. Plans Non-U.S. Plans
Net Periodic Pension Cost 2017 2016 2015 2017 2016 2015
Discount rate 3.85% 4.25% 4.30% 3.13% 3.26% 3.82%Expected return on plan assets 7.89% 7.90% 8.25% 4.50% 4.49% 5.18%Rate of compensation increase 3.80% 3.80% 3.81% 2.81% 2.81% 3.30%
The following tables illustrate the weighted-average actual and target allocation of plan assets:
U.S. Plans
Actual Asset
Target Allocation Allocation
(Dollars in millions) as of May 31, 2017 2017 2016
Equity securities 55% $ 295.2 $ 234.7Fixed income securities 25% 82.4 72.1Cash (1) 59.7 7.1Other 20% 0.2 0.3
Total assets 100% $ 437.5 $ 314.2
Non-U.S. Plans
Actual Asset
Target Allocation Allocation
(Dollars in millions) as of May 31, 2017 2017 2016
Equity securities 40% $ 83.8 $ 71.7Fixed income securities 41% 65.9 67.4Cash Property and other 19% 30.2 30.4
Total assets 100% $ 179.9 $ 169.5
(1) The cash position at May 31, 2017 results from our acceleration of the planned fiscal 2018 contribution, which was deposited into the RPM International Inc. Retirement Plan during May 2017. The cash will be invested at various points in time during fiscal 2018.
RPM International Inc. and Subsidiaries56

The following tables present our pension plan assets as categorized using the fair value hierarchy at May 31, 2017 and 2016:
U.S. Plans
Quoted Prices in Significant Other Significant Active Markets Observable Unobservable for Identical Assets Inputs Inputs Fair Value at (In thousands) (Level 1) (Level 2) (Level 3) May 31, 2017
U.S. Treasury and other government $ - $ 7,923 $ - $ 7,923State and municipal bonds 628 628Foreign bonds 1,623 1,623Mortgage-backed securities 20,211 20,211Corporate bonds 17,976 17,976Stocks - large cap 20,999 20,999Stocks - mid cap 8,128 8,128Stocks - small cap 16,423 16,423Stocks - international 2,639 2,639Mutual funds - equity 247,037 247,037Mutual funds - fixed 34,014 34,014Cash and cash equivalents 59,674 59,674Limited partnerships 206 206
Total $ 107,863 $ 329,412 $ 206 $ 437,481
Non-U.S. Plans
Quoted Prices in Significant Other Significant Active Markets Observable Unobservable for Identical Assets Inputs Inputs Fair Value at (In thousands) (Level 1) (Level 2) (Level 3) May 31, 2017
Pooled equities $ - $ 82,626 $ - $ 82,626Pooled fixed income 65,649 65,649Foreign bonds 252 252Insurance contracts 30,181 30,181Mutual funds 1,181 1,181Cash and cash equivalents 39 39
Total $ 39 $ 149,708 $ 30,181 $ 179,928
U.S. Plans
Quoted Prices in Significant Other Significant Active Markets Observable Unobservable for Identical Assets Inputs Inputs Fair Value at (In thousands) (Level 1) (Level 2) (Level 3) May 31, 2016
U.S. Treasury and other government $ - $ 9,533 $ - $ 9,533State and municipal bonds 532 532Foreign bonds 1,095 1,095Mortgage-backed securities 12,289 12,289Corporate bonds 21,035 21,035Stocks - large cap 28,686 28,686Stocks - mid cap 12,350 12,350Stocks - small cap 24,361 24,361Stocks - international 3,538 3,538Mutual funds - equity 165,784 165,784Mutual funds - fixed 27,611 27,611Cash and cash equivalents 7,108 7,108Limited partnerships 294 294
Total $ 76,043 $ 237,879 $ 294 $ 314,216
RPM International Inc. and Subsidiaries 57
Managem
ent’s Discussion and A
nalysis Consolidated Financial Statements N
otes to Consolidated Financial Statements Q
uarterly Stock Price and Dividend Inform
ation Managem
ent’s Report Auditors’ Reports Stockholder Inform
ation
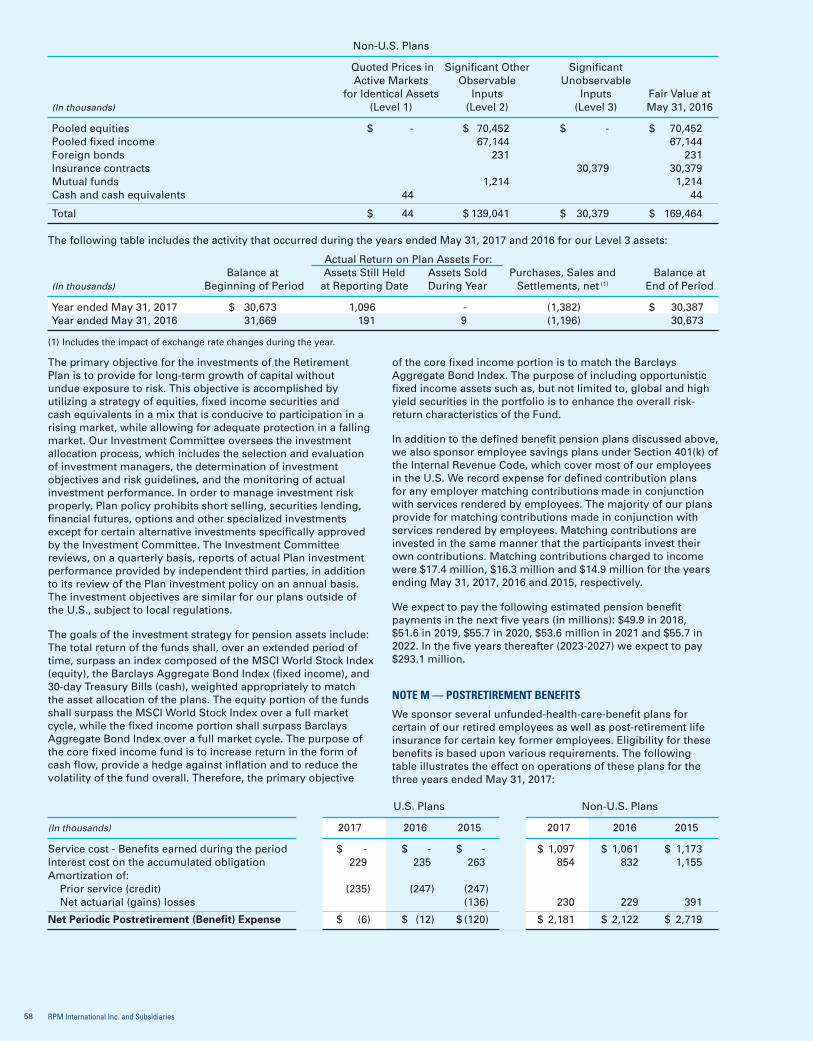
Non-U.S. Plans
Quoted Prices in Significant Other Significant Active Markets Observable Unobservable for Identical Assets Inputs Inputs Fair Value at (In thousands) (Level 1) (Level 2) (Level 3) May 31, 2016
Pooled equities $ - $ 70,452 $ - $ 70,452 Pooled fixed income 67,144 67,144Foreign bonds 231 231Insurance contracts 30,379 30,379Mutual funds 1,214 1,214Cash and cash equivalents 44 44
Total $ 44 $ 139,041 $ 30,379 $ 169,464
The following table includes the activity that occurred during the years ended May 31, 2017 and 2016 for our Level 3 assets:
Actual Return on Plan Assets For: Balance at Assets Still Held Assets Sold Purchases, Sales and Balance at (In thousands) Beginning of Period at Reporting Date During Year Settlements, net (1) End of Period
Year ended May 31, 2017 $ 30,673 1,096 - (1,382) $ 30,387Year ended May 31, 2016 31,669 191 9 (1,196) 30,673
(1) Includes the impact of exchange rate changes during the year.
The primary objective for the investments of the Retirement Plan is to provide for long-term growth of capital without undue exposure to risk. This objective is accomplished by utilizing a strategy of equities, fixed income securities and cash equivalents in a mix that is conducive to participation in a rising market, while allowing for adequate protection in a falling market. Our Investment Committee oversees the investment allocation process, which includes the selection and evaluation of investment managers, the determination of investment objectives and risk guidelines, and the monitoring of actual investment performance. In order to manage investment risk properly, Plan policy prohibits short selling, securities lending, financial futures, options and other specialized investments except for certain alternative investments specifically approved by the Investment Committee. The Investment Committee reviews, on a quarterly basis, reports of actual Plan investment performance provided by independent third parties, in addition to its review of the Plan investment policy on an annual basis. The investment objectives are similar for our plans outside of the U.S., subject to local regulations.
The goals of the investment strategy for pension assets include: The total return of the funds shall, over an extended period of time, surpass an index composed of the MSCI World Stock Index (equity), the Barclays Aggregate Bond Index (fixed income), and 30-day Treasury Bills (cash), weighted appropriately to match the asset allocation of the plans. The equity portion of the funds shall surpass the MSCI World Stock Index over a full market cycle, while the fixed income portion shall surpass Barclays Aggregate Bond Index over a full market cycle. The purpose of the core fixed income fund is to increase return in the form of cash flow, provide a hedge against inflation and to reduce the volatility of the fund overall. Therefore, the primary objective
of the core fixed income portion is to match the Barclays Aggregate Bond Index. The purpose of including opportunistic fixed income assets such as, but not limited to, global and high yield securities in the portfolio is to enhance the overall risk-return characteristics of the Fund.
In addition to the defined benefit pension plans discussed above, we also sponsor employee savings plans under Section 401(k) of the Internal Revenue Code, which cover most of our employees in the U.S. We record expense for defined contribution plans for any employer matching contributions made in conjunction with services rendered by employees. The majority of our plans provide for matching contributions made in conjunction with services rendered by employees. Matching contributions are invested in the same manner that the participants invest their own contributions. Matching contributions charged to income were $17.4 million, $16.3 million and $14.9 million for the years ending May 31, 2017, 2016 and 2015, respectively.
We expect to pay the following estimated pension benefit payments in the next five years (in millions): $49.9 in 2018, $51.6 in 2019, $55.7 in 2020, $53.6 million in 2021 and $55.7 in 2022. In the five years thereafter (2023-2027) we expect to pay $293.1 million.
NOTE M — POSTRETIREMENT BENEFITS
We sponsor several unfunded-health-care-benefit plans for certain of our retired employees as well as post-retirement life insurance for certain key former employees. Eligibility for these benefits is based upon various requirements. The following table illustrates the effect on operations of these plans for the three years ended May 31, 2017:
U.S. Plans Non-U.S. Plans
(In thousands) 2017 2016 2015 2017 2016 2015
Service cost - Benefits earned during the period $ - $ - $ - $ 1,097 $ 1,061 $ 1,173Interest cost on the accumulated obligation 229 235 263 854 832 1,155Amortization of: Prior service (credit) (235) (247) (247) Net actuarial (gains) losses (136) 230 229 391
Net Periodic Postretirement (Benefit) Expense $ (6) $ (12) $ (120) $ 2,181 $ 2,122 $ 2,719
RPM International Inc. and Subsidiaries58

The changes in benefit obligations of the plans at May 31, 2017 and 2016 were as follows:
U.S. Plans Non-U.S. Plans
(In thousands) 2017 2016 2017 2016
Accumulated postretirement benefit obligation at beginning of year $ 7,653 $ 7,640 $ 25,420 $ 24,646Service cost 1,097 1,061Interest cost 229 235 854 832Benefit payments (2,383) (251) (529) (464)Actuarial (gains) losses 393 29 1,766 536Currency exchange rate changes (740) (1,191)
Accumulated and accrued postretirement benefit obligation at end of year $ 5,892 $ 7,653 $ 27,868 $ 25,420
In determining the postretirement benefit amounts outlined above, measurement dates as of May 31 for each period were applied.
Amounts recognized in the Consolidated Balance Sheets for the years ended May 31, 2017 and 2016 are as follows:
U.S. Plans Non-U.S. Plans
(In thousands) 2017 2016 2017 2016
Current liabilities $ (411) $ (455) $ (522) $ (482)Noncurrent liabilities (5,481) (7,198) (27,346) (24,938)
Net Amount Recognized $ (5,892) $ (7,653) $ (27,868) $ (25,420)
The following table presents the pretax net actuarial gain (loss) and prior service credits recognized in accumulated other comprehensive income (loss) not affecting retained earnings:
U.S. Plans Non-U.S. Plans
(In thousands) 2017 2016 2017 2016
Net actuarial gain (loss) $ (299) $ 94 $ (7,354) $ (5,986)Prior service credits 1,107 1,341
Total recognized in accumulated other comprehensive income not affecting retained earnings $ 808 $ 1,435 $ (7,354) $ (5,986)
The following table includes the changes recognized in other comprehensive income:
U.S. Plans Non-U.S. Plans
(In thousands) 2017 2016 2017 2016
Changes in plan assets and benefit obligations recognized in other comprehensive income: Prior service cost $ - $ - $ - $ - Net loss (gain) arising during the year 393 29 1,766 536 Effect of exchange rates on amounts included in AOCI (168) (290)Amounts recognized as a component of net periodic benefit cost: Amortization or curtailment recognition of prior service credit (cost) 234 247 Amortization or settlement recognition of net gain (loss) - - (230) (229)
Total recognized in other comprehensive loss (income) $ 627 $ 276 $ 1,368 $ 17
The following weighted-average assumptions were used to determine our year-end benefit obligations and net periodic postretirement benefit costs under the plans:
U.S. Plans Non-U.S. Plans
Year-End Benefit Obligations 2017 2016 2017 2016
Discount rate 3.61% 3.76% 3.61% 3.92%Current healthcare cost trend rate 14.75% 10.37% 5.85% 5.98%Ultimate healthcare cost trend rate 4.36% 4.36% 4.20% 4.20%Year ultimate healthcare cost trend rate will be realized 2037 2037 2030 2030
U.S. Plans Non-U.S. Plans
Net Periodic Postretirement Cost 2017 2016 2015 2017 2016 2015
Discount rate 3.76% 3.95% 4.00% 3.92% 4.00% 4.40%Healthcare cost trend rate 10.37% 11.34% 12.28% 5.98% 6.06% 6.31%Ultimate healthcare cost trend rate 4.36% 4.50% 4.50% 4.20% 4.20% 4.20%Year ultimate healthcare cost trend rate will be realized 2037 2029 2029 2030 2030 2030
RPM International Inc. and Subsidiaries 59
Managem
ent’s Discussion and A
nalysis Consolidated Financial Statements N
otes to Consolidated Financial Statements Q
uarterly Stock Price and Dividend Inform
ation Managem
ent’s Report Auditors’ Reports Stockholder Inform
ation
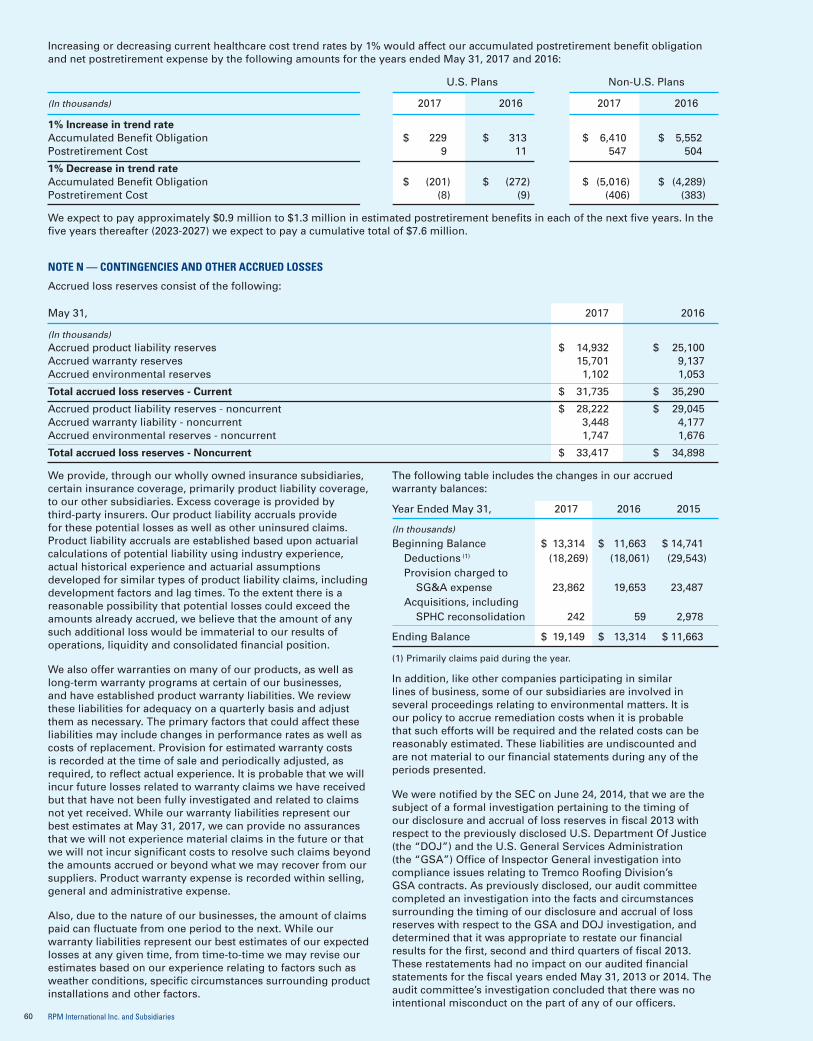
Increasing or decreasing current healthcare cost trend rates by 1% would affect our accumulated postretirement benefit obligation and net postretirement expense by the following amounts for the years ended May 31, 2017 and 2016:
U.S. Plans Non-U.S. Plans
(In thousands) 2017 2016 2017 2016
1% Increase in trend rate Accumulated Benefit Obligation $ 229 $ 313 $ 6,410 $ 5,552 Postretirement Cost 9 11 547 504
1% Decrease in trend rateAccumulated Benefit Obligation $ (201) $ (272) $ (5,016) $ (4,289)Postretirement Cost (8) (9) (406) (383)
We expect to pay approximately $0.9 million to $1.3 million in estimated postretirement benefits in each of the next five years. In the five years thereafter (2023-2027) we expect to pay a cumulative total of $7.6 million.
NOTE N — CONTINGENCIES AND OTHER ACCRUED LOSSES
Accrued loss reserves consist of the following:
May 31, 2017 2016
(In thousands)Accrued product liability reserves $ 14,932 $ 25,100Accrued warranty reserves 15,701 9,137Accrued environmental reserves 1,102 1,053
Total accrued loss reserves - Current $ 31,735 $ 35,290
Accrued product liability reserves - noncurrent $ 28,222 $ 29,045Accrued warranty liability - noncurrent 3,448 4,177Accrued environmental reserves - noncurrent 1,747 1,676
Total accrued loss reserves - Noncurrent $ 33,417 $ 34,898
We provide, through our wholly owned insurance subsidiaries, certain insurance coverage, primarily product liability coverage, to our other subsidiaries. Excess coverage is provided by third-party insurers. Our product liability accruals provide for these potential losses as well as other uninsured claims. Product liability accruals are established based upon actuarial calculations of potential liability using industry experience, actual historical experience and actuarial assumptions developed for similar types of product liability claims, including development factors and lag times. To the extent there is a reasonable possibility that potential losses could exceed the amounts already accrued, we believe that the amount of any such additional loss would be immaterial to our results of operations, liquidity and consolidated financial position.
We also offer warranties on many of our products, as well as long-term warranty programs at certain of our businesses, and have established product warranty liabilities. We review these liabilities for adequacy on a quarterly basis and adjust them as necessary. The primary factors that could affect these liabilities may include changes in performance rates as well as costs of replacement. Provision for estimated warranty costs is recorded at the time of sale and periodically adjusted, as required, to reflect actual experience. It is probable that we will incur future losses related to warranty claims we have received but that have not been fully investigated and related to claims not yet received. While our warranty liabilities represent our best estimates at May 31, 2017, we can provide no assurances that we will not experience material claims in the future or that we will not incur significant costs to resolve such claims beyond the amounts accrued or beyond what we may recover from our suppliers. Product warranty expense is recorded within selling, general and administrative expense.
Also, due to the nature of our businesses, the amount of claims paid can fluctuate from one period to the next. While our warranty liabilities represent our best estimates of our expected losses at any given time, from time-to-time we may revise our estimates based on our experience relating to factors such as weather conditions, specific circumstances surrounding product installations and other factors.
The following table includes the changes in our accrued warranty balances:
Year Ended May 31, 2017 2016 2015
(In thousands)
Beginning Balance $ 13,314 $ 11,663 $ 14,741 Deductions (1) (18,269) (18,061) (29,543) Provision charged to SG&A expense 23,862 19,653 23,487 Acquisitions, including SPHC reconsolidation 242 59 2,978
Ending Balance $ 19,149 $ 13,314 $ 11,663
(1) Primarily claims paid during the year.
In addition, like other companies participating in similar lines of business, some of our subsidiaries are involved in several proceedings relating to environmental matters. It is our policy to accrue remediation costs when it is probable that such efforts will be required and the related costs can be reasonably estimated. These liabilities are undiscounted and are not material to our financial statements during any of the periods presented.
We were notified by the SEC on June 24, 2014, that we are the subject of a formal investigation pertaining to the timing of our disclosure and accrual of loss reserves in fiscal 2013 with respect to the previously disclosed U.S. Department Of Justice (the “DOJ”) and the U.S. General Services Administration (the “GSA”) Office of Inspector General investigation into compliance issues relating to Tremco Roofing Division’s GSA contracts. As previously disclosed, our audit committee completed an investigation into the facts and circumstances surrounding the timing of our disclosure and accrual of loss reserves with respect to the GSA and DOJ investigation, and determined that it was appropriate to restate our financial results for the first, second and third quarters of fiscal 2013. These restatements had no impact on our audited financial statements for the fiscal years ended May 31, 2013 or 2014. The audit committee’s investigation concluded that there was no intentional misconduct on the part of any of our officers.
RPM International Inc. and Subsidiaries60
In connection with the foregoing, on September 9, 2016, the SEC filed an enforcement action against us and our General Counsel. We have cooperated with the SEC’s investigation and believe the allegations in the complaint mischaracterize both our and our General Counsel’s actions in connection with the matters related to our quarterly results in fiscal 2013 and are without merit. We intend to contest the allegations in the complaint vigorously, and both we and our General Counsel filed motions to dismiss the complaint on February 24, 2017.
The action by the SEC could result in sanctions against us and/or our General Counsel and could impose substantial additional costs and distractions, regardless of its outcome. We have determined that it is probable that we will incur a loss relating to this matter and have estimated a range of potential loss. We have accrued at the low end of the range of loss, as no amount within the range is more likely to occur, and no amount within the estimated range of loss would have a material impact on our consolidated financial condition, results of operations or cash flows.
In December 2014, we received notice of a claim seeking damages against one of our industrial segment subsidiaries alleging failure of a coating system application on a parking garage in Dubai, UAE. During the year ended May 31, 2017, the case settled for an immaterial amount.
A consolidated class-action complaint is pending against Rust-Oleum Corporation (“Rust-Oleum”) seeking to have a class certified and alleging breach of warranty, breach of contract and other claims regarding certain deck coating products of Rust-Oleum. In October 2016, the parties executed a settlement agreement. The court has granted final approval of the settlement. Rust-Oleum has deposited $9.3 million into a settlement fund in satisfaction of the claims. We recorded the amount of the settlement in accrued losses in our Consolidated Balance Sheets and reflected the amount in other expense (income), net, in our Consolidated Statements of Income as of and for the fiscal year ended May 31, 2016.
NOTE O — SEGMENT INFORMATION
We changed the composition of our operating and reportable segments in order to reflect management’s view of the operating results for each segment during the quarter ended August 31, 2016. Under our new composition, we made the determination to move a group of businesses serving the industrial flooring, concrete repair and specialty waterproofing markets out of our specialty reportable segment into our Performance Coatings Group operating segment, which better aligns with our management structure and reports through our industrial reportable segment. For the fiscal year ended May 31, 2016, this group of businesses represented less than 1% of our consolidated net sales, income before income taxes and identifiable assets. Information for all periods presented has been recast to reflect this change.
We operate a portfolio of businesses and product lines that manufacture and sell a variety of specialty paints, protective coatings and roofing systems, sealants and adhesives. We manage our portfolio by organizing our businesses and product lines into three reportable segments: the industrial reportable segment, the specialty reportable segment and the consumer reportable segment. Within each reportable segment, we aggregate operating segments or product lines that consist of individual companies or groups of companies and product lines, which generally address common markets, share similar economic characteristics, utilize similar technologies and can share manufacturing or distribution capabilities. Our seven operating segments represent components of our business for which separate financial information is available that is utilized on a regular basis by our chief operating decision maker in determining how to allocate the assets of the company and evaluate performance. These seven operating segments
are each managed by an operating segment manager, who is responsible for the day-to-day operating decisions and performance evaluation of the operating segment’s underlying businesses. We evaluate the profit performance of our segments primarily based on income before income taxes, but also look to earnings (loss) before interest and taxes (“EBIT”) as a performance evaluation measure because interest expense is essentially related to acquisitions, as opposed to segment operations.
Our industrial reportable segment products are sold throughout North America and also account for the majority of our international sales. Our industrial product lines are sold directly to contractors, distributors and end-users, such as industrial manufacturing facilities, public institutions and other commercial customers. The industrial reportable segment comprises three separate operating segments — Tremco Group, tremco illbruck Group and Performance Coatings Group. Products and services within this reportable segment include construction chemicals, roofing systems, weatherproofing and other sealants, and polymer flooring.
Our specialty reportable segment products are sold throughout North America and a few international locations, primarily in Europe. Our specialty product lines are sold directly to contractors, distributors and end-users, such as industrial manufacturing facilities, public institutions and other commercial customers. The specialty reportable segment is a single operating segment, which offers products that include industrial cleaners, restoration services equipment, colorants, exterior finishes, edible coatings and specialty glazes for pharmaceutical and food industries, and other specialty OEM coatings. As discussed in Note A(2), this segment includes the SPHC businesses, which were reconsolidated as of January 1, 2015.
Our consumer reportable segment manufactures and markets professional use and do-it-yourself (“DIY”) products for a variety of mainly consumer applications, including home improvement and personal leisure activities. Our consumer segment’s major manufacturing and distribution operations are located primarily in North America, along with a few locations in Europe and other parts of the world. Our consumer reportable segment products are primarily sold directly to mass merchandisers, home improvement centers, hardware stores, paint stores, craft shops, cosmetic companies and through distributors. This reportable segment comprises three operating segments — Rust-Oleum Group, DAP Group and SPG-Consumer Group. Products within this reportable segment include specialty, hobby and professional paints; nail enamels; caulks; adhesives; silicone sealants and wood stains. Sales to the Home Depot represented less than 10% of our consolidated net sales for fiscal 2017 and 2016, and 10% of our consolidated net sales for fiscal 2015, and 28%, 28% and 29% of our consumer segment net sales for fiscal 2017, 2016 and 2015, respectively.
In addition to our three reportable segments, there is a category of certain business activities and expenses, referred to as corporate/other, that does not constitute an operating segment. This category includes our corporate headquarters and related administrative expenses, results of our captive insurance companies, gains or losses on the sales of certain assets and other expenses not directly associated with any reportable segment. Assets related to the corporate/other category consist primarily of investments, prepaid expenses and headquarters’ property and equipment. These corporate and other assets and expenses reconcile reportable segment data to total consolidated income before income taxes, interest expense and earnings before interest and taxes; as well as identifiable assets, capital expenditures and depreciation and amortization.
We reflect income from our joint ventures on the equity method, and receive royalties from our licensees.
RPM International Inc. and Subsidiaries 61
Managem
ent’s Discussion and A
nalysis Consolidated Financial Statements N
otes to Consolidated Financial Statements Q
uarterly Stock Price and Dividend Inform
ation Managem
ent’s Report Auditors’ Reports Stockholder Inform
ation

The following tables reflect the results of our reportable segments consistent with our management philosophy, and represent the information we utilize, in conjunction with various strategic, operational and other financial performance criteria, in evaluating the performance of our portfolio of businesses. Information for all periods presented has been recast to reflect the current-year change in the composition of our reportable segments.
Year Ended May 31, 2017 2016 2015
(In thousands)Net Sales Industrial $ 2,564,202 $ 2,491,647 $ 2,581,424 Specialty 713,589 684,564 409,297 Consumer 1,680,384 1,637,438 1,603,829
Total $ 4,958,175 $ 4,813,649 $ 4,594,550
Income (Loss) Before Income Taxes Industrial Income Before Income Taxes (a) $ 243,335 $ 257,180 $ 251,903 Interest (Expense), Net (b) (7,985) (6,071) (8,282)
EBIT (c) $ 251,320 $ 263,251 $ 260,185
Specialty Income Before Income Taxes (a) $ 107,904 $ 107,546 $ 63,434 Interest (Expense), Net (b) 526 814 626
EBIT (c) $ 107,378 $ 106,732 $ 62,808
Consumer Income Before Income Taxes (a) $ 58,726 $ 268,218 $ 274,001 Interest (Expense), Net (b) (323) 40 34
EBIT (c) $ 59,049 $ 268,178 $ 273,967
Corporate/Other (Expense) Before Income Taxes (a) $ (165,632) $ (149,478) $ (136,085) Interest (Expense), Net (b) (75,188) (76,101) (61,416)
EBIT (c) $ (90,444) $ (73,377) $ (74,669)
Consolidated Income Before Income Taxes (a) $ 244,333 $ 483,466 $ 453,253 Interest (Expense), Net (b) (82,970) (81,318) (69,038)
EBIT (c) $ 327,303 $ 564,784 $ 522,291
Identifiable Assets Industrial $ 2,382,784 $ 2,206,062 $ 2,146,244 Specialty 759,822 754,757 758,020 Consumer 1,821,190 1,734,600 1,626,097 Corporate/Other 126,653 69,550 149,701
Total $ 5,090,449 $ 4,764,969 $ 4,680,062
Capital Expenditures Industrial $ 65,083 $ 78,002 $ 46,975 Specialty 14,104 10,238 6,998 Consumer 45,690 27,269 29,354 Corporate/Other 1,232 1,674 2,036
Total $ 126,109 $ 117,183 $ 85,363
Depreciation and Amortization Industrial $ 51,529 $ 47,697 $ 48,212 Specialty 26,453 25,646 12,619 Consumer 33,374 31,445 32,153 Corporate/Other 5,417 6,251 6,192
Total $ 116,773 $ 111,039 $ 99,176
(a) The presentation includes a reconciliation of Income (Loss) Before Income Taxes, a measure defined by Generally Accepted Accounting Principles (GAAP) in the United States, to EBIT.
(b) Interest (expense), net includes the combination of interest expense and investment expense (income), net.
(c) EBIT is a non-GAAP measure, and is defined as earnings (loss) before interest and taxes. We evaluate the profit performance of our segments based on income before income taxes, but also look to EBIT as a performance evaluation measure because interest expense is essentially related to acquisitions, as opposed to segment operations. We believe EBIT is useful to investors for this purpose as well, using EBIT as a metric in their investment decisions. EBIT should not be considered an alternative to, or more meaningful than, income before income taxes as determined in accordance with GAAP, since EBIT omits the impact of interest in determining operating performance, which represent items necessary to our continued operations, given our level of indebtedness. Nonetheless, EBIT is a key measure expected by and useful to our fixed income investors, rating agencies and the banking community, all of whom believe, and we concur, that this measure is critical to the capital markets’ analysis of our segments’ core operating performance. We also evaluate EBIT because it is clear that movements in EBIT impact our ability to attract financing. Our underwriters and bankers consistently require inclusion of this measure in offering memoranda in conjunction with any debt underwriting or bank financing. EBIT may not be indicative of our historical operating results, nor is it meant to be predictive of potential future results.
RPM International Inc. and Subsidiaries62

Year Ended May 31, 2017 2016 2015
(In thousands)Net Sales (based on shipping location) (a)
United States $ 3,269,400 $ 3,155,810 $ 2,856,723
Foreign Canada 321,696 310,817 337,869 Europe 908,799 928,519 941,820 Other Foreign 458,280 418,503 458,138
Total Foreign 1,688,775 1,657,839 1,737,827
Total $ 4,958,175 $ 4,813,649 $ 4,594,550
Long-Lived Assets (b)
United States $ 1,738,180 $ 1,756,012 $ 1,693,288
Foreign Canada 137,211 111,524 114,717 Europe 349,979 271,796 293,685 United Kingdom 199,415 257,935 273,118 Other Foreign 248,435 212,583 202,721
Total Foreign 935,040 853,838 884,241
Total $ 2,673,220 $ 2,609,850 $ 2,577,529
(a) It is not practicable to obtain the information needed to disclose revenues attributable to each of our product lines.
(b) Long-lived assets include all non-current assets, excluding non-current deferred income taxes.
NOTE P — QUARTERLY INFORMATION (UNAUDITED)
The following is a summary of the quarterly results of operations for the years ended May 31, 2017 and 2016:
For Quarter Ended
(In thousands, except per share amounts) August 31 November 30 (a) February 28 May 31
2017 Net Sales $ 1,252,063 $ 1,190,770 $ 1,022,496 $ 1,492,846Gross Profit $ 552,042 $ 521,681 $ 428,573 $ 663,392Net Income Attributable to RPM International Inc. Stockholders $ 112,769 $ (70,926) $ 11,928 $ 128,052Basic Earnings Per Share $ 0.85 $ (0.54) $ 0.09 $ 0.96Diluted Earnings Per Share $ 0.83 $ (0.54) $ 0.09 $ 0.94
Dividends Per Share $ 0.275 $ 0.300 $ 0.300 $ 0.300
(In thousands, except per share amounts) August 31 November 30 February 29 May 31
2016 Net Sales $ 1,242,526 $ 1,155,984 $ 988,555 $ 1,426,584Gross Profit $ 532,958 $ 493,934 $ 412,962 $ 647,194Net Income Attributable to RPM International Inc. Stockholders $ 99,815 $ 83,433 $ 18,582 $ 152,895Basic Earnings Per Share $ 0.76 $ 0.63 $ 0.14 $ 1.16Diluted Earnings Per Share $ 0.74 $ 0.62 $ 0.14 $ 1.13
Dividends Per Share $ 0.260 $ 0.275 $ 0.275 $ 0.275
(a) Reflects the pretax goodwill and intangible asset impairment losses of $188.3 million related to our Kirker reporting unit. Refer to Note B, “Goodwill and Other Intangible Assets,” for further information. Also reflects $12.3 million pretax charge relating to the Flowcrete decision to exit the Middle East.
Quarterly earnings per share may not total to the yearly earnings per share due to the weighted-average number of shares outstanding in each quarter.
RPM International Inc. and Subsidiaries 63
Managem
ent’s Discussion and A
nalysis Consolidated Financial Statements N
otes to Consolidated Financial Statements Q
uarterly Stock Price and Dividend Inform
ation Managem
ent’s Report Auditors’ Reports Stockholder Inform
ation
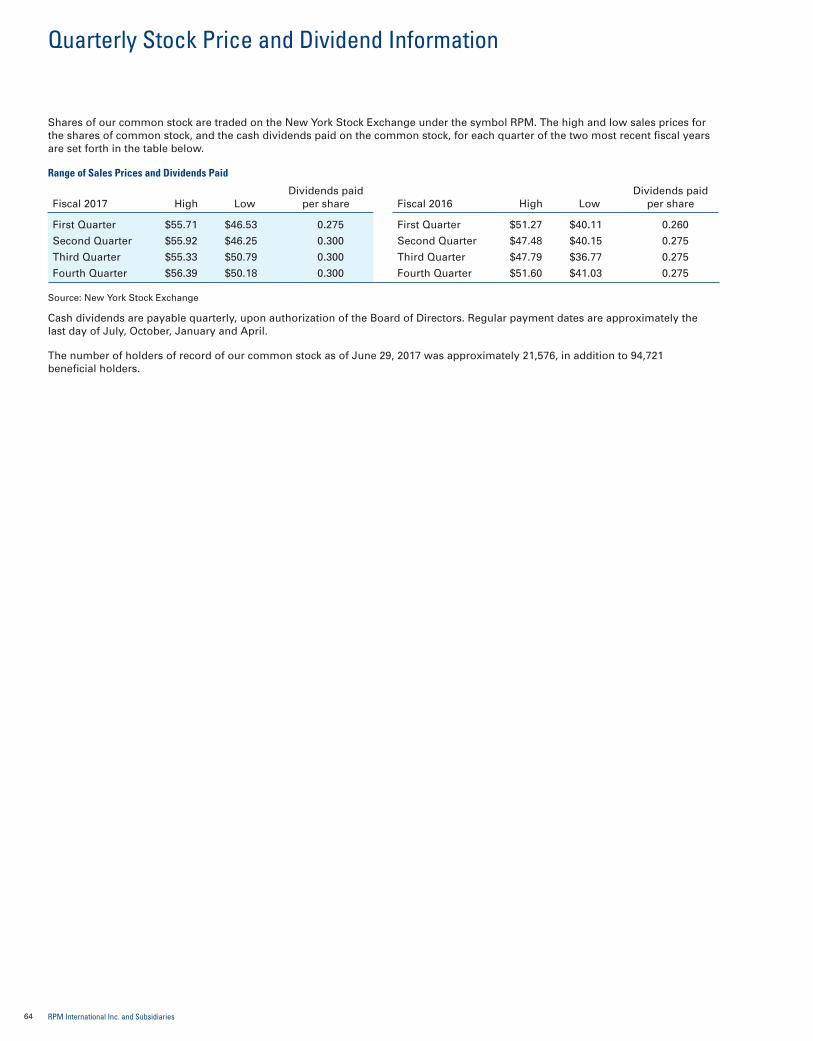
Quarterly Stock Price and Dividend Information
Shares of our common stock are traded on the New York Stock Exchange under the symbol RPM. The high and low sales prices for the shares of common stock, and the cash dividends paid on the common stock, for each quarter of the two most recent fiscal years are set forth in the table below.
Range of Sales Prices and Dividends Paid
Dividends paid Fiscal 2017 High Low per share
First Quarter $55.71 $46.53 0.275
Second Quarter $55.92 $46.25 0.300
Third Quarter $55.33 $50.79 0.300
Fourth Quarter $56.39 $50.18 0.300
Dividends paid Fiscal 2016 High Low per share
First Quarter $51.27 $40.11 0.260
Second Quarter $47.48 $40.15 0.275
Third Quarter $47.79 $36.77 0.275
Fourth Quarter $51.60 $41.03 0.275
Source: New York Stock Exchange
Cash dividends are payable quarterly, upon authorization of the Board of Directors. Regular payment dates are approximately the last day of July, October, January and April.
The number of holders of record of our common stock as of June 29, 2017 was approximately 21,576, in addition to 94,721 beneficial holders.
RPM International Inc. and Subsidiaries64

Management’s Report on Internal Control Over Financial Reporting
The management of RPM International Inc. is responsible for establishing and maintaining adequate internal control over financial reporting for the Company, as such term is defined in Rule 13a-15(f) under the Securities Exchange Act of 1934. RPM’s internal control system was designed to provide reasonable assurance regarding the reliability of financial reporting and the preparation of the Consolidated Financial Statements.
Because of its inherent limitations, internal control over financial reporting may not prevent or detect misstatements and even when determined to be effective, can only provide reasonable assurance with respect to financial statement preparation and presentation. Also, projections of any evaluation of effectiveness to future periods are subject to the risk that controls may be inadequate because of changes in conditions, or that the degree of compliance with the policies or procedures may deteriorate.
Management assessed the effectiveness of RPM’s internal control over financial reporting as of May 31, 2017. In making this assessment, management used the criteria set forth by the Committee of Sponsoring Organizations of the Treadway Commission in Internal Control-Integrated Framework (2013 Framework). Based on this assessment, management concluded that, as of May 31, 2017, RPM’s internal control over financial reporting is effective.
The independent registered public accounting firm Deloitte & Touche LLP, has also audited the Company’s internal control over financial reporting as of May 31, 2017 and their report thereon is included on page 67 of this report.
Frank C. Sullivan Russell L. Gordon Chairman and Chief Executive Officer Vice President and Chief Financial Officer
July 24, 2017
RPM International Inc. and Subsidiaries 65
Managem
ent’s Discussion and A
nalysis Consolidated Financial Statements N
otes to Consolidated Financial Statements Q
uarterly Stock Price and Dividend Inform
ation Managem
ent’s Report Auditors’ Reports Stockholder Inform
ation

Reports of Independent Registered Public Accounting Firms
TO THE BOARD OF DIRECTORS AND STOCKHOLDERS OF RPM INTERNATIONAL INC.
We have audited the accompanying consolidated balance sheets of RPM International Inc. and subsidiaries (the “Company”) as of May 31, 2017 and 2016, and the related consolidated statements of income, comprehensive income, cash flows, and stockholders’ equity for the years then ended. These financial statements are the responsibility of the Company’s management. Our responsibility is to express an opinion on these consolidated financial statements based on our audits.
We conducted our audits in accordance with the standards of the Public Company Accounting Oversight Board (United States). Those standards require that we plan and perform the audit to obtain reasonable assurance about whether the financial statements are free of material misstatement. An audit includes examining, on a test basis, evidence supporting the amounts and disclosures in the financial statements. An audit also includes assessing the accounting principles used and significant estimates made by management, as well as evaluating the overall financial statement presentation. We believe that our audits provide a reasonable basis for our opinion.
In our opinion, such consolidated financial statements present fairly, in all material respects, the financial position of RPM International Inc. and subsidiaries as of May 31, 2017 and 2016, and the results of their operations and their cash flows for the years then ended in conformity with accounting principles generally accepted in the United States of America.
We have also audited, in accordance with the standards of the Public Company Accounting Oversight Board (United States), the Company’s internal control over financial reporting as of May 31, 2017, based on the criteria established in Internal Control - Integrated Framework (2013) issued by the Committee of Sponsoring Organizations of the Treadway Commission and our report dated July 24, 2017, expressed an unqualified opinion on the Company’s internal control over financial reporting based on our audit.
Cleveland, Ohio July 24, 2017
TO THE BOARD OF DIRECTORS AND STOCKHOLDERS
RPM International Inc. and Subsidiaries
We have audited the accompanying consolidated statement of income, comprehensive income, stockholders’ equity and cash flows of RPM International Inc. and Subsidiaries for the period ended May 31, 2015. These financial statements are the responsibility of the Company’s management. Our responsibility is to express an opinion on these financial statements based on our audits.
We conducted our audits in accordance with the standards of the Public Company Accounting Oversight Board (United States). Those standards require that we plan and perform the audit to obtain reasonable assurance about whether the financial statements are free of material misstatement. An audit includes examining, on a test basis, evidence supporting the amounts and disclosures in the financial statements. An audit also includes assessing the accounting principles used and significant estimates made by management, as well as evaluating the overall financial statement presentation. We believe that our audits provide a reasonable basis for our opinion.
In our opinion, the financial statements referred to above present fairly, in all material respects, the consolidated results of operations and cash flows of RPM International Inc. and Subsidiaries for the period ended May 31, 2015, in conformity with U.S. generally accepted accounting principles.
Cleveland, Ohio July 27, 2015 Except for Notes B and O, as to which the date is July 24, 2017
RPM International Inc. and Subsidiaries66

TO THE BOARD OF DIRECTORS AND STOCKHOLDERS OF RPM INTERNATIONAL INC.
We have audited the internal control over financial reporting of RPM International Inc. and subsidiaries (the “Company”) as of May 31, 2017, based on criteria established in Internal Control—Integrated Framework (2013) issued by the Committee of Sponsoring Organizations of the Treadway Commission. The Company’s management is responsible for maintaining effective internal control over financial reporting and for its assessment of the effectiveness of internal control over financial reporting, included in the accompanying Management’s Report on Internal Control over Financial Reporting. Our responsibility is to express an opinion on the Company’s internal control over financial reporting based on our audit.
We conducted our audit in accordance with the standards of the Public Company Accounting Oversight Board (United States). Those standards require that we plan and perform the audit to obtain reasonable assurance about whether effective internal control over financial reporting was maintained in all material respects. Our audit included obtaining an understanding of internal control over financial reporting, assessing the risk that a material weakness exists, testing and evaluating the design and operating effectiveness of internal control based on the assessed risk, and performing such other procedures as we considered necessary in the circumstances. We believe that our audit provides a reasonable basis for our opinion.
A company’s internal control over financial reporting is a process designed by, or under the supervision of, the company’s principal executive and principal financial officers, or persons performing similar functions, and effected by the company’s board of directors, management, and other personnel to provide reasonable assurance regarding the reliability of financial reporting and the preparation of financial statements for external purposes in accordance with generally accepted accounting principles. A company’s internal control over financial reporting includes those policies and procedures that (1) pertain to the maintenance of records that, in reasonable detail, accurately and fairly reflect the transactions and dispositions of the assets of the company; (2) provide reasonable assurance that transactions are recorded as necessary to permit preparation of financial statements in accordance with generally accepted accounting principles, and that receipts and expenditures of the company are being made only in accordance with authorizations of management and directors of the company; and (3) provide reasonable assurance regarding prevention or timely detection of unauthorized acquisition, use, or disposition of the company’s assets that could have a material effect on the financial statements.
Because of the inherent limitations of internal control over financial reporting, including the possibility of collusion or improper management override of controls, material misstatements due to error or fraud may not be prevented or detected on a timely basis. Also, projections of any evaluation of the effectiveness of the internal control over financial reporting to future periods are subject to the risk that the controls may become inadequate because of changes in conditions, or that the degree of compliance with the policies or procedures may deteriorate.
In our opinion, the Company maintained, in all material respects, effective internal control over financial reporting as of May 31, 2017, based on the criteria established in Internal Control—Integrated Framework (2013) issued by the Committee of Sponsoring Organizations of the Treadway Commission.
We have also audited, in accordance with the standards of the Public Company Accounting Oversight Board (United States), the consolidated financial statements as of and for the year ended May 31, 2017, of the Company and our report dated July 24, 2017, expressed an unqualified opinion on those financial statements.
Cleveland, Ohio July 24, 2017
RPM International Inc. and Subsidiaries 67
Managem
ent’s Discussion and A
nalysis Consolidated Financial Statements N
otes to Consolidated Financial Statements Q
uarterly Stock Price and Dividend Inform
ation Managem
ent’s Report Auditors’ Reports Stockholder Inform
ation

World HeadquartersRPM International Inc.2628 Pearl RoadP.O. Box 777Medina, OH 44258Telephone: 330-273-5090 or 800-776-4488Fax: 330-225-8743Website: www.rpminc.comE-mail: [email protected]
Annual MeetingRPM stockholders are invited to attend RPM’s Annual Meeting, which will be held at 2:00 p.m. EDT on Thursday, October 5, 2017 at the Holiday Inn, 15471 Royalton Road, Strongsville, Ohio. Directions can be found on the RPM website.
Form 10-K and Other Financial InformationInvestors may obtain, at no charge, a copy of the RPM Annual Report to the Securities and Exchange Commission on Form 10-K, a corporate video and other investor information by contacting Kathie M. Rogers, Manager of Investor Relations, at RPM, 800-776-4488.
Form 10-K, other public financial reports and news releases may also be obtained electronically through the website, www.rpminc.com.
Corporate GovernanceCopies of the RPM Board of Directors Corporate Governance Guidelines, as well as the Committee Charters and RPM’s Governance Documents, are available on the company’s website at www.rpminc.com, under “About RPM/Corporate Governance.” Copies of these materials are also available, without charge, upon written request to the Secretary of RPM.
Institutional Investor and Security Analyst InquiriesSecurity analysts and investment professionals with questions regarding RPM should contact Barry M. Slifstein, Vice President - Investor Relations, at 330-273-5090 or [email protected].
Dividend PaymentsCommon stock cash dividends are payable quarterly, upon authorization of the Board of Directors. Regular payment dates are typically the 31st of July, October and January and the 30th of April. RPM has increased the cash dividend payments to its stockholders for 43 consecutive years.
Stock Exchange ListingRPM International Inc. is listed on the New York Stock Exchange under the ticker symbol “RPM.”
Stock Transfer Agent, Registrar and Dividend Disbursing AgentWells Fargo Bank, N.A. maintains RPM’s stockholder records and is responsible for disbursing dividend checks. Questions concerning your account, change of address, transfer of ownership, lost certificates, safekeeping of stock certificates, dividend payments, direct deposit of dividends and other related items should be directed to:
Wells Fargo Shareowner ServicesP.O. Box 64854St. Paul, MN 55164-0854Telephone: 800-988-5238 or 651-450-4064 (outside the United States)Fax: 651-450-4085Website: www.shareowneronline.com
Certified/Overnight Mail:Wells Fargo Shareowner Services1110 Centre Pointe Curve, Suite 101 Mendota Heights, MN 55120-4100
Internet Account AccessStockholders of record may access their accounts via the internet to view their account holdings, change address, complete certain transactions and get answers to other stock-related inquires through Wells Fargo Shareowner Online at www.shareowneronline.com.
Direct Stock Purchase and Dividend Reinvestment PlanRPM offers a direct stock purchase and dividend reinvestment plan administered by Wells Fargo Bank, N.A. The plan allows new investors to purchase RPM common stock directly, and existing stockholders to increase their holdings. There is no commission cost for shares purchased. The minimum initial investment is $200. Additional cash investments must be at least $25 and not more than $5,000 per month. For more details on the plan or questions concerning existing Dividend Reinvestment accounts, please contact Wells Fargo Shareholder Services (see above).
Independent Registered Public Accounting FirmDeloitte & Touche LLP, Cleveland, Ohio
CounselCalfee, Halter & Griswold LLP, Cleveland, Ohio
The RPM AppFor up-to-date investment information on RPM, download the RPM app for Apple and Android devices. Scan this QR code or visit your app market.
Stockholder Information
The paper in this annual report is certifi ed to the Forest Stewardship Council® (FSC®) standards. It was tracked through the FSC chain of custody, which means the forest, paper manufacturer, merchant and printer are all FSC certifi ed. The FSC certifi cation is indicative of the highest social and environmental standards for paper use. More information is available at www.us.fsc.org.
68 RPM International Inc. and Subsidiaries

Gen. John P. Abizaid (Retired) (3) Elected 2008; Senior Partner, JPA Partners LLC (a Nevada-based strategic and analytic consulting firm), and a retired four-star General in the U.S. Army and former commander of the U.S. Central Command
Julie A. Lagacy (2) Elected 2017; Vice President, Global Information Services and Chief Information Officer, Caterpillar Inc., Peoria, Illinois (a global manufacturer of construction and mining equipment)
Bruce A. Carbonari (1), (4*), (5) Elected 2002; retired Chairman and Chief Executive Officer, Fortune Brands, Inc., Deerfield, Illinois (a leading consumer brands company)
Craig S. Morford (4) Elected 2013; Chief Legal and Compliance Officer, Cardinal Health, Inc., Dublin, Ohio (a health care services company)
David A. Daberko (1), (3*) Elected 2007; retired Chairman and Chief Executive Officer, National City Corporation, Cleveland, Ohio, now part of PNC Financial Services Group, Inc. (a financial holding company)
Frederick R. Nance (4) Elected 2007; Global Managing Partner, Squire Patton Boggs (US) LLP, Cleveland, Ohio (attorneys at law)
Jenniffer D. Deckard (4) Elected 2015; President and Chief Executive Officer, Fairmount Santrol Holdings Inc., Chesterland, Ohio (a leading sand mining and sand-based products company)
Frank C. Sullivan (1*) Elected 1995; Chairman and Chief Executive Officer, RPM International Inc.
Salvatore D. Fazzolari (1), (2*) Elected 2013; former Chairman, President and Chief Executive Officer, Harsco Corporation, Camp Hill, Pennsylvania (a diversified global industrial company)
William B. Summers, Jr. (2) Elected 2004; retired Chairman and Chief Executive Officer, McDonald Investments Inc., Cleveland, Ohio, now part of KeyBanc Capital Markets Inc. (an investment banking and securities firm)
Thomas S. Gross (2), (3) Elected 2012; retired Vice Chairman and Chief Operating Officer, Electrical Sector of Eaton Corporation plc, Dublin, Ireland (a global diversified power management company)
BOARD OF DIRECTORS
OFFICERSFrank C. Sullivan Chairman and Chief Executive Officer
Ronald A. Rice President and Chief Operating Officer
Russell L. Gordon Vice President and Chief Financial Officer
Edward W. Moore Senior Vice President, General Counsel, Chief Compliance Officer and Secretary
Kenneth M. Armstrong Vice President – Environmental, Health and Safety
Tracy D. Crandall Vice President, Associate General Counsel and Assistant Secretary
Lonny R. DiRusso Vice President – Information Technology
Janeen B. Kastner Vice President – Corporate Benefits and Risk Management
John F. Kramer Vice President – Corporate Development
Randell McShepard Vice President – Public Affairs
Matthew T. Ratajczak Vice President – Global Tax and Treasurer
Melissa A. Schoger Vice President – Planning and Financial Analysis
Barry M. Slifstein Vice President – Investor Relations
Keith R. Smiley Vice President – Finance and Controller
Thomas C. Sullivan, Jr. Vice President – Corporate Development
(1) Executive Committee (2) Audit Committee (3) Compensation Committee (4) Governance & Nominating Committee (5) Lead Director * Chairman of the Committee
Directors and Officers • RPM International Inc.

AD Fire • Adhere Industrial Tapes • API • Applied Polymerics • Arnette Polymers • Ascoat • Betumat • Bomat • Boral • Canam • Carboline • Chemical Coatings, Inc. • Chemspec • Chemtec • Chemtron • Citadel • Dane Group • DAP • Day-Glo • Dryvit • Duram • Euclid Chemical • Eucomex • Expanko • Fibregrid • Finishworks • Firetherm • Flecto • Flowcrete • Grupo PV • Guardian Products • HiChem • Holton Food Products • Hummervoll • illbruck • Increte • Kop-Coat • Krud Kutter • Legend Brands • Mameco • Mantrose-Haeuser • Martin Mathys N.V. • Modern Masters • Mohawk • Multicolor Specialties • Nu-Chem • Nullifire • Okon • Paper Tiger • Parks • Permaquik • Pipeline & Drainage Systems • Plastic Wood • Prime Resins • Prochem • Productos CAVE • Prosytec • PSI Packaging • Radiant Color • Rust-Oleum • Seal-Krete • Sierra Performance Coatings • Specialty Polymer Coatings • Spraymate • SPS Group • Star Maling • Stonhard • Tamms • TCI • Testor • Tor • Touch ‘n Foam • Toxement • Tremco • Triarch • Ultra-Tex • Universal Sealants • Vandex • Viapol • Watco • Westfield Coatings • XIM • Zehrung • Zinsser • AD Fire • Adhere Industrial Tapes • API • Applied Polymerics • Arnette Polymers • Ascoat • Betumat • Bomat • Boral • Canam • Carboline • Chemical Coatings, Inc. • Chemspec • Chemtec • Chemtron • Citadel • Dane Group • DAP • Day-Glo • Dryvit • Duram • Euclid Chemical • Eucomex • Expanko • Fibregrid • Finishworks • Firetherm • Flecto • Flowcrete • Grupo PV • Guardian Products • HiChem • Holton Food Products • Hummervoll • illbruck • Increte • Kop-Coat • Krud Kutter • Legend Brands • Mameco • Mantrose-Haeuser • Martin Mathys N.V. • Modern Masters • Mohawk • Multicolor Specialties • Nu-Chem • Nullifire • Okon • Paper Tiger • Parks • Permaquik • Pipeline & Drainage Systems • Plastic Wood • Prime Resins • Prochem • Productos CAVE • Prosytec • PSI Packaging • Radiant Color • Rust-Oleum • Seal-Krete • Sierra Performance Coatings • Specialty Polymer Coatings • Spraymate • SPS Group • Star Maling • Stonhard • Tamms • TCI • Testor • Tor • Touch ‘n Foam • Toxement • Tremco • Triarch • Ultra-Tex • Universal Sealants • Vandex • Viapol • Watco • Westfield Coatings • XIM • Zehrung • Zinsser • AD Fire • Adhere Industrial Tapes • API • Applied Polymerics • Arnette Polymers • Ascoat • Betumat • Bomat • Boral • Canam • Carboline • Chemical Coatings, Inc. • Chemspec • Chemtec • Chemtron • Citadel • Dane Group • DAP • Day-Glo • Dryvit • Duram • Euclid Chemical • Eucomex • Expanko • Fibregrid • Finishworks • Firetherm • Flecto • Flowcrete • Grupo PV • Guardian Products • HiChem • Holton Food Products • Hummervoll • illbruck • Increte • Kop-Coat • Krud Kutter • Legend Brands • Mameco • Mantrose-Haeuser • Martin Mathys N.V. • Modern Masters • Mohawk • Multicolor Specialties • Nu-Chem • Nullifire • Okon • Paper Tiger • Parks • Permaquik • Pipeline & Drainage Systems • Plastic Wood • Prime Resins • Prochem • Productos CAVE • Prosytec • PSI Packaging • Radiant Color • Rust-Oleum • Seal-Krete • Sierra Performance Coatings • Specialty Polymer Coatings • Spraymate • SPS Group • Star Maling • Stonhard • Tamms • TCI • Testor • Tor • Touch ‘n Foam • Toxement • Tremco • Triarch • Ultra-Tex • Universal Sealants • Vandex • Viapol • Watco • Westfield Coatings • XIM • Zehrung • Zinsser • AD Fire • Adhere Industrial Tapes • API • Applied Polymerics • Arnette Polymers • Ascoat • Betumat • Bomat • Boral • Canam • Carboline • Chemical Coatings, Inc. • Chemspec • Chemtec • Chemtron • Citadel • Dane Group • DAP • Day-Glo • Dryvit • Duram • Euclid Chemical • Eucomex • Expanko • Fibregrid • Finishworks • Firetherm • Flecto • Flowcrete • Grupo PV • Guardian Products • HiChem • Holton Food Products • Hummervoll • illbruck • Increte • Kop-Coat • Krud Kutter • Legend Brands • Mameco • Mantrose-Haeuser • Martin Mathys N.V. • Modern Masters • Mohawk • Multicolor Specialties • Nu-Chem • Nullifire • Okon • Paper Tiger • Parks • Permaquik • Pipeline & Drainage Systems • Plastic Wood • Prime Resins • Prochem • Productos CAVE • Prosytec • PSI Packaging • Radiant Color • Rust-Oleum • Seal-Krete • Sierra Performance Coatings • Specialty Polymer Coatings • Spraymate • SPS Group • Star Maling • Stonhard • Tamms • TCI • Testor • Tor • Touch ‘n Foam • Toxement • Tremco • Triarch • Ultra-Tex • Universal Sealants • Vandex • Viapol • Watco • Westfield Coatings • XIM • Zehrung • Zinsser • AD Fire • Adhere Industrial Tapes • API • Applied Polymerics • Arnette Polymers • Ascoat • Betumat • Bomat • Boral • Canam • Carboline • Chemical Coatings, Inc. • Chemspec • Chemtec • Chemtron • Citadel • Dane Group • DAP • Day-Glo • Dryvit • Duram • Euclid Chemical • Eucomex • Expanko • Fibregrid • Finishworks • Firetherm • Flecto • Flowcrete • Grupo PV • Guardian Products • HiChem • Holton Food Products • Hummervoll • illbruck • Increte • Kop-Coat • Krud Kutter • Legend Brands • Mameco • Mantrose-Haeuser • Martin Mathys N.V. • Modern Masters • Mohawk • Multicolor Specialties • Nu-Chem • Nullifire • Okon • Paper Tiger • Parks • Permaquik • Pipeline & Drainage Systems • Plastic Wood • Prime Resins • Prochem • Productos CAVE • Prosytec • PSI Packaging • Radiant Color • Rust-Oleum • Seal-Krete • Sierra Performance Coatings • Specialty Polymer Coatings • Spraymate • SPS Group • Star Maling • Stonhard • Tamms • TCI • Testor • Tor • Touch ‘n Foam • Toxement • Tremco • Triarch • Ultra-Tex • Universal Sealants • Vandex • Viapol • Watco • Westfield Coatings • XIM • Zehrung • Zinsser • AD Fire • Adhere Industrial Tapes • API • Applied Polymerics • Arnette Polymers • Ascoat • Betumat • Bomat • Boral • Canam • Carboline • Chemical Coatings, Inc. • Chemspec • Chemtec • Chemtron • Citadel • Dane Group • DAP • Day-Glo • Dryvit • Duram • Euclid Chemical • Eucomex • Expanko • Fibregrid • Finishworks • Firetherm • Flecto • Flowcrete • Grupo PV • Guardian Products • HiChem • Holton Food Products • Hummervoll • illbruck • Increte • Kop-Coat • Krud Kutter • Legend Brands • Mameco • Mantrose-Haeuser • Martin Mathys N.V. • Modern Masters • Mohawk • Multicolor Specialties • Nu-Chem • Nullifire • Okon • Paper Tiger • Parks • Permaquik • Pipeline & Drainage Systems • Plastic Wood • Prime Resins • Prochem • Productos CAVE • Prosytec • PSI Packag-ing • Radiant Color • Rust-Oleum • Seal-Krete • Sierra Performance Coatings • Specialty Polymer Coatings • Spraymate • SPS Group • Star Maling • Stonhard • Tamms • TCI • Testor • Tor • Touch ‘n Foam • Toxement • Tremco • Triarch • Ultra-Tex • Universal Sealants • Vandex • Viapol • Watco • Westfield Coatings • XIM • Zehrung • Zinsser • AD Fire • Adhere Industrial Tapes • API • Applied Polymerics • Arnette Polymers • Ascoat • Betumat • Bomat • Boral • Canam • Carboline • Chemical Coatings, Inc. • Chemspec • Chemtec • Chemtron • Citadel • Dane Group • DAP • Day-Glo • Dryvit • Duram • Euclid Chemical • Eucomex • Expanko • Fibregrid • Finishworks • Firetherm • Flecto • Flowcrete • Grupo PV • Guardian Products • HiChem • Holton Food Products • Hummervoll • illbruck • Increte • Kop-Coat • Krud Kutter • Legend Brands • Mameco • Mantrose-Haeuser • Martin Mathys N.V. • Modern Masters • Mohawk • Multicolor Specialties • Nu-Chem • Nullifire • Okon • Paper Tiger • Parks • Permaquik • Pipeline & Drainage Systems • Plastic Wood • Prime Resins • Prochem • Productos CAVE • Prosytec • PSI Packaging • Radiant Color • Rust-Oleum • Seal-Krete • Sierra Performance Coatings • Specialty Polymer Coatings • Spraymate • SPS Group • Star Maling • Stonhard • Tamms • TCI • Testor • Tor • Touch ‘n Foam • Toxement • Tremco • Triarch • Ultra-Tex • Universal Sealants • Vandex • Viapol • Watco • Westfield Coatings • XIM • Zehrung • Zinsser • AD Fire • Adhere Industrial Tapes • API • Applied Polymerics • Arnette Polymers • Ascoat • Betumat • Bomat • Boral • Canam • Carboline • Chemical Coatings, Inc. • Chemspec • Chemtec • Chemtron • Citadel • Dane Group • DAP • Day-Glo • Dryvit • Duram • Euclid Chemical • Eucomex • Expanko • Fibregrid • Finishworks • Firetherm • Flecto • Flowcrete • Grupo PV • Guardian Products • HiChem • Holton Food Products • Hummervoll • illbruck • Increte • Kop-Coat • Krud Kutter • Legend Brands • Mameco • Mantrose-Haeuser • Martin Mathys N.V. • Modern Masters • Mohawk • Multicolor Specialties • Nu-Chem • Nullifire • Okon • Paper Tiger • Parks • Permaquik • Pipeline & Drainage Systems • Plastic Wood • Prime Resins • Prochem • Productos CAVE • Prosytec • PSI Packaging • Radiant Color • Rust-Oleum • Seal-Krete • Sierra Performance Coatings • Specialty Polymer Coatings • Spraymate • SPS Group • Star Maling • Stonhard • Tamms • TCI • Testor • Tor • Touch ‘n Foam • Toxement • Tremco • Triarch • Ultra-Tex • Universal Sealants • Vandex • Viapol • Watco • Westfield Coatings • XIM • Zehrung • Zinsser • AD Fire • Adhere Industrial Tapes • API • Applied Polymerics • Arnette Polymers • Ascoat • Betumat • Bomat • Boral • Canam • Carboline • Chemical Coatings, Inc. • Chemspec • Chemtec • Chemtron • Citadel • Dane Group • DAP • Day-Glo • Dryvit • Duram • Euclid Chemical • Eucomex • Expanko • Fibregrid • Finishworks • Firetherm • Flecto • Flowcrete • Grupo PV • Guardian Products • HiChem • Holton Food Products • Hummervoll • illbruck • Increte • Kop-Coat • Krud Kutter • Legend Brands • Mameco • Mantrose-Haeuser • Martin Mathys N.V. • Modern Masters • Mohawk • Multicolor Specialties • Nu-Chem • Nullifire • Okon • Paper Tiger • Parks • Permaquik • Pipeline & Drainage Systems • Plastic Wood • Prime Resins • Prochem • Productos CAVE • Prosytec • PSI Packaging • Radiant Color • Rust-Oleum • Seal-Krete • Sierra Performance Coatings • Specialty Polymer Coatings • Spraymate • SPS Group • Star Maling • Stonhard • Tamms • TCI • Testor • Tor • Touch ‘n Foam • Toxement • Tremco • Triarch • Ul-tra-Tex • Universal Sealants • Vandex • Viapol • Watco • Westfield Coatings • XIM • Zehrung • Zinsser • AD Fire • Adhere Industrial Tapes • API • Applied Polymerics • Arnette Polymers • Ascoat • Betumat • Bomat • Boral • Canam • Carboline • Chemical Coatings, Inc. • Chemspec • Chemtec • Chemtron • Citadel • Dane Group • DAP • Day-Glo • Dryvit • Duram • Euclid Chemical • Eucomex • Expanko • Fi-bregrid • Finishworks • Firetherm • Flecto • Flowcrete • Grupo PV • Guardian Products • HiChem • Holton Food Products • Hummervoll • illbruck • Increte • Kop-Coat • Krud Kutter • Legend Brands • Mameco • Mantrose-Haeuser • Martin Mathys N.V. • Modern Masters • Mohawk • Multicolor Specialties • Nu-Chem • Nullifire • Okon • Paper Tiger • Parks • Permaquik • Pipeline & Drainage Systems • Plastic Wood • Prime Resins • Prochem • Productos CAVE • Prosytec • PSI Packaging • Radiant Color • Rust-Oleum • Seal-Krete • Sierra Performance Coatings • Specialty Polymer Coatings • Spraymate • SPS Group • Star Maling • Stonhard • Tamms • TCI • Testor • Tor • Touch ‘n Foam • Toxement • Tremco • Triarch • Ultra-Tex • Universal Sealants • Vandex • Viapol • Watco • Westfield Coatings • XIM • Zehrung • Zinsser • AD Fire • Adhere Industrial Tapes • API • Applied Polymerics • Arnette Polymers • Ascoat • Betumat • Bomat • Boral • Canam • Carboline • Chemical Coatings, Inc. • Chemspec • Chemtec • Chemtron • Citadel • Dane Group • DAP • Day-Glo • Dryvit • Duram • Euclid Chemical • Eucomex • Expanko • Fibregrid • Finishworks • Firetherm • Flecto • Flowcrete • Grupo PV • Guardian Products • HiChem • Holton Food Products • Hummervoll • illbruck • Increte • Kop-Coat • Krud Kutter • Legend Brands • Mameco • Mantrose-Haeuser • Martin Mathys N.V. • Modern Masters • Mohawk • Multicolor Specialties • Nu-Chem • Nullifire • Okon • Paper Tiger • Parks • Permaquik • Pipeline & Drainage Systems • Plastic Wood • Prime Resins • Prochem • Productos CAVE • Prosytec • PSI Packag-ing • Radiant Color • Rust-Oleum • Seal-Krete • Sierra Performance Coatings • Specialty Polymer Coatings • Spraymate • SPS Group • Star Maling • Stonhard • Tamms • TCI • Testor • Tor • Touch ‘n Foam • Toxement • Tremco • Triarch • Ultra-Tex • Universal Sealants • Vandex • Viapol • Watco • Westfield Coatings • XIM • Zehrung • Zinsser • AD Fire • Adhere Industrial Tapes • API • Applied Polymerics • Arnette Polymers • Ascoat • Betumat • Bomat • Boral • Canam • Carboline • Chemical Coatings, Inc. • Chemspec • Chemtec • Chemtron • Citadel • Dane Group • DAP • Day-Glo • Dryvit • Duram • Euclid Chemical • Eucomex • Expanko • Fibregrid • Finishworks • Firetherm • Flecto • Flowcrete • Grupo PV • Guardian Products • HiChem • Holton Food Products • Hummervoll • illbruck • Increte • Kop-Coat • Krud Kutter • Legend Brands • Mameco • Mantrose-Haeuser • Martin Mathys N.V. • Modern Masters • Mohawk • Multicolor Specialties • Nu-Chem • Nullifire • Okon • Paper Tiger • Parks • Permaquik • Pipeline & Drainage Systems • Plastic Wood • Prime Resins • Prochem • Productos CAVE • Prosytec • PSI Packaging • Radiant Color • Rust-Oleum • Seal-Krete • Sierra Performance Coatings • Specialty Polymer Coatings • Spraymate • SPS Group • Star Maling • Stonhard • Tamms • TCI • Testor • Tor • Touch ‘n Foam • Toxement • Tremco • Triarch • Ultra-Tex • Universal Sealants • Vandex • Viapol • Watco • Westfield Coatings • XIM • Zehrung • Zinsser • AD Fire • Adhere Industrial Tapes • API • Applied Polymerics • Arnette Polymers • Ascoat • Betumat • Bomat • Boral • Canam • Carboline • Chemical Coatings, Inc. • Chemspec • Chemtec • Chemtron • Citadel • Dane Group • DAP • Day-Glo • Dryvit • Duram • Euclid Chemical • Eucomex • Expanko • Fibregrid • Finishworks • Firetherm • Flecto • Flowcrete • Grupo PV • Guardian Products • HiChem • Holton Food Products • Hummervoll • illbruck • Increte • Kop-Coat • Krud Kutter • Legend Brands • Mameco • Mantrose-Haeuser • Martin Mathys N.V. • Modern Masters • Mohawk • Multicolor Specialties • Nu-Chem • Nullifire • Okon • Paper Tiger • Parks • Permaquik • Pipeline & Drainage Systems • Plastic Wood • Prime Resins • Prochem • Productos CAVE • Prosytec • PSI Packaging • Radiant Color • Rust-Oleum • Seal-Krete • Sierra Performance Coatings • Specialty Polymer Coatings • Spraymate • SPS Group • Star Maling • Stonhard • Tamms • TCI • Testor • Tor • Touch ‘n Foam • Toxement • Tremco • Triarch • Ultra-Tex • Universal Sealants • Vandex • Viapol • Watco • Westfield Coatings • XIM • Zehrung • Zinsser • AD Fire • Adhere Industrial Tapes • API • Applied Polymerics • Arnette Polymers • Ascoat • Betumat • Bomat • Boral • Canam • Carboline • Chemical Coatings, Inc. • Chemspec • Chemtec • Chemtron • Citadel • Dane Group • DAP • Day-Glo • Dryvit • Duram • Euclid Chemical • Eucomex • Expanko • Fibregrid • Finishworks • Firetherm • Flecto • Flowcrete • Grupo PV • Guardian Products • HiChem • Holton Food Products • Hummervoll • illbruck • Increte • Kop-Coat • Krud Kutter • Legend Brands • Mameco • Mantrose-Haeuser • Martin Mathys N.V. • Modern Masters • Mohawk • Multicolor Specialties • Nu-Chem • Nullifire • Okon • Paper Tiger • Parks • Permaquik • Pipeline & Drainage Systems • Plastic Wood • Prime Resins • Prochem • Productos CAVE • Prosytec • PSI Packaging • Radiant Color • Rust-Oleum • Seal-Krete • Sierra Performance Coatings • Specialty Polymer Coatings • Spraymate • SPS Group • Star Maling • Stonhard • Tamms • TCI • Testor • Tor • Touch ‘n Foam • Toxement • Tremco • Triarch • Ul-tra-Tex • Universal Sealants • Vandex • Viapol • Watco • Westfield Coatings • XIM • Zehrung • Zinsser • AD Fire • Adhere Industrial Tapes • API • Applied Polymerics • Arnette Polymers • Ascoat • Betumat • Bomat • Boral • Canam • Carboline • Chemical Coatings, Inc. • Chemspec • Chemtec • Chemtron • Citadel • Dane Group • DAP • Day-Glo • Dryvit • Duram • Euclid Chemical • Eucomex • Expanko • Fi-bregrid • Finishworks • Firetherm • Flecto • Flowcrete • Grupo PV • Guardian Products • HiChem • Holton Food Products • Hummervoll • illbruck • Increte • Kop-Coat • Krud Kutter • Legend Brands • Mameco • Mantrose-Haeuser • Martin Mathys N.V. • Modern Masters • Mohawk • Multicolor Specialties • Nu-Chem • Nullifire • Okon • Paper Tiger • Parks • Permaquik • Pipeline & Drainage Systems • Plastic Wood • Prime Resins • Prochem • Productos CAVE • Prosytec • PSI Packaging • Radiant Color • Rust-Oleum • Seal-Krete • Sierra Performance Coatings • Specialty Polymer Coatings • Spraymate • SPS Group • Star Maling • Stonhard • Tamms • TCI • Testor • Tor • Touch ‘n Foam • Toxement • Tremco • Triarch • Ultra-Tex • Universal Sealants • Vandex • Viapol • Watco • Westfield Coatings • XIM • Zehrung • Zinsser • AD Fire • Adhere Industrial Tapes • API • Applied Polymerics • Arnette Polymers • Ascoat • Betumat • Bomat • Boral • Canam • Carboline • Chemical Coatings, Inc. • Chemspec • Chemtec • Chemtron • Citadel • Dane Group • DAP • Day-Glo • Dryvit • Duram • Euclid Chemical • Eucomex • Expanko • Fibregrid • Finishworks • Firetherm • Flecto • Flowcrete • Grupo PV • Guardian Products • HiChem • Holton Food Products • Hummervoll • illbruck • Increte • Kop-Coat • Krud Kutter • Legend Brands • Mameco • Mantrose-Haeuser • Martin Mathys N.V. • Modern Masters • Mohawk • Multicolor Specialties • Nu-Chem • Nullifire • Okon • Paper Tiger • Parks • Permaquik • Pipeline & Drainage Systems • Plastic Wood • Prime Resins • Prochem • Productos CAVE • Prosytec • PSI Packag-ing • Radiant Color • Rust-Oleum • Seal-Krete • Sierra Performance Coatings • Specialty Polymer Coatings • Spraymate • SPS Group • Star Maling • Stonhard • Tamms • TCI • Testor • Tor • Touch ‘n Foam • Toxement • Tremco • Triarch • Ultra-Tex • Universal Sealants • Vandex • Viapol • Watco • Westfield Coatings • XIM • Zehrung • Zinsser • AD Fire • Adhere Industrial Tapes • API • Applied Polymerics • Arnette Polymers • Ascoat • Betumat • Bomat • Boral • Canam • Carboline • Chemical Coatings, Inc. • Chemspec • Chemtec • Chemtron • Citadel • Dane Group • DAP • Day-Glo • Dryvit • Duram • Euclid Chemical • Eucomex • Expanko • Fibregrid • Finishworks • Firetherm • Flecto • Flowcrete • Grupo PV • Guardian Products • HiChem • Holton Food Products • Hummervoll • illbruck • Increte • Kop-Coat • Krud Kutter • Legend Brands • Mameco • Mantrose-Haeuser • Martin Mathys N.V. • Modern Masters • Mohawk • Multicolor Specialties • Nu-Chem • Nullifire • Okon • Paper Tiger • Parks • Permaquik • Pipeline & Drainage Systems • Plastic Wood • Prime Resins • Prochem • Productos CAVE • Prosytec • PSI Packaging • Radiant Color • Rust-Oleum • Seal-Krete • Sierra Performance Coatings • Specialty Polymer Coatings • Spraymate • SPS Group • Star Maling • Stonhard • Tamms • TCI • Testor • Tor • Touch ‘n Foam • Toxement • Tremco • Triarch • Ultra-Tex • Universal Sealants • Vandex • Viapol • Watco • Westfield Coatings • XIM • Zehrung • Zinsser • AD Fire • Adhere Industrial Tapes • API • Applied Polymerics • Arnette Polymers • Ascoat • Betumat • Bomat • Boral • Canam • Carboline • Chemical Coatings, Inc. • Chemspec • Chemtec • Chemtron • Citadel • Dane Group • DAP • Day-Glo • Dryvit • Duram • Euclid Chemical • Eucomex • Expanko • Fibregrid • Finishworks • Firetherm • Flecto • Flowcrete • Grupo PV • Guardian Products • HiChem • Holton Food Products • Hummervoll • illbruck • Increte • Kop-Coat • Krud Kutter • Legend Brands • Mameco • Mantrose-Haeuser • Martin Mathys N.V. • Modern Masters • Mohawk • Multicolor Specialties • Nu-Chem • Nullifire • Okon • Paper Tiger • Parks • Permaquik • Pipeline & Drainage Systems • Plastic Wood • Prime Resins • Prochem • Productos CAVE • Prosytec • PSI Packaging • Radiant Color • Rust-Oleum • Seal-Krete • Sierra Performance Coatings • Specialty Polymer Coatings • Spraymate • SPS Group • Star Maling • Stonhard • Tamms • TCI • Testor • Tor • Touch ‘n Foam • Toxement • Tremco • Triarch • Ultra-Tex • Universal Sealants • Vandex • Viapol • Watco • Westfield Coatings • XIM • Zehrung • Zinsser • AD Fire • Adhere Industrial Tapes • API • Applied Polymerics • Arnette Polymers • Ascoat • Betumat • Bomat • Boral • Canam • Carboline • Chemical Coatings, Inc. • Chemspec • Chemtec • Chemtron • Citadel • Dane Group • DAP • Day-Glo • Dryvit • Duram • Euclid Chemical • Eucomex • Expanko • Fibregrid • Finishworks • Firetherm • Flecto • Flowcrete • Grupo PV • Guardian Products • HiChem • Holton Food Products • Hummervoll • illbruck • Increte • Kop-Coat • Krud Kutter • Legend Brands • Mameco • Mantrose-Haeuser • Martin Mathys N.V. • Modern Masters • Mohawk • Multicolor Specialties • Nu-Chem • Nullifire • Okon • Paper Tiger • Parks • Permaquik • Pipeline & Drainage Systems • Plastic Wood • Prime Resins • Prochem • Productos CAVE • Prosytec • PSI Packaging • Radiant Color • Rust-Oleum • Seal-Krete • Sierra Performance Coatings • Specialty Polymer Coatings • Spraymate • SPS Group • Star Maling • Stonhard • Tamms • TCI • Testor • Tor • Touch ‘n Foam • Toxement • Tremco • Triarch • Ul-tra-Tex • Universal Sealants • Vandex • Viapol • Watco • Westfield Coatings • XIM • Zehrung • Zinsser • AD Fire • Adhere Industrial Tapes • API • Applied Polymerics • Arnette Polymers • Ascoat • Betumat • Bomat • Boral • Canam • Carboline • Chemical Coatings, Inc. • Chemspec • Chemtec • Chemtron • Citadel • Dane Group • DAP • Day-Glo • Dryvit • Duram • Euclid Chemical • Eucomex • Expanko • Fi-bregrid • Finishworks • Firetherm • Flecto • Flowcrete • Grupo PV • Guardian Products • HiChem • Holton Food Products • Hummervoll • illbruck • Increte • Kop-Coat • Krud Kutter • Legend Brands • Mameco • Mantrose-Haeuser • Martin Mathys N.V. • Modern Masters • Mohawk • Multicolor Specialties • Nu-Chem • Nullifire • Okon • Paper Tiger • Parks • Permaquik • Pipeline & Drainage Systems • Plastic Wood • Prime Resins • Prochem • Productos CAVE • Prosytec • PSI Packaging • Radiant Color • Rust-Oleum • Seal-Krete • Sierra Performance Coatings • Specialty Polymer Coatings • Spraymate • SPS Group • Star Maling • Stonhard • Tamms • TCI • Testor • Tor • Touch ‘n Foam • Toxement • Tremco • Triarch • Ultra-Tex • Universal Sealants • Vandex • Viapol • Watco • Westfield Coatings • XIM • Zehrung • Zinsser • AD Fire • Adhere Industrial Tapes • API • Applied Polymerics • Arnette Polymers • Ascoat • Betumat • Bomat • Boral • Canam • Carboline • Chemical Coatings, Inc. • Chemspec • Chemtec • Chemtron • Citadel • Dane Group • DAP • Day-Glo • Dryvit • Duram • Euclid Chemical • Eucomex • Expanko • Fibregrid • Finishworks • Firetherm • Flecto • Flowcrete • Grupo PV • Guardian Products • HiChem • Holton Food Products • Hummervoll • illbruck • Increte • Kop-Coat • Krud Kutter • Legend Brands • Mameco • Mantrose-Haeuser • Martin Mathys N.V. • Modern Masters • Mohawk • Multicolor Specialties • Nu-Chem • Nullifire • Okon • Paper Tiger • Parks • Permaquik • Pipeline & Drainage Systems • Plastic Wood • Prime Resins • Prochem • Productos CAVE • Prosytec • PSI Packag-ing • Radiant Color • Rust-Oleum • Seal-Krete • Sierra Performance Coatings • Specialty Polymer Coatings • Spraymate • SPS Group • Star Maling • Stonhard • Tamms • TCI • Testor • Tor • Touch ‘n Foam • Toxement • Tremco • Triarch • Ultra-Tex • Universal Sealants • Vandex • Viapol • Watco • Westfield Coatings • XIM • Zehrung • Zinsser • AD Fire • Adhere Industrial Tapes • API • Applied Polymerics • Arnette Polymers • Ascoat • Betumat • Bomat • Boral • Canam • Carboline • Chemical Coatings, Inc. • Chemspec • Chemtec • Chemtron • Citadel • Dane Group • DAP • Day-Glo • Dryvit • Duram • Euclid Chemical • Eucomex • Expanko • Fibregrid • Finishworks • Firetherm • Flecto • Flowcrete • Grupo PV • Guardian Products • HiChem • Holton Food Products • Hummervoll • illbruck • Increte • Kop-Coat • Krud Kutter • Legend Brands • Mameco • Mantrose-Haeuser • Martin Mathys N.V. • Modern Masters • Mohawk • Multicolor Specialties • Nu-Chem • Nullifire • Okon • Paper Tiger • Parks • Permaquik • Pipeline & Drainage Systems • Plastic Wood • Prime Resins • Prochem • Productos CAVE • Prosytec • PSI Packaging • Radiant Color • Rust-Oleum • Seal-Krete • Sierra Performance Coatings • Specialty Polymer Coatings • Spraymate • SPS Group • Star Maling • Stonhard • Tamms • TCI • Testor • Tor • Touch ‘n Foam • Toxement • Tremco • Triarch • Ultra-Tex • Universal Sealants • Vandex • Viapol • Watco • Westfield Coatings • XIM • Zehrung • Zinsser • AD Fire • Adhere Industrial Tapes • API • Applied Polymerics • Arnette Polymers • Ascoat • Betumat • Bomat • Boral • Canam • Carboline • Chemical Coatings, Inc. • Chemspec • Chemtec • Chemtron • Citadel • Dane Group • DAP • Day-Glo • Dryvit • Duram • Euclid Chemical • Eucomex • Expanko • Fibregrid • Finishworks • Firetherm • Flecto • Flowcrete • Grupo PV • Guardian Products • HiChem • Holton Food Products • Hummervoll • illbruck • Increte • Kop-Coat • Krud Kutter • Legend Brands • Mameco • Mantrose-Haeuser • Martin Mathys N.V. • Modern Masters • Mohawk • Multicolor Specialties • Nu-Chem • Nullifire • Okon • Paper Tiger • Parks • Permaquik • Pipeline & Drainage Systems • Plastic Wood • Prime Resins • Prochem • Productos CAVE • Prosytec • PSI Packaging • Radiant Color • Rust-Oleum • Seal-Krete • Sierra Performance Coatings • Specialty Polymer Coatings • Spraymate • SPS Group • Star Maling • Stonhard • Tamms • TCI • Testor • Tor • Touch ‘n Foam • Toxement • Tremco • Triarch • Ultra-Tex • Universal Sealants • Vandex • Viapol • Watco • Westfield Coatings • XIM • Zehrung • Zinsser • AD Fire • Adhere Industrial Tapes • API • Applied Polymerics • Arnette Polymers • Ascoat • Betumat • Bomat • Boral • Canam • Carboline • Chemical Coatings, Inc. • Chemspec • Chemtec • Chemtron • Citadel • Dane Group • DAP • Day-Glo • Dryvit • Duram • Euclid Chemical • Eucomex • Expanko • Fibregrid • Finishworks • Firetherm • Flecto • Flowcrete • Grupo PV • Guardian Products • HiChem • Holton Food Products • Hummervoll • illbruck • Increte • Kop-Coat • Krud Kutter • Legend Brands • Mameco • Mantrose-Haeuser • Martin Mathys N.V. • Modern Masters • Mohawk • Multicolor Specialties • Nu-Chem • Nullifire • Okon • Paper Tiger • Parks • Permaquik • Pipeline & Drainage Systems • Plastic Wood • Prime Resins • Prochem • Productos CAVE • Prosytec • PSI Packaging • Radiant Color • Rust-Oleum • Seal-Krete • Sierra Performance Coatings • Specialty Polymer Coatings • Spraymate • SPS Group • Star Maling • Stonhard • Tamms • TCI • Testor • Tor • Touch ‘n Foam • Toxement • Tremco • Triarch • Ul-tra-Tex • Universal Sealants • Vandex • Viapol • Watco • Westfield Coatings • XIM • Zehrung • Zinsser • AD Fire • Adhere Industrial Tapes • API • Applied Polymerics • Arnette Polymers • Ascoat • Betumat • Bomat • Boral • Canam • Carboline • Chemical Coatings, Inc. • Chemspec • Chemtec • Chemtron • Citadel • Dane Group • DAP • Day-Glo • Dryvit • Duram • Euclid Chemical • Eucomex • Expanko • Fi-bregrid • Finishworks • Firetherm • Flecto • Flowcrete • Grupo PV • Guardian Products • HiChem • Holton Food Products • Hummervoll • illbruck • Increte • Kop-Coat • Krud Kutter • Legend Brands • Mameco • Mantrose-Haeuser • Martin Mathys N.V. • Modern Masters • Mohawk • Multicolor Specialties • Nu-Chem • Nullifire • Okon • Paper Tiger • Parks • Permaquik • Pipeline & Drainage Systems • Plastic Wood • Prime Resins • Prochem • Productos CAVE • Prosytec • PSI Packaging • Radiant Color • Rust-Oleum • Seal-Krete • Sierra Performance Coatings • Specialty Polymer Coatings • Spraymate • SPS Group • Star Maling • Stonhard • Tamms • TCI • Testor • Tor • Touch ‘n Foam • Toxement • Tremco • Triarch • Ultra-Tex • Universal Sealants • Vandex • Viapol • Watco • Westfield Coatings • XIM • Zehrung • Zinsser • AD Fire • Adhere Industrial Tapes • API • Applied Polymerics • Arnette Polymers • Ascoat • Betumat • Bomat • Boral • Canam • Carboline • Chemical Coatings, Inc. • Chemspec • Chemtec • Chemtron • Citadel • Dane Group • DAP • Day-Glo • Dryvit • Duram • Euclid Chemical • Eucomex • Expanko • Fibregrid • Finishworks • Firetherm • Flecto • Flowcrete • Grupo PV • Guardian Products • HiChem • Holton Food Products • Hummervoll • illbruck • Increte • Kop-Coat • Krud Kutter • Legend Brands • Mameco • Mantrose-Haeuser • Martin Mathys N.V. • Modern Masters • Mohawk • Multicolor Specialties • Nu-Chem • Nullifire • Okon • Paper Tiger • Parks • Permaquik • Pipeline & Drainage Systems • Plastic Wood • Prime Resins • Prochem • Productos CAVE • Prosytec • PSI Packag-ing • Radiant Color • Rust-Oleum • Seal-Krete • Sierra Performance Coatings • Specialty Polymer Coatings • Spraymate • SPS Group • Star Maling • Stonhard • Tamms • TCI • Testor • Tor • Touch ‘n Foam • Toxement • Tremco • Triarch • Ultra-Tex • Universal Sealants • Vandex • Viapol • Watco • Westfield Coatings • XIM • Zehrung • Zinsser • AD Fire • Adhere Industrial Tapes • API • Applied Polymerics • Arnette Polymers • Ascoat • Betumat • Bomat • Boral • Canam • Carboline • Chemical Coatings, Inc. • Chemspec • Chemtec • Chemtron • Citadel • Dane Group • DAP • Day-Glo • Dryvit • Duram • Euclid Chemical • Eucomex • Expanko • Fibregrid • Finishworks • Firetherm • Flecto • Flowcrete • Grupo PV • Guardian Products • HiChem • Holton Food Products • Hummervoll • illbruck • Increte • Kop-Coat • Krud Kutter • Legend Brands • Mameco • Mantrose-Haeuser • Martin Mathys N.V. • Modern Masters • Mohawk • Multicolor Specialties • Nu-Chem • Nullifire • Okon • Paper Tiger • Parks • Permaquik • Pipeline & Drainage Systems • Plastic Wood • Prime Resins • Prochem • Productos CAVE • Prosytec • PSI Packaging • Radiant Color • Rust-Oleum • Seal-Krete • Sierra Performance Coatings • Specialty Polymer Coatings • Spraymate • SPS Group • Star Maling • Stonhard • Tamms • TCI • Testor • Tor • Touch ‘n Foam • Toxement • Tremco • Triarch • Ultra-Tex • Universal Sealants • Vandex • Viapol • Watco • Westfield Coatings • XIM • Zehrung • Zinsser • AD Fire • Adhere Industrial Tapes • API • Applied Polymerics • Arnette Polymers • Ascoat • Betumat • Bomat • Boral • Canam • Carboline • Chemical Coatings, Inc. • Chemspec • Chemtec • Chemtron • Citadel • Dane Group • DAP • Day-Glo • Dryvit • Duram • Euclid Chemical • Eucomex • Expanko • Fibregrid • Finishworks • Firetherm • Flecto • Flowcrete • Grupo PV • Guardian Products • HiChem • Holton Food Products • Hummervoll • illbruck • Increte • Kop-Coat • Krud Kutter • Legend Brands • Mameco • Mantrose-Haeuser • Martin Mathys N.V. • Modern Masters • Mohawk • Multicolor Specialties • Nu-Chem • Nullifire • Okon • Paper Tiger • Parks • Permaquik • Pipeline & Drainage Systems • Plastic Wood • Prime Resins • Prochem • Productos CAVE • Prosytec • PSI Packaging • Radiant Color • Rust-Oleum • Seal-Krete • Sierra Performance Coatings • Specialty Polymer Coatings • Spraymate • SPS Group • Star Maling • Stonhard • Tamms • TCI • Testor • Tor • Touch ‘n Foam • Toxement • Tremco • Triarch • Ultra-Tex • Universal Sealants • Vandex • Viapol • Watco • Westfield Coatings • XIM • Zehrung • Zinsser • AD Fire • Adhere Industrial Tapes • API • Applied Polymerics • Arnette Polymers • Ascoat • Betumat • Bomat • Boral • Canam • Carboline • Chemical Coatings, Inc. • Chemspec • Chemtec • Chemtron • Citadel • Dane Group • DAP • Day-Glo • Dryvit • Duram • Euclid Chemical • Eucomex • Expanko • Fibregrid • Finishworks • Firetherm • Flecto • Flowcrete • Grupo PV • Guardian Products • HiChem • Holton Food Products • Hummervoll • illbruck • Increte • Kop-Coat • Krud Kutter • Legend Brands • Mameco • Mantrose-Haeuser • Martin Mathys N.V. • Modern Masters • Mohawk • Multicolor Specialties • Nu-Chem • Nullifire • Okon • Paper Tiger • Parks • Permaquik • Pipeline & Drainage Systems • Plastic Wood • Prime Resins • Prochem • Productos CAVE • Prosytec • PSI Packaging • Radiant Color • Rust-Oleum • Seal-Krete • Sierra Performance Coatings • Specialty Polymer Coatings • Spraymate • SPS Group • Star Maling • Stonhard • Tamms • TCI • Testor • Tor • Touch ‘n Foam • Toxement • Tremco • Triarch • Ul-tra-Tex • Universal Sealants • Vandex • Viapol • Watco • Westfield Coatings • XIM • Zehrung • Zinsser • AD Fire • Adhere Industrial Tapes • API • Applied Polymerics • Arnette Polymers • Ascoat • Betumat • Bomat • Boral • Canam • Carboline • Chemical Coatings, Inc. • Chemspec • Chemtec • Chemtron • Citadel • Dane Group • DAP • Day-Glo • Dryvit • Duram • Euclid Chemical • Eucomex • Expanko • Fi-bregrid • Finishworks • Firetherm • Flecto • Flowcrete • Grupo PV • Guardian Products • HiChem • Holton Food Products • Hummervoll • illbruck • Increte • Kop-Coat • Krud Kutter • Legend Brands • Mameco • Mantrose-Haeuser • Martin Mathys N.V. • Modern Masters • Mohawk • Multicolor Specialties • Nu-Chem • Nullifire • Okon • Paper Tiger • Parks • Permaquik • Pipeline & Drainage Systems • Plastic Wood • Prime Resins • Prochem • Productos CAVE • Prosytec • PSI Packaging • Radiant Color • Rust-Oleum • Seal-Krete • Sierra Performance Coatings • Specialty Polymer Coatings • Spraymate • SPS Group • Star Maling • Stonhard • Tamms • TCI • Testor • Tor • Touch ‘n Foam • Toxement • Tremco • Triarch • Ultra-Tex • Universal Sealants • Vandex • Viapol • Watco • Westfield Coatings •
consecutive years ofCASH DIVIDEND INCREASES
43 70percent by which
RPM’s OUTPERFORMED
10-year total return
the S&P 500
has
1.9 billion dollars in CASH DIVIDENDS RETURNED TOSHAREHOLDERSover past 4 decades
Increase the value of your investment by participating in RPM’s Dividend Reinvestment Plan. You’ll pay no
brokerage fees or commissions on purchases. Learn more at: http://bit.ly/RPMdrip
RPM International Inc. 2628 Pearl Road, P.O. Box 777, Medina, Ohio 44258
Phone: 330-273-5090Fax: 330-225-8743
E-mail: [email protected] Web: www.RPMinc.com
Pay DividendsOur Brands