dtrace€¦ · the dtrace architecture...
TRANSCRIPT

DTrace
David Evans
February 24, 2009
What I’ll discuss
1. What’s DTrace all about
2. DTrace mechanisms
3. Instrumenting SBus
4. The end, and after
What I won’t discuss
The D language in detailStrategies for tracing thingsUseful recipes

1. What’s DTrace all about

What does DTrace do?
Provides probe points
# dtrace -l | wc -l24009
Allows straightforward event-driven measurement

Sun propaganda
If you have ever wanted to understand the behavior ofyour system, DTrace is the tool for you. DTrace is acomprehensive dynamic tracing facility that is builtinto Solaris. The DTrace facility can be used toexamine the behavior of user programs. The DTracefacility can also be used to examine the behavior ofthe operating system. DTrace can be used by systemadministrators or application developers, and issuitable for use with live production systems. DTracewill allow you to explore your system to understandhow it works, track down performance problemsacross many layers of software, or locate the cause ofaberrant behavior.

The DTrace architectureThe following diagram shows the di!erent components of the DTrace architecture, includingproviders, probes, the DTrace kernel software, and the dtrace command.
Now that you understand howDTrace works, let's return to the tour of the D programminglanguage and start writing somemore interesting programs.
Variables andArithmetic ExpressionsOur next example programmakes use of the DTrace profile provider to implement a simpletime-based counter. The pro"le provider is able to create new probes based on the descriptionsfound in your D program. If you create a probe named profile:::tick-nsec for some integern, the pro"le provider will create a probe that "res every n seconds. Type the following sourcecode and save it in a "le named counter.d:
syscall profile
sysinfo vminfo
fbt sdt
fasttrap
DTrace
kerneluserland
DTraceproviders
dtrace(7D)
libdtrace(3LIB)
lockstat(1M)dtrace(1M)
plockstat(1M)intrstat(1M)
DTraceconsumers
a.d b.d ...
...
...
D programsource files
FIGURE 1–1 Overview of theDTraceArchitecture andComponents
Variables andArithmetic Expressions
Chapter 1 • Introduction 33

2. DTrace mechanisms
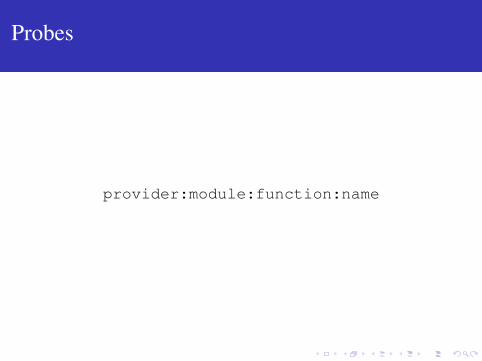
Probes
provider:module:function:name

Providers
# dtrace -l | awk ’{print $2}’ | ... |sort | uniq
...dtracefbtiolockstatmach_trapmds32procprofilesyscallvminfo

Actions
syscall:::entry{
@c[execname] = count();}

Actions with predicates
syscall:::return/ arg0 == -1 /{
@c[execname, probefunc] = count();}

D language features
Variables: lots of typesAggregations
f (f (x0) ∪ f (x1) ∪ . . . ∪ f (xn)) = f (x0 ∪ x1 ∪ . . . ∪ xn)
Thread local- (self->) and clause local- (this->)variablesStructs, unions, C preprocessor, . . .

Strings and address spaces
DTrace scripts run in the kernelGetting at data in user space requires copyin()copyinstr() is a favourite

Speculative tracing
#pragma D option nspec=100
syscall::stat64:entry{
self->spec = speculation();speculate(self->spec);printf("path of failed %s by pid %d is %s",
probefunc, pid,stringof(copyinstr(arg0)));
}

Speculative tracing
syscall::stat64:return/ self->spec /{
speculate(self->spec);printf("errno is %d", errno);
}
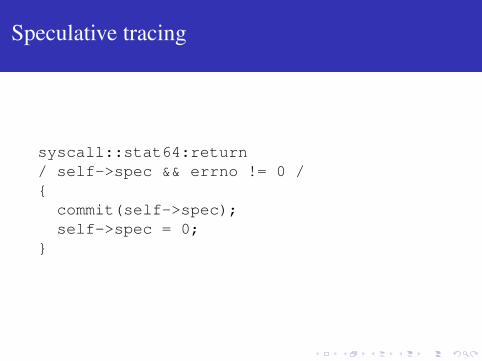
Speculative tracing
syscall::stat64:return/ self->spec && errno != 0 /{
commit(self->spec);self->spec = 0;
}

Speculative tracing
syscall::stat64:return/ self->spec && errno == 0 /{
discard(self->spec);self->spec = 0;
}

3. Instrumenting SBus

What is SBus?
Messaging middlewareComponent-basedDesigned with streams of messages in mind

Architecture
OrganisationOrganisation
Organisation
Component
Component
Component
ComponentComponent
Endpoints

Metrics of interest
RPC response timeComponent transit time

Modifications
smessage *sendpoint::rcv(){...
if(SBUS_RCV_ENABLED()) {inc->tree->cookie = 0;SBUS_RCV(name, type, inc->tree->cookie);
}}

Modifications
void sendpoint::reply(smessage *query,snode *result, int exception,HashCode *hc)
{if(SBUS_REPLY_ENABLED())
SBUS_REPLY(name, type, result->cookie);...}

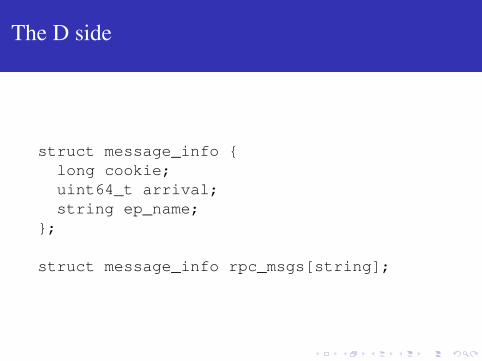
The D side
#pragma D option mangled#pragma D option quiet/** This is copied from component.h. It is a
* very good idea to keep them in sync.
*/enum EndpointType {
EndpointServer,EndpointClient,EndpointSource,EndpointSink
};
The D side
struct message_info {long cookie;uint64_t arrival;string ep_name;
};
struct message_info rpc_msgs[string];
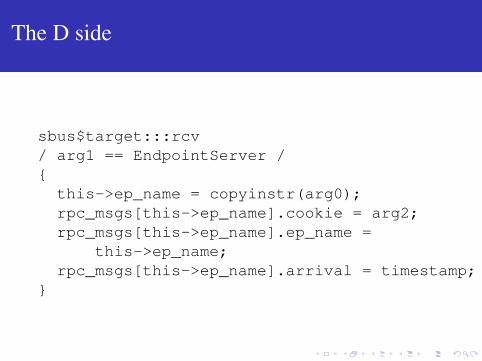
The D side
sbus$target:::rcv/ arg1 == EndpointServer /{
this->ep_name = copyinstr(arg0);rpc_msgs[this->ep_name].cookie = arg2;rpc_msgs[this->ep_name].ep_name =
this->ep_name;rpc_msgs[this->ep_name].arrival = timestamp;
}

The D side
sbus$target:::reply/ arg1 == EndpointServer /{
msg = rpc_msgs[copyinstr(arg0)];@rpc_time[msg.ep_name] = avg(timestamp -
msg.arrival);@rpcs[msg.ep_name] = count();
}

Glue
provider sbus{
probe rcv(char *, int, long);probe reply(char *, int, int);
};
and
#include "sbusProvider.h"

4. The end, and after

What DTrace lets you do
Measure things in the OS (find bugs in apps!)Prepare your apps for instrumentation fairly easily

Why you (probably) can’t have it
Only for Solaris, Opensolaris, and MacOS XMaybe for FreeBSDLinux people seem to mistrust it. . .
For further information
Solaris Dynamic Tracing GuideSun BigAdmin infoGreg Miller, “Exploring Leopard with DTrace”Bryan Cantrill, “DTrace Review”DTrace toolkit