the relationship of two quantitative variables
TRANSCRIPT
1
The relationship of two quantitative variables
2
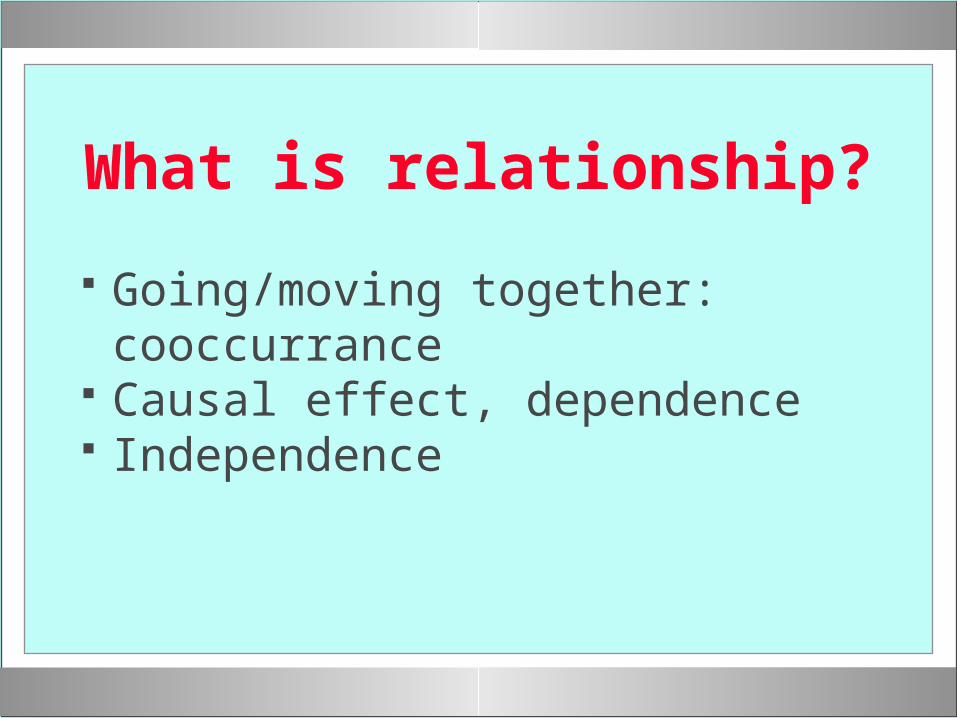
What is relationship?
Going/moving together: cooccurrance Causal effect, dependence Independence
3
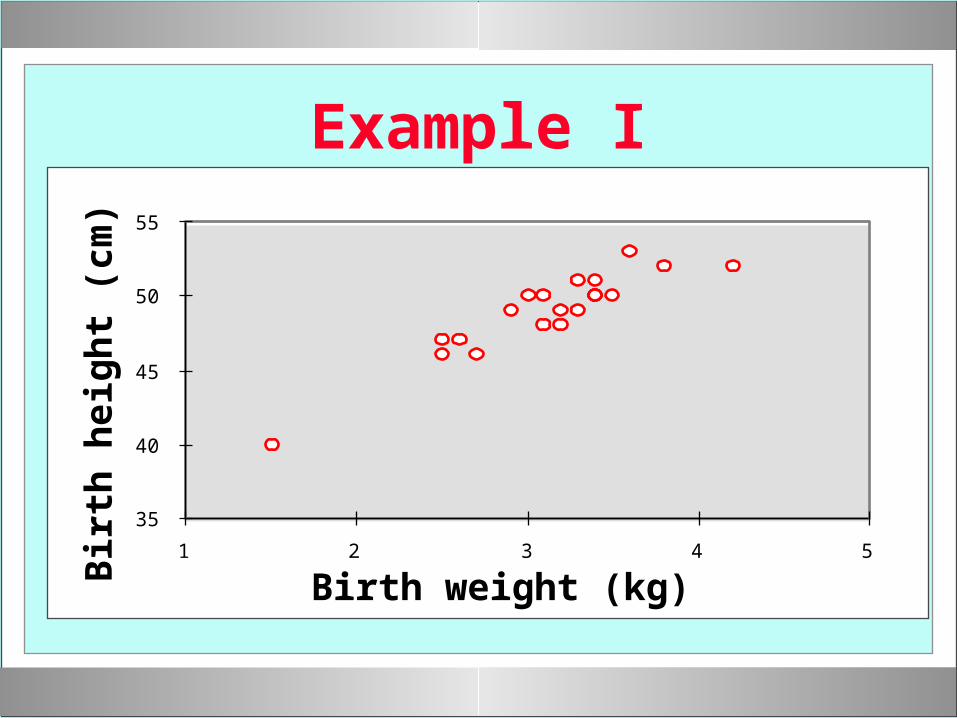
Example I
35
40
45
50
55
1 2 3 4 5
Birth weight (kg)
Bir
th h
eig
ht
(cm
)
4
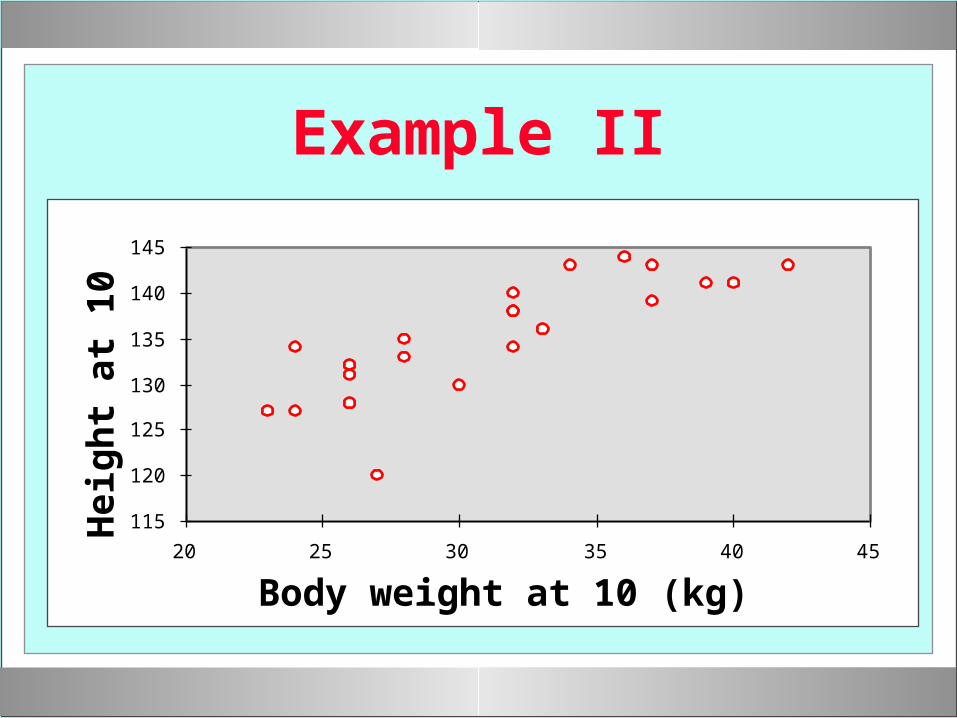
Example II
115
120
125
130
135
140
145
20 25 30 35 40 45
Body weight at 10 (kg)
Hei
gh
t at
10
5
The problem of prediction
If Mom is 50 kg at 30, what will be the weight of his 10 years old son?
6
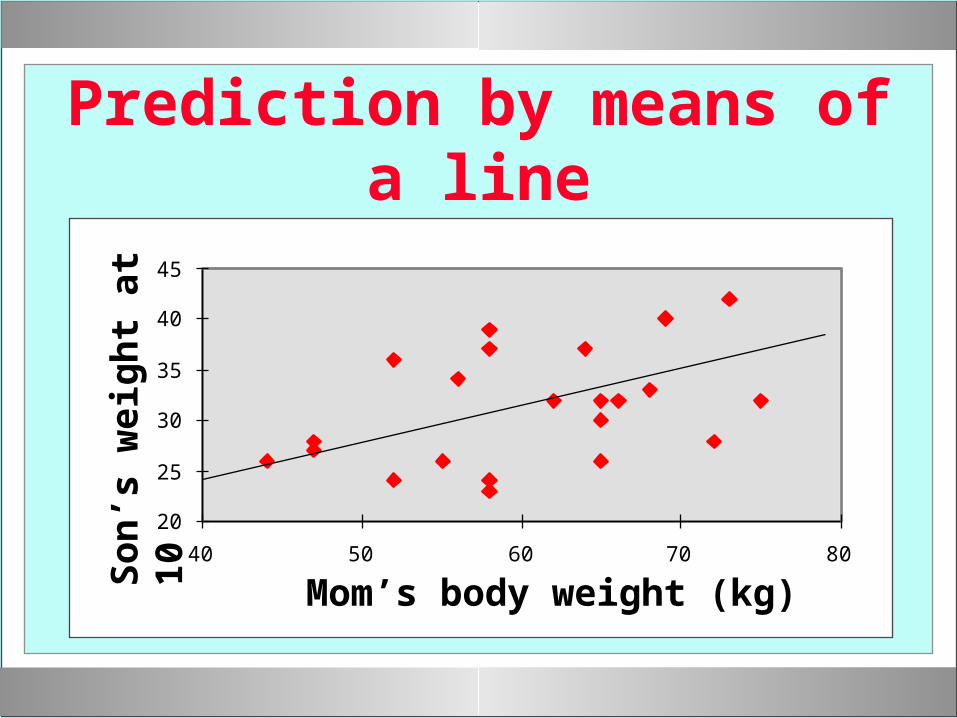
Prediction by means of a line
20
25
30
35
40
45
40 50 60 70 80
Mom’s body weight (kg)So
n’s
wei
gh
t at
10
7
20
25
30
35
40
45
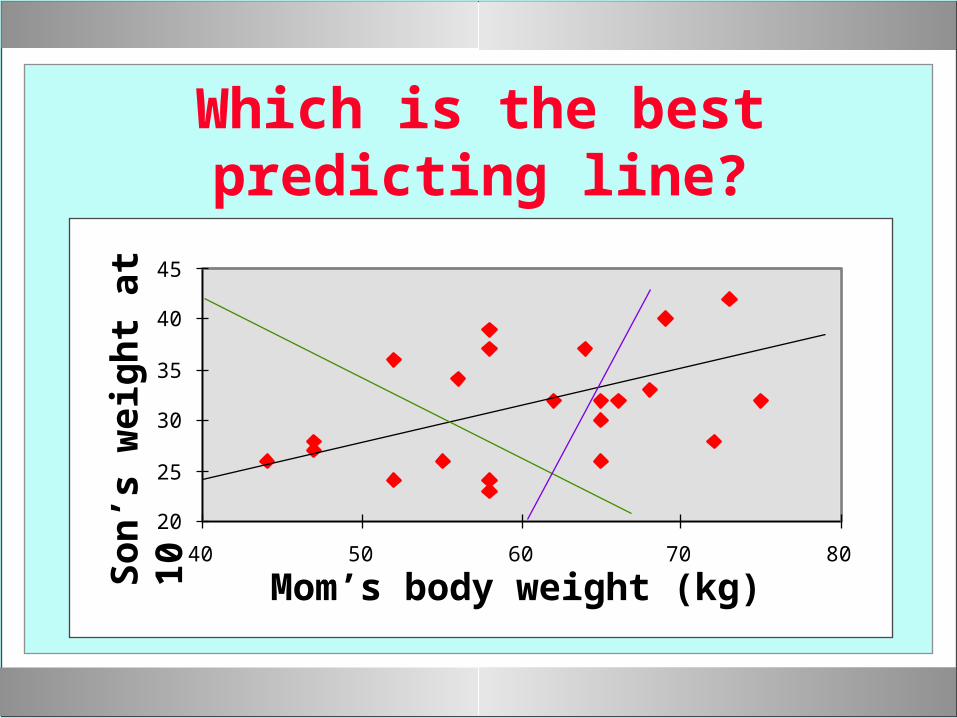
40 50 60 70 80
Which is the best predicting line?
Mom’s body weight (kg)So
n’s
wei
gh
t at
10
8
The best line is the one that lies closest to the points of the
diagram
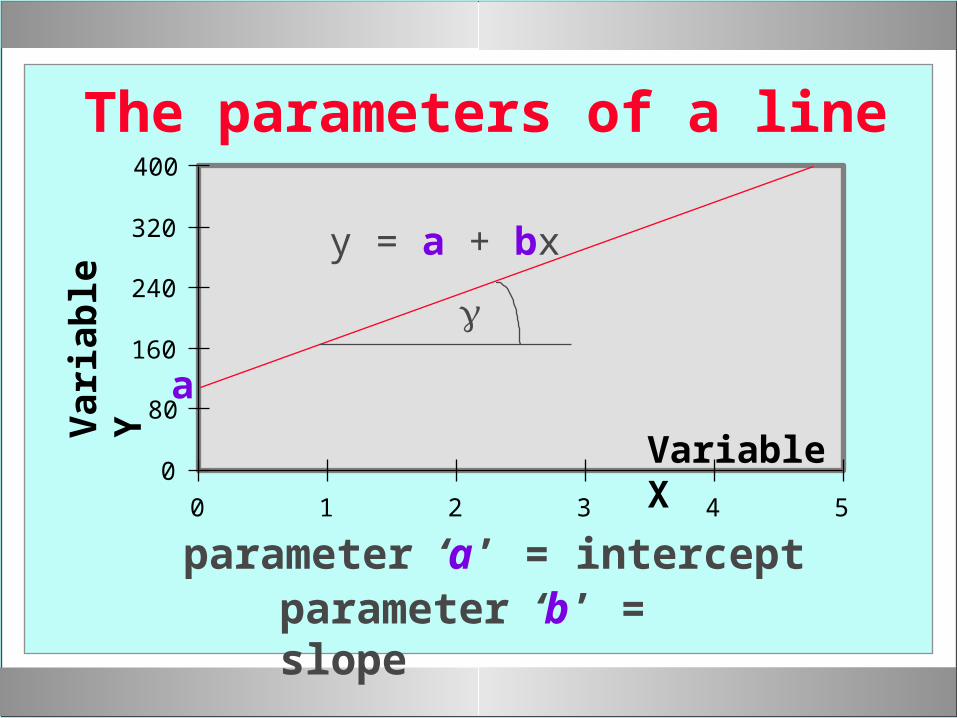
The general formula of a line:
f(x) = a + bx
9
0
80
160
240
320
400
0 1 2 3 4 5
Variable X
Var
iab
le Y
a
y = a + bx
parameter ‘a’ = interceptparameter ‘b’ = slope
The parameters of a line
10
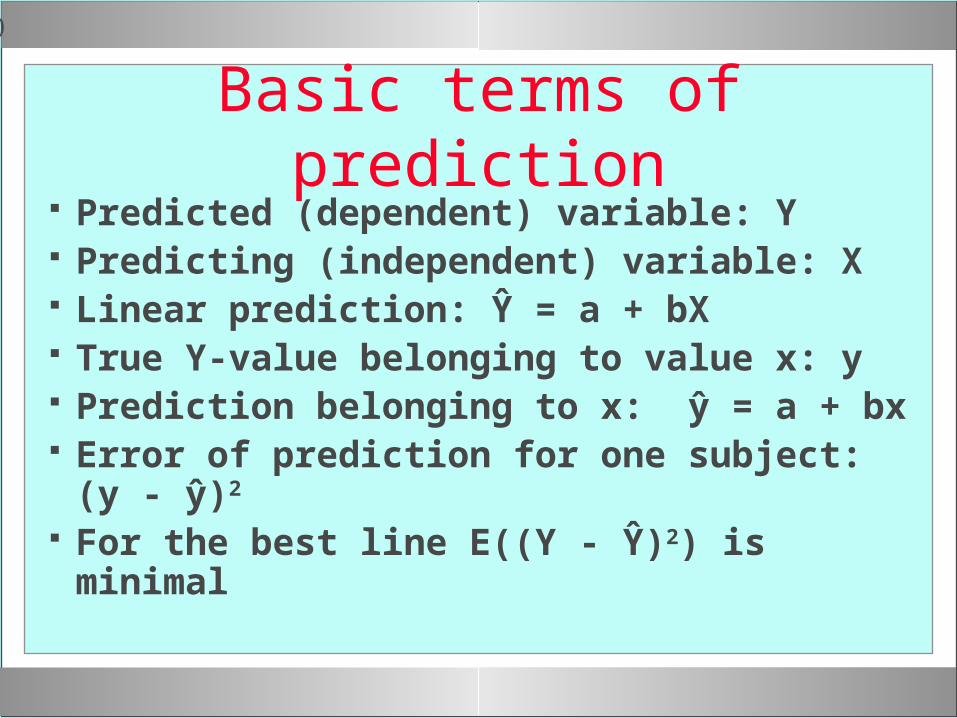
Basic terms of prediction Predicted (dependent) variable: Y Predicting (independent) variable: X Linear prediction: Ŷ = a + bX True Y-value belonging to value x: y Prediction belonging to x: ŷ = a + bx Error of prediction for one subject: (y - ŷ)2
For the best line E((Y - Ŷ)2) is minimal
11
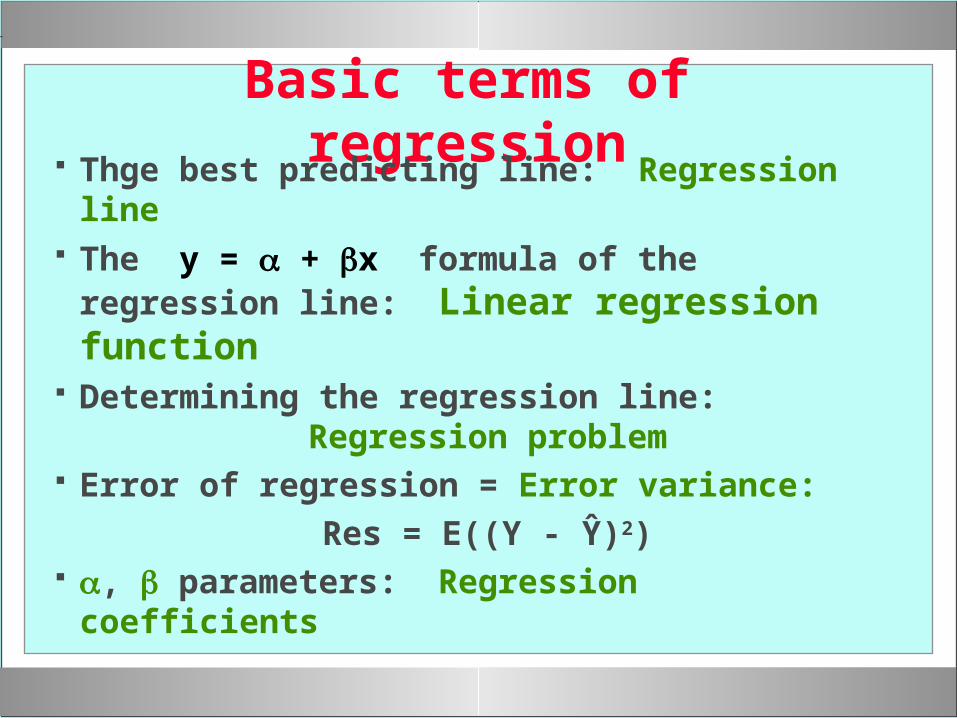
Basic terms of regression Thge best predicting line: Regression line The y = + x formula of the regression
line: Linear regression function Determining the regression line:
Regression problem Error of regression = Error variance:
Res = E((Y - Ŷ)2) , parameters: Regression coefficients
12
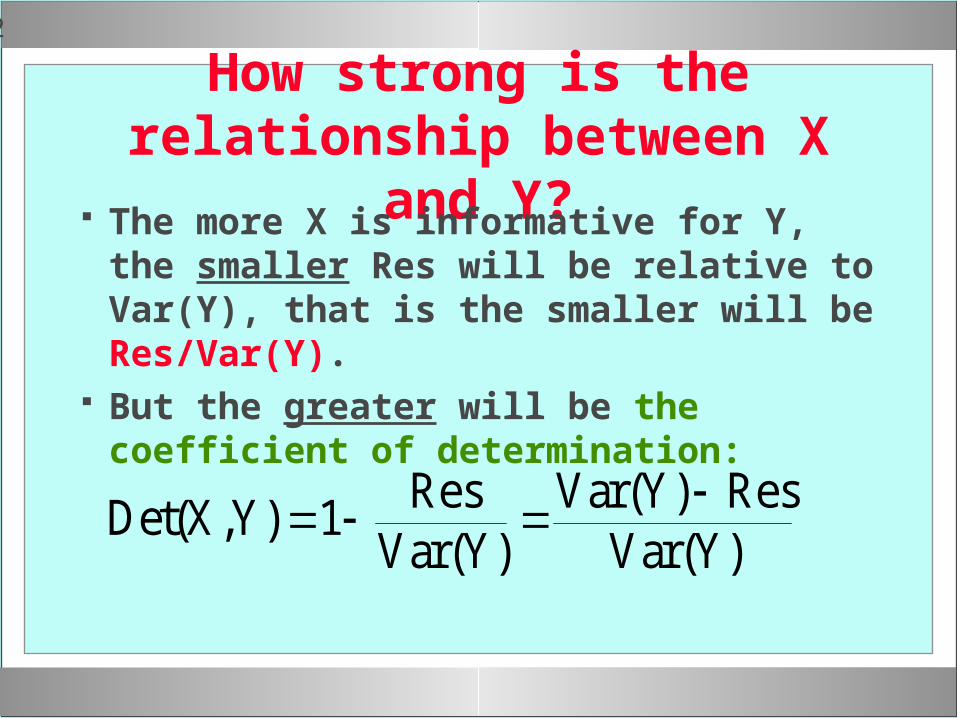
How strong is the relationship between X and Y?
The more X is informative for Y, the smaller Res will be relative to Var(Y), that is the smaller will be Res/Var(Y).
But the greater will be the coefficient of determination:
Det X Ys
Var YVar Y s
Var Y( , )
Re( )
( ) Re( )
1
13
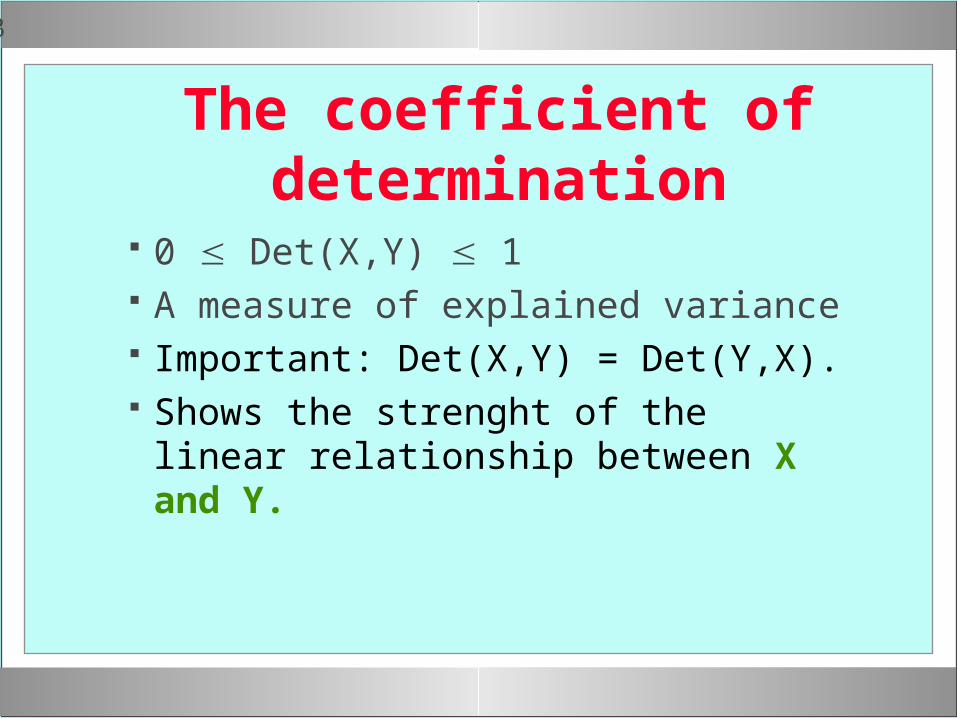
The coefficient of determination
0 Det(X,Y) 1 A measure of explained variance Important: Det(X,Y) = Det(Y,X). Shows the strenght of the linear
relationship between X and Y.
14
The independence of two random variables
QUESTION:Does the height of a person
depend on gender?
15
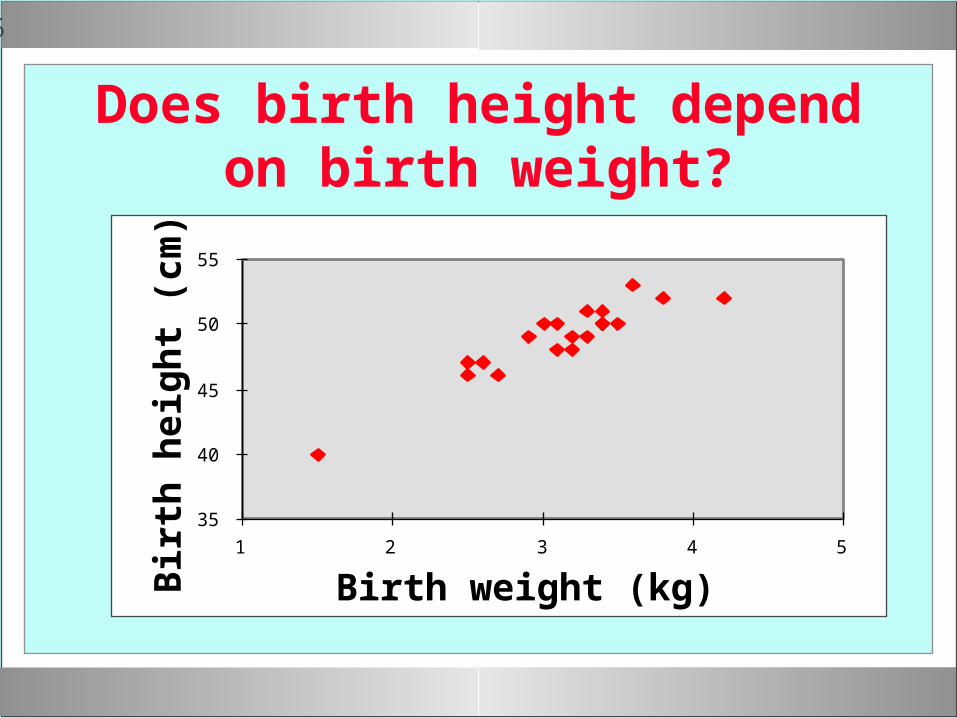
Does birth height depend on birth weight?
35
40
45
50
55
1 2 3 4 5
Birth weight (kg)
Bir
th h
eig
ht
(cm
)
16
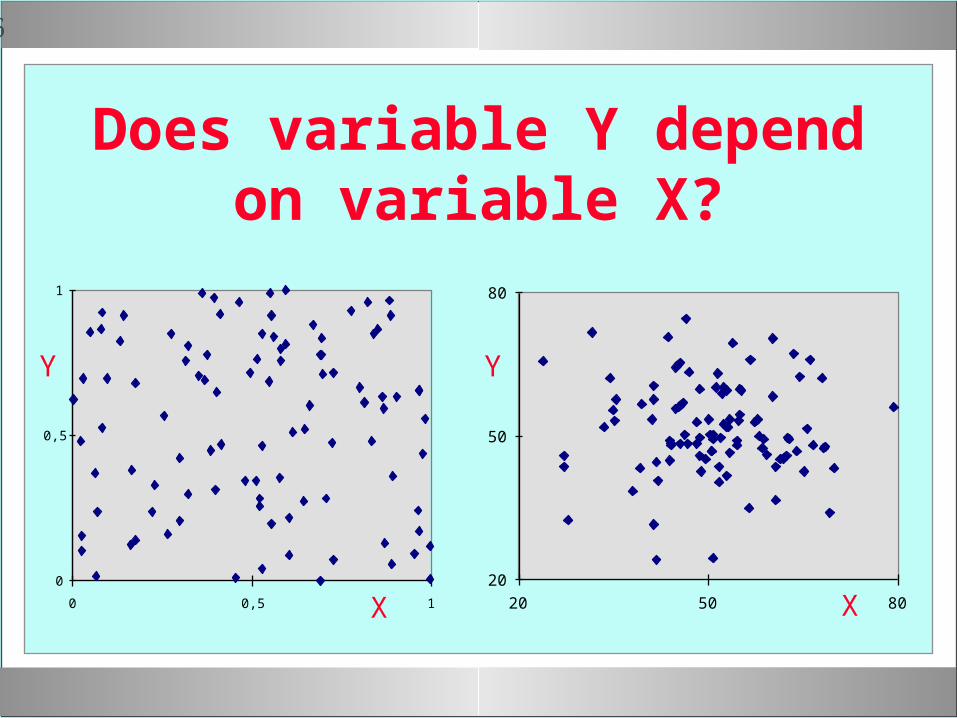
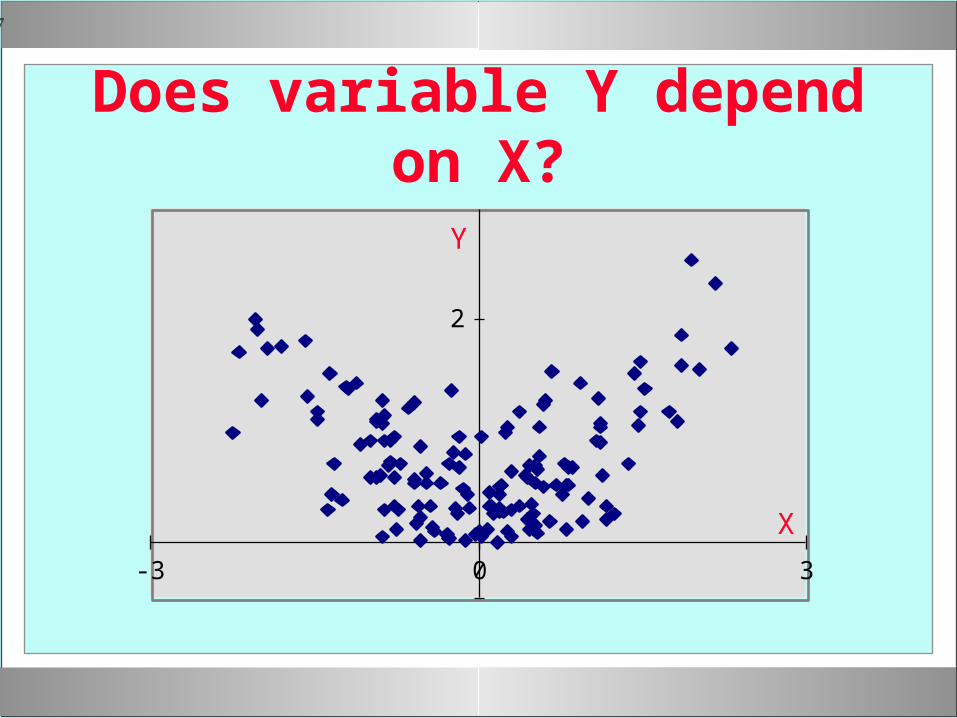
Does variable Y depend on variable X?
20
50
80
20 50 80
0
0,5
1
0 0,5 1
Y Y
X X
17
Does variable Y depend on X?
2
-3 0 3
X
Y

18
The independence is mutual
IMPORTANT:
If Y is independent from X,
then X is independent from Y as well.
19
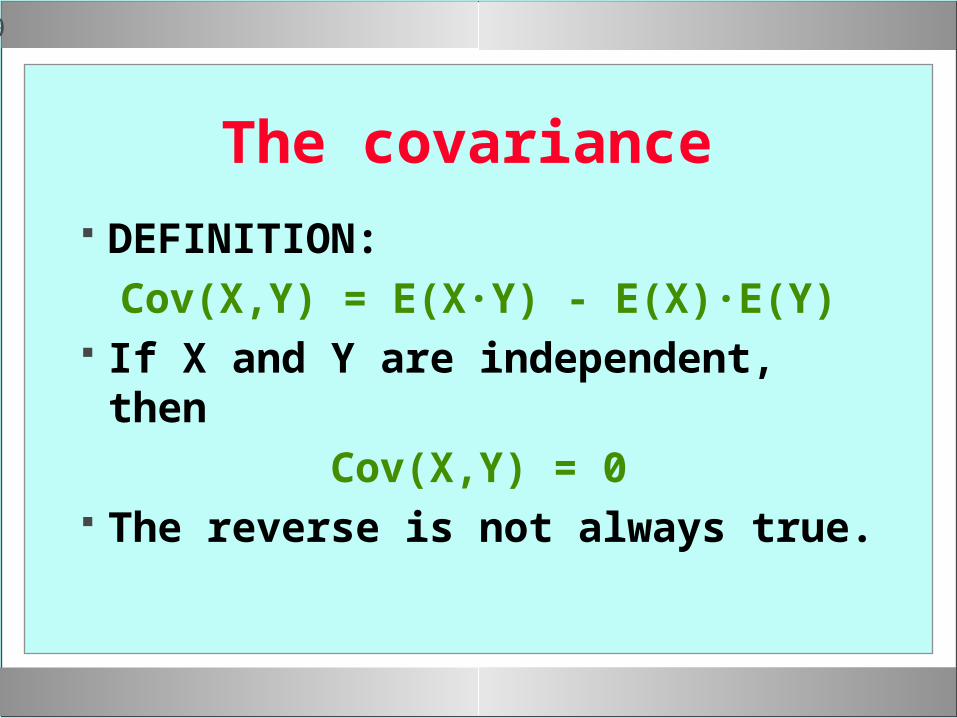
The covariance
DEFINITION:
Cov(X,Y) = E(X·Y) - E(X)·E(Y) If X and Y are independent, then
Cov(X,Y) = 0 The reverse is not always true.
20
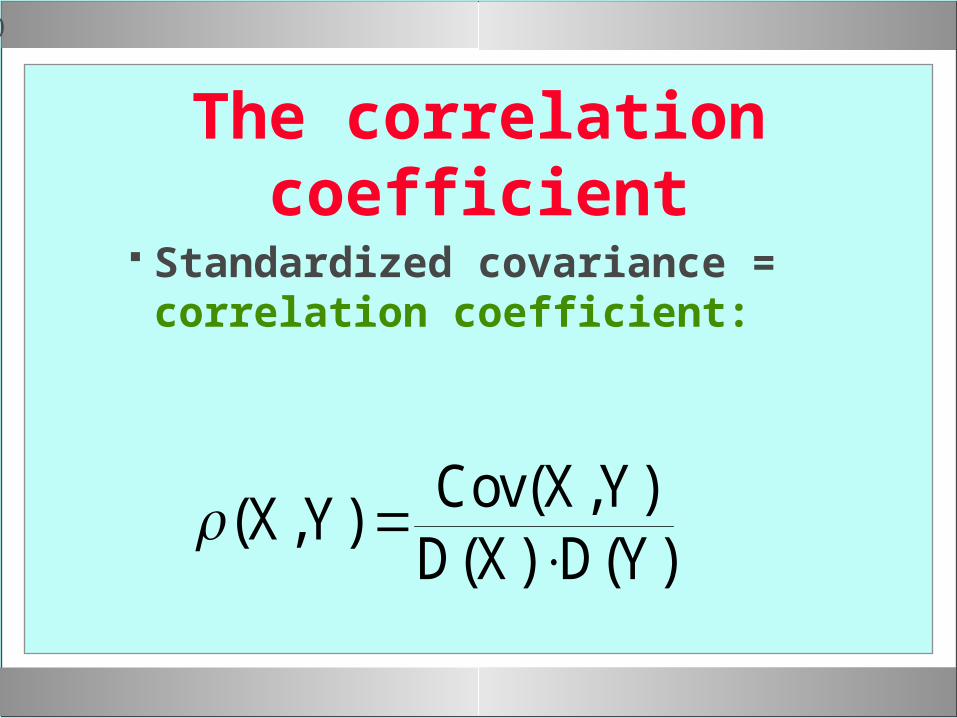
The correlation coefficient
Standardized covariance = correlation coefficient:
( , )( , )
( ) ( )X Y
Cov X YD X D Y
21
Relationship between correlation coefficient and coefficient of
determination
((X,Y))2 = Det(X,Y)
22
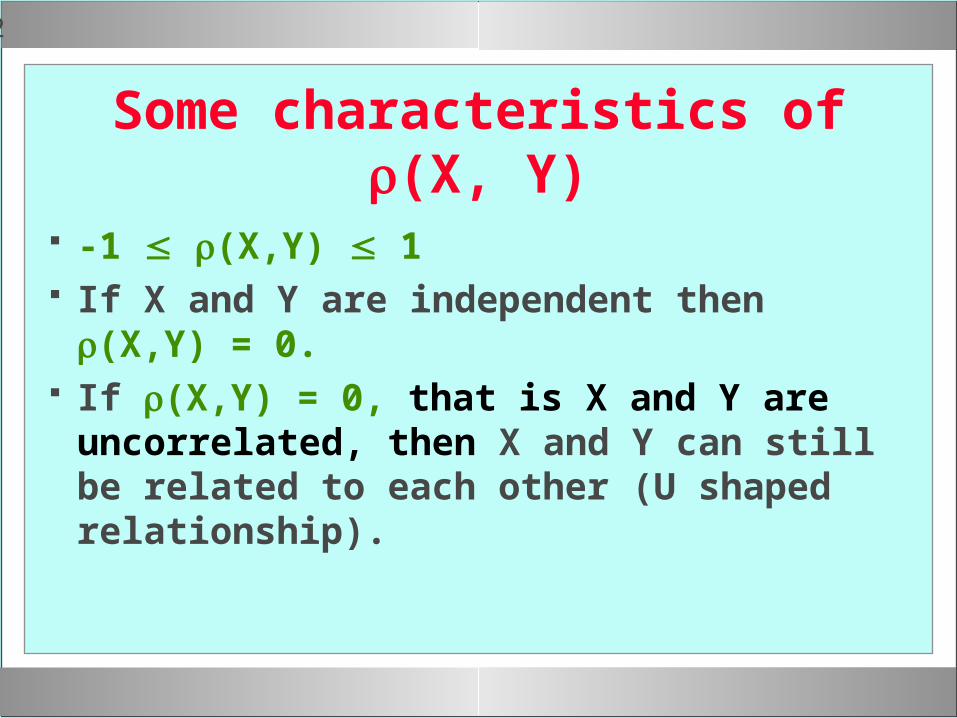
Some characteristics of (X, Y)
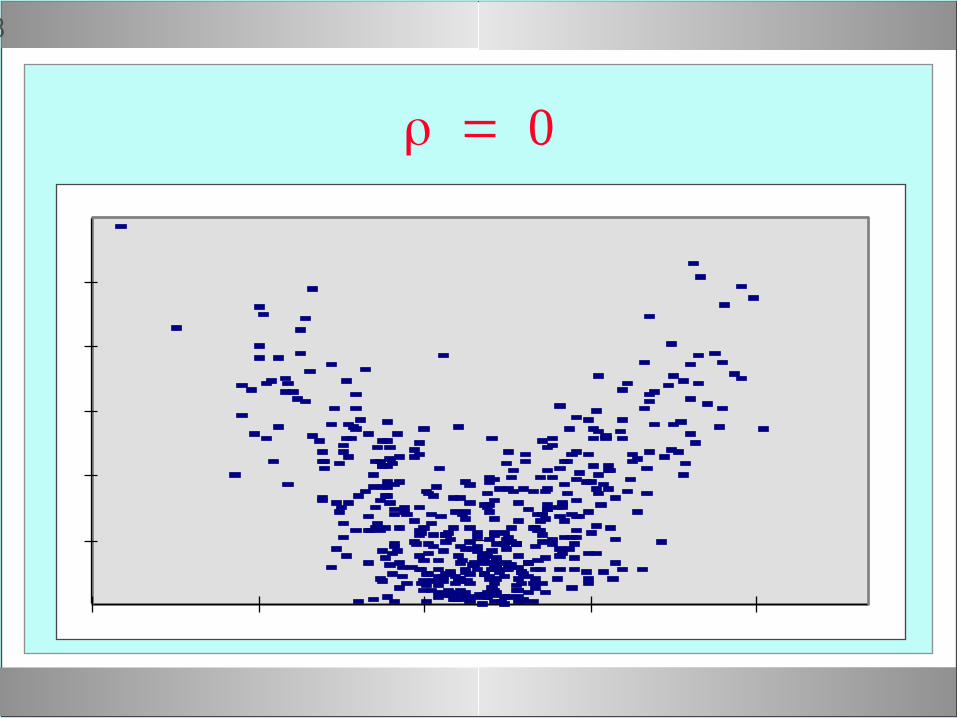
-1 (X,Y) 1 If X and Y are independent then (X,Y) = 0. If (X,Y) = 0, that is X and Y are
uncorrelated, then X and Y can still be related to each other (U shaped relationship).
23
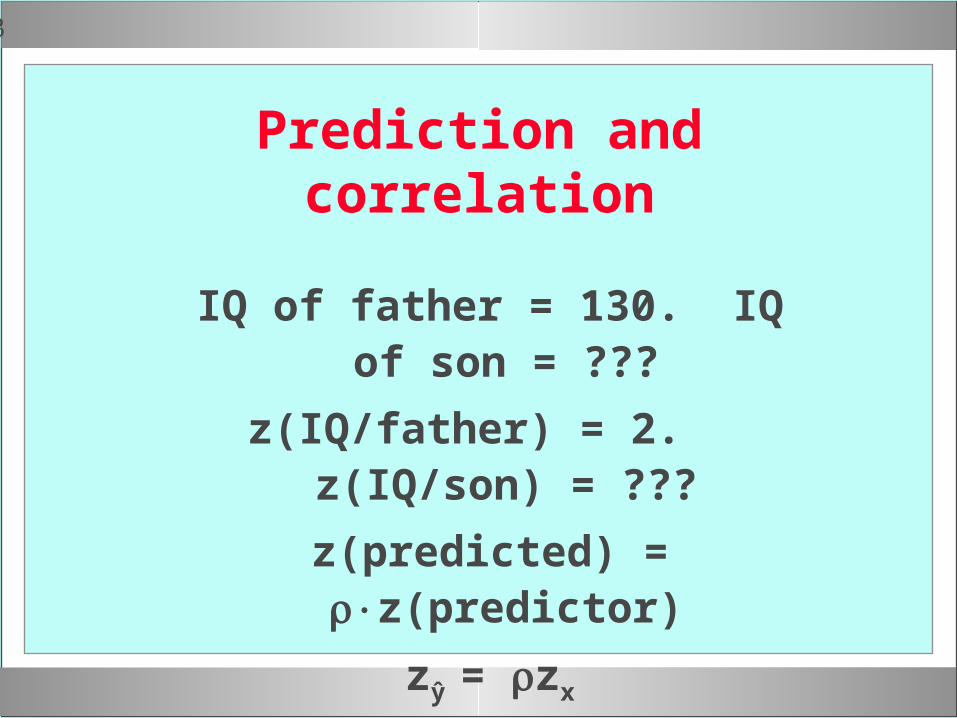
Prediction and correlation
IQ of father = 130. IQ of son = ???
z(IQ/father) = 2. z(IQ/son) = ???
z(predicted) = z(predictor)
zŷ = zx
24
05
25
05
26
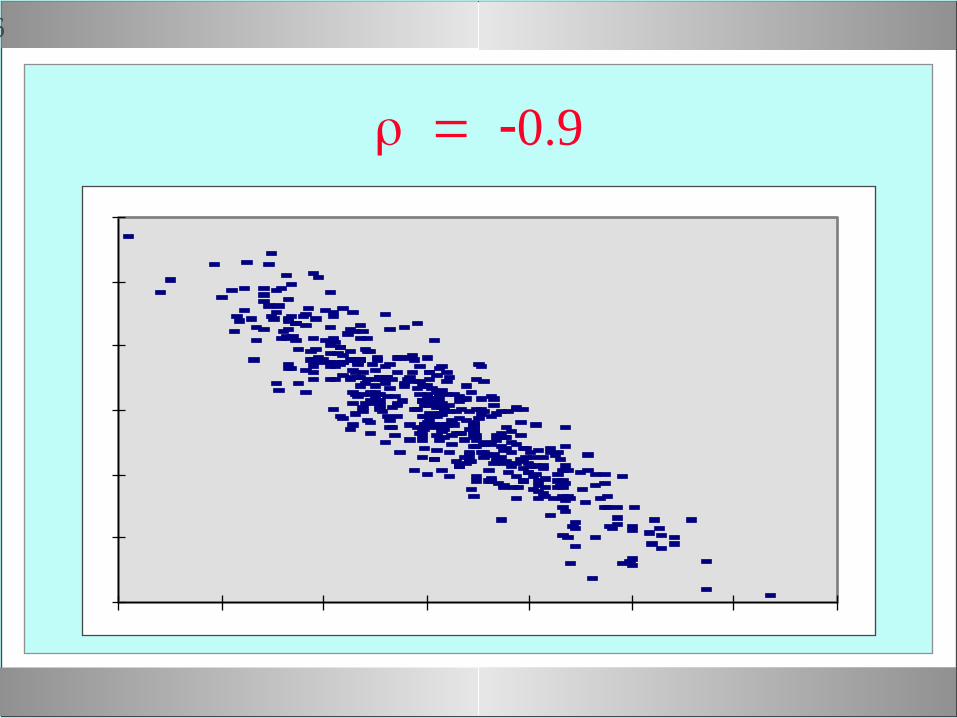
09
27
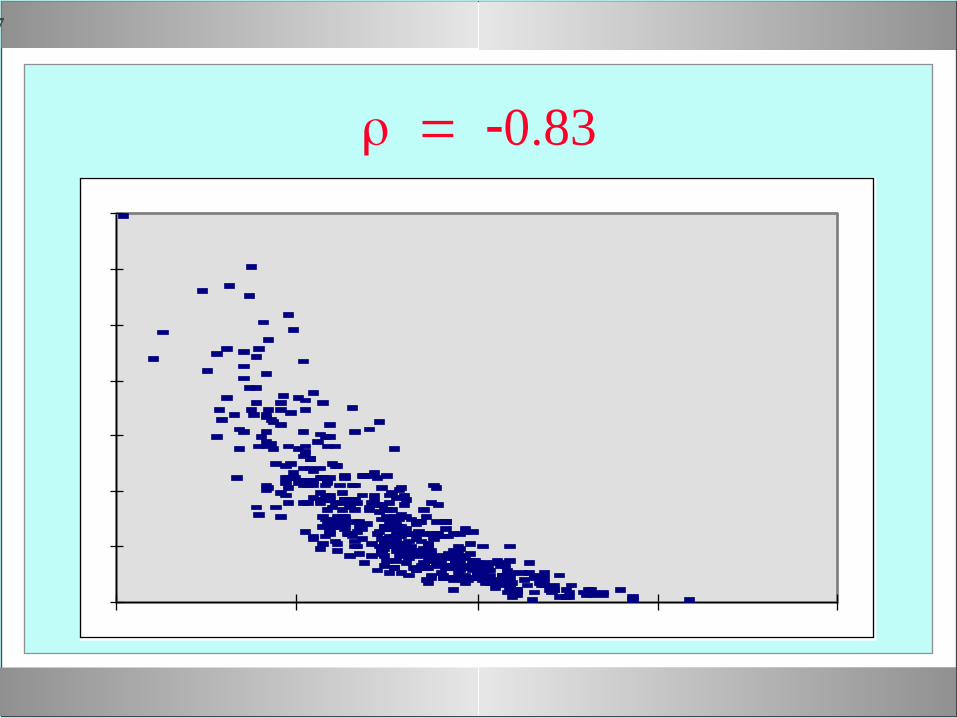
083
28
0

29
Sample correlation coefficient
Notation: rXY or r Formula:
XYXY
X Yr
ss s
30
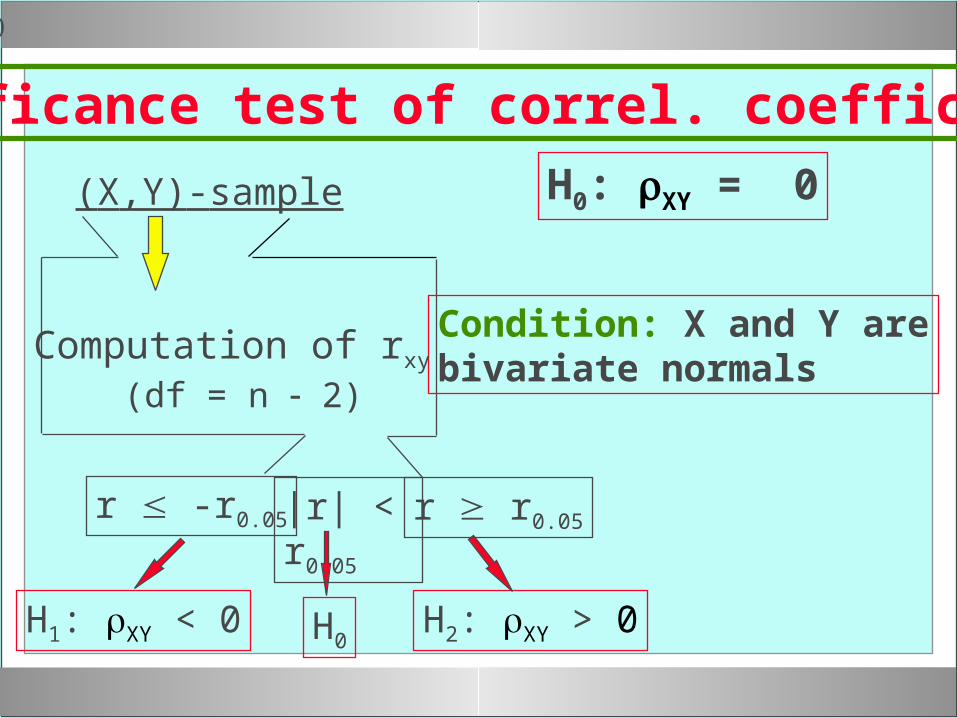
(X,Y)-sample
H1: XY < 0 H0H2: XY > 0
Condition: X and Y arebivariate normals
r -r0.05 r r0.05|r| < r0.05
Significance test of correl. coefficient
H0: XY = 0
Computation of rxy (df = n 2)