© this is a licensed product of ken research and should ... · 5 © this is a licensed product of...
TRANSCRIPT

1
© This is a licensed product of Ken Research and should not be copied

2
© This is a licensed product of Ken Research and should not be copied
TABLE OF CONTENTS
1. India Wellness Industry Introduction
2. India Wellness Industry Market Size by Revenue, 2006-2011
3. India Wellness Industry Segmentation, 2006-2011
3.1. By Wellness Products and Services
3.2. By Type of Products And Services
4. India Wellness Industry Trends and Developments
Growth of Medical Spa Centers in India
Emerging Hybrid Wellness Models in India
Increasing Number of Spas in India
Private Equity and Venture Capital Investments in wellness Industry in India from 2007-2012
5. India Wellness Industry Future Outlook and Projections, 2012-2016
5.1. Cause and Effect Relationship Between Industy Factors and India Wellness Industry
6. India Fitness and Slimming Market
6.1. India Fitness and Slimming Market Size by Revenue, 2006-2011
6.2. India Fitness and Slimming Market Segmentation, 2006-2011
6.2.1. By Fitness and Slimming Services, 2006-2011
6.2.2. By Fitness and Slimming Products, 2006-2011
6.3. Competitive Landscape of Major Fitness and Slimming Centers in India, 2011
6.4. India Fitness and Slimming Market Future Outlook and Projections, 2012-2016
7. India Spa, Salon and Alternate Therapy (AYUSH) Market
7.1. India Spa, Salon and Alternate Therapy (AYUSH) Industry Market Size, 2006-2011
7.2. India Spa Market Size by Revenue, 2006-2011
7.2.1. India Spa Industry Market Segmentation, 2011
7.2.2. Competitive Landscape of Spa Chains in India, 2011

3
© This is a licensed product of Ken Research and should not be copied
Emerging Domestic Spa Chains
Foreign Spa Chains in India
7.3. India Salon Market Size by Revenue, 2006-2011
7.3.1. Competitive Landscape of Major Salon Operators in India, 2011
7.4. India Alternate Therapy (AYUSH) Market Size By Revenue, 2006-2011
7.4.1. India Alternate Therapy (AYUSH) Market Segmentation, 2011
7.4.2. India Ayurveda Market
7.4.2.1. India Ayurveda Market Size, 2006-2011
7.4.2.2. Competitive Landscape of Major Players in the Ayurvedic Products Market in India, 2011
7.4.2.3. India Ayurveda Market Future Outlook and Projections, 2012-2016
7.4.3. India Homeopathy Market
7.4.3.1. India Homeopathy Market Size and Introduction, 2006-2011
7.4.3.2. India Homeopathy Market Future Outlook and Projections, 2006-2011
7.4.4. Yoga Therapy Market in India
Emerging Yoga Chain in India – Yoga Studio
7.4.5. Siddha Therapy Market in India
7.4.6. Unani Therapy Market in India
7.4.7. Exports of AYUSH Medicants, FY’2006-FY’2012
7.4.8. Importsof AYUSH Medicants, FY’2006-FY’2012
7.4.9. Government Expenditure on AYUSH System in India, FY’2008-FY’2011
7.5. India Spa, Salon and Alternative Therapy (AYUSH) Industry Future Outlook and Projections, 2012-2016
8. India Cosmetic Products Market
8.1. India Cosmetic Products Market Size by Revenue, 2006-2011
8.2. India Cosmetic Products Segmentation, 2007-2011
8.3. India Skin Care Market

4
© This is a licensed product of Ken Research and should not be copied
8.3.1. India Skin Care Market Size and Segmentation
8.3.2. Market Share of Major Players in the Skin Care in India, 2011
8.3.3. Emerging Skin Care Product Category in India
8.3.3.1. India Anti-aging Skin Care Market
Overview
Competitive Landscape of Major Companies in the Anti-Aging Skin Care Market in India, 2011
SWOT Analysis of the Anti-aging Skin Care Market in India
8.3.4. India Skin Care Market Projections, 2012-2016
8.4. India Hair Care Market
8.4.1. India Hair Care Market Size and Introduction
8.4.2. Key Trends in the Indian Hair Care Market
8.4.3. Market Share of Major Players in the Hair Care Market in India, 2011
By Hair Oil
By Shampoo
8.4.4. India Hair Care Market Projections, 2012-2016
8.5. India Men’s Grooming Market
8.5.1. India Men’s Grooming Market Size and Introduction, 2007-2011
8.5.2. Competitive Landscape of Major Players in the Men’s Grooming Market in India, 2011
By Men’s Hair Care
By Men’s Skin care
8.5.3. India Men’s Grooming Market Future Outlook and Projections, 2012-2016
8.6. Competitive Landscape of Major Players in the Cosmetic Products Market in India, 2011
8.7. India Cosmetic Products Future Outlook and Projections, 2012-2016
9. India Nutraceuticals Market
9.1. India Nutraceuticals Market Size by Revenue, 2006-2011

5
© This is a licensed product of Ken Research and should not be copied
9.2. India Nutraceuticals Market Segmentation, 2011
9.3. Scope for New Entrants
9.3.1. Affordability of Nutraceutical Products
9.3.2. Marketing of Dietary Supplements through Various Sources
9.3.3. Opportunity in Online Marketing
9.4. Trends and Developments in India Nutraceuticals Market
Introduction of Online Shopping Portal for Nutritional Supplement
Regulatory Environment in Dietary Supplements Industry
Vitamin C Pricing Affecting Quality and Availability
Growing Vitamin B Demand
9.5. Competitive Landscape of Major Players in the Nutraceuticals Market in India, 2011
9.6. India Nutraceuticals Industry Future Outlook and Projections, 2012-2016
10. Macro-Economic and Industry Factors: Historical and Projection
10.1. India Medical Tourism, 2006-2016
10.2. Leisure Foreign Tourists in India
10.3. India Personal Disposable Income, 2006-2016
10.4. India Health Expenditure, 2006-2016
10.5. Diabetes Patients in India, 2006-2016
10.6. Urban Middle Class Population in India, 2006-2016
11. Appendix
11.1. Market Definitions
11.2. Abbreviations
11.3. Research Methodology
Data Collection Methods
Approach
Variables (Dependent and Independent)
Multi Factor Based Sensitivity Model

6
© This is a licensed product of Ken Research and should not be copied
Final Conclusion
11.4. Disclaimer

7
© This is a licensed product of Ken Research and should not be copied
LIST OF FIGURES
Figure 1: India Wellness Market Size on the Basis of Revenue in USD Million, 2006-2011
Figure 2: Indian Wellness Market Segmentation by Wellness Products and Wellness Services on the Basis of Revenue in Percentage, 2011
Figure 3: Indian Wellness Market Segmentation by Wellness Categories on the Basis of Revenue in Percentage, 2006-2011
Figure 4: Total Number of Spa Centers in India in Units, 2006-2011P
Figure 5: India Wellness Industry Projections on the Basis of Revenue in USD Million, 20012-2016
Figure 6: India Fitness and Slimming Market Size on the Basis of Revenue in USD Million, 2006-2011
Figure 7: India Fitness and Slimming Services Market Size on the Basis of Revenue in USD Million, 2006-2011
Figure 8: India Fitness and Slimming Products Market Size on the Basis of Revenue in USD Million, 2006-2011
Figure 9: India Fitness and Slimming Market Projections on the Basis of Revenue in USD Million, 2012-2016
Figure 10: India Spa, Salon and Alternate Therapy (AYUSH) Market Size on the Basis of Revenue in USD Million, 2006-2011
Figure 11: India Spa Market Size on the Basis of Revenue in USD Million, 2006-2011
Figure 12: India Spa Market Segmentation on the Basis of Revenue in Percentage, 2011
Figure 13: India Spa Market Competition by Domestic and International Spa brands on the Basis of Revenue in Percentage, 2011
Figure 14: India Salon Market Size on the Basis of Revenue in USD Million, 2006-2011
Figure 15: India Alternate Therapy (AYUSH) Market Size on the Basis of Revenue in USD Million, 2006-2011
Figure 16: India Alternate Therapy (AYUSH) Market Segmentation by Ayurveda, Yoga, Unani, Siddha and Homeopathy on the Basis of Revenue in Percentage, 2011
Figure 17: India Ayurveda Market Size on the Basis of Revenue in USD Million, 2006-2011

8
© This is a licensed product of Ken Research and should not be copied
Figure 18: India Ayurveda Market Future Projections on the Basis of Revenue in USD Million, 2012-2016
Figure 19: India Homeopathy Market Size on the Basis of Revenue in USD Million, 2006-2011
Figure 20: India Homeopathy Market Future Projections on the Basis of Revenue in USD Million, 2012-2016
Figure 21: India Spa, Salon and Alternative Therapy (AYUSH) Market Projections on the Basis of Revenue in USD Million, 2012-2016
Figure 22: India Cosmetics Products Market Size on the Basis of Revenue in USD Million, 2006-2011
Figure 23: India Cosmetics Products Segmentation on the Basis of Revenue in Percentage, 2007-2011
Figure 24: India Skin Care Market Size on the Basis of Revenue in USD Million, 2006-2011
Figure 25: India Skin Care Market Segmentation on the Basis of Revenue in Percentage, 2011
Figure 26: Market Share of Major Players in the Skin Care Market in India, 2011
Figure 27: India Hair Care Market Size on the Basis of Revenue in USD Million, 2006-2011
Figure 28: India Hair Care Market Segmentation by Hair Oil, Shampoo and Hair Oil on the Basis of Revenue in Percentage, 2011
Figure 29: Market Share of Major Players in the Hair Oil Segment of the Hair Care Market in India on the Basis of Revenue in Percentage, 2011
Figure 30: Market Share of Major Players in the Shampoo Segment of the Hair Care Market in India on the Basis of Revenue in Percentage, 2011
Figure 31: India Hair Care Market Future Projections on the Basis of Revenue in USD Million, 2012-2016
Figure 32: India Men’s Grooming Market Size on the Basis of Revenue in USD Million, 2007-2011
Figure 33: India Men’s Grooming Segmentation on the Basis of Revenue in USD Million and Contribution in Percentage, 2011
Figure 34: India Men’s Grooming Market Future Projections on the Basis of Revenue in USD Million, 2012-2016

9
© This is a licensed product of Ken Research and should not be copied
Figure 35: India Cosmetics Products Market Projections on the Basis of Revenue in USD Million, 2012-2016
Figure 36: Nutraceuticals Market Structure
Figure 37: Value Chain Analysis
Figure 38: India Nutraceuticals Market Size on the Basis of Revenue in USD Million, 2006-2011
Figure 39: India Nutraceuticals Market Segmentation by Dietary Supplements, Functional Food and Functional Beverage, 2011
Figure 40: India Nutraceuticals Market Projections on the Basis of Revenue in USD Million, 2012-2016
Figure 41: India Medical Tourism Market Size by Revenue in USD Million and Medical Tourists in Thousands, 2006-2016
Figure 42: Leisure Foreign Tourists in India in Millions, 2006-2011
Figure 43: India Personal Disposable Income in USD Million, 2006-2016
Figure 44: India Health Expenditure in USD Million, 2006-2016
Figure 45: Diabetes Patients in India in Millions, 2006-2016
Figure 46: Total Middle Class population in Millions and the Composition of Upper Middle Class Population in India in Million, 2006-2016

10
© This is a licensed product of Ken Research and should not be copied
LIST OF TABLES
Table 1: Emerging Competition in the Med Spa Market in India, 2011
Table 2: Private Equity and Venture Capital Investments in Wellness Industry in India, 2007-2012
Table 3: Cause and Effect Relationship Analysis between Industry Factors and Expected Industry Prospects of the India Wellness Industry
Table 4: Competitive Landscape of Major Fitness and Slimming Centers (VLCC, Gold Gym and Talwalkers) in India, 2011
Table 5: India Fitness and Slimming Market Projections by Fitness and Slimming Services and Fitness and Slimming Products on the Basis of Revenue in USD Million, 2012-2016
Table 6: Competitive Landscape of the Emerging Domestic Spa Chains in India, 2011
Table 7: Competitive Landscape of the International Spa Chains in India, 2011
Table 8: Competitive Landscape of Major Salon Operators in India, 2011
Table 9: State-wise Framework of Ayurveda in India, FY’2010
Table 10: Competitive Landscape of Major Manufacturers of Ayurvedic Products in India, 2011
Table 11: State-wise Framework of Homeopathy in India, FY’2010
Table 12: State-wise Framework of Siddha in India, FY’2010
Table 13: State-wise Framework of Unani in India, FY’2010
Table 14: Exports of AYUSH Medicants in USD Million, FY’2006-FY’2012
Table 15: Imports of AYUSH Medicants in USD Million, FY’2006-FY’2012
Table 16: Total Government Expenditure on AYUSH System in India in USD Million, FY’2008-FY’2011
Table 17: India Spa, Salon and Alternate Therapy (AYUSH) Market Projections by Health Spa and Salon Services on the Basis of Revenue in USD Million, 2012-2016
Table 18: India Cosmetics Products Segmentation on the Basis of Revenue in USD Million, 2007-2011
Table 19: Competitive Landscape of Major Companies in the Anti-Aging Skin Care Market in India, 2011

11
© This is a licensed product of Ken Research and should not be copied
Table 20: Competitive Landscape of the Major Brands in the Men’s Hair Care Market in India, 2011
Table 21: Competitive Landscape of the Major Brands in the Men’s Skin Care Market in India, 2011
Table 22: Competitive Landscape of Major Players in the Cosmetic Products Market in India, 2011
Table 23: India Cosmetics Products Market Projections on the Basis of Revenue in USD Million, 2012-2016
Table 24: Competitive Landscape of Major Players (Amway, Dabur and Herbalife) in the Nutraceuticals Market in India, 2011
Table 25: Correlation Matrix of the India Spa Industry
Table 26: Regression Coefficients Output of the India Spa Industry
12
© This is a licensed product of Ken Research and should not be copied
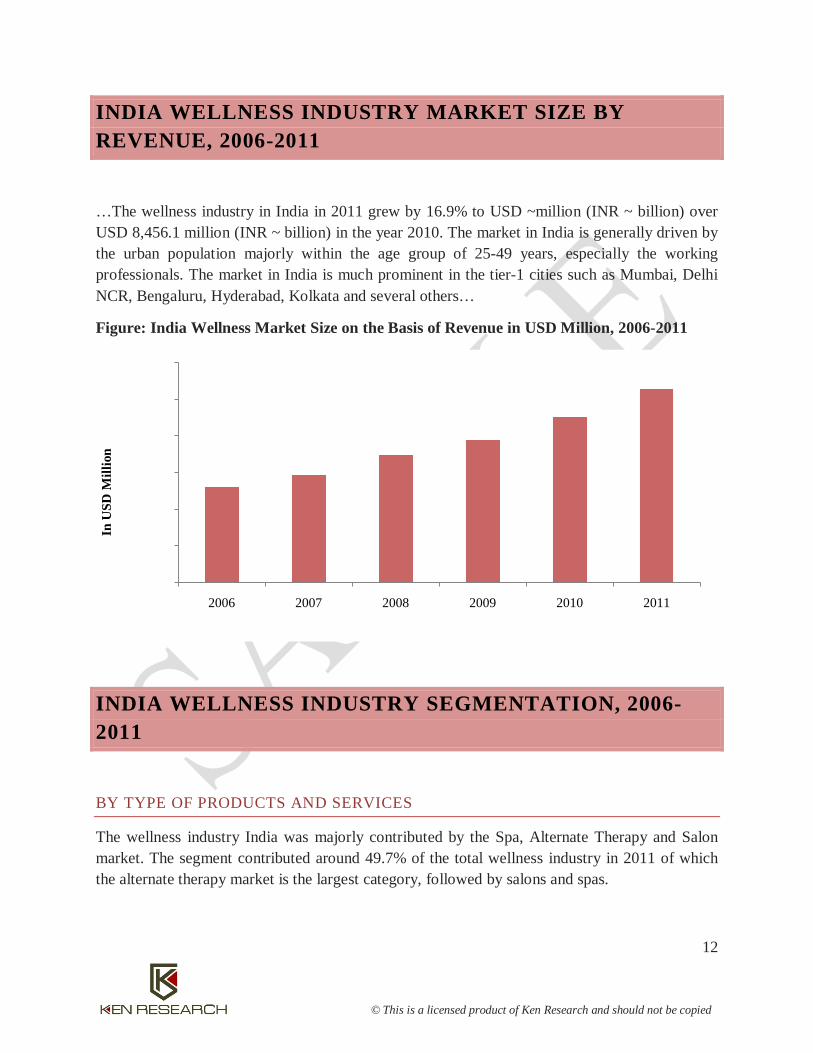
INDIA WELLNESS INDUSTRY MARKET SIZE BY REVENUE, 2006-2011
…The wellness industry in India in 2011 grew by 16.9% to USD ~million (INR ~ billion) over USD 8,456.1 million (INR ~ billion) in the year 2010. The market in India is generally driven by the urban population majorly within the age group of 25-49 years, especially the working professionals. The market in India is much prominent in the tier-1 cities such as Mumbai, Delhi NCR, Bengaluru, Hyderabad, Kolkata and several others…
Figure: India Wellness Market Size on the Basis of Revenue in USD Million, 2006-2011
INDIA WELLNESS INDUSTRY SEGMENTATION, 2006-2011
BY TYPE OF PRODUCTS AND SERVICES
The wellness industry India was majorly contributed by the Spa, Alternate Therapy and Salon market. The segment contributed around 49.7% of the total wellness industry in 2011 of which the alternate therapy market is the largest category, followed by salons and spas.
0.0
2,000.0
4,000.0
6,000.0
8,000.0
10,000.0
12,000.0
2006 2007 2008 2009 2010 2011
In U
SD M
illio
n

13
© This is a licensed product of Ken Research and should not be copied
Figure: Indian Wellness Market Segmentation by Wellness Categories on the Basis of Revenue in Percentage, 2006-2011
INDIA FITNESS AND SLIMMING MARKET
INDIA FITNESS AND SLIMMING MARKET SEGMENTATION, 2006-2011
BY FITNESS AND SLIMMING SERVICES, 2006-2011
…The fitness and slimming services market during the period 2006-2011 has grown at a CAGR of 19.7%. In 2011, the market grew by ~% to USD ~ million as compared to USD ~ million in 2010.
0.0%
10.0%
20.0%
30.0%
40.0%
50.0%
60.0%
70.0%
80.0%
90.0%
100.0%
2006 2007 2008 2009 2010 2011
Perc
enta
ge
Spa, Alternate Therapy and Salon Cosmetic services and Products Nutraceuticals Fitness and Slimming

14
© This is a licensed product of Ken Research and should not be copied
Figure: India Fitness and Slimming Services Market Size on the Basis of Revenue in USD Million, 2006-2011
BY FITNESS AND SLIMMING PRODUCTS, 2006-2011
The fitness and slimming products market contributed around 34.2% of the fitness and slimming market in India in the year 2011. The market during the year 2006-2011 has registered a CAGR of 14.0% driven majorly by the well off busy professionals who prefer to set up gym equipments in their house in order to stay fit and save the time involved in taking fitness sessions in the fitness or slimming centers…
Figure: India Fitness and Slimming Products Market Size on the Basis of Revenue in USD Million, 2006-2011
0.0
100.0
200.0
300.0
400.0
500.0
600.0
700.0
2006 2007 2008 2009 2010 2011
In U
SD M
illio
n
0.0
50.0
100.0
150.0
200.0
250.0
300.0
350.0
2006 2007 2008 2009 2010 2011
In U
SD M
illio
n
15
© This is a licensed product of Ken Research and should not be copied
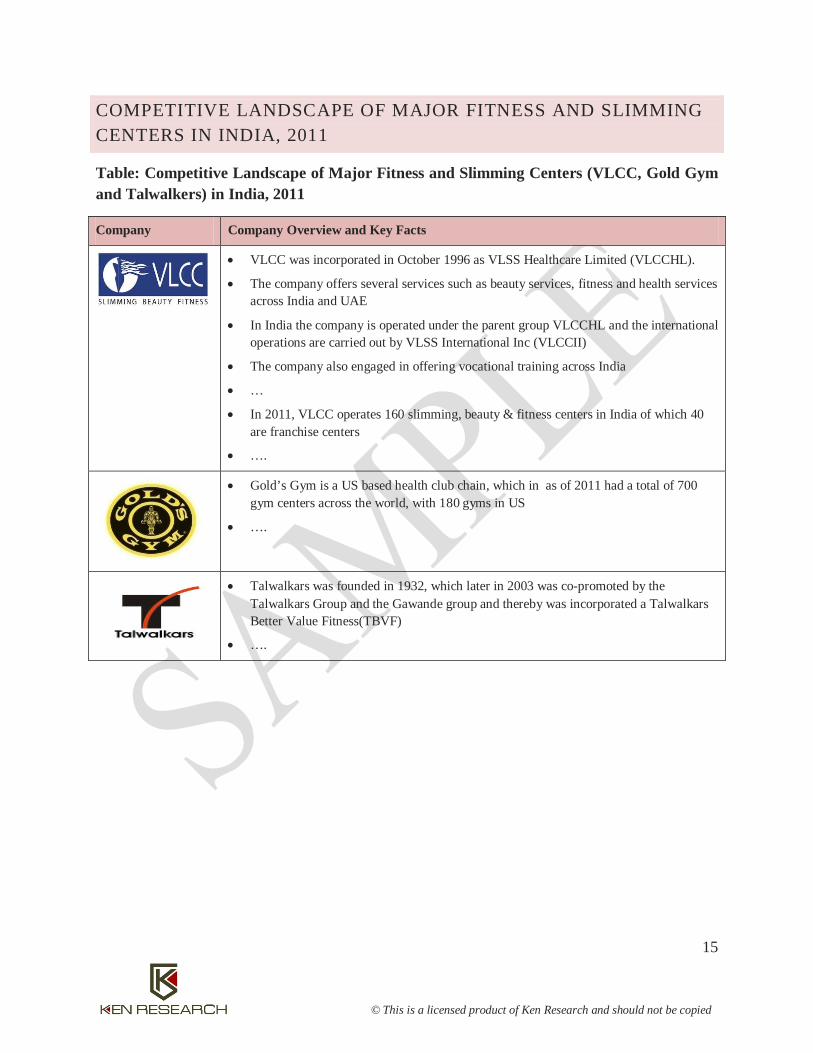
COMPETITIVE LANDSCAPE OF MAJOR FITNESS AND SLIMMING CENTERS IN INDIA, 2011
Table: Competitive Landscape of Major Fitness and Slimming Centers (VLCC, Gold Gym and Talwalkers) in India, 2011
Company Company Overview and Key Facts
• VLCC was incorporated in October 1996 as VLSS Healthcare Limited (VLCCHL).
• The company offers several services such as beauty services, fitness and health services across India and UAE
• In India the company is operated under the parent group VLCCHL and the international operations are carried out by VLSS International Inc (VLCCII)
• The company also engaged in offering vocational training across India
• …
• In 2011, VLCC operates 160 slimming, beauty & fitness centers in India of which 40 are franchise centers
• ….
• Gold’s Gym is a US based health club chain, which in as of 2011 had a total of 700 gym centers across the world, with 180 gyms in US
• ….
• Talwalkars was founded in 1932, which later in 2003 was co-promoted by the Talwalkars Group and the Gawande group and thereby was incorporated a Talwalkars Better Value Fitness(TBVF)
• ….

16
© This is a licensed product of Ken Research and should not be copied
INDIA SPA, SALON AND ALTERNATE THERAPY (AYUSH) MARKET
INDIA SPA INDUSTRY MARKET SEGMENTATION, 2011
The spa industry over the years has transitioned from hotel and destination spa for the elite class of the society to affordable spas for middle income population. The spa industry in India is largely contributed by the day spa segment considerably due to the affordability of such kind of spa treatment as compared to hotel or destination spa…
Figure: India Health Spa Market Segmentation on the Basis of Revenue in Percentage, 2011
COMPETITIVE LANDSCAPE OF SPA CHAINS IN INDIA, 2011
The spa industry in India has witnessed an immense inflow of new domestic spa centers especially day spa and destination spas, probably due to the fast emerging preference about wellness products and services amongst the population in the urban and semi-urban areas. Additionally, the rising disposable income and the growing stress level on account of long working hours have supplemented the development of domestic spa centers in the country in the recent past. The domestic spa chains in India contributed around ~% of the overall spa market revenue in 2011.
Day Spa
Hotel Spa
Destination Spa

17
© This is a licensed product of Ken Research and should not be copied
Figure: India Spa Market Competition by Domestic and International Spa brands on the Basis of Revenue in Percentage, 2011
EMERGING DOMESTIC SPA CHAINS
Table: Competitive Landscape of the Emerging Domestic Spa Chains in India, 2011
Company Company Description
Domestic Spa Brands
International Spa Brands

18
© This is a licensed product of Ken Research and should not be copied
FOREIGN SPA CHAINS IN INDIA
Table: Competitive Landscape of the International Spa Chains in India, 2011
Foreign Players Key Facts
INDIA ALTERNATE THERAPY MARKET SIZE BY REVENUE, 2006-2011
… The market over the years has grown at a CAGR of 12.4% during the period 2006-2011. The alternative therapy market in 2011 was valued at USD 2,210.0 million…The alternate therapy in India is now provided in the modern medical and healthcare centers including the spa centers along with some of the largest allopathic hospitals with an objective to reduce recuperation time. Yoga centers in the country have been growing remarkably along with spas that offer herbal or ayurvedic treatments

19
© This is a licensed product of Ken Research and should not be copied
Figure: India Alternate Therapy (AYUSH) Market Size on the Basis of Revenue in USD Million, 2006-2011
INDIA ALTERNATE THERAPY (AYUSH) MARKET SEGMENTATION, 2011
The alternate therapy market was majorly contributed by the ayurvedic medicine segment. The growing demand for ayurvedic medicines and related therapy contributed around ~% of the overall alternate therapy market in 2011. The market was followed by an emerging demand for homeopathy therapies majorly for skin care, hair care and respiratory problems in the same period. Unani, Yoga and Siddha accounted for approximately ~%, ~% and ~% of the alternate therapy market revenue in 2011
Figure: India Alternate Therapy (AYUSH) Market Segmentation by Ayurveda, Yoga, Unani, Siddha and Homeopathy on the Basis of Revenue in Percentage, 2011
0.0
500.0
1,000.0
1,500.0
2,000.0
2,500.0
3,000.0
3,500.0
2006 2007 2008 2009 2010 2011
In U
SD M
illio
n
Ayurveda
Homeopathy
Unani
Yoga
Siddha

20
© This is a licensed product of Ken Research and should not be copied
COMPETITIVE LANDSCAPE OF MAJOR SALON OPERATORS IN INDIA, 2011
Table: Competitive Landscape of Major Salon Operators in India, 2011
Company Company Description
INDIA COSMETIC PRODUCTS MARKET
INDIA COSMETIC PRODUCTS SEGMENTATION, 2007-2011
The cosmetic products market in India has been upheld by the skin care segment over the years. The contribution of the segment has increased from ~% in 2007 to ~% in 2011 due to the inflating demand for fairness products amongst women and the men category especially in the urban and semi-urban areas in India…

21
© This is a licensed product of Ken Research and should not be copied
Table: India Cosmetics Products Segmentation on the Basis of Revenue in USD Million, 2007-2011
Particulars 2007 2008 2009 2010 2011
Skin Care
Hair Care
Men’s Grooming
Deodorants & Perfumes
Color Cosmetics
Total
INDIA SKIN CARE MARKET
INDIA SKIN CARE MARKET SIZE AND SEGMENTATION
…The market for skin care has been dominated by the fairness cream products market. This category of the product contributed around ~% of the overall skin care market sales in 2011. The market in the recent years has been overwhelmed by the surge in the demand for fairness products from the male segment of the population in India. Brands such as Fair and lovely, Menz Active, Fair and Handsome, Garnier light have been successful to cater to the Indian male grooming segment with their specialized fairness cream for men….
Figure: India Skin Care Market Segmentation on the Basis of Revenue in Percentage, 2011
Fairness
Winter care (body lotion and cream)
Anti‐acne, therapeutic creams, toners
Face wash
Hair removing creams
Bleaches
Sunblocks
Facial masks (peel off, packs)
Scrubs

22
© This is a licensed product of Ken Research and should not be copied
The shampoo market in India has been dominated by HUL, with a contribution of around ~% in 2011.
MARKET SHARE OF MAJOR PLAYERS IN THE HAIR CARE MARKET IN INDIA, 2011
Emami in the hair oil segment has garnered ~% a market share in the Indian hair oil market with its hair oil brand Navratna. Although being one of the costliest hair oil brands in the Indian market, the brand Navratna in 2011 has accounted for approximately 54% of the cool hair oil segment in India. The positioning of the brand Navratna as a stress buster and cool hair oil has aided the company to cater to the masses especially during the summer season.
Figure: Market Share of Major Players in the Hair Oil Segment of the Hair Care Market in India on the Basis of Revenue in Percentage, 2011
BY SHAMPOO
The shampoo market in India has been dominated by HUL, with a contribution of around ~% in 2011. The company wide product line in the shampoo segment and widespread distribution channels has sustained the growth of the company in the shampoo market in India. The company’s brand such as Clinic Plus, Clear, Sunsilk and Dove has acquired a major share of the market across
India.
Marico
Dabur
Bajaj
Emami
Others

23
© This is a licensed product of Ken Research and should not be copied
Figure: Market Share of Major Players in the Shampoo Segment of the Hair Care Market in India on the Basis of Revenue in Percentage, 2011
INDIA NUTRACEUTICALS MARKET
COMPETITIVE LANDSCAPE OF MAJOR PLAYERS IN THE NUTRACEUTICALS MARKET IN INDIA, 2011
Table: Competitive Landscape of Major Players in the Nutraceuticals Market in India, 2011
Company Business Overview Segment Information and Brand Positioning
Financial Performance
HUL
P&G
Cavin care
Dabur
Others

24
© This is a licensed product of Ken Research and should not be copied
INDIA NUTRACEUTICALS INDUSTRY FUTURE OUTLOOK AND PROJECTIONS, 2012-2016
The future of the nutraceuticals market in India is expected to flourish in the long run given the growing awareness about health and wellness in the country especially amongst the population in the urban areas, which is probably due to the changing lifestyle of the urban middle class population… The nutraceuticals market in India in 2011 was around USD ~ million and is expected to be USD 3,216.6 million by 2016…
Figure: India Nutraceuticals Market Projections on the Basis of Revenue in USD Million, 2012-2016
DISCLAIMER
No part of this manual or any material appearing may be reproduced, stored in or transmitted on any other Web site without written permission of Ken Research and any payments of a specified fee. Requests to republish any material may be sent to us.
0.0
500.0
1,000.0
1,500.0
2,000.0
2,500.0
3,000.0
3,500.0
2012 2013 2014 2015 2016
In U
SD M
illio
n