~ united states product recovery of ponderosa ... - fs.fed.us · forest service pacific northwest...
TRANSCRIPT
. ~ United States ~ d I T | ' ~ Department of ' ~*q ~E--~'~,~J Agriculture
Forest Service
Pacific Northwest Research Station
Research Paper PNW-RP-467 November 1993
Product Recovery of Ponderosa Pine in Arizona and New Mexico Thomas D. Fahey and Janet K. Ayer Sachet

Authors THOMAS D. FAHEY was a research forester and JANET K. AYER SACHET was a forester (both now deceased), Forestry Sciences Laboratory, P.O. Box 3890, Portland Oregon 97208.

Abstract
Summary
Fahey, Thomas D.; Sachet, Janet K. Ayer. 1993. Product recovery of ponderosa pine in Arizona and New Mexico. Res. Pap. PNW-RP-467. Portland, OR: U.S. Department of Agriculture, Forest Service, Pacific Northwest Research Station. 18p.
A mill recovery study of ponderosa pine in Arizona and New Mexico showed wide variation in quality within the resource. Lumber grade ranged widely by log grade and diameter, with a major difference within grade 5 logs between old growth and young growth. Old growth produced mostly Shop and Selects grades of lumber while young growth produced mostly Dimension grades of lumber; small-diameter young growth developed severe problems of warpage. Log grades separated logs into distinct value classes, and separating young-growth timber (as if an additional grade) allowed better segregation of logs by product type and expected value.
Keywords: Product recovery, ponderosa pine, Pinus ponderosa, log grading and scaling, timber valuation.
The changing timber resource base in Arizona and New Mexico will affect how the resource is used and the values and types of products available from it. A mill study was used to assess the current value of ponderosa pine timber and the change in products to be anticipated when the resource base changes. Changes in log grading specifications and in log scaling systems were examined concurrently by comparing estimated product volume and value with actual recovery from sawn logs.
Sawn ponderosa pine logs yielded a high proportion of Shop and Select grades from old-growth trees, with log grade and log diameter being important indicators of expected lumber grade yield. Young-growth ponderosa pine results in a different type of product and much lower average lumber value than the old-growth pine it is replacing. Treating young growth as a separate grade of ponderosa pine leads to more accurate evaluation of timber.
The effect of juvenile wood in young growth used for dimension lumber may be an intractable problem. Dimension lumber degrades severely when dried, and it will continue to degrade if it drys further after shipping. This is especially true in the arid climate of the Southwest. The problem is well documented, but there has been little progress in solving it.
Grading ponderosa pine under the Gaines grading rules would have little effect on log grading for timber sales. Compared to the grading system in use previously, there seems to be a small gain in estimating log values. Use of the young-growth classification as a grade will do more to reduce the error associated with value estimates, however, than will changing to the Gaines log grades.
Scaling logs in cubic product rather than in Scribner board feet allows more accurate and less biased estimates of product recovery. This result is consistent with other comparisons of these scaling systems.

Contents
4
5
6
6
6
7
8
12
14
16
16
18
Introduction
Methods
Sample
Classification of Old Growth and Young Growth
Harvesting and Log Identification
Log Scaling and Grading
Sawing
Drying and Planing
Data Compilation
Analysis
Volume Recovery
Recovery of Value and Lumber Grades
Results And Discussion
Volume Recovery
Lumber Grade Recovery
Log Values by Log Grade
Conclusions
Literature Cited
Appendix
Introduction
Methods Sample
Classification of Old Growth and Young Growth
Ponderosa pine (Pinus ponderosa Dougl. ex Laws.) is not only the most important commercial timber species in Arizona and New Mexico but also a resource in transition. The old-growth "yellow pine" is being supplemented in the timber harvest by increasing volumes of "blackjack" or "bull pine" from young-growth stands. Old growth is the premier source of Select grade lumber and stock for millwork, but young-growth trees produce mostly less valuable structural and common grades of lumber. The young growth will not support the moulding and millwork industry that is based on old-growth pine, and the change may result in reduced employment in the forest products industry, even if National Forest harvests are maintained at current levels.
Given this changing resource, a main objective of this study was to document current use of mature and young stands, to provide a current appraisal base for National Forest timber sales, and to evaluate alternative methods of scaling and grading logs. Specific objectives in 1981 when the study was run, were to develop recovery infor- mation in relation to the scaling methods used, to demonstrate value differences among different grades of logs in relation to how logs and lumber are measured, to document the relation between lumber grades recovered and the grade of logs sawn, and to provide a means of estimating product value. To meet these objectives, it was necessary to develop a working definition of young growth and to determine if the value of products was different between young growth and old growth as defined.
The trees comprising the sample were selected to represent the range of size and quality of timber available from commercial stands in National Forests within Arizona and New Mexico. Subsamples of old- and young-growth trees were selected; the young-growth sample was stratified by tree d.b.h. (diameter at breast height),and the old growth was stratified by both d.b.h, and grade (Gaines 1962) of the first 16-foot log in the tree.
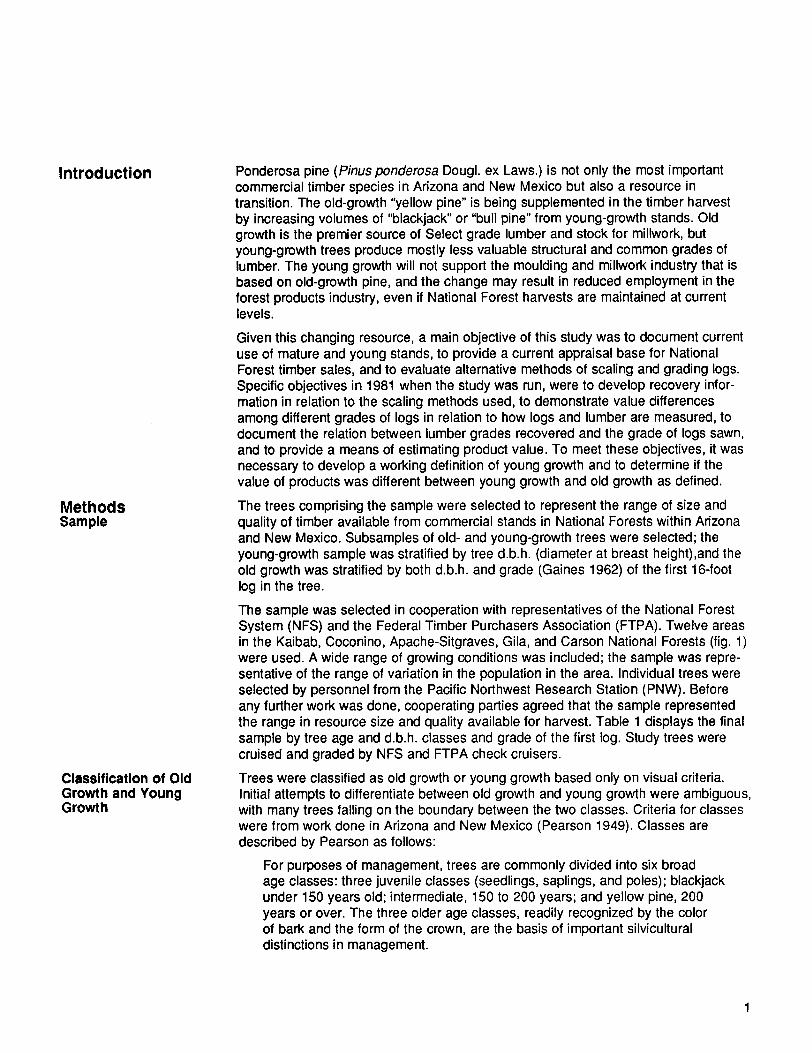
The sample was selected in cooperation with representatives of the National Forest System (NFS) and the Federal Timber Purchasers Association (FTPA). Twelve areas in the Kaibab, Coconino, Apache-Sitgraves, Gila, and Carson National Forests (fig. 1) were used. A wide range of growing conditions was included; the sample was repre- sentative of the range of variation in the population in the area. Individual trees were selected by personnel from the Pacific Northwest Research Station (PNW). Before any further work was done, cooperating parties agreed that the sample represented the range in resource size and quality available for harvest. Table 1 displays the final sample by tree age and d.b.h, classes and grade of the first log. Study trees were cruised and graded by NFS and FTPA check cruisers.
Trees were classified as old growth or young growth based only on visual criteria. Initial attempts to differentiate between old growth and young growth were ambiguous, with many trees falling on the boundary between the two classes. Criteria for classes were from work done in Arizona and New Mexico (Pearson 1949). Classes are described by Pearson as follows:
For purposes of management, trees are commonly divided into six broad age classes: three juvenile classes (seedlings, saplings, and poles); blackjack under 150 years old; intermediate, 150 to 200 years; and yellow pine, 200 years or over. The three older age classes, readily recognized by the color of bark and the form of the crown, are the basis of important silvicultural distinctions in management.
! 5 "raos
ABIZONA ' I NEW M : ,JCO
0 Phoenix / @ '
Figure 1--Locations where sample trees were selected.
Blackjack c/ass: Blackjacks are young Irees which possess all the biological advantages of youth. They are characterized by a dark almost black bark, a relatively short rapidly tapering bole, a pointed or rounded top, and ascending upper branches.
Intermediate age c/ass: They represent a transition stage from blackjack to yellow pine. This applies to the color of the bark which may be described as turning from black to yellow or brown. Intermediate trees are often dark on one side of the trunk and light on the other, and the upper portion of the bole is darker than the lower part. The tops are somewhat more rounded than those of blackjacks. The branches generally are more nearly horizontal but the upper ones are distinctly ascending. Boles of a given diameter are longer and less tapering than blackjack though less cylindrical than those of yellow pine.
Yellow pine class: Yellow pines are characterized by reddish yellow or cinnamon brown bark on all sides of the bole, this color extending quite or almost to the tip, a flat or broadly rounded top, and horizontal or drooping branches. Trees which have grown in close formation have long cylindrical boles comparatively free of branches for one or more log lengths.
Our intent was to identify trees as old growth or young growth by using only the external characteristics. We expected that most intermediates would fall into the young-growth classification. Tree age, the only precise determinant of age class, proved impractical to use because of the time and difficulty of measuring age on borderline trees. The other four characteristics--bark, crown shape, taper, and branch angle--were all subjective with crown shape and branch angle being essentially the same observation.
2
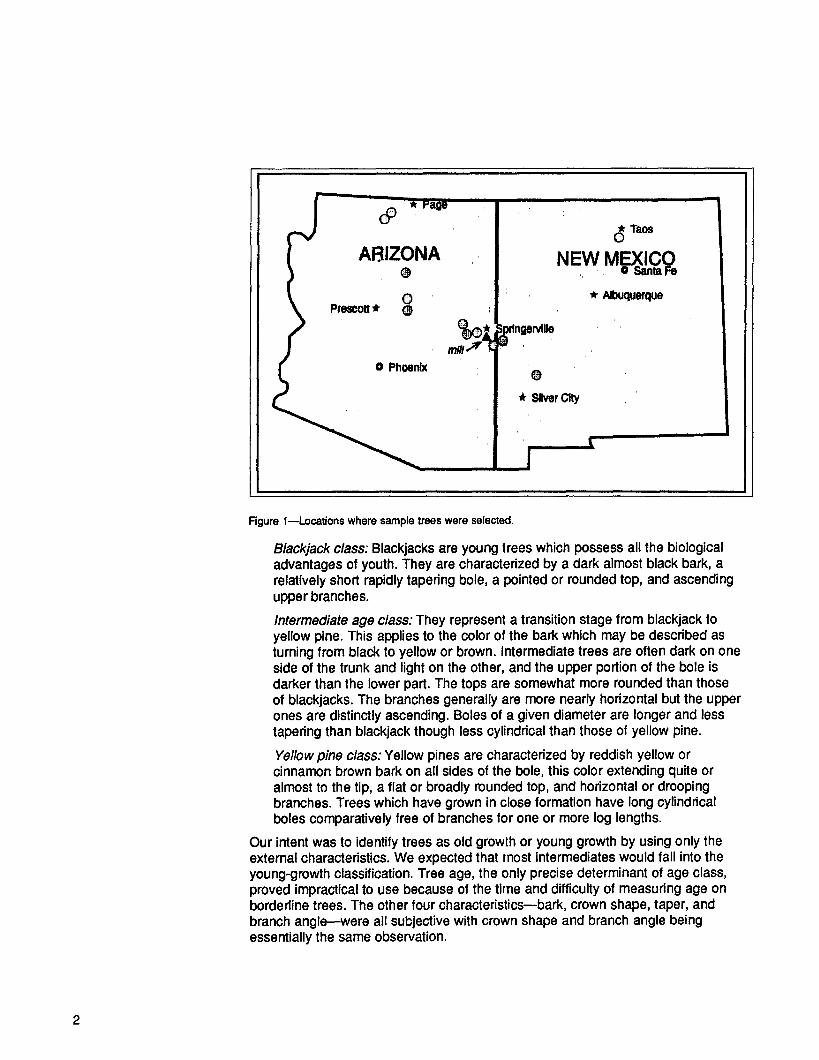
Table 1reDistribution of sample trees by age and diameter class
Age class
D.b.h. b class Log
grade a 9-12 13-15 16-18 19-21 22-24 25-27 28-30 31+ Total
Old growth 1, 2, or 3 4 2 8 7 11 9 2 10 53 Old growth 5 9 12 13 9 15 11 10 7 86 Young growth 5 21 18 15 11 9 1 75
a Grade of the first 16-foot log (Gaines 1962) in the standing tree. b Tree diameter (inches) at breast height.
The definitions arrived at and agreed to by the cooperating parties are given below.
Old g row th - -
Form--Long, cylindrical bole with taper usually less than 3 inches in the middle or second 16-foot log.
Top--Generally flat or rounded top.
Bark--(First 16-foot log only) Yellow to reddish brown color on all sides shading to black. Moderate to very wide plates with wide and shallow fissures.
Young g row th - -
Form-Rap id taper in bole usually with more than 3 inches of taper in the middle or second 16-foot log.
Top--Generally pointed or sharply rounded top.
Bark--(First 16-foot log only) Range from black to dark reddish brown. Narrow plates with deep and narrow fissures.
Trees were assigned to old growth or young growth based on these descriptions; borderline trees were assigned to one or the other classification based on two of the three characteristics. Our definitions did not come out exactly as Pearson described classes; more of the intermediate trees were classified as old growth than as young growth. Of the trees for which we had ring counts at the stump, the age class and identification were as follows:
Age Old growth Young growth
Years Number of trees . . . .
Less than 120 0 17 120-150 13 14 150-200 34 6 More than 200 19 0
No tree less than 120 years old was classified as old growth and none over 200 years old was classified as young growth. Trees between 120 and 150 years of age were classified in both age classes, but only a few trees older than 150 years of age were classified as young growth.
3
Harvesting and Log Identification
Log Scaling and Grading
Sawing
Drying and Planing
The major difference between this and the Pearson descriptions is that we considered bark characteristics only on the first 16-foot log in each tree. Lower site classes were the probable source of trees older than 120 years that were classified as young growth, as slower height growth will result in more taper in the middle logs.
Sample trees were selected in areas where FTPA member companies had ongoing timber harvests. Trees were cut and logged by several different companies using normal operating practices. Logs were measured and marked by PNW personnel and then trucked to the Southwest Forest Industries (SWFI) mill at Eagar, Arizona, for scaling and sawing.
Logs were rolled out and scaled in the mill yard as they were delivered from the woods (32 feet plus trim was the preferred length). Each log was measured inde- pendently by NFS and FTPA check scalers; after scaling, the scalers compared measurements and defect deductions for each log. If any difference in either the measurements or the amount of defect deduction was found, the log was rescaled and any differences resolved with all scalers. Scribner net scale (USDA 1972) and cubic firmwood and cubic product scales (USDA 1978) were taken in this manner. With the Scribner net scale, logs are scaled as segments not longer than 20 feet; log grades are assigned to these segments. The log grade assigned to each segment was a consensus grade taken while the tree was standing.
The sawmill in Arizona where the logs were sawn was considered typical of sawmills in the southern Rocky Mountains. The mill was organized to cut high-grade lumber on a band headrig and to edge the high-grade lumber through a variable-width edger. Lower grade logs were made into cants on the headrig; small cants then were cut on a linebar resaw, and larger cants were resawn by a sash-gang saw. Products cut were 6/4-inch Shop and Select grades on the headrig and edger, with both resaws producing primarily 2-inch-thick dimension lumber. A small volume of 4/4 and 5/4 lumber developed in sizing cants for the resaws. Little trimming was done in the sawmill, only enough to square board ends or remove obvious cull boards, thereby leaving final trim decisions to the graders at the planer mill. This sawmill has since been replaced by a new mill at the same site.
Study crew members marked each board to identify it with the log it came from. Other crew members measured a sample of the rough lumber so that the cubic volume of rough-green lumber produced could be estimated. Thickness was measured and recorded to the nearest 0.001 inch, and width was measured to the nearest one-thirty-second of an inch. Each board sampled was measured in three places, about 1 foot from each end and in the middle of the board. Table 2 displays the average dimensions for each size of lumber produced.
The lumber was stickered and kiln dried under the kiln schedule normally used for ponderosa pine at this mill. Because of problems in timing among the several parts of the study, some lumber dried more than expected during yard storage. Lumber was removed from the kiln at about 9 percent moisture content (m.c.) but then was stored in a covered shed where it dried to roughly 8 percent m.c. before it was surfaced.
4
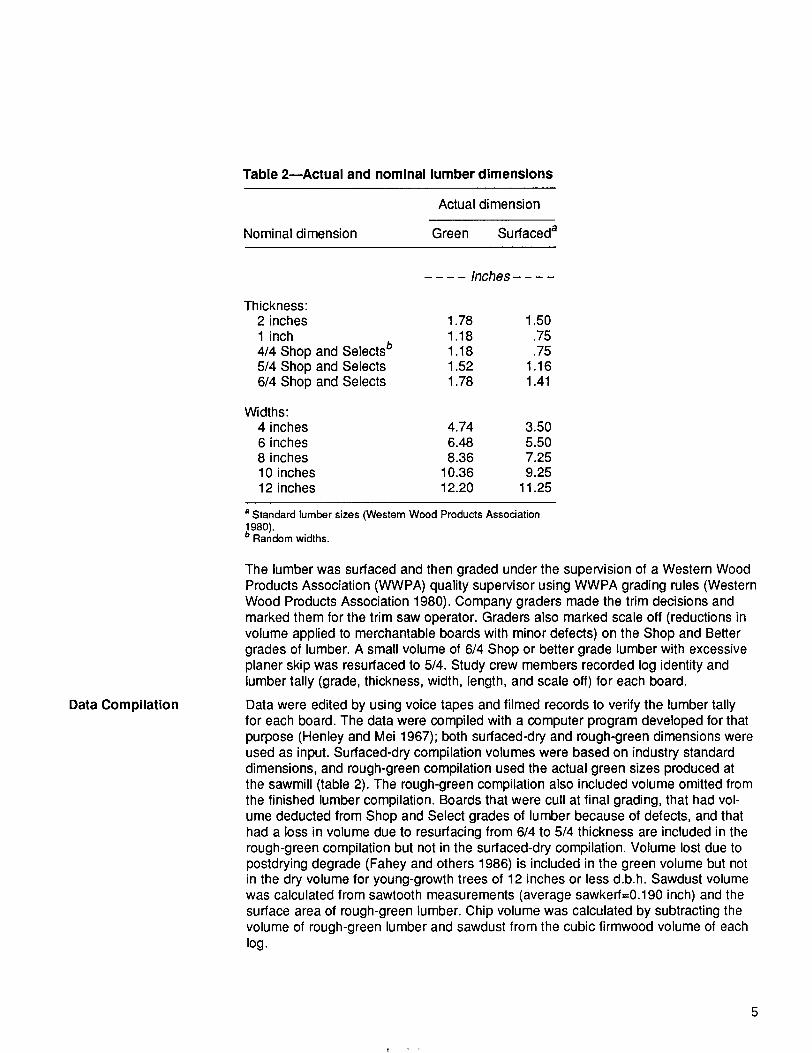
Table 2mACtual and nominal lumber dimensions
Nominal dimension
Actual dimension
Green Surfaced a
Data Compilation
. . . . I n c h e s . . . .
Thickness: 2 inches 1.78 1.50 1 inch 1.18 .75 4/4 Shop and Selects b 1.18 .75 5/4 Shop and Selects 1.52 1.16 6/4 Shop and Selects 1.78 1.41
Widths: 4 inches 4.74 3.50 6 inches 6.48 5.50 8 inches 8.36 7.25 10 inches 10.36 9.25 12 inches 12.20 11.25
a Standard lumber sizes (Western Wood Products Association 198o). b Random widths.
The lumber was surfaced and then graded under the supervision of a Western Wood Products Association (WWPA) quality supervisor using WWPA grading rules (Western Wood Products Association 1980). Company graders made the trim decisions and marked them for the trim saw operator. Graders also marked scale off (reductions in volume applied to merchantable boards with minor defects) on the Shop and Better grades of lumber. A small volume of 6/4 Shop or better grade lumber with excessive planer skip was resurfaced to 5/4. Study crew members recorded log identity and lumber tally (grade, thickness, width, length, and scale off) for each board.
Data were edited by using voice tapes and filmed records to verify the lumber tally for each board. The data were compiled with a computer program developed for that purpose (Henley and Mei 1967); both surfaced-dry and rough-green dimensions were used as input. Surfaced-dry compilation volumes were based on industry standard dimensions, and rough-green compilation used the actual green sizes produced at the sawmill (table 2). The rough-green compilation also included volume omitted from the finished lumber compilation. Boards that were cull at final grading, that had vol- ume deducted from Shop and Select grades of lumber because of defects, and that had a loss in volume due to resurfacing from 6/4 to 5/4 thickness are included in the rough-green compilation but not in the surfaced-dry compilation. Volume lost due to postdrying degrade (Fahey and others 1986) is included in the green volume but not in the dry volume for young-growth trees of 12 inches or less d.b.h. Sawdust volume was calculated from sawtooth measurements (average sawkerf=0.190 inch) and the surface area of rough-green lumber. Chip volume was calculated by subtracting the volume of rough-green lumber and sawdust from the cubic firmwood volume of each log.
Ana lys is
Volume Recovery
Recovery of Value and Lumber Grades
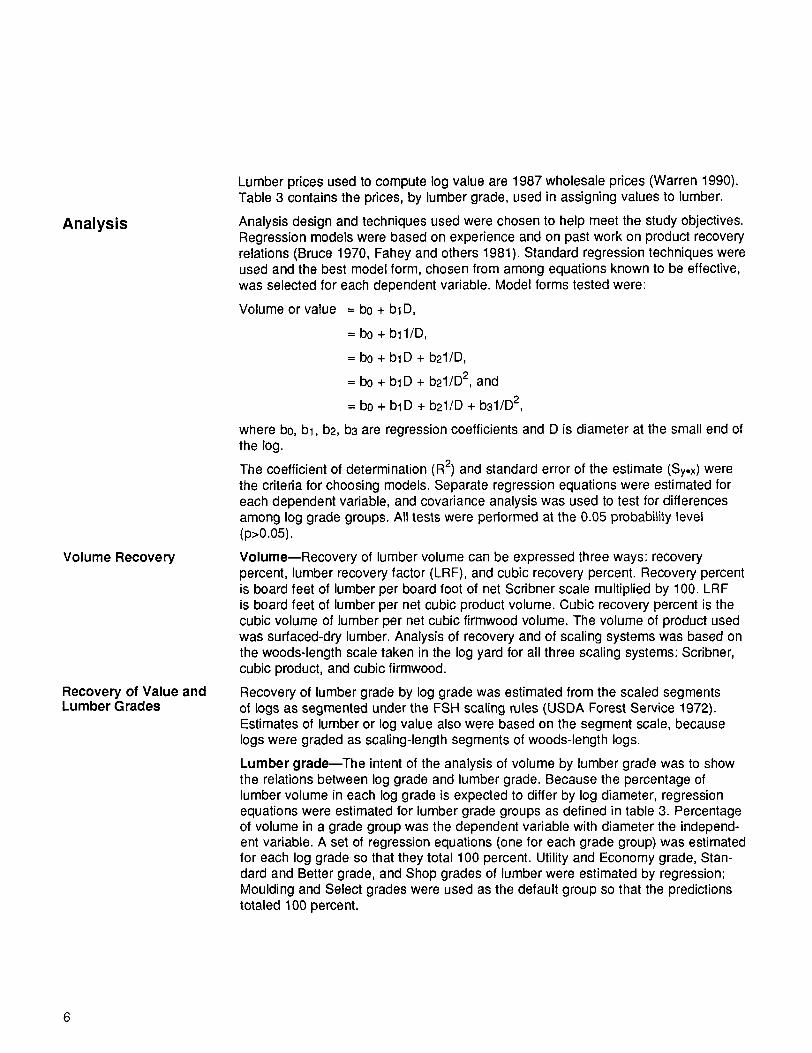
Lumber prices used to compute log value are 1987 wholesale prices (Warren 1990). Table 3 contains the prices, by lumber grade, used in assigning values to lumber.
Analysis design and techniques used were chosen to help meet the study objectives. Regression models were based on experience and on past work on product recovery relations (Bruce 1970, Fahey and others 1981). Standard regression techniques were used and the best model form, chosen from among equations known to be effective, was selected for each dependent variable. Model forms tested were:
Volume or value = bo + biD,
= bo + b11/D,
= bo + biD + b21/D,
= bo + bl D + b21/D 2, and
= bo + biD + b21/D + b31/D 2,
where bo, bl, b2, b3 are regression coefficients and D is diameter at the small end of the log.
The coefficient of determination (R 2) and standard error of the estimate (Syox) were the criteria for choosing models. Separate regression equations were estimated for each dependent variable, and covariance analysis was used to test for differences among log grade groups. All tests were performed at the 0.05 probability level (p>0.05).
Volume--Recovery of lumber volume can be expressed three ways: recovery percent, lumber recovery factor (LRF), and cubic recovery percent. Recovery percent is board feet of lumber per board foot of net Scribner scale multiplied by 100. LRF is board feet of lumber per net cubic product volume. Cubic recovery percent is the cubic volume of lumber per net cubic firmwood volume. The volume of product used was surfaced-dry lumber. Analysis of recovery and of scaling systems was based on the woods-length scale taken in the log yard for all three scaling systems: Scribner, cubic product, and cubic firmwood.
Recovery of lumber grade by log grade was estimated from the scaled segments of logs as segmented under the FSH scaling rules (USDA Forest Service 1972). Estimates of lumber or log value also were based on the segment scale, because logs were graded as scaling-length segments of woods-length logs.
Lumber grademThe intent of the analysis of volume by lumber grade was to show the relations between log grade and lumber grade. Because the percentage of lumber volume in each log grade is expected to differ by log diameter, regression equations were estimated for lumber grade groups as defined in table 3. Percentage of volume in a grade group was the dependent variable with diameter the independ- ent variable. A set of regression equations (one for each grade group) was estimated for each log grade so that they total 100 percent. Utility and Economy grade, Stan- dard and Better grade, and Shop grades of lumber were estimated by regression; Moulding and Select grades were used as the default group so that the predictions totaled 100 percent.
6
Table 3--Prices used In assigning value to lumber
Grade group and grades included P r i c e Thickness Width
Results and Discussion
Dollars
Select: C and Better Select $1524.29 6/4 Random width D and Moulding 1220.54 4/4, 5/4, 6/4 Random width
Shop: Factory Select 515.28 4/4, 5/4, 6/4 Random width No. 1 Shop 515.28 4/4, 5/4, 6/4 Random width No. 2 Shop 515.28 4/4, 5/4, 6/4 Random width No. 3 Shop 515.28 5/4, 6/4 Random width
Standard and Better: 3 and Better Common Standard/No. 2 & Better
244.56 4/4 Standard widths a 244.56 2 inches Standard widths
Utility and Economy: 4 and 5 Common Utility, No. 3, Economy
151.89 4/4 Standard widths 151.89 2 inches Standard widths
a Standard widths were 4, 6, 8, 10, and 12 inches.
Value--Like lumber grade estimates, log value estimates are related to log grades. Therefore, value per thousand board feet of net lumber tally ($/MLT) and value per thousand board feet of net log scale ($/MNLS) were estimated by using segment grades and scale. The values $/MLT and $/MNLS were estimated directly by using the prices shown in table 3. Analysis of covariance was used to test for differences among groups that were expected to be different (grades 1 and 2 combined, grade 3, grade 5 old growth, and grade 5 young growth). The null hypothesis was that there was no difference in value of products among any of the log grade groups.
Scaling system analysis--The technique used to analyze scaling systems is based on accuracy and bias (Fahey and others 1981). First, a lumber recovery equation was created by using regression of cubic foot volume of lumber over each scaling system volume for only the sound logs. Then this equation was used to predict vol- ume of defective logs based on the net scaled volume. Accuracy (Sy.x) was compared based on the relative size of mean squared error of defective logs about the regres- sion line calculated from sound logs. Bias is the sum of residual differences between observed and predicted values divided by the number of observations.
There are two major concerns that lumber recovery studies address well: the amount of lumber recovered from logs of various sizes and grades and the relative quality of that lumber. Log grades help to predict the quality of lumber produced from a given log. Log scale is a measure of volume that is used to estimate the volume of lumber that can be recovered from a log.
7
Volume Recovery
There are problems implicit in both the scale and grade assumptions and in the measurement of lumber. Scaling systems are not always accurate reflections of volume. They also have inconsistencies caused by degrees of precision as in rounding of diameter, length, or final scale volume. A board foot of lumber is not a consistent unit of volume. To demonstrate calculation of board feet, we used the measurements in table 2. Nominal 6/4 Shop-type lumber is tallied as 1.5 inches thick, but it is sawn the same thickness as nominal 2-inch thick dimension lumber. A log sawn into nominal 6/4 lumber will contain the same cubic volume of rough-green lumber as a log sawn into nominal 2-inch lumber, but it will have only 75 percent of the board-foot volume.
Lumber grade recovery is not static. Grade recovery is affected by what a mill chooses to produce, the set of lumber grades used, and how edging and trimming decisions are influenced by these choices. Lumber grade recovery is affected by log diameter and log grade, and some defects that affect lumber grade are not recognized as log grading defects. Regardless of these caveats, the study mill did follow sawing practices typical for the region. The policy at this mill was to saw Select and Shop lumber from a log until it was no longer feasible, and then saw the balance of the log into 2-inch dimension lumber. Most of the high-quality Select grades were sold as 6/4 Moulding and better, so standard practice was to edge and trim the high-quality lumber from a log to Moulding specifications. Most western mills cut ponderosa pine that fails to qualify for Shop grade into 1-inch Common lumber, but mills in the southern Rocky Mountains often cut 2-inch dimension lumber, as was done here.
The logs were scaled for Scribner volume, cubic firmwood, and cubic product volume. There were slight differences in the scale and in the way defects were deducted that help to explain apparent differences in recovery.
The three scaling systems deduct different volumes of defect from defective logs. Cubic firmwood deducts only for material unsuitable for chipping. Scribner and cubic product scale deduct for defects believed to affect lumber recovery but calculate volume of deductions differently. Defect appeared to be greater in logs from old- growth trees than in logs from young growth. Means were compiled and a t-test used to test for differences. The results of these tests are shown in the following tabulation:
Scaling system Old growth Young growth
. . . . P e r c e n t d e f e c t . . . .
Scribner 8.05 2.93 Cubic product 2.28 2.28 Cubic firmwood 1.09 0.34
Defect was relatively low for all scaling systems, and although the differences in defect between old- and young-growth trees were significant (p>0.05) for the Scribner and firmwood scales, we found no difference for the cubic product scale. Cubic product and Scribner scale are supposed to deduct for defects affecting lumber recovery. The percentages of defects in young growth were similar under both scales. But the percentage of defect in the old growth was higher with Scribner scale, because firm rot ( P o l y p o r u s a n c e p s ) was deducted from Scribner scale but not from cubic product scale.
8

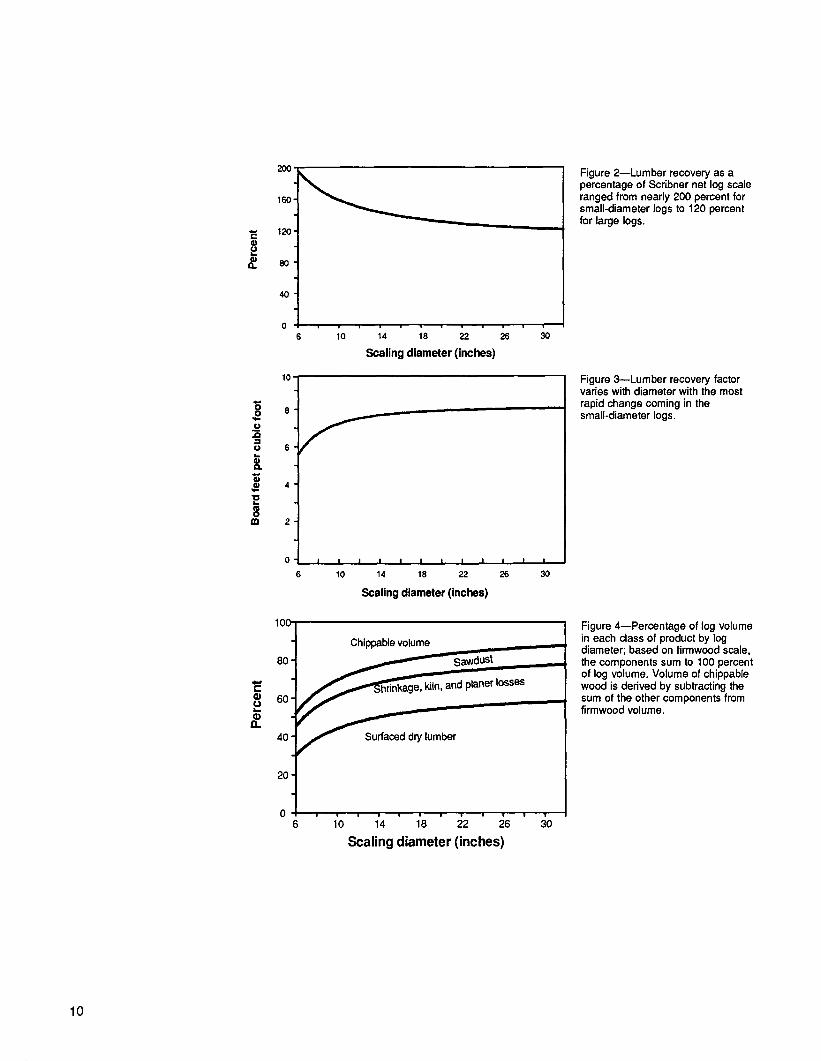
Recovery percentMTwo factors affect recovery percent: Scribner scale is inconsis- tent for small logs, with the error increasing as diameter decreases; and the board foot is not a consistent unit of product volume. Figure 2 displays a plot of recovery percent for woods-length logs. (Regression equations for all figures are in table 6, appendix.) Recovery is nearly 200 percent for small logs, and less than 130 percent for logs larger than 20 inches. This variation in scale recovery arises from two sources; inaccuracies in log scale and inconsistencies in lumber measurement. Two-inch dimension lumber cut from small-diameter logs requires less fiber per board foot than does 6/4 lumber cut from larger logs, and the ratio of board feet to cubic feet of lumber decreases (Fahey and Woodfin 1976).
Lumber recovery factormLRF as shown in figure 3 is defined as the board feet of lumber recovered per cubic foot of product scale. The LRF increases as log diameter increases and ranges from less than 6 for 6-inch logs to nearly 8 for logs 20 inches and larger. It would be similar to cubic recovery measured in cubic feet, described below, except that dimension lumber cut from small logs uses less fiber per board foot than does Shop lumber cut from larger logs.
Materials balance---Cubic firmwood scale deducts only for defects that are not suitable for chips and permits us to account for all volume from a log. Figure 4 displays the estimated volume of wood recovered or lost during sawing, kiln drying, and planing. Volume of surfaced-dry lumber is the final tally of volume of commercial lumber that was shipped. It increases rapidly in small-diameter logs and more slowly as log diameter increases. Shrinkage and planer losses are the difference in volume between the volume of rough-green lumber at the sawmill and the final shipping tally. Shrinkage in the kiln and during storage is about 6.5 percent of the green lumber volume. In addition, planing removes enough wood to finish the board to size. Besides these losses, some boards were culled due to warp, the volume of Shop and Better grades was reduced by defects, and some 6/4 lumber that was under- sized had to be replaned to 5/4 thickness.
The percentage of solid wood converted to sawdust increased with log diameter. As the percentage of rough-green lumber increases, the surface area of boards increases; therefore the percentage of sawdust must increase. Percentage of chippable wood decreases as lumber and sawdust increases. For example, nearly 50 percent of the volume of 6-inch logs is chipped, but less than 20 percent of the volume of 30-inch logs is chipped. These results roughly parallel the results of a study in California (Ernst and Pong 1985), although the range in diameter in our study was much smaller.
Cubic product scale---Cubic product scale determines deductions for defects that scalers assume will cause loss of lumber volume. With minor changes, the cubic product scale used for this study is the scaling system that will be in use for future timber sales. It results in a more accurate estimate of lumber volume than Scribner or cubic firmwood scales, but we can estimate chippable volume only empirically, because the sum of green lumber, sawdust, and chips exceeds log scale (deductions for defects that affect lumber but not chi~)pable volume). Table 4 displays the esti- mated recovery from the sawmill and th~ planer, as well as the losses to sawdust, shrinkage, and planing. Estimated volumes of rough-green lumber plus sawdust plus chips (calculated from firmwood scale) equals the materials' balance through the sawmill and will sum to slightly more than 100 percent. Volume of surfaced-dry lumber and of kiln and planer loss sum to the volume of rough-green lumber.
2OO
160 ̧
120
.u
40
10-
8
6
4
m o
2
100
80
e- 60
11. 40
20
, i ° , m , • , , , ,
10 14 18 22 26 3o
Scaling diameter (inches)
f
i I I I I I I I I | I
10 14 18 22 26 30
Sealing diameter (inches)
C h i p p a ~ , ~ , ~ ~
kiln, and planer losses
~ r y lumber
0 i | i i i i
6 1'o 1'4 ;8 :;o Scal ing d iameter ( inches)
Figure 2--Lumber recovery as a percentage of Scribner net log scale ranged from nearly 200 percent for small-diameter logs to 120 percent for large logs.
Figure 3--Lumber recovery factor varies with diameter with the most rapid change coming in the small-diameter logs.
Figure 4--Percentage of log volume in each class of product by log diameter; based on firmwood scale, the components sum to 100 percent of log volume. Volume of chippable wood is derived by subtracting the sum of the other components from firmwood volume.
10
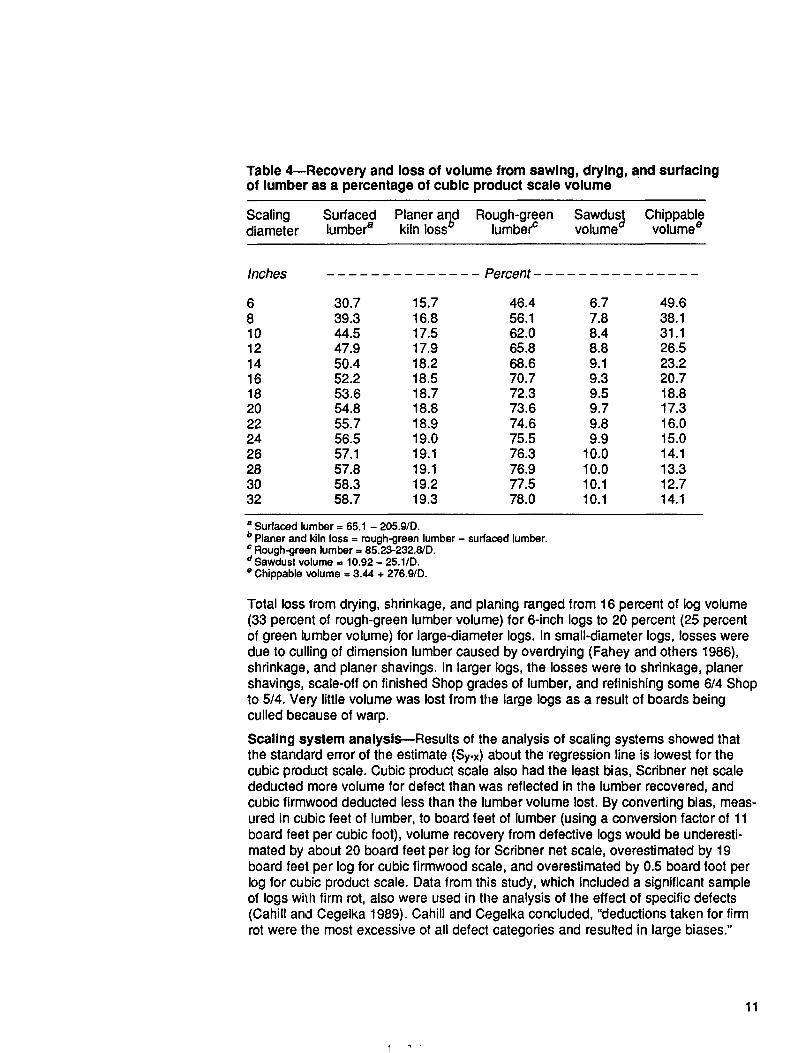
Table 4---Recovery and loss of volume from sawing, drying, and surfacing of lumber as a percentage of cubic product scale volume
Scaling Surfaced Planer ar],d Rough-green Sawdus~ Chippable diameter lumber a kiln loss" lumber" volume" volume e
Inches Percent
6 30.7 15.7 46.4 6.7 49.6 8 39.3 16.8 56.1 7.8 38.1 10 44.5 17.5 62.0 8.4 31.1 12 47.9 17.9 65.8 8.8 26.5 14 50.4 18.2 68.6 9.1 23.2 16 52.2 18.5 70.7 9.3 20.7 18 53.6 18.7 72.3 9.5 18.8 20 54.8 18.8 73.6 9.7 17.3 22 55.7 18.9 74.6 9.8 16.0 24 56.5 19.0 75.5 9.9 15.0 26 57.1 19.1 76.3 10.0 14.1 28 57.8 19.1 76.9 10.0 13.3 30 58.3 19.2 77.5 10.1 12.7 32 58.7 19.3 78.0 10.1 14.1
= Surfaced lumber = 65.1 - 205.9/D. b Planer and kiln loss = rough-green lumber - surfaced lumber. c Rough-green lumber = 85.23-232.8/D. d Sawdust volume = 10.92 - 25.1/D. • Chippable volume = 3.44 + 276.9/D.
Total loss from drying, shrinkage, and planing ranged from 16 percent of log volume (33 percent of rough-green lumber volume) for 6-inch logs to 20 percent (25 percent of green lumber volume) for large-diameter logs. In small-diameter logs, losses were due to culling of dimension lumber caused by overdrying (Fahey and others 1986), shrinkage, and planer shavings. In larger logs, the losses were to shrinkage, planer shavings, scale-off on finished Shop grades of lumber, and refinishing some 6/4 Shop to 5/4. Very little volume was lost from the large logs as a result of boards being culled because of warp.
Scaling system analysis--Results of the analysis of scaling systems showed that the standard error of the estimate (Sy.x) about the regression line is lowest for the cubic product scale. Cubic product scale also had the least bias, Scribner net scale deducted more volume for defect than was reflected in the lumber recovered, and cubic firmwood deducted less than the lumber volume lost. By converting bias, meas- ured in cubic feet of lumber, to board feet of lumber (using a conversion factor of 11 board feet per cubic foot), volume recovery from defective logs would be underesti- mated by about 20 board feet per log for Scribner net scale, overestimated by 19 board feet per log for cubic firmwood scale, and overestimated by 0.5 board foot per log for cubic product scale. Data from this study, which included a significant sample of logs witll firm rot, also were used in tile analysis of the effect of specific defects (Cahill and Cegelka 1989). Cahill and Cegelka concluded, "deductions taken for firm rot were the most excessive of all defect categories and resulted in large biases."
11
Lumber Grade Recovery
Error terms for the scaling systems are given in the following tabulation:
Scaling System Accuracy (Sy.x) Bias
Scribner net 6.29 +1.83 Cubic firmwood 5.01 -1.74 Cubic product 4.63 -.04
Lumber grades recovered at any mill are affected by log supply, mill efficiency, and how the mill markets its production. The mix of sizes and lumber grades that a mill makes and how edging and trimming are influenced by sizes and grades help to determine what grades will be recovered. For all log grades, the volume on a board foot basis was distributed as follows: 53.2 percent 2-inch Dimension, 42.8 percent 6/4 Shop and Select, 2.3 percent 5/4 Shop and Select, 1.1 percent 4/4 random width Shop and Select, and less than 1 percent in the 1-inch Common grades. The breakdown of recovery by grade and item is given in table 5.
Lumber grade recovery was related to log grade and to the size of logs within each log grade. Lumber grades were grouped into four grade groupings: Select, Shop, Standard and Better, and Utility and Economy grades (table 3). Recovery by these groupings was regressed over log diameter for log grades 1 and 2 combined, grade 3, grade 5 logs from old growth, and grade 5 logs from young-growth trees. Slope or intercept of the major grade groups was significantly different for all log grades. Our objective was to show the relative differences in recovery of these lumber grade groups by log grade and diameter. Models for fitting these curves and the statistics for them are not included; the figures are intended to show general trends, not to make precise predictions.
As illustrated in figure 5, the highest ratio of Selects was recovered from high-grade logs (5a); the lowest ratio of Selects was recovered from grade 5 young growth (5d). Recovery of Select grade lumber was largely a matter of log grade, but the recovery of Shop grades was related to log diameter for all grades of logs. Change in grade recovery with diameter was most pronounced in the lowest grades of lumber. The Utility and Economy came primarily from the juvenile wood portion of the log. This juvenile wood is congruent with the total log volume of young-growth logs of small diameter and is a major part of total log volume on all small-diameter logs. Most of the Utility and Economy grade lumber met the visual criteria for Standard or Better when green but was degraded during kiln drying or subsequent air drying because of excessive warp. Twist, crook, and bow all contributed significantly to the loss in grade that was related to drying juvenile wood (Fahey and others 1986). No definitive work has been done on the number of years that ponderosa pine produces juvenile wood; however, problems in drying due to warp may occur in wood formed in the first 50 years of growth (Markstrom and others 1985, Voorhies 1971 ).
The difference in lumber grade between old- and young-growth logs is important enough to recognize even if the values of products were equal. Old growth, even in grade 5 logs, provides a high percentage of Shop and Select grades, while recovery from second-growth logs is primarily in Dimension grades. Sawmill cutting patterns, drying schedules, planer operations, and lumber sales all have to be modified when the resource base changes. From an operational standpoint there is more difference between grade 5 young growth and old growth than between grade 3 and grade 5 in the old growth.
12

T a b l e 5 ~ P e r c e n t a g e of r e c o v e r y by l u m b e r g r a d e a n d s i ze for al l l o g s
Select Shop Dimension
Lumber Fac. Std. item C D Mldg. sel. No. 1 No. 2 No. 3 2&Btr. Util. Econ
Common
3&Btr 4 Total
6/4 random 5/4 random 4/4 random 2 b y 4 2 b y 6 2 b y 8 2 b y 1 0 2by 12 1 by 4-10
Percent
0.5 0.2 9.3 1.9 1.1 11,1 18.8 - - - - .1 .2 .1 .4 1.5 - - - - .2 .1 .2 .6
9.6 2.7 2.3 4.4 2.5 1.8 7.9 8.6 6.4 3.1 1.8 .5 1.0 .5 .2
Totals .5 .2 9,6 2.2 1.4 12.1 20.3 26.0 16.1 11.2
0.2 0.3
.2 .3
42.9 2.3 1.1
14.6 8.7
22.9 5.4 1.7
0.1 .6
.1 100.2
100
80,
~ 60
20
a
Selects
L
Utility and Economy I . . . . . . . . . .w
6 10 14 18 22 26 30
. . . . .
6 10 14 18 22 26 30
Scaling diameter (Inches)
% UIIItv and E o o n o ~ ~ o ~ U t l g t Y and Eoonomy
6 10 14 18 22 26 30
100
80
60
40
20
~ , ~ ~ ~ ~ d
um.y and Economy
~o ;4 l"e ~2 ~8 ~o Scaling diameter (inches)
Figure 5--Lumber recovery differed with log grade and scaling diameter. (A) Logs in grades 1 and 2 produced a very high percentage of lumber in the Shops and Select grades. (B) Grade 3 logs larger than 14 inches scaling diameter also produced a high proportion of Shops and Select grades. (C) Grade 5 logs from old growth were the most variable; small logs produced mostly lower grades and large logs yielded mostly Shop grades. (D) Grade 5 logs from young growth produced few Shop or Select grades of lumber.
13

Log Values by Log Grade
Value per thousand board feet lumber tally--Value can be estimated several ways. The $/MLT, or value per thousand lumber tally, is the average sales realization for the lumber; it is a good index of the relative grades, but does not recognize that the lower valued dimension grade lumber requires less wood to manufacture than do the higher valued Shop and Select grades. The $/MLT for this study is tied to the prices we used, but there is a long-term relation among prices. This $/MLT is tied to a long-term index that uses the same grade groups as were used in deriving it, and it can be updated by using this index. Each log grade was different than the adjacent group. The following tabulation shows the group means and standard deviations:
Number Log grade group of logs $/MLT Sx
Grades 1 and 2 26 $757.56 _+$223.87 Grade 3 50 $470.86 _+$200.05 Grade 5 old g~wth 472 $297.77 _+$134.24 Grade 5 young growth 243 $208.46 ±$55.02
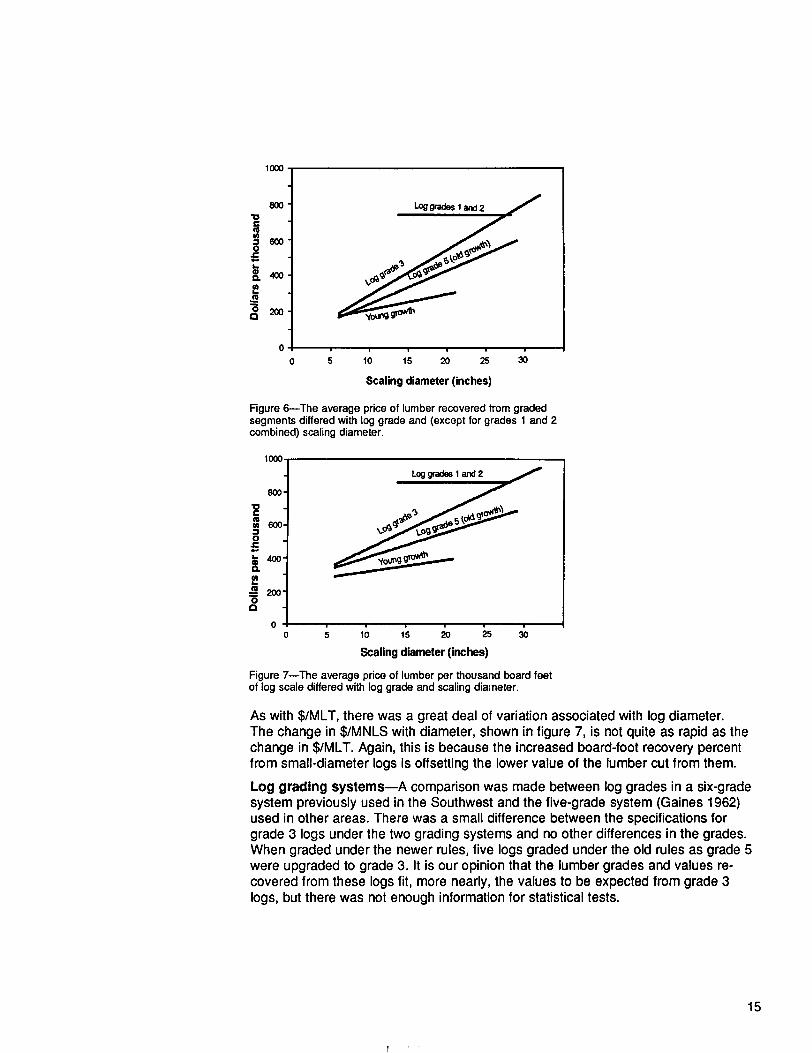
These differences are not as large as they appear, because all grade groups, except the combined grades 1 and 2, also were significantly correlated with log diameter, and the higher log grades had logs with the largest average diameter. Figure 6 shows that the difference between grades varies as diameter increases. The rate of change is relatively constant for all log grades except logs in grades 1 and 2. This group might have had a statistically significant slope if the sample had been larger. A similar study conducted in California (Ernst and Pong 1985) with a larger sample and a larger range in diameter had a significant relation between $/MLT and scaling diameter for logs in grades 1 and 2. One reason that values increase with increasing diameter is the shift in production from low-priced dimension lumber to higher priced Shop and Select lumber. For the grade 5 young growth, the reason for the increase in value was the switch from very low-priced Utility and Economy to moderately priced Standard or No. 2 and better grades.
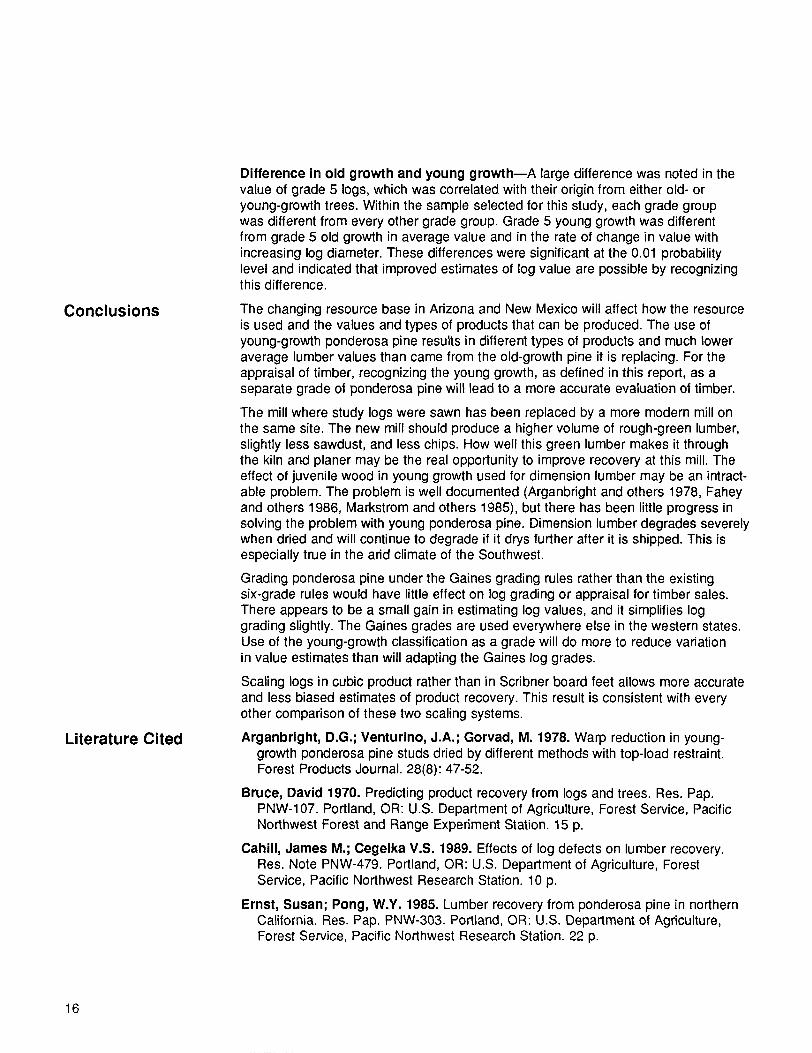
Value per thousand net log scale--The other measure of value, $/MNLS based on Scribner net scale, recognizes the effect of recovery and lumber grade simultane- ously. It does allow for the more efficient use of wood in the manufacture of nominal 2-inch dimension lumber and for some of the inherent inconsistencies in the Scribner scaling system (shown in fig. 2). High recovery percentages in small logs partially offset the effect of less valuable lumber. Tested on the basis of $/MNLS, each log grade group was different from every other grade group; the means and standard deviations are shown in the following tabulation:
Number Log grade group of logs $/MNLS Sx
Grade 1 and 2 26 $864.57 +$245.26 Grade 3 50 $612.26 +$219.36 Grade 5 old growth 472 $446.41 +$195.02 Grade 5 young growth 243 $314.49 _+$128.75
14
-o i- ¢l w 0
== ,=
1000
800
600
4oo
2oo
o 0 5 10 15 20 25 30
Scaling diameter (inches)
Figure 6--The average price of lumber recovered trom graded segments differed with log grade and (except for grades 1 and 2 combined) scaling diameter.
1000.
800-
°
o .
i . 400 -
. .= 200-
o r~
Scaling diameter (inches)
Figure 7--The average price of lumber per thousand board feet of log scale differed with log grade and scaling diameter.
As with $/MLT, there was a great deal of variation associated with log diameter. The change in $/MNLS with diameter, shown in figure 7, is not quite as rapid as the change in $/MLT. Again, this is because the increased board-foot recovery percent from small-diameter logs is offsetting the lower value of the lumber cut from them.
Log grading systemsmA comparison was made between log grades in a six-grade system previously used in the Southwest and the five-grade system (Gaines 1962) used in other areas. There was a small difference between the specifications for grade 3 logs under the two grading systems and no other differences in the grades. When graded under the newer rules, five logs graded under the old rules as grade 5 were upgraded to grade 3. It is our opinion that the lumber grades and values re- covered from these logs fit, more nearly, the values to be expected from grade 3 logs, but there was not enough information for statistical tests.
15
Conclusions
Literature Cited
Difference in old growth and young growthmA large difference was noted in the value of grade 5 logs, which was correlated with their origin from either old- or young-growth trees. Within the sample selected for this study, each grade group was different from every other grade group. Grade 5 young growth was different from grade 5 old growth in average value and in the rate of change in value with increasing log diameter. These differences were significant at the 0.01 probability level and indicated that improved estimates of log value are possible by recognizing this difference.
The changing resource base in Arizona and New Mexico will affect how the resource is used and the values and types of products that can be produced. The use of young-growth ponderosa pine results in different types of products and much lower average lumber values than came from the old-growth pine it is replacing. For the appraisal of timber, recognizing the young growth, as defined in this report, as a separate grade of ponderosa pine will lead to a more accurate evaluation of timber.
The mill where study logs were sawn has been replaced by a more modern mill on the same site. The new mill should produce a higher volume of rough-green lumber, slightly less sawdust, and less chips. How well this green lumber makes it through the kiln and planer may be the real opportunity to improve recovery at this mill. The effect of juvenile wood in young growth used for dimension lumber may be an intract- able problem. The problem is well documented (Arganbright and others 1978, Fahey and others 1986, Markstrom and others 1985), but there has been little progress in solving the problem with young ponderosa pine. Dimension lumber degrades severely when dried and will continue to degrade if it drys further after it is shipped. This is especially true in the arid climate of the Southwest.
Grading ponderosa pine under the Gaines grading rules rather than the existing six-grade rules would have little effect on log grading or appraisal for timber sales. There appears to be a small gain in estimating log values, and it simplifies log grading slightly. The Gaines grades are used everywhere else in the western states. Use of the young-growth classification as a grade will do more to reduce variation in value estimates than will adapting the Gaines log grades.
Scaling logs in cubic product rather than in Scribner board feet allows more accurate and less biased estimates of product recovery. This result is consistent with every other comparison of these two scaling systems.
Arganbright, D.G.; Venturino, J.A.; Gorvad, M. 1978. Warp reduction in young- growth ponderosa pine studs dried by different methods with top-load restraint. Forest Products Journal. 28(8): 47-52.
Bruce, David 1970. Predicting product recovery from logs and trees. Reso Pap. PNW-107. Portland, OR: U.S. Department of Agriculture, Forest Service, Pacific Northwest Forest and Range Experiment Station. 15 p.
Cahill, James M.; Cegelka V.S. 1989. Effects of log defects on lumber recovery. Res. Note PNW-479. Portland, OR: U.S. Department of Agriculture, Forest Service, Pacific Northwest Research Station. 10 p.
Ernst, Susan; Pong, W.Y. 1985. Lumber recovery from ponderosa pine in northern California. Res. Pap. PNW-303. Portland, OR: U.S. Department of Agriculture, Forest Service, Pacific Northwest Research Station. 22 p.
16
Fahey, T.D.; Max, T.A.; Ayer Sachet, J.K. 1986. Factors affecting grade change of ponderosa pine lumber in the desert Southwest. Forest Products Journal. 36(6): 36-40.
Fahey, T.D.; Snellgrove, T.A.; Cahill, J.M.; Max, T.A. 1981. Evaluating scaling systems. Journal of Forestry. 79(11): 745-748.
Fahey, T.D.; Woodfin, R.O., Jr. 1976. The cubics are coming: predicting product recovery from cubic volume. Journal of Forestry. 74(11): 739-743.
Henley, John W.; Hoopes, Jill M. 1967. An electronic computer program for calculating sawlog lumber recovery and value. Portland OR: U.S. Department of Agriculture, Pacific Northwest Forest and Range Experiment Station. 47 p.
Gaines, Edward M. 1962. Improved system for grading ponderosa pine and sugar pine logs in trees. Tech. Pap. 75. Berkeley, CA: U.S. Department of Agriculture, Forest Service, Pacific Southwest Forest and Range Experiment Station. 22 p.
Markstrom, D.; Shuler, C.; King, R. 1985. Warpage of studs from young-growth ponderosa pine from northern New Mexico. Res. Pap. PM-257. Fort Collins, CO: U.S. Department of Agriculture, Forest Service, Rocky Mountain Forest and Range Experiment Station. 13 p.
Pearson, G.A. 1949. Management of ponderosa pine. Agric. Monogr. 6. Fort Collins, CO: U.S. Department of Agriculture, Forest Service, Rocky Mountain Forest and Range Experiment Station.
U.S. Department of Agriculture, Forest Service. 1972. National Forest log scaling handbook. FSH 2409.11 Amend. 5. Washington DC: U.S. Department of Agri- culture, Forest Service.
U.S. Department of Agriculture, Forest Service. 1978. Cubic scaling handbook (a review draft). Washington, DC: U.S. Department of Agriculture, Forest Service.
Voorhies, G. 1971. The cause of warp in young-growth ponderosa pine wood. Arizona Forestry Notes. Flagstaff, AZ: Northern Arizona University. 7 p.
Warren, Debra D. 1990. Production, prices, employment, and trade in northwest forest industries, fourth quarter 1989. Resour. Bull. PNW-RB-174. Portland OR: U.S. Department of Agriculture, Forest Service, Pacific Northwest Research Station. 88 p.
Western Wood Products Association. 1980. WWPA western lumber grading rules. Portland, OR: Western Wood Products Association. 230 p.
17
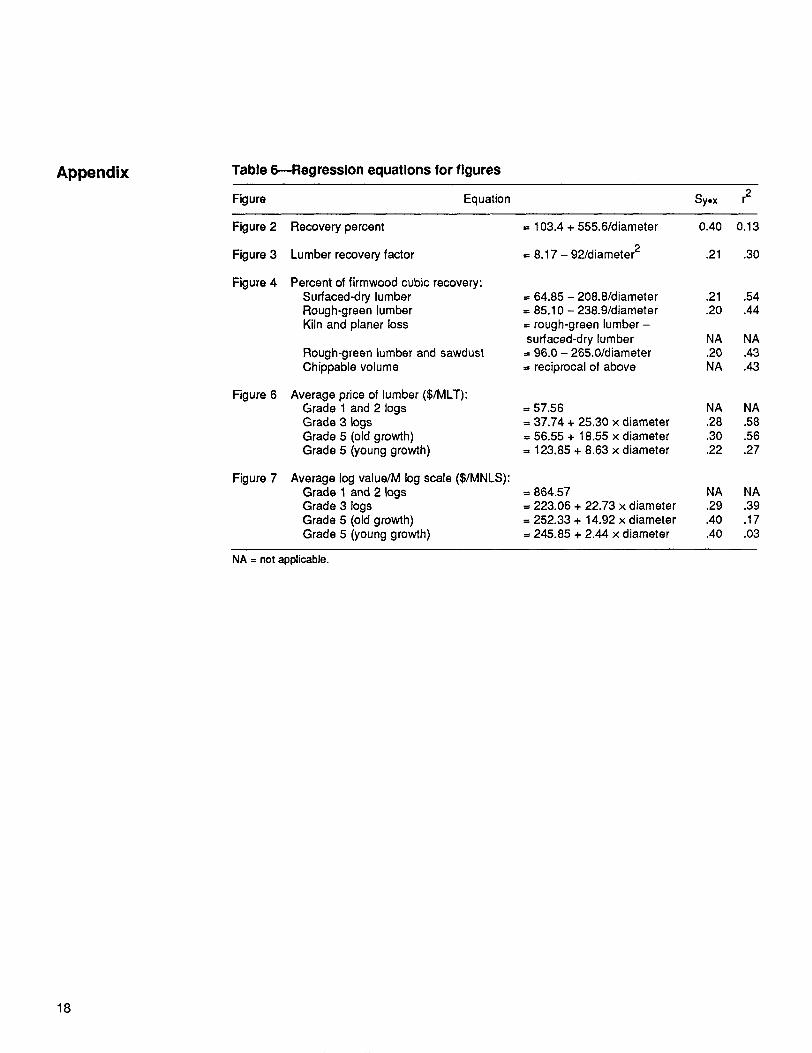
Appendix Table 6--Regression equations for figures
Figure Equation Sy,x r 2
Figure 2 Recovery percent = 103.4 + 555.6/diameter 0.40 0.13
Figure 3 = 8 . 1 7 - 92/diameter 2 .21 .30
Figure 4
Figure 6
Figure 7
Lumber recovery factor
Percent of firmwood cubic recovery: Surfaced-dry lumber Rough-green lumber Kiln and planer loss
Rough-green lumber and sawdust Chippable volume
Average price of lumber ($/MLT): Grade 1 and 2 logs Grade 3 logs Grade 5 (old growth) Grade 5 (young growth)
Average log value/M log scale ($/MNLS): Grade 1 and 2 logs Grade 3 logs Grade 5 (old growth) Grade 5 (young growth)
= 64.85 - 208.8/diameter .21 .54 = 85.10 - 238.9/diameter .20 .44 --- rough-green lumber- surfaced-dry lumber NA NA
= 96.0 - 265.0/diameter .20 .43 = reciprocal of above NA .43
= 57.56 NA NA = 37.74 + 25.30 x diameter .28 .58 = 56.55 + 18.55 x diameter .30 .56 = 123.85 + 8.63 x diameter .22 .27
= 864.57 NA NA = 223.06 + 22.73 x diameter .29 .39 = 252.33 + 14.92 x diameter .40 .17 = 245.85 + 2.44 x diameter .40 .03
N A = not appl icable .
18

Fahey, Thomas D.; Sachet, Janet K. Ayer. 1993. Product recovery of ponderosa pine in Arizona and New Mexico. Res. Pap. PNW-RP-467. Portland, OR: U.S. Department of Agriculture, Forest Service, Pacific Northwest Research Station. 18p.
A mill recovery study of ponderosa pine in Arizona and New Mexico showed wide variation in quality within the resource. Lumber grade ranged widely by log grade and diameter, with a major difference within grade 5 logs between old growth and young growth. Old growth produced mostly Shop and Selects grades of lumber while young growth produced mostly Dimension grades of lumber; small-diameter young growth developed severe problems of warpage. Log grades separated logs into distinct value classes, and separating young-growth timber (as if an additional grade) allowed better segregation of logs by product type and expected value.
Keywords: Product recovery, ponderosa pine, Pinus ponderosa, log grading and scaling, timber valuation.
The United States Department of Agriculture (USDA) Prohibits discrimination in its program on the basis of race, color, national origin, sex, religion, age, disability, political beliefs and marital or familial status. (Not all prohibited bases apply to all programs.) Persons with disabilities who require alternative means for communication of program information (braille, large print, autotape, etc.) should contact the USDA Office of Communications at (202)720-5581 (voice) or (202)720-7808 (TDD).
To file a complaint, write the Secretary of Agriculture, U.S. Department of Agriculture, Washington, DC 20250, or call (202)720-7327 (voice) or (202)720-1127 (TDD). USDA is an equal employment employer.
Pacific Northwest Research Station 333 S.W. First Avenue P.O. Box 3890 Portland, Oregon 97208-3890
*U.S. Government Pdnting Office: 1993 ~ 589-269/00004

U.S. Department ot Agriculture Pacific Northwest Research Station 333 S.W. Rrst Avenue P.O. Box 3890 Portland, OR 97208
Official Business Penality for Private Use, $300
do NOT detach label