w situationusda.mannlib.cornell.edu/usda/ers/cws/1950s/1955/cws-07...cs-1.59 -·-----the - cotton...
TRANSCRIPT

1k FOR RELEASE JULY 27, P.M.
1955
COTTON -- ~ ',fl/--•• '
... _ .. _... w
SITUATION ·;.., r 'G' ::,
,~ .. ,. '! :; I , -'. J'-'- -·
CS-159
--------------~~~------------~ COTTON YIELDS PER ACRE
LBS.
300t----+----+-- Actual yield~
I 250~-~---+----+---
200
1880 1900 1920 1940 1960 $ 9-YEAR MOVING AVERAGE. CEHTEREO, PElt HARVESTED ACRE
U.S. DEPARTMENT OF AGRICULTURE
_The yield of cotton per harvested acre has been increasing steadily since the mid-1920's. The niDe-year, centered, moving average indicates the upward. trend in yields. The trend yield for 1950 was at its highest point on
NEG. 1030•51(., AGRICULTURAL MARKETING SERVICE
record, about 287 pounds per acre. Despite this upward trend, the actual yield in 1954 of 341 pounds was about 40 pounds above a projection of the trend for that year.
UNITfD STATES DEPARTMENT OF AGRICUlTURE
AGRICULTURAL MARKETING SERVICE

Oo\WD 81 tua'U.on at. a Gluae
19S4 I tea • I
: tJa1t : I I t I
19SS
: : April t Mq I June I Apr1J. I MaT I I JlJDI!I '}/
Prices, reoe1ftll b7 ~n ~or .Aa. Uplallll (ldd1Dnth) : CeDts : 31.S7 Paza1. 't7 ]iXr'i.oe ft:IZ* M.. Upl.aM. ••• -••••••••••••••••••••••••• : Cents : 35.09 ..... price .. a pe:l'Uelltep 0~ piiZ'ii;To 0 0 0 0 0 0 0 0 0 0 0. 0 0 0. 0 0: Percent : 90 ATe:np 10 IIJIOt ..at price M1cl411Jr8 15/16 inch ••••••• : Cents : .34.19 A'Te:np price ~or 17 o0118truct10DII1 grrq sooU· ••.....• : Cents : 62.31 A'Te:np price oot.toD ued in 17 coutnaot.ione •••••••••• : Cents : 35.S6 Mill :zrt• ~or 17 00118trllct.10118 ••••••• 51 •6 ...•.....•. : Cents : 26.7S Average spot Jllal'ket price, Middling 1 l iDch : Cents : -BLS who»eale price illllex : :
All aa..ol1t1ea ••••••••••••••.••••••••••••••••••••••• : 1~7-~9. 100 : m.o CottaR~ WU..D soolB•••••••••••••••••••••••••••••I do. : 86.,3
:bde% 0~ inllutrial produotiOD : 1947-49 • 100
: Ot'eral.1 ( ad,Jaa1ie4) • • • • • • • • • • • • • • • • • • • • • • • ._ • • • • • • • • • • • I : 123 !axt.ilee aa4 ProdDcts (una4jUBted) ••••••••••••••••••• : do. : 97
PenoDBl. iaoc.e pe,peDts (adjUsted) •••••••••••••••••••• : Billion dol.lazoa : 284.4 ~nt aton ealea n\ead.Justed and reYiaed) ••• ·····y= Million dol.lazoa : 961
tocks+unfilled o rs, cotton broad woven goods2 : Percent : 65 Mill ocaeUIIption o~ all kiDde of oottOD J/ ............. : 1,000 bales : 6S9.) 11111 CIODIIUII!Ption, ~ rats ••.•.••••••••••••••••••••••• : 1,000 bales : 33.5 lD4e% o~ ap1D4le act.irtv •••••••••••••••••••••••••••••• : 2/ : 125.3 SpiDdles in pl.ace aDd o~ mnth 1D cotton •19tea. ••••••• : 'l'bous&Dd :22,807
B}liDdlee oaa&WiiDS 100 percent cot1;cm •••••••••••••••• : i'housand :19,4S7 , a•092 ar::~~~-ba·~·~;.;~· ~·y: (mif~4l: ~ 'lhousand
Cents 0
BJt»orU ~ oot"ton •••••••••••••••••••••••••••••••••••••• : 1,000 bales Bxporte ~ oottc:. a1DDe Aasaet 1 .•••••• ell ••••••••••••••• s 1,000 balea ~ o~ cottaR •••••••••••••••••••••••••••••••••••••• : Bales ~ o~ ootton ataae Aasaet 1 •••••.••••••••••••••••• : Bales Jllll etoake elll or amt1l ••••••••••••••••••••••••••••••• : 1,000 bales Stoclal, publio ·~• eta ••••••••••••••••••••••••••• 1 1,000 bales
LlllWn pr1ces1/ : ~ 2 •••••••••••••••••••••••••••••••••••••••••••••• : Cents ~ ~ •••••••••••••••••••••••••••••••••••••••••••••• 1 Cents ~ 6 •••.•.•.•.•....••.•..•.•.•.•.•.•••••.....••... & Cents
~oa prioea : Tteooee · ,.-.., 1!50 leatw .............................. : Cents 8~ ~1ber• Yleooee Ji 4eaiar •••••••••••••••••••••• t Oenta .Aoe'ta'te JUQ, 150 cla.S.e ••••••••••••••••••••••••••••• : Cents
he1im1Da.r'y. y End ofmontn-;- J1 Four veek period exc~ as no aDd a,ntbet.ic fibers. U Average price at. Memphis, Dallas and Atlanta.
: 128 0 0
0 422.0 : 2,672.1 1.,163 U61 484 : 1,729.4 : 9,749.4
;y 9.96 : 4.9f : 2.97
0 78 . . 34 0
0 7S 0
32.17 35.09
92 34.42 62.10 35.82 26.28 -
110.9 86.0
125. _9S
286.2 940
52 645.5 32.3
122.6 22,762 19,32S 2,135
129
3.36.1 3,098.2
11,679 128,1.6)
1,586.7 8,997.2
y 9.86 4.71 2.98
78 34 7S
32.31 34.97
92 34.23 62.12 35.62 26.SO -
uo.o 86.1
124 92:
286.5 957
52 lY778.6
)1.8 122.8
22,728 19,332 2,082
128
434.9 3,533.1 8,1.76
136,.340 1,402.3 8,221.4
y 9.22 4.56 2.95
78 34 75
31.93 35.22
91 33.6o 62.94 35.$8 27 • .36 33.38
110.5 88.4
lJ6 10.3 ~
1,016 41
696.4 3S.4
1)6.8 22,280 19,16o 1,6o6
130
239·3 2,176.1
1.6,594 118,403
1,812.8 11,189.4
8.24 4.70 2.64
83 34 8o
31.Sl 31.43 35.22 )5.34
89 89 33.92 33.96 62.74 62.58 36.1S ,36.24 26.59 26 • .34 33.73 )3.84
109.9 88.2
1.38 1.39 IOJ.i. ,301.1
1,000 -70,3-.2 35.2
135.7 22,284 18,302 2,460
3,~:1 ~L'-l23_6
]JO, 96 J..'llJ.6
10,432.2
8.06 4.52 2 • .$4
83 34 8o
1./841.1 :if ~1
8.09 4.SO 2 • .$4
8.3
lJ Eighty-hour week • 100 percent. Cotton, silk
fa I
{;; \0
1\)

cs-1.59
------------- -·-----THE COTTON SITUATION - - -- -- -- --- ~ -- -- -
Approved by the Outlook and Situation Board, July 21, 1955
Acres in cultivation to cotton on July 11 1955 were estimated at 171096,000 about 2.7 raillion below a year earlier and about 6 perc~nt below the national acreage allotment for the 195.5 crop. The acreage in cultivation is the smallest since records began in 1909. The previous low was 17,5JJ,OOO acres in 1945~ The 1954 crop was 1316791000 bales and yield per acre in cultivation v~s JJ6 pounds.
The carryover of cotton on August 1, 19.55 is expected to be more than 11 million bales compared with 9o 7 million a year earlier and will be the largest carryover since the 11.2 million bales of 1945. Disappearance is estimated at 12.4 million bales from the 1954-55 supply of about 23.5 milion bales, This includes estimated domestic mill con• sumption of about a.9 million bales and estimated exports of about 3 • .5 million.
Stocks held by the Commodity Credit Corporation (owned and held as collateral against outstanding loans) totaled about a~2 million bales on July a. This compares with an all time high of 11.4 million bales in April 1939 and the peak stocks for the current season of a. 7 million bales on January 2a. Stocks on July 91 19.54 were 7.1 million bales.
Domestic mill consurnption during the 1955-.56 marketing year is expected to exceed 9 million bales, compared with about a.9 million bales estimated for the 1954-55 season. Information for the 1955-56 season is not sufficient to warrant a more precise estimate at this time. Higher consumer income is e~:pected to result in larger cotton consumption, even though the minimum support price for the 1955 crop is slightly higher than the support price for the 1954 crop and an increase is expected in s,ynthetic fiber consumption. The rate of mill consumption during the first half of the 1954-55 season was very low relative to the last half. It is expected that the rate of mill consumption during the first half of the 1955-56 marketing year will be hit1er than during the first half of the 1954-55 season, but'consumption during the latter half of 1955-56 m~ be close to the last half of 1954-55.
The factors which usually are important in determining cotton exports are foreign beginning stocks which are partly determined by fo~eign consumption in the preceding season, foreign production, and PrJ.ces of cotton.
Stocks of cotton abroad on August 1, 1955 are estimated at around 9.8 million bales, compared ldth about 10 million a year earlier. During 1954-55 foreign consumption will probably approximate 26.5 million bales. Preliminary information on foreign production for 1955-56 indicates an output about a million bales larger than the 23.2 million of 1954-55.

CS-159 - 4 -
Fc:>reign importers have been very reluctant to make forward comnutments for cotton during -the Jlast· sever·al months. As a result, ivorking stocks in most foreign· countrieS- are low. Funds already committed by the U. S. Government for use 1~·1955-56 will finance the export of about 1.3 million bales. With these conditions in mind, same increase in exports seems likel~ ·next year. 'Firmer information on foreign production is needed before a better estimate of exports can be made.
Consumption of cotton in the U. S. in 1954 after adjusting for exports and imports of texti'les was 24.0 pounds per person. This was. about 2.5 pounds smaller than the 1953 figure. The decline was caused by smaller domestic mill consumption, which was also 2.5 pounds per person below 1953.
Prices for cotton in the United States increased during ,May· 'and ~rune, but declined during the first 20 days of July. The average :Price for Middling 15/16 inch cotton at the 14 spot markets during June was 33.& cents per pound. This compares with 33.38 cents in April and 33.73 in May. On July 21 this price was 33.30 cents. Foreign spot market prices for most foreign growths of cotton continued below prices for comparable qualities of .American upland in the U. S. in May and June. This situation has existed for several months.
RECENT DEVELOPMENTS
Acres !.£ Cultivation .QB. July h 1955
Land in cultivation to cotton on July 1, 1955 was estimated at 17,096,000 acres, the smallest acreage for July 1 since records began in 1909. The previous low was 17,533,000 acres in 1945. The July 1, 1955 figure is 94 percent of the 18.2 million acreage allotment for 1955 and 2.7 million acres smaller than the acreage in cultivation a year earlier. The 1954 crop was 13,679,000 bales and yield per acre in cultivation was 336 pounds • 1/
Acreage in cultivation on July 1, 1955 to upland cotton totaled about 17,052,000 acres. This compares with 19,755,000 a year earlier. Acreage in cultivation for American Egyptian cotton increased from 35,700 acres in 1954 to 43,600 in 1955. The na~~~acreage allotment for the 1955 crop of upland cotton was 18,113,000 acres. For American Egyptian it was 43,261.
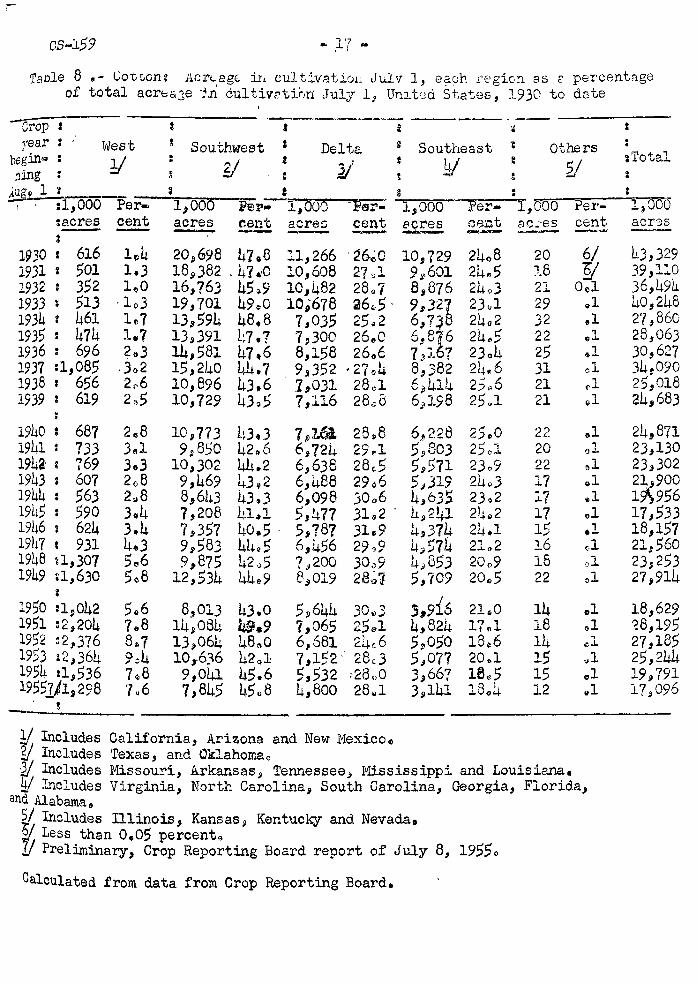
The proportion of the acres in cultivation on July 1 by regions, are shown in table 8. The Western States proportion declined about 0.2 percent £rom 1954 to 1955 and the Southeastern States' proportion declined 0.1 per~ent •. ~h~. Delta. and S~~thweatern States' proportion increased abo~t O.l.and 0.2 percent, respectively.
. . -------1/ Based on acres in cultivat~on on July 1 less acres removed for com~
pliance ~th allotments.
CS-159 - 5 -
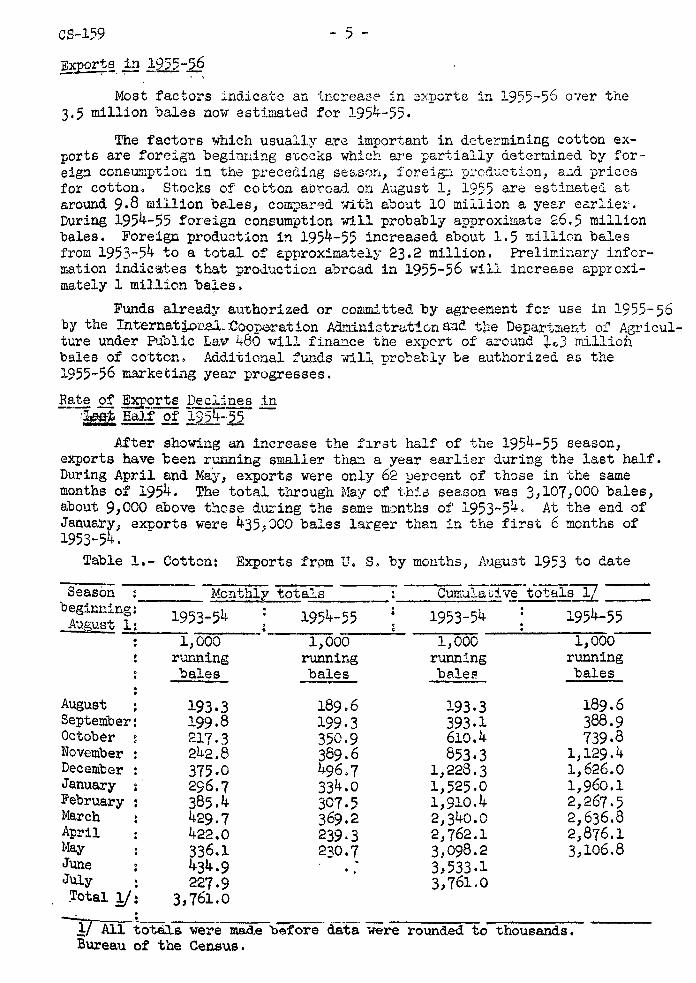
Most factors indice/ce an tnc:-ease in e:x-ports in 1955-56 o7er the 3.5 million "oales now est:l.mated for 1954-55·
The factors which usually are important in deteYmining cotton exports are foreign beginning s-cocks which are partially determined by foreign consump't!.on in the preceding seG.sor.~., :foreig:;. :p;.·od.,~ction, a..1d prices for cotton. Stocks of cotton ab~oa1 on August 1, 1955 are estinatei at around 9.8 million be.les, com~ar~d ·dth a"Jout 10 million a year earlier. During 1954-55 foreign consumption Nill probably approximate 26.5 million bales. Foreign production i~ 1954-55 increased about 1.5 ~illion bales from 1953-54 to a total of approximately 23.2 million. Prelimi~ary information indicates that production abroad in 1955-56 will increase approximately 1 million ba~es.
Funds already au-chorized or committed by agreeoent fer use in 1955-56 by the Internat~Il!U. :Cooperation Adninistrat!on tmC: tne Depart;nent oi' Agricult~e under Public Law 480 will fina~ce the expert of around ~~3 million bales of cotton. Additional ~unds Nil~ pro~ably be authorized as the 1955-56 marketing year progresses.
B11-te of .!E£rprte pecJ.:i~ in r~ Half .£! ~54--55
After showing an increase the flrat half of the 1954-55 season, exports have been running smaller tha~ a year earlier during the last half. During April and May, exports were only 62 ~ercent of those in the same months of 1954. The total through May of th:'.c1 sea.son was 3,107,000 bales, about 9,000 above t~ose during the same months of 1953-54. At the end of January, exports were 435,J00 bales larger than in the first 6 months of 1953-54.
Table 1.- Cotton: Exports !rpm u. S. by mouths, August 1953 to date
Season . MonthlY' totals Cumala'tive-tota.ls 1/ . beginlling: 1953-54 1954-55 1953-54 1954-55 AUf:iUSt 1:
1,000 1,000 1,000 1,000-running running running running 'bales bales ba.leP. bales
August . 193·3 189.6 193·3 189.6 , September: 199.8 199·3 393-1 388.9 October 217.3 350.9 610.4 739.8 November 242.8 389.6 853·3 1,129.4 December 375.0 496.7 1,228.3 1,626.0 January 296.7 334.0 1,525.0 1,960.1 February 385.4 307.5 1,910.4 2,267.5 March 429.7 369.2 2,340.0 2,636.8 April 422.0 239·3 2,762.1 2,876.1 May 336.1 230.7 3,098.2 3,106.8 June 434.9 .. 3,533.1 JUly . 227.9 3, 761.0 . _Total 1/: 3, 761.0 . - l.f All total.s were made before data were rounded to thousands. Bureau of the Census.
CS-159 - 6 ..
Expo:"ts during June and July probably t~el,e smaller than in the same months last year when they were 43.5, 000 and 228 ~ 000 bales., The total for the 1954-55 season is expected to be about 31,)5 million bales compared -vri.th 3o8 million the preceding seasono (See table lo)
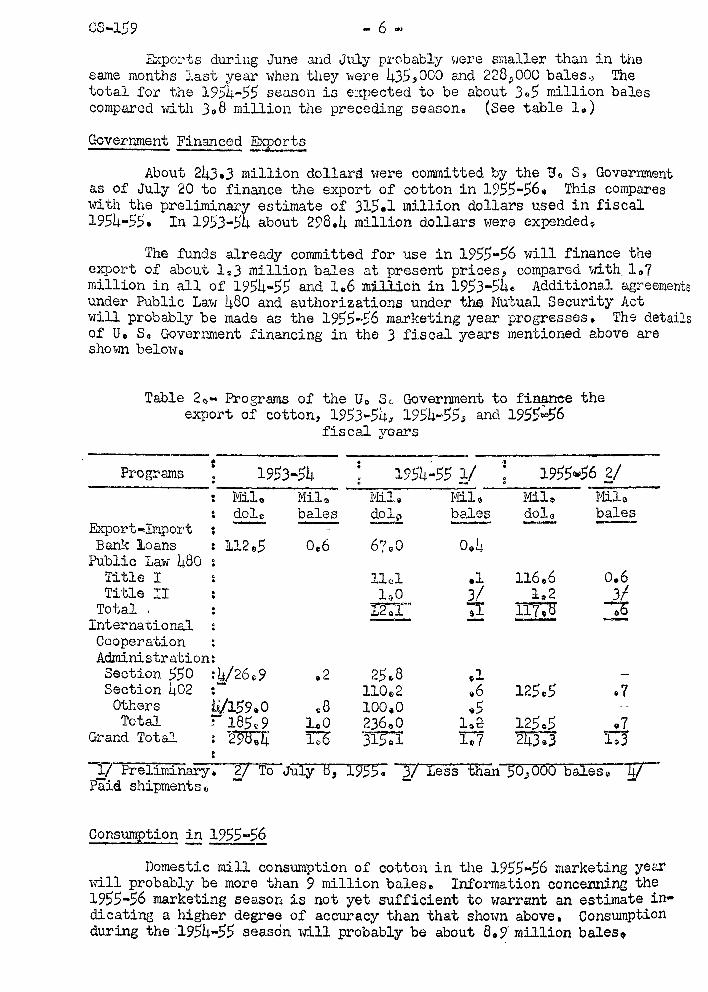
Government Financed Exports
About 243.3 million dollara were committed by the Be S, Gover~~ent as of July 20 to finance the export of cotton in 1955-56. This compares with the preliminary estimate of 315.1 million dollars used in fiscal 1954-55. In 1953-54 about 298.4 million dollars were expendedQ
The funds already committed for use in 195.5-56 will finance the export of about 1$3 million bales at present prices, compared with_ lo7 million in all of 1954-55 and 1.6 :million in 1953-54e Additional agreements under Public Law 480 and authorizations under the Hutual Security Act will probably be made as the 1955 .. 56 marketing year progresses. The details of u. s. Government financing in the 3 fiscal years mentioned above are shown below.
Table 2~· Programs of the Uo s~ Government to finan~e the export of cotton, 1953-54~ 1954~55, and 1955~56
fiscal years
: 1953-54 : 1954-55 ];./
Export-Import
Vlilo : d.olc
Milrb ~Iil, bales 9-.?}2.
Bank loans c 11295 Oe6 6?(10 o.4 Public Law 480
Title I Title :::I
Total , International Cooperation Administration: Section 550 :4/26~9 .2 Section 402 :-
25.8 91 110~2 .6
Others ii/159.0 o8 Total T 185e 9 l.oO
100.0 o5 236oO lo2-
Grand Total 298,4 rob 3l~al 1G7
1955q;56 3,/ -.;__--Mil~ dol(! -
116,6 1:.2
117.8
125c5
125.5 2437.3'
Milo bales
o.6 3/-;o -
1/ Prelilll.inary. J] To July 8, 1935.. '3/ Less than SO., 000 bales"' 4/ Paid shipmentsc - • -
Consumption in 1955-56
Domestic mill consumption of cotton in the 1955·56 marketing year will probably be more than 9 million bales. Information concel!ning the 1955-56 marketing season is not yet sufficient to warrant an estimate in• dicating a higher degree of accuracy than that sho1rm above. Constunption during the-1954-55 season will probably be about 8.9.million bales.

cs ... J.59 - 7 -
The more important factors on which the e~timate of consumption for the 1955~56 season is based are personal disposable income, manmade fiber consumption, the price of cotton, and the level of stocks an~ unfilled orders for broad woven goods at the mill level. Personal dis• posable income has been rising over the past year. If this continues throughout the 1955·~6 cottr:m mar~--:eting year., it would l1ave a t~ndency to increase the consumption of cotton. On the other hand, the ~ncre~se expected in consumption of r~nmade fibers, and the higher support pr~ce for 195S-56 probably will have depressing effects on cotton consumpt~on, Broad lvoven goods mills appear to be in about a normal position with respect to stocks and unfilled orders of cotton textiles. Contracts placed by the military forces for textiles so far indicate that about 25 percent more cotton will be used in such goods than during the past year. For the 9 months ending in 1'Iarch, 1955 such use was running at about 90 thousand bales a year. The net effect of these factors indicates that cotton consumption in 1955-56 probably vdll be slightly higher than in 1954-55.
Cotton consumption during the first half of the 1954-55 season 1vas at a low rate compared with the latter half e It appecr s likely that cotton consumption will be at a higher rate than a year earlier during the first half of 1955-56. During the latter half of the 1955-56 season, the rate may not be greatly different from that of the latter half of 1954-55.
Consumption in the Cur:nent Season-
Mill consumption of cotton in the United States in the first 11 months of the 1954-55 season totaled 8,268.,509 bales. This was 233,871 bales larg~r than during the same period a yecr earlier.
The average daily rate of consumption during these 11 months was J4,80J bales. This compares v-Jith 349033 during the same part of the 1953•54 season. The rate of consumption during August and September 1954 1-vas lo1ver than during the same months- of 1953. HoHever, it 1vas larger in every other month of the 1954-55 season except December when it vras about the same. For April, May and June 1955 the rate of consumption averaged about 2~551 bales a day higher than the same months a year earlier. (See table 3.)
·. From February through July 1954 the monthly rates of consumption showed B:bout a normal seasonal variation. Ho1vevsr, during May and June of 1955.the rate of consumption declined less than seasonally.
~ Net Consumption of Cotton ~n 1954 ·----
In the last issue of The Cotton Situation data on the consumption ?f cotton in the u. s. exc1ud~ng textile eA~orts but including textile llnpo:rts -vrere shov-m. The last year for which data were sho'I-Jl'l lvas 1953, Data for 1954 are now available.

CS-159 "" 8 ...
Table 3 ... Cotton: Average daily rate of consumption, United States, by monthf', Aug~ 1953 to date
--. Year .
Monthly ~~.-"e:r,age Cumt. average. beginning .
1954-55 . 1953-51.J. 1954-55 1953 ... 54 August .,
J.
1$000 1.?000 1,ooo 1,000 running running running running bales bales bales bales
August 36~4 33o4 36.4 33~4 September 36o1 33o3 36$1 33o3 October 35Q2 35.a8 35.S 34@11 November • 35o1 36~1 J5e7 34~~5 • December 32c.2 32ol 34.9 34~0 January 33()9 35.,6 34')3 34 .. 2 February : 34o9 36.,6 34.8 34S -~larch 33o8 35<}7 34~6 34.7 April 33~5 35\)4 34c.5 34.8 Hay 32c.3 35o-2 34o3 34.£3 June 3lo8 34~7 31.~~1 34o8 July 28 .. 5 33 .. 6
-----Bureau of the Census~
}~
' 'rn 1954 net constunption of cotton per person was about 24 pounds compared -vrith 26c5 pounds in 1953f, Domestic mill consumption per person in 1954 Has also about 2~ pounds smaller than in 1953,
·~ports of, cotton textiles in 1954 were about the same as in 1953, equivalent to about 260o4 and 260.,5 million ponnds of cotton, respectively. Imports of cotton textiles in 1954, equivalent to 41.7 million pounds of cotton, 1vere about 3.,5 million pounds larger than in 1953s
Cotton Broad Woven Goods Production
{ l ; 1 \:·'
I'·•
During.'the first quarter of 1955 the production of cotton broad woven goods'ias larger than in any quarter since the second quarter of 1953~ The first quarter of 1955 was also the first since April-June 1953 in which production is above that of a year earlier. Production of £.abrics by category is shown in table 11.
Production of Tire Cord
Production of tire cord, chiefly rayon tire cord and fabrics, during the first quarter of 1955 was larger than in any quarter since the third quarter of 1953. Production of cotton tire cord and fabrics except for chafer fabrics is not being reported separately by the Bureau of the Census. The cotton figures are combined with the figures for nylon tire cord and fabrics to avoid disclosing figures for in• dividual companies. The data on tire cord and fabric production from 1953 through the first quarter of 1955 are shown on page 9e

cs-159 - 9-
Table 4 •- Tire cord and fabrics= Production in United Statesi by quarters, 1953 to date
Calendar ,: Total 11 : Ra year __ ....__,... :;~ : yon
---- : \11:;-:ll'""'i,....o_n_.-.._ r;lilli.,..o_n __
1953
Jan.-Mar. Apre•June July-Sept, Oct,-Dec.
Total !/ 1954
Jan.-Mar. Apr.-June July-Sept. Oct,-Dec,
Total "JJ
1955 Jan.-Mar. 'Y
t E2unds Eounds
•• ' I l.36e2 t 140.8 I 130,7 : 113,0 : 520,6 : : : : 111.5 t 104o5 t 81,2 t 117.1 : 414.3 I : : 127.1 ;
112.2 114.6 1oe.u 93.7
428.9
90.4 79.2 63.0 91.5
324.1
99.4
:Cotton and nylon Millionpounds
8e5 9.8 9.0 7.7
35.0
7.9 12.4
8.9 13 .. 1 42.3
-,ohater fabrics : and others
Mill~on pounds
15.5 16.4 13.3 11.6 56.8
13.2 12.9 9.3 12~5-47.,9
!/. All totals were made before data were rounded to millions. Y Preliminary.
Bureau of the Census~
Cotton used in items Delivered to the Jcfilitary Forces -- ---
Consumption of cotton in items delivered to the military forces is estimated at about 231 000 bales in both the third and fourth quarters of 1954 and at about 201 000 bales during the first quarter in 1955. Reports of deliveries to the military forces of te::tile items cover those items which use about 80 to 90 percent of the cotton consumed by mills for military contracts. The total for each quarter is estimated by divim.ng the amount of cotton estir.1ated from actual reports by 0,85.
Stocks in the u. s. -·--~--
The carryover of cotton on August 1, 1955 is est~nated at about 11.1 million bales. This compares with 9, 7 million a year earlier and will be the largest since the 11.2 million bales on August 1, 1945. Upland steeles on August 1, 1955 are expected to amount to about 10.9 million bales and extra-long staple stocks appro.ximately o. 2 million bllales. On August 1, 19$4, these stocks totaled 9,570,000 bales and
~0, 000 bales.

CS-159 ~ 10 -
Stocks of cotton held ·by CCC (owned and plertged a.s collateral against outstanC.ing loans) amounted to 8. 2 million bales on July 8, about 131 thousand bales of ;v:1:i.ch are extre1.-long stE,ple cotton. This is 500,000 bales below the peak CCC holdir,gs t.h:Ls crop y~e:r of 8,716,000 bales on January 28 and compares wi ~h 8-rL 2-ll ·vi.:" .. \<7! high oi' 11.4 million bales in April 1939. · On July 9, 1954, CCtJ held 7, 0'77 ~::,hvnsa.nd oales of which 96,000 were extra-long staple cot.-~on, CCC ho:dings on Aug,.:.st 1, 1955 w·ill probably total about 8.1 million bales as coillpar(~d to 7,035,000 bales a year earlier,
Stocks of all cotton in consuming establishments amow.ted to about 1.5 million bales on July 2, 1955 c0m:pared with l,l~ million a year earlier, Of this total, mills held about 29,446 bales of extra-long staple cotton, compared ·with 32., 981 bales on the same date last year. Total mill stocks rose from a season's low of 1.0 million bales at the end of August 1954 to a peak of r:.lmost 1.9 million bales at the end of February 1955 and have been declining since. In a.ccord wi .. ~h the usual seasonal pattern, total stocks at mills are expected to decline to about 1.3 million bal~s at the end of July 1955. On ... ru:..y 31, 1954., stocks at mills totaled. about 1.2 mil::..ion bales, The postv,-ar peak fo~ mill stocka of nen.rly 2.4 million bales was att'3.ined at the end of' March 1951; thG postwar low of slightly under 0.7 million was ~eached at the en~ of August 1949.
Stocks of all cotton :!.n public storage and at compresses totaled 9.7 million bales on July 2, :955, about 148.4 thousand bales of which were extra-long staple cotton. Approximately 73 perc~nt of the total stocks and 74 percent of the ex"tre,-long stc.ple stocks at these locations is in Gov-ernment hands. Last year at +,tis -time, 8,2 million bales of cotton, 111,400 'bales of wm.c:!:l consisted 0f extra-long staple cotton, were in public storege and at com:p:·esses, CCC hc.lo.ings represente1 a:t'.Proximately 85 percent of the total on that date O.L"J.d about 56 percent of the extralo~g staple cottou stocks.
Table 5 ohows stocks by locations in the United States at about the end of each month since Augus~ 1~53·
~-Increase
After resting on :price supports in March and April, the average price for Middling 15/16 inch cotton at the 14 spot markets increased during May and June, but declined during the first 20 days of July. The average for June was 33.84 cents compared with 33.73 cer.ts in May and 33.38 cents in April. On July 21, ~he ~rice was 33.30 cents. The average 1954 support pr:!..ce at the 14 spot ma.rlrets f'or this quality cotton is 33.46 cents per pound.

cs-159 -11-
Table 5.• Cotton, all kinds: Stocks, by location: United States, end-of-month, August 1953 to date
Year : ~ ~~--~----~. . . ,eginning: Aug. :Sept. : Oct.: Nov.: Dec.: Jan.: Febo ~ Har.: Apr.: May June :JUly . . . . .ugust 1 : -- :Mil. Mil. Mil.
bales bales
. . ~--·~~~~- ~·~~--~~~~~-Mil. Hil. Mil. Hil. Hil. l1il. Hil. Mil. Mil• :bales bales bales bales bales bales bales bales bales bales :_]j_ 1/ 1/ _]j_ 1/ 1/ 1/ 1/ 1/ 1/ 1/ 1/
19)3 19541/
1953 1954 y
1953 1954}../
1953
• .
. .
Total 2/ -~---
20.7 22.0
19.8 18.7 17.8 16.7 15.7 14.7 13.4 12.4 11.4 10.2 21.0 19.9 18.9 17.6 16.5 15.4 14.3 13.5 12.6
--- __ Consrmng establishiiients -----
1.2 1.3 1.5 1.6 1.7- 1. 7 1.8 1.8 1.7 1.6 1.4 1.0 1.1 1.4 1.6 1.7 1.8 1.9 1.9 1.8 1.7 1~5
--- Public Harehouses and Compresses
3.8 5.9 9.5 11.2 12.0 12.1 11.5 10.6 9.7 9.0 8.-2-8.3 10.9 12.8 13.8 13.9 13.5 12.7 11.9 ll.2 10.4 9.7
------- Els 6_!7here 4/
: 15.7 12.6 7·7 5.0 1.8 1.0 0.9 o.s o.6 3.0 1.} 1954 '}./ : 12.6 9.0 5.8 3.5 2.(111 1.2 0.7 o.6 o.5 o.4 . .
1.2
8.3
0.3
lT"AiiierJ.can-ru run.ning 'bares; foreign cotton in bales of equivalent 500 pounds. Y Includes stocks on farms, intransit and unpicked portion of the crop as
stimated by the Ne1v York Cotton Exchange Service. 3/ Preliminary o
!±/ Includes stocks on 'farms, intransit, unpicked portions of the crop as stimated by the New York Cotton EXchange except stocl;:s at end of season vThich re estimated by the Bureau of the Census.
Bureau of the Census except as noted. All totals were made before data '1ere ounded to millions of bales •
The ~verae;e monthly prices for Nic~dling 15/16 inch cotton at the 10 spot marl::ets from Uarch through June 1955 -v1ere below the averaees of a year earlier. On July 211 1955 the average 10 spot market price of 33.42 cents per pound Has 0.99 cents belm.J that for the same date a year earlier.
In mid-Nay, the average price received by farmers for upland cotton was 31.51 cents per pound or 89 percent of parity; the average of 31.43 cents in mid-June also was 89 percent of parity. Nay marked the first month since Harch 1954 tha:t the price received by farmers dropped below 90 percent of parity. This also was the first month during the current marketing year when the average price recei vcd by farmers uas below that of a year earlier. In 1954, the mid .. lfay price 1vas 32.17 cents and the mid-June price was 32.31 cents.

CS-159 - 12 -
The parity price for upla!:!.d cotton in March and June was 35.34 cents per. poun4,, the highest on record,. 'I'he parity prices for J"anuary, February, April, and May were 35.22 cents, the second hj_ghesta
Support Prices
The minimum sup:9ort price for M:i.ddl ing 7/8 inch cotton from the 1955 crop at average location was annocnced en February 23 at 31.70 cents per pound which was 90 percent of the January 15 parity price. If the parity price in effect on August 1 (that announced for '"Tuly 15) is higher than the January 15 parity price, the support price will be in(!reased accordingly. On June 1 the loan differentials for various qualities of cotton were announced as shown in table 13. The differential between Midd~ing 15/16 inch cotton and Middling 7/8 inch was set at LBO cents per pound. ·This will give a m:l.nimum support price for Middling 15/16 inch at average location of 33.50 celits per pound. The average support price for this quality at average location for the 1954 crcp '>las 33.23 cent;;; per pound.
The minimum supp0rt price for extra-long staple cotton was announced a~ the. same T-ime as that for upland. The minimum for 1955-crop extra-long staple, cotta? is 55,20 cents per pound and reflects 75 percent of the Jan January 15 parity price for extra-long staple cotton of 73.6 cents per pound. Since January 15 the parity price of extra-long staple cotton has declined and on Jur..e 15 was 73.3 cents per pound. The same provisions that apply to a revision of the upland support price also apply to the extra-long staple support price.
On June 1 the Department announced the minimum price for various qualities of extra-long staple cotton ( ta1::.le:::I4 a..n.dJ5). In general, the support prices for American Egyptian cotton were slightly higher than the support prices for Sea Island and Sealand cotton.
Foreign Cott~ Prices
Since March 1955 foreign spot market prices for most foreign growths of cotton have been below U, S~ spot market prices for U. S. upland cotton of comparable quality. In June, for all the foreign growths for which prices are shown belo-w, prices were below the prices· ·for comparable qualities of u. S. upland cotton,
Base Quality for Futures --contracts Changed
Beginnj.ng with March 1956 deliveries on New Orleans and Chicago contracts, and May 1956 on New York contracts all cotton delivered must have a minimum micronaire reading of 3.0. The base quality for trading will be Middling, 15/16 inch as has been the case since 1939, No micronaire reading has been included in the specifications for quality. Middling 1 inch will be the base quality for future contracts for delivery on and after October 1956. In addition, cotton delivered against these contracts must have a micronaire reading of not less than 3.5.

- 13 ...
Table 6 •• Spot prices of specified growths of cotton, including export taxes, May and June 1955 y y
Foreign 1 u. s. eguivaient 3Z • I t Price .
P:r1c:;e Country a . : Quality : Market Quality . Market a per per w : I pound I pound ·:
Cents Cents -. Maz . India :Bombay Broach M 15/16 New
• Vijay, fine 29.45 35.40 inch Orleans . Pakistan :Karachi 289 FSind M 1·1/32 New
• fine 33.23 37.59 inches Orleans . Turkey :Izmir Acala II 46.98 38.41 M 1•1/16 ·New
• inches Orleans . Brazil :$ao Paulo Type S 21 35.40 }'l 15/16 New . inch Orleans • Mexico :Matamoros M 1-1/32 M 1·1/32 New
• ~ohes 21 37o59 inches Orleans . Peru :Lima Tanguis SLM 1-3/16
: type 5 34 .. 27 39.13 iDches Memphis Egypt :Alexandria A.Bhmouni SM l-l/8 . ~ood 41.18 42 .ll inches Me!!!Ehis •
t June India a Bombay Broach M 15/16 - New
' Vijay, fine 29.99 35,30 inch Orleans t Pakistan :Karachi 289 FSind M 1-1/32 New,
t tine ,36.27 31 • 7 5 inches Orleans Turkey aizmir Acala II 21 38.69 M 1-1/16 New
• inches Orleans • Brazil tSao Paulo Type 5 21 35,_30 M 15/16 New
• inch Orleans • Mexic-o :Matamoros M 1-1/32 M 1-1/32 New
:i.nches §/ 1/34.96 31 n75 inches Orleans Peru :Lima TanguJ.S SLM 1-3/16
' ~ 5 36.00 .39g.3~ inches 1'1emphis_
Egypt :Alexandria shmouni SM 1-1/8 good 41. .. 17 43eS9 inches Memphis
: i/ Includes export taxes t·rher~ apr,licable. V !.uotations on net uoi:.~ht basis exct...rt as noted. Jll.et :-It. prJ.ce for u. S • •spot IJl"icc • 0.96, !!./ .. .uality oZ \J • 3.· cotton .. cnerally considered to l-O •.\OEJt ncal"ly co .parable to the .~.·oreign cotton. Zf .-.o quotations •
. · 6/ •>cliv~1·ed at s3rot·~sville. Net weight'price = actual price • '0'.96. , 1/ One q,uctatl.on,

CS-159 - 14 -
Under the new contracts, cotton with a staple length of less than 29/32 inch cannot be delivered. In additiou1· c'o~ton from 29/32 to 1-1/32 inches will be deliverable against :futures 'contracts at full market differentials. Cotton longer than l-l/32·inches will carry the full premium for 1-1/32 inches over 1 inch plus 75 percent of the difference between 1-1/32 and 1-1/16 inch cotton. Under the olC: contract the premium for cotton longer than 1 inch was the full premium for 1 inch plus 50 percent of the di.fference between 1 inch and 1-1/32 inch cotton. ·
Contracts which mature before October 1956 will continue to be traded under the old ~ecifications for grade, st~ple, and quality differentials.
Mill Margins Decline
The mill margin for the amount of gray goods produced. from a pound of cotton (average of 17 constructions) declined during June to 26.31~ cents, this continued the downward trend of the preceding two months from the 1954-55 season's peak of 27.78 cents in Marqh. The June 1955 mill margin co~pares with 26.59 cents in May 1955 and 26.50 cents in June 1954. The decline from May 1955 was caused by a decline in the value of cloth and a rise in the price of cotton" Mill margins from February through May were above those of the corresponding months a year earlier, but June 1955 was 0.16 cent below a year earlier and the average for 1954-55 is expected to be the lowest of the five full seasons since the outbreak of the war in Korea.
The decrease in the value of fabric produced from a pound of cotton in June to 62.58 cents conti~ued the decline which started in Merch. The value was 63.~9 cents in February 1955 and 62.74 'cents, in May. In June 1954, it was 62.12 cents. Fabric value bas been above a year earlier since January ~955. The average price for the qualities of cotton used in manufacture of the 17 constructions in June was 36.24 cents. This was the highest price since September 1954.
Cons~ption of Linters
Consumption of cotton linters from August 1, 1954 through June 1955 was about 113 thousand bales l~rger than during the same ~eriod a year earlier. Cons~ption during the full 1954-55 marketing year will probably approximate 1,450,000 bales. This co~pares with 1,318,000 for the 1953-54 season. Consumption by bleachers and other users during.the current season has been larger than during the ~receding marketing year.
Exports of cotton,linters have been running ahead of a year earlier. From August 1, 1954 through May 1955 e~orts total~d 209,881 bales, compared with 195,164 during the same period a year·' earlier. However, e~orts from February through May l9'i5 of 97,494 bales d were 21,207 bales smaller than during the same period ~fa year earlier· an exports for the entire 1954-55 season are expected to be about the same as the 237,332 bales of 1953-54. 1
I/

CS-159 - 15 -Total disappearance for the 1954-55 season will probably be in the
neighborhood of 1. 7 mill..i.on bales. This is about 0. 2 million larger than during the 1953-54 season. The carryover on August l is estimated at a record of about 1.6 million bales.
Linters Prices Continue to Decline
The United States average price for most grades of linters has shown a sligbt but steady downward tendency the last 3 months. For example, the average price for grade 2 in March was 8.29 cents per pound but in June it was 8.09 cents per pound.- Grade 6 showed a similar tendency, declining from 2.64 cents in April to 2.54 cents in June. The decline is probably associated with the large supply of linters.
~ of CCC Cotton Linter Stocks
On July 8, the Department of Agriculture announced that stocks of cotton linters held by CCC would be offered for sale periodically over a considerable period of time. The sales will be on an offer and acceptance basis.
The release said "by selling on a periodic basis, at prices which ~dll not disrupt the orderly movement of current production, and if necessary spread~g sales over a period of years, the Department will endeavor to avoid undue interference with the flow of 'free' linters in regular channels of trade. At the same time, it will handle its stocks eo as to help insure a continuous supply of linters on the market at competitive prices--to keep linters moving into consumption at maximum rates."
On July 81 CCC had an inventory of about 1.2 million bales of cotton linters acquired from the 1951 through 1954 crops. More than half of this came from the 1952 crop. Synthetic Fibers Production
World production of synthetic fibers during 1954 totaled a record 4, 983 million pqunds. This was equivalent to about ll. 7 million bales of cotton. Approximately 10 percent of the world production were non-cellulosic fibers. Both rayon and acetate and the non-cellulosics hit new record highs of 4,507 and 476 million pounds, respectively. Previous records were set in 1953 when 4,175 million and 387 million pounds were produced.
United States production of the non-cellulosics was a record 346.1 million pounds, or about 73 percent of the world production. For rayon and acetate the United States produced 1,o85.7 million pounds or about 24 percent of the world total. In 1953 the United States produced 1,196.9 million pounds or about 29 percent of the world total of 4,175.0 million. Every foreign country for which records are available, except Greece~showed an increase in synthetic fiber production from 1953 to 1954. This applies to both the non-cellulosic synthetic fibers and to rayon and acetate. Production of rayon and acetate in Greece declined from 4.1 million pounds to 3·7 million.
Production of rayon and acetate in the Un~ted States has been running above a year earlier since the first of 1955. However, production has declined since the peak of 115.1 million pounds in March. In June production of rayon and acetate was 104.0 million pounds. Producers stocks of rayon and acetate have declined steadily since August 1954 when they were 103.3 million pounds. At the end of June 1955 stocks were 163.1 million pounds. -

CS-159 - J.6 ..
Correction
Table 16, page 24 of The Cotton Situati~~ released. May 27, 1955, CS-158, ·was incorrect. The following table is a correction of the above mentioned table.,
Table 7 •• Cotton: Rates of cash payments to e;cporters by CCC, u. s, 1939-52
Period
July 27, 1939- December 5, 1939
December 6, 1939- December 7, 1939
December 8, 1939 - December 11, 1939
December 11, 1939 - January 30, 1940
January 30, 1940
September 29, 1941 • October 22, 1941
October 22, 1941 - January 23, 1942
January 23, 1942 - February 13, 1942
February 13, 1942 - March 13, 1942
March 13, 1942
December 11, 1944 - February 13, 1947
February 13, 1947 - May 8, 1947
May 8$ 1947 - March 3, 1948
l1arch 3, 1948 - June 23, 1948
June 23, 1948 - December 26, 1950
December 26, 1950 - June 30, 1952
June 30, 1952
: s
. .
. . :
. .
:
: : :
I
: I
Rate of subsidy ---,.-----Cents per poun~
1,500
0,750
.400
.200
Discontinued
.300
.200
Discontinued
4.,000
.,125
y.o2o 0
Discontinued
!J Rate was 10 cents per bale ~vhich is calculated to be 0.02 cents per pound for a bale weighing 500 pounds.
.. 1'7 .. ' i
Taole 8 s- Cotwn: ll.crt..,agE.. irL cul t:~vA.tioH Julv l, 8?-9h regic.n as 2 percentage of total acrt:a,je -~-n cul tivetj.(-Jri July 11 Um .. t1.od St,a":,es, 1930 to date
' ·-----,~--- -------- -- ------Crop :
rear : beginao : ;ling
AUgQ 1 :
s t ~ t
West y
~ Southwest : a :
'
Delta
J/ ~ Southeast 1 Others ~ 4/ : - ~ 21 g :
-; :1,000 :acres t
Per ... cent
1,ooo acres
Pe~l'O
eent 1,ooo acre~
·Ji<ercent
1,ooo Per- I,ooo Perecres e~nt ac:es cent
1930 t 616 1931 .501 1932 : 3.52 1933 ; .513 1934 t 461 193.5 ~ 474 1936 : 696 1937 :1,085 1938 656 1939 : 619
1940 : 687 1941 733 194i g 769 1943 : 607 1944 : .563 1945 590 1946 2 624 1947 = 931 1948 tl,307 1949 d,630
i
1950 :1.\)042 1951 :2,204 1952 ~2,376 1953 :2,364 1954 :1~536 1955141$298
!
1\')4 1.3 1.,.0
·lo3 1~7 1.7 2c.3
,3()2 2('6 2~5
2c8 3.,1 3o3 2o8 2~,~8 3o4 3.4 4o3 5to6 5>)8
5.6 7o8 8j)7 9::4 7~8 7o6
- -ll, 266 '26-~0 10,608 27'Jl 10,482 28o7 10~678 26"5' 7,035 25Q2 7,300 26eC 8,158 26oc 9,352 ·27&4 _7,031 28ol ?,116 28<;d
7.l)l6l 28~8 6,?24 29~1 6,638 28~5 6,488 29o6 6,098 .30"6 5,477 31~2 . 5,787 31.9 6,456 29,9 ?J200 30o9 8~019 28~1
5,9644 30.,3 7,065 25el 61 681 24c6 7 ,l.S2 . 28c3 5,532 =28o0 4,800 28.,1
----1 24o8 24.,5 24o3 23ul 24fj2 24 .. 5 23o4 24c6 25"6 2.5-.1
25~0 2.5,1 2)o9 24.-3 23~2 24.,2 24.l 21o2 20o9 20e.5
21.0 17.,1 18~6 20cl 15.,5 1So4
20 J.8 21 29 32 22 25 31 21 21
20 22 17 j_7 17 15 !.6 15 22
14 18 14 15 15 12
~ o~1
,.1 .1 , o.J.
~1 ol cl o1
!/ Includes California, Ari~ona and New Mexico~ !/ Includes Texas, and Oklahomao ·J/ Includes Missou:!'i, Arkansas~ Tennessee, Mississippi and Louisiana, Y Includes Virginia, North Carolina!~ South Carolina, Georgia, Florida,
and Alabama. ~ Includes Illinois, Kansas~ Kentucky and Nevada. ~. Less than 0.05 percentG 7/ Preliminary, Crop Reporting Board report of July 8, 1955o
Calculated from data from Crop Reporting Board.
. . :Total
l~OOO acr3s
43,329 39,ll0 36,49h 40,248 27,860 28,063 30,627 34~090 2.5,018 24,683
24,871 23,,130 23.d02 21,900 19\956 17,533 18,157 21,560 23s253 27J914
18,629 ~8,195 27,18.5 25,244 19!1791 17,096

CS-1;,9 - lli ..
Table.~ 9 .... CottonJ l!.Rtimate of eareagE: J.n cul c.ivatlon July lt Ly ~)tates and United States, average 1944-oSJ, 19;)1+ and 1955
1 10-year : t e a average a I ~ 1955 aabandomen1 I t
STATE I from a Avera~e 1 1954 i I
a natural a 1944- 3 t : Actual
aiercent of 1 caluses r I t 1954 :1945-54__!__ --- ; I • 1. 1.9000 1,ooo 1,000 I Percent acres acres Acr~! Percent --3
North Carolina 8 1$.3 711 551 475 85 South Carolina i o.5 1,074 836 725 87 Georgia s o,a 1,.330 1,039 885 65 Tennessee B ilo4 767 657 580. 88 Alabama I o.6 1,54.3 1,180 1,005 85 Mississippi I 2.3 2,4.35 2,001 1, 7.30 ' 86 Missouri ' .3.2 484 455 395 87 Arkansas ' 2,5 2,018 1$721 l,h75 86 Louisiana 5 1~7 655 698 620 89 Oklahoma a 5.9 1,226 976 845 87 Texas I ).8 8,874 a,o65 7,000 87 New Mexico I 2,5 217 210 186 88 Arizona I G.4 .356 4.30 .355 8.3 California t 9.5 190 896 ?58 85 Other States ?J I .3.1 , 8.3 10 6.3 91 Unit6d States • 2. 7 . 22~16J 1'91 791 111096 86 Other States I
Virginia I .3tl 25e2 18,0 17..5 97 Florida I 1;8 4lo5 · .36.7 32t~7 69 illinois 8 8,.3 .3~7 3o2 2,7 84 Kentucky' I 3tl 12,2 9.6 8,0 82 Nevada I 2/8o!! 0.1 lo9 2,2 116
A.-n. Egypte y- ·-t ~ . . ' Texas t l'~ 14,7 12el! 16~0 132 New Mexico I J,J ?r-/1 6~9 . 8.,3 '• 120 Arizona 1 OtO 16/j,O 16oS 19.;0 115 California t o.o .3 -:-p.,~ Oo) 1$0
Total Am, Egypt~ : 0.9 40.6 .35c7 43'.!6 122 t ~· '\'
y Sums of acreage for 11 other states" rounded to thousands for in• elusion in United States totals. ·
£1. Short-time average, Jl Included in State and United States t.otalso
Crop Reporting Board .

1'abl.e l.O.- Cotton: Export• :rz- the VM.te4 State•, b7 ortapl.e J..ensth end by " COUDtriee or de~t1011, AprU and Ma;r J.955 and aooumul.a:l:.i.ons since Aug. J., J.954 y B
~ COUDtr,y : Apr:!.l 195'L- : Hili l$5 : ~ tot8i s~e Aug,u;, 1954
or I l.-J./8 I l. 1Dch I UDder I I l-J./8 I l inch I UDder 1 l-l.f 1 J. tD 1 UD4er I de8tirlatiOA I illches I to l.-J./8 I l. 1Dch I Total. I 1Dches I to l.-J./8 I l. 1Dch Total I inches I to l.-l/8 1 l 1Dch : Total.
aDd over 1 1Dche8 : : 1 ~ 1 1Dches 1 1 8114 over : 1Dches : : Ruzm1Dg ~ RUi¢iii Ruzm1Dg RWiJilna RUDii1iii Riiilli1Di RlliliiiJii RUDii1iii RlliliiiJii B\iliiiiiii ..E!!!!.._..!!!!!!._~~..E!!!!.......!!!!!!....~~~~~~ ,.
BUR0PB I I '
UJiited ~ 1 1• 71k 14.710 ~~ 745 26,169 1,5hJ. 8,120 3,148 12,809 31,983 204,951 l.Q6,53J. 383,1165 Austria 1 1~9 971 91 11 261 0 125 9 JJ4 1,859 9,808 1,964 -:1.?,631 BeJ.cillll aD4 I.aDUollrg !.) 1 Q ,4,_392 ~- 100 4.492 - _;.: 0 580 100 680 1,432 59,786 1,865 63,08,3 C:r.:echosJ.ovald.a ) I ·-' 0-' 1 . - 0 0 0 0 0 0 0 0 0 0 0 ~It 1 " • 0 1,640 0 1.640 0 539 0 539 0 18,427 JS4 18,581 lire 1 0 0 91 91 0 0 165 165 0 2• 79.3 1,880 4,673 r~ 1 o o o o o 5.336 o 5,336 o 9,378 o 9.378 Prance ~~ 1 21153 201 738 3.310 26.20l 21 607 22,810 1,632 27,049 35,190 309,235 22,709 g/367,828 ~-{Wen) 1 3,945.) 11,606 1,198 16,749 2;~ 5,475 .366 8,307 76,049 237,334 9.425 322,808 Greece 1 0 · 11031 ,. 500 1,531 0 0 381 381 0 2,10.3 1,381 3,484 lflulpry• 1 0 0 0 0 0 0 0 0 0 0 0 0 ltal7 ~ • 1 1,566 J.4,559 1,427 17,552 206 19,180 6,498 25,684 10,844 1721507 28,081 211,432 Betherl&Dd4 1 2,374 2,83& 200 5,412 1,750 760 0 2,510 47,003 411026 1,802 89,6.31 ·~ : ; 1 0 95l 0 951 0 1,050 0 11050 0 10,lll 1,000 ll,lll Polaii48114Darl:r.:1g 1 0 ~ 0 0 0 0 0 0 0 0 0 0 0 Portugal. . 1 0 J.54 . SJ 154 280 20 0 300 280 174 0 454 Spain I 500 308 0 808 0 5,696 901 6,603 9,.)00 92,329 910 102,539 I sWeden 1 0 2,344 685 3,229 0 1'.162 331 2, 763 11584 42,596 4,090 48,270 ~ 811it:r:erlall4 1 100 350 100 550 100 494 100 694 315hJ. 27 I 784 3,056 34,381 'lr1e8te 1 0 0 0 0 0 0 0 0 104 11 214 o 1,318 U. 8. 8. Jl. 1 0 0 0 0 0 0 0 0 0 0 0 0 Yugoslavia · 1 0 5,1'35 4,579 9, 714 , · 0 0 0 0 11143 601 932 22,166 84124J Other 1 0 0 ,.0 0 • 0 0 0 0 0 0 0 0
Total I J.2•5$1 81,727 22,226 ll6.$0!ij B.9@ 72,§37 13•637 9$,224 220,912 1,302,488 247•Cii6f4,77o,go :
m'BER COlJR'lJil88 I
CIUiada I 945 24,795 '216 20,941 4,638 25,195 .10,503 214,915 43,5.30 268,948 Mexico 1 0 0 0 0 0 0 0 0 0 0 Cuba ·: I 0 450 0 700 0 700 103 16,676 1,415 18,194 CoJ.aUia '_; I 0 0 0 0 0 0 586 793 0 1,379 lDd1a I 0 0 400 200 0 600 55,919 21 663 0 58,582 Ch1Da I 0 0 0 0 0 0 0 0 0 0 >Japan I 303. , 39,594 . . 0 31,412 13,119 44,531 4,073 381,004 2211793 606,870 : !f.oDg JtoDg i 50 0 0 0 0 0 300 503 4,913 5, 716 :~rorea 1 0 197 0 93 291 260 291 353 0 310 1381 923 1391 233 Pale8tine «114 Israel. 1 0 2,184 0 11 842 0 11 842 634 14,52gJ 0 15,424 ',Ph1J.1pp1JIAI' lllallds f 303 199 , 0 0 0 0 1,085 4,065 0 5,150 Australia : 210, 2,868 . 857 3,153 0 4,010 5,255 31,700 6,210 43,165 Other •I 292 7 68 0 6 2 11 28 6 8 9 0 110 318 173 636 . Total I 2 2 1 82 2 2
~ I • .
World~ : 14,654 159,699 64,977 2391330 10,423 137,702 82,565 230,690 303,148 2,029,183 774,118~1106,807 .~ I
,- l/ Prel.1m:l.nal71 includes pul:llished r!lvisiona through March F ,410 report!J-• "'!./ Indlides 94 bales of Pima exported to France. "1/ Includes ~ bales of Pima exported to Israel. ' !jf Includes ~ bales of Pima exported to France and ~·
Bureau of the Census.

cs-159 ... 20 ...
= fable ll,• Cotton Broad Woven Goods~ Production by quarters 1 United States, 1951 to date
• I :Towelsia Napped t a Other • Year : t Duck :Sheet- a Print •c 1 d:t~wel ... :fabrics, 1 Fine : woven and :Total : and • in t cloth ; 0 ore ~ · J..."'lg1 t blankets~ tt :fabrics
quarter y :allied : g : yarn : yarn : and : and ;00 ~n : and :fabrics: gj f fao;rics :fabrics: dish : blanket-:fabrJ.cs-: special .. . . : :cloths in~s . ties • • •
: Milt Mil. Milo Mil, Mil\\ Mil, Mile MUe Mil,-:linear linear linear linear linear ~mear linear linear linear yds~ yds, ;yds Q ..1£9:~ yds, fi-s. ~~ yds._ yds,
1951 J'ane-Mar, . 2,883 84 791 1,033 236 139 124 353 124 • J\Pr~-June : 2,661 95 751 965 185 113 112 337 103 July-Sept. 2,273 90 659 836 161 83 99 272 73 Qct,-DecQ 2,319 95 636 874 197 87 74 271 86 )'otal J/ :10,136 363 2,837 3,109 779 422 409 1,23.3 385
1952 Jan,..l'iar~ 2,381 109 645 877 205 98 78 270 99 Apr,.-June 2,275 99 570 878 1~!3 102 79 252 102 J\lly-Sept, 2;314 78 575 893 200 111 75 275 107 Oct.-Dec~ 2,531 80 622 981 224 117 70 .317 120 ~otal dJ ~,515 366 2,417 3,636 827 428 298 1,113 427
1953 : J~n.-Mare : 2,612 77 623 1.1,021 235 120 77 331 128 Apr~-June 2,610 71 651 1,006 227 123 76 330 128 July-Septe : 2,lf24 60 625 927 200 116 73 312 108 Oct.-DecQ : 2,558 58 66.3 1,00th 199 117 65 334 122 Total Jl :10,203 26.3 2,557 3,957 863 475 290 1,307 490
: t954 W=
117 J?Jl,-MarG ~ 2,515 61 642 986 196 116 72 326 Apr.,-June 2,454 55 616 1,008 186 106 66 312 106 July-Sept, 2,302 59 567 944 180 106 59 286 101 Oct.-Dec. : 2,498 62 606 1,007 195 122 62 323 120 Total 9,769 237 2,430 3,945 757 450 259 1,246 444
: 1955 !±/:
Jan-.-Mar. t 2,596 6.3 649 1,018 189 121 68 350 131 '-.
~
!( Totals were made before figures were rounded. S( Includes allied coarse and medium yarn fabrics. ~ Published totals and not summation of quarterly data. !±/ Preliminaryo
Bureau of the Census~

CS-159 - 21 -
Table 12.- CCC stocks of Cotton: United· States, ·1954~55
Upland : Extra-long staple .-- ...,P::.-o-o~1e'"""d::-:--- Collateral :Secre-: :
Date Total; Set--· to pro-: : on loans :tary's: 1953 : 1954 : aside ducers': Owned: 1953 :~1~9=54r-- Total: ac- : crop : crop
:accounts: : crop : crop :count : 1, ooo 1 ,~oo:;::-;o:----::-1, ooo 1, ooo 1, ooo 1, ooo --=1:--,=oo~o:- 1, ooo 1, ooo 1, ooo
! bales bales bales bales bales bales bales bales bales ~ 1954 :
Aug. 1 : 7,035 Aug. 27 : 7,011 Oct . 1 : 7 , 17 8 oct. 29 : 7,409 Nov. 26 : 8, 002 Dec. 3 : 8,184 Dec. 10 : 8,311 Dec. 17 8,413 Dec. 24 8,479 Dec. 31 8, 530 Jan. 7 8,585 Jan. 14 8,670 Jan. 21 : 8, 701 Jan. 28 : 8, 716 ~'eb • 4 : 8, 696 Feb. 11 : 8,677 Feb. 18 : 8,645 Feb •. 25 : 8,610 Mar. 4 ': 8,592 Mar . 11 : 8, 5 59 Mar. 18 : 8,540 Mar. 25 : 8, 540 Apr. 1 : 8, 527 Apr. 8 : 8, 518 Apr. · 15 : 8, 516 Apr. 22 : 8, 518 Apr. 29 8,520 May 6 : 8,529 May 13 : 8,449 May 20 8, 399 May 27 8,359 June 3 8,298 June 10 8, 270 June 17 8,241 June 24 8, 224 July 1 8,203 July 8 8,185 July 15 : JUly 22 :
1,000 1,000 1,000 1,000 1,000 1,000 1,000 1,000 1,000 1,000 1,000 1,000 1,000 1,000 1,000 1,000 1,000 1,000 1,000
'1,000 1,000 1,000 1,000 1,000 1,000 1;000 1,000 1,000 1,000 1,000 1,000 1,000 1,000 1,000 1,000
1,680 5,096 l/68o 5,068 !/806 5,014 l/8o6 4,983 y8o6 4,979 1/806 4,973 I/806 4,969 I/8o6 4r-961 I/8o6 4,956 I/8o6 4,954 I/8o6 4,946 Ij8o6 4,942 I/8o6 4,935 I/806 4,929 I/789 4,921 4/777 4,915 4/769 4,901 4/765 4,892 4/762 4,88o 4/761 '4,869 4/76o 4,863 4/758 4,856 4/753 4,852 4/753 4,845 4/752 4,839 - 752 4,834
752 4,830 4/686 4,822 4/681 4,8o4 Ti/679 4,781 4/679 4,751 Ti/677 4,735 4/676 4,725 4/675 4,718 4/675 4,714 !t/669 4,711
13 208 493
1,113 1,297 1,427 1,533 1,606 1,659 1,712 1,8ol 1,834 1,853 1,836 1,840 1,825 1,811 1,805 1,787 1,780 1,787 1,783 1,782 1,787 1,796 1,803 1,813 1,810 1,783 1,768 1,737 1,727 1,709 1,700 1,683 1,675
6,915 31 7,082 31 7,313 31 7,902 31 8,082 31 8,206 31 8,308 4/30 8,373 - 30 8.421 30 8:472 30 8;553 30 8,582 30 8,594 30 8,571 30 8,550 30 8,517 30 8,481 30 8,462 30 8,429 30 8,410 30 8,410 30 8,397 30 8,387 30 8,385 30 8,387 30 8,389 30 8,395 30 8,318 30 8,268 30 8,228 30 8,167 30 8,139 30 8,110 30 8,093 30 8,072 30 8,054 30
1/ One. million bales in ., set-aside. " gj/ CCC took possession of pooled cotton on October 13, 1954. ~ Less than 500 bales. _/ Cotton has been sold.
Commodity Credit Corporation.
65 65 65 65 65 G5 65 65 65 65 65 65 65 "'c:: o,. 65 65 65 65 65 65
' 65 65 65 65 65 65 65 65 65 65 65 65 65 65 65 65
6 9
10 11 14 18 22 24 27 30· 32 33 34 35 35 35 35 35 36 36 36 36 36 36 36 36 36 36 36 36 36 36

Table 1_3.·- Loan rates: Premiums and discounts for eligible qualities of 1955-crop American Upland cotton (Basis 15/16 -inch Middling)
: Staple ~el?-~th_ in inE,E_es GRADE : : : : : : : 1~ : 1~ : l- : 1.:. : 1- :_ 1 ... - : -l-- :lT and
:13/16: 7/8 :29/32:15/16::31/32~ 1 :1/32 :1/16 ~'J/32 :lLB :5/32 :3/16 :7/32 :1.on~r-: Fts. Pta~ Pts. Pts. Pts. Pts. Pts. Pts. Pts. Pts. Pts. Pts. Pts. Pts~ - ---- - _._..._ - - ~ -- --- ~~ -- _,_.._. -- --
WHITE . . Good Middling :-220 -140 -65 45 90 155 215 260 315 440 645 54,... :;) lOCO 1300 Strict lVIiddling :-235 -155 -75 30 bo ll~S 200 245 300 LJ.S 625 820 1060 1215 Middling :-250 -1b0 -100 Base 45 lOS 160 200 250 350 535 720 950 1155 St.. Low Middling :-400 -325 -250 ... 150 -100 -55 -5 30 70 125 220 310 420 520 Low Middlihg :-605 -545 -h7S -405 -360 -310 -270 -245 -225 -200 -175 -160 -150 ocJ.45 St. Good Ordinary :-7£0 -725 -66o -565 -5h;; -5o5 .. ,480 --470 ...,465 co465 -465 ""L.6S -465 -465 Good Ordinary : -950 -o95 -eho -765 -725 -660 -66o -655 -655 ....655 -655 -655 -655 -655 . .
SPOTTED . . Good Ifuidling :-JcO -310 -235 -155 -105 -60 -1;) 10 35 90 135 175 205 235 Strict Middling :-405 -33J -260 -lCO ·125 -Go -40 ~15 15 4~ 85 130 155 185 Middling :-6oo -5ho -470 -395 -330 -275 -230 -20) -170 -150 -130 -105 -60 -50 St. Low Middling :-775 -720 -6115 -590 -540 -490 -L!55 -455 -455 ~55 ·455 -455 -455 «>455 Low Middling :-960 -910 -655 -780 -740 -'/05 -600 -675 -675 -675 -675 -675 -675 -675
: TINGED " . ·-
Good Yliddling : -'(30 -6~0 -S20 -530 -490 -445 -L.20 -410 ~r 5 -..Ji.. -365 -330 -310 -265 -250 Strict !fiddling ~-760 -·to5 -645 -550 -510 -475 -i.~L~5 --435 -Uo -390 -36o -335 -310 -275 Middling :-915 -L.60 -195 -715 ... 680 -6_30 -605 -555 -595 -595 -555 -595 -595 -595 St. -Low Middl:lng :-llOO -1045 -9EO -910 -L75 ...835 -L15 -010 -&10 -<,10 -t:lO -C10 -810 -510 · Low Middling :-1315 -1260 -1200 -1105 ~1075 -1040 -1020 -1010 ... 1010 ~1010 -1010 ~1010 -1010 ~1010 .
0
YELLOW STAINED . . Good Middling ~1000 -945 -690 ~20 -790 ~755 -7i..t.O -135 •135 •135 -735 -735 -735 -735 St. Middling :-1025 -975 -915 -855 -820 -785 -110 -765 -165 -765 -765 -·(65 -765 -765 Middling :-1220 ~ -1105-1015-985 G960 -9h5 ·940 ... 940 -940 -940 -940 ·9h0 -940 .
(]',. .
~ GRAY .. . I Good Middling :-365 -300 -230 ~150-....105 -65 -20 .... von ·35 It~ 170 215 265. R~ (f) 9 t. Middling :-390 -325 -260 -17'> -130 ~95 -50 --25 10 120 170 205 0
Middling : -SLo ~$ .ohSS -~iS -320 -270 -235 -170 -150 -120 -90 -65 -40 -20 ¢t. _Low Middling :-005 -745 -685 -61.0 -545 -b-90 -l.WS -425 ~425 -425 -L.25 -425 -425 =425
- - -, Coiiimoa:lty Cr~ Corpoeat:z.o:n;;--

cs-159 - 23 -
l 2 3 4 5 6 1 8 9
. ' . Table 14•- American Egyptian Cotton: Minimum loan rates
per pound for 1955-Crop !/ I (Staple Length (Inches)) •-..,---- ---~ ----- I
; 1-3/8 ! 1-7/16 : 1-l/2 and longer
• .Arqoaa 1 New Mpico 1 Arizona 1 New Mexico 1 /aJieood a 1 New Me ico I and I d . I an(! I ..... ~ l Em. I and . 1 Cali• a In 1 . Cali- 1 ta&M.L a Cali· 1 1
c fornia 1 Texas : farnia 1 Texas 1 fornia : Texar 1 Cents Cents Cants Cents Cents Cent~ : : 55.oo
54.oo ~ 52.50 : 48.55 : 43.15 : 37.40 s 33.65 t 29.70 : 25.75 t
55.ua 54.40 52.90 48.95 43.55 37.80 34.05 30.10 26,15
--58.35 57.45 55.85 52.35 46.90 40.75 36.75 32.70 28.70
59.30 58.5o 51.35 53.85 48.25 42.65 38.65 34.30 30.35
y Net weight.
Commodity Credit Corporation
Table 15•• Sea Island and Sealand Cotton: Minimum loan rates per pound for 1955 crop !/
1 (Staple Length (Inche&,) ·Grade • a l-3/8 I l-7/16 ! l-l/2 and longer • I
I Cents Cents Cents -I 1 I 52.70 ss.ss 56.8S 1-1/2 t 5l.8o 54.70 56.65 2 I 50.30 53.15 54.9S 2-l/2 t 46.55 49.80 $1.60 3 • 41.40 b4.60 46.,30 • 3-l/2 • 35.90 38.15 40.95 4 t 32.35 34.90 37.10 4-l/2 I 28.55 31.05 32.95 s I 24,80 27.25 29.20
t
Y New weight,
Coaodity Credi.~ "Corporation,

Table 16o- Prices or cotton in specified £oreign markets, averages 1935-39, 1940-44 and 1945 to date
Ye~ : Egypt : India : Pakistan : Argent~-:--Peru : Brazil : Mexico begin- : Alexandria :Bombay : --Karachi :Buenos Aires: Lima :Sao Paulo:Torreon ning :Ash.molm:i :Karnak :Jaril1a:4 ·F Punjab:289 F Sind:289 F Punjab: Type B :Tanguis : Type 5 :Middling
_A~g. 1: Good : Good . Fine :S. G. Fine:S._ G. Fine:S .. B. Fine : ;Type 5 : :15/16 inch . . Cents Cents Cea1b$ Cents Cents Cents Cents Cents Cents Cents . ---Average : 1935·-39 :tl/12 .54 2/ . 8.31 Y. y 2/ 12.81 10.99 10.33 ll.52 1940-44 :l/18.31 Z/ y 9.90 2/ 2/ 2/ 13.98 12.82 10.73 16.2.1 1945 :4/28&29 5/31.38 16.43 2/ 2/ y 20.43 18.22 17.93 19.41 1946 :~/35.95 - 35.28 16.81 2/ 6/21.19 6/24.02 30.14 24.93 25.88 28.34 l9h7 :- 51.75 63o38 21.411 21 7/25.60 1/28.52 37.53 28 .. 40 28.44 3o.oa 1948 . 1.:.2 .. 10 67 .. 94 23 .. 43 30.14 - 33.54 36.00 46.80 8/31.43 33.05 5/25.2, . 1949 :5/45.96 2/47 .141Q/17.Si 27.87 29.11 30.08 41.03 o/3o.u 32.35 - 25.30 19.50 =- 67.13 82.88 20.17 42.48 44.43 46.96 54.55 ~37.20 58.79 44.61 19.51 :2(50.06 2/79.24 19«80 36.26 37.50 39.09 Y. '/30,.$6 50e29 30.58 1952 : 32.42 39~30 16~53 25.15 27.24 28.59 2/ - .
44o54 27.58 29.32 1953 . 31.56 37.80 19.60 25.79 27 .. 74 28.96 y 29.67 ll/33.78 y . 1954 :
: Aug. 32.89 40.28 19 .. 20 97 .. 23 28"74 29.16 2/ 30.61 12/35.96 2/ ' : Sept. . 36 .. 10 43 .. 35 18.95 27.87 30.09 29.55 2/ 30..57 - 36.16 Y. . Oct. . 36 .. 09 43 .. 31.!. 19~03 29.06 30.16 30 .. 16 21 30.61 37.61 ~
. Nov .. . 35.4J. 42 .. 49 19.16 28 .. 37 30.59 30.34 2/ 30.49 g/36.84 .
~ Dec. . 35.91 43 .. 18 18.89 28 .. 54 30 .. 40 31.61 2/ 30.00 36.84 . Jan~ . 35 .. 91 43 .. 10 17.69 27 .. 55 29..51 30'*51 ~ 30.75 37.68 ?!. 0
Feb. . 35.-78 42 .. 95 16.50 25.74 27.71 28.49 31.17 36.31 Y. . lllfa.r. . )4.99 41.97 16<l13 24.75 26 .. 57 27~28 y 29.76 13/36.96 Y. . Apr. 0 34 .. 6J hL .. 52 15e40 22.97 25.80 26Q22 Y. 29.12 - ?I ~
. }1ay . 35.30 42.35 16.00 23.40 26.30 26.64 2/ 29.45 y .
~ June . 35.29 42.33 15.64 26.)6 29 .. 34 29.65 'Y 30e31 I/ . ,July 7 . .
14: • .
y Price of Ashiilouni, Fully Good Fair. '§ Comparable data not readily availaoie~ Av. for---.J years. 4/ "uotation £or one month. 5_/ Av .. £or 10 months. §/ Av. for 7 months. 7/ Av. for 9 months. 8/ Av. £or 8 months. 2J Av. for ll months. lO/ Ceiling price for Jarilla fine in Bombay since Sept. 1949. ll/ .ExPort prices £or Aug.
1 1953 to date., 12/ Av. of 3 quotations. 13/ One quotation. -Foreign Agricultural Service. Compiled .:from reports of' the State Department and converted to cents per pound
at. cu..rren...t. rates o£ e.x.c~e. as reported by the Fede:ra.l Reserve Board- Based on. p.r.:i.ces o.n. one d.a:v in each ~P-k--


U. S. Department of Agriculture Washington 25, D. C.
OFFICIAL BUSINESS
~B-CS-159-7-55
NOTICE If you no longer need this publication, cheok bere L:::J return this sheet, and your name will be dropped from the mailing list.
If your address should be changed, write the new address on this sheet and return the whole sheet to: Agricultural Marketing Service United States Department of
Agriculture Washington 25, D. c.
Penalty for private use to avoid payment of postage $300