· web view1the stillwater plant is a hybrid plant utilizing both geothermal and solar energy....
TRANSCRIPT
TECHNICAL REPORT
UCED 2017/18-16
Economic Impact Analysis Report:
Fallon Range Training Complex Modernization
UNIVERSITY OF NEVADA, RENO

Economic Impact Analysis Report: Fallon Range Training Complex Modernization
Report Prepared by
Thomas R. Harris
Angelo Sisante
Brian Fogarty
Thomas R. Harris is a Professor in the Department of Economics and Director of the University Center for Economic Development, College of Business at the University of Nevada, Reno.
Angelo Sisante is a Graduate Research Associate in the Department of Economics at UNR
Brian Fogarty is a Graduate Research Associate in the Department of Economics at UNR
University Center for Economic Development
Department of Resource Economics
University of Nevada, Reno
Reno, Nevada
(775) 784-1681
March 2018
Photo from commons.wiki.org
The University of Nevada, Reno is an equal opportunity, affirmative action employer and does not discriminate on the basis of race, color, religion, sex, age, creed, national origin, veteran status, physical or mental disability or sexual orientation in any program or activity it operates. The University of Nevada employs only United States citizens and aliens lawfully authorized to work in the United States.
This publication, Economic Impact Analysis Report: Fallon Range Training Complex Modernization, was published by the University of Nevada Center for Economic Development. Funds for the publication were provided by the United States Navy and ManTech International Corporation. This publication's statements, findings, conclusions, recommendations, and/or data represent solely the findings and views of the author and do not necessarily represent the views of the Western Nevada Development District, the United States Department of Commerce, the Economic Development Administration, University of Nevada, or any reference sources used or quoted by this study. Reference to research projects, programs, books, magazines, or newspaper articles does not imply an endorsement or recommendation by the author unless otherwise stated. Correspondence regarding this document should be sent to:
Thomas R. Harris, Director
University Center for Economic Development
University of Nevada, Reno
Department of Economics
Mail Stop 204
Reno, Nevada 89557
Phone: 775-784-1681
UCED
University of Nevada, Reno
Nevada Cooperative Extension
Department of Resource Economic
Table of Contents
1. Introduction………………………………………………………………………… 1
2. Overview of Study Area………………………………………................................. 2
3. Population and Demographics ………………………………………………........... 3
3.1 Churchill County………………………………………………………………... 3
3.2 Lyon County……………………………………………………………………. 5
3.3 Mineral County…………………………………………………………………. 5
3.4 Nye County……………………………………………………………………... 5
3.5 Pershing County………………………………………………………………… 6
4. Housing……………………………………………………………………………... 6
4.1 Churchill County………………………………………………………………... 7
4.2 Lyon County……………………………………………………………………. 7
4.3 Mineral County…………………………………………………………………. 7
4.4 Nye County……………………………………………………………………... 8
4.5 Pershing County………………………………………………………………… 8
5. Regional Economy 10
5.1 Place of Residence Employment……………………………………………….. 10
5.2 Churchill County……………………………………………………………….. 11
5.3 Lyon County……………………………………………………………………. 11
5.4Mineral County…………………………………………………………………. 12
5.5 Nye County……………………………………………………………………. 12
5.6 Pershing County……………………………………………………………….. 12
5.7 Place of Work Sectoral Employment………………………………………….. 14
5.8 Employment Compensation…………………………………………………… 18
5.9 Payment in Lieu of Taxes……………………………………………………... 21
5.10 Agriculture Sector……………………………………………………………... 22
5.11 Mining Sector…………………………………………………………………. 25
5.12 Geothermal Industry…………………………………………………………... 27
5.13 Recreational Industry and Tourism…………………………………………… 28
6. Methodology……………………………………………………………………….. 29
6.1 Some Basic Concepts of Study Area Economics and Income and Employment
Multipliers………………………………………………………………………….. 30
6.2 Overview of Interindustry Analysis…………………………………………….. 34
6.3 Verification and Validation of Study Area Input-Output Models……………… 35
Results………………………………………………………………………………. 37
7. 7.1 Range Livestock Impacts……………………………………………………….. 38
7.2 Mining Impacts…………………………………………………………………. 44
7.3 Recreational…………………………………………………………………….. 45
7.4 Potential Impacts to Public Sector Revenue……………………………………. 49
8. Conclusions…………………………………………………………………………. 51
9. References…………………………………………………………………………... 53
10. Appendix A…………………………………………………………………………. 58
Figures
Figure 1 Overview of Community Economic System…………………………….. 32
Tables
Table 1 Population Trends in Counties Within the Study Area………………….. 4
Table 2 Housing Trends in Counties Within the Study Area…………………….. 9
Table 3 Housing Trends in Nevada, City of Fallon, and Gabbs…………………. 10
Table 4 Employment Status for Populations in Churchill, Eureka, Lander, and Lyon
Counties (2016)…………………………………………………….
13
Table 5 Employment Status for Populations in Mineral, Nye, Pershing, and Washoe
Counties in 2016………………………………………………...
13
Table 6 Employment Status for Populations in Nevada, the City of Fallon, Gabbs,
and Eureka in 2016………………………………………………
14
Table 7 Employment by Sector in Nevada, Churchill County, Mineral County, Nye
County, Pershing County, Lyon County 2016……………………...
17
Table 8 Total Compensation by Sector Nevada , Churchill County, Mineral County,
Nye County, Pershing County, Lyon County 2016…………….
20
Table 9 Lander Ownership Nevada, Churchill County, Mineral County, Nye County,
Pershing County, Lyon County 2016…………………………...
21
Table 10 Payments in Lieu of Taxes to Churchill County, Mineral County, Nye
County, Pershing County, Lyon County 2016…………………………...
22
Table 11 Overall Agricultural Statistics for Study Area…………………………... 23
Table 12 Alfalfa hay Statistics for Study Area Counties………………………….. 24
Table 13 Cattle and Calves Inventory for Study Area Counties…………………... 25
Table 14 Major Mineral Mines Near the FRTC and the Proposed Expansion Areas, 26
2015……………………………………………………………….
Table 15 Geothermal Power Plants in Study Area, 2015………………………….. 28
Table 16 Total AUM’s, Minimum and Maximum AUM’s Lost, Base Camp
County……………………………………………………………………
39
Table 17 Total AUM’s, Minimum and Maximum AUM’s Lost, Base Camp
County……………………………………………………………………
40
Table 18 Minimum and Maximum Value of AUM’s Lost and Value of AUMs Lost by
Impacted County from FRTC Alternative………………………
41
Table 19 Minimum and Maximum Value of AUMs Lost and Value of AUMs Lost by
Impacted Counties from FRTC Alternative 3…………………...
41
Table 20 Loss in Value of Output for Impacted Areas by Minimum and Maximum
Reductions in AUMs for Alternative 1 and Alternative 3……
42
Table 21 Employment Loss Impacts for Impacted Area by Minimum and Maximum
Loss of AUMs for Alternative 1 and 3……………………….
43
Table 22 Labor Income Losses for Impacted Areas by Minimum and Maximum
Loss of AUMs for Alternative 1 amd Alternative 3……………………...
43
Table 23 Employment, Labor Income, and Value of Output Impacts from Lost
Reasonable Foreseeable Gold Mine Opportunity in Churchill County….
45
Table 24 Employment, Labor Income, and Value of Output Impacts From Lost
Reasonable Foreseeable Geothermal Opportunities in Churchill, Mineral, and
Nye Counties……………………………………………….
47
Table 25 Employment, Labor Income, and Value of Output Impacts from Lost
Hunting Opportunities for Impacted Economies………………………...
48
Table 26 Employment, Labor Income, and Value of Output Impacts from Lost 49
Hunting Opportunities from FRTC for Churchill, Mineral, Pershing, and
Northern Nye Counties
Table 27 Estimated Reductions in Payment in Lieu of Taxes at County Level,
Alternative 1
50
Acronyms
AUM Animal unit months
BLM Bureau of Land Management
DoD Department of Defense
DOE Department of Energy
DOI Department of the Interior
I-O input-output
LEIS Legislative Environmental Impact Statement
NEPA National Environmental Policy Act
OHV off highway vehicle
PILT Payment in Lieu of Taxes
USFWS U.S. Fish and Wildlife Services
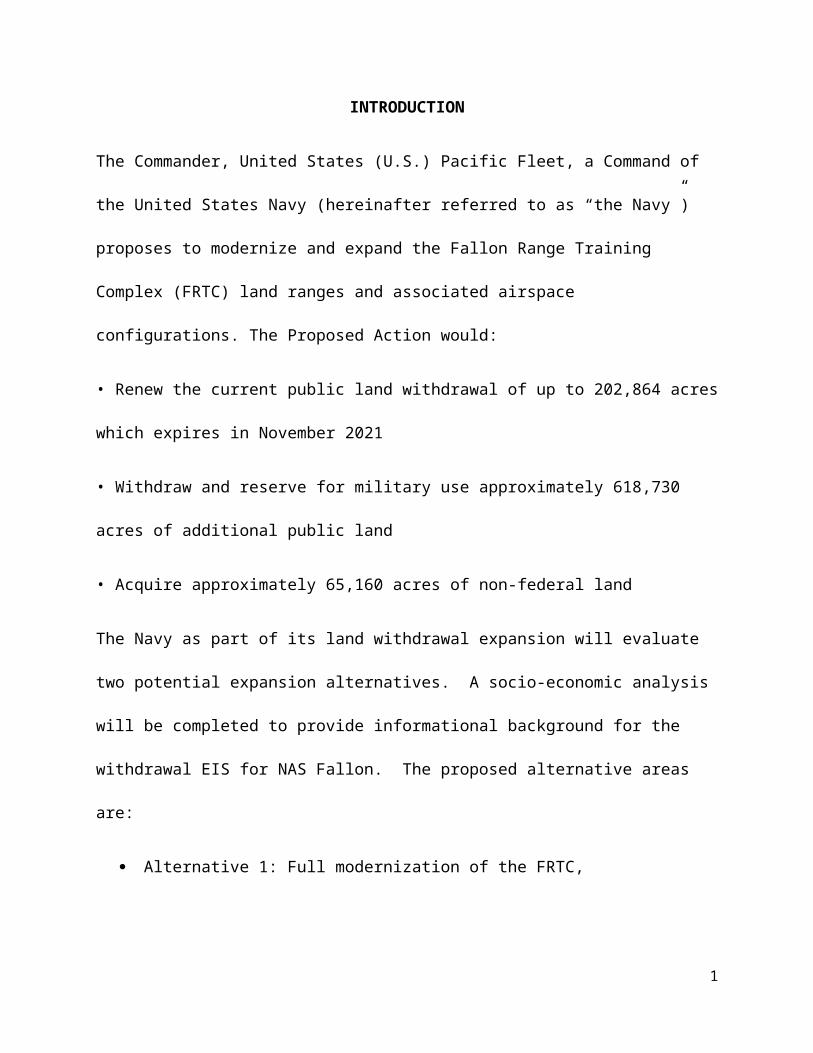
INTRODUCTION
The Commander, United States (U.S.) Pacific Fleet, a Command of the United States Navy
(hereinafter referred to as “the Navy”) proposes to modernize and expand the Fallon Range
Training Complex (FRTC) land ranges and associated airspace configurations. The Proposed
Action would:
• Renew the current public land withdrawal of up to 202,864 acres which expires in November
2021
• Withdraw and reserve for military use approximately 618,730 acres of additional public land
• Acquire approximately 65,160 acres of non-federal land
The Navy as part of its land withdrawal expansion will evaluate two potential expansion
alternatives. A socio-economic analysis will be completed to provide informational background
for the withdrawal EIS for NAS Fallon. The proposed alternative areas are:
Alternative 1: Full modernization of the FRTC,
Alternative 3: Includes all activities and access to land withdrawals described in
Alternative 2 of the EIS but includes a repositioning of withdrawal land around B-17.
If the No Action Alternative of the EIS were selected, neither the land withdrawal renewal or the
new withdrawal and acquisition of land would occur. In this case, the Navy would have to
reevaluate the mission of the FTRC. A reevaluation means all training activities that require use
of aviation or ground range ordnance would likely cease following the expiration of the existing
land withdrawal in November 2021. Some range activities that only require Military Operating
Areas (MOAs), which are independent of the land withdrawal (e.g., non-firing air combat
1
maneuvers, search and rescue, close air support), could still be performed. This possibility will
not be evaluated in this socio-economic impact analysis.
The Economic Impact Assessment study will assess and compare the potential socio-economic
impacts of alternative expansions proposed for the FRTC. The economic impact analysis will
estimate the economic, employment, and labor income impacts of the two alternatives. Because
FRTC is the only location for examination, these impacts will be local to the study area within
the FRTC.
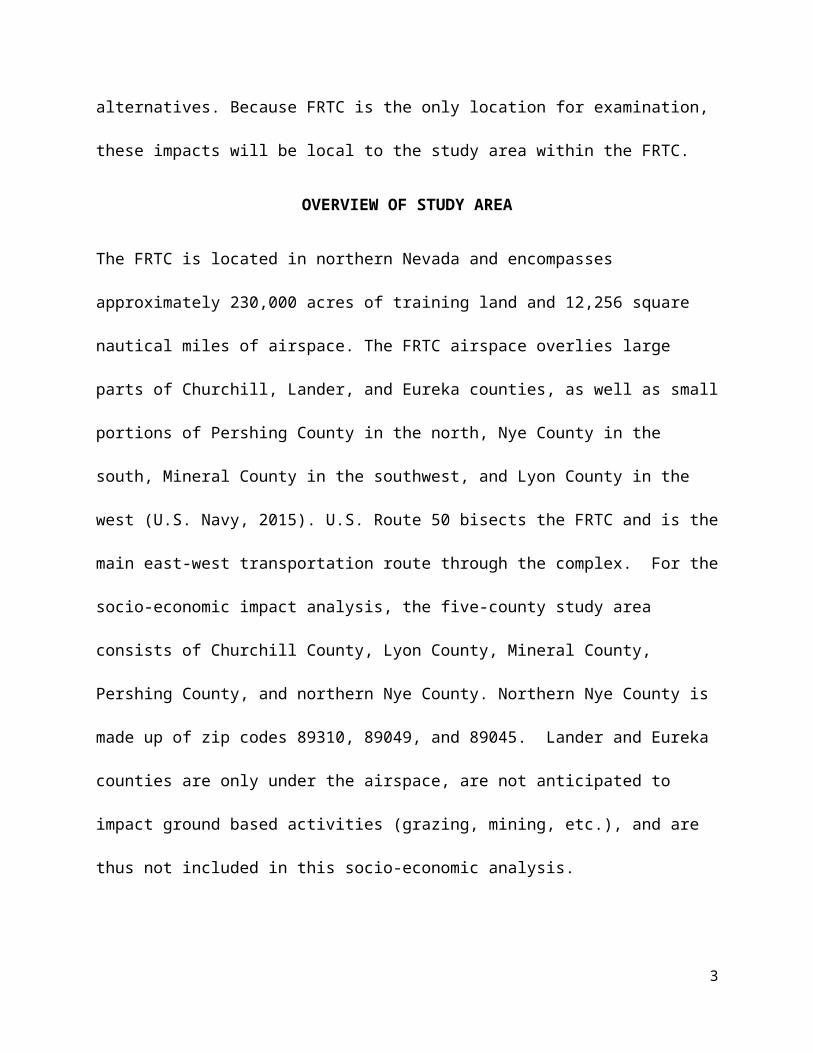
OVERVIEW OF STUDY AREA
The FRTC is located in northern Nevada and encompasses approximately 230,000 acres of
training land and 12,256 square nautical miles of airspace. The FRTC airspace overlies large
parts of Churchill, Lander, and Eureka counties, as well as small portions of Pershing County in
the north, Nye County in the south, Mineral County in the southwest, and Lyon County in the
west (U.S. Navy, 2015). U.S. Route 50 bisects the FRTC and is the main east-west transportation
route through the complex. For the socio-economic impact analysis, the five-county study area
consists of Churchill County, Lyon County, Mineral County, Pershing County, and northern Nye
County. Northern Nye County is made up of zip codes 89310, 89049, and 89045. Lander and
Eureka counties are only under the airspace, are not anticipated to impact ground based activities
(grazing, mining, etc.), and are thus not included in this socio-economic analysis.
The clear majority of the proposed land expansion areas are located in Churchill County. The
expansion area south of B-17 extends into Mineral and Nye counties, the expansion area west of
B-16 extends into Lyon County, and the expansion area north of B-20 extends into Pershing
2

County. For the areas outside of Churchill County, only the socioeconomic resources potentially
affected are discussed.
Fallon, Nevada, is the largest metropolitan area in Churchill County and also serves as the
county seat. The cities of Fernley and Silver Springs, both in Lyon County, are the two largest
nearby cities. Fernley is located approximately 28 miles northwest of Fallon along U.S. Route 50
(Alternate), and Silver Springs is located just under 25 miles to the southwest of Fallon, off of
U.S. Route 50. Outside of the cities, the region is primarily rural and sparsely populated.
Population and Demographics
Table 1 presents population characteristics for the State of Nevada, Churchill County, and the
City of Fallon, Lyon County, Mineral County, Nye County, and Pershing County. The reported
data from U.S. Census in 2000 and 2010 population trends between these two-time series and
projected population growth for 2020 and 2030.
Churchill County
Churchill County is approximately 3,144,320 acres and accounts for approximately 4.4 percent
of Nevada. In 2010, approximately 35 percent of Churchill County’s population resided in the
City of Fallon. Between 2000 and 2010, the population of the City of Fallon grew by 14.2
percent, which was higher than Churchill County’s rate of growth (3.7 percent) but less than
Nevada’s rate of growth (35.1 percent) (Table 1). County population growth is expected to
continue through the year 2030. More specifically, Churchill County’s total population is
expected to increase by nearly 26 percent from 2010 to 2030, while the State’s population is
projected to increase to 3.2 million, which is a slower rate over the same time period (19
percent). Projections of population growth for the City of Fallon to 2020 and 2030 are not
3
available. However, the population was estimated to be 8,410 in 2016 (U.S. Census Bureau,
2016b).
The population associated with Naval Air Station (NAS) Fallon includes approximately 1,450
civilian and military personnel who are permanently stationed on the base (U.S. Department of
the Navy, 2014). In addition, up to 20,000 transient personnel visit the base annually to
participate in training programs at NAS Fallon (Churchill County, 2015).
Table 1. Population Trends in Counties Within the Study Area.
Jurisdiction 20001 20102 Percent Change 2000–2010
2020 Projection3
2030 Projection3
Expected Percent Change
2010–2030
Counties
Churchill County 23,982 24,877 3.7 27,299 31,223 25.5Eureka County 1,651 1,987 20.4 2,015 2,336 17.6Lander County 5,794 5,775 -0.3 5,901 5,181 -10.3Lyon County 34,501 51,980 50.1 55,107 59,919 15.3Mineral County 5,071 4,772 -6.9 3,960 4,277 -10.4Nye County 32,485 43,946 35.3 45,618 48,093 9.4Pershing County 6,693 6,753 0.9 6,794 6,498 -3.8Washoe County 339,486 421,407 24.1 469,422 535,216 27.0CommunitiesCity of Fallon 7,536 8,606 14.2 (X) (X) (X)Gabbs (X) 269 (X) (X) (X) (X)Eureka (X) 610 (X)State
Nevada 1,998,257 2,700,551 35.1 2,959,642 3,222,107 19.3Note: (X) = the estimate is not applicable or data are not available.Sources:1U.S. Census Bureau (2000a, 2000b, 2000c)2U.S. Census Bureau (2010a, 2010b, 2010c)3Nevada State Demographers Office (2014)
4

Lyon County
Lyon County covers approximately 1,290,565 acres and accounts for nearly 1.8 percent of
Nevada’s total surface area. Between 2000 and 2010, the population of the county grew by over
50 percent, which was higher than Nevada’s rate of growth (35.1 percent) for the same time
period (U.S. Census, 2000 and 2010). Population growth in the study area is expected to
continue to increase through the year 2030, though at a lower rate. More specifically, Lyon
County’s total population is expected to increase by 15.3 percent from 2010 to 2030, while the
State’s population is projected to increase to 3.2 million, which is a faster rate over the same time
period (19 percent) (U.S. Census Bureau, 2016b).
Mineral County
Mineral County covers approximately 2,440,281 acres and accounts for nearly 3.45 percent of
Nevada’s total surface area. Between 2000 and 2010, the population of the county shrank by 6.9
percent, which was less than Nevada’s rate of growth (35.1 percent) for the same time period
(U.S. Census, 2000 and 2010). Population growth in the study area is expected to continue
decrease through the year 2030. More specifically, Mineral County’s total population is expected
to drop by nearly 10.4 percent from 2010 to 2030, while the State’s population is projected to
increase to 3.2 million, which is a faster rate over the same time period (19 percent) (U.S. Census
Bureau, 2016b).
Nye County
Nye County covers approximately 11,621,701 acres and accounts for nearly 16.42 percent of
Nevada’s total surface area. It is the third largest county by area in the United States. Between
2000 and 2010, the population of the county increased by 35.3 percent, which is approximately
the same as the State of Nevada’s rate of growth (35.1 percent) for the same time period (U.S.
5
Census, 20000 and 2010). Population growth in the study area is expected to decrease through
the year 2030. More specifically, Nye County’s total population is expected to increase by 9.4
percent from 2010 to 2030, while the State’s population is projected to increase to 3.2 million,
which is a faster rate over the same time period (19 percent) (U.S. Census Bureau, 2015b)
Pershing County
Pershing County covers approximately 3,883,141 acres and accounts for nearly 5.5 percent of
Nevada’s total surface area. Between 2000 and 2010, the population of the county grew by 0.9
percent, which was less than Nevada’s rate of growth (35.1 percent) for the same time period
(U.S. Census, 2000 and 2010). Population growth in the study area is expected to decrease
through the year 2030. More specifically, Pershing County’s total population is expected to drop
by nearly 3.8 percent from 2010 to 2030, while the State’s population is projected to increase to
3.2 million, which is a faster rate over the same time period (19 percent) (U.S. Census Bureau,
2016b).
Housings
Tables 2 and 3 show housing occupancy type and vacancy trends for the counties within the
Study Area and Table 3 presents the housing occupancy for selected cities, and the State of
Nevada from U.S. Census in 2000 and 2010 and estimates from the American Community
Survey in 2015. Between 2000 and 2010, the total number of housing units in the three census
areas increased. The trend continued through 2015 for the State, but a slight decrease of less than
1 percent is estimated for Churchill County and 2 percent for the City of Fallon in 2015 (Table 2
and 3). Overall, the number of housing units increased between 2000 and 2015 in all three census
areas.
6
Churchill County
According to the 2010 census, 10,826 housing units were available in Churchill County in 2010
(Table 2), and 3,979 of those units (or 36.8 percent) were in the City of Fallon (Table 3). The
largest portion of the county’s housing units in 2010 was comprised of single-family detached
units (67.9 percent). Mobile homes accounted for 16.0 percent of the remaining housing stock in
the county (U.S. Census Bureau, 2010b).
The percent of occupied housing units (i.e., occupancy) decreased in the State of Nevada,
Churchill County, and City of Fallon between 2000 and 2016, with a greater decrease occurring
at the state level, where occupancy declined by 4.9 percent over the 16-year time span (U.S.
Census, 2016). Occupancy in Churchill County and the City of Fallon decreased by 2.8 percent
and .8 percent, respectively, between 2000 and 2016.
Lyon County
According to the 2010 census, 22,547 housing units were available in Lyon County in 2010
(Table 2) and 22,427 housing units in 2016, though showing an overall increase in housing units
between 2000 and 2016 of 57 percent. The percent of occupied housing units decreased in Lyon
County by 3.8 percent over the 16-year time span (Table 2) between 2000 and 2016.
Mineral County
According to the 2010 census, 2,830 housing units were available in Mineral County in 2010 and
2,775 housing units available in 2016 (Table 2). Since 2000, there has been a decrease in 3.3
percent of housing units. The percent of occupied housing units decreased in Mineral County by
2.5 percent over the 16-year time span (Table 2)
7
Nye County
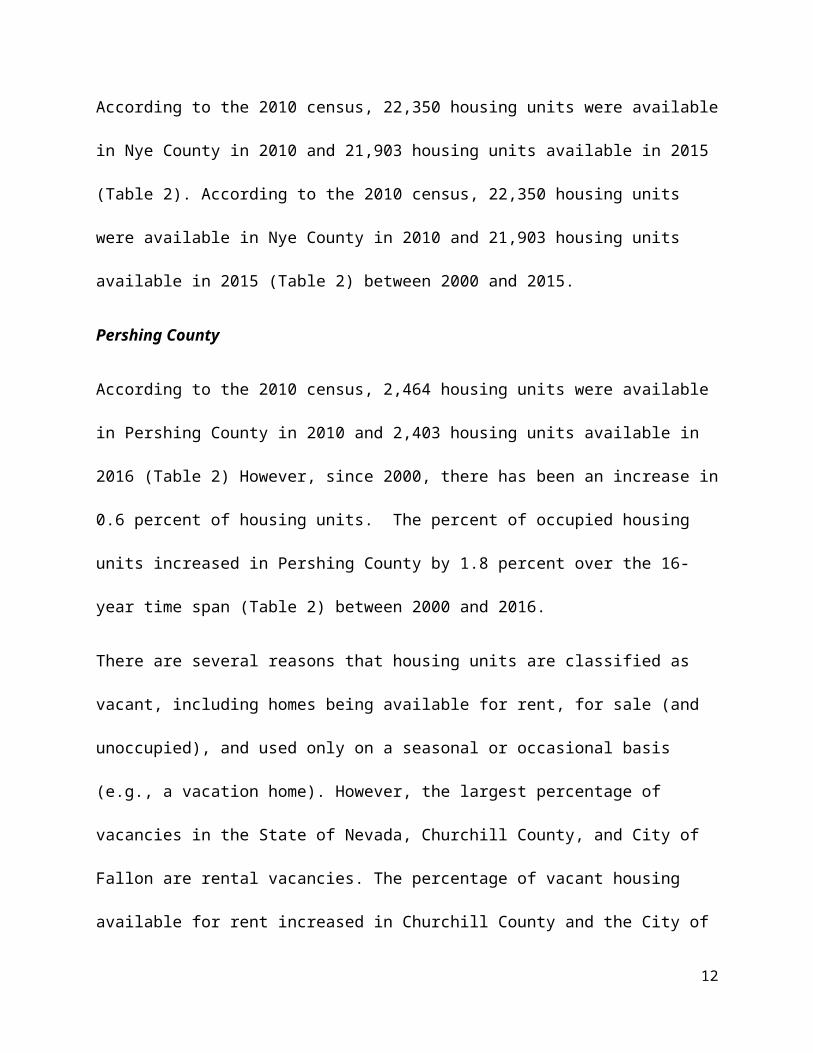
According to the 2010 census, 22,350 housing units were available in Nye County in 2010 and
21,903 housing units available in 2015 (Table 2). According to the 2010 census, 22,350 housing
units were available in Nye County in 2010 and 21,903 housing units available in 2015 (Table 2)
between 2000 and 2015.
Pershing County
According to the 2010 census, 2,464 housing units were available in Pershing County in 2010
and 2,403 housing units available in 2016 (Table 2) However, since 2000, there has been an
increase in 0.6 percent of housing units. The percent of occupied housing units increased in
Pershing County by 1.8 percent over the 16-year time span (Table 2) between 2000 and 2016.
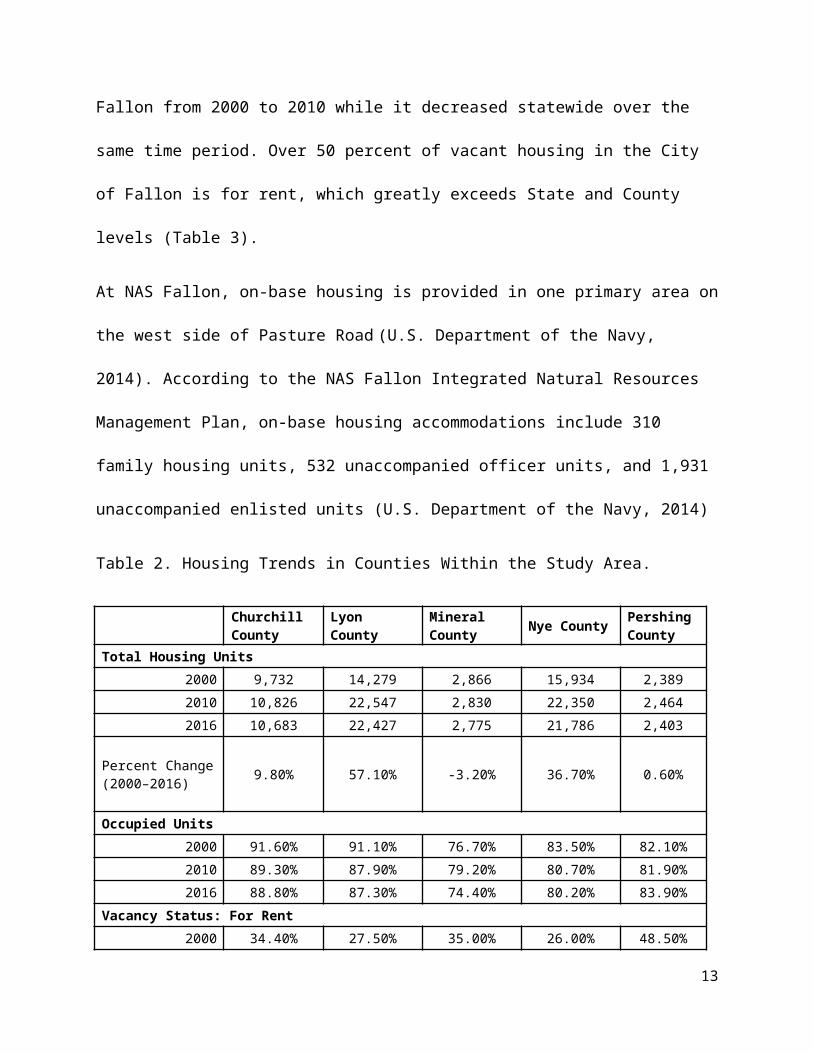
There are several reasons that housing units are classified as vacant, including homes being
available for rent, for sale (and unoccupied), and used only on a seasonal or occasional basis
(e.g., a vacation home). However, the largest percentage of vacancies in the State of Nevada,
Churchill County, and City of Fallon are rental vacancies. The percentage of vacant housing
available for rent increased in Churchill County and the City of Fallon from 2000 to 2010 while
it decreased statewide over the same time period. Over 50 percent of vacant housing in the City
of Fallon is for rent, which greatly exceeds State and County levels (Table 3).
At NAS Fallon, on-base housing is provided in one primary area on the west side of Pasture
Road (U.S. Department of the Navy, 2014). According to the NAS Fallon Integrated Natural
Resources Management Plan, on-base housing accommodations include 310 family housing
units, 532 unaccompanied officer units, and 1,931 unaccompanied enlisted units (U.S.
Department of the Navy, 2014)
8
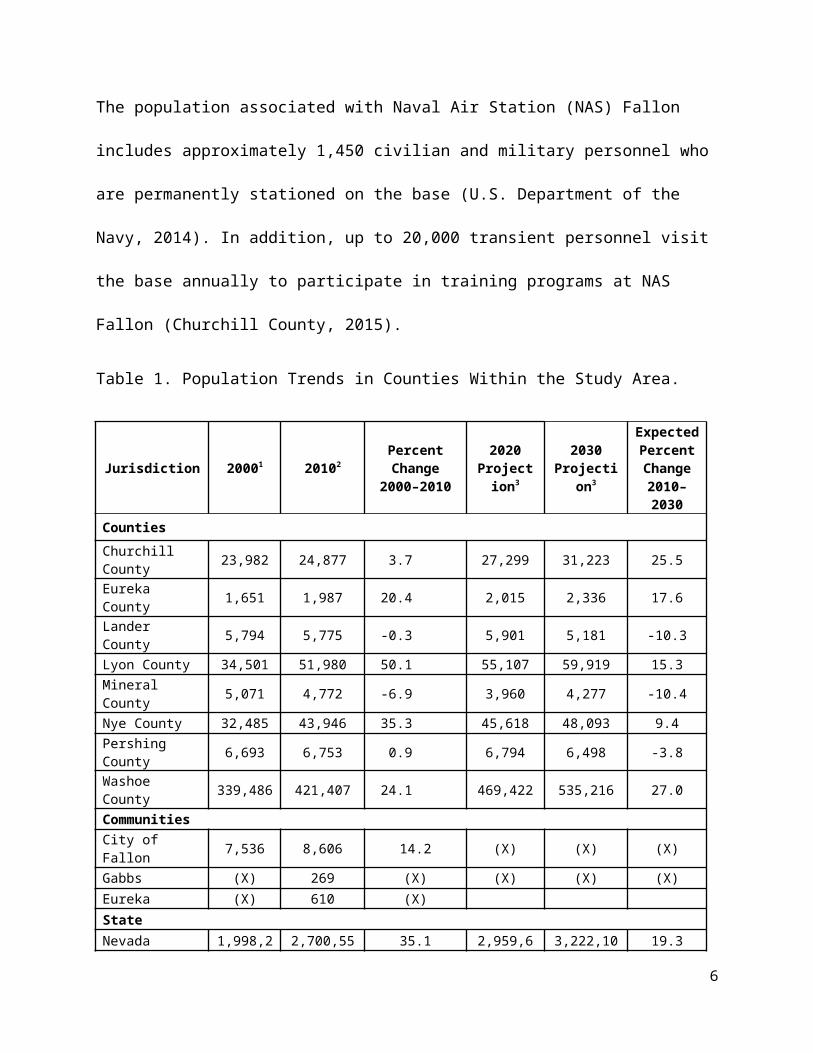
Table 2. Housing Trends in Counties Within the Study Area.
Churchill County Lyon County Mineral
County Nye County Pershing County
Total Housing Units
2000 9,732 14,279 2,866 15,934 2,389
2010 10,826 22,547 2,830 22,350 2,464
2016 10,683 22,427 2,775 21,786 2,403
Percent Change (2000–2016) 9.80% 57.10% -3.20% 36.70% 0.60%
Occupied Units
2000 91.60% 91.10% 76.70% 83.50% 82.10%
2010 89.30% 87.90% 79.20% 80.70% 81.90%
2016 88.80% 87.30% 74.40% 80.20% 83.90%
Vacancy Status: For Rent
2000 34.40% 27.50% 35.00% 26.00% 48.50%
2010 37.40% 23.60% 21.90% 23.20% 31.60%
2016 (X) (X) (X) (X) (X)
Note: (X) = the estimate is not applicable or data are not available.Sources: U.S. Census Bureau (2000a, 2000b, 2000c, 2010a, 2010b, 2010c, 2016e)
9
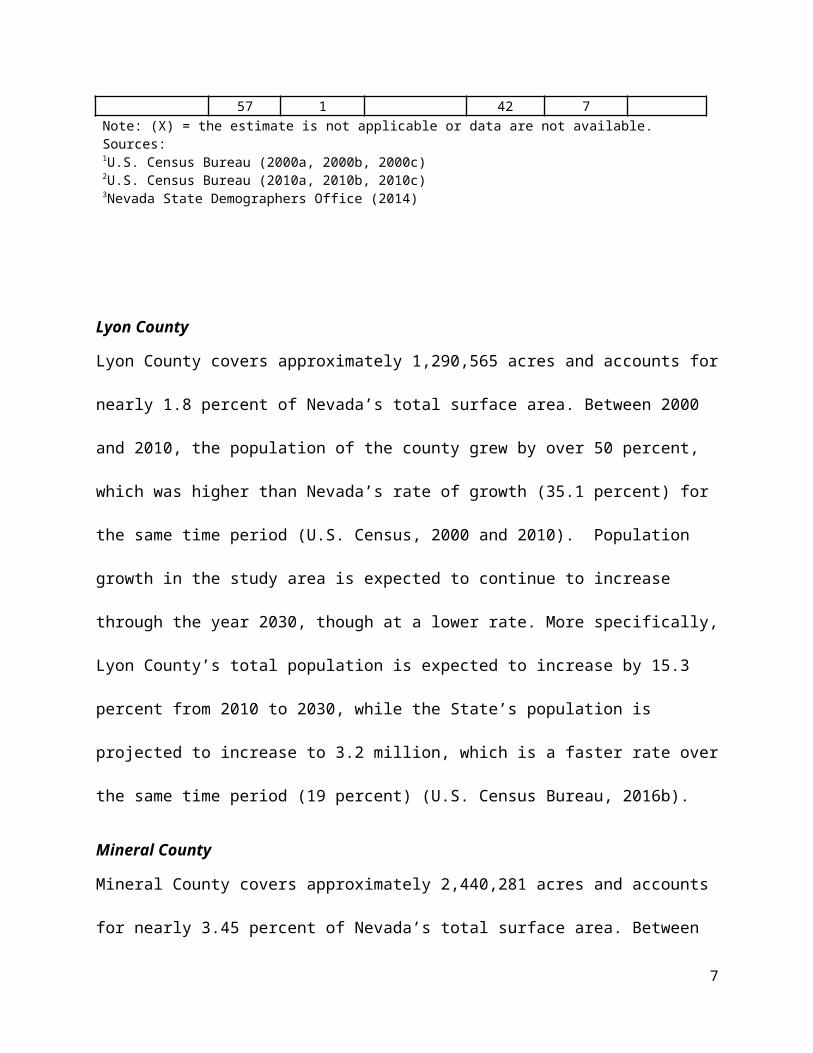
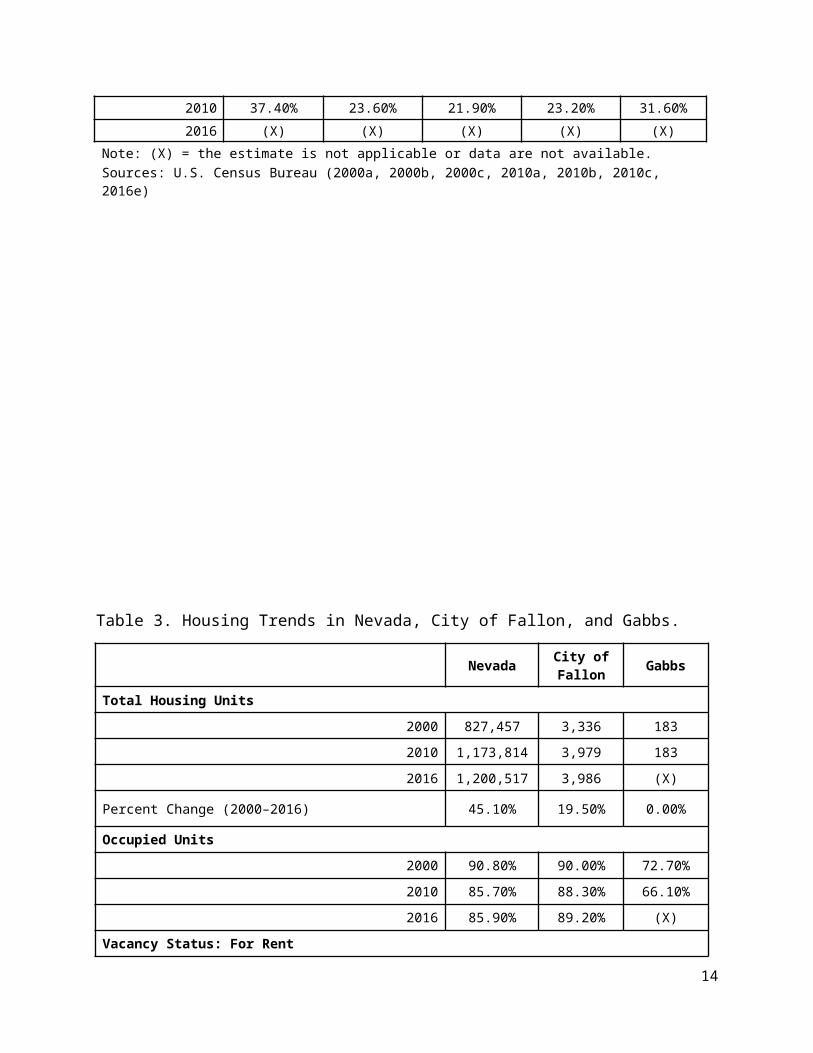
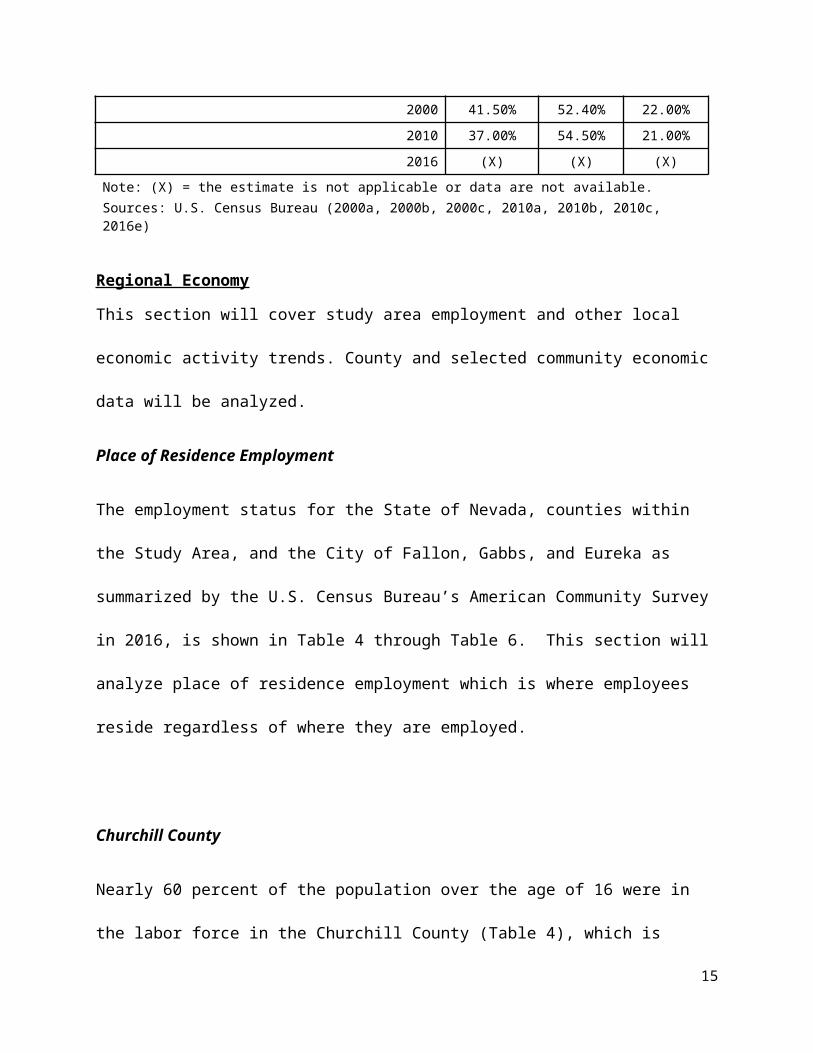
Table 3. Housing Trends in Nevada, City of Fallon, and Gabbs.
Nevada City of Fallon Gabbs
Total Housing Units
2000 827,457 3,336 183
2010 1,173,814 3,979 183
2016 1,200,517 3,986 (X)
Percent Change (2000–2016) 45.10% 19.50% 0.00%
Occupied Units
2000 90.80% 90.00% 72.70%
2010 85.70% 88.30% 66.10%
2016 85.90% 89.20% (X)
Vacancy Status: For Rent
2000 41.50% 52.40% 22.00%
2010 37.00% 54.50% 21.00%
2016 (X) (X) (X)
Note: (X) = the estimate is not applicable or data are not available.
Sources: U.S. Census Bureau (2000a, 2000b, 2000c, 2010a, 2010b, 2010c, 2016e)
Regional Economy
This section will cover study area employment and other local economic activity trends. County
and selected community economic data will be analyzed.
Place of Residence Employment
The employment status for the State of Nevada, counties within the Study Area, and the City of
Fallon, Gabbs, and Eureka as summarized by the U.S. Census Bureau’s American Community
Survey in 2016, is shown in Table 4 through Table 6. This section will analyze place of
residence employment which is where employees reside regardless of where they are employed.
10
Churchill County
Nearly 60 percent of the population over the age of 16 were in the labor force in the Churchill
County (Table 4), which is slightly less than in the City of Fallon and below the State’s rate of
64.2 percent (Table 6). The percentage of the labor force in the Armed Forces in Churchill
County and the City of Fallon greatly exceeded the statewide level (U.S. Census Bureau, 2016a,
2016b, 2016c). The unemployment rate in the State of Nevada was one of the highest in the
nation at 9.3 percent in 2016 (Table 6), 1.9 percent higher than the national average of 8.3
percent (U.S. Census Bureau, 2016f). The average unemployment rates for the City of Fallon
(12.6 percent) and Churchill County (11.7 percent) which were even higher and well above the
state’s unemployment rate.
In 2016, NAS Fallon directly employed 1,423 military and civilian personnel, 99 percent of
whom lived in Churchill, Lyon, or Washoe counties – the region of influence considered in the
Navy’s economic impact study (U.S. Department of the Navy, 2016). Total payroll spending for
these personnel exceeded $84 million. An additional 3,163 jobs indirectly supported by NAS
Fallon in 2015 included jobs related to base operations, payroll, and other spending.
Lyon County
Nearly 55.2 percent of the population over the age of 16 were in the labor force in the Lyon
County (Table 4), which is below the State’s rate of 64.2 percent. The percentage of the labor
force in the Armed Forces in Mineral County is well below the statewide level (U.S. Census
Bureau, 2016a, 2016b, 2016c) with 0.2 percent of the population in the Armed Services. The
average unemployment rate for Lyon County (11.8 percent) was above the state’s unemployment
rate of 9.3 percent.
11
Mineral County
Nearly 55.8 percent of the population over the age of 16 were in the labor force in the Mineral
County (Table 5), which is below the State’s rate of 64.2 percent. The percentage of the labor
force in the Armed Forces in Mineral County is well below the statewide level (U.S. Census
Bureau, 2016a, 2016b, 2016c) with 0.0 percent of the population in the Armed Services. The
average unemployment rate for Mineral County (13.0 percent) was above the state’s
unemployment rate of 9.3 percent.
Nye County
Nearly 46.1 percent of the population over the age of 16 were in the labor force in the Nye
County (Table 5), which is below the State’s rate of 64.2 percent. The percentage of the labor
force in the Armed Forces in Nye County is well below the statewide level (U.S. Census Bureau,
2016a, 2016b, 2016c) with 0.0 percent of the population in the Armed Services. The average
unemployment rate for Nye County (14.1 percent) was above the state’s unemployment rate of
9.3 percent.
Pershing County
Nearly 38.5 percent of the population over the age of 16 were in the labor force in the Pershing
County (Table 5), which is below the State’s rate of 64.2 percent. The percentage of the labor
force in the Armed Forces in Pershing County is well below the statewide level (U.S. Census
Bureau, 2016a, 2016b, 2016c) with 0.0 percent of the population in the Armed Services. The
average unemployment rate for Pershing County (3.5 percent) was below the state’s
unemployment of 9.3 percent.
12
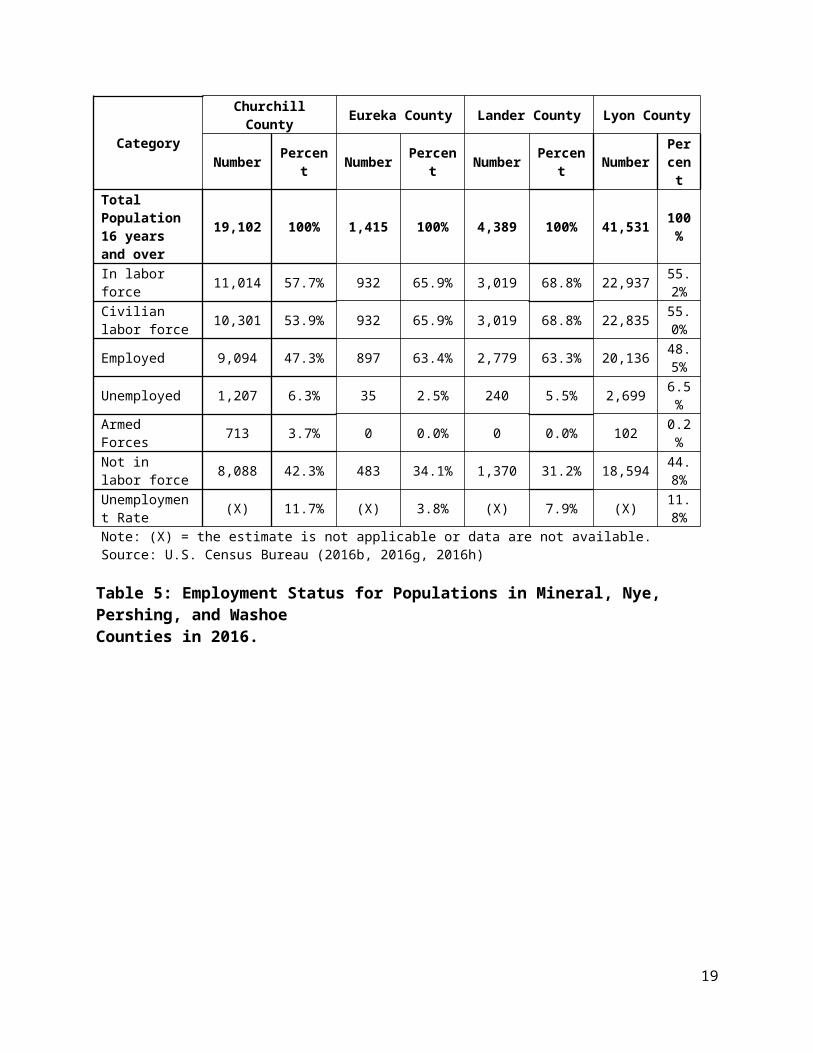
Table 4: Employment Status for Populations in Churchill, Eureka, Lander, and Lyon Counties (2016).
CategoryChurchill County Eureka County Lander County Lyon County
Number Percent Number Percent Number Percent Number Percent
Total Population 16 years and over
19,102 100% 1,415 100% 4,389 100% 41,531 100%
In labor force 11,014 57.7% 932 65.9% 3,019 68.8% 22,937 55.2%
Civilian labor force 10,301 53.9% 932 65.9% 3,019 68.8% 22,835 55.0
%
Employed 9,094 47.3% 897 63.4% 2,779 63.3% 20,136 48.5%
Unemployed 1,207 6.3% 35 2.5% 240 5.5% 2,699 6.5%Armed Forces 713 3.7% 0 0.0% 0 0.0% 102 0.2%Not in labor force 8,088 42.3% 483 34.1% 1,370 31.2% 18,594 44.8
%Unemployment Rate (X) 11.7% (X) 3.8% (X) 7.9% (X) 11.8
%Note: (X) = the estimate is not applicable or data are not available.Source: U.S. Census Bureau (2016b, 2016g, 2016h)
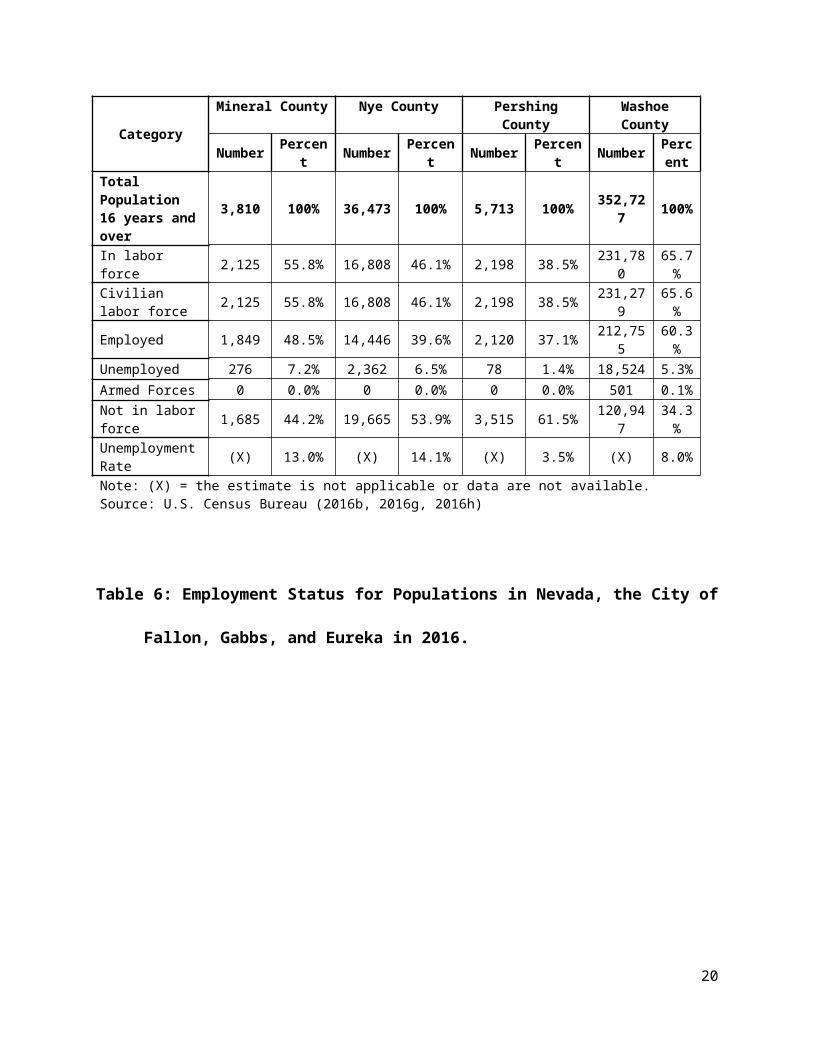
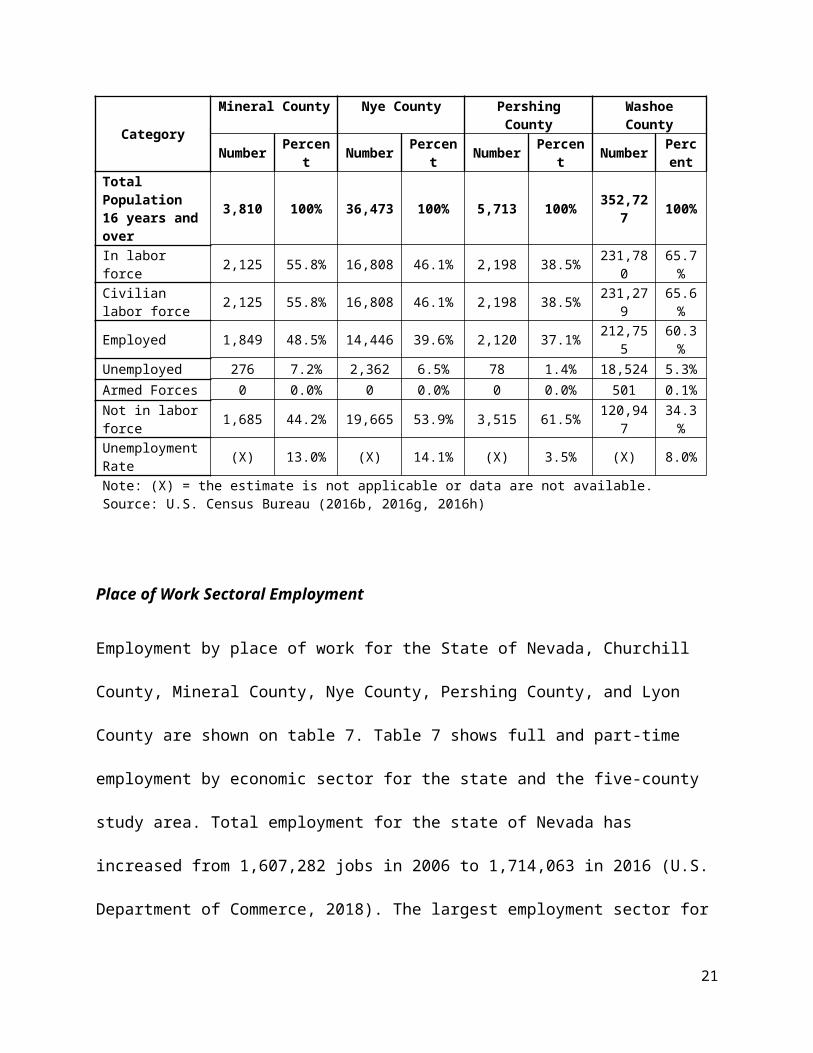
Table 5: Employment Status for Populations in Mineral, Nye, Pershing, and Washoe Counties in 2016.
CategoryMineral County Nye County Pershing County Washoe County
Number Percent Number Percent Number Percent Number Percent
Total Population 16 years and over 3,810 100% 36,473 100% 5,713 100% 352,727 100%
In labor force 2,125 55.8% 16,808 46.1% 2,198 38.5% 231,780 65.7%
Civilian labor force 2,125 55.8% 16,808 46.1% 2,198 38.5% 231,279 65.6%
Employed 1,849 48.5% 14,446 39.6% 2,120 37.1% 212,755 60.3%
Unemployed 276 7.2% 2,362 6.5% 78 1.4% 18,524 5.3%Armed Forces 0 0.0% 0 0.0% 0 0.0% 501 0.1%
Not in labor force 1,685 44.2% 19,665 53.9% 3,515 61.5% 120,947 34.3%
Unemployment Rate (X) 13.0% (X) 14.1% (X) 3.5% (X) 8.0%
Note: (X) = the estimate is not applicable or data are not available.Source: U.S. Census Bureau (2016b, 2016g, 2016h)
13
Table 6: Employment Status for Populations in Nevada, the City of Fallon, Gabbs, and
Eureka in 2016.
CategoryMineral County Nye County Pershing County Washoe County
Number Percent Number Percent Number Percent Number Percent
Total Population 16 years and over 3,810 100% 36,473 100% 5,713 100% 352,727 100%
In labor force 2,125 55.8% 16,808 46.1% 2,198 38.5% 231,780 65.7%Civilian labor force 2,125 55.8% 16,808 46.1% 2,198 38.5% 231,279 65.6%Employed 1,849 48.5% 14,446 39.6% 2,120 37.1% 212,755 60.3%Unemployed 276 7.2% 2,362 6.5% 78 1.4% 18,524 5.3%Armed Forces 0 0.0% 0 0.0% 0 0.0% 501 0.1%Not in labor force 1,685 44.2% 19,665 53.9% 3,515 61.5% 120,947 34.3%Unemployment Rate (X) 13.0% (X) 14.1% (X) 3.5% (X) 8.0%
Note: (X) = the estimate is not applicable or data are not available.Source: U.S. Census Bureau (2016b, 2016g, 2016h)
Place of Work Sectoral Employment
Employment by place of work for the State of Nevada, Churchill County, Mineral County, Nye
County, Pershing County, and Lyon County are shown on table 7. Table 7 shows full and part-
time employment by economic sector for the state and the five-county study area. Total
employment for the state of Nevada has increased from 1,607,282 jobs in 2006 to 1,714,063 in
2016 (U.S. Department of Commerce, 2018). The largest employment sector for the state is the
Accommodations and Food Service Sector, which includes casino hotels. Statewide this sector
makes up 19.02% of total state employment. The Construction Sector was impacted by the Great
recession with a decrease of 44.1% unemployment over the last ten years. Sectors with largest
employment growth over the ten-year period are the Management of Companies and Enterprise
Sector, the Mining, Oil and Gas Extraction Sector, the Educational Services sector and the
14
Health Care and Social Services Sector. Given the aging of the national population and Nevada
being an area targeted for retirement, the growth of the Health Care and Social Assistance Sector
is somewhat anticipated. For the state of Nevada, the Federal Military Sector accounts for 1.05%
of the state’s total employment (Table 7).
For Churchill County, the importance of Fallon NAS to the local economy is seen from Table 7.
For Churchill County 5.68% of the county’s total employment is with the Federal Military
Sector, which is approximately 5.5 times greater than the share at the state level. The
Agricultural Sector is a larger share of the county’s total employment than the state making up
6.80% of total county employment.
For Mineral County, total employment from 2006 to 2016 decreased from 2,321 to 2,137. The
Federal Military Sector only makes up 0.61% of its total employment in 2016. For Nye County,
the number of jobs from 2006 to 2016 decreased from 17,696 to 15,611. The Federal Military
Sector only makes up 0.76% of total Nye County population. Nye County employment is highly
skewed toward Pahrump area, which has seen rapid growth. For the Fallon NAS FTRC analysis,
three northern Nye County zip codes will be included in the analysis.
The number of jobs in Pershing County have decreased slightly from 2,380 in 2006 to 2,363 in
2016. The Agricultural Sector makes up approximately 9.82% of the county’s total employment.
The Mining Sector is an important player in the county making up 24.13% of total county 2016
employment. The Federal Military Sector only makes up 0.55% of Pershing County’s total
employment.
Lyon County was greatly impacted by the Great Recession. With employment in 2006 being
18,157 dropping to 16,088 in 2010 and finally increasing to 16,764 in 2016. Lyon County has
15
become one of the centers for manufacturing employment in the state with 13.70% of total
county 2016 employment in the Manufacturing Sector. The Federal Military Sector only
accounts for 0.86% of total county employment in 2016.
16
17
Employed
% of Total
Employed
% of TotalEm
ployed%
of TotalEm
ployed%
of TotalEm
ployed%
of TotalEm
ployed%
of Total5,664
0.33%
806
6.80%87
4.07%
206
1.32%232
9.82%
816
4.87%1,708,399
99.67%11,051
93.20%
2,050
95.93%15,405
98.68%
2,130
90.18%15,948
95.13%
1,536,496
89.64%8,514
71.81%
1,512
70.75%13,512
86.55%
1,384
58.59%13,643
81.38%
1,614
0.09%(D)
.(D)
.95
0.61%
(D).
192
1.15%19,510
1.14%
137
1.16%(D)
.1,189
7.62%
570
24.13%383
2.28%
4,444
0.26%95
0.80%
(D).
164
1.05%-
0.00%
64
0.38%92,220
5.38%
643
5.42%(D)
.786
5.03%
(D).
1,058
6.31%49,395
2.88%
528
4.45%(D)
.256
1.64%
(D).
2,297
13.70%43,932
2.56%
225
1.90%(D)
.145
0.93%
(D).
325
1.94%175,386
10.23%
1,267
10.69%(D)
.2,063
13.22%
204
8.64%1,848
11.02%
76,256
4.45%709
5.98%
(D).
271
1.74%(D)
.860
5.13%
19,508
1.14%103
0.87%
(D).
150
0.96%(D)
.84
0.50%
85,487
4.99%333
2.81%
(D).
379
2.43%34
1.44%
483
2.88%102,536
5.98%
530
4.47%(D)
.771
4.94%
36
1.52%800
4.77%
96,007
5.60%416
3.51%
28
1.31%1,688
10.81%
54
2.29%778
4.64%
29,091
1.70%(D)
.(D)
.41
0.26%
(D).
74
0.44%123,207
7.19%
487
4.11%(D)
.981
6.28%
(D).
713
4.25%17,099
1.00%
73
0.62%(L)
.245
1.57%
(D).
(D).
135,339
7.90%1,005
8.48%
29
1.36%899
5.76%
(D).
(D).
53,284
3.11%482
4.07%
(D).
720
4.61%(D)
.919
5.48%
325,961
19.02%728
6.14%
(D).
1,648
10.56%(D)
.909
5.42%
86,220
5.03%637
5.37%
66
3.09%1,021
6.54%
81
3.43%1,105
6.59%
171,903
10.03%2,537
21.40%
538
25.18%1,893
12.13%
746
31.58%2,305
13.75%
18,935
1.10%601
5.07%
61
2.85%124
0.79%
17
0.72%73
0.44%
17,920
1.05%673
5.68%
13
0.61%118
0.76%
13
0.55%145
0.86%
135,048
7.88%1,263
10.65%
464
21.71%1,651
10.58%
716
30.31%2,087
12.45%
36,178
2.11%131
1.10%
10
0.47%196
1.26%
(D).
89
0.53%98,870
5.77%
1,132
9.55%454
21.24%
1,455
9.32%(D)
.1,998
11.92%
Military
State and local State governm
ent Local governm
ent
Health care and Arts, Accom
modation
Other services
Government and
Federal, civilian
Finance and Real estate and Professional, M
anagement of
Administrative
Education
Construction M
anufacturing W
holesale trade Retail trade Transportation Inform
ation
Farm em
ployment
Nonfarm
Private nonfarm
Forestry, fishing, M
ining, Utilities
Table 7. Employm
ent by Sector in Nevada, Churchill County, M
ineral County, Nye County, Pershing County, and Lyon County, 2016
CategoryN
evadaChurchill
Mineral
Nye
PershingLyon
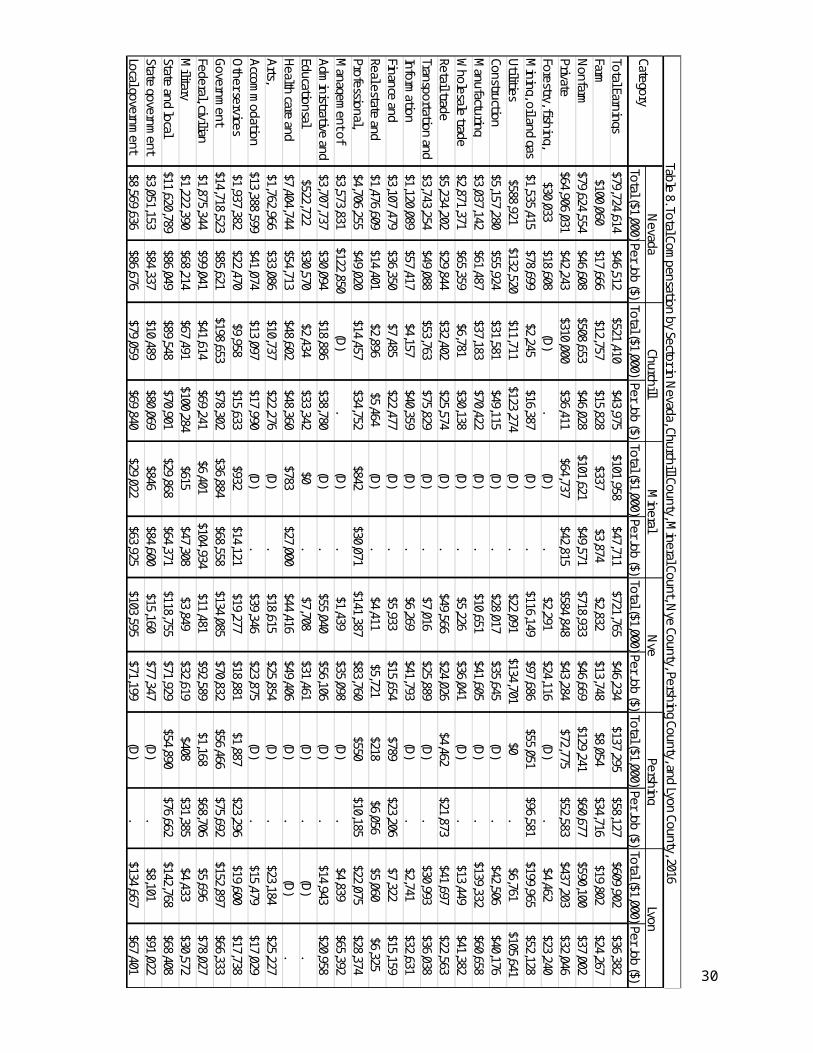
Employee Compensation
Table 8 shows total employee compensation for the state of Nevada and the five-county study
area in 2016. Employee compensation for the state of Nevada increased in nominal terms to
$79.7 billion, which is a ten-year increase nominally of $13.9 billion dollars or 20.4% nominal
increase. Also, from Table 8 average employee compensation for the state of Nevada was
$46,512 with the highest per employee compensation in the Utilities Sector at $132,520 followed
by the Management of Companies and Enterprises Sector at $122,850. For the state, the Federal
Military Sector in 2016 had total employee compensation of $1,222,390,000, which is $68,214
per job.
For Churchill County, total employee compensation in 2016 was $521,410,000, which was
0.65% of the state 2016 total. Per job employee compensation for Churchill County in 2016 was
$43,975, which was 94.5% of the state average. The Utilities Sector for Churchill County had the
highest per job compensation of $123,274 followed by the Federal Military Sector. Given the
Fallon NAS presence, it is not surprising that this sector is prominent in county income. These
incomes are also spent in the community that impact local economic activity.
For Mineral County, total employee compensation in 2016 was $101,958,000 which was 0,13%
of the state 2016 total. Per job compensation in 2016 for Mineral County was $47,711 per job
which was 2.5% greater than the state average. Of total county employee compensation, the
Local Government Sector made up 28.5% of total county employee compensation. The Federal
Government, Civilian Sector had the highest compensation per job at $104,934.
For Nye County, employment compensation in 2016 was $721,765,000, which was 0.91% of
total state compensation. Compensation per job for Nye County was $46,234, which was 0.5%
18
lower than the statewide average. Professional, Scientific, and Technical services Sector had
total employment compensation of $141.387,000 in 2016 or 19.5 % of county total. The Utilities
Sector recorded the higher per job employee compensation at $134,701. The Federal Military
Sector had total employee compensation of $3,849,000 in 2016 with a per job employee
compensation of $32,619.
For Pershing County, total employee compensation for 2016 was $137,295,000, which was
0.17% of the state total. As for per job compensation, Pershing county 2016 per job
compensation was $58,127 which was 25% above the state average. The Mining Sector had total
employee compensation in 2016 of $55,051,000, which was 40.0% of total county employee
compensation. The Mining Sector also had the highest employee compensation in 2016 for
Pershing County at $96,581. The Federal Government Military Sector in Pershing County in
2016 had only $408,000 in total compensation with a per job employee compensation of
$31,385.
For Lyon County, total employee compensation for 2016 was $609,902,000, which was 0.77%
of the state total. As for per job compensation, Lyon County in 2016 had per job compensation
of $36,382 which was 21.8% below the state average. The largest private sector employee
compensation in 2016 was the Manufacturing Sector with employee compensation of
$139,332,000 or 22.8% of the county total. Also, the Manufacturing Sector had the highest
compensation per job in the county at $60,658. The Federal Government Military Sector in 2016
had $4,433,000 in total employee compensation or $30,572 in per job compensation.
19
20
Total ($1,000)Per Job ($)Total ($1,000)
Per Job ($)Total ($1,000)Per Job ($)
Total ($1,000)Per Job ($)Total ($1,000)
Per Job ($)Total ($1,000)Per Job ($)
$79,724,614$46,512
$521,410$43,975
$101,958$47,711
$721,765$46,234
$137,295$58,127
$609,902$36,382
$100,060$17,666
$12,757$15,828
$337$3,874
$2,832$13,748
$8,054$34,716
$19,802$24,267
$79,624,554$46,608
$508,653$46,028
$101,621$49,571
$718,933$46,669
$129,241$60,677
$590,100$37,002
$64,906,031$42,243
$310,000$36,411
$64,737$42,815
$584,848$43,284
$72,775$52,583
$437,203$32,046
$30,033$18,608
(D).
(D).
$2,291$24,116
(D).
$4,462$23,240
$1,535,415$78,699
$2,245$16,387
(D).
$116,149$97,686
$55,051$96,581
$199,965$52,128
$588,921$132,520
$11,711$123,274
(D).
$22,091$134,701
$0.
$6,761$105,641
$5,157,280$55,924
$31,581$49,115
(D).
$28,017$35,645
(D).
$42,506$40,176
$3,037,142$61,487
$37,183$70,422
(D).
$10,651$41,605
(D).
$139,332$60,658
$2,871,371$65,359
$6,781$30,138
(D).
$5,226$36,041
(D).
$13,449$41,382
$5,234,202$29,844
$32,402$25,574
(D).
$49,566$24,026
$4,462$21,873
$41,697$22,563
$3,743,254$49,088
$53,763$75,829
(D).
$7,016$25,889
(D).
$30,993$36,038
$1,120,089$57,417
$4,157$40,359
(D).
$6,269$41,793
(D).
$2,741$32,631
$3,107,479$36,350
$7,485$22,477
(D).
$5,933$15,654
$789$23,206
$7,322$15,159
$1,476,609$14,401
$2,896$5,464
(D).
$4,411$5,721
$218$6,056
$5,060$6,325
$4,706,255$49,020
$14,457$34,752
$842$30,071
$141,387$83,760
$550$10,185
$22,075$28,374
$3,573,831$122,850
(D).
(D).
$1,439$35,098
(D).
$4,839$65,392
$3,707,737$30,094
$18,886$38,780
(D).
$55,040$56,106
(D).
$14,943$20,958
$522,722$30,570
$2,434$33,342
$0.
$7,708$31,461
(D).
(D).
$7,404,744$54,713
$48,602$48,360
$783$27,000
$44,416$49,406
(D).
(D).
$1,762,966$33,086
$10,737$22,276
(D).
$18,615$25,854
(D).
$23,184$25,227
$13,388,599$41,074
$13,097$17,990
(D).
$39,346$23,875
(D).
$15,479$17,029
$1,937,382$22,470
$9,958$15,633
$932$14,121
$19,277$18,881
$1,887$23,296
$19,600$17,738
$14,718,523$85,621
$198,653$78,302
$36,884$68,558
$134,085$70,832
$56,466$75,692
$152,897$66,333
$1,875,344$99,041
$41,614$69,241
$6,401$104,934
$11,481$92,589
$1,168$68,706
$5,696$78,027
$1,222,390$68,214
$67,491$100,284
$615$47,308
$3,849$32,619
$408$31,385
$4,433$30,572
$11,620,789$86,049
$89,548$70,901
$29,868$64,371
$118,755$71,929
$54,890$76,662
$142,768$68,408
$3,051,153$84,337
$10,489$80,069
$846$84,600
$15,160$77,347
(D).
$8,101$91,022
$8,569,636$86,676
$79,059$69,840
$29,022$63,925
$103,595$71,199
(D).
$134,667$67,401
Federal, civilianM
ilitaryState and localState governm
entLocal governm
ent
Educationsal Health care and Arts, Accom
modation
Other services
Government
Information
Finance and Real estate and Professional, M
anagement of
Administrative and
UtilitiesConstructionM
anufacturing W
holesale tradeRetail tradeTransportation and
Total EarningsFarmN
onfarmPrivateForestry, fishing, M
ining, oil and gas Table 8. Total Compensation by Sector in N
evada, Churchill County, Mineral Count, N
ye County, Pershing County, and Lyon County, 2016
CategoryN
evada Churchill
Mineral
Nye
PershingLyon
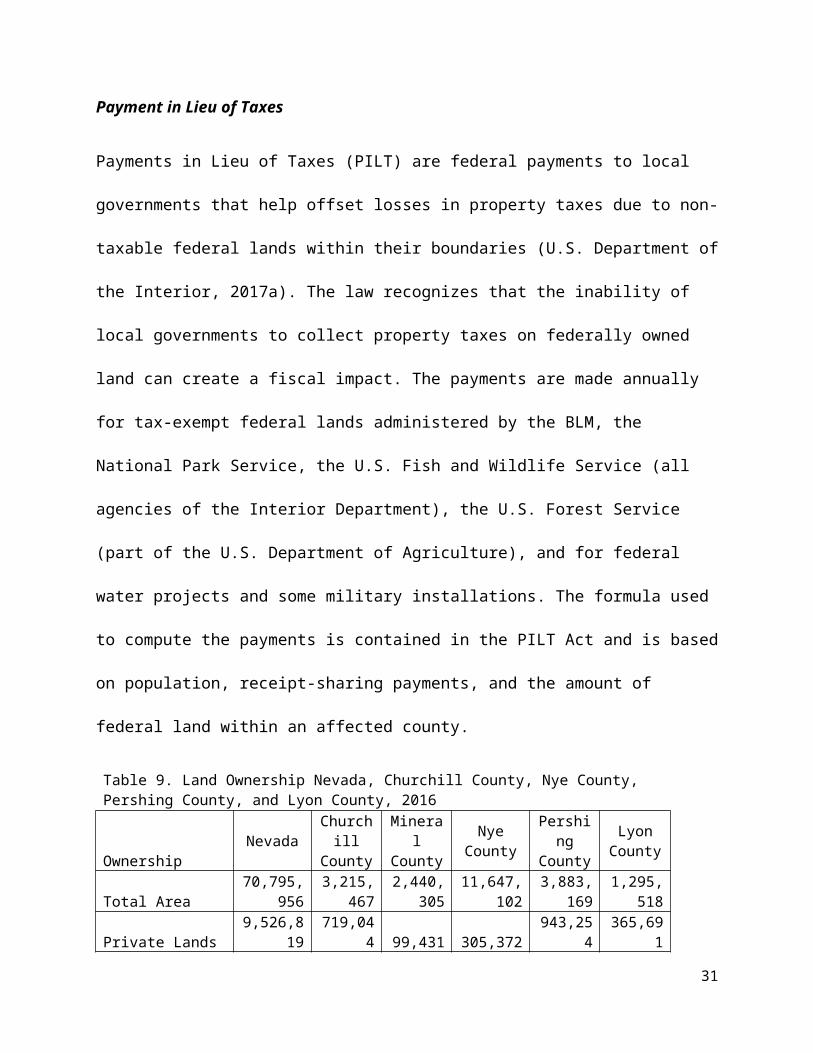
Payment in Lieu of Taxes
Payments in Lieu of Taxes (PILT) are federal payments to local governments that help offset
losses in property taxes due to non-taxable federal lands within their boundaries (U.S.
Department of the Interior, 2017a). The law recognizes that the inability of local governments to
collect property taxes on federally owned land can create a fiscal impact. The payments are made
annually for tax-exempt federal lands administered by the BLM, the National Park Service, the
U.S. Fish and Wildlife Service (all agencies of the Interior Department), the U.S. Forest Service
(part of the U.S. Department of Agriculture), and for federal water projects and some military
installations. The formula used to compute the payments is contained in the PILT Act and is
based on population, receipt-sharing payments, and the amount of federal land within an affected
county.
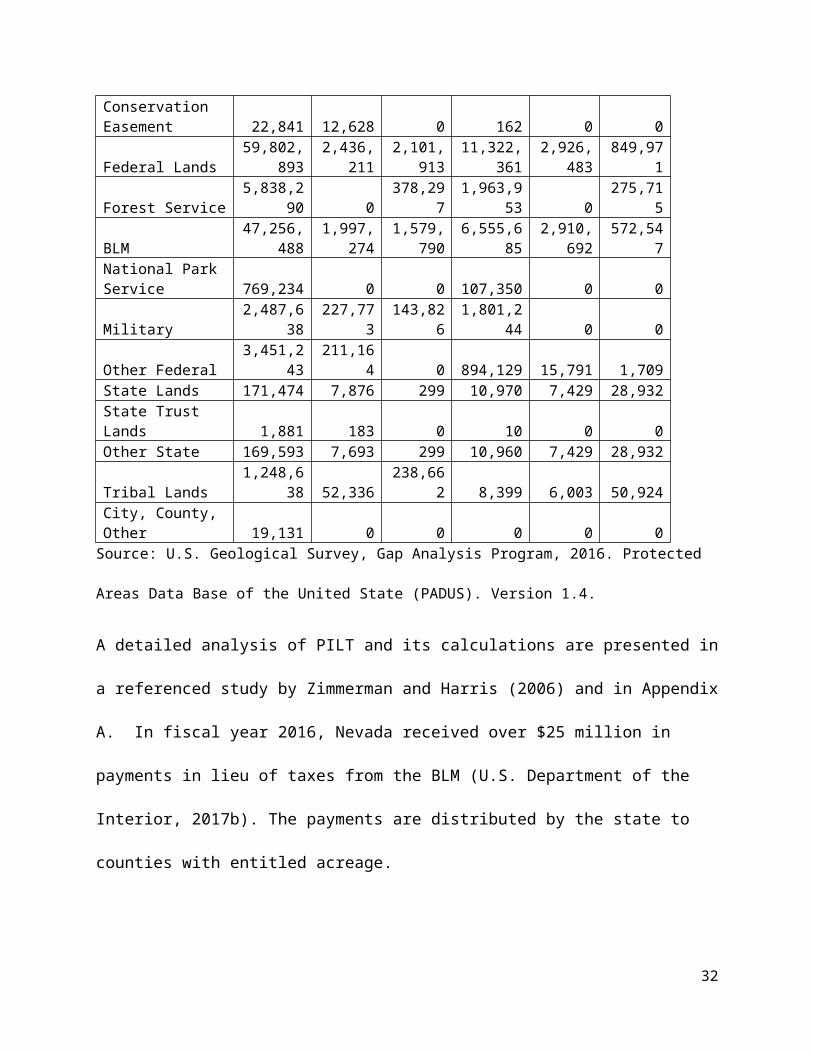
Table 9. Land Ownership Nevada, Churchill County, Nye County, Pershing County, and Lyon County, 2016
OwnershipNevada Churchill
CountyMineral County
Nye County
Pershing County
Lyon County
Total Area70,795,95
63,215,46
72,440,30
511,647,10
23,883,16
91,295,51
8Private Lands 9,526,819 719,044 99,431 305,372 943,254 365,691Conservation Easement 22,841 12,628 0 162 0 0
Federal Lands59,802,89
32,436,21
12,101,91
311,322,36
12,926,48
3 849,971Forest Service 5,838,290 0 378,297 1,963,953 0 275,715
BLM47,256,48
81,997,27
41,579,79
0 6,555,6852,910,69
2 572,547National Park Service 769,234 0 0 107,350 0 0Military 2,487,638 227,773 143,826 1,801,244 0 0Other Federal 3,451,243 211,164 0 894,129 15,791 1,709State Lands 171,474 7,876 299 10,970 7,429 28,932State Trust Lands 1,881 183 0 10 0 0Other State 169,593 7,693 299 10,960 7,429 28,932Tribal Lands 1,248,638 52,336 238,662 8,399 6,003 50,924
21
City, County, Other 19,131 0 0 0 0 0Source: U.S. Geological Survey, Gap Analysis Program, 2016. Protected Areas Data Base of the United
State (PADUS). Version 1.4.
A detailed analysis of PILT and its calculations are presented in a referenced study by
Zimmerman and Harris (2006) and in Appendix A. In fiscal year 2016, Nevada received over
$25 million in payments in lieu of taxes from the BLM (U.S. Department of the Interior, 2017b).
The payments are distributed by the state to counties with entitled acreage.
The number of acres entitled land and the amount of payment in2017 for Churchill, Lyon,
Mineral, Nye, and Pershing counties are presented in Table 10. It should be noted that the
maximum payment made to each county is limited based on the population in the county. The
payment is prorated depending on the appropriated funding for the year. The Unit Population is
used to determine the population funding limit.
Table 10. Payments in Lieu of Taxes to Churchill County, Mineral County, Nye County, Pershing County, and Lyon County, 2017County Federal Acres Unit Population 2017 Payment to County Payment MethodologyChurchill 2,158,533 24,000 2,260,796 Population Limited Formula AMineral 1,936,558 5,000 714,477 Formula BNye 8,548,257 42,000 3,153,811 Population Limited Formula APershing 2,918,844 7,000 1,102,628 Population Limited Formula ALyon 859,769 50,000 2,147,161 Formula A
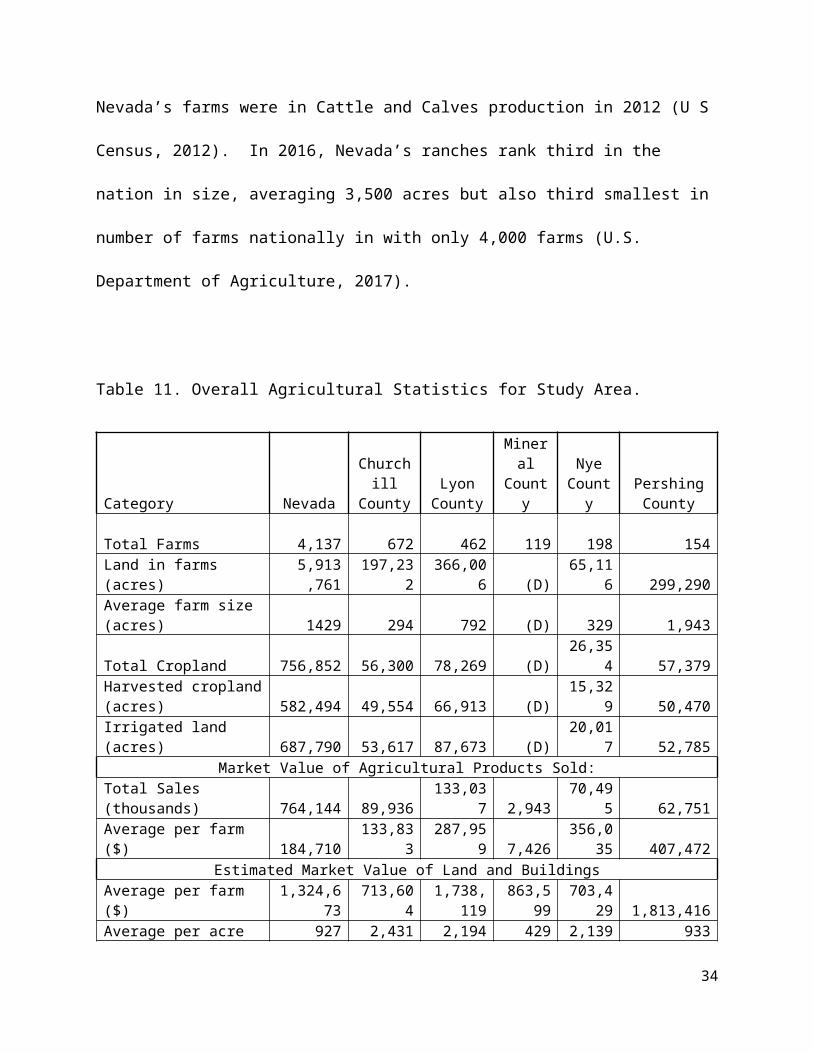
Agriculture Sector
Agriculture is one of Nevada’s most important industries, contributing significantly to the
economies of rural communities and the state as a whole. Nevada’s farms combined covered
nearly 6 million acres of land in 2012 (Table 11). Approximately 44% of Nevada’s farms were in
Cattle and Calves production in 2012 (U S Census, 2012). In 2016, Nevada’s ranches rank third
22
in the nation in size, averaging 3,500 acres but also third smallest in number of farms nationally
in with only 4,000 farms (U.S. Department of Agriculture, 2017).
Table 11. Overall Agricultural Statistics for Study Area.
Category NevadaChurchill County
Lyon County
Mineral County
Nye County
Pershing County
Total Farms 4,13
7 672 462 119 198 154
Land in farms (acres) 5,913,76
1 197,232 366,006 (D) 65,116 299,290Average farm size (acres) 1429 294 792 (D) 329 1,943Total Cropland 756,852 56,300 78,269 (D) 26,354 57,379Harvested cropland (acres) 582,494 49,554 66,913 (D) 15,329 50,470Irrigated land (acres) 687,790 53,617 87,673 (D) 20,017 52,785
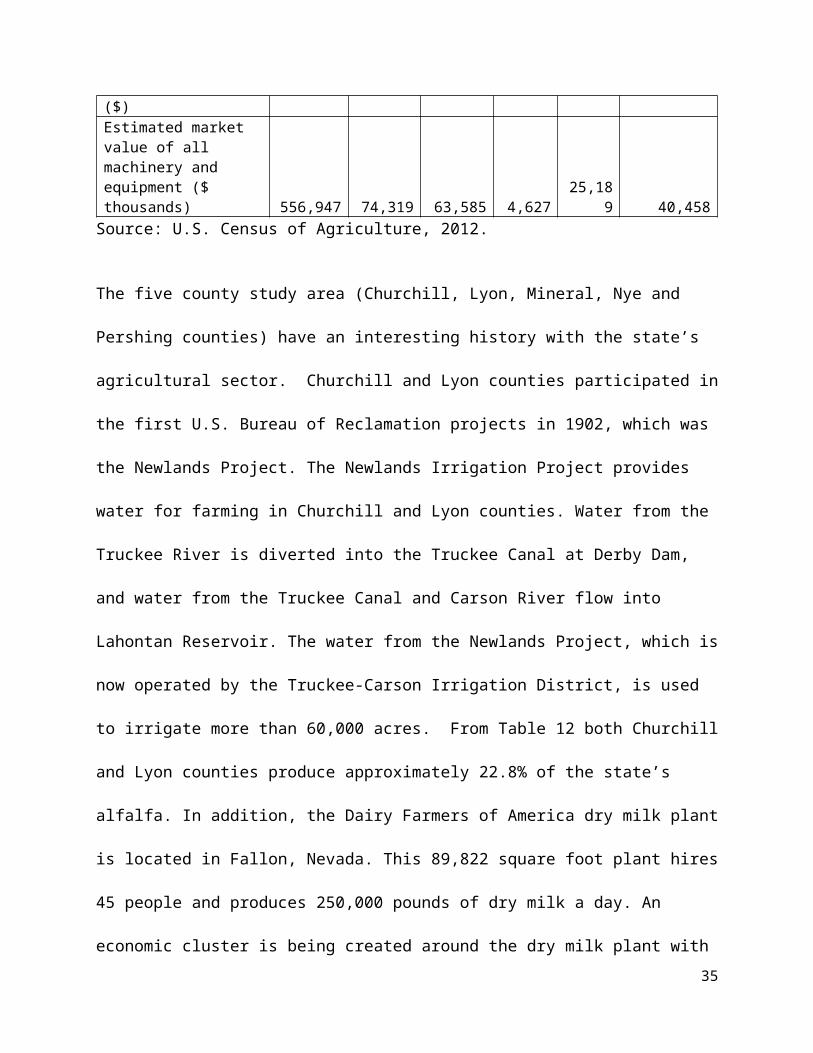
Market Value of Agricultural Products Sold:Total Sales (thousands) 764,144 89,936 133,037 2,943 70,495 62,751
Average per farm ($) 184,710 133,833 287,959 7,426356,03
5 407,472Estimated Market Value of Land and Buildings
Average per farm ($) 1,324,673 713,6041,738,11
9 863,599703,42
9 1,813,416Average per acre ($) 927 2,431 2,194 429 2,139 933Estimated market value of all machinery and equipment ($ thousands) 556,947 74,319 63,585 4,627 25,189 40,458
Source: U.S. Census of Agriculture, 2012.
The five county study area (Churchill, Lyon, Mineral, Nye and Pershing counties) have an
interesting history with the state’s agricultural sector. Churchill and Lyon counties participated
in the first U.S. Bureau of Reclamation projects in 1902, which was the Newlands Project. The
Newlands Irrigation Project provides water for farming in Churchill and Lyon counties. Water
from the Truckee River is diverted into the Truckee Canal at Derby Dam, and water from the
Truckee Canal and Carson River flow into Lahontan Reservoir. The water from the Newlands
23
Project, which is now operated by the Truckee-Carson Irrigation District, is used to irrigate more
than 60,000 acres. From Table 12 both Churchill and Lyon counties produce approximately
22.8% of the state’s alfalfa. In addition, the Dairy Farmers of America dry milk plant is located
in Fallon, Nevada. This 89,822 square foot plant hires 45 people and produces 250,000 pounds
of dry milk a day. An economic cluster is being created around the dry milk plant with more
dairy cattle in production and additional demands on alfalfa hay. Lyon County is one of the
largest counties in the state in agriculture. The agricultural sector of Lyon is quite diverse
growing garlic and onions along with beef cattle and alfalfa hay (tables 12 and 13). Pershing
County is also one of the state’s top agricultural counties obtaining surface water from Rye Patch
Reservoir. From past droughts, the irrigation water available for Pershing County agriculture has
been quite variable.
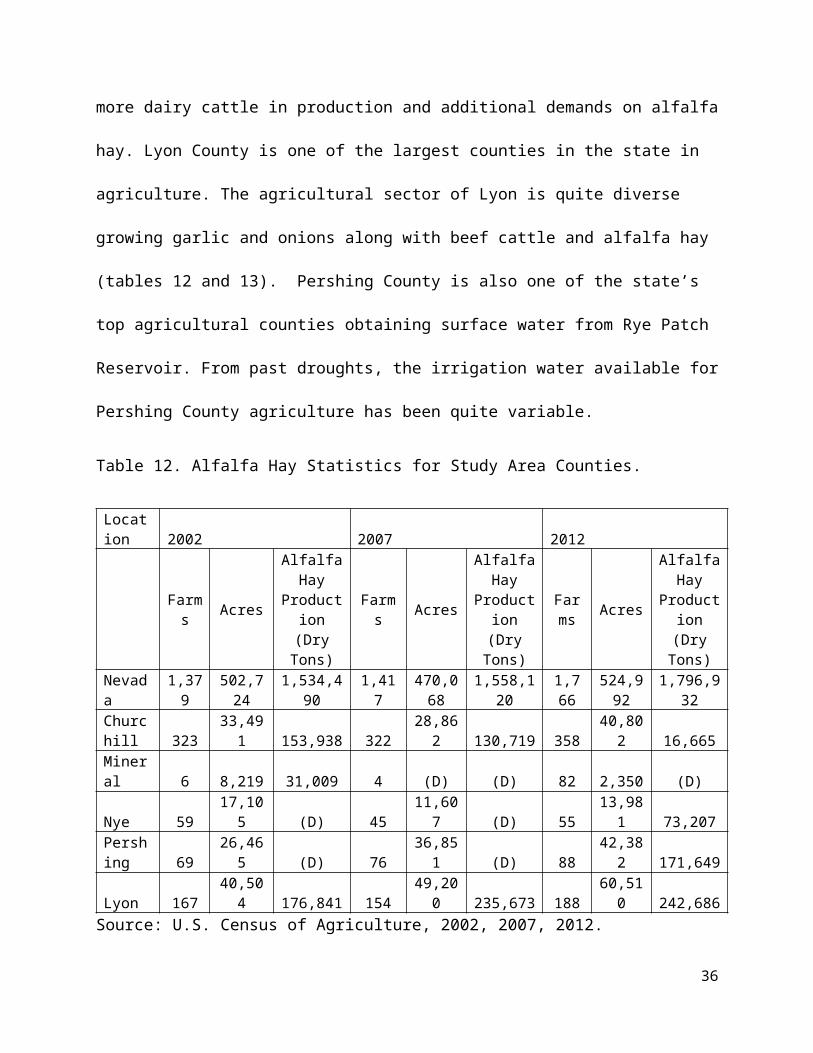
Table 12. Alfalfa Hay Statistics for Study Area Counties.
Location 2002 2007 2012
Farms Acres
Alfalfa Hay
Production (Dry Tons)
Farms Acres
Alfalfa Hay
Production (Dry Tons)
Farms Acres
Alfalfa Hay
Production (Dry Tons)
Nevada 1,379 502,724 1,534,490 1,417470,06
8 1,558,120 1,766524,99
2 1,796,932Churchill 323 33,491 153,938 322 28,862 130,719 358 40,802 16,665Mineral 6 8,219 31,009 4 (D) (D) 82 2,350 (D)Nye 59 17,105 (D) 45 11,607 (D) 55 13,981 73,207Pershing 69 26,465 (D) 76 36,851 (D) 88 42,382 171,649Lyon 167 40,504 176,841 154 49,200 235,673 188 60,510 242,686
Source: U.S. Census of Agriculture, 2002, 2007, 2012.
24
Grazing lands, many of which are lands owned by the federal government and managed by the
Bureau of Land Management (BLM), are integral to cattle and other livestock operations, and
play a role in determining the size of a herd and the market value of the livestock operation.
The metric of an “animal unit” was devised as a standard unit for calculating the relative grazing
requirements of different types of livestock. For cattle, an animal unit is defined as one mature
cow and her suckling calf weighing a combined 1,000 pounds (or a 1,000-pound steer) requiring
26 pounds of dry matter forage per day. The concept of the “animal unit month” (AUM) is used
by range and pasture managers to estimate the monthly stocking requirements for pastures to
support livestock.
Table 13. Cattle and Calves Inventory for Study Area Counties.
Location 2002 2007 2012
Farms
Cattle and Calves
Farms Cattle and Calves
Farms Cattle and Calves
Nevada 1,583 460,263 1,513 441,629 1,822 420,322Churchill 269 47,136 244 36,834 297 38,814Lyon 172 36,273 126 36,579 166 46,039Mineral 11 1,422 30 2,816 65 2,221Nye 79 27,657 80 29,422 88 28,672Pershing 76 19,161 81 23,264 75 26,525
U.S. Census of Agriculture, 2002, 2007, and 2012.
Mining Sector
There are 12 industrial active mineral mines and 9 geothermal power plants located in Churchill
County and adjacent areas in surrounding counties (Perry & Visher, 2016). None of these mines
or geothermal plants are in the proposed expansion area (Private conversations with Perry and
Visher, 2017).
25
Nevada mines produce over a dozen types of mineral commodities as well as aggregates and oil.
In 2015, the total value of all commodities mined in the State was over $7.4 billion, with
approximately 86.1 percent from gold and silver production (Perry & Visher, 2016). Nevada
produces about 83 percent of the gold mined in the United States. The 2015 production of
minerals sold as commodities from the 12 nearby mines was valued at over $215.5 million. The
four diatomite mines produce nearly 100 percent of the State’s total diatomite production, which
was valued at $42.8 million in 2015. The Huck Salt mine, which is located near Fallon, is the
State’s only major salt mine, producing 100 percent of salt sold as a commodity in 2015. The
most lucrative mine, the Coeur Rochester mine, is located near Lovelock in Pershing County,
and is north of the Study Area. Silver production in 2015 accounted for nearly half of the state’s
total production and was valued at over $72.8million.
Table 14. Major Mineral Mines Near the FRTC and the Proposed Expansion Areas, 2015.
Facility County Commodity2015
Production (short tons)
Percent of Nevada
Production
Approximate Value ($ million)
Churchill Mine Churchill Limestone 519,125.0 6.6% $2.5
Fernley Operations Churchill Diatomite 31,817.0 14.0% $6.0
Hazen mine Churchill Diatomite 9,283.0 4.1% $1.8
Huck Salt Churchill Salt 11,649.0 100.0% $0.5
Nightingale Mine Churchill Diatomite 27,800.0 12.2% $5.3
Perlite Mine Churchill Perlite 23,730.0 91.6% $2.5
Coeur Rochester Mine Pershing Gold 1.6 1.0% $59.4
Coeur Rochester Mine Pershing Silver 145.0 48.9% $72.8
Colado Mine Pershing Diatomite 156,565.0 68.9% $29.7
Relief Canyon Mine Pershing Limestone 28,865.0 0.4% $0.1
26
Nassau Mine Pershing Bentonite 0.0 0.0% $0.0
Premier Magnesia Mine NyeMagnesium Compounds
108,943.0 100.0% $6.7
Denton-Rawhide Mine Mineral Gold 1.0 0.4% $26.0
Denton-Rawhide Mine Mineral Silver 5.0 1.5% $2.3
TOTAL VALUE $215.5
Sources: Perry and Visher (2016), Nevada Bureau of Mines and Geology (2017)
Geothermal Industry
Nevada is the second-largest producer of geothermal energy in the United States (California is
the largest producer) and has more geothermal projects in development than any other state (U.S.
Department of Energy, 2017). Nevada is ranked first in the nation in terms of geothermal use per
capita, with roughly 65 percent of renewable energy generation produced by domestic
geothermal resources in northern Nevada. Nearly one-third of this generation is located within
the Fallon area, and existing BLM geothermal leases are located within the proposed withdrawal
area.
Ten geothermal projects in various stages of development are located in Churchill County, where
the majority of the state’s known geothermal resources areas are located (Bureau of Land
Management, 2017). No geothermal power plants, active geothermal fields, or geothermal lease
parcels are located in the proposed expansion areas, and the vast majority of existing geothermal
sales parcels in the study area are located outside of the proposed expansion are power
transmission lines used to distribute power from geothermal power plants to the surrounding
region traverse the study areas. Two transmission lines currently pass through the existing
DVTA withdrawal area that is open to the public, and both lines would pass through the
27

proposed DVTA expansion area. A separate transmission line would traverse through the
southeastern corner of the B-20 expansion area.
Table 15. Geothermal Power Plants in Study Area, 2015.
Facility County Mineral Type CompanyEnergy
Output (Sales) (MWh)
Salt Wells Churchill Limestone Enel North America, LLC 103410Stillwater 1 and 2 Churchill Diatomite Enel North America, LLC 135369Soda Lake 1 and 2 Churchill Diatomite Cyrq Energy Crop. 70002Patua Churchill Salt Cyrq Energy Crop. 115973Desert Peak 2 Churchill Diatomite Ormat Nevada Inc. 84404Brady Churchill Perlite Ormat Nevada Inc. 53597Dixie Valley Churchill Gold Terra-Gen Dixie Valley, LLC 479103Wild Rose 1 and 2 Mineral Silver Ormat Nevada Inc. 351124Wabuska 1 and 2 Lyon Diatomite
Homestretch Geothermal, LLC 9125
TOTAL VALUE 14021071The Stillwater plant is a hybrid plant utilizing both geothermal and solar energy.
Notes: MWe = megawatts electric (i.e., electric power produced), MWh = megawatt hours
Source: Nevada Division of Minerals (2017)
Recreation Industry and Tourism
28
Recreational activities in the FRTC Area include outdoor activities such as fishing, hiking,
camping, bird watching, rock/fossil collecting, horseback riding, sightseeing, and visiting
historic sites. The study area community would focus recreational impacts on hunting and
operating off-highway vehicles (e.g., four wheelers and motorcycles).
Businesses and organizations that provide opportunities for recreational activities in the region
include Pine Nut Mountains Trail Association, Nevada Four Wheel Drive Association,
California Four Wheel Drive Association, American Motorcyclist Association District 36,
Rebelle Rally Enterprises, Sierra Trail Dogs Motorcycle Club, Hills Angels 4x4 Club, and the
Sharetrails.org BlueRibbon Coalition, among others. The expenditures by recreators impact the
local retail, food services sector (e.g., restaurants), and accommodations (e.g., motel) businesses
benefit economically from organized recreational activities that attract visitors from across and
outside of the state.
The Best In the Desert Racing Association holds an annual off-road vehicle race from Las Vegas
to Reno that would traverse lands in Mineral County that are proposed for withdrawal for the
expansion of B-17. The race is billed as the “The Longest Off-Road Race in the United States,”
and while the race would only last for one day, preparation for the race, including marking the
route, begins up to one year before the race takes place. Businesses located along the route,
including hotels and restaurants, benefit from the influx of visitors.
Hunting and wildlife viewing are popular recreational activities enjoyed by visitors and
residents. Some of the lands used for these activities are proposed for withdrawal and would
become closed to the public. Various organizations, primarily sportsmen’s organizations,
interested in preserving these activities, have invested in and constructed approximately 65 water
developments (i.e., guzzlers) that are located within the proposed expansion areas. Guzzlers
29
provide water needed by wildlife during dry conditions. Ten of the guzzlers for big game (e.g.,
bighorn sheep, pronghorn, and mule deer) and 23 small game guzzlers (for chukar and other
smaller wildlife) are in the study areas.
METHODOLOGY
Estimation of the economic, employment and household income impacts of changes in study
area economic activity from the Fallon Range Training Complex Modernization will be derived
from employing input-output or interindustry modeling techniques. Interindustry analysis was
developed by Wassily Leontief in the late 1930’s to represent the interdependencies between
different economic sectors in a study area (1936). Interindustry analysis specially shows how
economic sector are linked together by sales and purchases between other economic sectors.
Since its inception, the framework of interindustry models has continued to be improved and is
one of today’s most applied analytical techniques in economics (Baumol, 2000). The advantage
of interindustry analysis is its ability to provide an easy to understand, transparent, and detailed
picture of economic structure of a study area economy at a point in time. Another advantage is
that interindustry models do not incorporate any behavioral equations of individuals or
businesses, so it is politically and ideologically neutral (Forum et al., 2005). This section will
discuss some basics of study area economics, discussion of input-output models, verification and
validation of interindustry models, and estimation of impacts of potential Fallon Range Training
Complex Modernization.
Some Basic Concepts of Study Area Economics and Income and Employment Multipliers
30
Figure 1 illustrates the major dollar flows of goods and services in any economy. The
foundation of a study area’s economy is those economic sectors that sell some or all their goods
and services to buyers outside of the study area. Such economic sectors are designated as basic
economic sector. The flow of products out of, and dollars into, a study area is represented by the
two arrows in the upper right portion of Figure 1. To produce these goods and services for
“export” outside the study area, the basic economic sectors purchase inputs from outside of the
study area (upper left portion of Figure 1), labor from the residents or “households” of the study
area (left side of Figure 1), and inputs from service industries located within the study area (right
side of Figure 1), and inputs from service industries located within the study area (right side of
Figure 1). The flow of labor, goods and services in the study area is completed by households
using their earnings to purchased goods and services from the study area’s service economic
sectors (bottom of Figure 1). It is evident from the interrelationships illustrated in Figure 1 that a
change in any one segment of a study area’s economy will have reverberations throughout the
entire study area economy.
Consider, for instance, the activities of the Fallon Range Training Complex
Modernization, and its impacts on the study area economy. Economic sectors such as the Range
Livestock Sector may be impacted by the activities of the Fallon Range Training Complex
Modernization. The study area’s Range Livestock Sector is designated as a basic economic
sector as it draws dollars from outside the study area. These dollars may hire a few people from
the study area household sector such as laborers to work on these range cattle operations.
However, most of the study area economic linkages are from the Range Livestock Sector’s
purchases of goods and services from the study area service sectors. These include economic
sectors such as restaurants, gas stations, hotels and other retail sectors. As earnings increase in
31

these economic sectors, they will hire additional people and buy more inputs from other study
area sectors. Thus, the change in the economic base works its way throughout the entire study
area economy.
The total impact of a change in the study area economy consists of direct, indirect and
induced impacts. Direct impacts are the changes in the activities of the impacting industry, such
as the reduction of operations by the Range Livestock Sector. The impacted economic sector,
such as the Range Livestock Sector, changes its purchases of inputs as a result of the direct
impacts. This produces an indirect impact in other study area economic sectors. Both the direct
and indirect impacts change the flow of dollars to the study area’s households. The study area
households alter their consumption accordingly. The effect of this change in study area
household consumption upon economic sectors in the study area is referred to as an induced
impacts.
A measure is needed that yields the effects created by an increase or decrease in
economic activity. In economics, this measure is called the multiplier effect.
32
33
Overview of Interindustry Analysis
Within a study area economy, there are numerous economic sectors performing different tasks.
All sectors are dependent upon each other to some degree. A change in economic activity by one
sector will impact either directly or indirectly the activity and viability of other sectors in the
economy. In order to show these interdependencies and interventions between economic sectors,
a study area input–output model can be used.
Wassily Leontief (1936) developed input-output or interindustry analysis and Miller and Blair
(2009) present a detailed mathematical presentation of interindustry analysis in a referenced
study. Input-output models create a picture of a study area economy describing monetary flows
to and from economic sectors and institutions (local, state, and federal government, etc.).These
monetary flows are called interrelationships.
The name input-output model refers to the model showing output (sales) of one economic sector
will appear as an input (purchase) of another economic sector. Economic sectors purchase and
sell from other study area economic sectors as well as selling and purchasing from outside the
study area economy.
Multipliers are a product of input-output analysis showing total changes throughout the study
area economy from a one-unit change for a given economic sector. Multipliers can be output,
employment, and labor income (employee compensation and proprietor income). Output
multipliers measure the total change in study area economic activity from a change in output by a
given study area economic sector. Employment multipliers measure the total change in study
area employment from a given change in a given study area economic sector activity. Labor
34
Income impacts are the total labor income impacts in the study area from a change economic
activity by a given study area economic sector.
Impacts can be further delineated into direct, indirect, and induced impacts. Direct impacts
represent the initial changes by a selected study area economic sector. Indirect impacts are the
study area businesses buying and selling among each other. Induced impacts include household
spending earned from direct and indirect impacts.
Verification and Validation of Study Area Input-Output Models
As mentioned earlier, input-output models were developed in the 1930’s by Wassily Leontief
(1936). These models proved to be very useful in determining total and sectoral impacts of
changes in the national economy and its economic linkages have been used for economic
clustering studies. States and localities wanting similar detailed economic impact analysis for
their jurisdictions initially used the national input-output model for impact and linkage analysis.
However, the national economy can be very dissimilar at the state or regional economy level.
Therefore, states and localities wanted input-output models that represent their state or local
economies. Some states developed their own input-output models through primary surveys.
Primary survey input-output models were derived for the states of Washington (Bourque et al.,
1967). Texas (Grubb, 1973), Kansas (Emerson, 1969), and West Virginia (Miernyk et al., 1970).
However, primary survey models are very costly and time consuming. Development of a state or
local input-output model may take years to complete. To address time and costs concerns of
primary survey models, non-survey procedures were adopted and used for the model
development. An excellent discussion of non-survey and partial-survey procedures is presented
in Miller and Blair (2009). These non-survey procedures take the national input-output model
35

and formulate a state, region, or county input-output model. However, these non-survey input-
output models need to be verified and validated as well as the economic structure of the model.
One of the most used secondary input-output models is IMPLAN. IMPLAN stands for Impact
Analysis for Planning. Originally developed by the U S forest service, IMPLAN is now a private
modeling company (IMPLAN, 2014). The two major components of IMPLAN is its data files
and software. The database includes information on 528 different economic sectors along with a
national input-output model to derive regional or county level input-output models. The
IMPLAN model is reasonably flexible allowing users to verify and validate data used in county
model development.
Given the out of the box IMPLAN model, there must be the verification and validation of data
set used for developing IMPLAN models as outlined by Holland et al. (1997): The first step is to
download the IMPLAN model data from the Industry Detail file which has sectoral employment.
The second step was to download Quarterly Census of Employment and Wage data for the study
area from the State of Nevada Department of Employment, Training, and Rehabilitation
employment data by North American Industrial Classification Sector (NAICS). Using IMPLAN
user supplied crosswalk tables, the NAICS sectors and employment levels are redefined into
IMPLAN economic sectors.
After putting Nevada DETR employment IMPLAN sectors, employment data is downloaded
from Bureau of Economic Analysis Regional Economic Information System (REIS) employment
data for the same year as the IMPLAN data and model. The BEA employment data will have
employee and proprietor data. The REIS data will show employment by 2-digit NAICS code
and using crosswalk tables can redefine these employment levels into 2-digit IMPLAN sectors.
36
Using the IMPLAN sector data from the state employment offices, proportional values of each
sector to each 2-digit IMPLAN sector can be estimated. From these proportional values, 2-digit
NAICS REIS data can be disaggregated into disaggregated IMPALN sector data. If possible, the
calculated data should be shared with the study area population to “ground truth” the values.
As Holland et al. (1997) note that some health and educational employment is within the public
sector. These employment levels will be located in the Local and State-Non-Education Sector. It
is suggested by Holland et al. (1997) that these public-sector employment values be estimated
and placed in the corresponding IMPLAN sectors covering doctors, dentist, hospitals, and
schools. As Holland et al. (1997) stated that employment being placed in the public sector is
correct from an accounting standpoint but often this causes confusion to the local populace.
With validation and verification of sectoral employment, all components of value added and total
industrial output for each sector of the model should be redefined as defined by Holland et al.
(1997). Using procedures outlined by Holland et al. (1997), State of Nevada Department of
Employment, Training, and Rehabilitation, and REIS data, county level input-output models for
this analysis are verified and validated.
In addition, the agricultural sector is often portrayed as one facing variabilities in weather and
prices. In order to develop models under average conditions, a five-year average of beef prices
were used to estimate model that would reflect average conditions.
RESULTS
The impacts to study area counties from FRTC are called multiplier effects. Multiplier effects
are simplified and compact way of representing these effects on the study area economies. The
multiplier is interpreted as the impact of a one-unit change in sales, employment, and/or income
37
that results in a corresponding total impact on sales, employment, and/or income in the larger
study area economy. In essence, the multiplier represents the recycling of dollars, jobs, and/or
income in a specific geographic area. This recycling creates or reduces jobs opportunities and
higher or lower wages for individuals residing in this study area economies.
There are three types of multiplier effects based on the type of economic impact analysis
undertaken: direct, indirect, and induced. The direct effect is based on a sector’s initial economic
impact on the study area’s economy, for example, if a range livestock operation had revenues of
$500,000, then this figure becomes the direct economic impact on the study area economy. The
indirect multiplier effect is based on industry-to-industry transactions only. For example, the
Range Livestock sector purchases local alfalfa hay, agricultural supplies, and contract services.
These impacted sectors also expand their purchases from local economic sectors, which in turn
repeats itself in the local economy. Induced multiplier effects are the response of local economic
sectors to employee spending both from direct and indirect effects. Local household purchases
primarily impact the commercial sectors of a study area economy. The total economic impact is
defined as direct plus indirect plus induced economic impacts. For this study, indirect and
induced effects will be aggregated and designated as secondary effects. Therefore, total impacts
in this study are delineated into direct and secondary impacts.
Range Livestock Impacts
Federal grazing plays an important role in the range livestock sector of the study area economies.
With the FTRC some Bureau of Land Management permits will be terminated and this loss in
economic activity will be estimated. Working with data provided by the U.S. Bureau of Land
Management and ManTech International Corporation (2018), grazing permits that would be
impacted were identified. From these permits, the location of the base camp of these permits
38
were identified. The economic impacts will be realized where business is contracted which will
be the base camp. Also, Bureau of Land Management and ManTech International Corporation
(2018) supplied information as to low and high estimates of AUM reductions by grazing
permitee for Alternatives 1 and 3. Location of Base Camp was developed from GIS and
conversations with BLM personnel and ManTech International Corporation (2018). Base camp is
defined as the county location of the ranch that has these grazing permits. Table 16 shows by
allotments the minimum and maximum loss in AUMs from FRTC for Alternatives 1. Table 17
shows by allotments minimum and maximum loss in AUMs from FRTC for Alternative 3.
Table 16. Total AUM’s, Minimum and Maximum AUM’s Lost, Base Camp County
Location for Allotments Impacted by FRTC from Alternative 1.
ALTERNATIVE 1
Allotment NameCounty of
Base Camp Total AUMsMinimum AUMs Lost
Maximum AUMs Lost
Horse Mountain Washoe 3,000 67 137
Lahontan Churchill 1,155 442 618
Bell Flat Churchill 3,688 2,987 3,233
Eastgate Churchill 9,770 22 33
La Beau Flat Churchill 3,035 1,003 1,056
Philip Well Mineral 1,450 969 1,058
Pilot Table Mountain Mineral 7,900 36 317
Copper Kettle Churchill 2,339 286 948
Humboldt Sink (Summer) Pershing 62 8 26
Humboldt Sink Pershing 1,520 1 19
South Rochester Pershing 777 34 86
White Cloud Churchill 1,884 539 1,046TOTAL 36,580 6,394 8,577
Table 17. Total AUM’s, Minimum and Maximum AUM’s Lost, Base Camp County
39
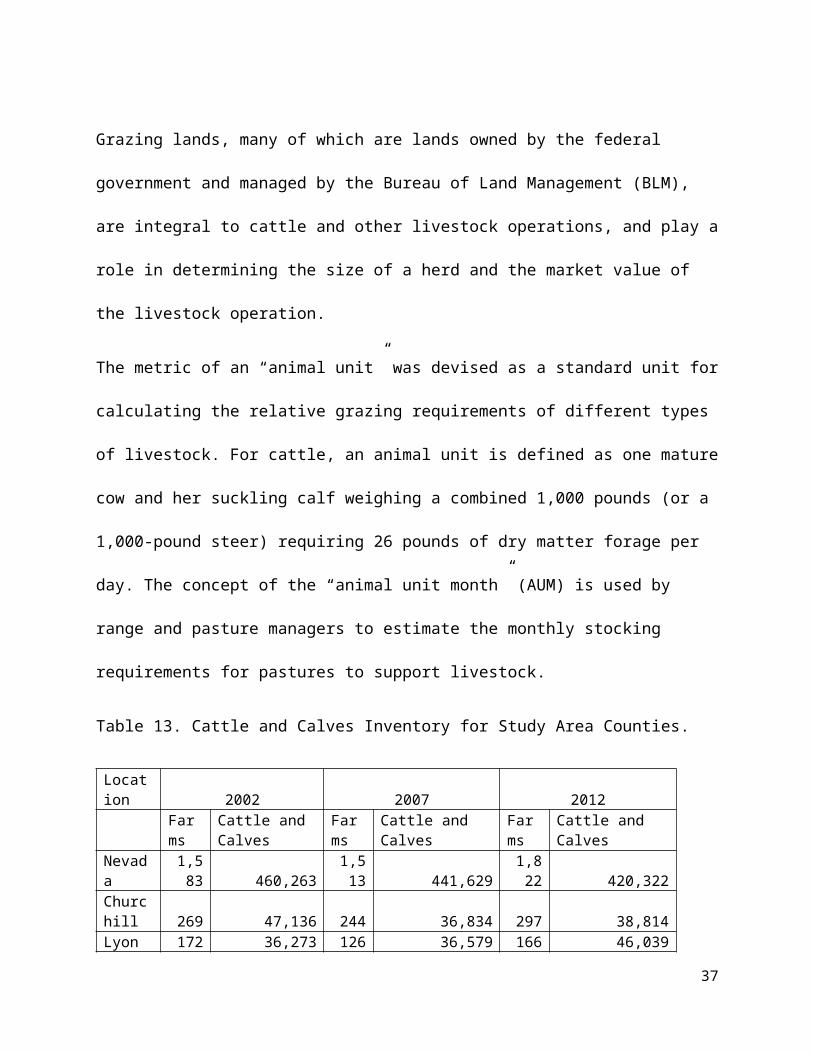
Location for Allotments Impacted by FRTC from Alternative 3.
ALTERNATIVE 3
Allotment NameCounty of
Base Camp Total AUMsMinimum AUMs Lost
Maximum AUMs Lost
Horse Mountain Washoe 3,000 67 137
Lahontan Churchill 1,155 442 618
Bell Flat Churchill 3,688 2,483 3,325
Eastgate Churchill 9,770 1,556 1,822
La Beau Flat Churchill 3,035 1,003 1,056
Philip Well Mineral 1,450 1,288 1,395
Pilot Table Mountain Mineral 7,900 213 487
Copper Kettle Churchill 2,339 286 948
Humboldt Sink (Summer) Pershing 62 8 26
Humboldt Sink Pershing 1,520 1 19
South Rochester Pershing 777 34 86
White Cloud Churchill 1,884 539 1,046
TOTAL 36,580 7,920 10,965
Following procedures for valuing AUMs from referenced studies by Torell et al. (2002) and
Alevy et al. (2006), University of Nevada, Reno Cooperative Extension cow-calf budgets were
employed to derive AUM value for Federal Grazing only. Using budgets developed by Curtis et
al. (2005), the per AUM value of production was estimated to be $38 per AUM. Using the
validated and verified county level input-output models for Churchill, Mineral, Pershing, and
Washoe counties, direct, secondary and total economic, employment, and labor income
(employee compensation and proprietor income) impacts were estimated. Table 18 shows the
direct minimum and maximum values of lost AUM’s and value of AUMs by impacted counties
from FRTC under Alternative 1. Table 19 shows the direct minimum and maximum values of
lost AUMs and value of AUMs by impacted counties from FRTC for Alternative 3.
40
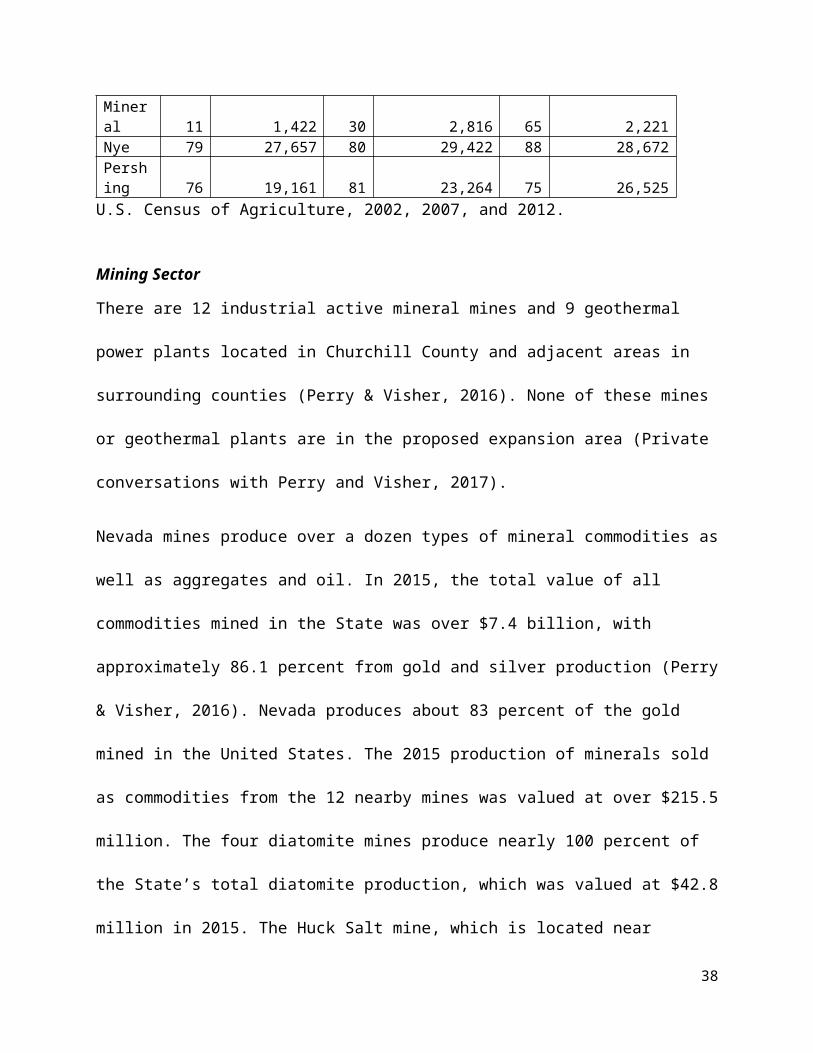
Table 18. Minimum and Maximum Value of AUM’s Lost and Value of AUMs Lost by Impacted County from FRTC Alternative 1.
Alternative 1 Alternative 1 at $38 per AUM
CountyTotal AUMs Minimum
AUMs LostMaximum AUMs Lost
Minimum AUMs Lost
Maximum AUMs Lost
Churchill 21,871 5,279 6,934 $200,602 $263,492Mineral 9,350 1,005 1,375 $38,190 $52,250Pershing 2,359 43 131 $1,634 $4,978Washoe 3,000 67 137 $2,546 $5,206
The minimum and maximum ranges for AUMs lost were derived by the Navy in coordination
with the Bureau of Land Management. Washoe County impacts were derived because the
location of the base camp for Horse Mountain is Washoe County.
Table 19. Minimum and Maximum Value of AUMs Lost and Value of AUMs Lost by Impacted Counties from FRTC Alternative 3.
Alternative 3 Alternateive 3 at $38 per AUM
CountyTotal AUMs Minimum
AUMs LostMaximum AUMs Lost
Minimum AUMs Lost
Maximum AUMs Lost
Churchill 21,871 6,309 8,815 $239,742 $334,970Mineral 9,350 1,501 1,882 $57,038 $71,516Pershing 2,359 43 131 $1,634 $4,978Washoe 3,000 67 137 $2,546 $5,206
The availability of federal lands for grazing livestock impacts individual ranches but also
influences the economies they reside. Tables 20, 21, and 22 show the output, employment, and
household income impacts of reduced public land grazing for the county economies in Churchill,
Mineral, Pershing, and Washoe counties. From table 20, the total economic impacts associated
with lost federal land grazing in Churchill County range from a minimum loss of $292,443 to a
maximum loss of $383,603 under alternative 1, or a minimum loss of $349,027 to a maximum
loss of $487,664 under Alternative 3. From table 21, employment impacts range from a loss of
41
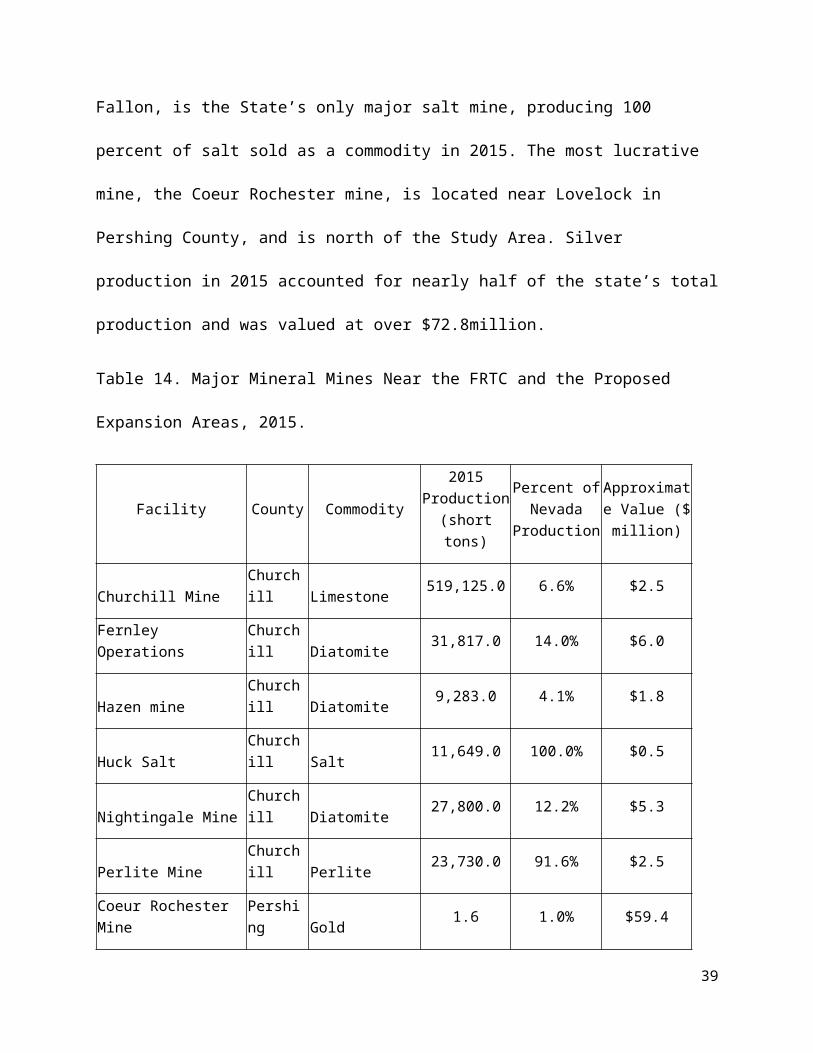
1.75 employees to a maximum loss of 2.10 employees under Alternative 1, or a minimum loss of
2.30 employees to a maximum loss of 2.93 employees under Alternative 3. From Table 22,
Churchill County realized from lost federal grazing under alternative 1 a minimum loss in labor
income of $16,616 to a maximum loss of $19,858 under Alternative 1 or a minimum loss of
$21,825 to a maximum loss of $27,707 under alternative 3. The other three impacted counties
can be interpreted as was Churchill County.
Table 20. Loss in Value of Output for Impacted Areas by Minimum and
Maximum Reductions in AUMs for Alternative 1 and Alternative
Alternative 1 Alternative 3
Area Minimum
Maximum
Minimum
Maximum
Churchill Direct $200,602 $263,492 $239,742 $334,970Secondary $91,443 $120,111 $109,281 $152,694TOTAL $292,443 $383,603 $349,027 $487,664Mineral Direct $38,190 $52,250 $57,038 $71,516Secondary $8,017 $10,968 $11,974 $15,013TOTAL $46,207 $63,218 $69,012 $86,529Pershing Direct $1,634 $4,978 $1,634 $4,978Secondary $154 $469 $154 $469TOTAL $1,788 $5,447 $1,788 $5,447Washoe Direct $2,546 $5,206 $2,546 $5,206Secondary $1,096 $2,242 $1,096 $2,242TOTAL $3,642 $7,448 $3,642 $7,448
42
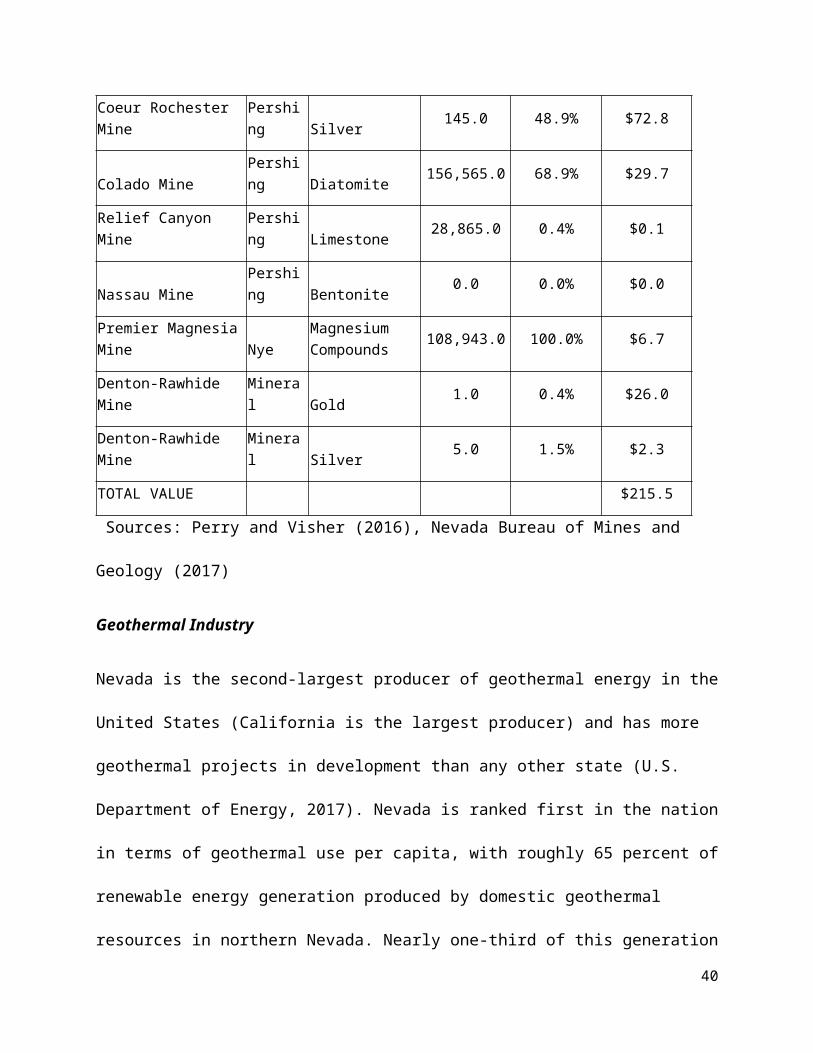
Table 21. Employment Loss Impacts for Impacted Area by Minimum and Maximum Loss of AUMs for Alternative 1 and 3.
Alternative 1 Alternative 3
Area Minimum
Maximum
Minimum
Maximum
Churchill Direct 1.16 1.39 1.52 1.94Secondary 0.59 0.71 0.78 0.99TOTAL 1.75 2.1 2.3 2.93Mineral Direct 0.74 1.02 1.11 1.39Secondary 0.19 0.26 0.29 0.36TOTAL 0.93 1.28 1.4 1.75Pershing Direct 0.01 0.02 0.01 0.02Secondary 0 0 0 0TOTAL 0.01 0.02 0.01 0.02Washoe Direct 0.06 0.13 0.06 0.13Secondary 0.01 0.02 0.01 0.02TOTAL 0.07 0.15 0.07 0.15
Table 22. Labor Income Losses for Impacted Areas by Minimum and Maximum Loss of AUMs for Alternative 1 amd Alternative 3.
Alternative 1 Alternative 3
Area Minimum
Maximum
Minimum
Maximum
Churchill Direct $6,781 $8,104 $8,906 $11,322Secondary $9,835 $11,754 $12,919 $16,424TOTAL $16,616 $19,858 $21,825 $27,746Mineral Direct $5,754 $7,872 $8,594 $10,775Secondary $476 $652 $711 $892TOTAL $6,230 $8,524 $9,305 $11,667Pershing Direct $451 $1,373 $451 $1,373Secondary $96 $292 $96 $292TOTAL $547 $1,665 $547 $1,665Washoe Direct $519 $1,061 $519 $1,061Secondary $362 $740 $362 $740TOTAL $881 $1,801 $881 $1,801
43
Mining Impacts
As stated earlier, there are 12 industrial active mineral mines and 9 geothermal power plants
located in Churchill County and adjacent areas in surrounding counties (Perry & Visher, 2016).
None of these mines or geothermal plants are in the proposed expansion area (Private
conversations with Perry and Visher, 2018). However, from conversations with Visher (2018)
and following materials supplied by the State Department of Minerals (2018b), reasonable
foregone mineral development in the FRTC area would be a gold mine similar to Rawhide mine.
Therefore the reasonable forgone mine development impacted would have direct output of
$24,500,000 and employment of 70 employees. This mine is assumed to be located in Churchill
County. Using the Churchill County input-output model, the total estimated economic impact,
employment and household income impacts for the lost foreseeable opportunity would be
$27,057,680, 90.0 employees, and $5,377,643, respectively.
Not only will opportunities for gold mining be restricted from FTRC, Visher (Personnel
Conversations, 2018; State of Nevada Department of Minerals, 2018a) determined that
reasonable foreseeable geothermal opportunities would also be reduced for Churchill, Mineral,
and Northern Nye Counties. Table 23 shows for Churchill County total employment,
employment, and household income impacts of lost foreseeable opportunities in county
geothermal development would be $28.5 million, 71.7 jobs, and $3.9 million, respectively.
Losses for Mineral and Northern Nye County can be interpreted in a similar fashion.
44

Table 23. Employment, Labor Income, and Value of Output Impacts
From Lost Reasonable Foreseeable Geothermal Opportunities in
Churchill, Mineral, and Nye Counties.
CountiesImpacts Churchill Mineral Northern Nye
Employment Direct 32.1 3.2 4.4Secondary 39.6 1.8 4.2Total 71.7 5.0 8.6Labor Income Direct $2,706,310 $410,007 $616,008Secondary $1,882,651 $176,809 $166,650Total $4,588,961 $586,816 $782,658Value of Output
Direct $22,615,111 $2,293,967 $3,060,871Secondary $5,858,423 $297,599 $778,457Total $28,473,534 $2,591,566 $3,839,328
Recreation Impacts
Public lands are characterized as having multiple use. Not only do ranching and mining activities
occur on these public lands but also recreation. Working with State of Nevada Department of
Wildlife, information as to restrictions on hunting were ascertained. Under Alternative 1 no big
horn hunting but under Alternative 3, big horn sheep hunting will be coordinated by the Navy on
B17 lands and DVTA hunting for everything will still be allowed. Working with State of Nevada
Department of Wildlife personnel, the reduction in number of hunters because land has been
withdrawn is shown in Table 24 by Alternative, species and county.
Also using expenditures for hunting data from the U.S. Fish and Wildlife Service national survey
(U.S. Fish and Wildlife Service, 2012), expenditures per hunter were derived. Also the survey
45
delineates hunting expenditures by expenditure item. If an expenditure item is purchased from a
retail sector, the value of the expenditure was margined so the only impact that occurs locally is
the value of the sale above operating costs. From Table 25 for Churchill County under
Alternative 1, total economic impacts to Churchill County from lost hunting would be a total of
$447.1 thousand with employment decreases of 3.5 employees and decreased labor income of
$112.2 thousand. From Table 26 for Churchill County under Alternative 1, total economic
impacts to Churchill County from lost hunting would be a total of $443.0 thousand with
employment decreases of 3.5 employees and decreased labor income of $111.3 thousand.
Additionally recreation would be impacted such as sightseeing, hiking, etc. Recreational impacts
for Mineral County, Pershing County, and Northern Nye County can be discussed in a similar
manner as was for Churchill County.
46
Table 24. Lost Number of Hunters by Alternative, Species and County from FRTC.
CountiesSpecies Churchill Mineral Northern Nye PershingDesert bighorn - 181 13.77 1.62 0.81 0Desert bighorn - 044, 182 0 0 0 0Desert bighorn, 183 0 0 0 0Mule deer (Junior), 181-184 3.5 0 0 0Mule deer (Any Legal), 181-184 8 0 0 0Mule deer (Muzzle) 181-184 0.85 0 0 0Mule deer (Archery) 181-184 2.2 0 0 0Pronghorn (Any Legal), 181-184 15.25 0 0 0Pronghorn (Archery), 181-184 7 0 0 0Pronghorn (Horns Shorter), 181-184 5 0 0 0Pronghorn (Any Legal), 205-208 0 0.98 0.42 0Pronghorn (Archery), 205-208 0 0.525 0.225 0Pronghorn (Any Legal), 043-046 0.72 0 0 2.88Pronghorn (Archery), 043-046 0.2 0 0 0.8Chucker 1,370.88 15.83 224.9 73.635Calf. Quail 0 0 29.645 0Mtn. Quail 0 0 0 0Rabbit 87.94 2.765 12.13 27.35TOTAL ALTERNATIVE 1 1,501.54 20.1 267.32 104.665TOTAL ALTERNATIVE 3 1,515.31 21.72 268.13 104.665
47
Table 25. Employment, Labor Income, and Value of Output Impacts from
Lost Hunting Opportunities from FRTC for Churchill, Mineral,
Pershing, and Northern Nye Counties Under Alternative 1.
Counties
Impacts ChurchillMineral
Pershing
Northern Nye
Employment Direct 3.1 0.1 0.3 1.6Secondary 0.4 0 0 0Total 3.5 0.1 0.3 1.6 Labor Income Direct $94,108 $1,339 $6,740 $39,735Secondary $18,164 $133 $326 $2,706
Total$112,27
2 $1,472 $7,006 $42,441 Value of Output
Direct$394,88
2 $3,556 $23,462 $69,964Secondary $52,218 $403 $1,226 $9,416
Total$447,10
0 $3,959 $24,688 $79,380
48

Table 26. Employment, Labor Income, and Value of Output Impacts from
Lost Hunting Opportunities from FRTC for Churchill, Mineral,
Pershing, and Northern Nye Counties Under Alternative 3.
COUNTIESIMPACTS Churchill Mineral Pershing Northern Nye
Employment Direct 3.1 0.1 0.3 1.6Secondary 0.4 0.0 0.0 0.0Total 3.5 0.1 0.3 1.6 Labor Income Direct $93,253 $1,229 $6,740 $39,593Secondary $17,999 $122 $326 $2,693Total $111,252 $1,351 $7,066 $42,286 Value of Output Direct $391,293 $3,268 $23,462 $69,664Secondary $51,743 $70 $1,226 $9,367
Total $443,036 $3,638 $24,688 $79,031
Potential Impacts to Public Sector Revenues
The withdrawal of public land for the proposed expansion would impact current and foreseeable
operations and expansions in the livestock, mining geothermal, potential water resources, and
recreational sectors. Withdrawal of lands would also impact local government revenues. A
primary source of county government revenues from public lands are PILT payments. Table
26show potential impacts on PILT payments from reductions in public lands from FRTC.
49
Table 27.Estimated Reductions in Payment in Lieu of Taxes at County Level, Alternative 1.
PILTChurchill County
Lyon County
Mineral County
Nye County
Pershing County
Acreage Proposed for Withdrawal (Alternative 1) (acres) 544,902 4,074 84,704 30,188 21,6552017 PILT Amount Per Acre ($/acre) $2.66 $2.66 $0.37 $0.04 $0.37Estimated Reduction in PILT ($) - 10,837.30 31,340.02 11,169.47 -Percent Reduction (Based on 2017 PILT) 0.00% 0.50% 4.37% 0.35% 0.00%
Churchill County even with its large reduction in public lands will see no change in PILT
payments. This is due to their payment methodology of Population Limited under Formula A.
All of these counties are impacted differential because of payment mechanisms of the PILT
system. (Appendix A has a discussion on PILT and its calculations.)
Also with range expansion, foreseeable industries in livestock, mining, and geothermal power
will not be operating which would reduce future sales and use taxes.
Also sales taxes will be lost for some counties. In the state of Nevada, some rural counties
receive a guaranteed amount of sales tax revues. For counties that are not guaranteed counties,
Churchill and Nye counties, they will realize less sales tax revenues. Additionally, the state
would also lose funding from wildlife applications fees, resident and non-resident license and
tags of approximately $20 thousand. In addition, the state would lose wildlife funding match
from the Federal government of 3 federal dollars to 1 state, which would be approximately $60
50
thousand. In total, the State of Nevada Department of Wildlife could potentially lose $80.0
thousand from range restrictions of FRTC.
Conclusions
The Fallon Training Complex Modernization proposes to withdraw approximately 230,000 acres
of public land for training purposes. This withdrawal would primarily impacts counties such as
Churchill County but also Mineral, Pershing, Lyon, and Northern Nye counties. The study
investigated the socio-economic impacts of alternatives 1 and 3 of the withdrawal. The counties
impacted by this withdrawal have been recovering from the Great Recession, which impacted the
state of Nevada and its counties very hard. Many of the counties have not returned to pre-
recession levels but their recovery has been steady.
To derive the economic, employment, and household income impacts of alternatives 1 and 3, an
input-output model was employed. The model used for the analysis was verified and validated
before its use. Impacts were derived for reduced range livestock and mining operations as well as
reduced outdoor recreation.
Economic impacts from reduced range livestock operations ranged from a minimum of $292.4
thousand under alternative 1 for Churchill County to $487.7 thousand for alternative 3 in
Churchill County. If foreseeable gold and geothermal opportunities do not come to fruition,
Churchill County could lose $27.1 million and $28.5 million in economic activity from these
proposed operations. Hunting recreation would also be impacted in Churchill County by
withdrawal of public lands. It was estimated that total economic impact of land withdrawal from
lower leveling of recreational activity would be $447.1 thousand under Alternative 1 and $443.0
thousand under Alternative 3.
51
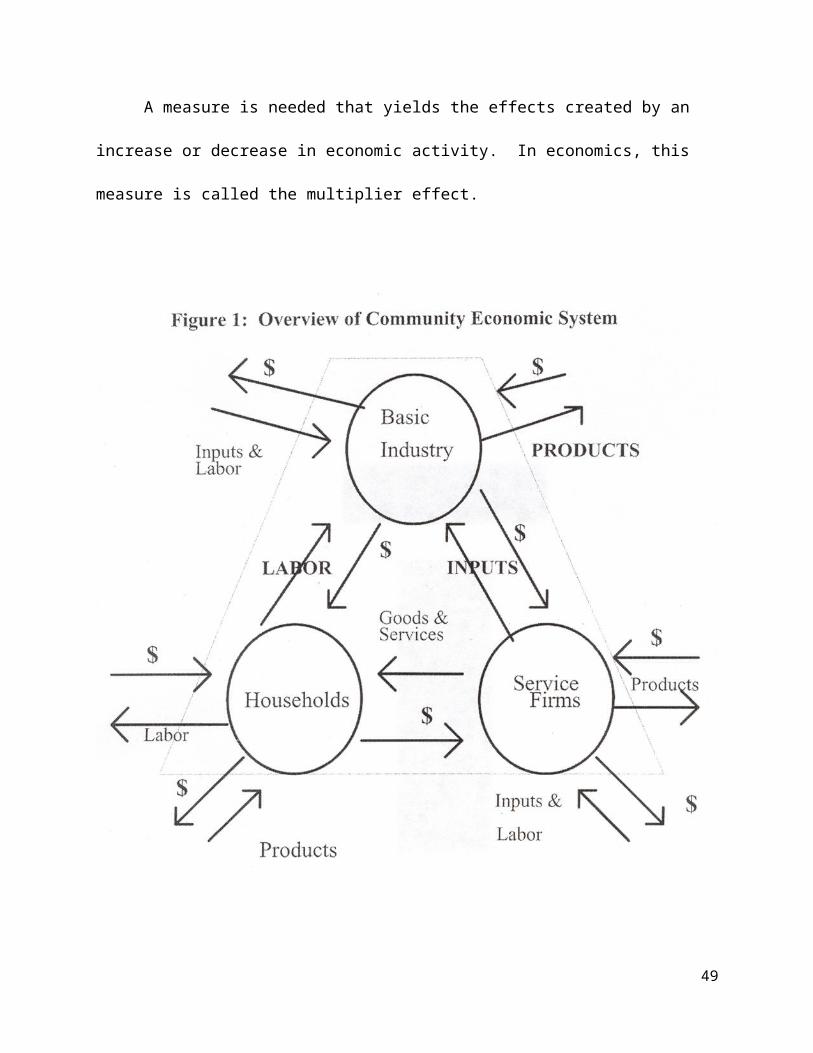
Not only would there be impacts to local economic activity but also county and state fiscal
balances would be impacted. Reduced range livestock activity would lower agricultural property
taxes as well as net proceeds of mining. The State of Nevada Wildlife Department could
potentially realize losses of matching federal dollars of $60 thousand, which would contribute to
overall loss of approximately $80.0 thousand for the department.
The Fallon NAS plays an important role in the economy of Churchill County and historically has
been a basic economic sector of the county. These withdrawals will impact current and
foreseeable economic development and growth on public. This study hopefully adds information
for weighing decisions on expansion of NAS Fallon Naval air station training space.
52
REFERENCES
Alevy, J., E. Fadali, and T. Harris (2006). Analysis of Impacts of Public Grazing on the Elko
County Economy and Mountain City Management Area: Economic Impacts of
Federal Grazing in Elko County. University Center for Economic Development,
University of Nevada, Reno, University Center Technical Report UCED 2006/07-03.
Baumol, W. (2000). “Leontief’s Great Leap Forward Beyond Quesney, Marx, and von
Bortkiewicz”. Economic Systems Research, 12(2):141-152.
Bourque, P., E. Chambers, J. Chiu, F. Denman, B. Dowdle, G. Gordon, M. Thomas, C. Tiebout,
and E. Weeks. (1967). The Washington Economy: An Input-Output Study. University
of Washington Graduate School of Business Administration: Seattle, WA.
Curtis, K. R., R. Koewler and W. W. Riggs (2005). Eureka County Forage Establishment and
Production Costs, 2004. Reno, Nevada, University of Nevada, Reno Cooperative
Extension.
Elrod, R. and P. Laferney. (1972). Sector Income and Employment Multipliers-Their
Interactions on the National Economy. U.S. Department of Agriculture, ERS,
Technical Bulletin No. 1421, Washington, D.C.
Emerson. M. (1969). The Interindustry Structure of the Kansas Economy. Kansas Office of
Economic Analysis and Kansas Department of Economic Development, Topeka, Kansas.
Foran, B., M. Lenzen, and C. Dey. (2005). Balancing Act – A Triple Bottom Line Account of
the Australian Economy, Canberra, ACT, Australia, CSIRO Resource Futures and the
University of Sydney.
53
Grubb, H. (1973). The Structure of the Texas Economy. Office of the Governor, Office of
Information Services, Austin, Texas.
IMPLAN (2014). Reference Manual (Users Guide to IMPLAN Version 3.0Software).
https://implan.com/index.php?options=com
multicategories&view=categories&layout=blog&categories&cid=222:referencemanualus
ersguidetoimplanversion30software<emid=14.
Leontief, W. (1936). “Quantitative Input-Output Relations in the Economic System of the United
States”. The Review of Economics and Statistics, 18:105-125.
Miernyk, W., K. Shellhammer, D. Brown, R. Coccari, C. Gallagher, and W. Wineman. (1970).
Simulating Economic Development: An Interindustry Analysis of the West Virginia
Economy. D.C. Heath and Co.: Lexington, MA.
Nevada State Demographer.(2014). 2014 Population Estimates, Nevada Taxation Department,
Carson City.
Osborn, J., H. Grubb, T. Harris, and T. Swan. (1973). An Input-Output Model Analysis of the
Texas High Plains Labor Employment Potentials to 1980. Office of Information
Services, Austin, Texas, Technical Report T-1-116.
Perry, R. and M. Visher. (2016). Major Mines of Nevada 2015: Mineral Industries in the
Nevada Economy. Nevada Division of Minerals, Carson City, Nevada, Special
Publication P-27.
Perry, R. and M. Visher. (2018). Private Conversation. Nevada Division of Minerals, Carson
City, Nevada.
54
State of Nevada Commission on Minerals. (2018a). “Geothermal Energy Analysis for the
Proposed Fallon Range and Training Complex Modernization Land Withdrawal”. Draft
Memo. Division of Minerals, Carson City, Nevada.
State of Nevada Commission on Minerals. (2018b). “Mineral Resource Assessment for Certain
Lands Within the Proposed Fallon Range and Training Complex Modernization Land
Withdrawal”. Draft Memo. Division of Minerals, Carson City, Nevada.
Torell, L., J. Tanaka, N. Rimby, T. Darden, L. Van Tassell, and A. Harp. (2002). Ranch-Level
Impacts of Changing Grazing Policies on BLM Land to Protect the Greater Sage-
Grouse: Evidence from Idaho, Nevada, and Oregon. Policy Analysis Center for
Western Public Lands, Caldwell, Idaho.
U.S. Census Bureau. (2000a). Profile of General Demographic Characteristics: 2000. Census
2000 Summary File (SF1) 100 Percent Data estimates for the State of Nevada. Retrieved
from https://factfinder.census.gov/faces/tableservices/jsf/pages/productview.xhtml?
src=CF
U.S. Census Bureau. (2000b). Profile of General Demographic Characteristics: 2000. Census
2000 Summary File (SF1) 100 Percent Data estimates for the Churchill County, Nevada.
Retrieved from
https://factfinder.census.gov/faces/tableservices/jsf/pages/productview.xhtml?src=CF
U.S. Census Bureau. (2000c). Profile of General Demographic Characteristics: 2000. Census
2000 Summary File (SF1) 100 Percent Data estimates for the City of Fallon. Nevada.
Retrieved from
https://factfinder.census.gov/faces/tableservices/jsf/pages/productview.xhtml?src=CF
55
U.S. Census Bureau. (2010a). Profile of General Population and Housing Characteristics: 2010
Demographic Profile Data estimates for the State of Nevada. Retrieved from
https://factfinder.census.gov/faces/tableservices/jsf/pages/productview.xhtml?src=CF
U.S. Census Bureau. (2010b). Profile of General Population and Housing Characteristics: 2010
Demographic Profile Data estimates for Churchill County, Nevada. Retrieved from
https://factfinder.census.gov/faces/tableservices/jsf/pages/productview.xhtml?src=CF
U.S. Census Bureau. (2010c). Profile of General Population and Housing Characteristics: 2010
Demographic Profile Data estimates for City of Fallon, Nevada. Retrieved from
https://factfinder.census.gov/faces/tableservices/jsf/pages/productview.xhtml?src=CF
U.S. Census Bureau. (2016a). 2016 Lyon County Business Patterns. Retrieved from
https://factfinder.census.gov/faces/nav/jsf/pages/index.xhtml
U.S. Census Bureau. (2016b). 2012-2016 American Community Survey 5-Year Estimates for the
City of Fallon, Nevada. Retrieved from
https://factfinder.census.gov/faces/tableservices/jsf/pages/productview.xhtml?src=CF
U.S. Census Bureau. (2016c). 2016 Nye County Business Patterns. Retrieved from
https://factfinder.census.gov/faces/nav/jsf/pages/index.xhtml
U.S. Census Bureau. (2016d). 2016 Pershing County Business Patterns. Retrieved from
https://factfinder.census.gov/faces/nav/jsf/pages/index.xhtml
U.S. Census Bureau. (2016e). Demographic and Housing Estimates. American Community
Survey 2012-2016. 5-Year Estimates for the City of Fallon, Nevada. Retrieved from
https://factfinder.census.gov/faces/tableservices/jsf/pages/productview.xhtml?src=CF
56
U.S. Census Bureau. (2016f). 2012-2016 American Community Survey 5-Year Estimates for the
United States. Retrieved from
https://factfinder.census.gov/faces/tableservices/jsf/pages/productview.xhtml?src=CF
U.S. Census Bureau. (2016g). 2012-2016 American Community Survey 5-Year Estimates for the
State of Nevada. Retrieved from
https://factfinder.census.gov/faces/tableservices/jsf/pages/productview.xhtml?src=CF
U.S. Census Bureau. (2016h). 2012-2016 American Community Survey 5-Year Estimates for
Churchill County, Nevada. Retrieved from
https://factfinder.census.gov/faces/tableservices/jsf/pages/productview.xhtml?src=CF
U.S. Census Bureau. (2016i). 2012-2016 American Community Survey 5-Year Estimates for the
State of Nevada, Churchill County, and the City of Fallon. Retrieved from
U.S. Bureau of Land Management and ManTech International Corporation. (2018). Personal
Conversations.
U.S. Geological Survey, Gap Analysis Program, 2016. Protected Areas Data Base of the United
State (PADUS). Version 1.4.
U.S. Fish and Wildlife Service. (2012). 2011 National Survey of Fishing, Hunting, and
Wildlife-Associated Recreation: National Overview. U.S. Department of Interior,
Washington, DC.
Visher, M. (2018). Private Conversation. Nevada Division of Minerals, Carson City, Nevada.
57

APPENDIX A: EXPLANATION OF PAYMENT IN LIEU OF TAXES
58
Payment in Lieu of TaxesThe Payment in Lieu of Taxes (“PILT”) program began in 1976 following the enactment of Public Law 94-565. Federal PILT payments were designed to supplement other federal land receipt sharing payments and are made to local government units who are allowed to spend it for any governmental purpose. Due to its distinction as the largest federal land management agency, the BLM was chosen by the Secretary of Interior to administer the PILT program. The Act has undergone several changes since 1976. In September 1982, it was amended and recorded as Chapter 69, 31 U.S.C. In July 1983, it was amended to clarify the definition of “unit of general local government,” and authorized state governments to redistribute payments to smaller units of governments through legislation. The most recent changes occurred following the passage of an Act in 1994 which increased payments to each county. There are three sections in the Act that distribute money to the states: Section 6904, Section 6905 and Section 6902. Table 1 shows the distribution of funds by section for counties in the state of Nevada. Also, figure 1 shows the distribution of 2017 fiscal year PILT payments by county for the state of Nevada and entitlement acreage in each county.
Section 6904Section 6904 authorized payments for lands acquired after December 31, 1970 which were additions to the National Park System or National Forest Wilderness Areas. These lands must have been subject to local real property taxes within the five-year period preceding the acquisition by the Federal government. Payments are made annually for five years following the acquisition and are one percent of the fair market value of the lands at the time of acquisition. The annual payments may not exceed the amount of taxes levied on the property during the year previous to the purchase. The Act stipulates Section 6904 payments must be distributed to local governments and school districts, which have incurred losses of real property taxes prior to the acquisition of these lands. Payments are distributed proportional to tax revenues, which were levied by local governments and school districts in the year prior to the acquisition of these lands.
Section 6905This Section specifically applies to land within the Redwood National Park or the LakeTahoe Basin. Payments are figured the same as Section 6904, but continue until the total amount equals 5 percent of the fair market value of the lands at the time of acquisition. These payments may be used for any governmental purpose.
Section 6902Section 6902 payments are calculated using one of two equations based on “entitlement lands” within the respective county. Entitlement lands refer to lands owned by the United StatesGovernment and include lands in the National Park System, the National Forest System, lands administered by the Bureau of Land Management, or lands involved in Government water resource development projects. Other lands included are: semi-active installations used for nonindustrial purposes, dredge disposal areas under the jurisdiction of the Secretary of the Army.National Wildlife Reserve areas withdrawn from the public domain, semi-active Army installations used for non-industrial purposes, and some lands donated to the United States Government by State and local governments. The payment is figured by taking the higher of the following two formulas. Formula A is $2.66 times the number of entitlement land acreage in the
59
county minus the payment made last year. The BLM PILT report clarifies that: “only the amount of Federal land payments actually received by units of government in the prior fiscal year are deducted. If a unit of government receives a Federal land payment, but is required by State law to pass all or part of this payment to financially and politically independent school districts, or other single or special purpose district, such redistributed payments are considered to have not been received by the unit of local government and are not deducted from the in-lieu payment. The amounts to be deducted are reported to the Bureau of Land Management each year by the Governor of each State or his delegate.” The formula value is restricted by a population payment ceiling figured by multiplying the county's population by the appropriate figure. Populations are based on the most recent census figures. A government may not be credited with a population greater than 50,000and populations between 5,000 and 50,000 are rounded to the nearest 1,000.
If the calculated value of $2.66 times the number of entitlement acres exceeds the ceiling, the ceiling value minus last year's payment is the result of Formula A.
Formula B is much simpler and figured by taking thirty-seven cents times the number of entitlement acres. As with Formula A, the population payment ceiling is binding. Tables 1, 2, and 3 show values used in determining 2017 Nevada PILT payments. Figure 1 shows the county PILT payments and entitlement acres for fiscal year 2017.
Recent Changes in the PILT ActBy October of 1994, both the House and Senate passed an amendment to the PILT Act that proposed a number of changes. On the 22nd of the same month, the President enacted the amendment by signing Public Law 103-397. In general, the enactment: “would more than double authorization levels and link authorization levels to future changes in the consumer price index.”...because... “The present system of shared receipts bears no relationship to the direct or indirect burdens placed on local governments by the presence of federal lands”. The catalyst for the enactment was a report written by M. Lynne Corn who recognized PILT payments have not kept pace with inflation. The report also concluded PILTs were no longer a true compensation for taxes, were widely fluctuating, had no mechanism to keep the State level from taking advantage of the system, ceiling limits caused problems, and the current formula provided less income to poor counties and more to rich counties.
60
Figure 1
Carson City
Churchill
Clark
Douglas
Elko
Esmeralda
Eureka
Humboldt
Lander
Lincoln
Lyon
Mineral
Nye
Pershing
Storey
Washoe
White Pine
0 1000000 2000000 3000000 4000000 5000000 6000000 7000000 8000000 9000000
Federal Payment In Lieu of Taxes to Nevada Counties Entitlement Acres and PILT Payment, Fiscal Year 2017
PILT $ ENTITLEMENT ACRES
61
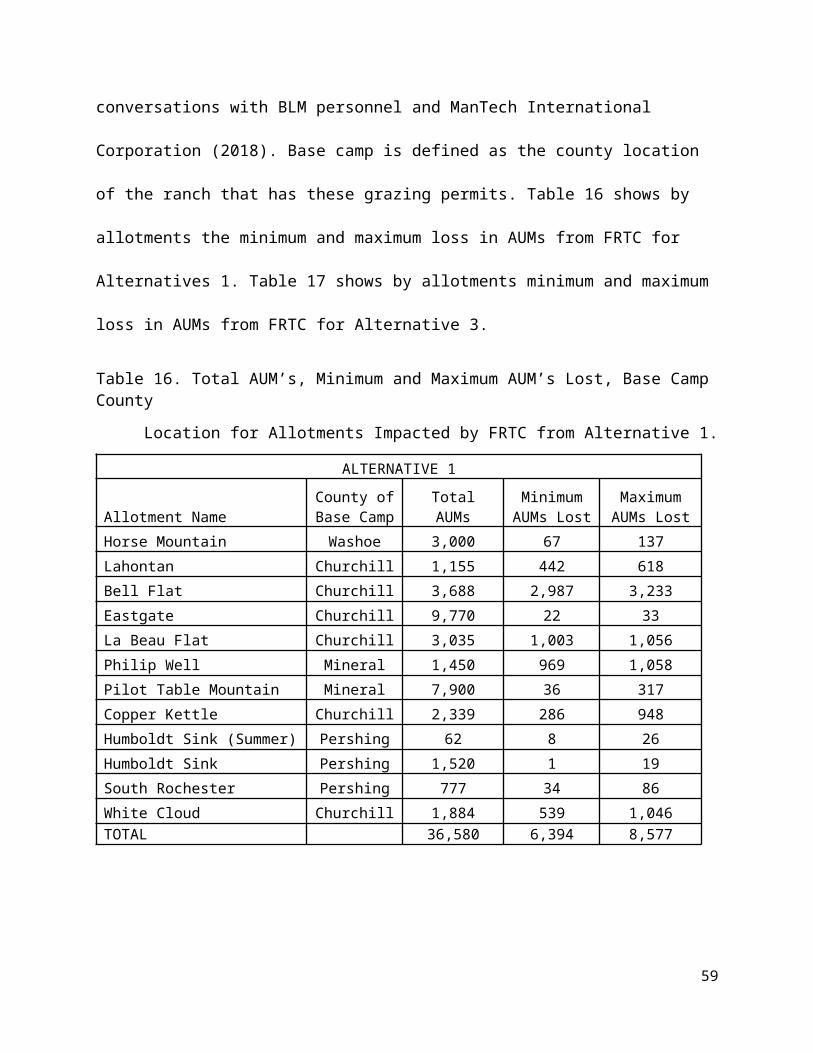
Table 1: Federal Payments in Lieu of Taxes to Nevada by County Fiscal year 2017
CountySection 6902 Payments Sec 6904
&6905 Payment
Est Payment to County
Entitlement Acres
Prior Year Payment
Unit Population Ceiling Alternative A Alternative B
Carson City 42817 $ 5,127 50000 $ 3,578,373 $ 108,794 $ 15,842 $ 594 $ 109,045 Churchill 2158533 $ - 24000 $ 2,267,280 $ 2,267,280 $ 798,657 $ - $ 2,260,796 Clark 4820547 $ 116,421 50000 $ 3,467,079 $ 3,467,079 $ 1,783,430 $ 677 $ 3,457,840 Douglas 256442 $ 14,628 48000 $ 3,503,772 $ 667,615 $ 94,898 $ 5,510 $ 671,200 Elko 7904310 $ 13,676 50000 $ 3,569,824 $ 3,569,824 $ 2,924,851 $ - $ 3,559,616 Esmeralda 2253252 $ 16,634 5000 $ 131,881 $ 131,881 $ 148,515 $ - $ 148,090 Eureka 2156894 $ 68,996 5000 $ 292,170 $ 292,170 $ 361,166 $ - $ 360,133 Humboldt 4979933 $ 74,172 17000 $ 1,697,228 $ 169,722 $ 1,771,400 $ - $ 1,766,335 Lander 3333646 $ 58,402 6000 $ 948,278 $ 948,278 $ 1,006,680 $ - $ 1,003,801 Lincoln 6411587 $ 24,595 5000 $ 871,155 $ 871,155 $ 895,750 $ - $ 893,189 Lyon 859769 $ 132,665 50000 $ 3,450,835 $ 2,154,321 $ 318,115 $ - $ 2,148,161 Mineral 1937258 $ 151,147 5000 $ 651,087 $ 651,087 $ 716,526 $ - $ 714,477 Nye 8548257 $ 803,353 42000 $ 2,480,627 $ 2,480,627 $ 3,162,855 $ - $ 3,153,811 Pershing 2919284 $ - 7000 $ 1,105,790 $ 1,105,790 $ 1,079,972 $ - $ 1,102,628 Storey 14498 $ - 5000 $ 714,271 $ 38,502 $ 5,355 $ - $ 38,392 Washoe 2931912 $ 28,083 50000 $ 3,555,417 $ 3,555,417 $ 1,084,824 $ 1,916 $ 3,547,161 White Pine 5192782 $ 265,913 10000 $ 987,787 $ 987,787 $ 1,253,700 $ - $ 1,250,115
62
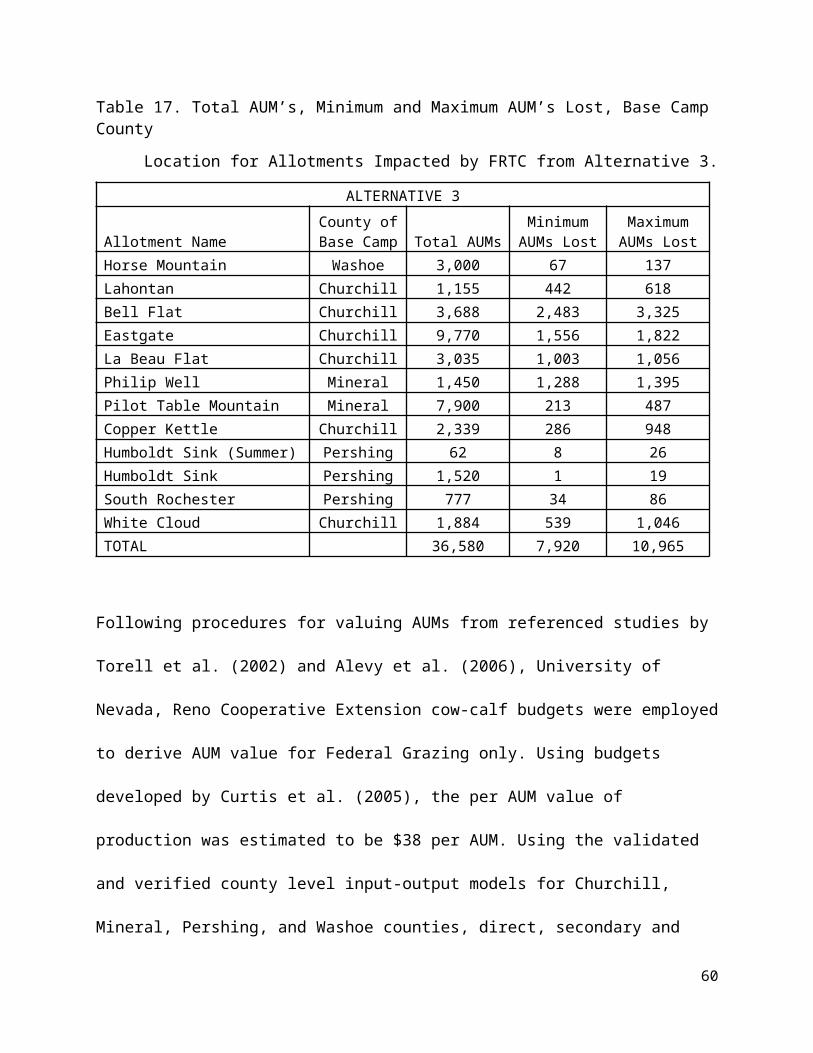
Table 2: Population of Nevada Counties Used in 2017 PILT Calculations
COUNTY 2017 Estimated Population Population Used in PILT Calculations
Carson City 54,745 50,000 Churchill 24,230 24,000 Clark 2,204,079 50,000 Douglas 109,405 48,000 Elko 52,649 50,000 Esmeralda 850 5,000 Eureka 1,961 5,000 Humboldt 16,826 17,000 Lander 5,775 6,000 Lincoln 5,223 5,000 Lyon 54,122 50,000 Mineral 4,457 5,000 Nye 44,202 42,000 Pershing 6,508 7,000 Storey 4,006 5,000 Washoe 460,587 50,000 White Pine 9,592 10,000
63
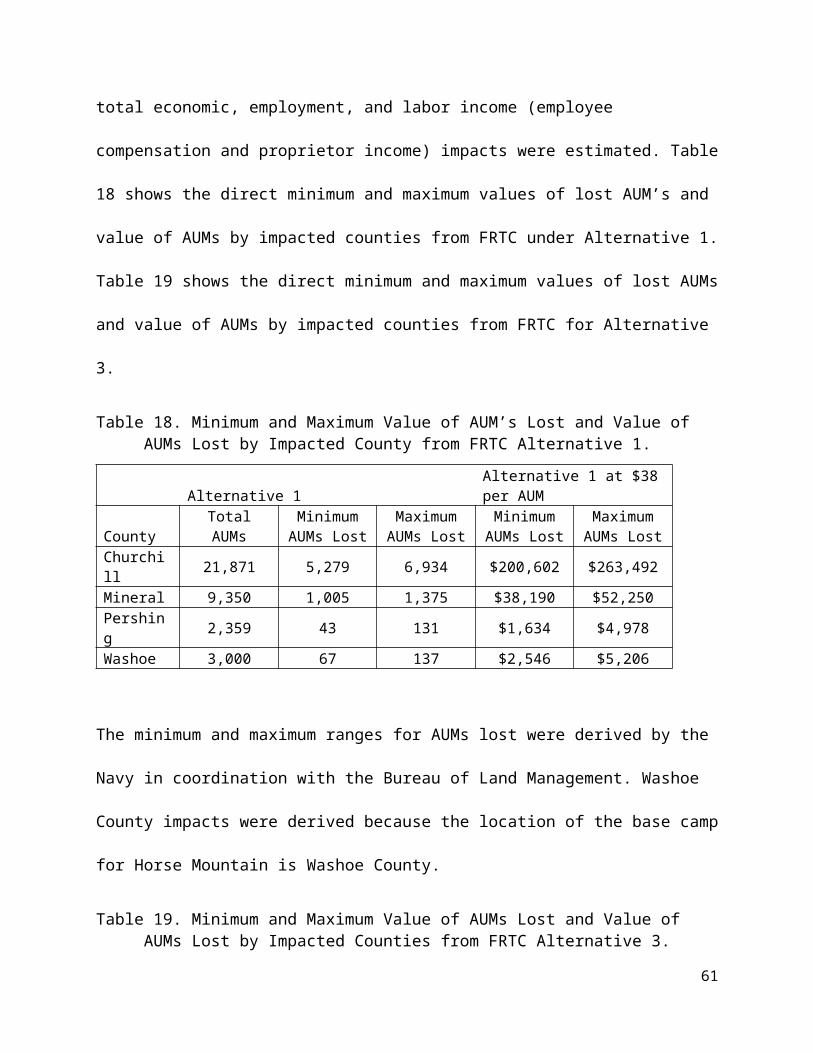
Table 3: Population Constraints for Payment in Lieu of Taxes Fiscal Year 2017
If population is Payment shall not exceed the amount less than or equal to computed by multiplying such population by:
5000…………………………………………………………………………………………
$179.15
6000…………………………………………………………………………………………
$167.78
7000…………………………………………………………………………………………
$157.97
8000…………………………………………………………………………………………
$146.61
9000…………………………………………………………………………………………
$136.80
10000…………………………………………………………………………………………
$125.37
11000…………………………………………………………………………………………
$122.17
12000…………………………………………………………………………………………
$118.92
13000…………………………………………………………………………………………
$114.02
14000…………………………………………………………………………………………
$110.76
15000…………………………………………………………………………………………
$107.48
16000…………………………………………………………………………………………
$105.86
17000…………………………………………………………………………………………
$104.20
18000…………………………………………………………………………………………
$102.61
19000…………………………………………………………………………………………
$100.99
20000………………………………………………………………………………………… $99.40
21000………………………………………………………………………………………… $97.72
22000………………………………………………………………………………………… $96.10
23000………………………………………………………………………………………… $96.10
24000………………………………………………………………………………………… $94.47
25000………………………………………………………………………………………… $92.85
26000 …………………………………………………………………………………… $91.21
64
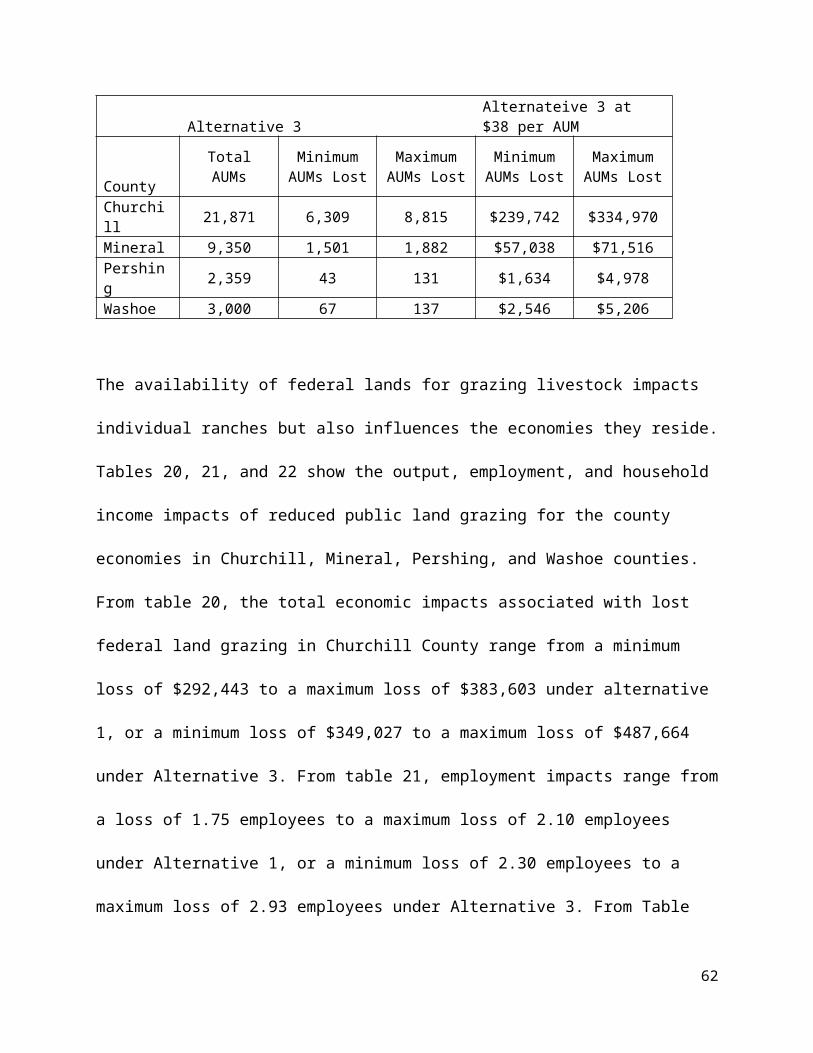
……
27000………………………………………………………………………………………… $91.21
28000………………………………………………………………………………………… $91.21
29000………………………………………………………………………………………… $89.61
30000………………………………………………………………………………………… $89.61
31000………………………………………………………………………………………… $87.95
32000………………………………………………………………………………………… $87.95
33000………………………………………………………………………………………… $86.31
34000………………………………………………………………………………………… $86.31
35000………………………………………………………………………………………… $84.67
36000………………………………………………………………………………………… $84.67
37000………………………………………………………………………………………… $83.05
38000………………………………………………………………………………………… $83.05
39000………………………………………………………………………………………… $81.45
40000………………………………………………………………………………………… $81.45
41000………………………………………………………………………………………… $79.79
42000………………………………………………………………………………………… $78.19
43000………………………………………………………………………………………… $78.19
44000………………………………………………………………………………………… $76.53
45000………………………………………………………………………………………… $76.53
46000………………………………………………………………………………………… $74.93
47000………………………………………………………………………………………… $74.93
48000………………………………………………………………………………………… $73.30
49000………………………………………………………………………………………… $73.30
50000 …………………………………………………………………………………… $71.67
65
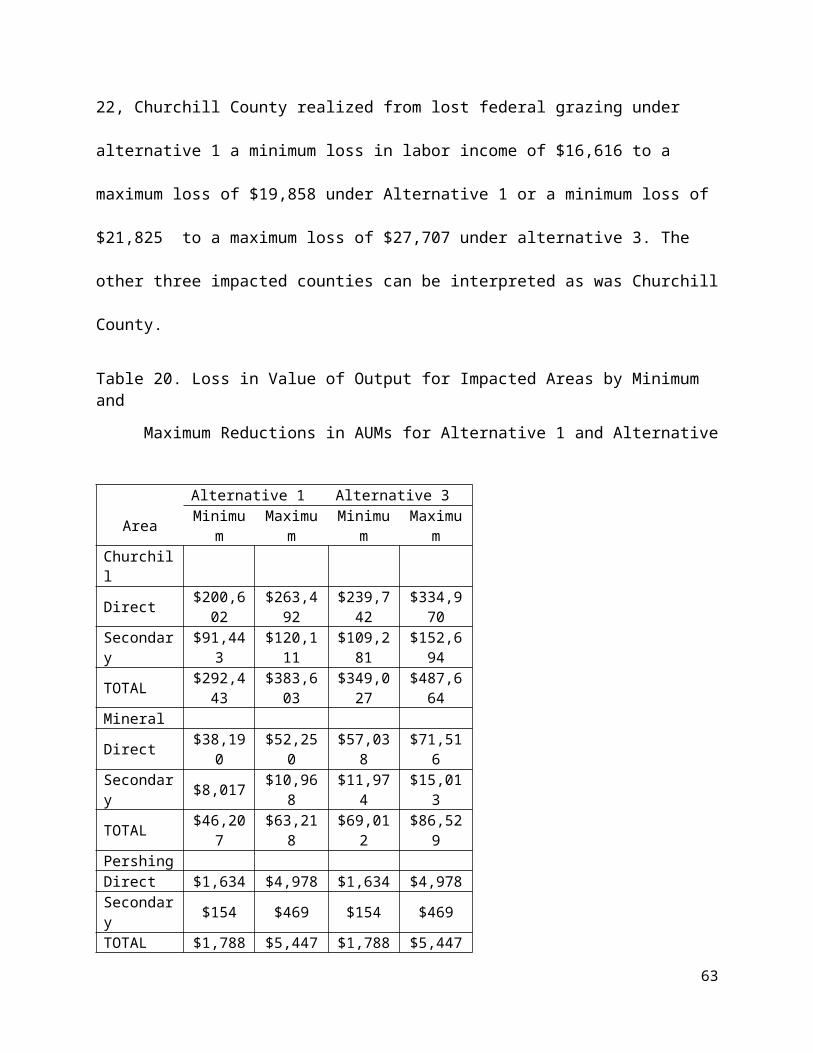
……
66
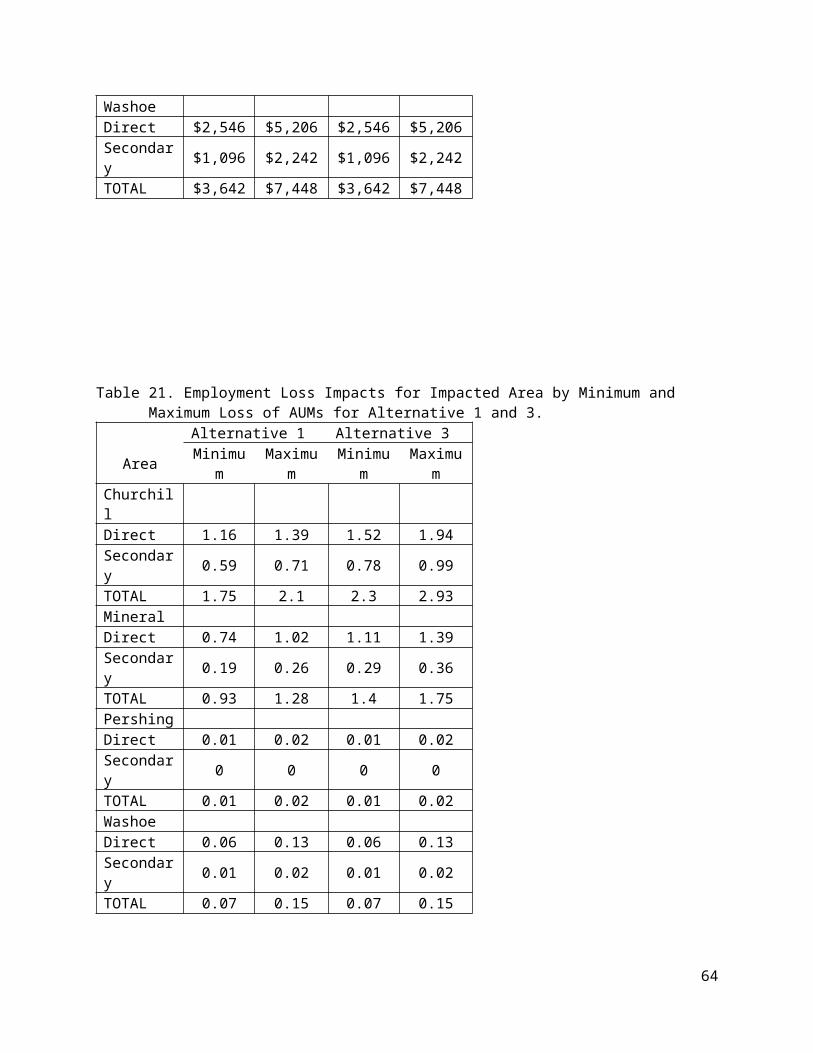
2017 FALLON NAS Acreage Proposed for Withdrawal
The counties up for proposed acreage withdrawal for Fallon NAS are Churchill County, Lyon County, Mineral County, and Pershing County. Of these counties, only Lyon County, Mineral County, and Nye County would experience a loss in PILT payments due to acreage withdrawal based on 2017 PILT estimates.
Churchill County and Pershing County both receive PILT payments based on the Population Limited Alternative A plan. This means Churchill County and Pershing County are capped on PILT payments based on population, not on entitlement acreage. In 2017, Churchill County had a population limited PILT ceiling of $2,267,280. Since Churchill Counties non-ceiling Alternative A PILT payment was valued at $5,741,698 and is above the population limited PILT ceiling, Churchill County received the valuation of the Population Limited Alternative A PILT payment. The proposed acreage reduction of 544,902 acres would reduce the non-ceiling Alternative A PILT payment to $4,292,258 that is still above the population limited PILT ceiling of $2,267,280. Thus, Churchill County would experience no change in PILT payment due to the proposed acreage withdrawal.
In 2017, Pershing County had a population limited PILT ceiling of $1,105,790. Pershing County’s non-ceiling Alternative A PILT was valued at $7,764,725, but was above the population limited PILT ceiling. Thus, Pershing County received the Population Limited Alternative A PILT payment of $1,105,790. The proposed acreage withdrawal of 21,655 would still result in a non-ceiling Alternative A PILT valuation that is above the population limited ceiling ($7,706,522). Thus, Pershing County would experience no change in PILT payment due to the proposed acreage withdrawal.
Lyon County, Mineral County, and Nye County follow non-ceiling Alternative A, non-ceiling Alternative B, and non-ceiling Alternative B plans, respectively. This means that their PILT payment valuation is calculated based on acreage not on population. Thus, Lyon County, Mineral County, and Nye County would experience changes to their PILT payments due to the proposed acreage withdrawal.
Table 4 reports the estimated changes to PILT Payment Structure for the proposed acreage withdrawal based on 2017 PILT information.
67
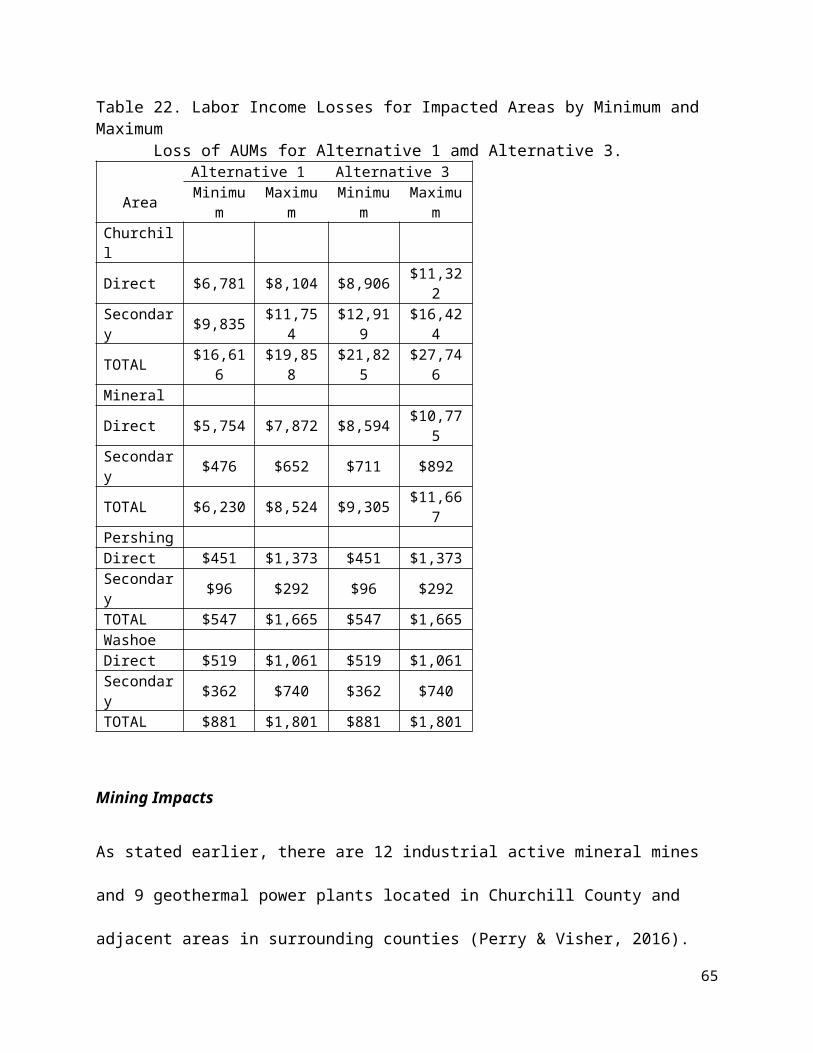
Table 4: Estimated Reduction in Payments in Lieu of Taxes Made to Counties Under Alternative 1
PILT Churchill County Lyon County Mineral
County Nye County Pershing County
Acreage Proposed for Withdrawal (Alternative 1) (acres)
544,902 4,074 84,704 30,188 21,655
2017 PILT Amount Per Acre ($/acre) $ 2.66 $ 2.66 $ 0.37 $ 0.37 $ 0.37
Estimated Reduction in PILT ($)
- $ 10,837.30 $ 31,340.02 $ 11,169.47 -
Percent Reduction (Based on 2017 PILT)
0.00% 0.50% 4.37% 0.35% 0.00%
68