· web view2 proteins (at least reported by 2 literatures) retrieved from glad4u tools was using a...
TRANSCRIPT

Biased random walk model for the
prioritization of drug resistance associated
proteins
Hao Guo1,2§, Jiaqiang Dong1§, Sijun Hu1§, Xiqiang Cai1, GuangboTang1, Jianhua
Dou1, Miaomiao Tian1, FuchuHe2*, Yongzhan Nie1*, Daiming Fan1*
Supplementary Methods
Selection of restart probability in random walk model
The restart parameter r controls the return probability of each random step to seed
nodes. If r is close to 0, the algorithm will provide a more comprehensive view of the
network structure around the seed nodes. If r is close to 1, a restricted view of the
neighborhood of seed nodes will be obtained1. The selection of r value seems
empirical in different research. In disease gene prioritization research, random walk
with r=0.7 was used to infer gene phenotype relationships2. In biological pathway or
network motif identification research3, r value was set to 0.01. In VAVIEN model4, by
calculating the average rank of the target gene after LOO cross validation, the author
claims that VAVIEN appears to be stable in the range [0.3-0.9] of r and provides a

best performance when r is set to 0.5. We also investigated the effect of r selection on
the performance of ProteinRank using LOO cross validation. The performance here is
measured in terms of the mean rank ratio of the seed protein among 100 candidates (1
seed and 99 random proteins), a lower value indicating better performance.
ProteinRank appears to be robust in the range [0.4, 0.6] and reaches a best
performance at r=0.4. Therefore, we set r=0.4 in ProteinRank model.
Permutation Test
A statistical P value of the sum of the absolute PCC has been calculated in terms of
permutation test. In short, 1) the original paired correlation score of a protein i in the
network is RankScore(seeds,i); 2) a new score RankScore(seeds,i’) is redefined
randomly where i’ is randomly drew from the permutation set of {1,…,n} (n is the
total number of the proteins in the network); 3) a new RankScore is calculated from
the randomized data; 4) by repeating step 2) and 3) 50000 times, the P value equals to
the proportion of the RankScores generated in step 3) which are greater than the
original RankScore obtained in step 1). The significance level is set to 0.05.
References
1. El Dayeh, M. & Hahsler, M. in Computational Intelligence in Bioinformatics and
Computational Biology (CIBCB), 2012 IEEE Symposium on 229-236 (IEEE, 2012).
2. Li, Y. & Patra, J.C. Genome-wide inferring gene-phenotype relationship by
walking on the heterogeneous network. Bioinformatics 26, 1219-24 (2010).

3. Komurov, K., White, M.A. & Ram, P.T. Use of data-biased random walks on
graphs for the retrieval of context-specific networks from genomic data. PLoS
Comput Biol 6 (2010).
4. Erten, S., Bebek, G. & Koyuturk, M. Vavien: an algorithm for prioritizing
candidate disease genes based on topological similarity of proteins in interaction
networks. J Comput Biol 18, 1561-74 (2011).
Supplementary Information
Supplementary Table 1. ADR related proteins collected from DrugBank and
GLAD4U. Supplementary Table 2. VCR related proteins collected from DrugBank
and GLAD4U. Supplementary Table 3. Proteins with altered expression levels in
ADR resistant cells identified by iTRAQ-MS/MS listing the accession number;
protein name; gene symbol; unused and % coverage for each protein; peptides (95%);
iTRAQ ratios for 114:113 (SGC7901/ADR: SGC7901) and P Value. Supplementary
Table 4. Proteins with altered expression levels in VCR resistant cells identified by
iTRAQ-MS/MS listing the accession number; protein name; gene symbol; unused and
% coverage for each protein; peptides (95%); iTRAQ ratios for 115:113
(SGC7901/VCR: SGC7901) and P Value. Supplementary Table 5. ProteinRank
scores for the 11 seed proteins and the top 100 ranked proteins in ADR study.
Supplementary Table 6. The top 100 ranked proteins using VAVIEN with 11 seeds in
ADR sutdy. Supplementary Table 7. ProteinRank scores for the 12 seed proteins and
the top 100 ranked proteins in VCR study. Supplementary Table 8. The top 100
ranked proteins using VAVIEN with 12 seeds in VCR study.

Supplementary Figure1. Expression levels and interactions among seeds and
differentially expressed proteins identified by MS in ADR study.
Supplementary Tables:
Table 1. ADR related proteins (with at least 1 PPI) collected from DrugBank and
GLAD4U
Gene Symbol HPRD ID DrugBank1 GLAD4U PubMed ID2
TOP2A 536 Target -CYP3A4 484 Enzyme -ABCB1 1370 Transporter -ABCB8 4436 Transporter -ABCB11 10400 Transporter -ZNRD1 9601 - [18058465], [12795835]
MAD2L1 3274 - [20440596], [16214181]TERT 1754 - [18396642], [12579337]BCL2 1045 - [18478476], [12579337]AKT1 1261 - [20514451], [19062713]BAD 4409 - [18449891], [16911523]
1 Protein list was retrieved from DrugBank under the category of doxorubicin.2 Proteins (at least reported by 2 literatures) retrieved from GLAD4U tools was
using a search key word: gastric cancer doxorubicin resistance.
Table 2. VCR related proteins (with at least 1 PPI) collected from DrugBank and
GLAD4U
Gene Symbol
HPRD ID
DrugBank1 GLAD4U PubMed ID2
TUBB 1852 Target[23178631], [20699370], [20556576], [18389626], [18058465]
TUBA4A 1851 Target -CYP3A4 484 Enzyme -ABCB1 1370 Transporter -

ABCC2 3065 Transporter -ABCB11 4436 Transporter -SLC22A3 5328 Transporter -RALBP1 9013 Transporter -
ZNRD1 9601 -[18058465], [17492506], [14726695], [12795835]
PPP1R1B 5097 - [18058465], [17492506]SRI 1680 - [21109982], [18423116]
AKT1 1261 - [23743572], [17310852]1 Protein list was retrieved from DrugBank under the category of vincristine.2 Proteins (at least reported by 2 literatures) retrieved from GLAD4U tools was
using a search key word: gastric cancer vincristine resistance.
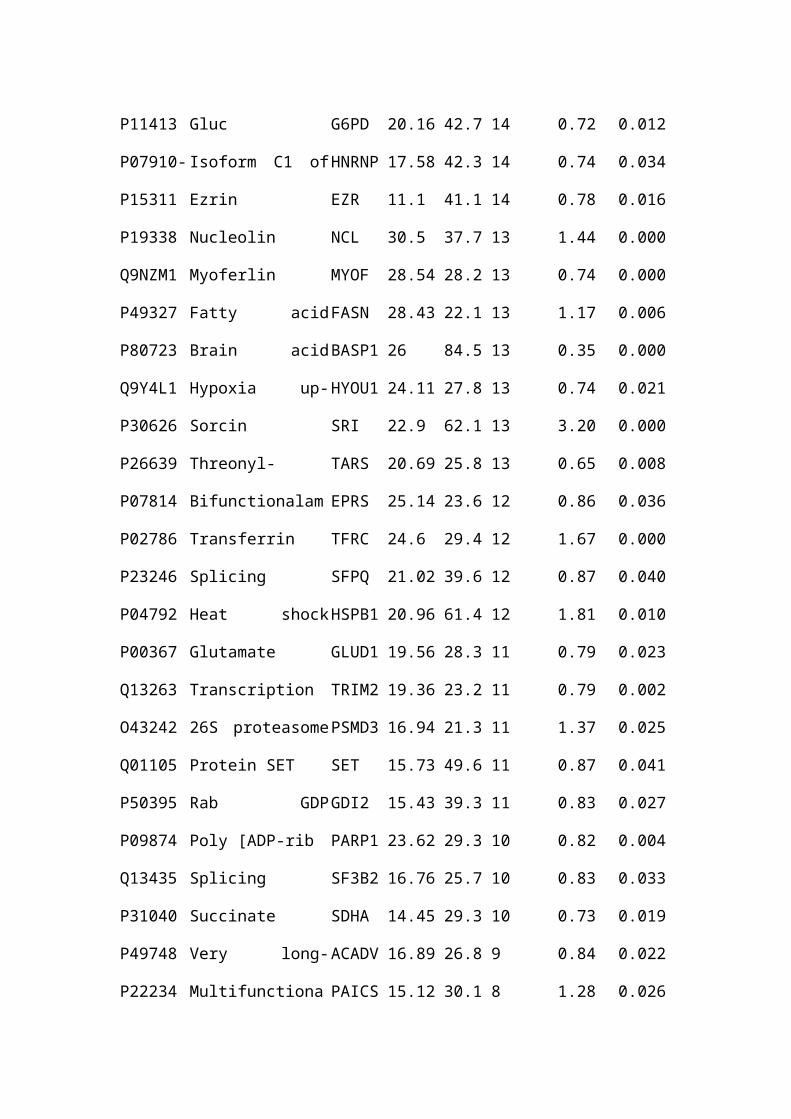
Table 3. Differentially expressed proteins in SGC7901/ADR cells compared with
SGC7901 cells identified by iTRAQ-MS/MS
Accession Protein Name Gene Unused %Cov Peptides 114:113a PValue
P21333 Filamin-A FLNA 161.52 49.45 105 0.82 0.0000
P06733 Alpha-enolase ENO1 90.45 86.41 76 0.61 0.0000
P04406 Glyceraldehyde-3-ph GAPDH
58.58 71.34 53 0.68 0.0005
P07900-2 Isoform HSP90AA1-2 of Heat shock
HSP90AA1
31.05 54.10 48 1.23 0.0086
Q09666 Neuroblastdifferentiation-associated
AHNAK
66.13 46.37 43 0.73 0.0000
P08670 Vimentin VIM 56.63 74.25 43 1.25 0.0011
P30101 Protein disulfide-isomerase A3
PDIA3 55.81 67.13 41 1.14 0.0092
P13639 Elongation factor 2 EEF2 61.32 48.60 35 1.26 0.0003
P10809 60 kDa heat shock protein,
HSPD1 57.73 63.70 35 1.12 0.0416
P02545 Lamin-A/C LMNA 53.51 66.11 35 0.70 0.0000
P22626 Heterogeneous nuclear
HNRNPA2B1
40.82 59.77 35 0.76 0.0054
P14618 Pyruvate kinase isozymes M1/M2
PKM2 55.6 71.37 34 0.66 0.0000
P26038 Moesin MSN 50.29 65.16 33 0.71 0.0001

P05787 Keratin, type II cyt KRT8 50.06 61.70 33 0.84 0.0055
Q14204 Cytoplasmic dynein 1 heavy chain 1
DYNC1H1
63.59 25.59 32 1.19 0.0000
P38646 Stress-70 protein, mitochondrial
HSPA9 54.7 56.55 32 1.23 0.0048
P29401 Transketolase TKT 38.18 45.10 32 0.87 0.0317
P08758 Annexin A5 ANXA5 39.34 80.31 30 0.74 0.0473
P08729 Keratin, type II cyt KRT7 39.18 71.64 26 1.13 0.0127
O43707 Alpha-actinin-4 ACTN4 38.78 35.35 26 0.62 0.0050
P31327 Carbamoyl-ph CPS1 43.8 26.20 25 0.84 0.0133
P00338 L-lactate dehydrogenase A
LDHA 39.13 63.86 22 0.76 0.0002
P63104 14-3-3 protein zeta/delta
YWHAZ
22.47 70.61 22 0.83 0.0062
P27824 Calnexin CANX 42.49 39.02 20 0.73 0.0228
Q9Y490 Talin-1 TLN1 41.3 26.09 19 0.87 0.0239
P07237 Protein disulfide-isomerase
P4HB 34.72 56.50 19 0.81 0.0013
P10412 Histone H1.4 HIST1H1E
25.35 72.60 19 0.50 0.0305
P62937 Peptidyl-prolylcis-trans isomerase A
PPIA 30.89 84.24 18 0.57 0.0001
Q06830 Peroxiredoxin-1 PRDX1 22.36 57.79 18 0.73 0.0283
Q16658 Fascin FSCN1 30.63 57.00 17 0.73 0.0013
P58107 Epiplakin EPPK1 26.42 34.79 17 1.27 0.0002
P06744 Gluc GPI 25.33 42.47 17 0.68 0.0000
P16403 Histone H1.2 HIST1H1C
2.79 62.91 17 0.42 0.0022
Q00839 Heterogeneous nuclear
HNRNPU
29.18 41.09 16 0.83 0.0002
P21796 Voltage-dependent anion-selective
VDAC1 23.6 68.55 16 1.25 0.0012
P61978-3 Isoform 3 of Heterogeneous
HNRNPK
26.57 51.36 15 0.82 0.0390
P26641 Elongation factor 1-gamma
EEF1G 20.43 40.05 15 0.79 0.0500

Q05639 Elongation factor 1-alpha 2
EEF1A2
7.07 55.94 15 2.34 0.0097
Q99832 T-complex protein 1 subunit eta
CCT7 24.49 40.70 14 1.21 0.0259
Q14697 Neutral alpha-gluc GANAB
23.44 31.25 14 0.66 0.0017
P11413 Gluc G6PD 20.16 42.72 14 0.72 0.0122
P07910-2 Isoform C1 of Heterogeneous
HNRNPC
17.58 42.32 14 0.74 0.0345
P15311 Ezrin EZR 11.1 41.13 14 0.78 0.0168
P19338 Nucleolin NCL 30.5 37.75 13 1.44 0.0000
Q9NZM1 Myoferlin MYOF 28.54 28.24 13 0.74 0.0000
P49327 Fatty acid synthase FASN 28.43 22.10 13 1.17 0.0068
P80723 Brain acid soluble protein 1
BASP1 26 84.58 13 0.35 0.0000
Q9Y4L1 Hypoxia up-regulated protein 1
HYOU1 24.11 27.83 13 0.74 0.0212
P30626 Sorcin SRI 22.9 62.12 13 3.20 0.0001
P26639 Threonyl-tRNAsynthetase,
TARS 20.69 25.86 13 0.65 0.0086
P07814 Bifunctionalaminoacyl-tRNAsynthetase
EPRS 25.14 23.68 12 0.86 0.0361
P02786 Transferrin receptor protein 1
TFRC 24.6 29.47 12 1.67 0.0000
P23246 Splicing factor, proline- and
SFPQ 21.02 39.60 12 0.87 0.0405
P04792 Heat shock protein beta-1
HSPB1 20.96 61.46 12 1.81 0.0108
P00367 Glutamate dehydrogenase 1,
GLUD1 19.56 28.32 11 0.79 0.0234
Q13263 Transcription intermediary factor
TRIM28
19.36 23.23 11 0.79 0.0026
O43242 26S proteasome non-ATPase regulatory
PSMD3 16.94 21.35 11 1.37 0.0257
Q01105 Protein SET SET 15.73 49.66 11 0.87 0.0417
P50395 Rab GDP dissociation inhibitor
GDI2 15.43 39.33 11 0.83 0.0275
P09874 Poly [ADP-rib PARP1 23.62 29.39 10 0.82 0.0046
Q13435 Splicing factor 3B subunit 2
SF3B2 16.76 25.70 10 0.83 0.0333

P31040 Succinate dehydrogenase
SDHA 14.45 29.37 10 0.73 0.0194
P49748 Very long-chain specific acyl-CoA
ACADVL
16.89 26.87 9 0.84 0.0220
P22234 Multifunctional protein ADE2
PAICS 15.12 30.12 8 1.28 0.0265
P62158 Calmodulin CALM1 13.72 71.81 8 0.75 0.0397
O00299 Chloride intracellular channel protein 1
CLIC1 12.83 55.60 8 0.80 0.0278
P15328 Folate receptor alpha FOLR1 11.98 29.96 8 0.16 0.0006
Q15365 Poly(rC)-binding protein 1
PCBP1 11.53 44.38 8 0.85 0.0328
O00232 26S proteasome non-ATPase regulatory
PSMD12
10.81 22.59 8 1.19 0.0277
P55809 Succinyl-CoA:3-ketoacid-coenzyme
OXCT1 9.32 26.92 8 0.70 0.0026
P20810-7 Isoform 7 of Calpastatin
CAST 14.88 28.89 7 0.60 0.0283
P21399 Cytoplasmic aconitatehydratase
ACO1 14.11 21.48 7 0.79 0.0166
Q99460 26S proteasome non-ATPase regulatory
PSMD1 13.28 17.00 7 1.37 0.0343
P30044 Peroxiredoxin-5, mitochondrial
PRDX5 11.65 36.92 7 0.77 0.0382
P17931 Galectin-3 LGALS3
10.31 31.60 7 1.43 0.0373
P45880 Voltage-dependent anion-selective
VDAC2 9.97 39.80 7 0.77 0.0188
P35998 26S protease regulatory subunit 7
PSMC2 14.25 38.80 6 1.22 0.0145
Q9Y2W1 Thyroid hormone receptor-associated
THRAP3
13.03 22.72 6 0.71 0.0196
P41250 Glycyl-tRNAsynthetase
GARS 12.13 18.67 6 0.70 0.0014
Q07065 Cyt CKAP4 12.05 27.24 6 0.77 0.0389
P08183 Multidrug resistance protein 1
ABCB1 11.82 20.39 6 2.31 0.0056
P99999 Cytochrome c CYCS 10.43 60.00 6 0.67 0.0271
P47756-2 Isoform 2 of F-actin-capping protein
CAPZB 9.69 32.35 6 0.75 0.0169
P12277 Creatine kinase B-type
CKB 9.23 25.72 6 1.50 0.0012
P62328 Thym TMSB4X
8.54 77.27 6 0.57 0.0250

P13667 Protein disulfide-isomerase A4
PDIA4 11.98 30.70 5 0.78 0.0021
O43399 Tumor protein D54 TPD52L2
11.07 38.35 5 1.23 0.0179
Q9UBE0 SUMO-activating enzyme subunit 1
SAE1 10.19 30.06 5 0.70 0.0231
Q15056 Eukaryotic translation initiation
EIF4H 9.7 38.71 5 0.58 0.0006
Q14839 Chromodomain-helicase-DNA-
CHD4 9.57 17.42 5 0.89 0.0440
Q9UHB9 Signal recognition particle 68 kDa
SRP68 9.18 24.72 5 1.26 0.0086
Q7L576 Cytoplasmic FMR1-interacting protein 1
CYFIP1 8.98 13.65 5 1.20 0.0492
Q13200 26S proteasome non-ATPase regulatory
PSMD2 11.52 24.45 4 1.31 0.0047
Q9BQG0 Myb-binding protein 1A
MYBBP1A
10.48 17.24 4 1.34 0.0354
Q9UHB6 LIM domain and actin-binding protein
LIMA1 9.91 24.51 4 1.88 0.0001
Q9H0A0 N-acetyltransferase 10
NAT10 9.41 16.88 4 1.31 0.0146
Q9Y5B9 FACT complex subunit SPT16
SUPT16H
8.86 21.01 4 0.78 0.0465
O75531 Barrier-to-autointegration factor
BANF1 8.59 75.28 4 0.56 0.0050
P16104 Histone H2A.x H2AFX 8.26 40.56 4 0.58 0.0138
Q13619 Cullin-4A CUL4A 7.44 18.31 4 2.01 0.0181
P09960 Leukotriene A-4 hydrolase
LTA4H 7.32 12.77 4 1.43 0.0092
O43175 D-3-ph PHGDH
7.31 19.14 4 2.34 0.0359
P50995 Annexin A11 ANXA11
7.13 24.95 4 0.61 0.0228
Q96TA1 Niban-like protein 1 FAM129B
6.77 19.51 4 0.83 0.0404
O75367 Core histone macro-H2A.1
H2AFY 6.19 22.04 4 0.64 0.0388
Q71DI3 Histone H3.2 HIST2H3A
3.94 55.88 4 0.45 0.0000
Q13423 NAD(P) transhydrogenase,
NNT 7.21 11.33 3 0.55 0.0010
P04181 Ornithine aminotransferase,
OAT 6.94 26.65 3 1.52 0.0142
P30085 UMP-CMP kinase CMPK1 6.94 35.20 3 0.71 0.0158

Q99497 Protein DJ-1 PARK7 6.86 49.21 3 0.71 0.0396
Q10471 Polypeptide N-acetylgalact
GALNT2
6.67 20.49 3 0.59 0.0118
Q15459 Splicing factor 3A subunit 1
SF3A1 6.57 16.39 3 0.79 0.0142
Q05682 Caldesmon CALD1 6.43 22.57 3 0.41 0.0359
Q13228 Selenium-binding protein 1
SELENBP1
6.2 18.43 3 0.62 0.0103
P78347 General transcription factor II-I
GTF2I 5.89 16.03 3 0.56 0.0030
Q13724 Mann MOGS 5.04 10.75 3 1.56 0.0085
P46934-4 Isoform 4 of E3 ubiquitin-protein
NEDD4 5.04 15.67 3 1.30 0.0180
P09497 Clathrin light chain B CLTB 4.94 29.26 2 0.66 0.0176
Q13428 Treacle protein TCOF1 4.57 9.75 2 0.68 0.0080
P17096 High mobility group protein
HMGA1
4.43 38.32 2 0.52 0.0076
Q8WW12 PEST proteolytic signal-containing
PCNP 4.41 26.97 2 0.60 0.0343
P48637 Glutathione synthetase
GSS 4.38 25.74 2 1.38 0.0242
P31350 Ribonucle RRM2 3.92 19.54 2 1.47 0.0146
Q96D15 Reticulocalbin-3 RCN3 3.87 25.91 2 0.63 0.0111
Q9NZL4 Hsp70-binding protein 1
HSPBP1
3.62 12.71 2 0.70 0.0345
Q9UDY2 Tight junction protein ZO-2
TJP2 3.61 18.24 2 0.80 0.0274
P59998 Actin-related protein 2/3 complex subunit
ARPC4 3.57 25.60 2 1.51 0.0455
P58546 Myotrophin MTPN 3.56 33.05 2 0.66 0.0451
Q9H3P7 Golgi resident protein GCP60
ACBD3 3.4 15.34 2 0.76 0.0374
Q9UK76 Hematological and neurological
HN1 3.36 40.26 2 1.79 0.0240
aProtein samples were labeled with 113 for SGC7901 and with 114 for SGC7901/ADR.
Table 4. Differentially expressed proteins in SGC7901/VCR cells compared with
SGC7901 cells identified by iTRAQ-MS/MS

Accession Protein NameGene
SymbolUnused %Cov
Pepti-
des
(95%)
115:113a Pvalue
P21333 Filamin-A FLNA 161.52 49.45 105 1.20 0.0000
P35579 Myosin-9 MYH9 105.29 41.38 53 1.12 0.0003
Q15149-8Isoform Plectin-3 of Plectin-1
PLEC1 97.12 38.03 48 0.92 0.0145
P06733 Alpha-enolase ENO1 90.45 86.41 76 0.79 0.0002
P1102178 kDa glucose-regulated protein
HSPA5 84.31 59.94 58 0.74 0.0000
Q00610-2Isoform 2 of Clathrin heavy chain 1
CLTC 70 43.99 40 0.85 0.0002
Q09666
Neuroblast differentiation-associated protein AHNAK
AHNAK
66.13 46.37 43 0.92 0.0073
Q14204Cytoplasmic dynein 1 heavy chain 1
DYNC1H1
63.59 25.59 32 1.12 0.0000
P06576ATP synthase subunit beta, mitochondrial
ATP5B 59.03 58.60 38 0.84 0.0022
P04406Glyceraldehyde-3-phosphate dehydrogenase
GAPDH 58.58 71.34 53 0.62 0.0000
P07355 Annexin A2 ANXA2 55.67 71.09 41 1.12 0.0120
P14618Pyruvate kinase isozymes M1/M2
PKM2 55.6 71.37 34 0.70 0.0000
P38646Stress-70 protein, mitochondrial
HSPA9 54.7 56.55 32 1.15 0.0325
P02545 Lamin-A/C LMNA 53.51 66.11 35 0.74 0.0000
P00558Phosphoglycerate kinase 1
PGK1 51.88 70.26 33 0.92 0.0466
P26038 Moesin MSN 50.29 65.16 33 0.83 0.0000
P05787Keratin, type II cytoskeletal 8
KRT8 50.06 61.70 33 0.74 0.0000
P31327 Carbamoyl-phosphate
CPS1 43.8 26.20 25 0.63 0.0000

synthase [ammonia], mitochondrial
P55072Transitional endoplasmic reticulum ATPase
VCP 43.36 54.09 28 0.89 0.0084
P27824 Calnexin CANX 42.49 39.02 20 0.76 0.0071
P04075Fructose-bisphosphate aldolase A
ALDOA 41.97 76.92 33 0.81 0.0007
P22626
Heterogeneous nuclear ribonucleoproteins A2/B1
HNRNPA2B1
40.82 59.77 35 0.72 0.0000
P08758 Annexin A5 ANXA5 39.34 80.31 30 0.73 0.0000
P00338L-lactate dehydrogenase A chain
LDHA 39.13 63.86 22 0.68 0.0000
O43707 Alpha-actinin-4 ACTN4 38.78 35.35 26 0.80 0.0039
P08107Heat shock 70 kDa protein 1A/1B
HSPA1A
37.96 62.71 50 1.22 0.0262
P06748 Nucleophosmin NPM1 36.66 61.90 37 1.27 0.0035
P05783Keratin, type I cytoskeletal 18
KRT18 36.09 69.77 23 0.84 0.0000
P07237Protein disulfide-isomerase
P4HB 34.72 56.50 19 0.69 0.0000
O00571ATP-dependent RNA helicase DDX3X
DDX3X 32.6 42.90 17 1.12 0.0271
P25705ATP synthase subunit alpha, mitochondrial
ATP5A1
32.59 58.59 21 0.89 0.0022
P78371T-complex protein 1 subunit beta
CCT2 32.1 57.94 20 1.10 0.0446
P62937Peptidyl-prolyl cis-trans isomerase A
PPIA 30.89 84.24 18 0.41 0.0000
Q16658 Fascin FSCN1 30.63 57.00 17 0.83 0.0032
P19338 Nucleolin NCL 30.5 37.75 13 1.63 0.0000
P37802 Transgelin-2TAGLN2
30.39 79.40 21 0.81 0.0023
P40926Malate dehydrogenase, mitochondrial
MDH2 30.23 60.36 20 0.79 0.0072
P50990T-complex protein 1 subunit theta
CCT8 29.53 42.15 16 1.10 0.0198
Q00839
Heterogeneous nuclear ribonucleoprotein U
HNRNPU
29.18 41.09 16 0.88 0.0133
P6225814-3-3 protein epsilon
YWHAE
28.64 72.16 23 0.85 0.0062
Q9NZM1 Myoferlin MYOF 28.54 28.24 13 0.79 0.0000
P78527-2
Isoform 2 of DNA-dependent protein kinase catalytic subunit
PRKDC 26.31 17.50 11 0.82 0.0003
P13797 Plastin-3 PLS3 26.07 36.19 13 1.12 0.0190
P80723Brain acid soluble protein 1
BASP1 26 84.58 13 0.33 0.0000
P00966Argininosuccinate synthase
ASS1 25.56 42.48 15 0.75 0.0002
P10412 Histone H1.4HIST1H1E
25.35 72.60 19 0.60 0.0295
P06744Glucose-6-phosphate isomerase
GPI 25.33 42.47 17 0.62 0.0000
P07814Bifunctional aminoacyl-tRNA synthetase
EPRS 25.14 23.68 12 0.84 0.0008
P02786Transferrin receptor protein 1
TFRC 24.6 29.47 12 1.11 0.0429
Q99832T-complex protein 1 subunit eta
CCT7 24.49 40.70 14 1.22 0.0192
Q14152 Eukaryotic EIF3A 24.23 35.82 13 1.09 0.0187

translation initiation factor 3 subunit A
P53621Coatomer subunit alpha
COPA 24.17 29.66 13 0.76 0.0001
Q9Y4L1Hypoxia up-regulated protein 1
HYOU1 24.11 27.83 13 0.73 0.0010
P67936Tropomyosin alpha-4 chain
TPM4 23.85 62.90 11 1.18 0.0384
Q14697Neutral alpha-glucosidase AB
GANAB
23.44 31.25 14 0.74 0.0261
P30626 Sorcin SRI 22.9 62.12 13 2.44 0.0003
Q06830 Peroxiredoxin-1 PRDX1 22.36 57.79 18 0.78 0.0038
P62805 Histone H4HIST1H4A
22.22 70.87 29 0.75 0.0397
P27797 Calreticulin CALR 21.85 42.93 12 0.84 0.0077
Q15233
Non-POU domain-containing octamer-binding protein
NONO 21.44 43.31 13 0.82 0.0470
Q15084Protein disulfide-isomerase A6
PDIA6 21.25 36.36 14 0.91 0.0436
Q04695Keratin, type I cytoskeletal 17
KRT17 21.19 33.80 12 0.66 0.0000
P23246Splicing factor, proline- and glutamine-rich
SFPQ 21.02 39.60 12 0.86 0.0143
P09211Glutathione S-transferase P
GSTP1 20.49 66.19 24 0.71 0.0002
P26641Elongation factor 1-gamma
EEF1G 20.43 40.05 15 0.66 0.0007
P00367Glutamate dehydrogenase 1, mitochondrial
GLUD1 19.56 28.32 11 0.75 0.0024
P081954F2 cell-surface antigen heavy chain
SLC3A2
19.25 32.70 12 0.74 0.0000
P00505 Aspartate aminotransferase,
GOT2 19.07 42.09 12 1.14 0.0193

mitochondrial
P12814 Alpha-actinin-1 ACTN1 18.3 35.76 24 1.49 0.0007
Q99613
Eukaryotic translation initiation factor 3 subunit C
EIF3C 18.06 29.79 9 1.15 0.0335
P07910-2
Isoform C1 of Heterogeneous nuclear ribonucleoproteins C1/C2
HNRNPC
17.58 42.32 14 0.86 0.0328
P09429High mobility group protein B1
HMGB1 17.57 49.30 11 0.82 0.0386
P49748
Very long-chain specific acyl-CoA dehydrogenase, mitochondrial
ACADVL
16.89 26.87 9 0.76 0.0008
P33992DNA replication licensing factor MCM5
MCM5 16.78 30.11 9 0.76 0.0094
P23284Peptidyl-prolyl cis-trans isomerase B
PPIB 16.21 62.96 8 0.76 0.0146
P50395Rab GDP dissociation inhibitor beta
GDI2 15.43 39.33 11 0.82 0.0195
Q14566DNA replication licensing factor MCM6
MCM6 15.36 21.80 8 0.80 0.0141
P55209Nucleosome assembly protein 1-like 1
NAP1L1
15.27 29.41 10 1.37 0.0245
O60664 Perilipin-3 PLIN3 14.94 35.02 7 1.35 0.0048
P20810-7Isoform 7 of Calpastatin
CAST 14.88 28.89 7 0.59 0.0008
Q018136-phosphofructokinase type C
PFKP 14.87 22.96 8 1.48 0.0013
Q9UNF1Melanoma-associated antigen D2
MAGED2
14.81 25.74 9 0.74 0.0235
O00429 Dynamin-1-like DNM1L 14.01 24.05 7 1.18 0.0306

protein
P38606V-type proton ATPase catalytic subunit A
ATP6V1A
13.06 29.17 8 0.84 0.0146
Q14315 Filamin-C FLNC 12.97 22.39 16 1.25 0.0393
P33993DNA replication licensing factor MCM7
MCM7 12.97 31.85 7 0.78 0.0171
P48735
Isocitrate dehydrogenase [NADP], mitochondrial
IDH2 12.71 33.85 6 0.80 0.0213
P41250Glycyl-tRNA synthetase
GARS 12.13 18.67 6 0.79 0.0203
Q07065Cytoskeleton-associated protein 4
CKAP4 12.05 27.24 6 0.86 0.0308
P13667Protein disulfide-isomerase A4
PDIA4 11.98 30.70 5 0.82 0.0028
P15328Folate receptor alpha
FOLR1 11.98 29.96 8 0.14 0.0006
Q6XQN6-2
Isoform 2 of Nicotinate phosphoribosyltransferase
NAPRT1
11.86 26.28 7 0.58 0.0058
P08183Multidrug resistance protein 1
ABCB1 11.82 20.39 6 2.78 0.0036
P33176Kinesin-1 heavy chain
KIF5B 11.66 24.82 6 1.22 0.0066
P35606Coatomer subunit beta'
COPB2 11.63 34.00 6 0.79 0.0107
Q15942 Zyxin ZYX 11.58 32.52 7 1.35 0.0077
Q13200
26S proteasome non-ATPase regulatory subunit 2
PSMD2 11.52 24.45 4 1.31 0.0066
P48444Coatomer subunit delta
ARCN1 11.36 22.70 6 0.76 0.0103
P49591Seryl-tRNA synthetase, cytoplasmic
SARS 11.31 18.87 5 0.82 0.0178

P36871Phosphoglucomutase-1
PGM1 11.19 26.33 6 0.78 0.0442
O43399Tumor protein D54
TPD52L2
11.07 38.35 5 1.35 0.0049
P63241-2
Isoform A of Eukaryotic translation initiation factor 5A-1
EIF5A 11 45.65 9 0.78 0.0457
Q06210
Glucosamine--fructose-6-phosphate aminotransferase [isomerizing] 1
GFPT1 10.96 29.33 5 0.77 0.0180
P4678140S ribosomal protein S9
RPS9 10.88 52.58 6 0.83 0.0170
P10599 Thioredoxin TXN 10.8 51.43 6 0.66 0.0162
Q13185Chromobox protein homolog 3
CBX3 10.58 44.26 5 0.76 0.0315
Q02790Peptidyl-prolyl cis-trans isomerase FKBP4
FKBP4 10.5 35.29 5 1.21 0.0047
Q9BQG0Myb-binding protein 1A
MYBBP1A
10.48 17.24 4 1.34 0.0148
P99999 Cytochrome c CYCS 10.43 60.00 6 0.63 0.0033
P17931 Galectin-3LGALS3
10.31 31.60 7 0.75 0.0119
P32119 Peroxiredoxin-2 PRDX2 10.21 43.43 10 0.76 0.0057
Q9UBE0SUMO-activating enzyme subunit 1
SAE1 10.19 30.06 5 0.82 0.0438
Q99829 Copine-1 CPNE1 10.17 17.32 6 1.32 0.0370
P12268Inosine-5'-monophosphate dehydrogenase 2
IMPDH2
9.93 26.07 4 1.42 0.0007
Q9UHB6LIM domain and actin-binding protein 1
LIMA1 9.91 24.51 4 2.70 0.0001
P09382 Galectin-1LGALS1
9.83 57.04 9 0.82 0.0196
O75340 Programmed cell PDCD6 9.77 52.36 5 0.66 0.0046

death protein 6
Q15056
Eukaryotic translation initiation factor 4H
EIF4H 9.7 38.71 5 0.78 0.0181
P17812 CTP synthase 1 CTPS 9.67 24.87 7 1.41 0.0026
Q9NYU2
UDP-glucose:glycoprotein glucosyltransferase 1
UGGT1 9.54 14.98 5 0.73 0.0012
O43852 Calumenin CALU 9.19 31.75 4 0.65 0.0211
O75396Vesicle-trafficking protein SEC22b
SEC22B 9.12 39.53 6 0.70 0.0429
Q14019Coactosin-like protein
COTL1 8.97 72.54 4 1.28 0.0108
P53999
Activated RNA polymerase II transcriptional coactivator p15
SUB1 8.72 49.61 4 0.68 0.0026
O75531Barrier-to-autointegration factor
BANF1 8.59 75.28 4 0.73 0.0099
P16401 Histone H1.5HIST1H1B
8.42 63.72 11 0.71 0.0346
O00461Golgi integral membrane protein 4
GOLIM4
8.21 18.10 4 0.67 0.0447
Q166982,4-dienoyl-CoA reductase, mitochondrial
DECR1 8.2 21.79 4 0.60 0.0111
Q13011
Delta(3,5)-Delta(2,4)-dienoyl-CoA isomerase, mitochondrial
ECH1 8.14 21.95 4 0.61 0.0104
Q13045Protein flightless-1 homolog
FLII 8.09 18.75 4 1.22 0.0349
Q9Y678Coatomer subunit gamma
COPG 8.07 17.05 4 0.79 0.0439
P61981 14-3-3 protein YWHA 7.98 49.80 14 0.82 0.0470

gamma G
P20042
Eukaryotic translation initiation factor 2 subunit 2
EIF2S2 7.91 33.33 4 1.37 0.0275
P12004Proliferating cell nuclear antigen
PCNA 7.46 45.59 4 0.77 0.0054
P16070 CD44 antigen CD44 7.39 9.30 4 1.45 0.0427
Q9NQC3-2
Isoform Foocen-M of Reticulon-4
RTN4 7.37 27.88 4 1.29 0.0288
O43175D-3-phosphoglycerate dehydrogenase
PHGDH 7.31 19.14 4 2.22 0.0297
Q13423NAD(P) transhydrogenase, mitochondrial
NNT 7.21 11.33 3 0.63 0.0020
P50995 Annexin A11ANXA11
7.13 24.95 4 0.50 0.0025
P8373160S ribosomal protein L24
RPL24 6.97 33.76 5 0.83 0.0469
O43847 Nardilysin NRD1 6.95 12.17 4 1.27 0.0193
P26447 Protein S100-A4 S100A4 6.73 36.63 4 0.40 0.0019
Q10471Polypeptide N-acetylgalactosaminyltransferase 2
GALNT2
6.67 20.49 3 0.61 0.0016
P11498Pyruvate carboxylase, mitochondrial
PC 6.36 19.61 4 0.73 0.0192
P61160Actin-related protein 2
ACTR2 6.24 24.11 3 1.31 0.0305
Q13228Selenium-binding protein 1
SELENBP1
6.2 18.43 3 0.66 0.0158
P49257Protein ERGIC-53
LMAN1 6.1 22.16 3 0.67 0.0174
P78347General transcription factor II-I
GTF2I 5.89 16.03 3 0.73 0.0188
Q9H4A4Aminopeptidase B
RNPEP 5.53 17.69 5 0.75 0.0380
Q9BUJ2 Heterogeneous nuclear
HNRNPUL1
5.39 29.91 3 0.73 0.0398

ribonucleoprotein U-like protein 1
Q969X5
Endoplasmic reticulum-Golgi intermediate compartment protein 1
ERGIC1 5.16 21.03 4 0.70 0.0168
O43719HIV Tat-specific factor 1
HTATSF1
5.05 14.57 3 0.82 0.0477
O953366-phosphogluconolactonase
PGLS 5.05 27.52 3 0.66 0.0166
P46934-4Isoform 4 of E3 ubiquitin-protein ligase NEDD4
NEDD4 5.04 15.67 3 1.44 0.0119
Q6NZI2Polymerase I and transcript release factor
PTRF 4.99 14.87 4 0.53 0.0214
P27694
Replication protein A 70 kDa DNA-binding subunit
RPA1 4.85 16.23 2 0.70 0.0022
P78417Glutathione S-transferase omega-1
GSTO1 4.64 19.50 2 0.71 0.0381
P48637Glutathione synthetase
GSS 4.38 25.74 2 1.50 0.0278
Q9Y5M8Signal recognition particle receptor subunit beta
SRPRB 4.27 36.90 2 0.66 0.0109
P55265
Double-stranded RNA-specific adenosine deaminase
ADAR 4.25 9.13 2 0.80 0.0445
P31350
Ribonucleoside-diphosphate reductase subunit M2
RRM2 3.92 19.54 2 1.29 0.0405
Q96D15 Reticulocalbin-3 RCN3 3.87 25.91 2 0.76 0.0181
Q9NX58Cell growth-regulating nucleolar protein
LYAR 3.46 15.04 2 1.36 0.0252
P16403 Histone H1.2 HIST1H 2.79 62.91 17 0.56 0.0041

1C
P55060 Exportin-2 CSE1L 20.47 22.66 12 1.12 0.0345
aProtein samples were labeled with 113 for SGC7901 and with 115 for SGC7901/VCR.
Table 5. ProteinRank scores for the 11 seed proteins (flagged by *) and the top 100
ranked proteins in ADR study
Rank Gene Symbol HPRD ID RankScoreP
Value1 ABCB1* 01370 1.1842 0.0000 2 ABCB11* 04436 1.1712 0.0001 3 AKT1* 01261 1.0594 0.0002 4 BAD* 04409 1.0535 0.0004 5 BCL2* 01045 1.0444 0.0003 6 TERT* 01754 1.0342 0.0004 7 CYP3A4* 00484 1.0055 0.0005 8 TOP2A* 00536 1.0051 0.0006 9 ABCB8* 10400 1.0046 0.0006 10 ZNRD1* 09601 1.0045 0.0010 11 MAD2L1* 03274 1.0031 0.0012 12 HAX1 12075 0.9779 0.0012 13 RNF2 07028 0.7204 0.0012 14 PIM3 15137 0.5205 0.0012 15 TPP1 06415 0.4990 0.0015 16 CAV1 03028 0.4267 0.0017 17 SMG6 06502 0.4097 0.0020 18 DFFB 03532 0.3495 0.0017 19 BCL2L1 02497 0.3374 0.0015 20 TP53AIP1 10397 0.3307 0.0021 21 CPT1A 02755 0.3307 0.0020 22 SMG5 16869 0.2930 0.0021 23 SAT1 02431 0.2859 0.0022 24 NMB 01210 0.2757 0.0027 25 BNIPL 16557 0.2723 0.0023 26 METTL1 06834 0.2643 0.0028 27 PLXNA1 11868 0.2543 0.0025 28 DLC1 05035 0.2527 0.0029 29 CCDC88A 11131 0.2527 0.0027 30 TCL6 05104 0.2527 0.0031

31 THEM4 16215 0.2527 0.0028 32 UXS1 15642 0.2527 0.0034 33 HMOX1 00782 0.2498 0.0030 34 - 05934 0.2445 0.0030 35 PCGF6 07427 0.2322 0.0032 36 TCL1B 04795 0.2271 0.0033 37 SOD1 00937 0.2224 0.0035 38 NCL 01245 0.2105 0.0042 39 KIAA0513 17192 0.2001 0.0048 40 AHNAK 14684 0.1941 0.0041 41 NONO 02098 0.1924 0.0039 42 HSP90AA1 00777 0.1916 0.0042 43 MYST1 11381 0.1892 0.0048 44 BFAR 16548 0.1838 0.0040 45 ITM2B 04878 0.1837 0.0046 46 HRK 04581 0.1782 0.0051 47 ABCB4 01371 0.1772 0.0047 48 PDK2 03955 0.1755 0.0045 49 RAB3D 05070 0.1727 0.0048 50 BNIP2 04481 0.1727 0.0050 51 RING1 03624 0.1704 0.0050 52 RYBP 09607 0.1596 0.0044 53 TFCP2 01790 0.1590 0.0053 54 BCL2L14 05841 0.1574 0.0057 55 SPNS1 11599 0.1574 0.0049 56 TMBIM6 02851 0.1568 0.0054 57 PKD2 01437 0.1557 0.0055 58 NMBR 01211 0.1549 0.0059 59 YWHAZ 03183 0.1520 0.0055 60 ATP2A2 00161 0.1486 0.0058 61 RAF1 01265 0.1458 0.0064 62 BNIP1 04480 0.1455 0.0056 63 CYCS 00479 0.1452 0.0062 64 VEGFA 01889 0.1427 0.0067 65 BNIP3 04482 0.1422 0.0063 66 WDR4 09330 0.1362 0.0065 67 BECN1 05087 0.1347 0.0068 68 SEMA6D 10221 0.1308 0.0070 69 SVIL 04992 0.1300 0.0062 70 ATXN2 03307 0.1300 0.0079 71 IL1A 00988 0.1297 0.0072 72 BLVRB 02967 0.1286 0.0071 73 PHC1 16009 0.1280 0.0077 74 PARP1 01435 0.1268 0.0074

75 TOPBP1 09678 0.1245 0.0082 76 VDAC1 05137 0.1220 0.0080 77 TCL1A 01744 0.1219 0.0080 78 MTOR 03134 0.1202 0.0085 79 PPARGC1B 10594 0.1200 0.0087 80 BIK 04547 0.1191 0.0083 81 DGKD 03492 0.1178 0.0086 82 KDM5D 02464 0.1172 0.0080 83 PPP3CA 00234 0.1150 0.0085 84 BLK 01866 0.1148 0.0087 85 S1PR1 03578 0.1133 0.0087 86 SUMO4 10584 0.1126 0.0085 87 TP53 01859 0.1124 0.0086 88 APPL1 05053 0.1122 0.0092 89 INSR 00975 0.1118 0.0090 90 FKBP8 05327 0.1110 0.0093 91 BAK1 02744 0.1078 0.0095 92 PDE3B 03626 0.1076 0.0102 93 CASP3 02799 0.1036 0.0100 94 BBC3 16165 0.1033 0.0093 95 CBX4 04357 0.1028 0.0099 96 BCL2L10 06071 0.1025 0.0091 97 BCL2L2 03569 0.1020 0.0106 98 NDC80 06277 0.1018 0.0099 99 GFI1B 05088 0.1016 0.0098
100 INTS4 12386 0.1009 0.0103 101 BMF 05881 0.1004 0.0104 102 AKTIP 07467 0.0988 0.0103 103 PKMYT1 03920 0.0949 0.0108 104 MLL 01162 0.0932 0.0097 105 BAG4 04861 0.0931 0.0109 106 BCL10 04625 0.0920 0.0110 107 BMI1 01277 0.0912 0.0108 108 PCGF2 10621 0.0897 0.0114 109 TSC22D4 18231 0.0869 0.0102 110 YWHAQ 00886 0.0862 0.0113 111 PRG2 09283 0.0860 0.0117
Table 6. The top 100 ranked proteins using VAVIEN with 11 seeds (flagged by *) in
ADR sutdy

Rank Gene Symbol HPRD Score1 ABCB1* 01370 1.15252 ABCB11* 04436 1.15203 BAD* 04409 1.07454 AKT1* 01261 1.07095 BCL2* 01045 1.05006 TERT* 01754 1.04477 TOP2A* 00536 1.01258 MAD2L1* 03274 1.00409 ZNRD1* 09601 1.001610 ABCB8* 10400 0.998911 CYP3A4* 00484 0.996812 UGT2B7 02508 0.879113 HAX1 12075 0.853914 PIM3 15137 0.576815 DLC1 05035 0.572516 CCDC88A 11131 0.572517 TCL6 05104 0.572518 THEM4 16215 0.572519 UXS1 15642 0.572520 TP53AIP1 10397 0.568521 CPT1A 02755 0.568522 ABCB4 01371 0.497623 SMG6 06502 0.371624 SPNS1 11599 0.347125 BCL2L14 05841 0.3471

26 TPP1 06415 0.324927 ITM2B 04878 0.314828 HRK 04581 0.286329 SACS 05135 0.282230 C4orf14 12823 0.276831 RNF2 07028 0.267132 TMBIM6 02851 0.248333 NMT2 11948 0.241834 UBD 09354 0.241535 MTCP1 02122 0.236236 PDE3B 03626 0.234437 TCL1B 04795 0.229738 SAT1 02431 0.228139 METTL1 06834 0.226640 BFAR 16548 0.224941 CAV1 03028 0.224342 BCL2L10 06071 0.223643 KIAA0513 17192 0.221444 TEP1 03404 0.212345 FKBP8 05327 0.206646 BIK 04547 0.203247 SMG5 16869 0.202848 CIC 10831 0.192449 NONO 02098 0.189550 DFFB 03532 0.184851 BCL2L2 03569 0.184552 BBC3 16165 0.181953 KRT10 01021 0.174554 IMPDH2 00895 0.173655 AHNAK 14684 0.165956 BMF 05881 0.165757 ATXN2 03307 0.163958 - 05934 0.162059 BCLAF1 16544 0.159960 WDR18 18296 0.158061 BECN1 05087 0.156562 GFI1B 05088 0.148363 TCL1A 01744 0.148064 BCL2A1 03034 0.147065 DGKD 03492 0.146466 WNK1 05570 0.145967 BCL2L11 04828 0.144968 PMAIP1 12002 0.143369 BAG4 04861 0.141270 PPARGC1B 10594 0.1394

71 AKT1S1 12441 0.139472 HMOX1 00782 0.135773 BCL2L1 02497 0.135674 ANAPC2 07367 0.135275 PKMYT1 03920 0.133976 BNIP1 04480 0.132077 BNIPL 16557 0.128378 YWHAQ 00886 0.127579 INTS4 12386 0.126980 BNIP3 04482 0.126281 INO80C 10719 0.124782 TACO1 17421 0.124783 RBM17 09501 0.124784 TP53AP1 10276 0.124785 FAM86C 13337 0.124786 WDR4 09330 0.122187 MAD2L2 07246 0.120388 RAB3D 05070 0.120089 HTR1F 01637 0.118690 S1PR1 03578 0.117791 CDC16 04587 0.115992 MTOR 03134 0.114693 TOP2B 00537 0.113894 CDC27 00304 0.111995 MBL2 01107 0.111096 RUVBL1 09143 0.109697 BNIP3L 07288 0.108098 NMB 01210 0.107199 ATP2A2 00161 0.1063
100 PFKFB2 01383 0.1059101 CAMKK1 13000 0.1054102 EIF3F 04887 0.1052103 PAK7 06423 0.1051104 PRKCA 01498 0.1041105 MAD2L1BP 10065 0.1041106 PPP3CA 00234 0.1039107 PRG2 09283 0.1038108 BNIP2 04481 0.1037109 ADAM17 04703 0.1036110 BAK1 02744 0.1017111 PIM2 02244 0.1015
Table 7. ProteinRank scores for the 12 seed proteins (flagged by *) and the top 100
ranked proteins in VCR study

Rank Gene Symbol HPRD ID RankScoreP
Value1 ABCB1* 01370 1.1752 0.0000 2 ABCB11* 04436 1.1576 0.0001 3 ABCC2* 03065 1.0921 0.0002 4 SLC22A3* 05328 1.0886 0.0002 5 TUBB* 01852 1.0850 0.0006 6 TUBA4A* 01851 1.0846 0.0006 7 SRI* 01680 1.0360 0.0006 8 AKT1* 01261 1.0256 0.0007 9 ZNRD1* 09601 1.0091 0.0009 10 CYP3A4* 00484 1.0074 0.0009 11 PPP1R1B* 05097 1.0043 0.0011 12 RALBP1* 09013 1.0035 0.0009 13 HAX1 12075 0.9528 0.0015 14 RNF2 07028 0.7201 0.0014 15 PDZD3 06191 0.6316 0.0015 16 TTK 04973 0.5275 0.0016 17 CAV1 03028 0.4768 0.0017 18 ANXA11 03983 0.4337 0.0018 19 RYR2 01619 0.4054 0.0015 20 CALCOCO2 06846 0.3975 0.0019 21 CACNA1C 00246 0.3706 0.0023 22 SHBG 01646 0.3656 0.0015 23 B4GALT1 00659 0.3577 0.0024 24 C5orf25 13486 0.3551 0.0025 25 CACNA1S 00248 0.3509 0.0025 26 TBCE 05381 0.3418 0.0028 27 LGALS2 08859 0.3392 0.0024 28 SMAD2 03221 0.3314 0.0027 29 CALB2 00230 0.3243 0.0029 30 GCA 06122 0.3217 0.0034 31 CANX 00252 0.3194 0.0034 32 TAOK2 18147 0.3084 0.0030 33 NONO 02098 0.2910 0.0033 34 CFTR 03883 0.2747 0.0033 35 MAP6 15989 0.2628 0.0034 36 TBCB 03196 0.2549 0.0034 37 ANXA7 01720 0.2461 0.0038 38 TUBB1 18243 0.2439 0.0033 39 AZU1 01221 0.2439 0.0038 40 PSEN2 02860 0.2438 0.0039 41 METTL1 06834 0.2428 0.0037

42 PLXNA1 11868 0.2347 0.0043 43 PCGF6 07427 0.2322 0.0040 44 HMOX1 00782 0.2305 0.0046 45 TTBK1 11653 0.2289 0.0047 46 TCL6 05104 0.2208 0.0047 47 UXS1 15642 0.2208 0.0050 48 DLC1 05035 0.2208 0.0049 49 CCDC88A 11131 0.2208 0.0053 50 THEM4 16215 0.2208 0.0044 51 IMPDH2 00895 0.2162 0.0049 52 AHNAK 14684 0.2121 0.0046 53 TCL1B 04795 0.2073 0.0051 54 MYST1 11381 0.1986 0.0064 55 YWHAG 05639 0.1950 0.0065 56 SIRT2 10377 0.1859 0.0057 57 KIAA0513 17192 0.1844 0.0064 58 ATXN2 03307 0.1809 0.0061 59 TCL1A 01744 0.1797 0.0066 60 PDK2 03955 0.1765 0.0061 61 LTA 01084 0.1735 0.0063 62 RING1 03624 0.1720 0.0064 63 RTN4 07259 0.1690 0.0065 64 RAB3D 05070 0.1669 0.0067 65 VEGFA 01889 0.1641 0.0065 66 ABCB4 01371 0.1630 0.0060 67 BMPR2 02880 0.1613 0.0072 68 RYBP 09607 0.1571 0.0068 69 FKBP1B 02795 0.1557 0.0063 70 TOPBP1 09678 0.1556 0.0070 71 CSNK2A1 00277 0.1545 0.0076 72 TFCP2 01790 0.1542 0.0071 73 ARL8B 12483 0.1524 0.0081 74 SVIL 04992 0.1468 0.0069 75 PRKDC 02941 0.1424 0.0082 76 MTCP1 02122 0.1409 0.0074 77 PKD2 01437 0.1333 0.0079 78 PRG2 09283 0.1327 0.0081 79 APPL1 05053 0.1310 0.0079 80 AKAP6 05257 0.1306 0.0084 81 KRT10 01021 0.1300 0.0075 82 CACNB3 11879 0.1285 0.0084 83 PPARGC1B 10594 0.1278 0.0086 84 PRKCA 01498 0.1276 0.0079 85 WDR4 09330 0.1258 0.0082

86 IL1A 00988 0.1252 0.0081 87 CIC 10831 0.1249 0.0084 88 PDCD6 03035 0.1245 0.0094 89 RAB8B 11476 0.1230 0.0084 90 SEMA6D 10221 0.1213 0.0088 91 DYNLL1 03334 0.1210 0.0097 92 BLVRB 02967 0.1192 0.0089 93 ALG2 09716 0.1189 0.0090 94 PHC1 16009 0.1184 0.0092 95 TBCD 05227 0.1183 0.0097 96 BCL10 04625 0.1181 0.0103 97 KDM5D 02464 0.1174 0.0094 98 STARD13 11607 0.1167 0.0101 99 S1PR1 03578 0.1166 0.0104
100 SYT9 11618 0.1164 0.0113 101 ALDOA 00070 0.1164 0.0093 102 NOS3 01224 0.1157 0.0105 103 CBX4 04357 0.1116 0.0100 104 FLNA 02060 0.1113 0.0107 105 CSNK2A2 00279 0.1112 0.0105 106 EZH2 03342 0.1110 0.0099 107 CPNE7 05749 0.1106 0.0108 108 PCGF1 11404 0.1106 0.0103 109 DBNDD2 12763 0.1106 0.0107 110 YWHAZ 03183 0.1102 0.0111 111 ILK 03842 0.1062 0.0114 112 RAC1 03627 0.1051 0.0110
Table 8. The top 100 ranked proteins using VAVIEN with 12 seeds (flagged by *) in
VCR sutdy
Rank Gene Symbol HPRD ID Score1 ABCB1* 01370 1.1520 2 ABCB11* 04436 1.1495 3 ABCC2* 03065 1.1281 4 SLC22A3* 05328 1.1264 5 TUBA4A* 01851 1.0305 6 TUBB* 01852 1.0298 7 AKT1* 01261 1.0099 8 RALBP1* 09013 1.0048 9 PPP1R1B* 05097 1.0042 10 SRI* 01680 1.0026 11 ZNRD1* 09601 0.9986

12 CYP3A4* 00484 0.9964 13 UGT2B7 02508 0.8788 14 HAX1 12075 0.8497 15 PDZD3 06191 0.8301 16 C5orf25 13486 0.5568 17 DLC1 05035 0.5396 18 CCDC88A 11131 0.5396 19 TCL6 05104 0.5396 20 THEM4 16215 0.5396 21 UXS1 15642 0.5396 22 SLC15A1 02768 0.5075 23 SLCO1C1 08342 0.5075 24 ABCB4 01371 0.4951 25 SLC15A2 09088 0.3704 26 TBCE 05381 0.3431 27 PFDN4 05358 0.3364 28 CALB2 00230 0.3086 29 B4GALT1 00659 0.2805 30 SLCO3A1 07502 0.2788 31 SLC22A9 06982 0.2788 32 SACS 05135 0.2709 33 CACNA1S 00248 0.2667 34 RNF2 07028 0.2664 35 SLC22A5 04539 0.2641 36 SLCO1A2 09112 0.2641 37 SLC22A4 09171 0.2641 38 RAB8B 11476 0.2476 39 PDZK1 04829 0.2444 40 LGALS2 08859 0.2395 41 NCALD 09466 0.2372 42 TAOK2 18147 0.2352 43 PDE3B 03626 0.2344 44 GUCY2C 07529 0.2323 45 CAV1 03028 0.2278 46 SLC9A3R1 05406 0.2198 47 KIAA0513 17192 0.2188 48 TTK 04973 0.2174 49 TBCB 03196 0.2172 50 MTCP1 02122 0.2165 51 TCL1B 04795 0.2158 52 METTL1 06834 0.2048 53 GCA 06122 0.2009 54 RDX 01534 0.1932 55 CIC 10831 0.1926

56 RALB 01550 0.1790 57 NONO 02098 0.1789 58 ANXA7 01720 0.1732 59 TTBK1 11653 0.1702 60 C4orf17 12825 0.1691 61 ATXN2 03307 0.1674 62 ARL8B 12483 0.1671 63 ROBO2 11895 0.1643 64 CACNA1C 00246 0.1639 65 KRT10 01021 0.1625 66 IMPDH2 00895 0.1597 67 REPS1 09687 0.1572 68 AHNAK 14684 0.1565 69 ANXA11 03983 0.1551 70 TBCD 05227 0.1548 71 MAP1LC3A 03144 0.1499 72 CANX 00252 0.1473 73 TCL1A 01744 0.1467 74 GFI1B 05088 0.1448 75 DGKD 03492 0.1424 76 DLGAP4 16826 0.1423 77 SLC22A12 06160 0.1394 78 SLC17A1 01661 0.1394 79 SLC26A6 10235 0.1394 80 WNK1 05570 0.1359 81 RYR2 01619 0.1348 82 SYNJ2BP 15455 0.1328 83 PPARGC1B 10594 0.1316 84 GUCA2A 00767 0.1311 85 TUBB1 18243 0.1292 86 AZU1 01221 0.1292 87 HMOX1 00782 0.1273 88 REPS2 02262 0.1264 89 AKT1S1 12441 0.1255 90 INTS4 12386 0.1252 91 PRKACA 03382 0.1234 92 HTR1F 01637 0.1203 93 RAB3D 05070 0.1197 94 SLC26A3 00544 0.1189 95 TCP1 01748 0.1188 96 MAP6 15989 0.1184 97 MARK4 09402 0.1174 98 TM4SF1 01854 0.1173 99 HDAC6 02228 0.1148

100 SIRT2 10377 0.1142 101 CSNK2A1 00277 0.1134 102 S1PR1 03578 0.1129 103 CSNK2A2 00279 0.1118 104 WDR4 09330 0.1099 105 DPYSL2 03914 0.1093 106 CDK5 00449 0.1087 107 PPP1CA 15942 0.1087 108 LTA 01084 0.1075 109 CRIPT 05208 0.1073 110 SYT9 11618 0.1053 111 MAP4 01141 0.1048 112 EIF3F 04887 0.1046

Supplementary Figures:
Figure 1. Expression levels and interactions among 11 ADR seeds (A) and 119
differentially expressed proteins in ADR resistant GCCs (B). Out of 130 differentially
expressed proteins identified by MS analysis, 119 were included in this PPI network.
Fold changes were log2 transformed.

Figure 2. An analysis of the 130 differentially expressed proteins in SGC7901/ADR
compared to SGC7901 identified by mass spectrometry using the PANTHER
classification system. The categorization was based on the (a) Biological process and
(b) Molecular function provided by PANTHER