· web view2018-02-26 · a computer-based optical communication system is designed through the...
TRANSCRIPT
Determination of the Optimal Length of the EDF Amplifier within the C-band for the
Optical Communication System Duried H. Ahmad
Science Department, College of Basic education, University of Mosul, Iraq
__________________________________________________________________
Abstract
A computer simulation was used in the design of a multi-channel optical communication system within the band (1546-1552) nm to determine the optimum length of the Erbium Doped Fiber Amplifier EDFA by using of 1480nm pumping with 40mW.
The quality factor QF , bit error rate BER for different EDFA ranged between 2-18m as well as the gain G , noise figure NF and optical signal to noise ratio OSNR were calculated for optimal conditions of operation.
The results shown that the optimum length of the amplifier is 10 m in the C packet with the transmission power of 1 mW , bit rate of 10 Gbps and distance of 150 Km.
Key-words : Erbium-doped fiber amplifier EDFA . Gain ,Optical signal to noise ratio OSNR , noise figure NF ,
IntroductionSeveral designs and computer models of erbium doped fiber amplifiers EDFAs
were developed by finding numerical solutions for propagation equations. These
models included amplified spontaneous emission ASE, gain G, noise figure NF,
effect of pumping power and fiber length on the amplifier work within C-band
(1525 -1565) nm in the optical communication 1.
One of the most inherent difficulties of multichannel systems , wavelength
division multiplexer WDM , using EDFAs is the reliability of G on : wavelength of
transmitted signal S , length of amplifier LEDF, wavelength and power of pumping
signal P, PP respectively . So, this effect results in optical signal to noise ratio
OSNR differential between channels after passing through a cascade of
EDFAs2.Therefore, a number of practical techniques have been suggested to
1
correct this gain non-uniformity such as using of , filters (external or
internal) ,optical isolators , thermally decreasing the homogeneous line broadening
of the amplifier; but these methods require either extra components or are
complicated ; or by optimizing the EDFA itself by controlling the fiber length and
pump power for a given input power and desired output power 2.
However , several studies was published for adoption of gain values and noise
factor along the EDFAs .G= 47 dB , NF= 13 dB , P =1480nm , LEDF = 9 m , PP = 40
mW, as well as far away less than PP = 22mW because the noise figure is greater
than gain 3. While , other studies was indicated that the length of the amplifier
under these specifications should be greater than 13 m to avoid oscillations in the
signal power 4-7. but all studies are numeric treatment and did not investigate
accurately all of the practical results .
In this paper we present a detailed study to simulate a more realistic
communication system , an eight-channel C-band WDM optical communication
system was designed in the wavelength region of 5.6 nm (1546.92-1552.52nm)
with 0.8 nm separation , power of each channel is 0dBm , 150 km transmission
length , 10 Gb/s - NRZ rate with external Mach-Zehnder Modulator MZM , EDFAs
with variable length in order to investigate the ideal practical parameter of LEDF , G ,
NF , OSNR , Bit Error Rate BER, Quality Factor QF and Gain Flatness GF.
EDFA THEORYThe EDFAs is one of the most common devices in modern C-band communications
systems. This technology has significantly improved in WDM requirements
because it has high gain, low noise in wideband , high output power, polarization
dependent, low interference between channels and ease of coupling with optical
fiber 8.
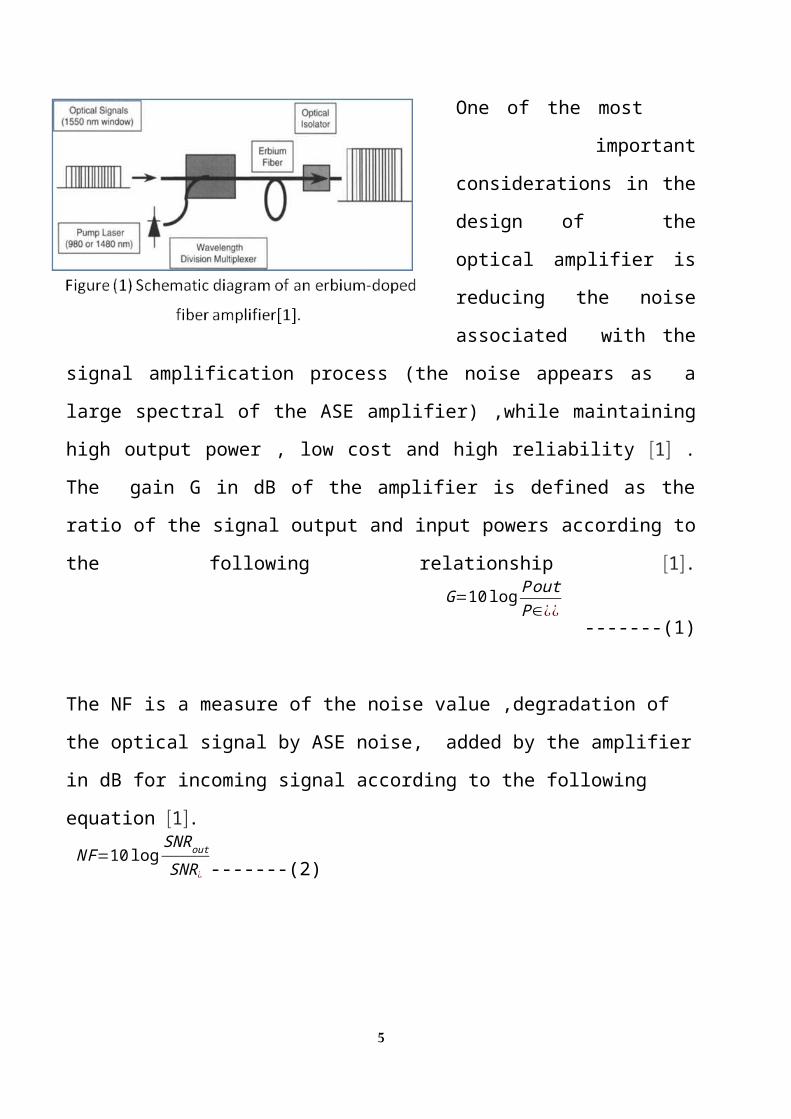
Basic elements of an EDFA are shown schematically in Fig. 1. The gain medium
in the amplifier is a specially fabricated optical fiber with its core doped with
erbium (Er). The erbium-doped fiber is pumped by a semiconductor laser, which is
2
couple by using a wavelength
selective coupler, also known
as a WDM coupler, that
combines the pump laser light
with the signal light. The pump
light propagates either in the
same direction as the signal
(co-propagation) or in the
opposite direction (counter-propagation). Optical isolators are used to prevent
oscillations and excess noise due to unwanted reflection in the assembly. More
advanced architecture of an amplifier consists of multiple stages designed to
optimize the output power and noise characteristics while incorporating additional
loss elements in the mid-stage 1 .
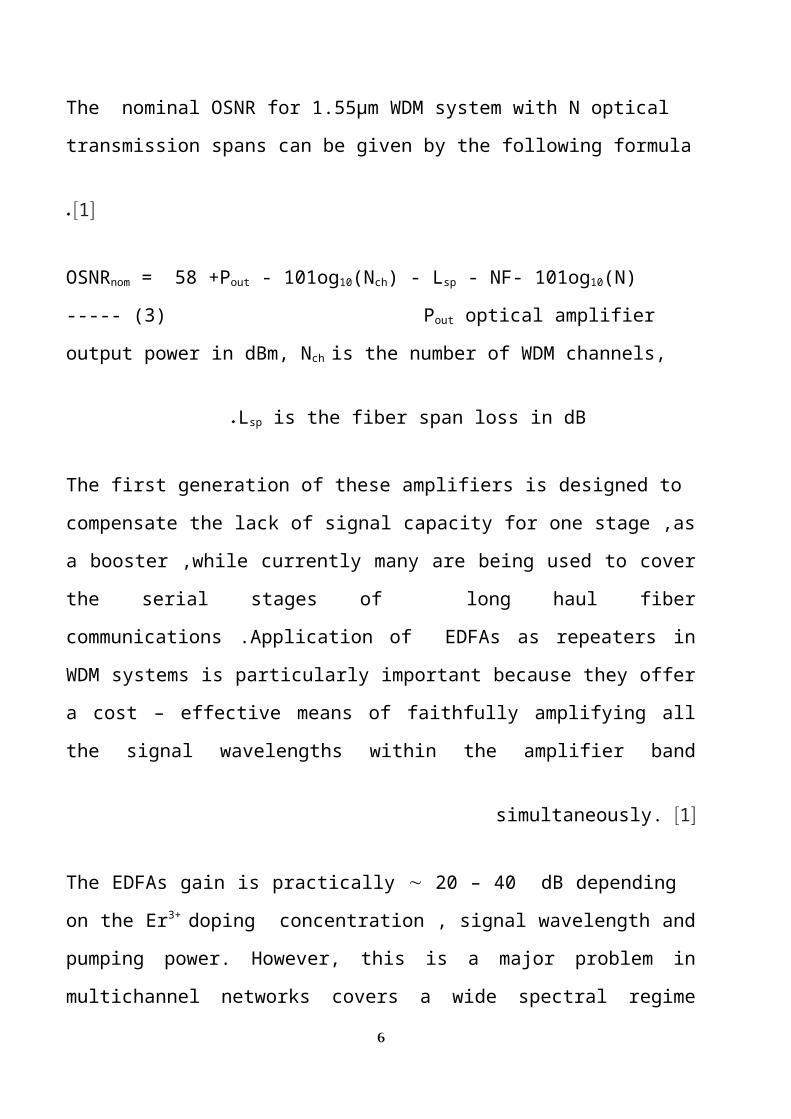
One of the most important considerations in the design of the optical amplifier
is reducing the noise associated with the signal amplification process (the noise
appears as a large spectral of the ASE amplifier) ,while maintaining high output
power , low cost and high reliability 1 . The gain G in dB of the amplifier is
defined as the ratio of the signal output and input powers according to the following
relationship 1. G=10 log P out
P∈¿¿ -------(1)
The NF is a measure of the noise value ,degradation of the optical signal by ASE
noise, added by the amplifier in dB for incoming signal according to the following
equation 1. N F=10 logSNRout
SNR¿ -------(2)
The nominal OSNR for 1.55µm WDM system with N optical transmission spans
can be given by the following formula 1.
3
OSNRnom = 58 +Pout - 101og10(Nch) - Lsp - NF- 101og10(N) ----- (3) Pout
optical amplifier output power in dBm, Nch is the number of WDM channels, Lsp is
the fiber span loss in dB .
The first generation of these amplifiers is designed to compensate the lack of
signal capacity for one stage ,as a booster ,while currently many are being used to
cover the serial stages of long haul fiber communications .Application of EDFAs
as repeaters in WDM systems is particularly important because they offer a cost –
effective means of faithfully amplifying all the signal wavelengths within the
amplifier band simultaneously. 1
The EDFAs gain is practically 20 – 40 dB depending on the Er3+ doping
concentration , signal wavelength and pumping power. However, this is a major
problem in multichannel networks covers a wide spectral regime 1500-1600 nm
and when the amplifiers are cascaded. Passive optical filters can be employed to
flatten the gain spectrum 9,10 .
It is important to note that both the pump intensity and the population inversion
decrease along the fiber due to linear attenuation . At the same time, the signal-
carrying beam is being amplified. This causes the signal intensity to continue to
increase until the point where the pump beam is depleted by the combination of
linear attenuation and stimulated emission. Beyond this point, the signal intensity
starts to decrease with distance. Consequently, there is an optimal fiber length
where the gain is maximized 9 .
The performance measures used are the Q-factor and BER. The voltage eye level
(decision level) is sampled to obtain the means for a ‘1’ and ‘0’ signal (μ1 and μ0)
as well as for their respective standard deviations (σ1 and σ0), assuming a Gaussian
distribution for the noise fluctuations. The Q-factor is then determined and the BER
is related to the Q-factor by equations 6 , 11 . QF=µ1−µ0
σ 1−σ 0 -----------------(4)
4
BER=0.5erfc [ Q√2 ] e−Q2/2
Q√2 π - ---(5)
Commonly the acceptable of BER for optical communication system is ≤10-9.On
the other hand , eye diagram is a technique that provides an aggregation of signal
measurement information and so helps us to evaluate the quality of the received
signal 12 .
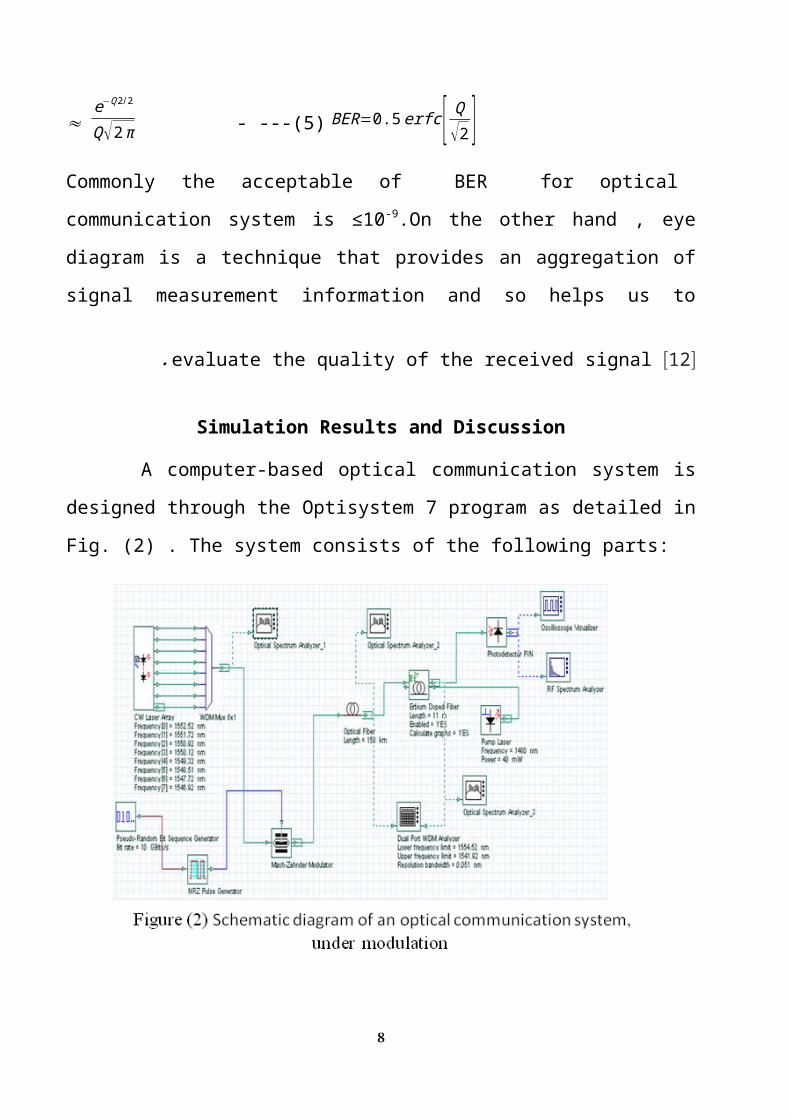
Simulation Results and Discussion
A computer-based optical communication system is designed through the
Optisystem 7 program as detailed in Fig. (2) . The system consists of the following
parts:
*Transmitter : includes eight semiconductor lasers ,CW Laser Array, with power of
each channel is1mw(0dBm) within the C band in the wavelength region of 5.6 nm
(1546.92 -1552.52 nm) with 0.8 nm separations with WDM (8×1).
5
* Transmission medium : Standard Single-Mode Fiber (SSMF) with a length = 150
Km , attenuation = 0.2 dB / km and dispersion =16.75ps / nm / Km for wavelength
=1550 nm .
* EDFAs with the specifications shown in Table (1) and Photo detector PIN.
Pumping power
PP
Erbium ion density
ρ
Spontaneous emission
time τ
Pumping wavelength
p
Numerical Aperture
NA
Radius of the fiber
r
Length ofFiber LEDF
40 mW1X1025 m-310 ms1480 nm0.242.2 µm2-18m Table (1) shows the specifications of the EDFAs
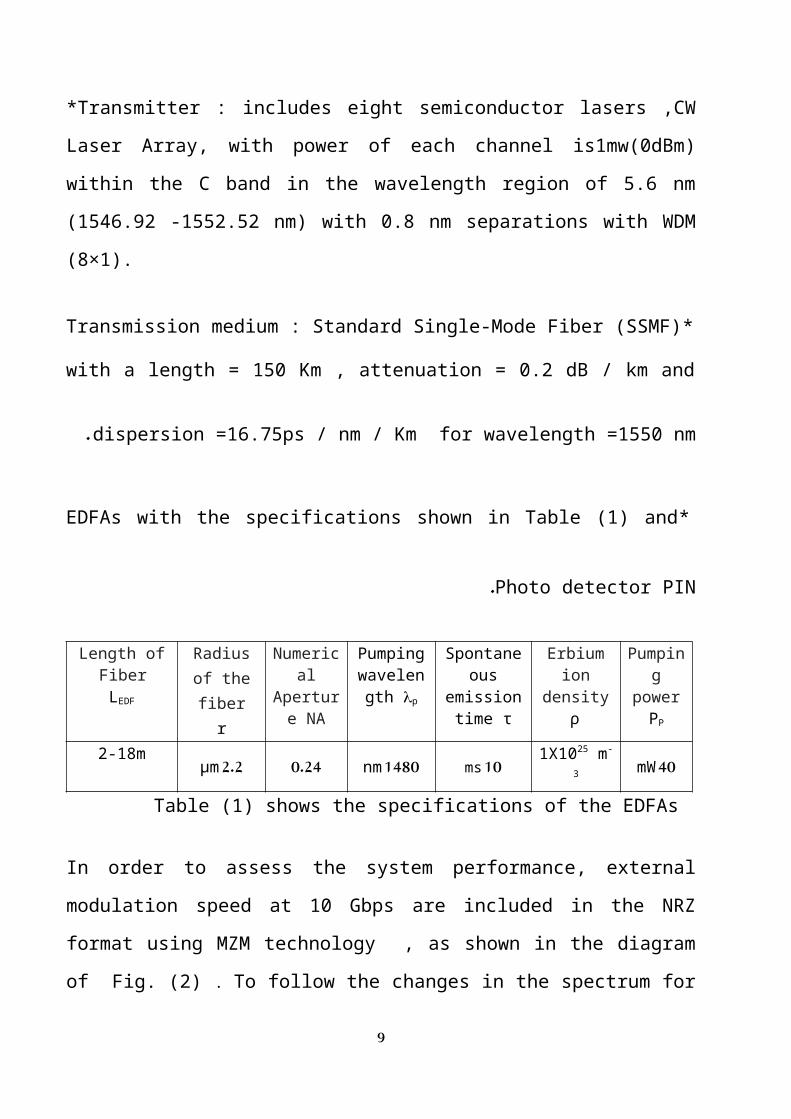
In order to assess the system performance, external modulation speed at 10 Gbps are
included in the NRZ format using MZM technology , as shown in the diagram of
Fig. (2) . To follow the changes in the spectrum for all wavelengths during the
transmission through the system phases, figures (3,4) are shown . Fig. (3) presents
the spectrum of the eight wavelengths at the WDM and the optical power for all
channels is 0 dBm , while the first decrease in the power about -5 dBm was
indicated after the signal modulation process , Fig. (4) ,.
6
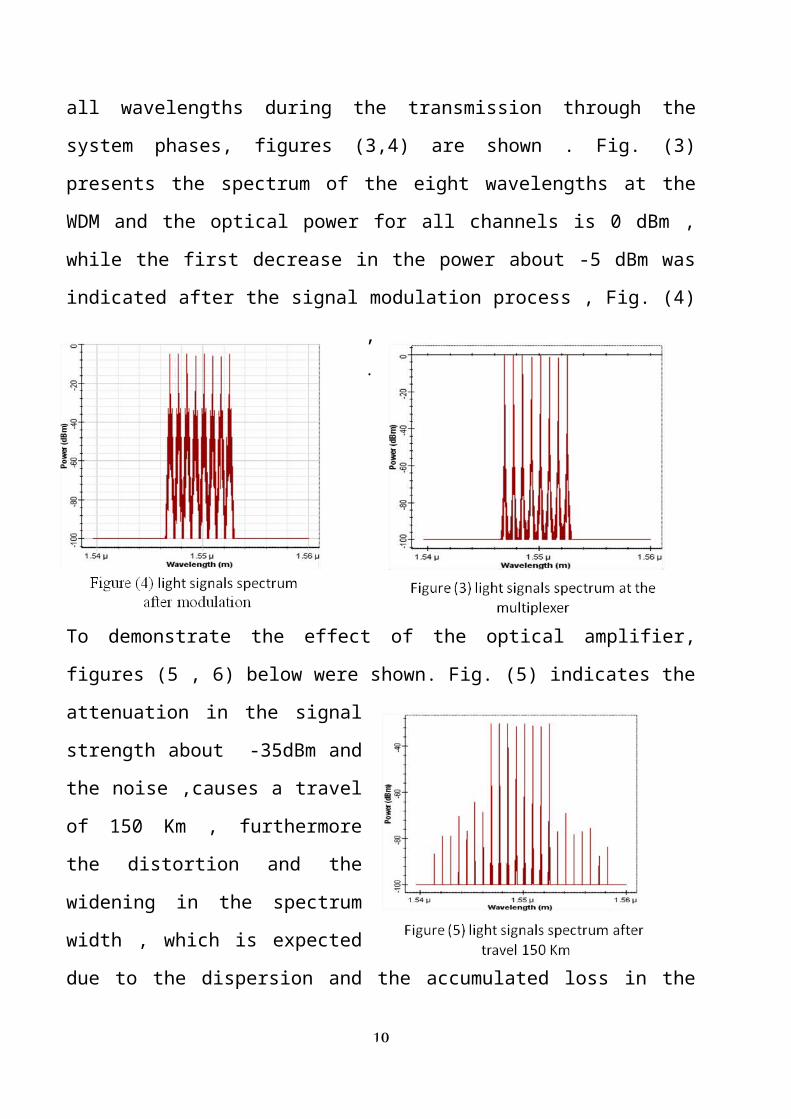
To demonstrate the effect of the optical amplifier, figures (5 , 6) below were
shown. Fig. (5) indicates the attenuation in the signal strength about -35dBm and
the noise ,causes a travel of 150 Km , furthermore the distortion and the widening in
the spectrum width , which is expected due to the dispersion and the accumulated
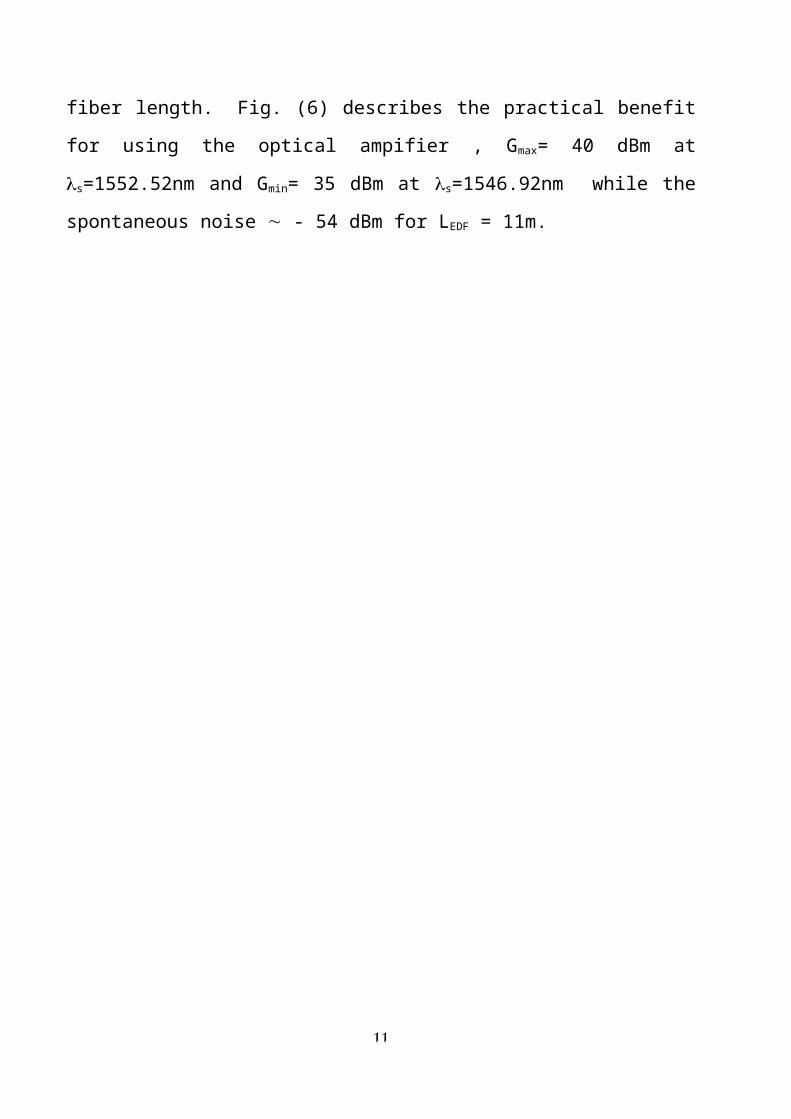
loss in the fiber length. Fig. (6) describes the practical benefit for using the optical
ampifier , Gmax= 40 dBm at s=1552.52nm and Gmin= 35 dBm at s=1546.92nm
while the spontaneous noise - 54 dBm for LEDF = 11m.
7
To examine the changes in ASE as a
function of wavelength along the
amplifier's , for 11 m length , fig.(7)
showing the exponential growth where
identified especially at the beginning of 8
m. Fortunately ,these results seem that the
EDFAs have a wide spectral range within
C band , but it varies amplification
response with the variation in the
wavelength. These experimental
validation are consistent with previous
works 3-7 .
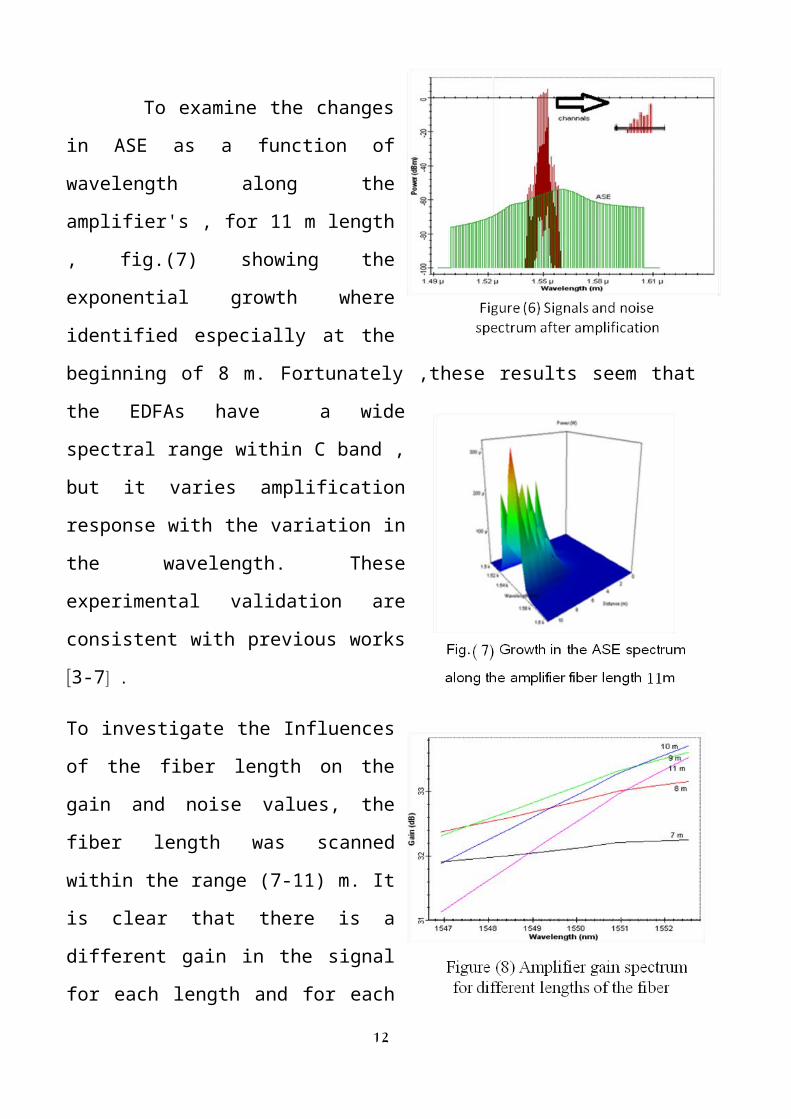
To investigate the Influences of the fiber
length on the gain and noise values, the
fiber length was scanned within the range
(7-11) m. It is clear that there is a different
gain in the signal for each length and for
each wavelength. Note Fig. (8,9) . Gmax =
33.7 dB at s= 1552.5 nm for LEDF = 10m ,
blue color in Fig. 8, and the gain flatness
GF is approximately equal in all lengths,
GF = Gmax / Gmin 2. While , Fig. (9)
illustrates the output power of the amplifier
as a function of a wavelength in three
dimension. It also supports the progressive
zoom along the fiber length. And thus, the
8
amplifier noise factor associated with the signal is increased , note Fig. (10), NF = 8
dB at LEDF =10 m for s= 1552.52 nm.
To evaluate the OSNR spectrum of the EDFA for all wavelengths and all fiber
lengths referred to earlier, the results were analyzed and plotted by numerical
simulation in Fig. (11), the figure showing that the highest ratio is 25 dB at 10 m.
To study the effect of lengths larger than 11 m, under the specifications in Table 1,
many fiber lengths were scanned within range (2-18) m. As illustrated in figures
(12,13) . Also ,figures are enhances the optimum work of the magnifier around
LEDF= 10 m and away from the lengths of less than 5 m and greater than 15m.
9
To check of the proposed system
performance ,for a distance of
150Km, the relationship between
BER and QF values was plotted by
numerical simulation after selecting
the amplifier length range 2-14 m as
shown in Fig. (14). It was found that
the system has high reliability within
universally recognized values For a bit rate of up to 4GBits / s especially at lengths
greater than 8m.
To illustrate the differentiation
between these lengths, Fig. (15)
illustrates the role of the ideal
length of the amplifier, 10 m, the
violet color. Finally, fig. (16) shows
eye diagram , the method used to
measure BER, QF values for
s=1552.52 nm by using 10m
EDFAs .
10
Summary of the above, Table 2 contains the most important simulation parameters
results for selecting the optimum length of the amplifier. However, this is not
enough to create a good and optimal optical communication system so that the gain
(with a amplifier) must be high reliability and small values of noise figure . In the
end, we find that there is a process of maturity and a balance between these values
to determine the optimal length of the EDFA amplifier
Table (2) Simulation Parameters for EDFAs with L EDF =10 m
Conclusion: This study concerned the design of an optimal communication system
with an EDFA amplifier. This study came out with several conclusions summarized
as follows :
1- The optimal length of the EDFA amplifier is 10 m (within the specifications in
Table 1) to make QF and BER reliable within the internationally accepted limits.
2- The amplifier can also operate at a length greater than 10 m or slightly smaller,
but there are increase in NF and decrease in G especially at lengths greater than
11m and less than 5m .
3 -Fiber dispersion , (16.75ps / nm / Km), limits the speed of transmission and
restricts BER and QF to be universally accepted .
4- The study of spectra gives more advantage for determining the basic parameters
in the proposed optical communication system because it was more comprehensive
and credible , taking into account study's of more than one parameter
instantaneously.
11
OSNRdB
NFdB
GdB
QFdB
BERdB
s
nmLEDF
m19.937.633.78.768.87×10-191552.52
10198.5327.891.43×10-151546.92
Acknowledgements : The author would like to acknowledge his thanks and
gratitude for his supervisor, Dr. Mozzahim Ibrahim AL-Ekaily.
Reference :
1-A .K . Dutta ,WDM Technologies Passive Optical Components, Academic Press, VOL2 ,USA, 2006.
2-Optiwave ,OptiSystem Tutorials, Optimizing the EDFA gain for WDM light wave systems , VOL.1 ,Canada ,2008.
3-Al-Naama, Mohamed Ali , "Calculation of the gain and noise factor in the optical fiber amplifier in the beam of C for optical communication", Volume 11, Issue 3, Journal of Research College of Basic Education, March 2012.
4-E. Desurvire , Erbium-doped fiber amplifier principles and application ,New York: Wiley,1994 .
5-C. R. Giles , E. Desurvire."Modeling erbium doped fiber amplifiers" ,IEEE J. Light wave Tech. , VOL 9, 1991.
6-A. C. Okrak," Gain and Noise Figure Performance of Erbium Doped Fiber Amplifiers" ,Istanbul University, Journal of Electrical and Electronics Engineering, VOL4 ,2004.
7- A. A. Rieznik ,W.A.Aremano , G.S.Wiederhecker , " Gain and Noise Figure Dependence on the Fiber Length ", IEEE-MTT-SIMOC , pp115-120,2003 .
8- H . Rongqing , Fiber Optic Measurement Techniques , Elsevier Academic Press , USA,2009 .9- A .Yariv , Photonics Optical Electronics in Modern Communication , 6th
Edition ,Oxford University Press ,USA ,2007.10-P.C.Becker, Erbium-Doped Fiber Amplifiers Fundamentals and Technology, Academic Press ,USA ,2003.
11-L. N. Binh , A. Chua ,Department of Electrical and Computer Systems Engineering ,Monash University, Australia ,2005.
12 -Ab-Rahman, M.S., "A Comparison between Electrical and Optical Chromatic Dispersion Compensation in Wavelength Division Multiplexing Network Regarding
to Electrical Pulse Shapes" . J. Computer Sci., 8 (1): 76-83, 2012 .
12