€¦ · web viewask your government! the 6 question campaign. a comparative analysis of. access...
TRANSCRIPT

ASK YOUR GOVERNMENT! The 6 Question Campaign
A Comparative Analysis Of
Access to Budget Information
In 80 Countries
Access Info Europe
Centre for Law and Democracy
International Budget Partnership
September 2011

Acknowledgements
This Report is based on the findings of a global testing of access to budget information conducted in 80 countries, the Ask Your Government! 6 Question Campaign, a project coordinated jointly by the International Budget Partnership, Access Info Europe, and the Centre for Law and Democracy together with international and national partners around the world.
The Report was written and edited by Toby Mendel of the Centre for Law and Democracy and Helen Darbishire of Access Info Europe, with additional data processing by Victoria Anderica. The Ask Your Government! 6 Question Campaign was coordinated by Victoria Anderica of Access Info Europe and Libby Haight of the International Budget Partnership.
This project was made possible thanks to Warren Krafchik, Helena Hofbauer, Vivek Ramkumar, and Caroline Poirier from the International Budget Partnership. The expert thematic partners were Mark Halle from the International Institute for Sustainable Development; Lalanath De Silva from the World Resources Institute; Raquel Gomes from Oxfam USA; Victoria Room from Development Initiatives; Karin Christiansen and Catalina Reyes from Publish What You Fund; Samantha Lobis from the Averting Maternal Death and Disability Program at Columbia University; Debra Jones and Ann M Starrs from Family Care International; Betsy McCallon from the White Ribbon Alliance.
Thanks are also due to the dedicated researchers who submitted and pursued requests to their government in 80 countries: Ilir Aliaj and Dorina, Xhaxhiu, CDDI, Albania; Mohammed Zine Barka, Association Nationale des Finances Publiques, Algeria ; Ernesto Kambali, Episcopal Justice and Peace Commission of Angola and S. Tome Bishops Conference, Angola; Ezequil Nino, Asociación Civil por la Igualdad y la Justicia, Argentina; Karine Danielyan, Association For Sustainable Human Development, Armenia; Kenan Aslanli, Public Finance Monitoring Center, Azerbaijan; Badiul Majumdar, The Hunger Project-Bangladesh, Bangladesh; Juan Luis Espada, Centro de Estudios para el Desarrollo Laboral y Agrario, Bolivia; Boris Mrkela and Admir Alihodzic,Centar za promociju civilnog društva /Centar za istraživačko novinarstvo, Bosnia Herzegovina; Gape Kaboyakgosi, Botswana Institute for Development Policy Analysis, Botswana; Atila Roque and Lucídio Barbosa, Instituto de Estudos Socioeconômicos, Brazil; Gergana Jouleva and Tereza Alexova, Access to Information Programme, Bulgaria; Silwé Kaphalo Ségorbah, Centre pour la Gouvernance Démocratique, Burkina Faso; Kim Song Chea, The NGO Forum on Cambodia, Cambodia; Leonard Eoussa, Budget Information Centre, Cameroon; Toby
Mendel, the Centre for Law and Democracy, Canada; Antoine Doudjidingao, Groupe de Recherches Alternatives et de Monitoring du Projet Pétrole Tchad-Cameroun, Chad; Moises Sanchez, Fundacion Pro Acceso, Chile; Esmeralda Caceres, Corporación Foro Joven, Colombia; Luis Diego Segura, Fundación para la Paz y la Democracia, Costa Rica; Katarina Ott, Institute of Public Finance, Croatia; Juan Castillo, Fundación Solidaridad, Dominican Republic; Abraham Djamba Samba, SHAKO, Reseau des Organisations Partenaires de FIFES, Democratic Republic of Congo; Christopher Henry Samson, Lalenok Ba Ema Hotu, Timor Este; Humberto F. Dirani, Transparencia Ecuador, Ecuador; Jaime López, El Salvador; Fabrice Pozzoli-Montenay, Association de Journalistes Européens, France; Tamuna Karosanidze, Transparency International Georgia, Georgia; Christian Mihr and Andreas Bock, Netzwerk für Osteuropa-Berichterstattung (n-ost), Germany; Nicholas Adamtey, Centre for Budget Advocacy (CBA) of the Integrated Social Development Centre, Ghana; Jorge Alberto Santos Contreras, Asociación Centro Internacional para Investigaciones en Derechos Humanos, Guatemala; Elda Dariela Diaz, Centro de Investigación y Promoción de los Derechos Humanos, Honduras; Yamini Mishra/Subrat Das/Sakti, Centre for Budget and Governance Accountability, India; Mustafa Alshawi, Iraq Institute for Economic Reform, Iraq; Davide del Monte, Transparency International, Italy; Janar Jandosova, Sange Research Center, Kazakhstan; Philip Thigo, Social Development Network, Kenya; Avni Zogiani, COHU, Kosovo; Tatiana Popovitskaya, Reproductive health Alliance, Kyrgyzstan; G. Jasper Cummeh, Actions for Genuine Democratic Alternatives, Liberia; Kiril Ristovski, Florozon-Association for protection of natural environment and sustainable economic development, Macedonia; Dalitso Kubalasa, Malawi Economic Justice Network, Malawi; Khairiah Makata, Centre for Public Policy Studies, Asian Strategy & Leadership Institute, Malaysia; Coulibaly Massaoly, Great Mali; Mali; Miguel Pulido, Fundar, Centro de Análisis e Investigación, Mexico; Olga Kazantseva, BIOTICA, Moldova; Namkhaijantsan Dorjdari, Open Society Forum, Mongolia; Vanja Calovic and Vuk Maras, MANS, Montenegro; Azeddine Akesbi, Transparency International, Morocco; Adriano Nuvunga, Centro de Integridade Publica, Mozambique; Graham Hopwood, Institute for Public Policy Research; Jenny Browne, Transparency International, New Zealand; Ana Quirós Víquez, Centro de Información y Servicios de Asesoría en Salud, Nicaragua; Moussa Tchangari and Abdourahamane Ousmane, Alternative Espaces Citoyens, Niger; Oby Nwankwo, Civil Resource Development and Documentation Centre, Nigeria; Jan Isaksen, Chr Michelsen Institute, Norway; Ali Asghar Khan, Omar Asghar Khan Development Foundation, Pakistan; Paul Barker, Institute of National Affairs, Papua New Guinea; Malou Mangahas and Carol Ilajan, Philippine Center for Investigative Journalism, Philippines; Wojciech Misiag, The Gdańsk Institute for Market Economics, Poland; Pedro Krupenski, Amnistia Internacional, Portugal; Ioana Avadani, Centre for Independent Journalism, Romania; Inna Kremen, Foundation for the Support of Information Freedom Initiatives, Russia; Ousmane Adama Dia, Universite de Dakar, Senegal;

Nemanja Nenadic and Bojana Medenica, Transparency International, Serbia; Edward Abu Sifoe and Emmanuel Saffa Abdulai, Konima Development Association and Freedom of Information Coalition, Sierra Leona; Brankica Petkovic, Peace Institute/Mirovni institute, Slovenia; Thembinklosi Dlamani, Institute of Democracy, South Africa; Helen Darbishire, Access Info Europe, Spain; Sonali de Silva, Public Interest Law Foundation, Sri Lanka; Buthaina Ahmed Elnaiem, Juba University, Sudan; Shahlo Juraeva, Society organization Jahon, Tajikistan; Christine Matovu, Women’s Dignity, Tanzania; Dennis Pantin, Sustainable Economic Development Unit for Small and Island Economies, Economics Department University of the West Indies, Trinidad and Tobago; Yaman Akdeniz, Cyber Law/Cyber Rights, Turkey; Imelda Namagga, Uganda Debt Network, Uganda; Ildar Gazizullin, International Centre for Policy Studies, Ukraine; Libby Haight, International Budget Partnership, United States; Mercedes De Freitas, Transparencia International, Venezuela; Raufa Hassan Alsharki, Cultural Development Program Foundation, Yemen; Kaalu Nona Mubita, Economics Association of Zambia, Zambia; Shamiso Mtisi, Zimbabwe Environmental Law Association, Zimbabwe.
Project Funding
The project partners are grateful to the following organisations for the financial support which made this global study possible: the Bill and Melinda Gates Foundation, the Hewlett Foundation, the Ford Foundation, the Open Society Foundations, and UKaid.

Table of Contents
Acknowledgements........................................................................................................................................................ ii
Project Funding............................................................................................................................................................... iv
Table of Contents.............................................................................................................................................................v
Executive Summary....................................................................................................................................................... 1
Trends and Conclusions............................................................................................................................................... 2
MAIN Findings.................................................................................................................................................................. 4
Recommendations..........................................................................................................................................................5
1.Introduction...................................................................................................................................................................6
1.1Methodology............................................................................................................................................................... 7
1.2Main Results............................................................................................................................................................. 13
2.Analysis by Response Type..................................................................................................................................15
2.1Compliant Responses........................................................................................................................................... 15
2.2Incomplete Information...................................................................................................................................... 17
2.3Information Not Held........................................................................................................................................... 19
2.4Mute Refusals.......................................................................................................................................................... 20
2.5Refusals and Rejections....................................................................................................................................... 23
3.Analysis By Other Factors.....................................................................................................................................26
3.1Timeliness................................................................................................................................................................. 26
3.2The Number of Attempts.................................................................................................................................... 28
3.3Reasons...................................................................................................................................................................... 31
3.4Analysis by Question............................................................................................................................................. 32
4.Country Analysis.......................................................................................................................................................37
4.1Positive Responses................................................................................................................................................. 37
4.2Right to Information Laws Make a Difference..........................................................................................40
4.3Old vs. Young Democracies................................................................................................................................ 42
4.4Regional Analysis................................................................................................................................................... 46
4.5Analysis by Donor and Recipient Countries...............................................................................................47
5.Conclusion................................................................................................................................................................... 50

Executive Summary
This Report presents the results of the largest comparative testing exercise involving requests for budget information ever conducted.
In 80 countries civil society organisations participated in the Ask Your Government! initiative by submitting 6 questions about budget openness in three thematic areas, namely maternal health, development assistance and the environment.
Led by Access Info Europe, the Centre for Law and Democracy and the International Budget Partnership, and supported by eight international organisations focusing on the three thematic areas and local civil society partners in each of the 80 countries, the testing exercise involved making the same six requests for information, two in each thematic area, in 80 different countries around the world.
In total, 1061 requests for information were made, accompanied in many cases by phone calls, additional letters, faxes, and e-mails, and in some countries personal visits to the relevant public authorities.
Figure 1: Combined results from 80 countries
- 1 -

A key finding is that less than half of the requests resulted in information being provided to the requester. Only one in four requests (26%) led to full information being provided, and less than half (45%) yielded any information at all. Fully 42% of all requests met with responses that were not compliant with right to information standards.
The level of Mute Refusals (a complete lack of response from the authorities) was particularly high, representing 4 in every 10 requests (38%), even after up to three attempts to get a response, as stipulated by the project protocol. Fully 55 of the 80 countries covered by the exercise provided at least one Mute Refusal, and 15 responded to five or six requests with administrative silence.
The results are also disturbing in terms of time and effort required to get a response. The average number of attempts needed to get to a final outcome was 2.2. This includes cases where the final outcome was a Mute Refusal, but even in the case of compliant responses, requesters had to make a second attempt more often than not.
The average time taken to respond to requests was 62 calendar days, significantly longer than the 10-20 working days (up to 30 calendar days) period established as a maximum in most of the world’s over 80 right to information (RTI) laws. Only nine countries responded to all six questions in, on average, 30 days or less, and only three managed to meet this timeline for each of the six requests.
The results therefore reveal widespread violations of the right to information across a wide range of countries including in established democracies (see Sections 4.1 and 4.4 for the country and regional analyses). This is troubling, particularly in the context of this exercise in which the questions were deliberately selected so as to be non-controversial in the sense that they do not raise serious issues regarding secrecy. Furthermore, all of the questions in the 6 Question Campaign bear on important matters of public interest, including meeting the Millennium Development Goals and other development commitments. Budget transparency is, among other things, essential to protect participatory democracy, to combat corruption and to foster sound development. Yet relatively little information was provided, in spite of the requesters giving authorities at least three clear chances to respond.
- 2 -

Trends and Conclusions
The analysis points to a large number of trends and conclusions. Some are not very controversial, for example that there is a positive correlation between having a right to information law and more open responses to requests. This positive correlation was observed across all of the information openness indicators (complete responses, positive responses, compliant responses, number of attempts and overall timeliness), with the effect being more significant the longer that the RTI law had been in place.
Other trends are less expected, such as that the so-called established democracies perform substantially less well in terms of budget openness than other countries with relatively well-established right to information laws, such as the newer democracies of Eastern and Central Europe. Indeed, these newer democracies represented two-thirds of the top 15 performers in the exercise. Established democracies, all but one of which had a right to information law, did not even perform better than all countries with right to information laws.
In some cases, there are reasonably obvious explanations for the trends identified, such as the very active role played by civil society in promoting the right of access to information in new democracies. Other trends, such as the overall poor performance of the 80 countries in terms of complying with the right to information, are harder to explain and merit further investigation with a view to providing right to information advocates with a deeper understanding of the best strategies to pursue when promoting compliance with the right.
The findings are also important for those working on the substantive issues which were the subject of the questions. They raise the concern that in many cases government bodies do not appear to have the data necessary to take crucial decisions related to promotion of maternal health and environmental protection. The findings also indicate a concerning lack of data on incoming aid flows and a shortage of information on future aid commitments in spite of repeated international pledges to increase the predictability of aid in order to facilitate budget planning in recipient countries.
The findings of this Report and the recommendations are drawn from a strong empirical base of comparative information collected through the testing exercise. As a result, they warrant being taken seriously.
- 3 -

The results of the exercise are sobering and should serve to remind openness campaigners once again that true transparency is a goal which, though certainly worth fighting for, requires constant struggle.
MAIN Findings
* No information was provided in response to over half of the requests and 38% of the requests elicited no response at all, with 15 of the 80 countries providing no response to five or more questions.
* There was widespread failure to answer requests within acceptable timeframes and requesters often had to make repeat requests. Only 12 countries provided six compliant responses within 30 days and less than 1 in 4 requests resulted in information being provided after just one attempt.
* Countries with RTI laws performed significantly better on all indicators. The longer a right to information law has been in place, the shorter the average response time, the less likely it is that requesters have to resubmit requests and the better the response rates in terms of information actually provided.
* Established democracies only performed as well, on average, as all countries with RTI laws. From among the countries with longer-standing RTI laws, the newer democracies took two-thirds of the top 15 spots in terms of greater information openness. This indicates that campaigns to promote the right to information in new democracies have been effective.
* The very small number of actual refusals, both written and oral, demonstrates that although officials frequently blocked access to information, they would rarely go so far as to claim that it should be confidential.
- 4 -

Recommendations
The very poor performance of many of the countries in this survey and the failure to provide responses to requests for the key and uncontroversial financial data indicates that a number of urgent steps need to be taken to improve budget transparency:
Countries without access to information laws should, without delay, adopt comprehensive legislation giving effect to the right to information that meets international standards.
Countries with access to information laws but which have a problem with administrative silence (mute refusals) should take immediate and effective steps to redress this problem so that responses are provided to all requests.
Countries with access to information laws should review the timeframes within which requests are being answered and ensure that requests are responded to within the timeframes established by the law, which should be 20 working days or less;
Training should be provided to officials on their responsibilities under access to information laws so as to ensure that:
o they make an appropriate effort to compile information to respond to requests whenever it can be extracted from existing documents, rather than simply refusing requests where the information is not easily to hand;
o they respond appropriately where the public authority holds only part of the information requested, including by informing requesters clearly which information is being provided and which is not; and
o they issue clear and well-motivated refusals where information requests are refused, in whole or in part, rather than issuing oral refusals or simply failing to respond to requests.
All countries should systematically gather data on access to information requests and their eventual outcomes in order to provide a scientific database of information which can inform an analysis of problems and systemic failures to respect the right to information.
- 5 -

1.IntroductionIt is widely recognised that access to information held by public authorities is a fundamental human right and central to participatory democracy, good governance, sound development and the exposure of corruption. Access to budget information represents a high water mark of all of these benefits of openness, given that the budget represents a key democratic, governance and development interface. This Report presents the results of a comparative testing exercise to assess budget openness in three thematic areas, namely maternal health, development assistance and the environment. The testing exercise involved 80 local organisations making the same six requests for information, two in each thematic area, in 80 different countries around the world. It therefore represents an important contribution to our understanding of access to budget information.
The largest comparative testing of requests for budget information ever conducted, this survey is also significant from an access to information perspective. There is an increasingly robust body of literature on the right to information and on access to budget information, on its main attributes, on the growth in national laws giving effect to this right, and on their strengths and weaknesses. To date, however, this is the first major comparative study of budget transparency based on submitting similar requests for information in a large number of countries.
The testing exercise generated two different types of information. First, it provided a wealth of comparative information in response to the specific questions in the three thematic areas. The questions were specifically designed to be uncontroversial, in the sense that they did not raise serious issues regarding exceptions to the right of access.
In total, 218 responses providing full or partial information (referred to in this Report as “positive responses”) about budget expenditure, from all regions of the world, were obtained through the testing. The failure to provide information, especially through Information Not Held responses, also highlights important knowledge gaps where national governments do not hold information about key development issues.
Second, the exercise provided extensive information about the way in which requests for information are dealt with in the 80 countries, just over half of which have right to information (RTI) laws (also known as access to information or
- 6 -

freedom of information laws) and just under half of which do not. The testing was conducted with rigorous controls designed to ensure maximum comparability of results across countries. As a result, it generated a wealth of solid empirical data about how, in practice, access to budget information works in countries around the world. It has, among other things, generated information about the different kinds of responses to the requests, how long it took to respond, and which countries, and groups of countries, performed better or worse in terms of openness.
It is the second type of information that this Report is primarily about. It starts by describing the methodology used in the testing exercise, followed by an overview of the main results, to orient the reader. It then analyses the responses to the 480 requests, assessing them through various filters such as types of responses (for example Mute Refusals, the provision of Incomplete Information, and reasoned refusals). It also assesses them through the filter of different cuts across the data, such as an analysis by question and by timeliness. Finally, the Report provides a country-based analysis of the data, analysing it on the basis of whether countries have right to information laws, by region, and by comparing the performance of older and newer democracies. The analysis is based primarily on the database of information recorded through the testing exercise. This is supplemented by anecdotal information, including that provided by requesting organisations.
1.1Methodology
The Ask Your Government! 6 Question Campaign arose out of discussions between the partner organisations about the need to gather empirical data on how the right to information serves budget openness. IBP reached out to civil society organisations working in the three thematic areas (maternal health, aid effectiveness and environmental protection) as well as groups working on the right of access to information. IBP then worked with Access Info Europe and the Centre for Law and Democracy to develop the structure for the monitoring and the protocol to be followed by all the requesters.
In selecting the country partners, IBP reached out to its partners, many of whom had been involved in the Open Budget Index. Additional country partners came from the Freedom of Information Advocates Network.
The initiative involved making six requests for budget information in a total of 80 countries around the world and comparing the results. To promote comparability,
- 7 -

not only were the same six questions asked in each country, but a strict methodology was developed regarding the manner of making requests, the follow-up and recording of responses.
The requesting exercise was overseen by three international partners – Access Info Europe, the Centre for Law and Democracy and the International Budget Partnership. Access Info Europe and the Centre for Law and Democracy, organisations which specialise in the right to information, led on the design of the methodology.
The specific questions (See Box A) were developed by groups working in three thematic areas – maternal health, international development assistance and the environment. These were the White Ribbon Alliance, Family Care International, Averting Maternal Death and Disability Program at Columbia University, Publish What You Fund, Development Initiatives, Oxfam USA, the World Resources Institute and the International Institute for Sustainable Development.
The questions and request protocol were finalised at a meeting convened by IBP and held in Washington DC in February 2010.
The project team also comprised 80 different requesting organisations based in the 80 target countries, which were responsible for actually lodging the requests. See Annex A for the full list.
To promote a common level of understanding about the questions themselves, background information on each question was provided to the requesting organisations. To ensure consistency, the organisations were also provided with request letters for all six questions, in three different languages (English, French and Spanish). These letters took into account three difference scenarios: countries with a right to information law giving individuals a legal right to request information, countries with a constitutional guarantee of the right to information but no implementing legislation, and countries with neither a law nor a constitutional guarantee.
- 8 -

- 9 -
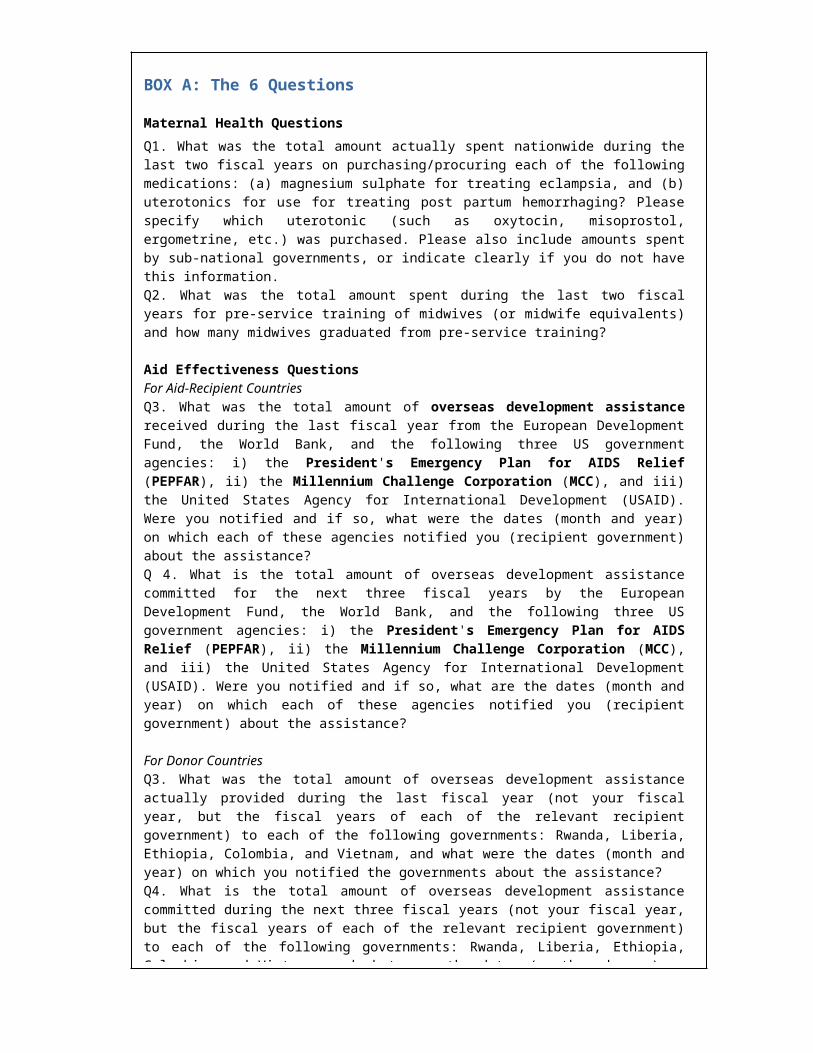
BOX A: The 6 Questions
Maternal Health Questions
Q1. What was the total amount actually spent nationwide during the last two fiscal years on purchasing/procuring each of the following medications: (a) magnesium sulphate for treating eclampsia, and (b) uterotonics for use for treating post partum hemorrhaging? Please specify which uterotonic (such as oxytocin, misoprostol, ergometrine, etc.) was purchased. Please also include amounts spent by sub-national governments, or indicate clearly if you do not have this information.Q2. What was the total amount spent during the last two fiscal years for pre-service training of midwives (or midwife equivalents) and how many midwives graduated from pre-service training?
Aid Effectiveness QuestionsFor Aid-Recipient CountriesQ3. What was the total amount of overseas development assistance received during the last fiscal year from the European Development Fund, the World Bank, and the following three US government agencies: i) the President's Emergency Plan for AIDS Relief (PEPFAR), ii) the Millennium Challenge Corporation (MCC), and iii) the United States Agency for International Development (USAID). Were you notified and if so, what were the dates (month and year) on which each of these agencies notified you (recipient government) about the assistance?Q 4. What is the total amount of overseas development assistance committed for the next three fiscal years by the European Development Fund, the World Bank, and the following three US government agencies: i) the President's Emergency Plan for AIDS Relief (PEPFAR), ii) the Millennium Challenge Corporation (MCC), and iii) the United States Agency for International Development (USAID). Were you notified and if so, what are the dates (month and year) on which each of these agencies notified you (recipient government) about the assistance?
For Donor CountriesQ3. What was the total amount of overseas development assistance actually provided during the last fiscal year (not your fiscal year, but the fiscal years of each of the relevant recipient government) to each of the following governments: Rwanda, Liberia, Ethiopia, Colombia, and Vietnam, and what were the dates (month and year) on which you notified the governments about the assistance?Q4. What is the total amount of overseas development assistance committed during the next three fiscal years (not your fiscal year, but the fiscal years of each of the relevant recipient government) to each of the following governments: Rwanda, Liberia, Ethiopia, Colombia, and Vietnam, and what were the dates (month and year) on which you notified the governments about the assistance?
Environment QuestionsQ5. As a share of the national budget, what was the total amount actually spent on all national agencies in charge of environmental protection and conservation during the last two fiscal years?Q6. What was the total amount actually incurred during the past three fiscal years on subsidies for oil, gas and coal production and consumption?

To achieve this, a detailed Request Protocol was developed and central support was provided to the requesting organisations as they went through the exercise, ensuring that a consistent approach was achieved. The Request Protocol (in English, French and Spanish) can be found on the websites of each of the lead organisations.
A detailed procedure for making and following-up on requests was established, along with clear timeframes. It was established that reasons for the request should never be provided and, in particular, it should not be communicated that the exercise was part of a global testing project. This was done in order to provide a level playing field for measuring governments respect for the right of access to information: it is clearly established by international standards1 that requesters should not be required to explain why they want the information. Most national access to information laws contain provisions to that effect. Otherwise, if information is provided based on the reasons given, it becomes a test of how convincing the reasons are rather than of the government’s willingness to be open.
Requests could be submitted by e-mail, regular mail or hand delivered, whichever was appropriate in the local context.
The Requesting Protocol also set out very clear rules and procedures for recording responses and following-up where a proper response to the request was not provided. A detailed form for recording the process and results was provided to requesting organisations, which included information about the date of submission, the date of acknowledgement, the result and so on.
In order to generate meaningful comparative data about the functioning of the right to information in different countries, the requesting organisations were required to follow standard procedures when submitting requests, when following-up on these requests, and when recording the way in which the authorities respond to those requests.
The twelve different possible responses to requests listed below were outlined in the Requesting Protocol, and an additional outcome, that of “invalid response”, was added as a result of the findings of the testing exercise:
1 See, for instance, the Council of Europe Convention on Access to Official Documents states clearly the requester “shall not be obliged to give reasons for having access to the official document” and that requests “shall be dealt with on an equal basis”. Many national laws reflect this.
- 10 -

Outcome Circumstances
Unable to Submit* It was physically impossible to make the request
Refusal to Accept*An official with decision-making power refused to receive the request
Oral RefusalAn official with decision-making power stated that that they would not answer the request
Written RefusalA written refusal to answer the request was received by the requester
Transferred (intermediate outcome)
The public authority with which the request was lodged transferred it to another public authority
Referred (intermediate outcome)
The public authority with which the request was lodged referred the requester to another public authority
Mute Refusal No response at all – administrative silence
Information ReceivedThe information requested was provided in full to the requester
Partial AccessAccess to part of the information is provided and to part denied, on the basis of claimed exceptions to the right of access
Incomplete InformationOnly part of the requested information is provided
Information Not HeldAuthority responds that they do not hold the requested information
Invalid Answer
A response was given which purported to provide the information but did not, for example irrelevant information or a link to a website not holding the requested data.
Excessive Fees Charged*Fees charged either for filing the request or excessive fees for accessing the information
* None of the requests in this testing exercise resulted in this outcome
Of these possible outcomes, three – namely Written Refusal, Information Received and Information Not Held – were, if proper (i.e. a written refusal was based on a legitimate exception and an Information Not Held response was true), considered to bring the requesting process to an end.
- 11 -

The other nine responses warranted specific follow-up actions. For example, no response after a period of 30 days was deemed a Mute Refusal, with the follow-up being to resubmit the request. In case of an Incomplete Information response, the follow-up was to resubmit the request, asking for the rest of the information. Other responses generated other follow-up actions. The process involved up to two resubmissions of requests (and a potentially greater number of other types of follow-ups, such as attempts at original submission of the request), for a total of three different request attempts per question. In total, 1061 different formal requests for information were submitted, accompanied in some countries by a number of phone calls, additional letters, faxes, and e-mails and even personal visits to the relevant public authorities.
Starting in February 2010, project coordinators working with Access Info Europe and IBP briefed local civil society partners by telephone and remained in constant contact with them throughout the monitoring project, providing support and advice on issues such as how to respond to an incomplete or Information Not Held answer, when to resubmit a request following a Mute Refusal, and in some cases how to handle the questions from public officials who wanted to know why the organisation wanted the information and what they were going to do with it.
A period of about six months was allocated for the whole process, taking into account that countries started at different dates and that there was the possibility of various types of delays.
The data was captured in an on-line database built by Access Info Europe to which all the project partners had access so that they could review and update their information in real time. The thematic partners also had access to this database so that they could review English language summaries of the substantive content of the responses.
Once the testing was completed, the project coordinators conducted a review of the data, checking results and confirming assignment of outcomes with the local partners. The data was then processed and analysed along different axes in order to form the basis for this Report.
The results assessed in this Report are the assigned final responses for each question. Thus, if a public authority responded twice with a Mute Refusal but on the third attempt provided the information, the result would be Information Received. The provision of Incomplete Information followed by two Mute Refusals would lead to an Incomplete Information response.
- 12 -
1.2Main Results
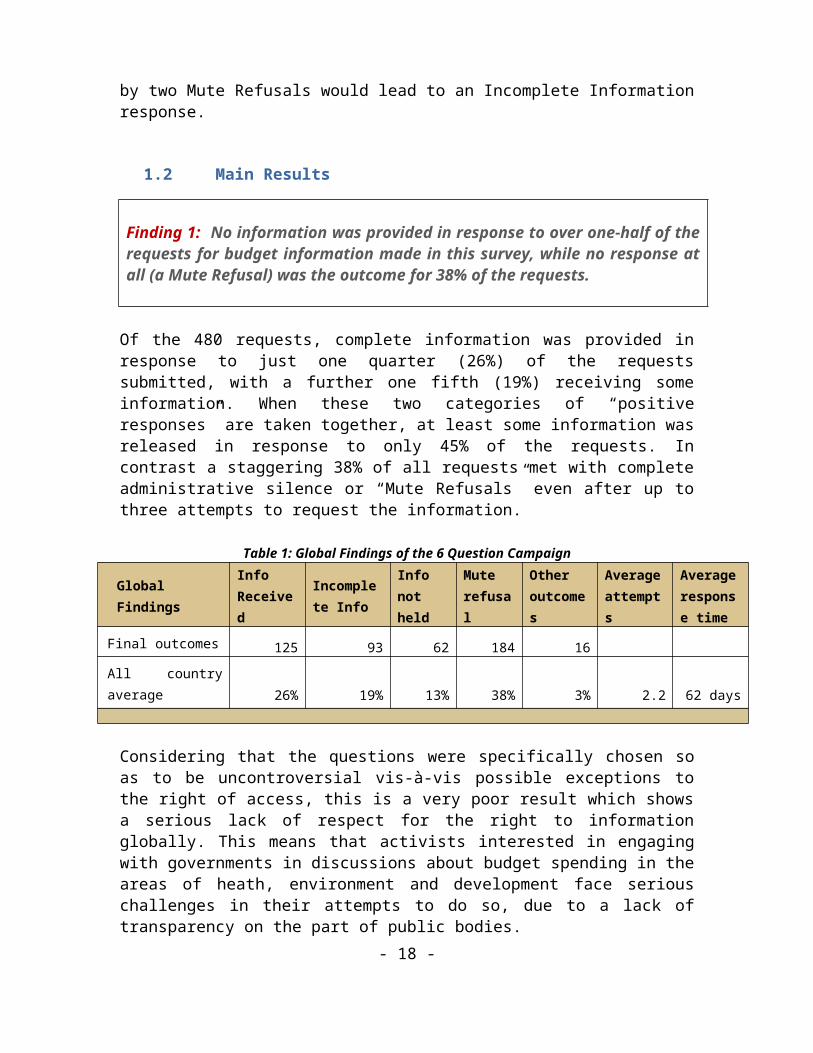
Finding 1: No information was provided in response to over one-half of the requests for budget information made in this survey, while no response at all (a Mute Refusal) was the outcome for 38% of the requests.
Of the 480 requests, complete information was provided in response to just one quarter (26%) of the requests submitted, with a further one fifth (19%) receiving some information. When these two categories of “positive responses” are taken together, at least some information was released in response to only 45% of the requests. In contrast a staggering 38% of all requests met with complete administrative silence or “Mute Refusals” even after up to three attempts to request the information.
Table 1: Global Findings of the 6 Question Campaign
Global FindingsInfo
Received
Incomplete
Info
Info not
held
Mute
refusal
Other
outcomes
Average
attempts
Average
response
time
Final outcomes 125 93 62 184 16
All country average 26% 19% 13% 38% 3% 2.2 62 days
Considering that the questions were specifically chosen so as to be uncontroversial vis-à-vis possible exceptions to the right of access, this is a very poor result which shows a serious lack of respect for the right to information globally. This means that activists interested in engaging with governments in discussions about budget spending in the areas of heath, environment and development face serious challenges in their attempts to do so, due to a lack of transparency on the part of public bodies.
Information Received: Out of the total number of 480 requests, an Information Received response was recorded in 125 cases, or just over one-quarter (26%) of all requests. These were the cases where the information provided constituted a full answer to the request.
- 13 -
Incomplete Information: In another 93 cases, representing nearly one-fifth (19%) of all responses, some but not all of the information was provided. In the majority of cases these Incomplete Information answers demonstrated a good faith attempt by the public bodies to answer the request, in spite of not having all the information. Indeed, the majority of these partial answers were of high quality.
Information Not Held: In this study, the response to a total of 62 requests (13%) was that the authority did not hold the information. Most right to information laws require that where a public authority which does not hold the information is aware of another one which does, it should either transfer or refer the request to that other authority. This did happen in some cases, but by no means in all.
Mute Refusal: In total, 184 (38%) of all requests met with Mute Refusals (simply no answer). Mute Refusals are the most egregious breach of the right to information, since they represent situations where public bodies simply do not bother to respond at all to requests. It is a matter of serious concern that there were 50% more Mute Refusals than Information Received responses.
Written and Oral Refusal: Very few responses resulted in actual refusals to provide information – whether via an oral or written refusal – specifically for just 10 out of 480 responses, or just over 2%. In the context of this study, this is positive, inasmuch as it means that public authorities were not invoking exceptions to refuse to provide information.
Invalid Response: The testing exercise also includes six responses which have been assigned “Invalid Response” labels. These are mainly responses where some information was provided, but it did not answer the question posed in the request. This might be because the information was excessively general or because the requester was referred to a website which did not contain the information being sought. In some cases, these responses seemed to have been provided in bad faith, with no serious effort to process the request properly.
- 14 -

2.Analysis by Response Type
This part of the Report provides a more in-depth analysis of the results broken down according to the type of responses provided to the requests, specifically: Compliant Responses; Incomplete Information; Information not Held; Mute Refusals; and Refusals and Rejections.
2.1Compliant Responses
For purposes of this Study the 6 Question Campaign, Information Received, Incomplete Information and Information Not Held outcomes are all considered to be “compliant” with the right to information. As noted above, in most cases Incomplete Information outcomes appeared to be in good faith, which is why they have been classified as compliant. From the perspective of the right to information, a response of Information Not Held, assuming that the information is indeed not held, is a compliant response.
Figure 2: Compliant and Non-Compliant Outcomes
A Written Refusal, if proper, in the sense that it refers to a legitimate exception as the basis for the refusal, is generally considered to be a compliant response. However, for purposes of this Report, refusals are considered to be improper responses, based on our assessment that for these questions, there are no legitimate exceptions which would justify withholding the information. Thus, recognised exceptions such as privacy, national security, management of the economy and so on simply do not apply here.
- 15 -
58%
42%
COMPLIANT AND NON-COM-PLIANT OUTCOMES
Compliant responsesNon-compliant responses

In total 280 requests (58%) resulted in compliant outcomes, with a further 200 requests (42%) resulting in non-compliant outcomes.
Finding 2: More than four out of every ten responses (42%) were not compliant with the right to information.
These figures reflect a high level of disrespect for the right to information in many countries. This is a matter of particular concern given that the questions in the testing exercise aimed to obtain uncontroversial information about budget spending in areas which generate a significant amount of citizen interests.
When the 16% Information Not Held response are discounted, the number of requests which were compliant and actually resulted in the provision of information drops to 46%, with over half, 54% of requests not resulting in the release of any information whatsoever.
Figure 3: Information Received vs. No Information Outcomes
A breakdown of compliant responses by number of attempts required shows that, on average, an Information Received response required 1.7 requests, while nearly two attempts were needed in the case of Incomplete Information or Information Not Held, the other compliant outcomes. On average, requesters did not receive a compliant answer in response to the first submission of their requests.
- 16 -
46%54%
INFORMATION RECEIVED VS. NO INFORMATION OUT-
COMES
Information ReceivedNo information outcomes

Table 2: Average Number of Attempts by Response Type
Outcome Percentage of Total Average attempts Average time
Information received 26% 1.66 attempts 37 calendar days
Incomplete information 19% 1.98 attempts 51 calendar days
Information not held 13% 1.90 attempts 45 calendar days
Furthermore, if requesters had only made one attempt to obtain the information, which should in theory be enough, the percentage of compliant outcomes drops significantly, from 58% to just 28%, as demonstrated in the following table:
Table 3: Outcomes After Just one Request
Outcome Number of outcomes Percentage of Total
Information received 70 15%
Incomplete information 32 7%
Information not held 28 6%
Finding 3: Even in the context of compliant outcomes, more often than not requesters had to make a second request to obtain this result, with average timelines ranging well beyond the minimum standards established by international standards.
A key finding of the 6 Question Campaign testing exercise is that it is only by demonstrating a level of persistence which should not be necessary in a functioning access to information regime that requesters are able to obtain a compliant response. The average time frames for the compliant outcomes were much longer than the maximum time limits recognised by international standards, as shown in Table 2. These findings suggest that there are serious problems with the respect for the right of access to information across the countries surveyed.
2.2Incomplete Information
An analysis of Incomplete Information responses reveals a complex picture involving at least three different types of response. First, there were responses which appeared to contain all of the information that the public authority held on the question, but this was not complete in the sense that it did not fully answer the
- 17 -

question. In other words, these responses were technically a combination of Information Received and Information Not Held. For example, in response to Question 2, on education of midwives, Germany provided information on the number of people trained, but not on the cost, because the hospitals which provided this training did not separate out the costs of this particular type of training in their budgets. Other countries where the authorities provided some information and explicitly stated that they did not hold the remainder of it included Armenia, Bosnia, Colombia, DRC, Dominican Republic, Ecuador, El Salvador, India (2 responses), Mexico (2 responses) and the United States.
A second situation was where a good answer was provided, but the request was not fully answered without the public authority acknowledging this or explaining why not all information had been provided. This was a particular issue with questions three and four, which asked for information about five different countries or donors (depending on whether the country in question was a donor or recipient). Sometimes, information was provided on some donors, but not on all. It was not always clear whether information had been omitted by mistake or there was no information held on the other donors. For example, Georgia did not provide any information about funding from the European Development Fund and PEPFAR. However, it is possible to conclude that they did not hold information about these funds, since they do not operate in Georgia. In other cases, the situation was less clear.
Third, in some cases, countries provided only very superficial information in response to questions, raising a concern that they had not made a serious effort to answer the question properly (in which case, the response fell somehow between an Incomplete Information answer and an Invalid Response). An example of this comes from Brazil where, in response to Question 5 regarding spending on environmental agencies, the Ministry of Environment provided total spending, but not the budget percentage (something which also happened in a handful other countries). More seriously, the figures were those for budget commitments, not the actual spending of the Ministry. This Incomplete Information therefore came close to an Invalid Response.
Despite this, as most of the Incomplete Information answers were of high quality and appeared to be in good faith, for purposes of statistical analysis in this Report we give countries the benefit of the doubt and count them as compliant responses.
- 18 -
2.3Information Not Held
A total of 62 requests (13%) received an Information Not Held response.
Finding 4: The rate of “Information Not Held” outcomes of 13% suggests potential problems with information management inside public authorities responsible for aid funds, environment and maternal health.
It is difficult to assess whether the 13% of Information Not Held responses is high. Certainly it is much higher than the 3% registered in the Transparency and Silence survey.2 On the other hand, that study also registered a much higher rate of Mute Refusals and other refusals, and the questions involved were different. In some cases, Information Not Held responses were clearly suspicious. Thus, for some requests, two Mute Refusals were followed by a ‘not held’ response, leading to a sense that the latter was simply a brush-off. In other cases, very vague answers were provided, again creating suspicion that the requester was simply being brushed off. Thus, in Azerbaijan, for Questions 1 and 2, the Ministry of Health simply wrote that it could not respond “because of lack of suitable statistics”.
One might expect a relatively low rate of Information Not Held responses for a number of reasons. First, one would normally expect the information corresponding to four of the questions, namely those about aid and the environment, to be held by a national public authority, even in federal States, subject to a possible caveat regarding the question about future aid.3
However, the information requested in the maternal health questions is, in many countries, held only at a sub-national or even institutional level. This can be seen in some of the answers. In Armenia, for example, in relation to Question 1 on drugs for postpartum haemorrhaging, the response was that this information was held at the level of health care institutions, with a comment added that they were well-provided with the drugs in use at the time. In Bosnia-Herzegovina, the response to Question 2 about education of midwives was that this is provided through secondary medical schools and not by the Ministry of Health.
2 Transparency & Silence: A Survey of Access to Information Law and Practices in 14 Countries (2006, New York, Open Society Justice Initiative) was a survey conducted by the Open Society Justice Initiative in 2004 involving nearly 2000 requests in 14 countries.3 See below under section 3.4 for an analysis of this.
- 19 -

It is perhaps significant that over one-half of the Information Not Held responses were in the area of maternal health, and that the future aid question also had a high ‘not held’ response rate. Indeed, the rate of ‘not held’ responses for the other three questions drops to just 7%, which seems appropriately low.
Second, where a question was directed at the wrong authority, the proper response would be to direct either the requester, or the request itself, to the right authority (refer or transfer). This did indeed happen for many requests. A good practice example of this was New Zealand, where the law requires requests to be transferred if it is known that other public authorities hold the information. The national agency at first refused to transfer the question on postpartum haemorrhaging drugs to the local health bodies which held that information, perhaps because of the complexity of this, but upon being reminded of their obligations, they did so and the information was received.
At the same time, there were examples of suspected poor practice in relation to transfers following on from Information Not Held responses. In some cases, requests were transferred back and forth between institutions. For example, in Macedonia, Question 6 on fuel subsidies was sent from the Ministry of the Economy to the Agency of Commodity Stocks and back. In Spain, Question 5 on funding for environmental agencies went from one part of the Ministry of the Economy to another department in the same ministry to the Agency for Energy and then back to the Ministry of the Economy. It is not clear in these cases whether this was due to a failure to treat the request seriously, or because the respective public authority did not hold the information and thought the other one might.
Furthermore, there were many examples of Information Not Held responses which were not followed up by transfers or referrals. Such a follow-up is warranted only if the public authority is aware of another body that holds the information. Where the information is disbursed among many authorities (for example, among local health providers), it is understandable if a referral is not made. Further research would be needed to assess properly whether or not there was a significant problem of an illegitimate failure to transfer or refer following-on from Information Not Held responses.
2.4Mute Refusals
Nearly four in ten (38%) of all of the responses to the 480 questions were Mute Refusals, meaning that public bodies did not respond in any way at all to the request. This rate is particularly egregious considering that the testing exercise
- 20 -

involved, where necessary, three attempts to request the information. In most cases, a final response of Mute Refusal meant that the authority in question failed to respond three times in a row.4
Finding 5: Administrative silence in the face of access to information requests is blocking access to budget information in 55 of the 80 countries surveyed.
The high level of Mute Refusals is perhaps the most serious failing recorded by the 6 Question Campaign. At the same time, it is not inconsistent with other comparative testing exercises. Around the world administrative silence continues to be one of the most significant ways in which public authorities violate the right of access to information.5
In total 55 countries had at least one Mute Refusal. The data demonstrates that the rate of Mute Refusals is significantly lower for countries which have right to information laws and decreases consistently the longer such a law has been in place (see Table 6). This tends to suggest that the high level of Mute Refusals could, in at least some countries, be explained by ignorance on the part of officials about their obligations to respond to public requests for information. Awareness of the rules can generally be expected to increase with the adoption and then longevity of a right to information law.
Table 6: Rate of Mute Refusals Against Longevity of RTI Law
RTI Law Status Number of countries
Number of Mute Refusals
Average Mute Refusals
Mute refusals by %
Global Finding 80 184 2.3 38%
No RTI law 36 114 3.2 53 %
Has an RTI law 44 70 1.6 27%
Law < 5 years old 11 29 2.6 43%
Law 5-10 years 20 28 1.4 23%
Law 10 years + old 13 13 1 17%
4 In a few cases, less than three submissions were made before a final result of Mute Refusal was recorded. This happened, for example, when during follow ups the requesters were persistently asked for reasons, treated with suspicion, or treated aggressively, so that requesters adjudged that there was little point in making a third attempt to get the information. 5 Indeed, the finding in the 6QC is significantly lower than the 47% of Mute Refusals recorded in the Transparency and Silence survey. See note 1.
- 21 -

Some 15 countries registered either five or six Mute Refusals in total (see Table 7). These countries represent just 19% of all countries but are responsible for 45% of all Mute Refusals (83 in total). Most of these countries do not have right to information laws. The exceptions are France (whose law was adopted 32 years before the testing exercise), Trinidad and Tobago (9 years), Uganda (4 years) and Bangladesh (less than 1 year). The case of France is most surprising since despite having had a right to information law for 32 years, it recorded 5 Mute Refusals, each after 3 attempts.
Table 7: Countries with highest levels of Mute Refusals
Country RTI LawAverage
Attempts
Mute
Refusals
Yemen no 1.33 5
Iraq no 2.17 5
Malaysia no 2.5 5
France yes ― 32 years 2.83 5
Morocco no 2.83 5
Uganda yes ― 4 years 2.83 5
Nigeria no 3 5
Algeria no 3 6
Bangladesh yes ― 1 year 3 6
Cameroon no 3 6
East Timor no 3 6
Liberia no 3 6
Nicaragua no 3 6
Trinidad and Tobago yes ― 9 years 3 6
Venezuela no 3 6
When these 15 counties are removed from the mix, the rate of Mute Refusals drops from 38% to 26%, while the percentage of Information Received responses jumps from just over a quarter to nearly a third. Similarly, removing the 15 worst countries causes the percentage of overall compliant responses to rise from 59% to nearly 71%, a relatively healthy figure.
Finding 6: In 15 of the 80 countries, officials made no or virtually no attempt to provide any answers to requests for budget information.
- 22 -

Mute refusals were remarkably consistent across all six questions, ranging from a low of 34% to a high of 41%. The consistency increases even more when thematic questions (i.e. on maternal health, aid and the environment) are grouped (in which case the range is just 37% to 39%). This suggests two conclusions.
First, the rate of Mute Refusals is not particularly question dependent and cannot be accounted for by any possible differences in the complexity or sensitivity of the questions.
Second, it suggests very little variation in terms of the rate of Mute Refusals across different public authorities. Although one might expect there to be institutional differences in terms of openness, and although other studies have found that ministries involved with the environment are generally more open,6 this was not reflected in the data from this testing exercise.
It seems reasonable to conclude that in countries with high levels of Mute Refusals the institutional culture fails to take seriously and to respect the public’s right to information.
2.5Refusals and Rejections
In total there was just one formal Written Refusal and nine Oral Refusals as final outcomes to the 480 requests in this testing exercise. The extremely low rate of ‘confirmed’ or ‘positive’ refusals confirms that public officials around the world viewed the information requested as data which could legitimately enter the public domain. In some cases, however, requesters were intimidated or threatened, which constitutes a violation of their right to information.
In terms of substance, only two of the 10 Oral and Written Refusals raised any objection to release of the information which could be said to relate to a legitimate exception. The one Written Refusal occurred in Iraq in response to Question 6 about fuel subsidies. The requester was told that the information was subject to a confidentiality agreement, and such an agreement was indeed found on the website of the Ministry of Finance relating to the economic reform program adopted in collaboration with the International Monetary Fund (IMF) about reducing government subsidies on oil. Further investigation would be needed to assess whether or not this agreement and its apparent confidentiality clause is a proper exception according to international standards, but it would appear to be legitimate for authorities in Iraq to rely upon it.
6 See Transparency and Silence, note 1. - 23 -

In the case of Yemen, in relation to Question 1 about maternal medicines, the requester was told orally that the information was private. This might be a legitimate response if the request had been about provision of these medicines to individuals. But given that the question simply asks for overall spending on these medicines, it does not raise a privacy issue.
Finding 7: The very small number of refusals, both written and oral, demonstrates that although officials frequently blocked access to information, they would rarely go so far as to make positive claims that it should be confidential.
In the other cases, the refusals did not make a serious attempt to identify an exception to the right of access but, rather, relied on extraneous considerations. For example, for Question 1 and 2, the requester in the Democratic Republic of Congo was told by an administrative advisor to the Ministry of Health that they refused to provide information to just anybody. In Nigeria, the requester was told, also in relation to Question 1, that this was sensitive information that “could not just be given to anyone”.
In Nigeria, when the local partner visited the Ministry of Health, they met with the Deputy Director who questioned why the requesting organisation was seeking information on vital and controversial issues, and even suggested that they might be from the Auditor General’s office or the Economic and Financial Crimes Commission. The requesting organisation then provided an explanation about their work and their interest in the data, but was told that it was sensitive and its disclosure would have to be discussed with the Director. After that, organising another meeting proved impossible.
The requester in Tajikistan was told, once again in relation to Question 1, that they should not be asking for this information. In Papua New Guinea and Portugal, both in relation to Question 5, oral refusals were simply provided, apparently without any reasons.
- 24 -

Table 8: Oral Refusals
Oral Refusals RTI LawQuestion
Number
Attempt
Number
DRC no 1 3
DRC no 2 3
Nigeria no 1 3
Papua New Guinea no 5 3
Portugal yes – 17 years 5 2
Sierra Leone no 2 3
Sri Lanka no 5 3
Tajikistan Yes – 8 years 1 2
Yemen no 1 1
We can thus conclude that, with the possible exception of one question in Iraq, none of the confirmed refusals to provide information were based on legitimate exceptions. This conclusion is supported by the finding that most of the Oral or Written Refusals came after the second or third attempt to obtain the information (the average being 2.6 attempts for these outcomes). This indicates that only when requesters persisted, often following up after two Mute Refusals, were they given some kind of a refusal to provide the information, most likely as a way of trying to discourage further requests.
It is of particular concern that although a statistically small number of refusals were received, the treatment of requesters in some countries comes close to a reprimand for even asking for the information, and in a handful of cases this reprimand was threatening. It is unacceptable for public officials to intimidate people exercising their right to information. Given that the right to information has been clearly established by international human rights tribunals as an inherent part of freedom of expression, such actions are a violation of this basic democratic right.
- 25 -

3.Analysis By Other Factors3.1 Timeliness
The average time taken to respond to all of the requests made in this testing exercise was 62 calendar days, calculated as the number of days between making requests and receiving an answer.7 This includes, where applicable, up to two follow-ups to the original request, for example in the case of Mute Refusals, referrals and Incomplete Information answers. Mute refusals were allocated a time of 30 calendar days, on the basis that most right to information laws require requests to be responded to in 30 calendar days or less. For questions which received an answer, as opposed to Mute Refusals, the average time per response dropped to 45 days.
Only nine of the 80 countries surveyed managed to achieve an average response time of 30 days or less, meaning that other countries were in breach of their right to information laws. Guatemala had the shortest overall average response time, of 10 days, followed by Georgia (11), Armenia (13), the Philippines (15), Montenegro (19), Romania and Germany (27), and Canada and Moldova (30). A handful of countries fell just outside this, averaging 31 days to respond: Bulgaria, Colombia, Kazakhstan, New Zealand, and Slovenia.
Figure 4: Percentage of countries responding within 30-day timeframe
Only 12 of the 80 countries in the study managed to provide compliant answers to all 6 questions within around 30 days from when the first request was filed (see
7 Some 26 requests were excluded from this calculation, for example because they were deemed invalid or because the dates were not clearly recorded.
- 26 -
11%
89%
DISTRIBUTION OF TIMES
Managed to achieve an average response time of 30 days or lessAverage response time of more than 30 days

Table 9). These, then, were the only countries that fulfilled two key conditions for the right to information: that requests be answered and that they be answered in a timely fashion.
At the other end of the spectrum, several countries had an average response time of 90 days, based on providing Mute Refusals to all questions, and two countries were actually over this limit (Papua New Guinea, 95.6 days, and Ecuador, 101.2 days), although by the same token at least they did provide answer to some requests.
Finding 8: There was widespread failure to answer requests within acceptable timeframes, with only nine countries operating on average inside a 30 calendar day time limit and only 12 countries providing six compliant responses within around 30 days.
The long time to respond to requests is extremely problematical from a right to information perspective. The average time limit for right to information laws around the world is around 15 working days or 21 calendar days, and the 30 calendar day upper limit set for this testing exercise can be seen as a maximal figure. Delay in provision of information directly undermines the very purposes for which information of this sort is being requested, namely to participate in decision-making and to hold governments to account.
There was a remarkable degree of consistency in the average time taken to respond to the different questions, as illustrated in Table 10, with the difference between the shortest and longest time being just 14% or less than 8 days.
Table 10: Average Time to Respond to Requests by Question
Q1 Q2 Q3 Q4 Q5 Q6
Average response time 61.9 days 65.4 days 61.8 days 57.3 days 65.0 days 60.8 days
The data also shows that countries with right to information laws had substantially shorter average response times than countries without, and that the response time decreased on average with the longevity of the right to information law (see Table 11). Table 11 shows that longevity of the access to information law not only correlates with faster responses, but also with better responses, in the sense of actually providing more information.
- 27 -

Finding 9: The longer a right to information law has been in place, the shorter the average time for responding to requests for information.
Table 11: Average Response Time against Longevity of RTI Law
RTI Law Status Average Response Time
Positive responses %
Compliant responses %
All countries 61.6 days 45% 58%No RTI law 72.5 days 33% 42%Has an RTI law 52.7 days 55% 72%Law < 5 years old 60.6 days 43% 55%Law 5-10 years old 54.4 days 57% 75%Law 10 years + old 43.5 days 62% 82%
3.2 The Number of Attempts
In the protocol for this monitoring requesters were required to make up to 3 attempts to obtain the information. This meant that, if the information was refused or if there was administrative silence, the requesters would resubmit the request up to two more times. In addition to this, requesters were advised to follow up to find out the status of the request by phone, e-mail, or going in person to the institution to find out what had happened to their request.
As a result of following the protocol, requesters submitted the 480 requests a total of 1061 times. In addition, there were numerous phone calls, e-mails, and personal visits to try to attempt to ascertain the status of the request. Some requesters continued to pursue the requests beyond the three attempts although in the majority of cases this did not result in the provision of information. The unfortunate conclusion here is that once the system has failed to provide a requester with information, further persistence is unlikely to pay off. The use of formal appeals mechanisms (which were not tested in this monitoring) might therefore be the best route for requesters determined to get certain information.
For the purposes of the results in this survey, the outcomes of the first three attempts were recorded and the “best” result was selected. So, for example, if a requester was given incomplete information following the first attempt and tried
- 28 -

again to get fuller information with the subsequent two attempts resulting in administrative silence, then the recorded result would be incomplete information.
The data shows an inverse relationship between longevity of the right to information law and the average number of attempts required to obtain a response from public authorities (i.e. fewer attempts were required in countries with longer-standing right to information laws).
Table 12: Average Number Attempts against Longevity of RTI Law
RTI Law Status Average Number of Attempts
Positive responses %
Compliant responses %
All countries 2.23 45% 58%No RTI law 2.01 33% 42%Has an RTI law 2.50 55% 72%Law < 5 years old 2.41 43% 55%Law 5-10 years old 2.07 57% 75%Law 10 years + old 1.60 62% 82%
Thus, the overall average number of attempts out of a maximum of three was 2.23, with figures of 2.50 and 2.01, respectively, for countries without and with an RTI law, a difference of 24%. No country without an RTI law achieved an average number of attempts of just one, the ideal, although the Philippines came close with 1.17.8 Two countries with laws of between five and ten years had scores of just one attempt (Armenia and Turkey) and four countries with laws of ten years or over achieved this (Canada, Colombia, New Zealand and Ukraine).
Finding 10: The longer a right to information law has been in place, the less likely it is that requesters have to resubmit requests to obtain responses.
Several of the established democracies did poorly in this area, with France, Italy, Portugal and the United States all requiring two or more attempts on average, and Norway coming in at 1.83. Younger democracies tended to do better. From among the thirteen countries with laws of ten years or more, for example, the established democracies had an average number of attempts of 1.88, while the other countries had an average of just 1.28.
8 Although the Philippines does not have a right to information law, its constitution does guarantee this right and it is one of the few countries where a constitutional guarantee has been used to some effect in practice to access information.
- 29 -

Figure 5: Average number of attempts by how long law in force
There was also a rough correlation between different response outcomes and the average number of attempts required. Thus, in general, more positive outcomes (ranging from Information Received to Incomplete Information to Information Not Held to Mute Refusal) required progressively fewer attempts.
The average of nearly two attempts to receive an Incomplete Information response suggests that public authorities are prone to ignore requests where they hold only part of the information or where they do not hold it. The largely good-faith nature of incomplete information responses might suggest that persistence prompts them to provide at least part of the information.
The data indicates that after two attempts, further persistence is not likely to elicit an optimal response. Where a compliant response was not forthcoming after the first or second attempt, the evidence suggests that additional efforts are unlikely to result in the information being provided (with a refusal or an Invalid Response being likely or even a refusal to process the request at all, resulting in a Mute Refusal).
Table 13: Attempts by outcome
Info
received
Incomplete
Info
Info not
held
Mute
refusal
Oral
/Written
Invalid
response
- 30 -
Genera
l avera
ge of a
ttempts
Countries
with no RTI l
aw
Countries
with RTI
law
Countries
with La
w < 5 ye
ars old
Countries
with la
ws 5-10 ye
ars old
Countries
with la
ws 10 ye
ars +
old 0
1
2
3
Average Number of Attempts
Average Number of At -tempts

refusal
Number of
Attempts1.66 1.98 1.90 2.78 2.6 2.17
As noted in Section 3.2 above, if requesters had stopped after just one attempt, which is all a requester should have to make under a properly functioning RTI regime, the results for this study would have been radically different, with the level of compliant responses dropping from 58% to only 28%.
Finding 11: Less than 1 in 4 (22%) requests resulted in information being provided to the requester after just one attempt.
3.3 Reasons
Quite a few requests did meet with a demand from the public authority addressed for the reasons behind the request, although this is contrary to international standards and specifically prohibited in many right to information laws. In some cases, public authorities seemed to feel the request was motivated by a desire for commercial gain, and that this was inappropriate. In other cases, concern was expressed about the information being made available to foreigners. In some countries, very formal written replies did not ask for reasons, but these were interspersed with much less formal oral replies (for example over the telephone), where reasons were asked for.
Finding 12: All too often, requesters were asked for the reasons for their requests, contrary to clear international standards prohibiting this.
In at least some cases, however, requesting organisations attributed problems with the processing of requests, including asking for the reasons behind the request, to misunderstanding, bureaucracy and inefficiency, rather than a specific desire to be secretive. For example, requesters faced a number of problems in Namibia, including oral demands for reasons, transfer of requests to the wrong departments and provision of the wrong information. But, in the end, positive responses were
- 31 -

provided to all six questions, even though Namibia does not have a right to information law.
After the testing exercise was completed, a mini-survey was conducted among requesting organisations to assess the extent to which they were asked for the reasons for their request by public authorities. A total of 38 partners in 14 countries responded of which 14 (37%) said that they had been asked for reasons for their requests on at least one occasion. Of the 14 countries, six had a right to information law and eight did not. Those with a law where requesters were asked for reasons included Bosnia, the Kyrgyz republic, Portugal, Pakistan, Tajikistan, and Ukraine. Those without a law where requesters were asked for reasons included Chad, the DRC, Ghana, Malaysia, Mozambique, Namibia, Nigeria and Zambia.
3.4 Analysis by Question
An analysis of the responses by question reveals some interesting patterns. Overall, there was a very high degree of consistency across all questions for compliant answers, counted as the combination of Information Received, Incomplete Information and Information Not Held responses. Indeed, all six questions scored results of between 53% and 62% on this.
Finding 13: Despite significant differences in terms of individual response types, all six questions received comparable scores in terms of compliant responses.
Table 14: Responses by Question – Positive and Compliant Responses
Global FindingsInfo
received
Incomplete
Info
POSITIVE
RESPONSES
Info not
held
COMPLIANT
RESPONSES
All country average 26% 19% 45% 13% 58%
Q1. Maternal - medicines 23% 11% 34% 26% 60%
Q2. Maternal - midwives 23% 20% 43% 14% 57%
Q3. Aid - spent 19% 33% 52% 10% 62%
Q4. Aid - committed 14% 31% 44% 16% 60%
Q5. Environ - agencies 45% 5% 50% 3% 53%
Q6. Environ - subsidies 34% 16% 50% 9% 59%
The 6 Questions in Brief
- 32 -

Q1: How much was spent in the last two fiscal years on life-saving drugs to reduce maternal mortality?Q2: How much was spent in the last two fiscal years on training midwives (or equivalents), and how many were trained?Q3: How much aid was received (or provided) during the last fiscal year, and when was notification about it given?Q4: How much aid will be received (or provided) during the next three fiscal years, and when was notification about it given?Q5: How much was spent on national environmental agencies during the last two fiscal years?Q6: How much was spent on subsidizing fossil fuel production and consumption during the last three fiscal years?
There were however some important and striking differences between the results for each of the questions, with Information Received outcomes ranging from 14% to 45%, Incomplete Information responses ranging from 5% to 33%, and Information Not Held from 3% to 26%.
Table 15: Responses by Question – All Responses
Global FindingsInfo
received
Incomplete
Info
Info not
held
Mute
refusal
Oral
refusal
Written
refusal
Invalid
response
All country average 26% 19% 13% 38% 2% 0.5% 1.5%
Q1. Maternal - medicines 23% 11% 26% 34% 5% 0% 1%
Q2. Maternal - midwives 23% 20% 14% 40% 3% 0% 1%
Q3. Aid - spent 19% 33% 10% 38% 0% 0% 1%
Q4. Aid - committed 14% 31% 16% 38% 0% 0% 1%
Q5. Environ - agencies 45% 5% 3% 43% 4% 0% 1%
Q6. Environ - subsidies 34% 16% 9% 39% 0% 1% 1%
Questions 1 and 2 were about budget spending to promote maternal health. These questions received the highest levels of Information Not Held responses. Indeed, Question 1, on maternal health medicines, received 21 such responses (26%), far higher than any other question (the next highest being 16% for Question 4 on future aid funding). If accurate, in the sense that a national public authority really did not
- 33 -

hold the information, this is formally a compliant response in terms of access to information.
The high levels of Information Not Held outcomes were offset for the maternal health questions by low scores for Positive Responses (i.e. the combined number of Information Received and Incomplete Information responses), where these questions scored bottom and next to bottom. Question 1, on maternal health medicines, was appreciably lower in this regard than any other question (34% versus 43% for Question 2). Again, these low comparative scores may reflect the fact that the information sought was simply not held at the national level.
It seems reasonable to posit that, in many countries, responsibility for maternal health is located at the sub-national level rather than at the level of the national, or federal, government. Question 1 somehow adverts to this possibility, stating that the answer should include amounts spent by sub-national governments. However, analysis of the answers received indicates that, in many countries, responsibility is located even more locally, at the level of individual institutions and data is not available centrally.
Hence the high levels of Information Not Held outcomes reflects the way that health systems are structured nationally and the level of detail which central government has about the availability of certain medicines. Maternal health advocates may wish to consider how important they believe it is for national governments to maintain central information on these issues to be able to deliver effective maternal health care.
Questions 3 and 4 were about aid spending. Question 3 asked about aid funds received or spent in the previous three years and Question 4 pertains to future aid flows, asking recipient countries about aid expected from five funding programmes over the next three fiscal years, and asking donors about aid they expected to provide to five recipient countries over the following three fiscal years, including dates of notification of the aid.
These questions had the lowest Information Received responses, at rates of 19% and 14% respectively (contrasting with 45% for the top-scoring environmental Question 5). This is somewhat surprising, at least for aid spent/received, where relatively good record keeping would be expected. This low figure is offset by a rate of Incomplete Information responses for these questions was far higher than for any other questions (33% for Question 3 and 31% for Question 4) bringing the level of Positive Responses for these questions to equal to or above the overall average of
- 34 -

45%. One reason for the low level of complete information may be the complexity of the questions (involving five countries or funding programmes over three years).
In terms of future aid flows, donors committed to providing information on rolling forward expenditure plans at the Third High Level Forum on Aid Effectiveness, in the Accra Agenda for Action, adopted on 4 September 2008. Specifically, the document states, in paragraph 26:
b) Beginning now, donors will provide full and timely information on annual commitments and actual disbursements so that developing countries are in a position to accurately record all aid flows in their budget estimates and their accounting systems.
c) Beginning now, donors will provide developing countries with regular and timely information on their rolling three- to five-year forward expenditure and/or implementation plans, with at least indicative resource allocations that developing countries can integrate in their medium-term planning and macroeconomic frameworks. Donors will address any constraints to providing such information.
It is possible that some countries interpreted Question 4 on future aid flows as being different from the commitment above, leading to low complete responses and yet relatively high incomplete responses (i.e. they provided rolling forward expenditure information, but as an incomplete response to the question).
The results of the 6 Question Campaign demonstrate that donors are largely failing to meet the commitments made in Accra to provide “full and timely information on annual commitments and actual disbursements”. This is an issue which aid transparency campaigners need to raise with donor and recipient governments.9
The two environmental questions received the highest levels of Information Received responses, which far outstripped those of any other question, at 45% and 34%, respectively, for Questions 5 and 6 (the next highest rate was 23% for both Questions 1 and 2). These questions were both at the top end of the list in terms of some information being provided (i.e. their combined scores on Information Received and Incomplete Information responses), with the same rate each of 50%. They also received lower numbers of Information Not Held responses than any other questions, bringing their Compliant Response levels close to the overall
9 A number of the partner organisations in the 6 Question Campaign are engaged in international advocacy to promote greater aid transparency, including through the donor-led International Aid Transparency Initiative.
- 35 -

average (53% for Question 5 and 59% for Question 6 compared with an average of 58%).
The finding of the 6 Question Campaign is that the environmental requests received more complete information than other questions. The explanation for the higher level of information provided could be that the environmental access to information movement has been very active and over the past years has successfully advocated for special access to environmental information laws in many countries. The fact that this movement has also filed a lot of requests for information may mean that ministries of environment are used to answering information requests. It may also be that Question 5, which received the highest rate of complete information responses, was relatively simple and hence easier for public authorities to answer, although the questions were designed to be of a similar level of complexity.
That said, the total number of Positive Responses for the environmental requests was only 50% for each of these questions, there remained another 50% where information was not provided. Clearly governments still need to do more to fulfil commitments to transparency on key environmental issues such as fuel subsidies and
- 36 -

4.Country Analysis
This part of the Report assesses the data based on the performance of different countries and identifies the main trends along with the factors which might account for differences in country performance. The following sections assess country performance in relation to positive responses, the presence or not of a right to information law, whether the country is a long-established democracy or not, regional differences, and, finally, the differences between donor and recipient countries.
In addition to the above, Access Info Europe and the Centre for Law and Democracy also examined other variables for correlation with the findings of the 6 Question Campaign. These included the size of the country (in terms of population), economic indicators (such as GDP per capita), the country’s rating on the UN’s Human Development Index, and the country’s position on the Reporters Sans Frontiers Press Freedom Index, and the country’s position on the Transparency International Corruption Perceptions Index. We did not find any statistically significant correlations. However, we did note some potentially interesting relationships with respect to Corruption Perceptions Index (CPI) scores, the bottom 10 countries have a CPI score of 2.5 out of 10, whereas the top 10 have double this at 4.9 out of 10. At the same time, there were high corruption countries such as Georgia (3.8), Armenia (2.6) or Serbia (3.5) which performed well and lower corruption countries such as Norway (8.6) or France (6.8) which performed less well. Hence other factors such as civil society activity (see Section 4.3 below) would also need to be taken into account. This suggests that these relationships merit more detailed analysis in future studies.
4.1 Positive Responses
In this section, the overall performance of each country is analysed according to scores achieved for Positive Response outcomes (i.e. Information Received and Incomplete Information outcomes combined), with secondary consideration given to compliant responses (i.e. Positive Responses plus Information Not Held). The number of attempts needed to get an answer and the amount of time between filing requests and getting a response are also used to rank countries.
Finding 14: Newer democracies dominate in terms of greater openness, taking two-thirds of the top 15 spots.
- 37 -

The countries which performed best in terms of providing Positive Responses to five or six questions, along with a full complement of six Compliant Responses, are listed in Table 16.10 Given the requirement of six Compliant Responses, by definition all of these countries had no Mute Refusals. The ranking is ordered first by Positive Responses, then by number of attempts, and finally by average time to respond.
Table 16: Top Countries by Positive Results
RTI Law Status
Number
Positive
results
Average
attempts
Average
time to
respond
Years
with
RTI Law
Number
compliant
responses
Number
Mute
Refusals
New Zealand 6 1 32 27 6 0
Georgia 6 1.33 11 10 6 0
India 6 1.83 48 5 6 0
Namibia 6 2 60 0 6 0
Armenia 5 1 13 7 6 0
Colombia 5 1 31 25 6 0
Ukraine 5 1 41 18 6 0
Montenegro 5 1.33 19 5 6 0
Serbia 5 1.33 38 6 6 0
Bulgaria 5 1.5 31 10 6 0
Croatia 5 2 39 7 6 0
Slovenia 5 2.17 31 7 6 0
South Africa 5 2.17 57 9 6 0
Costa Rica 5 2.33 58 0 6 0
Germany 5 2.83 27 4 6 0
The worst performing countries, defined as those with one or no Positive Responses, are listed in Table 17.11 These countries are ranked first by number of Positive Responses (which happened to be identical in all cases to the number of Compliant Responses), then by average number of attempts and finally by average time to respond.
10 Five other countries – Argentina, Chile, Dominican Republic, Ecuador and Guatemala – scored five positive responses but were not included because they had one non-compliant response.11 Mozambique was the only other country with just one compliant response. Its non-compliant responses included two Mute Refusals and three invalid answers in which requesters were referred to websites which did not contain the requested information.
- 38 -

Table 17: Bottom Countries by Positive Responses
RTI Law StatusPositive
responses
Compliant
responses
Average
attempts
Average
time to
respond
Years
with
RTI Law
Number
Mute
Refusals
Malaysia 1 1 2.5 79 0 5
Sierra Leone 1 1 2.67 83 0 3
Tajikistan 1 1 2.67 83 8 3
Uganda 1 1 2.83 78 4 5
Morocco 1 1 2.83 81 0 5
France 1 1 2.83 87 32 5
Yemen 0 0 1.33 90 0 5
Iraq 0 0 2.17 90 0 5
Cameroon 0 0 3 75 0 6
Algeria 0 0 3 88 0 6
Bangladesh 0 0 3 90 1 6
East Timor 0 0 3 90 0 6
Liberia 0 0 3 90 0 6
Nicaragua 0 0 3 90 3 6
Nigeria 0 0 3 90 0 5
Trinidad & Tobago 0 0 3 90 9 6
Venezuela 0 0 3 90 0 6
It may come as no surprise to democracy-watchers that the last place was shared by countries such as Liberia, Nicaragua and Venezuela. However, there are a number of surprises in the findings. These include the fact that France is among the bottom achievers, with a full five mute refusals after three attempts.12 Perhaps even more surprising is that only two of the 15 countries in the top group of countries – namely New Zealand and Germany – are Western democracies, while ten are newer democracies (mostly from East and Central Europe along with South Africa and Namibia). For further consideration of this finding, see Section 4.3 below on Old vs. Young Democracies.
12 The Transparency & Silence survey (see note 1) found a level of 51% mute refusals in France and other studies have confirmed that this is a persistent problem. France’s performance in the 6QC was nevertheless a surprisingly poor result for a country with one of the longest established access to information regimes in the world, the law having been adopted in 1978, and which in the 2010 Open Budget Index scored highly with 87 out of a possible 100 points, coming in joint 3rd place.
- 39 -

4.2 Right to Information Laws Make a Difference
Finding 15: Countries with RTI laws provide significantly more information than those without.
Of the 80 countries included in the testing exercise, 44 had right to information (RTI) laws and 36 did not. RTI countries scored more than double the number of Information Received responses (35% compared with 15%) and over 60% more positive responses (55% as against 34%). RTI countries also had half the Mute Refusals of non-RTI countries (27% compared with 53%). In terms of compliant responses, RTI countries scored 72%, versus 42% for non-RTI countries.
Figure 6: Outcomes for countries with and without RTI Laws
The countries with RTI laws also required significantly fewer request attempts to get a response, and response times were shorter, as show in Table 18.
- 40 -
RTI Law No RTI Law 0%
10%
20%
30%
40%
50%
60%
70%
80%
90%
100%
Outcomes for countries with and without RTI Laws
Invalid responseWritten refusalOral refusalMute refusalInfo not heldIncomplete InfoInfo received

Table 18: Average outcomes for countries with and without RTI Laws
RTI Law StatusNumber of
Countries
Average
attempts
Average
time to
respond
Average
positive
results
Average
compliant
responses
Average
Mute
Refusals
All countries 80 2.2 62 days 45% 58% 38%
Has an RTI law 44 2.0 53 days 55% 72% 27%
No RTI law 36 2.5 73 days 33% 42% 53%
The existence of an RTI law could be the direct cause of these significant differences between countries with and without such laws. It could also be that the primary correlation is between countries which are prone to openness and countries which are ready to adopt RTI laws in the first place.
To probe this effect, we examined whether the length of time that a right to information law has been in place also has a positive impact on levels of responsiveness and the amount of information provided to requesters.
Finding 16: The longer an RTI law has been in place, the better the response rates.
The 6 Question Campaign study found that the length of time that an RTI law has been in force makes an important positive difference in terms of openness. On four key indicators – Compliant Responses, Positive Responses, average number of attempts and average time to respond – there was a positive correlation between good performance and the longevity of the RTI law (see Table 19).
Table 19: Final Outcomes against Longevity of RTI Law
RTI Law StatusNumber of
Countries
Average
attempts
Average
time to
respond
Average
positive
results
Average
compliant
responses
Average
Mute
Refusals
All countries 80 2.2 62 days 45% 58% 38%
No RTI law 36 2.5 73 days 33% 42% 53%
RTI Law under 5 years old 11 2.4 61 days 43% 55% 43%
Law 5-10 years old 33 2.1 55 days 57% 75% 23%
Law 10 years old or more 13 1.6 44 days 62% 82% 17%
- 41 -

For countries without an RTI law, compliant responses averaged just 42%, rising even with a young law (in force for less than 5 years) to 55%, and then significantly to 75% for laws between 5 and 10 years old, and to 82% in countries with laws that are older than 10 years. Comparable figures emerge for positive responses (see Table 20). Only 1 in 3 (33%) requests received information in countries with no RTI law, rising to 43% for countries with young RTI laws, 57% for countries with laws of five to ten years old, and 62% in countries with laws in place for 10 or more years.
These findings confirm the value of a right to information law in promoting openness.
Outside of the averages, some points are worth noting. Only four of the 80 countries provided a positive response to all six questions, three with RTI laws (New Zealand, Georgia and India) and one without (Namibia). Another 16 countries provided information in response to five questions, of which 14 had right to information laws.
4.3 Old vs. Young Democracies
Of the 80 countries in this testing exercise, ten are countries which are so-called established democracies, namely Canada, France, Germany, India, Italy, New Zealand, Norway, Portugal, Spain and the United States (all but one of which, Spain, has an RTI law). One might expect to find a positive correlation between transparency and the fact that these countries are established democracies and amongst the world’s wealthiest nations. It is reasonable to assume that the public administrations in such countries would both be responsive to requests for information and would have at their fingertips the data necessary to answer the requests.
Finding 17: Established democracies as a group did not perform better than the group of all countries with RTI laws.
The findings do not support these conclusions. Among the established democracies were countries which performed very well (New Zealand, India), others which had mediocre results (Germany, United States) and still others which came in the bottom half of the results table (Canada, Norway, Italy, Portugal, France, Spain). Clearly the mere fact that a country is an established democracy or has a strong economy does not necessarily mean that it is more transparent.
- 42 -

Table 20: Performance of countries with RTI laws against Established Democracies
RTI Law StatusNumber of
Countries
Average
attempts
Average
time to
respond
Average
positive
results
Average
compliant
responses
Average
Mute
Refusals
All countries 80 2.2 61.6 days 45% 58% 38%
RTI law 44 2.0 52.7 days 55% 72% 27%
Established Democracies 10 2.0 63.2 days 52% 73% 25%
As a group, the established democracies had the same results as the average for all countries with right to information laws. On no indicator did they significantly outperform the average, although there were some minor differences, the most significant of which was that the average response time for countries with an RTI law was 52.7 days whereas for the established democracies it was 63.2 days. Overall, the established democracies failed to distinguish themselves in terms of transparency.
A possible variable which might explain this picture is the age of the right to information law which, as discussed in Section 4.2, demonstrated a strong correlation with open outcomes in this exercise. The established democracies group has a mixture of countries with long standing right to information laws (the United States 43 years, Norway 40 years, France 32 years, Canada and New Zealand 27 years), some which have younger laws (Germany 4 years), and, as noted, one country which has no RTI law (Spain).
However an analysis along these lines does not generate clear results. Indeed, among the 13 longer-standing RTI regimes (i.e. those adopted ten or more years ago), the seven so-called established democracies (United States, Norway, France, Canada, New Zealand, Italy and Portugal) did vastly less well than the other six countries (Colombia, Ukraine, Albania, Bulgaria, Georgia and Moldova) (see Table 22).
- 43 -

Table 21: Comparison Established Democracies and Other Countries with RTI laws
Country Group
Number
of
Countries
Average
attempts
Average time
to respond
Average
positive
results
Average
compliant
responses
Average
Mute
Refusals
Law 10 years old or more 13 1.6 43.5 days 62% 82% 17%
Established Democracies with laws > 10 years old
7 1.9 54.4 days 45% 69% 29%
Other countries with laws > 10 years old
6 1.3 30.8 days 81% 97% 3%
These differences can only be described as startling. The other countries achieved a rate of compliant responses that was nearly 30% higher than established democracies, and positive response rates of almost twice as high (45% compared with 81%). The six other countries only registered one Mute Refusal between them, while established democracies were batting nearly two each.
Finding 18: From among the countries with longer-standing RTI laws, the established democracies performed significantly less well as a group than newer democracies.
Remarkably, of the seven established democracies, five (71%) failed to provide any information in response to four or more of the six questions (the other two being New Zealand, with six positive responses, and United States, with four). Not one of the other countries with longer-standing right to information laws did so poorly. Indeed, all of them provided information in response to at least four requests. Established democracies even did poorly compared to the group of countries with RTI law of five years or more, from among which only 12 of 33 countries (36%) failed to provide information in response to four or more questions, less than one half of the rate for established democracies.
One possible explanation for these significant country differences, which would merit further assessment, is the quality of the RTI law. Although many RTI laws around the world contain the same basic principles, there are differences.
- 44 -

For example, the laws of Slovenia and Chile, good performers in this exercise, are stronger than the laws of France and Italy for a number of reasons including that they have strong oversight mechanisms. The laws of Germany and Serbia are relatively young laws but again have stronger oversight mechanisms than the laws of Norway or the United States.
Another source which might explain at least some of the findings is to review the level of civil society activity to promote the right to information in the better-performing countries. The Transparency and Silence survey found that in response to a total of 140 requests submitted in 14 countries, some new democracies such as Armenia, Bulgaria, Mexico and Romania performed significantly better than established democracies such as France and Spain. The report concludes that there is a correlation between the level of civil society activity, including ongoing campaigns to promote the adoption and implementation of RTI laws, and performance in those countries.13
Consistent with this, when the Transparency and Silence study was carried out in 2004 (the year of the actual monitoring), Chile did not have a right to information law and performed badly, with a level of Mute Refusals of 69%. In the intervening time, civil society has been galvanised and Chile has both adopted a law and recognised RTI in its constitution. This high level of civil society activity may help explain the improved performance in Chile in the 6 Question Campaign, where it provided positive answers in response to 5 out of the 6 requests.
Other studies have identified other factors – notably the attitude of political elites towards openness but also the culture which has emerged around implementation of the RTI law – as relevant to performance in terms of openness.14 To reach definitive conclusions about these issues clearly requires more in-depth investigation using a more sophisticated methodology, but it is noted here that these are areas which merit further research.
13 Note 1.14 See, for example, Snell, Rick (2005): ‘Using Comparative Studies to Improve Freedom of Information Analysis: Insights from Australia, Canada and New Zealand’, Presented at 6th National and 2nd International Congress on the Right to Information, Mexico 8-11 Nov. 2005 (Mexico City: National University of Mexico).
- 45 -

4.4 Regional Analysis
The testing exercise revealed significant regional variations in terms of the results. With the exception of two regions with only two or three countries each in the survey – North America and Oceania15 – there was a reasonable sampling of countries from each region (four from MENA, seven from South America, seven from Central America, 12 from Asia, 21 from Africa and 24 from Europe).
In terms of compliant refusals, North America did the best, at 95%, followed by Europe (80%) and then Oceania (67%) (see Table 23). In terms of positive responses, Oceania came out best (67%), based largely on New Zealand’s strong performance, with South America coming second (64%) and Europe, Central America and North America all scoring 50% or better.
Table 22: Percentage of Different Responses by Region
Region
Information
received
Incomplete
info
Info not
held
Total
Compliant
Mute
refusal RTI Laws
North America 17% 39% 39% 95% 6% 100%
Europe 41% 15% 24% 80% 20% 96%
Oceania 58% 9% 0% 67% 25% 50%
South America 24% 40% 2% 66% 33% 57%
Central America 24% 29% 2% 53% 43% 71%
Asia 24% 14% 17% 55% 42% 50%
Africa 16% 17% 5% 38% 56% 19%
MENA 4% 0% 0% 4% 88% 0%
At the other end of the spectrum, the MENA region was the worst performer by a clear margin in every category, registering just 4% positive responses and 88% Mute Refusals. It was followed by Africa, the second worst performer in every category, albeit much better than MENA with 33% positive responses and 56% Mute Refusals.
Finding 19: Regions with a greater prevalence of RTI laws also performed better in terms of compliant responses.
15 There were only three countries in North America, as defined by the Study (Canada, Mexico, and the United States) and just two from Oceania (New Zealand and Papua New Guinea).
- 46 -

These results correlate strongly with the overall positive relationship between RTI laws and levels of transparency. In this testing exercise, regions with higher RTI law densities generally scoring better. Indeed, there was an almost perfect correlation between percentage of RTI laws and the rates of compliant responses (with only Central America falling out of place). This is consistent with the finding noted in Section 4.2 above that countries with RTI laws perform better than those without.
One notable statistic is that the rates of Information Not Held responses substantially higher in North America (75% higher than the next highest region, Europe). Part of the explanation for this may be that both North American countries are federal States, which is corroborated by the fact that three of the five ‘not held’ responses from this region were in relation to the maternal heath questions, which tended to be more sensitive to federalism.
The rates of Information Not Held responses were extremely low (6% or less) in all other regions except Europe and Asia. This may to some extent be explained by higher rates of Mute Refusals in those other regions. This is in line with the finding that in countries with RTI laws, officials are more likely to respond, even if it is with an Information Not Held outcome, than to simply not bother to respond to the request, resulting in a Mute Refusal.
4.5 Analysis by Donor and Recipient Countries
Out of the 80 countries assessed here, twelve were identified as donor countries, namely Canada, the United States, New Zealand and nine European countries (Bulgaria, Croatia, France, Germany, Italy, Norway, Portugal, Slovenia and Spain). The other 68 countries were all considered to be recipient countries.
Table 23: Comparison Donor and Recipient countries
Country Group
Number
of
Countries
Average
attempts
Average time
to respond
Average
positive
results
Average
compliant
responses
Average
Mute
Refusals
All countries 80 2.2 62 days 45% 58% 38%
Donors 12 2 49 56% 78% 21%
Recipients 68 2.3 64 44% 55% 41%
Donors outperformed recipients (see Table 25), although perhaps not by as large a margin as some might have expected. In terms of positive responses, donors scored
- 47 -

56% compared with a recipient score of 44%, over one quarter as much again. Similarly, compliant responses were 78% for donor countries compared with 55% for recipient countries, nearly half as much again. On the other hand, donors had half the rate of Mute Refusals (21% as against 41%). One possible explanation for these differences is the fact that donors are by definition richer States, and so might be expected to have better record management systems in place.
There is a significant difference in the responses to the aid-related questions, Questions 3 and 4 respectively.
Table 24: Comparison Donor and Recipient countries for Questions 3 and 4
Country Group
Information
received
Incomplete
info
Info not
held
Total
Compliant
Mute
refusal
Other
(invalid)
Donor Q3 33% 50% 0% 83% 17% 0%
Recipient Q3 16% 29% 12% 57% 41% 2%
Donor Q4 33% 25% 17% 75% 25% 0%
Recipient Q4 10% 32% 16% 59% 40% 2%
For Question 3, on the amount of aid funds that had been disbursed, donor countries provided far more positive responses, namely 83% as against 45% for recipient countries. Significantly, for the donor countries, there was not one Information Not Held response to this question, and there was a relatively low level of Mute Refusals, at 17%. This is a generally positive result for those working on donor transparency although it should be noted that a full 50% of the responses in donor countries were incomplete, indicating that more effort needs to be made to provide full data on aid spending.
Finding 20: The positive response rate among donors was significantly (43%) higher for aid provided in past years than for aid committed, although in both cases Incomplete Information formed an important part of the overall positive response rate.
- 48 -

The results were less impressive for Question 4, on aid funds committed, with a total of 58% positive answers for donor countries compared to 42% for recipients, although the rate of Information Not Held responses among donors, at 17%, meant that overall, donor compliance on this question was similar to the rate for Question 3. In recipient countries, Incomplete Information made up over three quarters of the positive responses.
Figure 7: Comparison Donor and Recipient countries for Questions 3 and 4
- 49 -
Donor Q3 Recipient Q3 Donor Q4 Recipient Q40%
10%
20%
30%
40%
50%
60%
70%
80%
90%
100%
OtherMute refusalInfo not heldIncomplete infoInformation received

5.Conclusion
There is an increasingly robust body of literature on the right to information and access to budget information, on its main attributes, on the growth in national laws giving effect to this right, and on their strengths and weaknesses. There have, however, been relatively few comparative testing exercises based on making similar requests for information in countries around the world.
This Report, and the comparative testing exercise upon which it is based, therefore represents an important contribution to our understanding of access to budget information. The comparative testing was conducted with rigorous controls designed to ensure maximum comparability of results across countries. As a result, it has generated a wealth of solid empirical data about how, in practice, access to budget information works in countries around the world.
Perhaps the most important single conclusion to be drawn from the analysis is that, with very few exceptions, countries failed, within the scope of this concrete testing exercise, to respect minimum guarantees of the right to information. Overall, 42% of the responses were not compliant with the right to information, even though Incomplete Information answers were generously deemed to be compliant. Some 55 of the 80 countries responded to at least one question with a Mute Refusal, perhaps the most egregious manner of breaching the right to information. Only nine countries managed to respond to all six requests in an average of less than 30 days, and only three managed to meet this timeline for each of the six requests.
Beyond these formal breaches, it is notable that a complete response was provided to only one in four requests (26%), while less than one half of all requests elicited any information at all (45% of requests). Given that the aim of making requests is to obtain information, this is disappointing, to say the least. No doubt there were genuine cases of public bodies not holding the information requested, but it is clear that far more effort is needed on the part of officials to respect the right to information.
This conclusion is even more poignant given the subject matter of the requests, namely budget information. Openness is important for lots of reasons, and openness around budget information lies at the heart of most of these rationales for transparency. Budget transparency is, among other things, essential to protect participatory democracy, to combat corruption and to foster sound development.
- 50 -

The information which was the subject of this testing exercise all related to matters of great public importance. Furthermore, it was all uncontroversial in the sense of not being sensitive from a secrecy point of view. Finally, officials were given three separate chances to respond, as requesters made three attempts to obtain the information (and pressed for responses with phone calls, e-mails and even visits between these three main attempts). In light of these factors, the results of this exercise are sobering indeed, and should serve to remind openness campaigners once again that true transparency is a goal which, though certainly worth fighting for, requires constant struggle.
- 51 -