pedagoggles.files.wordpress.com · web viewfor example, if the colour value is between 2 and 4...
TRANSCRIPT
AQA A-Level Biology
Required Practical Methods & Notes
<school logo removed>
Name:
Class:
Biology Teacher:

A-level Biology required practical No. 1
Student Sheet
Investigation into the effect of a named variable on the rate of an enzyme-controlled reaction
The effect of temperature on the rate of the reaction catalysed by trypsin
Casein is a protein found in milk. Trypsin is an enzyme that digests casein. When trypsin is added to a dilute solution of milk powder, the casein is digested and the solution goes clear.
Method
You are provided with the following:
0.5% trypsin solution 3% solution of milk powder pH7 buffer solution a large beaker to use as a water bath test tubes test tube rack stop watch marker pen pipettes or syringes thermometer.
You are required to find the rate of reaction at five different temperatures. Your teacher will tell you whether you are going to investigate all the temperatures yourself or whether you will get some results from other students in your class.
You should read these instructions carefully before you start work.
1. Using a marker pen write an ‘X’ on the glass halfway down one side of each of three test tubes.2. Add 10 cm3 of the solution of milk powder to each of these three test tubes.3. Add 2 cm3 of trypsin solution to 2 cm3 of pH 7 buffer in another set of three test tubes.4. Stand the three test tubes containing the solution of milk powder and the three test tubes
containing trypsin and buffer in a water bath at 20 oC.5. Leave all six tubes in the water bath for 10 minutes.6. Add the trypsin and buffer solution from one test tube to the solution of milk powder in another
test tube and mix thoroughly.7. Put the test tube back into the water bath.8. Repeat steps 6 and 7 using the other test tubes you set up.9. Time how long it takes for the milk to go clear. Do this by measuring the time taken to first see
the ‘X’ through the solution.10. Record the time for each of the three experiments.11. Using the same method, find out how long it takes the trypsin to digest the protein in the
solution of milk powder at 30 oC, 40 oC, 50 oC, 60 oC. 12. Record your data in a suitable table.13. Process your data and draw a graph of your processed data.

Notes on this practical:

Notes on this practical:

A-level Biology required practical No. 2
Student Sheet
Preparation of stained squashes of cells from plant root tips; set up and use of and optical microscope to identify the stages of mitosis in these stained squashes and calculation of a mitotic index
Root tip squash using onion root meristem tissue
You are provided with the following:
100 ml beaker hydrochloric acid (5 mol dm-3) microscope slide and cover slip toluidene blue stain filter paper mounted needle scalpel distilled water watch glass forceps root tip of onion or garlic microscope and light source.
You are required to prepare a microscope slide of the meristem tissue from an onion root. You will add a stain to the material which allows you to see the chromosomes. You will look at the slide under the microscope to identify any cells showing stages of mitosis. You will then calculate the mitotic index.
Safety
Hydrochloric acid (5 mol dm-3) is corrosive and should be handled with caution. Eye protection must be worn.
The beaker must be stood on a bench mat. Do not carry the beaker with acid in it.
N.B. Do not leave root tips for investigation lying about on the bench top prior to staining. Cut your root tip immediately before you put it into the acid. This will stop any reactions and hopefully some cells will be in a stage of division.
You should read these instructions carefully before you start work.
Making your slide
1. Stand the beaker on a bench mat before adding approx. 10ml of hydrochloric acid (5 mol dm-3)2. Place about 2 cm of root tip in the acid and leave for 15 minutes.3. Set up your microscope while you are waiting.4. Rinse the root tip in distilled water in the watch glass.5. Cut off the root tip (1mm) and place on a microscope slide.6. Cover the section with toluidene blue stain and macerate with the mounted needle to separate
the cells.7. Continue to macerate until the tissue is well broken and the cells are stained dark blue.8. Add a cover slip and with gentle finger pressure ‘spread’ the material and blot at the same time
by using a folded filter paper between finger and slide.
9. Look carefully at all slides for cells undergoing mitosis. Chromosomes should stain dark blue. Repeat for several fields of view.
10. Record your data in a suitable table.11. Calculate the mitotic index.
Notes on this practical:

Notes on this practical:

A-level Biology required practical No. 3
Student Sheet
Production of a dilution series of a solute to produce a calibration curve with which to identify the water potential of plant tissue
Determining the water potential of potato tuber cells
You are provided with the following:
large potato tuber potato chip cutter 1 mol dm-3 sucrose solution distilled water boiling tube rack six boiling tubes, marker pen thermometer 10 cm3 graduated pipette and pipette filler White tile scalpel or small kitchen knife ruler paper towels timer digital balance forceps.
You should read these instructions carefully before you start work.
Preparing the dilution series
1. Label six boiling tubes 0, 0.2, 0.4, 0.6, 0.8 and 1.0 mol dm-3 sucrose.2. Use the 1.0 mol dm-3 sucrose solution and water to make up 20 cm3 of sucrose solution of each
of the following concentrations:
0.2 mol dm-3
0.4 mol dm-3
0.6 mol dm-3
0.8 mol dm-3
1.0 mol dm-3
Complete Table 1 to show the volumes of 1.0 mol dm-3 sucrose solution and water that you used to make up each concentration.
3. Stand the boiling tubes containing the sucrose solutions in a water bath set at 30 oC. Use a thermometer to check the temperatures in all tubes reaches 30 oC.
4. Using the chipper, cut six chips from your potato tuber. Make sure you remove any peel on the potatoes. Use a ruler, scalpel and tile to cut all of the chips to the same length. Blot the potato chips dry with a paper towel, i.e. roll each chip until it no longer wets the paper towel and dab each end until dry. Do not squeeze the chips. Put each potato chip onto a clean square of paper towel which you have numbered in the same way as the boiling tubes.
5. Weigh each potato chip. Record these initial masses in a suitable table.6. At the water bath, set the stop clock to zero. Quickly transfer each potato chip from its square
of paper towel to its own boiling tube with the same number. 7. After precisely 20 minutes, remove the chips from the boiling tubes. Blot the chips dry, as
before. Then reweigh them. Record these final masses in your table. 8. Calculate the change in mass and then calculate the percentage change in mass.

9. Plot a graph of your processed data and use this to determine the concentration of sucrose which is which has the same water potential as the potato tuber cells.
Table 1
Concentration of sucrose solution/mol
dm-30 0.2 0.4 0.6 0.8 1.0
Volume of 1.0 mol dm-3 sucrose solution
/ cm30 20
Volume of water/cm3
20 0

Notes on this practical:

Notes on this practical:

A-level Biology required practical No. 4
Student Sheet
Investigation into the effect of a named variable on the permeability of cell-surface membranes
The effect of alcohol concentration on the leakage of pigment from beetroot cells
Introduction
Beetroot contains high concentrations of betalin. This is a purple pigment found inside the vacuoles of the cells. The pigment cannot move across undamaged plasma membranes. You will investigate the effect of alcohol concentration on the amount of pigment leaking through beetroot plasma membranes.
In Part 1 of the investigation you will produce a set of standards. In Part 2 you will use these standards to compare the colour of the solutions obtained when beetroot discs have been soaked in different concentrations of alcohol.
Method
You are provided with:
stock solution of beetroot extract five concentrations of alcohol labelled 100%, 80%, 60%, 40%, 20% discs cut from a beetroot and rinsed thoroughly in water graduated pipettes or syringes test tubes bungs to fit some of the test tubes thermometer large beaker to use as a water bath stop watch test tube rack small beakers permanent marker pen water.
You should read these instructions carefully before you start work.
Part 1 Making the colour standards
1. Use the extract and water to prepare a series of six test tubes containing 5 cm3 of different concentrations of extract. The concentrations should be equally spaced and cover a range from pure water (0%) to pure extract (100%). These will be your colour standards.
2. Label these standards 0, 2, 4, 6, 8, 10.3. Complete Table 1 to show the concentration of extract in each tube.4. Complete Table 1 to show how you made the colour standards in Part 1 of the investigation.

Table 1
Volume of beetrootextract/cm3
Volume of water /cm3
Concentration of extract/%
0 100
Absorbance reading from colorimeter
Part 2 The Investigation
5. Set up a water bath at 30 oC.6. With a second set of test tubes add 2 cm3 of 100% alcohol to a test tube and put a bung in the
tube.7. Label the tube with the alcohol concentration.8. Repeat steps 5 and 6 with alcohol concentrations of 80%, 60%, 40% and 20%.9. Put the tubes of alcohol in the water bath until temperature of the alcohol reaches 30 oC.10. Blot 10 discs of beetroot with a paper towel to remove excess water.11. Gently put two discs of beetroot in each of the five tubes. Replace the bungs as soon as
possible after doing so.12. Leave the tubes in the water bath for five minutes. Shake the tubes gently once every minute.
Then remove the tubes from the water bath.13. Immediately pour each solution into a clean test tube, being careful to label the tubes
appropriately. Throw the beetroot discs away.14. Compare each of your solutions with the colour standards you made in Part 1. Note which
standard has the same colour as each of your solutions. If the colour of the solution falls between two of the values you can use the intermediate number. For example, if the colour value is between 2 and 4 record the colour value 3.
15. Record your results in a suitable table.
Notes on this practical:

Notes on this practical:
A-level Biology required practical No. 5
Student Sheet
Dissection of animal or plant gas exchange or mass transport system or of organ within such a system
Heart Dissection
You are provided with the following:
a sheep’s heart dissecting tray and board dissecting instruments labels and pins.
You should read these instructions carefully before you start work.
1. Before you cut the heart examine its external features.
Identify the coronary arteries Run water into the top of the heart and see if you can see the valves in the aorta and
pulmonary arteries close. Squeeze the heart gently and these valves should open and the water will come out.
2. Cut down each side of the heart to open up the left atrium and left ventricle and the right atrium and right ventricle.
Look for the tendinous cords holding the atrio-ventricular valves, and lift the weight of the heart by holding one of these cords over a dissecting needle.
Look how thin the atrio-ventricular valves are. Examine the thickness of the walls of the ventricles. Which side is thicker, and why? Look at the walls of the atria, they are much thinner, can you think why? Push the handle of the dissecting needle up behind the atrio-ventricular valves. You should
notice that the aorta and pulmonary arteries cross over.
3. Make some little flags from pins and sticky labels and label the parts of the heart that you can identify. Make sure they are legible and visible as you look down on your dissection.
Ask your tutor to check your labeling and take a photograph so you can include it in your notes.
Packing away:
Remove all pins and discard labels. Place pins and dissecting instruments in the beaker with disinfectant. Place the heart in the yellow disposal bag on the trolley.
Use the disinfectant spray to clean the dissecting board and bench, using paper towels to dry them. Dispose of the towels in the yellow disposal bag along with your plastic gloves.
Notes on this practical:

A-level Biology required practical No. 6

Student Sheet
Use of aseptic techniques to investigate the effect of antimicrobial substances on microbial growth
Aseptic technique producing bacterial plates and use of mast ring of antibiotics
Method
You are provided with the following:
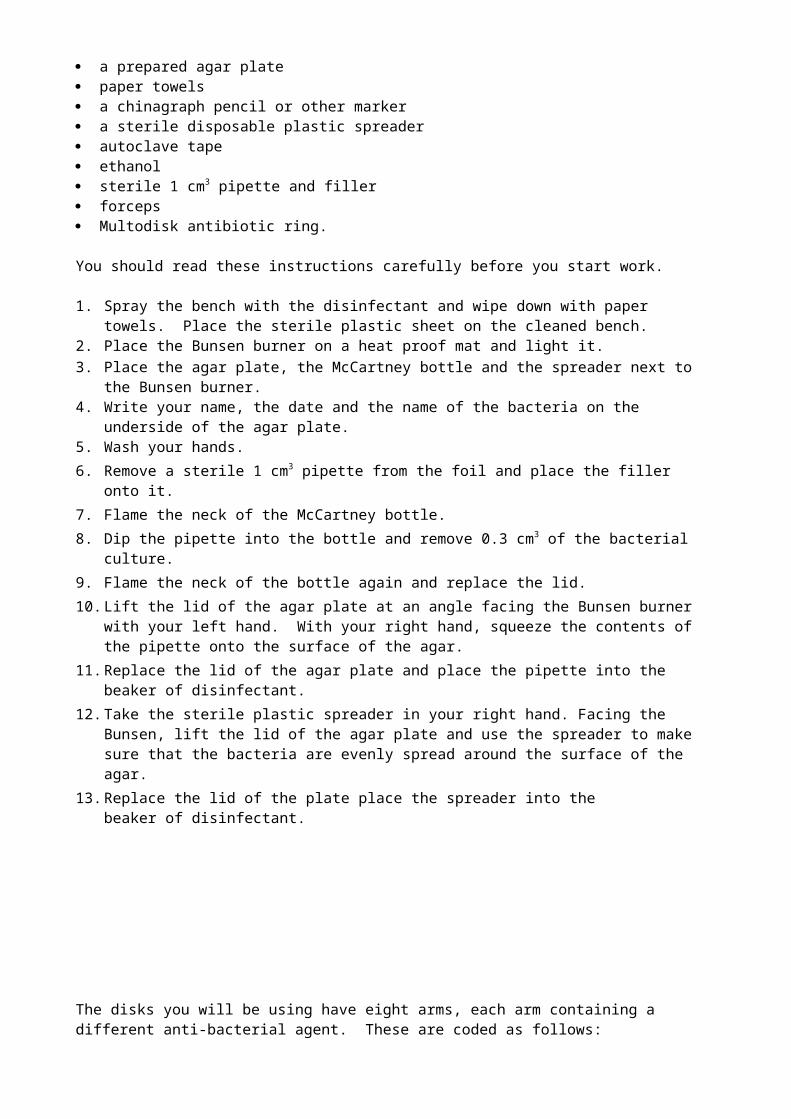
plastic sheet to work on. McCartney bottle containing Bacillus megaterium bacteria Bunsen burner a beaker containing disinfectant disinfectant spray a prepared agar plate paper towels a chinagraph pencil or other marker a sterile disposable plastic spreader autoclave tape ethanol sterile 1 cm3 pipette and filler forceps Multodisk antibiotic ring.
You should read these instructions carefully before you start work.
1. Spray the bench with the disinfectant and wipe down with paper towels. Place the sterile plastic sheet on the cleaned bench.
2. Place the Bunsen burner on a heat proof mat and light it.3. Place the agar plate, the McCartney bottle and the spreader next to the Bunsen burner.4. Write your name, the date and the name of the bacteria on the underside of the agar plate.5. Wash your hands.6. Remove a sterile 1 cm3 pipette from the foil and place the filler onto it.7. Flame the neck of the McCartney bottle.8. Dip the pipette into the bottle and remove 0.3 cm3 of the bacterial culture.9. Flame the neck of the bottle again and replace the lid. 10. Lift the lid of the agar plate at an angle facing the Bunsen burner with your left hand. With
your right hand, squeeze the contents of the pipette onto the surface of the agar.11. Replace the lid of the agar plate and place the pipette into the beaker of disinfectant.12. Take the sterile plastic spreader in your right hand. Facing the Bunsen, lift the lid of the agar
plate and use the spreader to make sure that the bacteria are evenly spread around the surface of the agar.
13. Replace the lid of the plate place the spreader into the beaker of disinfectant.

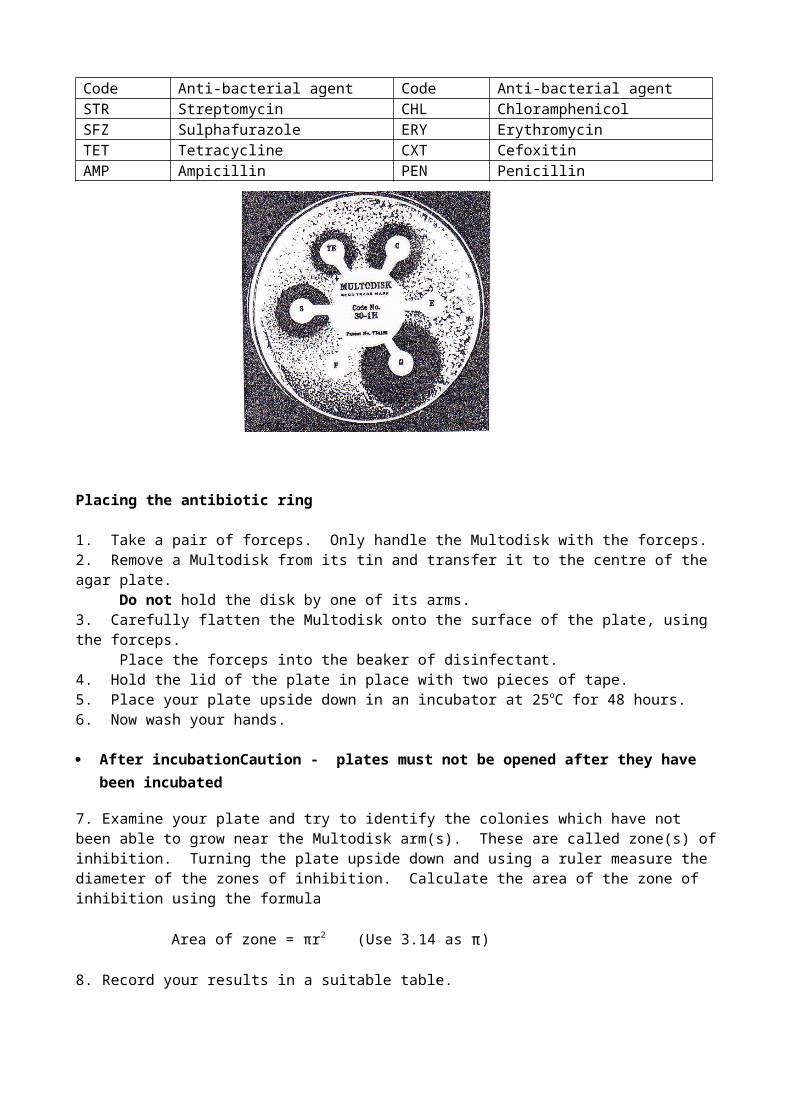
The disks you will be using have eight arms, each arm containing a different anti-bacterial agent. These are coded as follows:
Code Anti-bacterial agent Code Anti-bacterial agentSTR Streptomycin CHL ChloramphenicolSFZ Sulphafurazole ERY ErythromycinTET Tetracycline CXT CefoxitinAMP Ampicillin PEN Penicillin
Placing the antibiotic ring
1. Take a pair of forceps. Only handle the Multodisk with the forceps.2. Remove a Multodisk from its tin and transfer it to the centre of the agar plate. Do not hold the disk by one of its arms. 3. Carefully flatten the Multodisk onto the surface of the plate, using the forceps. Place the forceps into the beaker of disinfectant.4. Hold the lid of the plate in place with two pieces of tape.5. Place your plate upside down in an incubator at 25oC for 48 hours.6. Now wash your hands.
After incubationCaution - plates must not be opened after they have been incubated
7. Examine your plate and try to identify the colonies which have not been able to grow near the Multodisk arm(s). These are called zone(s) of inhibition. Turning the plate upside down and using a ruler measure the diameter of the zones of inhibition. Calculate the area of the zone of inhibition using the formula
Area of zone = πr2 (Use 3.14 as π)
8. Record your results in a suitable table.

Notes on this practical:

Notes on this practical:
A-level Biology required practical No. 7
Student Sheet
Use of chromatography to investigate the pigments isolated from leaves of different plants eg leaves from shade-tolerant and shade intolerant plants or leaves of different colours
An Investigation of pigments present in leaves
Introduction
In plants, chlorophyll is the main pigment that absorbs light energy during photosynthesis. Most plants have other photosynthetic pigments as well and these are not green. You will be using a technique called chromatography to separate chlorophyll and other pigments from two different leaves, A and B.
Method
You are provided with the following:
boiling-tube rack two boiling tubes with bungs small glass measuring cylinder solvent chromatography paper glass rod two leaves, A and B cork borer tile on which to use cork borer ruler pencil drawing pins marker pen sticky tape.
Safety
Wear eye protection and work in a well-ventilated room or fume cupboard.
You should read these instructions carefully before you start work.
1. Set up two boiling tubes at the start of the investigation. Add 3 cm3 of solvent to each of the two boiling tubes. Put a bung in the top of each tube and stand them upright in a rack. Label the tubes A and B.
2. Take a piece of chromatography paper that fits into the boiling tube, as shown in the diagram. Rule a pencil line 2 cm from the bottom of the filter paper. This line is called the origin. Write leaf A at the top of the chromatography paper in pencil.
3. Cut a disc from leaf A with a cork borer. Try to avoid the veins and midrib of the leaf when you do this.
4. Place the leaf disc on the chromatography paper at the centre of the line marking the origin. Crush the disc into the paper with the end of a glass rod. The crushed leaf disc should leave a stain on the chromatography paper.
5. Pin the chromatography paper to the bung with a drawing pin, and then put the chromatography paper into the tube labelled A as shown in Figure 1. Make sure the end of the
chromatography paper is in the solvent and that the solvent does not come above the origin. Put the tube carefully back into the rack and do not move it again.
Figure 1
6. Let the solvent run up the chromatography paper until it almost reaches the top of the paper. Remove the chromatography paper from the tube and immediately draw a pencil line to show how far the solvent moved up the paper. This line marks the solvent front.
7. Replace the bung in the tube.8. The filter paper with its coloured spots is called a chromatogram. Let the chromatogram dry.
Using a pencil, draw round each coloured spot on the chromatogram.9. Repeat step 2 with the second piece of paper but write B at the top of the chromatography
paper.10. Repeat steps 3 – 8 with leaf B.
Calculate the Rf value for each of the pigment spots on each chromatogram.
Rf value = Distance moved by pigment from origin to centre of pigment spot Distance from origin to solvent front

Notes on this practical:

Notes on this practical:
A-level Biology required practical No. 8
Student Sheet
Investigation into the effect of a named factor on the rate of dehydrogenase activity in extracts of chloroplasts
The effect of ammonium hydroxide on the time taken for chloroplasts to decolourise DCPIP
In this investigation you will use a chloroplast suspension and a blue dye called DCPIP to monitor the rate of dehydrogenase activity. DCPIP goes from blue to colourless when it accepts electrons released by the chlorophyll.
Method
You are provided with the following:
spinach leaves access to a blender measuring cylinder muslin ( or material for filtering) filter funnel 3 beakers ice isolation medium (cold) DCPIP solution (cold) distilled water (cold) ammonium hydroxide solution (cold) test tubes test tube rack syringes (1cm3 and 5 cm3 ) piece of aluminium foil lamp marker pen timer.
You should read these instructions carefully before you start work.
1. Put about 50 cm3 of isolation medium into a beaker. 2. Tear 8 spinach leaves into small pieces and put the pieces into the isolation medium in the
beaker. Do not put pieces of the midrib or the leaf stalk into the beaker.3. Half fill a large beaker with ice and place a small beaker on top of the ice.4. Put 3 layers of muslin over the top of the filter funnel and wet it with the isolation medium. Rest
the filter funnel in the small beaker on the ice.5. Pour the spinach and isolation medium into the blender and blend for about 15 seconds. Pour
the blended mixture back into the beaker.6. Pour a little of your blended mixture through the muslin in the filter funnel. Carefully fold and
squeeze the muslin to assist the filtering process. Repeat until most of the blended mixture has been filtered. Label this filtrate which is in the small beaker on ice as ‘chloroplast suspension’.
7. Label five test tubes A, B, C, X and Y. Stand these five tubes in the ice in the large beaker. Position the lamp about 10 cm from the beaker so that all tubes are illuminated. Turn on the lamp.

8. Set up tubes A and B as followsTube APut 5 cm3 DCPIP solution + 1 cm3 water + 1 cm3 chloroplast suspension in the tube. Immediately wrap the tube completely in aluminium foil to exclude light.Tube BPut 5 cm3 DCPIP solution + 1 cm3 water + 1 cm3 isolation medium in the tube. Tubes A and B are control experiments. Leave both tubes until the end of your investigation.
9. Set up tube C as followsTube CPut 6 cm3 water + 1 cm3 chloroplast suspension in the tube. Tube C is for you to use as a standard to help you to determine when any colour change is complete.
10. Set up tube X as followsTube XPut 5 cm3 DCPIP solution + 1 cm3 water in the tube. Add 1 cm3 chloroplast suspension to tube X, quickly mix the contents and start the timer. Record in seconds how long it takes for the contents of tube X to change colour from blue-green to green. This is when all signs of blue have disappeared. Use tube C to help you determine when the colour change is complete.
11. Repeat step 10 four more times. 12. Set up tube Y as follows.
Tube YPut 5 cm3 DCPIP solution + 1 cm3 ammonium hydroxide in the tube. Add 1 cm3 chloroplast suspension to tube Y, quickly mix the contents and start the timer. Record in seconds how long it takes for the contents of tube Y to change colour from blue-green to green. This is when all signs of blue have disappeared. Use tube C to help you determine when the colour change is complete. However if this has not taken place within 300 seconds (5 minutes), record the colour at this point.
13. Repeat step 12 four more times.14. Record your data in a suitable table.15. At the end of your investigation, record the colour of the mixtures in tubes A and B.
Notes on this practical:

Notes on this practical:

A-level Biology required practical No. 9
Student Sheet

Investigation into the effect of a named variable on the rate of respiration of cultures of
An investigation of the effect of temperature on respiration in yeast
Yeast is a single- celled fungus. It can respire aerobically and anaerobically. During aerobic respiration, the transport of electrons is linked to the synthesis of ATP. In this investigation these electrons will be accepted by a substance called methylene blue. When methylene blue accepts electrons, it changes from blue to colourless.
Method
You are provided with the following:
yeast and glucose mixture methylene blue test tubes test-tube rack beaker to act as water bath a way of changing the temperature of the water bath graduated pipettes or syringes marker pen thermometer timer.
You should read these instructions carefully before you start your investigation.
1. Use the beaker to set up a water bath at 35 oC.2. Label five test tubes 1 to 5.3. Shake the yeast and glucose mixture.4. Add 2 cm3 of the yeast and glucose mixture to all five tubes.5. Place all five tubes in the water bath and leave them until the contents reach 35 oC. Make
sure the water bath stays at 35 oC6. Add 2 cm3 methylene blue to test tube 1.7. Immediately shake this tube for 10 seconds and replace the tube in the water bath. Note the
time and do not shake this tube again.8. Record how long it takes for the blue colour to disappear in the tube.9. Repeat steps 6 to 8 for the other four tubes.10. Your teacher will tell you which other temperatures to use. Repeat steps 1 to 9 at each
temperature.
Notes on this practical:

Notes on this practical:

A-level Biology required practical No. 10
Student Sheet

Investigation into the effect of an environmental variable on the movement of an animal using either a choice chamber or a maze
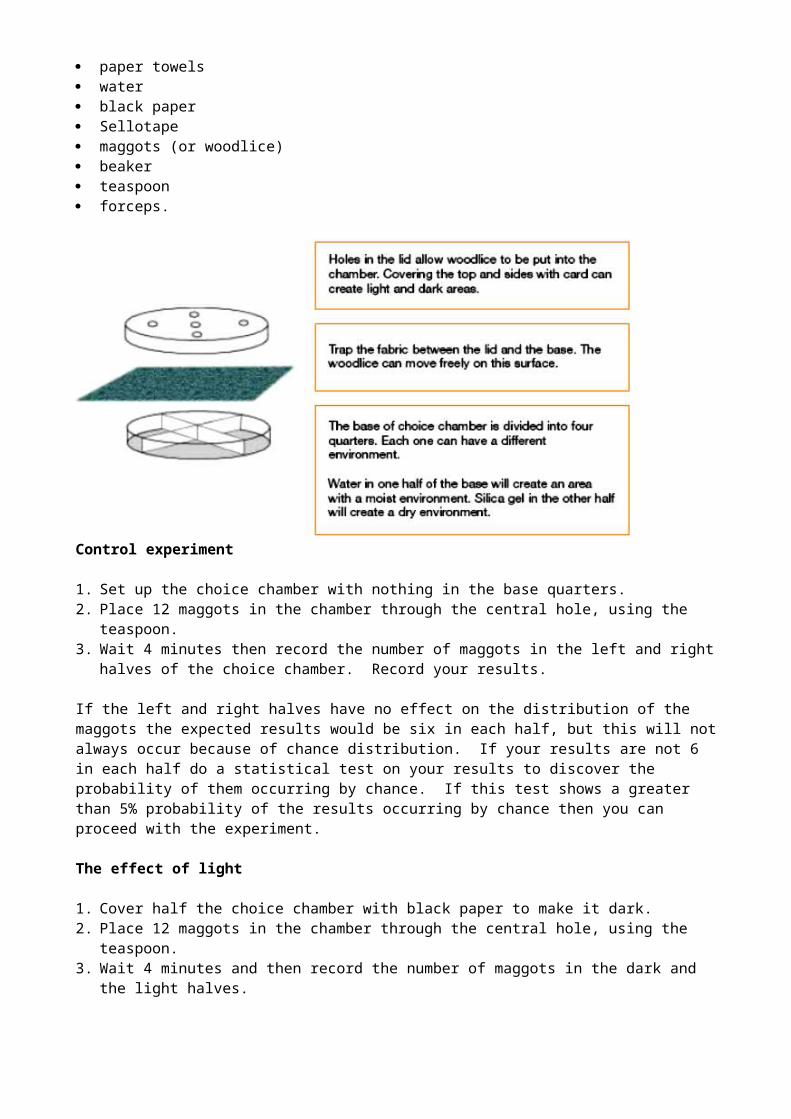
Using choice chambers to investigate responses in invertebrates to light/dark and humid/dry conditions
Method
You are provided with the following:
a choice chamber with nylon mesh fabric silica gel humidity test strips (Cobalt chloride strips which have been dried – blue when dry and pink
when moist) paper towels water black paper Sellotape maggots (or woodlice) beaker teaspoon forceps.
Control experiment
1. Set up the choice chamber with nothing in the base quarters.2. Place 12 maggots in the chamber through the central hole, using the teaspoon.3. Wait 4 minutes then record the number of maggots in the left and right halves of the choice
chamber. Record your results.
If the left and right halves have no effect on the distribution of the maggots the expected results would be six in each half, but this will not always occur because of chance distribution. If your results are not 6 in each half do a statistical test on your results to discover the probability of them occurring by chance. If this test shows a greater than 5% probability of the results occurring by chance then you can proceed with the experiment.
The effect of light
1. Cover half the choice chamber with black paper to make it dark.2. Place 12 maggots in the chamber through the central hole, using the teaspoon.

3. Wait 4 minutes and then record the number of maggots in the dark and the light halves.
If light has no effect on the distribution of maggots the expected results would be six in each half. Now do a statistical test on your results to find the probability of them occurring by chance.
The effect of humidity
1. Place damp paper towel in one half of the choice chamber and silica gel in the other. Use the humidity test strips to ensure that a humidity gradient exists in the chamber before adding the maggots. Use the forceps to place the humidity test strip.
2. Place 12 maggots in the chamber through the central hole.3. Wait 4 minutes and then record the number of maggots in the humid and the dry halves.
The effect of light and humidity
In reality living organisms do not have simple choices between one pair of contrasting environmental factors. If you have time do a final experiment with the choice between dark and dry, dark and humid, light and dry, light and humid. Again test the probability of your results occurring by chance with a statistical test.
Alternative practical using a maze
Turning behaviour in maggots
You are provided with the following:
a maze printed on card scissors glue maggots cotton wool buds a plastic teaspoon.
You should read these instructions carefully before you start work.
1. Cut out pieces A, B and C from the card by cutting along all the solid lines.2. Fold along the dashed and dotted lines, keeping dashes on the inside and dots on the outside.3. Glue the tabs to form the maze shown in Figure 1.

4. Cut out the barrier (piece D) and place it at the position shown in Figure 2.
Figure 2
5. Place a maggot at point X using the plastic teaspoon.
6. Record in a table whether the maggot turns left or right when it reaches the junction at Y.7. Remove the maggot from the maze.8. Wipe the inside of the maze with a cotton wool bud.9. Repeat steps 5 to 8 until you have results for 10 maggots.10. If a maggot stops moving, remove it from the maze and carry out another trial.
This experiment should give equal numbers turning left and right. This section of the maze could be used to investigate the effect of variables such as light by covering one side of the maze with black paper and then the other.
Turn alternation in maggots
Many animals show behaviour called turn alternation. This means if the animal is forced to turn inone direction it is more likely to turn in the opposite direction next time it has a choice. The maze can be uses to allow you to investigate whether maggots show turn alternation.
1. Use the maze you made in Task 1, with barrier D removed.
2. Place a maggot at point Z in the maze.3. Record whether the maggot turns left or right when it reaches the junction at Y.4. Repeat steps 2 and 3 until another 9 times.5. Record your data in a suitable table.
Risk assessment
Risk assessment and risk management are the responsibility of the centre.
Trialling
The practical should be trialled before use with students.
Additional notes
The Bluebottle adult flies hatching from the maggots are classed as statutory nuisance animals by DEFRA (listed in document “Nuisance Insects and Climate Change” March 2009). The maggots should therefore be killed (e.g. by placing in a freezer for a week) before wrapping securely and placing in a bin collected directly by refuse collectors. Animals that have been used in experimental work are regarded as animal by-products and as such should not enter the food chain. For disposal, the flies should be killed as described above, and placed in the normal refuse.
See Hazcard 25 for Cobalt chloride papers, and found in self-indicating silica gel, causes skin sensitisation. The chemical is also potentially carcinogenic by inhalation. Students should use forceps to place the cobalt chloride paper in the choice chamber. Students should not directly handle the papers or self-indicating silica gel.

Notes on this practical:

Notes on this practical:
6.

A-level Biology required practical No. 11 Student Sheet
Production of a dilution series of a glucose solution and use of colorimetric techniques to produce a calibration curve with which to identify the concentration of glucose in an unknown ‘urine’ sample
Sugar in the urine is one of the first indications of diabetes.
Method
You are provided with the following:
10 mmol dm-3 glucose standard. distilled water urine samples from Tom, Dick and Harry Benedict’s solution graduated pipettes (2 and 1 cm3) and pipette filler test tubes and test-tube rack water bath set at 90 oC colorimeter and cuvettes.
Prepare urine samples for testing
1. Label the test tubes with the name of the patient and add 2 cm3 urine samples from each patient.
2. To each test tube add 2 cm3 Benedict’s solution. Mix the contents of the tube.
Prepare the glucose calibration curve
1. Label six test tubes 0 to 10 mmol dm-3 as shown in the table below.2. Dilute the glucose standard (10 mmol dm-3) with water in the labelled test tubes and complete
the table to show volumes used to achieve each concentration.
Concentration of final solution/ mmol dm-3
0.0 2.0 4.0 6.0 8.0 10.0
Amount of water/cm3
2.0
Amount of glucosestandard /cm3
0.0
3. Add 2 cm3 of Benedict's solution to each tube. Mix the contents of each tube.4. Place all the test tubes into the water bath together (including the tubes with the urine samples)
and time for four minutes. Allow to cool before taking readings from the colorimeter.5. Use the contents of the 0.0 mmol dm-3 glucose solution tube, which you have heated with
Benedict's, as a blank to calibrate the colorimeter to zero absorbance. Place the remaining samples in cuvettes into the colorimeter and read the absorbance.
6. Record your results in a table and plot a graph of the absorbance of the known concentrations of glucose.
7. Using the graph and the absorbance values obtained for the urine samples read off from the graph the concentration of glucose in the urine samples.
8. Record your results in a suitable table.
Notes on this practical:
Notes on this practical:


A-level Biology required practical No. 12
Student Sheet
Investigation into the effect of a named environmental factor on the distribution of a given species
Investigation into distribution of dandelions in a lawn not treated with herbicide and a lawn treated with herbicide using a point quadrat
Method
You are provided with the following:
Point frame (also called a point quadrat or pin frame) 2 Tape measures.
You should read these instructions carefully before you start work.
1. Before going to the lawn generate 10 sets of random co-ordinates. 2. Go to the lawn where one site is an herbicide-treated lawn and the other an untreated lawn.
(Your teacher will tell you which area is treated) Make sure you can identify a dandelion plant by the shape of its leaves.
3. Lay out the tapes at right angles and place the point quadrat at the first set of co-ordinates. 4. Use the pointers in the point frame to record the dandelions at this position.
Look at the plants hit by the points and attempt to identify them. As each pointer is lowered, you must record any dandelion that is “hit” by the pointer, in the tally chart. Repeat this at the position determined by each set of co-ordinates.
5. Take 100 pointer samples in each site, i.e. 10 placements of the point quadrat. 6. Carry out the data collection from the two sites. Then add up the total number of dandelion
plants in each of the two sites.7. Percentage cover of dandelions = no. of dandelion plants hit x 100
total no. of pointer samples