· web viewin china, smes account for 60% of gross industries output and for 75% of total...
TRANSCRIPT


ENV/JM/MONO(2008)5
2

ENV/JM/MONO(2008)5
OECD Environment, Health and Safety Publications
Series on Pollutant Release and Transfer Registers
No. 10
Scoping Study on the Inclusion of Releases and Transfers from Small and Medium-sized Enterprises (SMEs)
in PRTRs
Environment DirectorateORGANISATION FOR ECONOMIC CO-OPERATION AND DEVELOPMENT
3

ENV/JM/MONO(2008)5
Paris 2008
4

ENV/JM/MONO(2008)5
Environment, Health and Safety Publications on Pollutant Release and Transfer Registers
Pollutant Release and Transfer Registers (PRTRs): A Tool for Environmental Policy and Sustainable Development. Guidance Manual for Governments (OECD/GD(96)32) (1996).
PRTR Series No. 1: Proceedings of the OECD International Conference on Pollutant Release and Transfer Registers (PRTRs). PRTRs: National and Global Responsibility. Tokyo, 9-11 September 1998. Part 1 (1999).
PRTR Series No. 2: Proceedings of the OECD International Conference on Pollutant Release and Transfer Registers (PRTRs). PRTRs: National and Global Responsibility. Tokyo, 9-11 September 1998. Part 2 (1999).
PRTR Series No. 3: Presentation and Dissemination of PRTR Data: Practices and Experiences, Getting the Word and Numbers Out (2000).
PRTR Series No. 4: How Pollutant Release and Transfer Registers Differ: A Review of National Programmes (2001).
PRTR Series No. 5: Resource Compendium of PRTR Release Estimation Techniques, Part 1: Summary of Point Source Techniques (2002).
PRTR Series No. 6: Resource Compendium of PRTR Release Estimation Techniques, Part 2: Summary of Diffuse Source Techniques (2003).
PRTR Series No. 7: Uses of Pollutant Release and Transfer Register Data and Tools for Their Presentation: A Reference Manual (2005).
PRTR Series No. 8: Resource Compendium of PRTR Release Estimation Techniques, Part 3: Summary of Techniques for Off-site Transfers (2005).
PRTR Series No. 9: Framework for Selecting and Applying PRTR Release Estimation Techniques (2005).
© OECD 2008Applications for permission to reproduce or translate all or part of this material should be made to: Head of Publications Service, OECD, 2 rue André-Pascal, 75775 Paris Cedex 16, France
5

ENV/JM/MONO(2008)5
ABOUT THE OECD
The Organisation for Economic Co-operation and Development (OECD) is an intergovernmental organisation in which representatives of 30 industrialised countries in North America, Europe and the Asia and Pacific region, as well as the European Commission, meet to co-ordinate and harmonise policies, discuss issues of mutual concern, and work together to respond to international problems. Most of the OECD’s work is carried out by more than 200 specialised committees and working groups composed of member country delegates. Observers from several countries with special status at the OECD, and from interested international organisations, attend many of the OECD’s workshops and other meetings. Committees and working groups are served by the OECD Secretariat, located in Paris, France, which is organised into directorates and divisions.
The Environment, Health and Safety Division publishes free-of-charge documents in ten different series: Testing and Assessment; Good Laboratory Practice and Compliance Monitoring; Pesticides and Biocides; Risk Management; Harmonisation of Regulatory Oversight in Biotechnology; Safety of Novel Foods and Feeds; Chemical Accidents; Pollutant Release and Transfer Registers; Emission Scenario Documents; and the Safety of Manufactured Nanomaterials. More information about the Environment, Health and Safety Programme and EHS publications is available on the OECD’s World Wide Web site (http://www.oecd.org/ehs/).
This publication was developed in the IOMC context. The contents do not necessarily reflect the views or stated policies of individual IOMC Participating Organizations.
The Inter-Organisation Programme for the Sound Management of Chemicals (IOMC) was established in 1995 following recommendations made by the 1992 UN Conference on Environment and Development to strengthen co-operation and increase international co-ordination in the field of chemical safety. The participating organisations are FAO, ILO, OECD, UNEP, UNIDO, UNITAR and WHO. The World Bank and UNDP are observers. The purpose of the IOMC is to promote co-ordination of the policies and activities pursued by the Participating Organisations, jointly or separately, to achieve the sound management of chemicals in relation to human health and the environment.
6

ENV/JM/MONO(2008)5
This publication is available electronically, at no charge.
For this and many other Environment,Health and Safety publications, consult the OECD’s
World Wide Web site (www.oecd.org/ehs/)
or contact:
OECD Environment Directorate,Environment, Health and Safety Division
2 rue André-Pascal75775 Paris Cedex 16
France
Fax: (33-1) 44 30 61 80
E-mail: [email protected]
7

ENV/JM/MONO(2008)5
FOREWORD
The 37th Joint Meeting agreed in November 2004 to include the “Scoping Study on the Inclusion of Releases and Transfers from Small and Medium-sized Enterprises (SMEs) in PRTRs” in the draft Programme of Work on PRTRs for 2005-2008 [ENV/JM/M(2004)2]. The European Commission kindly provided funding for this Scoping Study which was commenced in November 2006 and finalised in December 2007. The Finnish Environment Institute carried out the study.
The primary purpose of this study was to provide a better insight on whether systematic inclusion of SMEs in national PRTRs would improve the current knowledge of industrial pollution as a whole. Although small and medium-sized enterprises (SMEs) may not be a considerable environmental problem if reviewed individually, they can be a significant source of pollution as a whole due to their large number.
The Task Force on PRTRs reviewed the study in November 2007 by a written procedure, agreed to its conclusions and recommendations and agreed to propose to the Joint Meeting that further studies be undertaken to identify the environmental importance of those releases and off-site transfers from SMEs that are not yet included in PRTRs. The Task Force would then evaluate the feasibility of possible inclusion in PRTRs of such releases and transfers, as well as the need for new estimation techniques.
The 42nd Joint Meeting reviewed the Scoping Study in February 2008, endorsed the proposed further studies and declassified the Scoping Study.
This document is published on the responsibility of the Joint Meeting of the Chemicals Committee and the Working Party on Chemicals, Pesticides and Biotechnology.
8

ENV/JM/MONO(2008)5
TABLE OF CONTENTS
EXECUTIVE SUMMARY..............................................................................................................................9
GLOSSARY OF TERMS..............................................................................................................................10
CHAPTER 1: BACKGROUND AND CONTEXT......................................................................................12
1.1 Introduction.....................................................................................................................................121.2 Objectives........................................................................................................................................121.3 Methodology Used..........................................................................................................................13
CHAPTER 2: OVERVIEW OF SME DEFINITIONS..................................................................................14
CHAPTER 3: CONTRIBUTION OF SMEs TO POLLUTION AND ENERGY USE................................17
3.1 The Number of SMEs......................................................................................................................173.2 Contribution of SMEs to Releases, Transfers and Energy Consumption........................................17
CHAPTER 4: CURRENT INCLUSION OF SMEs IN PRTRS....................................................................25
4.1 Current Inclusion of SMEs in PRTRs.............................................................................................254.2 Industrial Sectors included in PRTRs and other Inventories...........................................................274.3 Reporting Practices..........................................................................................................................284.4 Data Collection from SMEs............................................................................................................30
4.4.1 Obtaining Data from SMEs....................................................................................................304.4.2 Reporting Obligations of SMEs.............................................................................................31
4.5 Resource Need for Reporting..........................................................................................................334.6 Supporting Material and Tools........................................................................................................344.7 Release Estimation Techniques for SMEs.......................................................................................37
CHAPTER 5: CONCLUSIONS AND RECOMMENDATIONS................................................................46
5.1 Contribution of SMEs to Releases and Transfers............................................................................465.2 Current Inclusion of SMEs in PRTRs and other Inventories..........................................................465.3 SME Definitions..............................................................................................................................475.4 Current Practices in receiving Release and Transfer Data from SMEs...........................................475.5 Identification of Partnerships...........................................................................................................495.6 Recommended Mode of SME Inclusion in PRTRs.........................................................................50
REFERENCES...............................................................................................................................................51
SUPPORTING LITERATURE.....................................................................................................................53
ANNEX 1: QUESTIONNAIRE....................................................................................................................54
ANNEX 2: ADDITIONAL QUESTION.......................................................................................................70
ANNEX 3: SME DEFINITIONS..................................................................................................................73
9

ENV/JM/MONO(2008)5
EXECUTIVE SUMMARY
INTRODUCTION
Traditionally national Pollutant Release and Transfer Registers (PRTRs) have focused on collecting release data from larger industrial installations. In many OECD countries, however, small and medium-sized enterprises (SMEs) and larger enterprises are treated identically in relation to reporting obligations to national PRTRs, due to the fact that national reporting obligations in relation to releases and transfers are determined on basis of the type and quantity of releases, rather than on the basis of the enterprise size.
The study was initiated by the OECD Task Force on PRTRs, financed through a grant from the European Commission and undertaken by the Finnish Environment Institute between November 2006 and September 2007.
OBJECTIVES
The objectives of this study were to provide an overview of OECD member country practices regarding the inclusion of SMEs in national PRTRs and emission inventories, and provide guidance, which would enable OECD to support its member countries in obtaining better information on releases and transfers from SMEs for national PRTRs, if they so wish.
RESULTS
Based on the information collected from the survey for this study, it was found that SMEs having a considerable impact on the environment are generally included in PRTRs as point sources, due to reporting requirements in environmental permits or in the PRTR reporting guidelines. The releases of SMEs, which are not reported by the installations/facilities, are often included in the data from diffuse sources under other reporting systems, but not necessarily included in national PRTRs. However, there are still industrial activities, where releases and transfers from SMEs are not yet included in PRTRs or other emission inventories.
CONCLUSIONS AND RECOMMENDATIONS
Based on the findings in this study, it was concluded that raising awareness on and improving skills of small- and micro-sized enterprises to report their releases and transfers to PRTRs would be more resource demanding both to enterprises and to governments than carrying out this work on behalf of them by governments. By this way also the obtained data would probably be more reliable. The saved resources could be used to improve the estimation of releases and transfers from diffuse sources, rather than using them for extensive quality control activities by the authorities. The share of releases that is not covered by different reporting systems in the countries, should be identified and analysed in relation to environmental impacts, and if appropriate, methodologies be developed to include this data in the diffuse source inventory of PRTRs.
10

ENV/JM/MONO(2008)5
GLOSSARY OF TERMS
AP-42 Clearinghouse for Inventories and Emission Factors (USEPA)
BTU British thermal unit
CLRTAP Convention on Long-Range Transboundary Air Pollution
CO Carbon monoxide
EC European Commission
EMEP Co-operative programme for monitoring and evaluation of the long range transmission of air pollutants in Europe
EPER European Pollutant Release Register
EU European Union
HCB Hexachlorobenzene
HELCOM Baltic Marine Environment Protection Commission
IEA International Energy Agency
IPCC Intergovernmental Panel on Climate Change
NACE Nomenclature Generale des Activites Economiques dans I`Union Europeenne (General Nomenclature for Economic Activities in the European Union)
NMVOC Non-methane volatile organic compounds
NPI National Pollutant Inventory (Australia)
NPRI National Pollutant Release Inventory (Canada)
OECD Organization for Economic Co-operation and Development
OSPAR The Convention for the Protection of the Marine Environment of the North-East Atlantic
PBT Polybutylene terephthalate
PCDD/F Polychlorinated dibenzodioxins and dibenzofurans
PI Pollution Inventory (England and Wales)
11

ENV/JM/MONO(2008)5
PM10 Particulate matter, diameter less than 10 mm
PRTR Pollutant Release and Transfer Register
RAINS Regional Air Pollution Information and Simulation (RAINS) model (www.iiasa.ac.at/rains).
RET Release Estimation Technique
SME Small- and medium-sized enterprises
SO2 Sulphur dioxide
TRI Toxics Release Inventory (USA)
UN United Nations
UNECE United Nations Economic Council for Europe
UNFCCC United Nations’ Framework Convention on Climate Change
UNEP United Nations Environment Programme
UNITAR United Nations Institute for Training and Research
US EPA United States Environmental Protection Agency
UWWTP Urban wastewater treatment plant
VOC Volatile organic compounds
12

ENV/JM/MONO(2008)5
CHAPTER 1: BACKGROUND AND CONTEXT
1.1 Introduction
Traditionally, national Pollutant Release and Transfer Registers (PRTRs) have focused on collecting release data from larger industrial facilities. In many OECD countries, however, small and medium-sized enterprises (SMEs) and larger enterprises are treated identically in relation to reporting obligations to national PRTRs, since the reporting obligations in OECD countries are determined on the basis of the type and quantity of releases, rather than on the basis of the enterprise size.
During the last decades, releases from large industrial facilities have decreased considerably through systematic abatement efforts. Consequently, the relative share of releases from SMEs and diffuse sources has increased. The SMEs may not be a considerable environmental problem if reviewed individually, but due to their large number, they can be a significant source of pollution as a whole. Currently only a part of the SMEs has a reporting obligation to the authorities on their releases and transfers. Generally, those releases from SMEs that are required to be inventoried on the basis of international or regional conventions on air emissions or on wastewaters,1 are calculated by the authorities as diffuse sources, if the information is not obtained from the SMEs. Therefore, current information on the releases from SMEs may not be as accurate as the comparable release information from large enterprises that are obliged to monitor and report their releases.
The primary purpose of this study is to provide an insight on whether a systematic inclusion of SMEs into national PRTRs would improve the current knowledge of industrial pollution as a whole. The study was initiated by the OECD Task Force on PRTRs, financed through a grant from the European Commission and carried out by the Finnish Environment Institute between November 2006 and September 2007.
1.2 Objectives
A scoping study on SMEs was included in the work programme of the OECD Task Force on PRTRs for 2005-2008 with the following objectives:
1. Provide an overview of OECD member country practices regarding the inclusion of SMEs in national PRTRs and emission inventories, and list the used SME;
2. Identify countries that are estimating releases and transfers from SMEs and provide a breakdown of sectors, substances (and waste types), as appropriate, and indicate whether the information is based on point or diffuse source reporting/estimation; collect information on the availability and use of release estimation methods in OECD countries;
3. Provide information on legal obligations of SMEs to report on their releases and transfers, as well as information of initiatives by industry associations to support their member-SMEs;
1 Greenhouse gases are reported to the UNFCCC and air pollutants to the UNECE CLRTAP. Wastewater discharges are reported under the regional marine protection conventions, such as HELCOM, OSPAR, or under the European Union Water Framework Directive.
13

ENV/JM/MONO(2008)5
4. Provide guidance which would enable OECD to support its member countries in obtaining better information of releases and transfers from SMEs for national PRTRs, if they so wish; and
5. Assess the resource need for obtaining information of releases and transfers from SMEs, as well as the best reporting mode for SMEs (point/diffuse source).
1.3 Methodology Used
The material for the study was received from a questionnaire sent to all OECD member countries. In addition to responses received from the countries, information was gathered with a literature survey on SMEs contained in PRTRs, as well as from other inventories.
Due to the limited amount (12) of responses received to the first questionnaire, it was resent to member countries in March 2007 with and additional question (4.12 a-d), requesting further details on the applied release estimation techniques. Four (4) responses were received to the additional question.
As the overall response rate was lower than envisaged, the information presented in this report is unfortunately not as complete as it could have been. The detailed response rate for each question is presented in the tables below. The original responses can be made available by the OECD Secretariat upon request.
14

ENV/JM/MONO(2008)5
CHAPTER 2: OVERVIEW OF SME DEFINITIONS
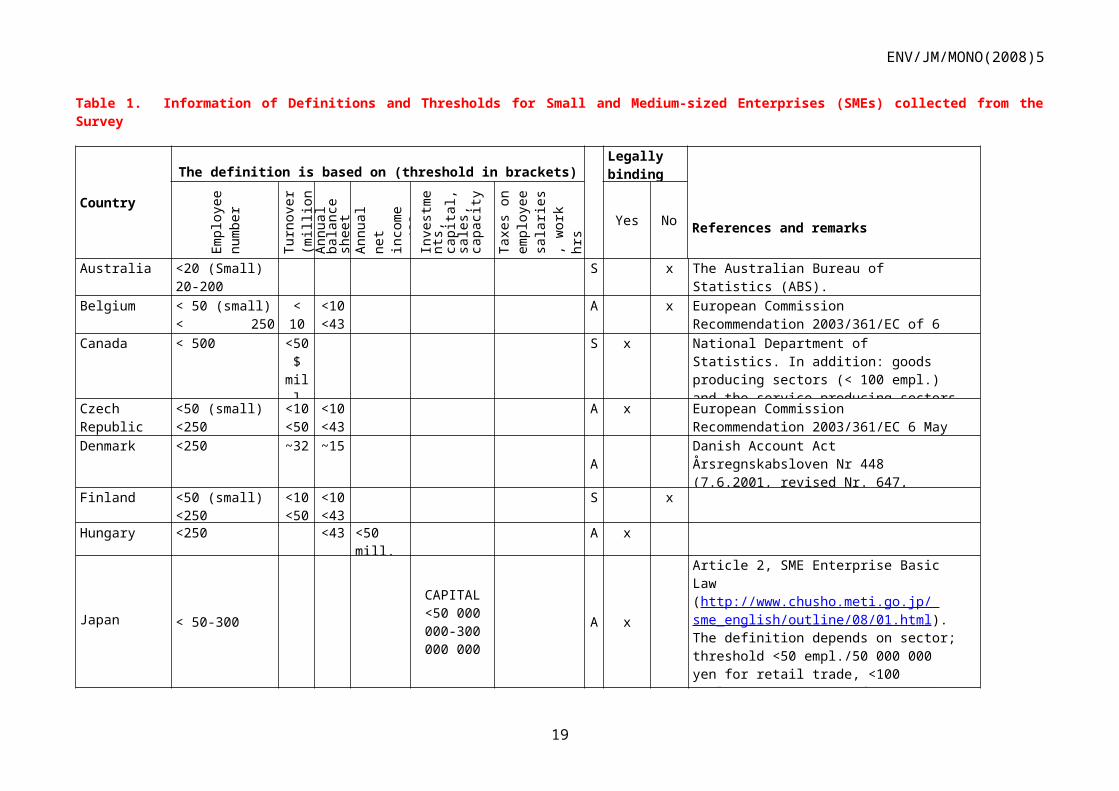
The majority of the OECD countries provide guidance for SMEs. According to the survey responses, existing definitions for SMEs are not related to environmental issues. The definitions are of administrative nature in nine countries (and in the EU) and statistical in three countries out of the twelve responses received. The definition is legally binding in six out of the twelve countries responded. On the other hand, reporting to PRTRs is based on the environmental impact of the activity, rather than the size of an enterprise or any other criteria. This issue is reviewed more closely in Section 4.1.
Practices to define SMEs vary widely between the OECD countries. Definitions for SMEs are statistical or administrative and are based on the number of employees, number of annual working hours, annual turnover, annual balance sheet or production volume and independence of the company. Countries are using one or several of these definitions. The number of employees and annual turnover seem to be the criteria applied in most countries. However, the definitions are different in relation to economic activity sectors. For instance, the physical production and the sales amounts often provide the basis for the agricultural sector, while the number of employees often is the basis for other sectors.
The thresholds for SMEs, even with the similar definition, vary according to the economic activities, making cross-country comparisons difficult. For instance, the ceiling used for the number of employees is generally 250 in Europe and 500 in the USA and Canada. The thresholds may also vary between industrial sectors in one country.
Information of definitions and thresholds received from the survey is presented in Table 1 below for each country responding to the relevant questions (points 1.1 – 1.5). Definitions used in the OECD countries and beyond are presented in Annex 3.
15

ENV/JM/MONO(2008)5
Table 1. Information of Definitions and Thresholds for Small and Medium-sized Enterprises (SMEs) collected from the Survey
Country
The definition is based on (threshold in brackets)
A =Legally binding
References and remarksEm
ploy
ee
num
ber
Turn
over
(m
illion
eur
os)
Annu
al
bala
nce
shee
t (m
ill. e
uros
)
Annu
al n
et
inco
me
(mill.
eu
ros)
Inve
stm
ents
, ca
pita
l, sa
les,
ca
pacit
y
Taxe
s on
em
ploy
ee
sala
ries,
wor
k hr
s
Yes No
Australia <20 (Small)20-200 (Medium)
S x The Australian Bureau of Statistics (ABS).
Belgium < 50 (small)< 250 (medium)
< 10< 50
<10<43
A x European Commission Recommendation 2003/361/EC of 6 May 2003
Canada < 500 <50 $ mill
S x National Department of Statistics. In addition: goods producing sectors (< 100 empl.) and the service producing sectors (< 50 empl). A micro enterprise < 5 employers regardless of the sector.
Czech Republic <50 (small)<250 (medium)
<10<50
<10<43
A x European Commission Recommendation 2003/361/EC 6 May 2003.
Denmark <250 ~32 ~15A
Danish Account Act Årsregnskabsloven Nr 448 (7.6.2001, revised Nr. 647, 15.6.2006) No difference between statistics on SMEs and other statistics.
Finland <50 (small)<250 (medium)
<10<50
<10<43
S x
Hungary <250 <43 <50 mill. euros
A x
Japan< 50-300
CAPITAL<50 000 000-300 000 000
A x
Article 2, SME Enterprise Basic Law (http://www.c h usho.meti.go.jp/ sme_english/outline/08/01.h t ml ). The definition depends on sector; threshold <50 empl./50 000 000 yen for retail trade, <100 empl./50 000 000 yen for service sector, <100 empl./100 000 000 yen for wholesale trade, <300 empl./300 000 000 yen for manufacturing industry and others.
16

ENV/JM/MONO(2008)5
17

ENV/JM/MONO(2008)5
Country
The Definition is based on (threshold in brackets)
A =
Legally binding
Empl
oyee
nu
mbe
r
Turn
over
(m
illion
eu
ros)
Annu
al b
alan
ce
shee
t (m
ill. e
uros
)
Annu
al n
et
inco
me
(mill.
eur
os)
Inve
stm
ents
, ca
pita
l, sa
les,
ca
pacit
y
Taxe
s on
em
ploy
ee
sala
ries,
wor
k hr
s
Yes No
Norway<50 A x
The base line of inclusion of an enterprise to the PRTR is the potential to pollute, not the size.
Spain <50 (small)<250 (medium)
<10<50
<10<43 A x
European Commission Recommendation 2003/361/EC of 6 May 2003.
Sweden <50 (small)<250 (medium)
<10<50
<10<43 A x
European Commission Recommendation 2003/361/EC of 6 May 2003.
UK (mill £) 50 (adm) (small)0-49 (stat) (small)250(adm) (medium)50-249 (stat) (medium)
<2.8
<11.2
A xAdministrative: Section 248 of the Companies Act of 1985. Statistical: Micro firm 0-9 employees, small firm 0-49 employees, medium firm 50-249 employees (Department of Trade and Industry).
US >10
(non-good
s producing
SME)
Manufacture/process 25 000 pounds or use
of 10 000 pounds per
toxic chemical / calendar year
Work hours > 20 000 A x
Definition for PRTR. Another: US Small Business Administration (SBA)http://www.sba.gov/size/indextableofsize.html#naics_ determine): manufacturing industry 500 empl., wholesale trade 100 empl., $ 6 mill for retail and service industry, $28.5 for general and heavy construction industry, $ 12 for special trade contractors, $ 0.76 for agricultural industry.
EU <50 (small)<250 (medium)
<10<50
<10<43
A European Commission Recommendation 2003/361/EC of 6 May 2003.
18
ENV/JM/MONO(2008)5
CHAPTER 3: CONTRIBUTION OF SMEs TO POLLUTION AND ENERGY USE2
3.1 The Number of SMEs
In the OECD countries, 95% of the enterprises are SMEs. The SMEs account for 60 – 70% of the production within the manufacturing industry in OECD countries, as well as for the majority of workplaces in the service sector (OECD, 1996).
In the European Union there are 23 million SMEs that represent 99% of all enterprises in EU-25 (Vettori, 2006). Information on the percentages of SMEs in the EU countries is provided in Table 2 and in the OECD in Table 3.
According to statistical information, 80 – 90% of all industrial establishments 3 are SMEs in the developing countries. For instance, in India about 20 million people are employed by 5 million SMEs, accounting for 80% of the industrial sector employment and 40% of industrial production. The SMEs are thus the second largest employer after agriculture. In China, SMEs account for 60% of gross industries output and for 75% of total employment. In Latin America, the "formal sector" has 1.2 million SMEs with 21 million workers, comprising 65% of all employment (Alikhan, 2005; OECD, 1996).
3.2 Contribution of SMEs to Releases, Transfers and Energy Consumption
While enhancing growth of productivity and employment, SMEs contribute to pollution and consumption of energy and resources. The relative share of emissions from SMEs has increased during the past 30 years compared to emissions from large industrial installations, though the overall emissions have reduced from both large facilities and SMEs. The SMEs may not generate large quantities of pollution per individual operating site, but, due to the large number of SMEs, they may have a significant collective environmental impact especially in the urban areas, where they often are located. It is also obvious, that pollution reduction at larger facilities is relatively easy and more cost-efficient than within the SMEs. The emissions from SMEs seem to be increasing, e.g. approximately 80 percent of the smaller polluters in North America have increased the amount of hazardous chemicals and pollutants released to air, water and land by 15% from 1998 to 2000 (Alberta Government, 2006).
SMEs can be found in sectors that do not have significant impact on the environment, but also in sectors where their contribution, regardless of their size, is considerable in relation to both the pollution and resource consumption. No comprehensive pollution or resource consumption statistics exist for SMEs, making it difficult to determine their exact contribution to environmental degradation. However, studies (presented below) carried out at national level indicate that SMEs in certain activity branches may contribute significantly to the consumption of energy and resources, and to releases of hazardous chemicals and other pollutants.
2 Information on energy consumption is included as it is a key factor in environmental performance contributing heavily to air emissions, but not reported to PRTRs.
3 Note: It is possible that one enterprise has many different establishments. In these cases statistics representing small- and medium-sized enterprises may be overestimated. Unfortunately, no information is available to convert the number of establishments into the number of enterprises.
19

ENV/JM/MONO(2008)5
Table 2. Share of Enterprises in Europe by Size (number of employees) in 1996 (Annual Competitiveness Report, 1999)
Country
Share of Enterprises by Size [%] according to EmployeesMicro<10
Small1-49
Medium50-249
Large>250
Total
Austria 86.1 10.8 2.4 0.6 100Belgium 96.5 2.9 0.5 0.2 100Denmark 92.4 6.3 1.1 0.2 100Finland 94.4 4.5 0.9 0.2 100France 92.9 5.8 1.1 0.2 100Germany 88.1 10.0 1.5 0.4 100Greece 97.0 2.6 0.4 0.1 100Ireland 89.8 8.0 1.6 0.6 100Italy 94.4 5.1 0.5 0.1 100Luxembourg 84.2 12.4 3.0 0.4 100Netherlands 90.5 7.7 1.4 0.4 100Norway 92.4 6.4 1.0 0.2 100Portugal 93.8 5.3 0.9 0.1 100Spain 94.9 4.4 0.6 0.1 100Sweden 91.0 7.4 1.3 0.3 100Switzerland 85.2 12.1 2.3 0.4 100United Kingdom 94.5 4.7 0.7 0.2 100EU 93.0 5.9 0.9 0.2 100
Table 3. Share of Enterprises in Manufacturing by Size (number of employees) in 2001 (Annual Competitiveness Report, 1999)
CountryShare of Enterprises by Size [%] according to Employees
<10 10-49 50-99 100-499 500+
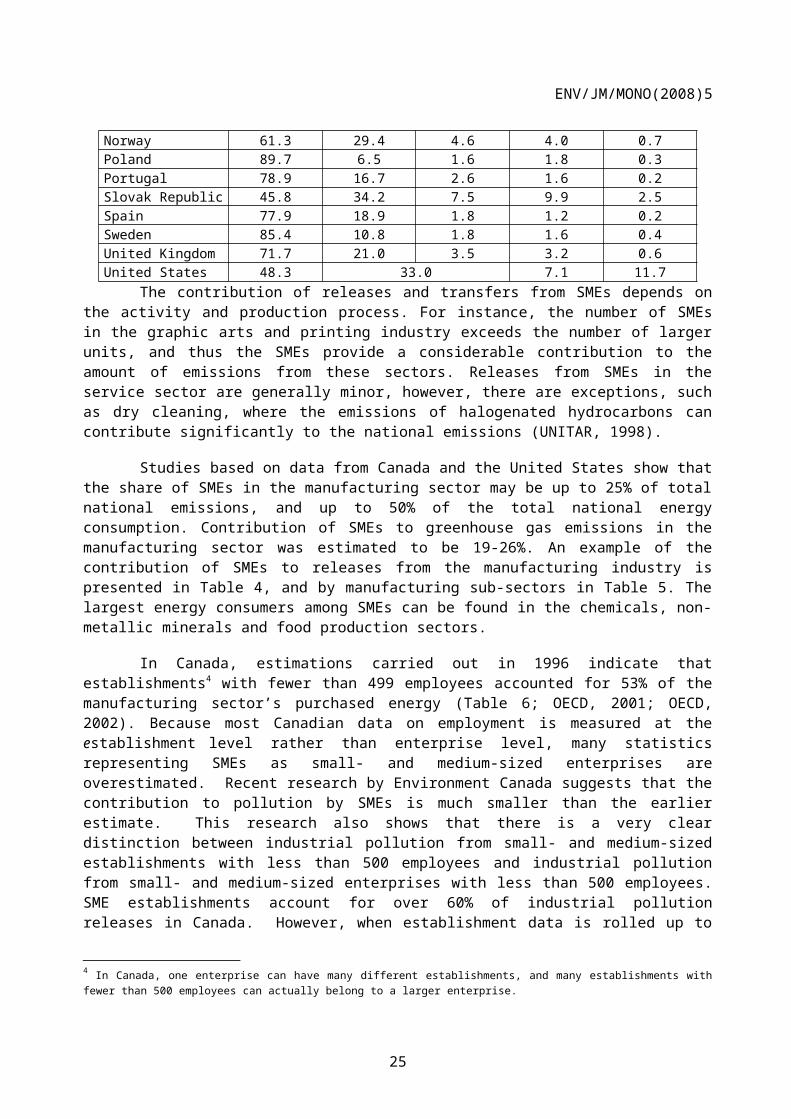
Australia 72.6 21.8 2.8 2.2 0.6Austria 69.0 23.3 3.3 3.8 0.6Belgium 79.4 15.5 2.4 2.2 0.6Czech Republic 89.2 7.6 1.5 1.4 0.3Denmark 70.7 21.8 3.6 3.3 0.6Finland 83.4 12.0 2.2 1.9 0.5France 81.8 13.9 2.0 1.9 0.4Germany 64.0 26.5 4.3 4.3 0.9Greece .. 79.4 9.6 9.7 1.3Hungary 86.0 10.4 1.6 1.6 0.3Ireland 37.3 42.3 9.5 9.3 1.5Italy 83.3 14.5 1.3 0.8 0.1Japan 50.9 39.2 5.4 4.0 0.5Netherlands 77.0 16.7 3.2 2.6 0.4New Zealand 81.3 15.3 1.7 1.4 0.3Norway 61.3 29.4 4.6 4.0 0.7Poland 89.7 6.5 1.6 1.8 0.3Portugal 78.9 16.7 2.6 1.6 0.2Slovak Republic 45.8 34.2 7.5 9.9 2.5Spain 77.9 18.9 1.8 1.2 0.2Sweden 85.4 10.8 1.8 1.6 0.4United Kingdom 71.7 21.0 3.5 3.2 0.6United States 48.3 33.0 7.1 11.7
The contribution of releases and transfers from SMEs depends on the activity and production process. For instance, the number of SMEs in the graphic arts and printing industry exceeds the number of larger units, and thus the SMEs provide a considerable contribution to the amount of emissions from these
20

ENV/JM/MONO(2008)5
sectors. Releases from SMEs in the service sector are generally minor, however, there are exceptions, such as dry cleaning, where the emissions of halogenated hydrocarbons can contribute significantly to the national emissions (UNITAR, 1998).
Studies based on data from Canada and the United States show that the share of SMEs in the manufacturing sector may be up to 25% of total national emissions, and up to 50% of the total national energy consumption. Contribution of SMEs to greenhouse gas emissions in the manufacturing sector was estimated to be 19-26%. An example of the contribution of SMEs to releases from the manufacturing industry is presented in Table 4, and by manufacturing sub-sectors in Table 5. The largest energy consumers among SMEs can be found in the chemicals, non-metallic minerals and food production sectors.
In Canada, estimations carried out in 1996 indicate that establishments4 with fewer than 499 employees accounted for 53% of the manufacturing sector’s purchased energy (Table 6; OECD, 2001; OECD, 2002). Because most Canadian data on employment is measured at the establishment level rather than enterprise level, many statistics representing SMEs as small- and medium-sized enterprises are overestimated. Recent research by Environment Canada suggests that the contribution to pollution by SMEs is much smaller than the earlier estimate. This research also shows that there is a very clear distinction between industrial pollution from small- and medium-sized establishments with less than 500 employees and industrial pollution from small- and medium-sized enterprises with less than 500 employees. SME establishments account for over 60% of industrial pollution releases in Canada. However, when establishment data is rolled up to the enterprise5 level, the industrial pollution from small- and medium-sized enterprises is much smaller, representing 25% of all industrial releases6.
Information on the contribution of SMEs to national releases and transfers was asked in this survey (Annex I to the Questionnaire). However, it was not possible for the countries to provide information of the relative share of the total releases from SMEs, as valid search criteria to screen this information are not included in the PRTR or other inventory databases.
4 In Canada, one enterprise can have many different establishments, and many establishments with fewer than 500 employees can actually belong to a larger enterprise.
5 i.e. establishments belonging to the same enterprise are added together for employment size
6 Canadian Criteria Air Contaminant Releases
21

ENV/JM/MONO(2008)5
Table 4. Contribution of SMEs from the Manufacturing Industry to Pollution in the US 1997 (OECD, 2001)
Emissions into Air Share of Total Wastewater Releases Share of Total
Carbon Monoxide (CO)Sulphur Dioxide (SO2)Nitrogen Dioxide (NO2)Volatile Organic Compounds (VOCs)Total Suspended Particulates (TSP)Fine Particulates (PM10)
Toxic chemicals, released to:
AirWaterLand
13%13%14%18%22%19%
19%15%15%
Biological Oxygen Demand (BOD)Total Suspended Solids (TSS)
Bio-accumulative metals, released to:
AirWaterLand
24%12%
19%17%18%
22

ENV/JM/MONO(2008)5
Table 5. Contribution of SMEs (%) to Releases from the Manufacturing Industry in the US 1997 (OECD, 2001)
Manufacturing sector Air Water Toxic Chemicals to: Bio-accumulative to:
CO SO2 NO2 VOCs TSP PM10 BOD TSS Air Water Land Air Water LandFood and kindred products X 5% 7% X 8% 6% 29% X Y X X Y X YTobacco products Y Y Y Y Y Y Y Y Y Y Y Y Y YTextile mill products Y X X X Y Y Y Y X 5% X Y Y YApparel and other textile products Y Y Y Y Y Y Y Y Y Y Y Y Y YLumber and wood products 17% X 7% 12% 16% X Y Y X Y Y X Y YFurniture and fixtures Y Y Y 11% X Y Y Y X Y Y Y Y YPaper and allied products 9% 9% 8% X X X 8% Y 7% X X X X YPrinting and publishing X Y Y 6% Y Y Y Y X Y Y Y Y YChemicals, allied products 11% 19% 26% 18% 10% 11% 32% 8% 24% 69% 45% 8% 42% 9%Petroleum, coal products 11% 19% 16% 7% 10% X Y Y X Y X Y Y YRubber and misc. plastics products Y Y Y 8% Y Y 9% Y 15% Y X Y X XLeather and leather products Y Y Y Y Y Y Y Y Y Y X Y Y YStone Clay and glass products X 20% 17% X 38% 64% Y Y X Y X X Y YPrimary metal industries 30% 12% 5% X 8% 11% 19% 75% 7% 11% 19% 58% 21% 59%Fabricated metal products 8% X 6% 9% Y Y Y X 11% 6% 13% 16% 23% 17%Industrial machinery and equipment X X X 5% Y Y Y Y X Y X X Y XElectronic and other electric equipment X X X X Y X Y Y 8% Y 5% X X XTransportation equipment Y X Y X X Y Y Y 5% X X X Y XInstruments and related products Y Y Y Y Y Y Y Y X Y Y Y X YMisc. manufacturing industries Y Y Y X Y Y Y 8% X Y Y Y Y X
Y represents < 1% and X represents 1-5%
23

ENV/JM/MONO(2008)5
Table 6. SME Energy Consumption by Sector in Canada 1996 (OECD, 2001)
Industrial Sector Total purchased energy % of all SMEs
Total purchased energy Share of SMEs (%) of the
sectorChemical and Chemical Products 27.50% 56.30%Non-metallic Mineral Products 16.40% 77.20%Food Industries 11.20% 58.90%Paper and Allied Products 9.00% 13.00%Fabricated Metal Products 8.10% 78.50%Wood 7.10% 62.20%Primary Metal Industries 3.10% 5.70%Plastic Products 2.90% 82.70%Machinery Industries 2.10% 63.10%Refined Petroleum and Coal Products 1.90% 13.90%Transportation Equipment 1.60% 12.20%Printing, Publishing and Allied 1.40% 59.10%Beverage 1.20% 48.00%Electrical and Electronic Products 1.20% 34.60%Furniture and Fixture Industries 1.10% 67.70%Primary Textiles 1.00% 31.20%Other Manufacturing 1.00% 49.30%Textile Products Industries 0.90% 50.80%Clothing 0.60% 51.50%Rubber Products 0.50% 25.80%Leather and Allied 0.20% 61.30%Tobacco Products 0.10% 21.10%Total SMEs (5-199) 100.00% 34.60%
According to a study by the European Commission, SMEs could be responsible for up to 70% of all industrial pollution in the EU-15. An example from the Netherlands shows that enterprises having less than 100 employees are estimated to generate 30% of the total CO2 emissions and 29% of chlorofluorocarbon (CFC) emissions. Another Dutch study estimates that the SMEs’ contribution to wastewater discharges constituted 53% of national wastewater discharges in 1995 (OECD 2001; OECD, 2002; DG ENTR, 2004; Vettori, 2006). In the United Kingdom, SMEs have been estimated to be responsible for 60% of commercial waste. In the Netherlands SMEs are responsible for 24% of all waste produced, and for 50% of industrial waste. It is estimated that almost 30% of the total industrial waste in the Flanders region in Belgium is generated in enterprises employing fewer than 10 workers. Another example provided in Table 7 presents waste generation in Flanders divided by the economic sectors. This Table clearly shows that the highest percentages originate from real estate and leasing of buildings (95.3%), pharmacies (92.9%) and from fuel distribution (92.3%) (Thas, 2003; SEPA, 2002).
According to another study, 87% of SMEs in the industrial sector in Belgium state that they do not contribute to soil contamination, 44% that they do not emit any polluting substances into air and 23% claim not to produce any solid waste. In Poland, 87% of SME managers claim that their operations do not have any significant negative impact on the environment. In the UK, 93% of SMEs interviewed think that they do not undertake activities that could cause harm to the environment and 75% do not have any environmental policy (Vettori, 2006).
24
ENV/JM/MONO(2008)5
Table 7. Production of Waste by Micro Companies (less than 10 employees) in the Flanders Region (Thas, 2003)
Sector
Waste produced by Micro-sized facilities
as % of total industrial waste of
the sector
Sector
Waste produced by Micro-sized
facilities as % of total industrial waste of the
sector Waste processing industry 28.1 Communal services 31.6Building sector 40.0 Cleaning companies 47.2Chemical industry 1.1 Mining construction 0.4Metal-working industries (jewellery production)
69.4 Metal-working industries (furniture manufacture)
15.5
Sewage water purification 81.3 Overland transport of goods 48.9Energy sector 0, Installation works in buildings 72.1Rubber production and processing
19.5 Wholesale and retail for automotive accessories
58.8
Food sector 6.0 Culture, sports and recreation 41.0Meat production & processing 13.9 Production of non-ferrous metals 0.0Production of ferrous metals 0.2 Refineries 0.5Wholesalers 36.1 Potable water provision 45.4Hospitality and catering 61.8 Administrative sector 68.6Lumber industry 14.7 Passenger transport overland 52.4Metal-working industries (general)
6.6 Banking and insurance institutions 57.6
Retail and repair enterprises 74.6 Shipping 20.9Garages 51.0 Other companies 75.8Agriculture 22.3 Telecommunication 40.0Metal-working industries (prod. of transport facilities)
1.2 Mineral products (cement, concrete, gypsum)
11.6
Paper production 0.9 Mail delivery 6.5Textile sector 24.6 Physical care 88.5Supermarkets 4.0 Laboratories 13.6Providing education services 13.0 Railways 1.1Storage and transit depots 43.1 Film and multimedia 57.5Finishing of buildings 48.9 Medical practices 81.1Rental enterprises 73.8 Tourism 71.9Real Estate and leasing of buildings
95.3 Laundry and dry cleaning 5.1
Aviation 0.8 Photography and photolaboratories 10.9Production of mineral articles (ceramic products)
12.2 Production of mineral articles (glass)
3.2
Printing houses 5.2 Pharmacies 92.9Gasoline stations and fuel sellers
92.3
Hospitals and rest homes 6.6 TOTAL 29.8
25

ENV/JM/MONO(2008)5
The number of SMEs in developing countries is even larger and their contribution to pollution much bigger than in the OECD countries. According to a UNEP report (2001), SMEs are the major contributor to the total export of goods from the South Asian countries, but they also generate 50% of the total industrial pollution in these countries. For example, the textile industry in some areas pollutes heavily the local environment with dye effluents, which contain both heavy metals and organic pollutants. Concentration of these pollutants in wastewater is often high and, thus, the cumulative local impact may be substantive when several SMEs discharge their effluents to the same water body. Tea production is another example. It is very energy intensive and consumes both thermal and electrical energy, contributing considerably to CO2 emissions. It is also rather common practice to dump used lubricating oils from motor repair workshops directly onto the soil.
26

ENV/JM/MONO(2008)5
CHAPTER 4: CURRENT INCLUSION OF SMEs IN PRTRS
4.1 Current Inclusion of SMEs in PRTRs
Based on an OECD survey in 2007, 17 OECD countries had an operational PRTR in place: Australia, Canada, Czech Republic, Denmark, France, Hungary, Ireland, Japan, Korea, Mexico, the Netherlands, Norway, Slovak Republic, Sweden, Switzerland, United Kingdom and the United States. In many more countries, within the OECD and beyond, the work towards establishing a national PRTR system is underway. For the time being, thirty-six countries and the European Community have signed the UNECE PRTR Protocol under the Aarhus Convention, and in the next couple of years, for instance, all the 27 European Union Member States will have a full scale PRTR system in place (European PRTR) when implementing the UNECE Protocol.
Thirteen countries (and the EC) responded to the questionnaire (Australia, Belgium, Canada, Czech Republic, Denmark, Finland, Hungary, Japan, Norway, Spain, Sweden, United Kingdom and the United States). According to their responses, all countries having or preparing a PRTR, have already included, or will include, SMEs into their national PRTRs.
The responses from the countries confirmed the fact, that rather than the enterprise size, it is generally the environmental impact of SMEs that launches their reporting obligations. The activity may be required to apply for an environmental permit and to report accordingly, or it may be listed under those activities of the national PRTR programme that have reporting obligation regardless of the size of the activity. In general, many medium-sized facilities exceed the set capacity and release thresholds and are thus required to report to the national PRTR. Some SMEs are thus already included in PRTRs of many countries. However, countries including SMEs in their PRTRs do not have definitive means of identifying the size of the reporting enterprise, as the required information to do so is not normally reported to PRTRs.
In Japan, reporting to the national PRTR is required for enterprises having more than 21 full time employees. In the US, the reporting burden for micro-sized businesses has been reduced 7 by targeting only facilities having 10 or more employees and which exceed certain other thresholds.
A summary of responses received from the survey (points 2.1; 2.2; 2.4; 2.5; 2.6; 2.7; 2.8 and 4.4; 4.5; 4.6; 4.7 in the Questionnaire) is provided in Table 8. The number of responses to each question is given in parentheses.
In the EU, establishment of the European PRTR is underway and SMEs will be partly included in the register as point sources, since some SMEs exceed the capacity and release thresholds of the E-PRTR.
All countries did not respond to all survey questions. The number of replies received for each question is presented below (per total number of replies).
The reporting of SMEs covers releases to air, water and soil for all countries (10/10 replies), and transfers to wastewater treatment plants, as well as off-site transfers of waste for disposal or recovery for 70% (7/10 replies) of the countries that responded to these questions.
7 By the law establishing the US Toxics Release Inventory
27

ENV/JM/MONO(2008)5
44% of the countries reported off-site waste transfers as pollutants or chemicals, while 66% reported them as waste (all of the latter were European countries). The pollutant/chemical specific reporting thresholds are the same for both SMEs and large installations in all countries (8/8 replies).
Table 8. Inclusion of SMEs in PRTRs
QUESTION Responses from Countries Number of Responses
2 GENERAL QUESTIONS ON SMEs AND PRTRs
2.1 Has your country established a national PRTR?
YES (10) NO (0) UNDERWAY (2) 12
2.2 Are SMEs included in your national PRTR
YES (9)Partly (2) NO (0)
UNDERWAY (1)Partly(1 + EU)
12
2.3 See Table 7 7
2.4
In case the SMEs are not included in the PRTR, does your country have any plans to include them?
YES (3) NO (0) 3
2.5
Can you give an estimate of resources needed for the PRTR agency for obtaining the information of releases and transfers from the SMEs in your PRTR?
National and regional authorities: 5 man years (1)Annual budget for input and validation of waste data from SMEs, EUR 170 000 (1)
Depends on how the data is received(1)
Not possible to separate the resources between LEs and SMEs (4)
7
2.6How do you get information on the SMEs that are included in the reporting?
Municipal authorities (0) Trade register (0)
National statistics (4)
11Trade organisations (3) Inquiries
(5)Reporting by the facility (5)
2.7Which reporting mode do you have for the SMEs? Point source
(7)
Diffuse source(0)
Point/diffuse depending on the branch (5)
12
2.8 Other general observations on the inclusion of SMEs in PRTRs
EPER regarded as first step to European PRTR, no SMEs included;
Same release thresholds for reporting of SMEs and Large Enterprises;
In case SMEs are not included in the point source reporting, their emissions are estimated by governments in the inventories
3
4.4 Does the reporting on SMEs to PRTR cover:
Releases to air, water, soil (10)
10Transfers to wastewater treatment plants (8)
Transfer of waste off-site for treatment (8)
4.5Is the reporting on off-site waste transfers from SMEs to the national PRTR…
… chemical specific? (4)9
… waste specific? (5)
4.6 Are there pollutant/chemical specific reporting thresholds for SMEs in the national PRTR?
YES (5) 9NO (4)
4.7 Are the pollutant/chemical specific reporting thresholds the same for SMEs as for large installations?
YES (8) 8NO (0)
28

ENV/JM/MONO(2008)5
According to the responses received (8 replies), the pollutants/chemicals to be reported from SMEs do not differ from the overall reporting requirements in the PRTRs. The reporting obligation for the enterprises is launched if the threshold for the use of chemicals is exceeded and if the chemicals are persistent, bio-accumulative or toxic. Generally, all releases of the pollutants/chemicals must be reported by any facility that meets the reporting requirements.
4.2 Industrial Sectors included in PRTRs and other Inventories
In the questionnaire the OECD member countries were asked to provide information on the industrial branches of SMEs that are included in their national PRTRs and those that are currently included in other national inventories.
Based on survey responses, SMEs in the sectors listed in the Questionnaire8, are included in both PRTR and other national inventories (air emissions, wastewater and waste) in the majority of countries. However, activities in the service-producing sector are not included in the PRTRs or inventories of all countries.
The summary of responses received to the question on inclusion of SMEs into the national PRTRs and other inventory systems (point 2.3 in the Questionnaire) is presented in Table 9. All countries did not reply to this question. The number of replies to each alternative is given in brackets. However, the numbers presented for release inventories (three last columns) may be misleading as it is obvious that all countries did not provide all information.
8 Sectors in the questionnaire: Energy, Production and processing of metals, Mineral industry, Chemical industry, Waste and wastewater management, Paper and wood production and processing, Intensive livestock production and aquaculture, Animal and vegetable products from the food and beverage sector, Service-producing sector (e.g. dry cleaners, car repair shops), Other activities (please, specify).
29

ENV/JM/MONO(2008)5
Table 9. Inclusion of SMEs in national PRTRs and other national Emission Inventories (AUS = Australia, BE=Belgium, CAN = Canada, CZ = Czech Republic, DK = Denmark, ES = Spain, FI = Finland, HUN = Hungary, JP = Japan, NO = Norway, US = the USA)
Sector PRTR Air EmissionInventories
WastewaterInventories
Waste Reporting
Energy sector (8) AUS BE CAN CZ DK JP NO
US*
(8) BE CAN CZ DK ES FI HUN US
(8) BE CAN CZ DK FI ES HUN US
(8) BE CAN CZ DK ES FI HUN US
Production and processing of metals
(8) AUS BE CAN CZ DK JP NO US
(8) BE CAN CZ DK ES FI HUN US
(8) BE CAN CZ DK FI ES HUN US
(8) BE CAN CZ DK ES FI HUN US
Mineral industry (8) AUS BE CAN CZ DK JP NO US
(8) BE CAN CZ DK ES FI HUN US
(8) BE CAN CZ DK ES FI HUN US
(8) BE CAN CZ DK ES FI HUN US
Chemical industry (8) AUS BE CAN CZ DK JP NO US
(8) BE CAN CZ DK ES FI HUN US
(8) BE CAN CZ DK ES FI HUN US
(8) BE CAN CZ DK ES FI HUN US
Waste and wastewater management
(8) AUS BE CAN CZ DK JP NO US
(8) BE CAN CZ DK ES FI HUN US
(8) BE CAN CZ DK ES FI HUN US
(8) BE CAN CZ DK ES FI HUN US
Paper and wood production and processing
(8) AUS BE CAN CZ DK JP NO US
(8) BE CAN CZ DK ES FI HUN US
(8) BE CAN CZ DK ES FI HUN US
(8) BE CAN CZ DK ES FI HUN US
Intensive livestock production and aquaculture
(7) AUS BE CAN CZ DK NO**
US*****
(8) BE CAN*** CZ DK ES FI HUN US
(8) BE CAN CZ DK ES FI HUN US
(8) BE CAN CZ DK ES FI HUN US
Animal and vegetable products from the food and beverage sector
(8) AUS BE CAN CZ DK JP NO
US******
(8) BE CAN CZ DK ES FI HUN US
(8) BE CAN CZ DK ES FI HUN US
(7) BE CAN CZ DK FI HUN US
Service-producing sector (e.g. dry cleaners, car repair shops)
(5) AUS BE CAN**** CZ JP
(6) CAN CZ DK ES FI US
YES (5): CAN CZ DK ES FI NO (2): JP US
(7) BE CAN CZ DK ES FI US
Other activities, please, specify:
Railway transport, warehousing, educational sector
(5) BE CAN CZ JP US*******
(4) CAN CZ DK US YES (5): CAN CZ DK ES FINO (2): JP US
(7) BE CAN CZ DK ES FI US
(1) JP
*US: only fossil fuels ** Norway: including aquaculture *** Canada: excluding aquaculture **** Canada: excluding car repair shops *****US only processing/production plants, not farming operations******US food processing/production plants *******(US/Other activities: see p.44 of TRI Reporting Form and Instructions at http://www.epa.gov/tri/report/TRI_RFI_2006.pdf)
4.3 Reporting Practices
Whether the SMEs are treated as point or diffuse sources in the national PRTRs and in other emission inventories, depends on the purpose of the inventory. The industrial sectors are included in emission registers and inventories at different levels: in the emission inventories the emission data is summed up at the sectoral level of economic activities, while in the national PRTRs facility level data is required. In those countries that include diffuse sources in their PRTR, SMEs that do not report to the PRTR as a point source, are included anyway in the diffuse source data.
According to the survey responses, SMEs in the energy sector, production and processing of metals, mineral industry, chemical industry, waste and wastewater management, paper and wood production and processing, as well as manufacturing of animal and vegetable products in the food
30

ENV/JM/MONO(2008)5
production sector, were reported as point sources. In case the countries had other sectors 9 than those listed in the questionnaire, these were always reported as point sources.
The only industrial sectors that were reported either as point or diffuse sources, or solely as diffuse sources, were the intensive livestock production and aquaculture, as well as the service sector, which includes, for instance dry cleaners and car repair shops.
Based on the responses to the additional question 4.12c, part of the countries included dry cleaning, car repair shops and pig and poultry farms as diffuse sources in their PRTRs. This was the case also with part of smaller power plants10 and urban wastewater treatment plants11 (see Table 14).
The responses received to the question of reporting releases from SMEs as point or diffuse source (point 2.7) are presented in Table 10. All countries did not reply to this question.
Table 10. Reporting Mechanism for Releases from SMEs by Industrial Sector
Sector Point Source
Diffuse Source
Point or Diffuse Source
Number of Responses
Energy sector 7 2 9
Production and processing of metals 7 2 9
Mineral industry 7 2 9
Chemical industry 7 2 9
Waste and wastewater management 7 2 9
Paper and wood production and processing 7 2 9
Intensive livestock production and aquaculture 5 1 3 9
Animal and vegetable products from the food and beverage sector
7 2 9
Service-producing sector (e.g. dry cleaners, car repair shops) 2 2 2 6
Other activities (see footnote 3) 3 1 4
In the EU, the reporting mode for SMEs is point source for all other activities except the service sector, where SMEs are included either as point or diffuse sources.
In the emission inventories on a national level, SMEs may be treated as diffuse sources for practical reasons, such as adjusting the working load of the authority compiling the inventory. When deciding, which industrial activities are treated as point sources, the authorities may decide on the maximum number of point sources, from which emissions can be received and treated individually. The rest of the emission sources will then be treated as diffuse sources. 9 Canada and the Czech Republic indicated other sectors but did not provide a list of these sectors. The Japanese list for other activities deviates from the default list given in the questionnaire and is therefore presented here (all reported as point sources): metal mining, crude petroleum and natural gas production, manufacturing, production, transmission and distribution of electricity, manufacture of gas, heat supply, sewerage, railway transport, warehousing, wholesale trade of petroleum, wholesale trade of iron scrap, wholesale trade of motor vehicles, fuel stores, laundries, photographic studios, automobile maintenance services, machine repair shops, commodity inspection services, surveyor certification, waste disposal business, advanced educational organizations, research institutes for natural sciences.
10 E.g. in Canada with fuel use of < 10 000 BTU/hour capacity or if emissions do not meet the threshold of the NPRI. In Australia power plants < 50 MW are reported both as point and diffuse sources (threshold was not given in Australia’s reply).
11E.g. in Canada the threshold for UWWTPs to report as point sources is >10 000 m3/day.
31

ENV/JM/MONO(2008)5
As earlier stated, the reporting threshold is not decided according to the size of the enterprise but according to the potential environmental impact of the activity in question. The activity may also be listed under those having a reporting obligation regardless of whether the firm is an SME or a larger enterprise. For example, in the European Pollutant Emission Register (EPER) and in the European PRTR, no capacity threshold exists for chemical industry. Generally, countries that have incorporated releases and transfers from SMEs in their PRTRs, do not have definitive means of distinguishing the size of the reporting enterprises.
For instance in the European Union, releases from SMEs are partly covered by the European PRTR and partly by national PRTRs, since some medium-sized facilities exceed the capacity and release thresholds of the European PRTR. In many countries typical SME activities in the service-producing sector, such as dry cleaners and car repair shops, are not included in all countries’ PRTRs.
In the US, sources releasing air emissions less than 10 tons of VOCs, or 100 tons of NO x, CO, SO2, or PM10 per year, need to be inventoried as diffuse sources according to a US EPA recommendation (UNITAR, 1998).
4.4 Data Collection from SMEs
4.4.1 Obtaining Data from SMEs
Release and transfer data from SMEs are currently collected in diverse ways in OECD countries. The SMEs may have a reporting obligation based on the environmental permit or a PRTR regulation. There may be direct inquiries to SMEs or information may also be received from trade organizations, or calculated by the government based on data from national statistics. Thus, the release and transfer data on SMEs can be either point source or diffuse source data.
Several countries reported that often multiple methods are used simultaneously to collect release data from SMEs. Based on the survey responses (point 2.6, see Table 8), information from SMEs is in most cases retrieved from facility reports or surveys. Surveys were also often used, together with national statistics and data from trade organisations, when the SMEs were included in PRTRs as diffuse sources.
If the release data is delivered by the SMEs themselves, they send their reports to the PRTR agency (4/11 replies), the supervising authority (5/11 replies), the Ministry of the Environment (1/11 replies) or, to the national commerce and companies’ agency (1/11 replies).
Member countries were asked of the share of releases reported as point sources of all emissions from SMEs. However, the countries do not have means to identify this data in their databases. Two countries provided estimates of the approximate share of releases reported as point sources of all emissions from SMEs (Question 4.8). As it is likely that the interpretation of the question was different in these countries, the results are not presented.
Based on survey responses, member countries use the same lists of chemicals and chemical specific thresholds for both the SMEs and large industrial facilities (Questions 4.9 and 4.10) (see EC, 2006, NPRI, NPI, PI, TRI).
If the release data are estimated by authorities on behalf of SMEs, the data are generally calculated based on statistical data and emission factors (Question 4.3 replied by 6/12 countries).
Information on supporting material and tools provided by the countries is presented in Section 4.6 and release estimation methods applied for SMEs in Section 4.7. Applicability of national release
32

ENV/JM/MONO(2008)5
estimation techniques in other countries has been discussed in OECD report Framework for Selecting and Applying PRTR Release Estimation Techniques (OECD, 2005).
4.4.2 Reporting Obligations of SMEs
According to the survey responses, legal obligations to report releases and/or transfers to a national PRTR system exist in nine countries (Question 4.1, Table 11). Reporting obligations are mainly based on three criteria:
1. Activity is listed under those that need to report to a national PRTR, and the level of the capacity of the activity exceeds a given threshold;
2. Consumption rate of chemicals of the SME exceeds the given threshold; and
3. Reporting of releases to environmental authorities is legally binding, if the activity needs a permit from the environmental authority (the need for a permit depends on the potential environmental impact of the activity, not on the size of the enterprise).
In the two first cases, requirements may vary among sectors and substances, as well as the threshold for different chemicals.
33
ENV/JM/MONO(2008)5
Table 11. Mandatory Reporting Obligations of SMEs
3.1 –3.2 Are there any legal obligations in your country for an SME to report releases and/or transfers to the national PRTR system? Specification of the legal background (11)4.1 Is the reporting on SMEs to the national PRTR mandatory/voluntary? (for 8 countries mandatory out of 11 replies)
CountryMandatory
Specification of the Legal BackgroundYES NO
Australia x
Exceeding the established threshold in national legislation called a National Environmental Protection Measure. Every year Australian industrial facilities that use certain amounts of the 93 NPI substances must estimate and report their emissions and transfers of substances in waste directly to their state or territory environment agency. The substances that must be reported and the different categories and thresholds are listed in a NPI Guide, and can be viewed and downloaded at http://www.npi.gov.au/about/list_of_subst.html.
Belgium (x)
• In the Belgium Flanders region the Flemish environmental legislation requires emissions to be reported if they exceed specified thresholds. According to the Flemish Waste Decree, all facilities that produce waste have to keep a waste register and have to report to the authorities annual quantities and other relevant data of waste produced. • In the Belgium Walloon and Brussels regions: E-PRTR Regulation and EPER Decision.• EU Waste Statistics Regulation.
Canada x
SMEs, like other facilities, must report to Canada’s PRTR if they meet the reporting requirements and thresholds of the NPRI (National Pollutant Release Inventory). These requirements vary for different sectors and substances. For the official reporting requirements: Canada Gazette Notice for 2006 NPRI reporting
Czech Rep. x
The Act on Integrated Prevention, No. 76/2002 Coll. , Government Regulation No. 368/2003 Coll on the Integrated Pollution Register; Decree No. 527/2004 Coll,. Form and way of keeping records of documents essential for IPR reportingNew act on Integrated Pollution Register (EPRTR).
Denmark x The Green Account Act.
Hungary x
Japan xThere are no legal differences between large enterprises and SMEs under the Japanese PRTR. It is, however, not required for small enterprises, which have 20 employees or less, to notify reports under the Japanese PRTR in consideration of their burden.
Norway xThere is no legal binding obligation for SMEs to report given no legally binding definition of an SME in Norway. Legally binding, however, is the reporting of releases to the environmental authorities if the activity needs a permit from the environmental authorities.
Spain x
The legal background for including one enterprise in the PRTR comes from Regulation (EC) 166/2006: Its Annex I compiles all industrial activities (and its corresponding capacity thresholds) with legal obligations to report. These obligations refer to SME (the definition of SME is the one gathered in the Recommendation 2003/61/CE of the European Commission) whenever they develop an Annex I industrial activity.
Sweden x
United Kingdom (England & Wales)
xIf an operator carries out any activity listed in Schedule 1 of the Pollution Prevention and Control (England and Wales) Regulations 2000 (as amended) it will operate under a PPC permit and be required to provide information to the Pollution Inventory (England and Wales) [under regulation 28].
United States x
Law establishing the US Toxics Release Inventory. The facility must report if it operates within any given industry sector, employs 10 or more full-time-equivalent employees and manufactures or processes more than 25 000 pounds or otherwise uses more than 10 000 pounds of any listed chemical during the calendar year (except for PBT chemicals where the thresholds are 0.1 gram for PCDD/F and 10 or 100 pounds for other PBT chemicals).
EU x
34

ENV/JM/MONO(2008)5
4.5 Resource Need for Reporting
According to the received survey responses12, it is not easy to separate the resource needs for obtaining information on releases and transfers between large and small enterprises, as the size is not a factor that determines the obligation to report. Two countries provided estimates of the resources and replied that i) the PRTR Agency needs 5 full-time persons per year for obtaining the information of releases and transfers from SMEs for the national PRTR; and ii) the costs for input and validation of waste data from SMEs that are not PRTR protocol companies requires annual resources of approximately EUR 170 000 (Question 2.5).
Concerning the micro- and small-sized enterprises, the reporting to a PRTR does not increase considerably the need of resources in case they are already reporting under another obligation, for instance under the environmental permit. Small- and medium-sized enterprises may also have an environmental management system that requires regular reporting. In both cases, the company has already established procedures to follow up the levels of releases and transfers, as well as consumption of energy and resources. Reporting to a PRTR may thus only increase the number of parameters to be monitored. However, there is need for expert help to identify such releases that do not belong to the regular monitoring programme, as well as for tools to estimate the relevant releases.
Collectively, there is a large number of SMEs that do not report to national PRTRs because they do not meet the national reporting thresholds. In many cases, SMEs have limited capacity to report and their awareness of their releases and transfers may not be at an adequate level (OECD, 2001; Vettori, 2006). A reporting obligation may therefore provide a burden for SMEs, likely resulting in provision of lower quality information than that which can be provided through the application of diffuse source estimation method by governments. Therefore, for example the US does not require micro-sized businesses to report, but focuses on facilities with 10 or more employees, or those which meet some other thresholds.
However, the costs and benefits of requiring reporting from those SMEs that are not currently submitting data should be carefully evaluated and weighed against the costs and benefits of a system where governments estimate the releases. Better estimation of releases and transfers and management of related documentation by the micro- and small-sized enterprises, is considered a long-term challenge.
In the current situation, it can be assumed that much of the data that would be reported by the numerous small SMEs might be of relatively low quality. This would lead to a situation where increased resources would be required for quality control activities by governments for the large number of records. It may, therefore, be more profitable to spend these resources for refining the diffuse source estimation techniques, than for controlling data quality (OECD, 2003).
According to the survey responses, the number of industrial facilities reporting to a PRTR system may be doubled when the European PRTR will be implemented, as the reporting obligation will concern new industrial activities under which the number of SMEs is large. The costs of including new facilities and sources in PRTRs may be controlled by using the existing data and reporting channels to serve the PRTR programme. For example, mandatory reporting under the environmental permits, as well as data calculated for diffuse sources and reported to international conventions (such as UNFCCC, UNECE CLRTAP, EU Water Framework Directive), can be used for reporting to PRTRs.
12 Six replies were received to this question (Question 2.5).
35

ENV/JM/MONO(2008)5
Information on costs related to establishing a national PRTR is available from relevant publications by the OECD, such as “Pollutant Release and Transfer Registers (PRTRs): A Tool for Environmental Policy and Sustainable Development - Guidance Manual for Governments”)13.
4.6 Supporting Material and Tools
The questionnaire collected information on possible technical and other support provided for the reporting of releases from SMEs. A compilation of the responses received to questions 5.1 – 5.5 is provided in Table 12. According to the responses, general guidance for reporting was provided in all countries that replied to the question. In all countries, the information is available on a website and half of the countries provide guidance also in written form.
Technical support to the SMEs for reporting to the PRTR
All countries provide general guidance on the estimation of releases.
Sector specific guidance exists at least in Australia, Canada, Spain, the UK and the US.
The Australian PRTR, NPI14, has developed 79 industry sector handbooks, which provide explanation and best available emission estimation techniques for the different industry processes; all the 90 NPI chemical compounds, as well as their characteristics and properties, are presented in these handbooks.
In Canada, the "NPRI Toolbox"15 provides information about various methods of estimating releases, as well as on references, guidance documents and case studies. Also examples, questions and answers related to release estimation, as well as software and spreadsheets for estimating emissions for various processes, are available.
In Japan general and sector specific guidance on estimation of releases is provided16 .
In Spain17 there are specific guides for pulp and paper, glass and fused metal coating sectors, as well as information on release estimation techniques and measurement methods for a wide variety of substances.
In UK, general guidance as well as industry sector specific guidebooks, are available on the Internet18. In addition, sector specific tools to estimate releases and transfers have been developed in collaboration with industry representatives. These include tools to estimate releases to water from sewage treatment works and leachate from landfills.
The US provides reporting software to assist facilities in their reports and guidance documents for facilities to report to the TRI19; also general guidance, industry and chemical specific guidebooks, as well as a questions and answers website are available.
13 http://www.chem.unep.ch/prtr/download/pgd9632e.pdf
14 http://www.npi.gov.au/
15 http://www.ec.gc.ca/pdb/npri/documents/2004ToolBox/toolBox_e.cfm
16 http://www.env.go.jp/en/chemi/prtr/manual/index.html17 http://www.eper-es.es
18 http://www.environment-agency.gov.uk/business/444255/446867/255244/
19 http://www.epa.gov/tri/report/index.htm#forms
36

ENV/JM/MONO(2008)5
Personal assistance
Personal assistance is provided generally via telephone service or by email. Local technical assistance is available in Australia, Canada, Spain in the US and in the UK. A FAQ database (frequently asked questions) is provided by the Czech Republic and by the US. Plant visits are carried out in Australia. The Czech Republic provides an email helpdesk and articles in expert magazines. Telephone support and public FAQ services are applied to SMEs in Belgium and Japan.
Workshops
Workshops are organised in Australia, Belgium, Canada, the Czech Republic, Japan, Spain and in the US annually or several times a year; these workshops may be organized in various locations across the country and they are open to all enterprises regardless of their size.
Environment Canada provides full-day and half-day NPRI workshops each year to explain the reporting requirements for the upcoming NPRI reporting year.
Other tools
Canada indicated hat they have extensive collaboration with industry associations in developing sector-specific guidance on reporting protocols.
Networking
Networking with larger companies, trade associations, professional organisations, utilities and municipalities, could offer important information to SMEs. These networks have been found useful in building environmental awareness among the SMEs, helping with environmental management training, and providing advice on technical and financial matters (OECD, 2001). According to the survey responses, networking also takes place with regard to PRTR reporting.
Trade or industrial organisations or associations provide support for their SME members for reporting to the PRTR in Australia, Belgium, the Czech Republic, Japan and in the US. In Australia the industry associations provide centralized reporting on behalf of the reporter, particularly in relation to intensive agriculture; in two replying countries out of six, no support was provided by trade associations.
Australia, the Czech Republic, Denmark, Norway and the US reported that there is co-operation between the enterprises inside the industrial branches. In the US, facilities within a particular sector work together on their reporting and, for instance, in automobile manufacturing there is collaboration between facilities even across the parent company lines.
Other kind of networking was reported by Australia, where there are seminars and workshops and by the Czech Republic, where a special website is established for communication between the industrial companies.
Subsidies
SMEs are provided with subsidies in many countries for improving the environmental performance. However, according to the survey responses, it can be concluded that OECD countries do not generally provide subsidies or other kind of financial support to the SMEs for
37

ENV/JM/MONO(2008)5
their reporting purposes. Only Spain has the possibility to subsidize projects towards the development20 of monitoring techniques for industrial facilities with the aim of unifying measurement criteria and improving the quality of the PRTR. The need to subsidize these projects, however, is evaluated on the basis of the contents and environmental benefits of the projects, not on the basis of the enterprise size.
Table 12. Supporting Material and Tools for Estimating Releases and Transfers
5.1 Does your government provide technical support to the SMEs for reporting to the PRTR? Number of Responses
Guidance manuals/ industry handbooks
General guidance on reporting 8/9
9General guidance on estimation of releases 5/9Sector specific guidance on RETs 4/9Other: reporting software 2/9
The information is availableOn a website 10/
10As published material 6/1On request 6/1
Does your government provide any personal assistance to the SMEs for their reporting?
Local technical assistance centres 4/8
8Plant visits 3/8Telephone service 8/8
Email helpdesk 1/8
Does your government organize demonstration programmes, seminars or workshops
Annual workshops for all enterprises 7/7
7FAQ database/service 2/7Collaboration with industry associations to develop sector guidance and reporting protocols 1/7
Articles in expert magazines 1/75.2 Does your government provide subsidies or other kind of financial support to the SMEs for reporting? No (3/4) Support to projects to develop monitoring techniques in industrial facilities (1/4) 4
5.3 Do the trade or industrial organizations/associations provide support to their SME members for reporting to the PRTR?
Centralized reporting on behalf of the reporter, particularly in relation to intensive agriculture (1/8)
Assistance to their members for reporting to the PRTR (5/8) None (2/8)
8
5.4 Is there co-operation between the enterprises inside the industrial branches? Yes (6/8) Coordination groups between the Ministry and the competent authorities as well as between
the Ministry and industrial associations (1/8) Unknown (1/8)
8
5.5 Is there other kind of networking? Seminars and workshops etc. (7/7) Special website for industrial companies (1/7) No information (2/7)
7
20 In Spain the basis for subsidies is the National Plan for Scientific Research, Development and Technological Innovation 2004-2007. Subsidies can be provided if projects meet the criteria set in the official announcement and pass the evaluation process.
38

ENV/JM/MONO(2008)5
4.7 Release Estimation Techniques for SMEs
The release estimation techniques (RETs)21 used by a facility are generally chosen based on the nature of the industrial activity and releases, the degree of confidence required in the data and anticipated uses of the data.
In case the SME has an environmental permit, the release estimation technique may be determined in the permit or in the attached monitoring programme. In these cases use of standard methods is generally required. There may also be general and technical guidance and regulations on reporting and estimation of releases, which do not distinguish between SMEs and larger enterprises.
According to the responses (Table 13), for those SMEs having an environmental permit, the release estimation technique is mainly determined in the permitting and supervising process or in national regulations (6/6 replies).
21 The most commonly used release estimation techniques are direct monitoring, mass balance, chemical-specific emission factors, engineering calculations, as well as engineering judgement, techniques based on physical-chemical properties, combination of techniques (engineering judgement and direct monitoring), and the application of other techniques, such as default emission factors.
39
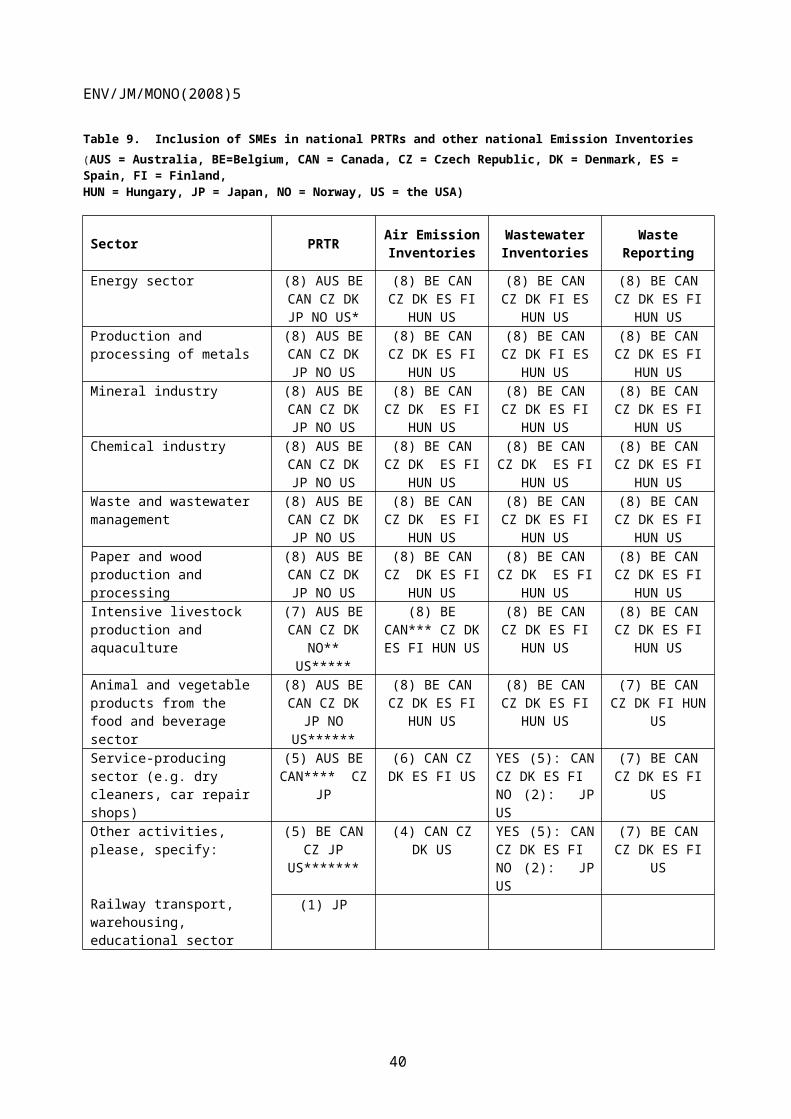
ENV/JM/MONO(2008)5
Table 13. Release Estimation Technique determined in the Permit or in the attached Monitoring Programme
5.6 In case the SME has an environmental permit the release estimation technique may be determined in the permit or in the attached monitoring programme
Number ofResponses
Belgium Flanders: The release estimation techniques are determined for all sectors.
6
Canada The release estimation technique is determined in the provincial permits (incl. Service-producing sector). For production & processing of metals and paper& wood production & processing the release estimation techniques are determined in addition to the permit, also in the federal regulations, which prescribe the use of specific measurement protocols or other estimation techniques.
Denmark The release estimation technique is determined in the permit/monitoring programme for all sectors except the service-producing sector
Spain Monitoring depends on the sector and on the Competent Authority, although most usual is that large plants use continuous monitoring and smaller ones punctual samples.
UK (England and Wales)
The general and technical Pollution Inventory guidance contains information for all operators, including SMEs and larger installations on techniques to use for the determination of emissions.
US The facilities collect information on their emissions because of other environmental laws and already have the necessary information to report to TRI.
5.7 Additional observations on material and toolsNorway The environmental authorities require the facilities to use national standards to
estimate/measure releases (very often based on international standards)1
In those cases where the SMEs do not report as point sources to the PRTR, governments have used several approaches to estimate releases and transfers on behalf of SMEs:
Data from SMEs, which report releases as point sources, can be used for other similar SMEs operating in the same sector; also emission factors for similar processes can be developed with the help of the reported data and activity data; these methods, however, require that the comparability of the process has been verified.
Release data can be obtained from industrial associations that carry out estimation of releases for their member companies. However, industrial associations should also document and publish the release estimation methods used for the calculations. The releases of non-member companies can be estimated by governments.
Surveys may be used to obtain information from companies on either the releases or activity data, with the help of which the releases can be estimated; the survey could also include instructions (for example a calculation sheet with pre-filled formulas) for the operator to perform calculation of releases by himself, if he so wishes.
Information of the existing companies per industrial activity, can be obtained from several national registries.
Governments can use data from companies' environmental reports, which are published on Internet.
40

ENV/JM/MONO(2008)5
Data on production and use of chemicals is usually available in several national statistics; this data can be used to estimate releases from SMEs by sorting out the production volumes of SMEs from the production volume of those companies that report as point sources; emission factors for the calculation are available in the literature.22 National emission factors can be developed, for instance, on the basis of release data within activity concerned, or based on information from national studies.
To get a comprehensive picture of the situation in estimating releases and transfers from SMEs, countries were asked to provide information on the estimation of releases for the following sectors: dry cleaners, car repair shops, power plants < 50 MW, pig (< 2 000 animals) and poultry (< 40 000 animals) farms and urban wastewater treatment plants (< 100 000 P.E.23 ). Compilation of the responses received (Questions 4.12a – 4.12c) from seven countries (Australia, Belgium, Canada, Finland, Japan, Spain and Sweden) is presented in Table 14 below.
The following can be provided as a summary of the responses from countries on the inclusion of releases and transfers from specific activities in national PRTRs:
Releases from dry cleaning were included in the PRTR in Australia, Belgium (Flanders Region), Canada, Japan, and in the other reporting systems in Australia, Belgium (Flanders, Walloon and Brussels regions), Canada, Finland and Sweden. According to the replies, part of the emissions are reported by SMEs as point sources, part calculated as diffuse sources.
Releases from car repair shops were included in PRTRs in Japan and in the Belgium (Flanders Region both as a point and diffuse source), and in the other reporting systems in Belgium.
(Walloon and Brussels regions), Canada, Finland and Sweden.
Releases from power plants < 50 MW were included in PRTR in Australia, Japan and Canada, and in the other reporting systems in Belgium, Canada, Finland, Japan, Spain and Sweden; the source was reported both as a point and diffuse source.
Releases from pig and poultry farms were included in PRTRs in Australia and in the Flanders Region both as a point and diffuse source, and in the other reporting systems in Canada, Finland and Sweden.
Releases from urban wastewater treatment plants were included in PRTRs in Australia, Belgium (Flanders Region), Canada and Japan, and in the other reporting systems in Belgium (Flanders and Walloon regions), Finland and Japan. The source was reported both as a point and diffuse source.
In Canada, power plants exceeding 35 MW and urban wastewater treatment units > 10 000 m 3/d are treated as point sources. Canada does not plan to require reporting to NPRI from agriculture, or car repair shops, but plans to continue the improvement release estimation in the National Air Emissions inventories, as well as improve the multi-media emissions inventories for POPs, as required under the Stockholm convention.
22 See OECD Resource Centre for PRTR RETs: http://www.oecd.org/env/prtr/rc.
23 P.E. = population equivalent.
41

ENV/JM/MONO(2008)5
Table 14. Inclusion of selected Activities in different Inventory Systems
4.12 a Do you compile information in your PRTR or in other reporting systems of the releases and off-site transfers from facilities within the following sectors?
Number of responses
SectorPRTR Other Reporting Systems
7
YES (3/5) NO (3/6) YES (3/5) NO (2/5)
Dry cleaningAustraliaBelgium*Japan
Belgium*SwedenUS
Belgium*Canada FinlandSwedenUS
AustraliaJapan
Car repair JapanBelgium*
AustraliaCanada SwedenUS
Belgium*CanadaFinland SwedenUS
AustraliaJapan
Power plants < 50 MW
AustraliaJapan CanadaUS****
Sweden
BelgiumJapanCanada FinlandSwedenSpainUS
Australia
Pig (< 2 000 animals) and poultry (< 40 000 animals) farmsAustraliaBelgium*US *****
Japan Sweden
BelgiumCanadaFinlandSwedenUS
AustraliaJapan
Urban wastewater treatment plants (<100 000 P.E.)
AustraliaBelgium*JapanCanada
Sweden
BelgiumCanadaFinlandUS
AustraliaJapan
*In Belgium these activities are included in the PRTR system in Flanders but not in Walloon and Brussels regions. All activities from all regions are included in the other reporting systems.** US: for fossil fuel combustion and meeting other reporting thresholds.*** US: only processing/production plants, not farming operations.
4.12 b In case of NO, are you planning to do this in the future?
YES NO
6
AustraliaSweden
Canada*JapanUS
*Canada does not plan to require reporting to NPRI from agriculture, car repair or dry cleaners. Canada plans to continue the improvement of the emissions / releases estimated as part of the National Air Emissions inventories cited above, as well as to improve the multi-media emissions inventories for POPs as required under the Stockholm convention.
4.12 c How is the information reported?
Point source Diffuse source
6
Australia*Belgium**Canada ***Japan****Spain
Australia*Belgium**JapanSweden
* In Australia the activities are reported either as point or diffuse sources. Car repair shops are reported neither as point nor diffuse sources. The thresholds are concerned with the use of a substance with the threshold 10 tonnes being used or the amount of fuel stored or energy used.** Belgium Flanders Region includes dry cleaning, power plants and urban WWTPs as point sources and car repair and pig & poultry farms as diffuse sources in their PRTR. In the Walloon and Brussels regions these are reported as diffuse sources.*** In Canada the threshold for power plants for reporting as point sources is > 25MW (on PCDD/F and HCB releases) and for power plants > 10 000 BTU/h capacity must report as point sources on those criteria air contaminants for which release thresholds are exceeded. Wastewater treatment plants with an annual average discharge > 10 000 m3/d must report as point sources.**** In Japan laundries > 20 full time employees or handling one ton or more of PRTR chemicals report as point sources
42

ENV/JM/MONO(2008)5
The question (4.12 d) was responded to by six countries (Australia, Belgium, Canada, Japan, Spain and the United States). A compilation of the responses is presented in Table 15. The responses to the question on estimating releases and transfers by activity sector can be summarised as follows:
Dry Cleaning
NMVOC emissions to air
It can be assumed that NMVOC emissions into the air from dry cleaning are estimated in all countries that are parties to the UNECE CLRTAP and UNFCCC conventions, as the source is included in the reporting obligations of these conventions.
Three countries out of the six that replied to this question report NMVOCs from dry cleaning to their national PRTRs. Releases from dry cleaning as a diffuse source are calculated with the help of activity data (e.g. from solvent use register, or obtained from surveys or operators) and emission factors (by using national emission factors or searching from guidebooks); also models (e.g. RAINS) can be used; the governments may carry out the calculation or outsource it.
Spent solvents in off-site transfers of waste
At least in the Belgium Flanders Region spent solvents are estimated in off-site transfers of waste by extrapolation based on sample survey sent out to representative enterprises (number of employees and economical sector). The economical sectors are regarded homogeneous concerning waste generation by enterprise and by size classification. There are no reporting thresholds. The mean of the waste production by sector and size of the enterprises is calculated and this is extrapolated to the total population. The total waste generation is calculated.
Solvents in wastewater
None of the five countries that replied to this question estimate these releases.
Car Repair
Volume of waste oil or chemicals in off-site transfers of waste
Belgium Regions Flanders and Wallonia (see dry cleaning above), as well as Spain, estimate these releases. The data is obtained from reports by the plants or calculated on the basis of data in waste statistics.
Power Plants < 50 MW
Emissions of sulphur dioxide (SO2), nitrous oxides (NOx), non-methane volatile organic compounds (NMVOC), carbon dioxide (CO2), particulate matter size fraction < 10 micrometres (PM10), ammonia (NH3 ) and heavy metals
It can be assumed that these emissions are estimated in all countries that are parties to the UNECE CLRTAP and UNFCCC conventions, as the source is included in the reporting obligations of these conventions. The data is often reported by the plants, as the reporting thresholds may concern boiler capacities as of 5 MW. In both cases the data for CO2 is calculated with methods compatible with the IPCC guidance. SO2 and NOx, as well as total suspended particles (TSP) are usually included in the environmental permit reporting obligations
43

ENV/JM/MONO(2008)5
for those operators that submit this data to the authorities. PM10 emissions can be calculated from the TSP data with fraction factors available from international databases24. Heavy metals are not always included in the reporting obligations under an environmental permit; however, heavy metal and ammonia emissions can be estimated with emission factors available in the international literature25. For other releases than CO2, information of the applied combustion and abatement techniques is required in order to produce accurate estimates.
Fuel consumption data is required for the calculation of all emissions. For point sources, guidance26 is available for determining the fuel consumption; for diffuse sources, fuel consumption can be obtained from the national energy balance.
In Australia, Canada and the Flanders Region the data is either received from the plants or the plants are included in the calculation of diffuse sources. The threshold for reporting in Canada is 35 MW and 400 t of fuel/year in Australia. Emission factors from AP-42 are used in Canada, from the NPI in Australia and from the IPCC in Belgium. In Canada the calculation is based on fuel sales and in Australia and Belgium on fuel consumption.
Pig (< 2 000 animals) and Poultry (< 40 000 animals) Farms
Ammonia
It can be assumed that ammonia emissions to air from pig and poultry farms are estimated in all countries that are parties to the UNECE CLRTAP convention, as the source is included in the reporting obligations of this convention, though the responses do not explicitly reveal this.
Ammonia emissions to air are estimated by Australia, Belgium (Flanders Region) and Canada. Part of the data is reported by the plants or received through inquiries. In cases where the source is treated as a diffuse source, data is calculated with livestock statistics and emission factors. Many countries also use national calculation models developed for this purpose.
Waste
Waste generation from pig and poultry farms is included as a diffuse release at least in the Belgium Flanders Region’s PRTR. These waste volumes are estimated with extrapolation on the basis of a survey sampling representative enterprises (number of employees and economical sector). No reporting thresholds are applied. The mean of the waste production by sector and size of the enterprises is calculated and this is extrapolated to the total population of enterprises for each sector/size.
24 Available at: http://www.air.sk/tno/cepmeip/
25 Guidebooks such as EMEP/Corinair Emission Inventory Guidebook, NPI and AP-42 available through the OECD Resource Centre for PRTR RETs at: http://www.oecd.org/env/prtr/rc.
26 Commission decision of 29/01/2004 establishing guidelines for the monitoring and reporting of greenhouse gas emissions pursuant to Directive 2003/87/EC of the European Parliament and of the Council available at: http://ec.europa.eu/environment/climat/pdf/c2004_130_en.pdf.
44

ENV/JM/MONO(2008)5
Urban Wastewater Treatment Plants < 100 000 P.E.27
Nitrogen (Ntot ), phosphorus (Ptot ) and heavy metal releases to water
It can be assumed that these releases are estimated in all countries that are parties to international marine conventions and/ or shall implement the European Union Urban Wastewater Treatment Directive 91/271/EEC.
According to the survey responses, the data are either reported by the plants based on measurements, or calculated as diffuse source releases based on statistical data and a variety of different factors.
Additional guidance for estimating releases from this sector can be found through the OECD Resource Centre for PRTR RETs28.
27 P.E. = population equivalent
28 http://www.oecd.org/env/prtr/rc.
45

ENV/JM/MONO(2008)5
Table 15. Methods used by Operators or Governments for estimating Emissions from selected Activities
4.12d Please specify the methods used by the government/operator for emission calculation/estimation for the following sectors (4 replies)
SectorNational definition / threshold
Media Substance, pollutant Description of the national method
Method from IPCC,EMEP/Corinair, AP-42, NPI…
Activity data Comments
Dry cleaning CRF/NFR 3B (under Solvent Use)
20 empl (AUS)>20 empl (JP)
Air NMVOC
Volume of solvent use + emission factors (statistics, registers) ) (BE/Brussels)Consultant (survey, technology, sector data) CANNational inventories by emission factors (AUS, US, UK)
NPI (AUS)NEI (US): facility studies to generate emission factors
Tonnes of clothes (AUS)
Waste/Off-site transfer
Spent solvents
Waste statistics (Dangerous waste register/ waste containing solvents) (BE/Brussels)US: large facilities self report based on waste amountN/A: CAN, AUS
Waste-water Solvents
Extrapolation based on sample survey (BE/Flanders)US: sewered discharges limited, not reported; direct discharges rare but captured by national reporting systemsN/A: BE/Bruxelles, CAN, AUS
Car repair >20 empl (JP)Waste/Off-site transfer
Volume of waste oil or chemicals in waste
Waste statistics (Dangerous waste register/waste oil, battery, …) (BE/Brussels and Wallonia)Data reported by the plants, calculation for diffuse sources (Spain)US: large facilities self report based on waste amountN/A: CAN, AUS
Power plants < 50 MW > 400 t of fuel/a (AUS)> 25 MW (CAN)
Air
SO2, NOx, NMVOC, CO2, PM10, NH3 (heavy metals)
Data reported by the plants, calculation for diffuse sources (CAN, BE/Flanders)Direct measurements and other RETs (AUS)Calculation of CO2 according to Spanish Real Decreto 1315/2005US: estimated by EPA based on operating and fuel data combined with emission factors UK: estimated in the national atmospheric emission inventory
AP-42 (CAN)NPI (AUS)IPCC (BE/Wallonia)
Fuel sales (CAN)Fuel consumption (AUS, BE/Flanders, US)
Reconciled with reported data (CAN)Instead of NMVOCs total VOCs + non-CO2
gases (AUS)
Pig (< 2 000 animals) and poultry (< 40 000 animals)
N/A Air NH3 Calculation and inquiries (CAN)National inventories by emission factors (AUS, US)Data reported by the plants, calculation for diffuse sources (Spain)National model (BE/Flanders)UK: estimated in the national atmospheric emission inventory
National emission factors (CAN, BE/Flanders)NPI (AUS)US: facility studies to generate emission factors
Livestock statistics (CAN, BE/Flanders)
46

ENV/JM/MONO(2008)5
Waste
Extrapolation based on sample survey (BE/Flanders)N/A: CAN, AUSUS: waste estimates may be produced as part of episodic studies
Urban wastewater treatment plants < 100 000 P.E.**
< 10 000 m3/d (CAN) Water
Ntot, Ptot,heavy metals
Data reported by the plants, Statistical data, effluent generation rate (CAN) ( PCDD, HCB and PCB /CAN)Emission factors and measurement data (AUS)Data reported by the plants (BE/Flanders)US: Facilities self-report (flow measurement and concentration)
To be improved for Stockholm convention purposes
* CRF = Common Reporting Format, source category in reporting to the UNFCCC, NFR = Nomenclature for Reporting, in reporting to the UNECE CLRTAP.
47

ENV/JM/MONO(2008)5
CHAPTER 5: CONCLUSIONS AND RECOMMENDATIONS
5.1 Contribution of SMEs to Releases and Transfers
A driving force for this study was to provide a better insight on whether systematic inclusion of SMEs in national PRTRs would improve the current knowledge of industrial pollution as a whole. Although small and medium-sized enterprises (SMEs) may not be a considerable environmental problem if reviewed individually, they can be a significant source of pollution as a whole due to their large number.
There is no accurate data available on the relative share of SMEs' contribution to total releases of hazardous chemicals and pollutants. Nevertheless, based on the information from available international and national studies, it can be concluded that SMEs in some industrial sectors, such as food and fabricated metal production, stone and clay workshops, paper and chemicals production, may have a considerable contribution to releases to air or water, or both. In fact, based on the information collected in this study, it seems that releases and transfers from SMEs are to a large extent already included in national PRTRs as point or diffuse sources.
When comparing data on releases and transfers from SMEs, attention needs to be paid to the fact that the available statistics is presented either at the establishment or enterprise level. As many establishments can belong to a larger enterprise, releases and transfers may in some cases be overestimated, if the establishments are regarded as enterprises. Unfortunately, in most cases there are no possibilities to translate the establishment data to enterprise data.
5.2 Current Inclusion of SMEs in PRTRs and other Inventories
The responses received from the survey confirmed that rather than the size of an enterprise, the environmental impact determines the reporting obligation for an SME. The facility may be required to apply for an environmental permit and to report accordingly, or it is included in those activities that must report regardless of the size of a facility. Since part of SMEs fall under these categories29, they are already included in most PRTRs. On the other hand, those countries which have SMEs in their PRTRs do not have definitive means to identify the size of enterprises, since the information to do so is not normally reported.
The releases and transfers required to be reported by environmental permits may not cover all the substances that should be reported to the PRTR. However, in some countries the reporting obligation has been widened to include also the information required by PRTRs, even without any reporting thresholds.
Those releases from SMEs, which are not included as point sources in national PRTRs, have been included in other reporting systems in some OECD countries. However, it may be that there are industrial activities, especially in the service producing sector, that are not yet included in any register or inventory. For example, within the sectors (dry cleaning, car repair shops, power plants, pig and poultry farms and urban wastewater treatment plants) that were selected for a closer review in this survey, car repair shops in Australia and pig and poultry farms in Japan are not included in any reporting system.
It is likely that releases and transfers from SMEs that are reported as diffuse source under other reporting systems, are also available to national PRTRs as diffuse source.
29 These facilities exceed the thresholds for reporting.
48

ENV/JM/MONO(2008)5
RECOMMENDATION:
OECD COUNTRIES SHOULD UNDERTAKE SURVEYS TO IDENTIFY SECTORS WHERE NONE OR ONLY SOME RELEASES AND OFF-SITE TRANSFERS FROM SMEs ARE INCLUDED IN PRTRs. ENVIRONMENTAL IMPACT OF THESE RELEASES AND TRANSFERS SHOULD BE EXAMINED AND THEIR POSSIBLE INCLUSION IN PRTRs ASSESSED.
5.3 SME Definitions
OECD countries provide guidance for defining SMEs, but the established definitions are not based on environmental criteria. The definitions are administrative or statistical, and some of them are also legally binding. The number of employees and annual turnover are the criteria applied in most countries and in most industrial sectors.
Based on this study, it can be concluded that it is not necessary to understand, compare or harmonise the different official definitions of SMEs for collecting more complete data for PRTRs, due to the fact that the official definitions are not used as a criteria for assigning SMEs a reporting requirement.
5.4 Current Practices in receiving Release and Transfer Data from SMEs
Release and transfer data from SMEs are currently collected in diverse ways in OECD countries:
1. SMEs report as point sources:
SMEs may have a reporting obligation based on an environmental permit or a PRTR Regulation. In these cases, the release estimation technique may be determined in the environmental permit of the operator or in national regulations. It may also be that the government provides technical guidance and tools (industry guidebooks, software and calculation examples), or guidance is available in international databases31. The operator is responsible for the costs of estimating the releases and transfers.
2. If SMEs are not reporting, their releases will be included in PRTRs as diffuse source data:
Estimation can be carried out by industrial associations or trade organisations for their member companies. Industry may have sector specific models and other information to produce accurate information on releases. National studies or information in the international databases31 may be used. The industry is responsible for the costs of estimating the releases and transfers.
Releases from the SMEs that are not reported as point sources can be estimated on behalf of SMEs in the context of national data systems used for calculation of national release inventories, as these data systems may include source data at facility or process level. However, as only data reported by the facility can be included as point source data in PRTRs, the results from calculation on behalf of a facility can only be included as diffuse source data. The calculation may also be based on national statistical data or on special surveys among SMEs. National studies or information in international databases31 may also be used.
49

ENV/JM/MONO(2008)5
The costs of including SMEs in the calculation of diffuse sources may not increase considerably the costs incurred for the regular work on existing register/inventory systems, provided that large changes or extensions in the existing register/inventory system are not needed. However, calculation methods to be used in the inventory/register systems need to be developed and documented, unless they are already part of the existing system. In case additional surveys need to be carried out, additional resources of 3 to 24 months, or more, 30 maybe needed, depending on the number of SMEs to be addressed and the number of substances to be included in the calculation systems. When the calculation system has been established, the data collection procedure still needs to be updated regularly (e.g. annually or at least every fifth year).
Estimation of releases and transfers from SMEs as diffuse source can be outsourced by the government, but it will still be responsible for the costs of this work. The total costs will largely depend on the number of SMEs and the number and type of pollutants/substances/chemicals to be included in the PRTR.
According to the survey responses, it is not possible to separate the resources needed to obtain information on releases and transfers from large enterprises and SMEs, as the size is not a factor that determines the reporting obligation. The resources needed by authorities to compile registers and/or inventories depend on how the data is acquired, e.g. on the calculation mode (point vs. diffuse source) or the reporting mode (paper vs. electronic), rather than on the facility size.
The SMEs, which are currently not reporting to national PRTRs, are probably rather numerous. For instance, in Europe the number of industrial facilities, which will need to report, may double in the next few years, when the European PRTR will be implemented. In addition, SMEs normally have limited capacity to report and they may not be well aware of their releases and transfers. Therefore, their reports may contain data, which is of lower quality than in the case when these releases and transfers would have been estimated by the government with diffuse source methodologies. If countries would like to include more SMEs in their PRTRs, they may wish to carefully consider which SMEs should report their releases and transfers to PRTRs as point sources and which ones governments should estimate as diffuse sources, since the resource requirements may differ considerably between the options where all SMEs are reporting and where the SMEs are partly treated as diffuse sources. Increasing the know-how of smaller SMEs in estimating releases and transfers, managing the related documentation and keeping records is considered as a long-term challenge.
In many countries information of total releases and transfers already exists based on inventories prepared for reporting to the international conventions (such as UNFCCC, UNECE CLRTAP, EU Water Framework Directive, IEA, Eurostat). This data can be used in PRTRs. Mandatory reporting under the environmental permits can also be connected to reporting to PRTRs.
RECOMMENDATION:
WHEN CONSIDERING THE INCLUSION OF ADDITIONAL RELEASES AND OFF-SITE TRANSFERS FROM SMEs IN PRTRs, ASSOCIATED COSTS SHOULD BE OPTIMISED BY DETERMINING THE MAXIMUM NUMBER OF SMEs THAT WILL BE REQUIRED TO REPORT INDIVIDUALLY AND THE REMAINING RELEASES AND TRANSFERS FROM SMEs BE INCLUDED IN PRTRs AS DIFFUSE SOURCES.
30 Based on experiences from practical inventory work.
50

ENV/JM/MONO(2008)5
5.5 Identification of Partnerships
Establishment of programmes inside industry sectors to raise the awareness of SMEs of their releases and transfers are seen as useful for the purposes of the industry as a whole. In many countries this kind of activities are already in place. The work can be carried out nationally or regionally with neighbouring countries. Also international industry associations have expressed interest to contribute actively to this work. As the development of reliable release estimation techniques requires organisation of large-scale sampling and measuring, it would be beneficial if the work could be undertaken in partnership with other similar facilities. Also cost-sharing would be beneficial for the facilities as the number of substances and chemicals to be reported to PRTRs is large and the costs of measurements can be high.
When estimating releases and transfers from SMEs that do not report individually, governments could use data or estimation tools applied to the similar activity in other areas, or even in neighbouring countries. However, when applying data or tools from other areas or countries, correspondence between the activities should be verified, as only data or tools applied to similar activities can be used. The reason is that processes of especially the small- and micro-sized enterprises can sometimes be rather specific.
Countries may already have release and transfer data under other reporting systems and environmental statistics. It is beneficial for all the systems that the same data is applied in all reporting, to the extent possible. For instance, the part of SMEs that do not report as point sources, can be included in PRTRs as diffuse sources by using release data already available in inventories submitted to the United Nations' Convention on Long-Range Transboundary Air Pollution and to the Framework Convention on Climate Change. However, these Conventions require reporting of only part of the substances to be reported to PRTRs.
Also national wastewater discharge inventories31 and waste statistics as top-down inventories32 can be used for the estimation of some releases from SMEs as diffuse sources.
International organisations, such as IPCC33 and EMEP34, maintain and develop release estimation techniques for emissions to air. Also material from the organisations35 developing emission scenarios can be applied to estimation of releases and transfers from SMEs. The methodologies are mainly industrial sector-specific, but may for certain sectors include detailed methodologies for different types of installations.
RECOMMENDATION:
OECD COUNTRIES SHOULD IDENTIFY SOURCES FOR WHICH CURRENTLY THERE ARE NO RELEASE ESTIMATION TECHNIQUES AVAILABLE AND SEEK CO-OPERATION WITH OTHER COUNTRIES OR INTERNATIONAL ORGANISATIONS TO FURTHER DEVELOP APPLICABLE METHODOLOGIES.
31 E.g. the Technical Guidance Manual prepared by the European Chemicals Bureau contains methods to estimate wastewater discharges (http://ecb.jrc.it/tgd/)
32 Top-down inventory = the data is estimated from aggregated national data (e.g. statistics)
33 Intergovernmental Panel on Climate Change
34 Co-operative programme for monitoring and evaluation of the long range transmission of air pollutants in Europe.
35 IIASA (International Institute for Applied Systems Analysis, http://www.iiasa.ac.at/ ) and the European Chemicals Bureau (http://ecb.jrc.it/tgd/).
51

ENV/JM/MONO(2008)5
5.6 Recommended Mode of SME Inclusion in PRTRs
According to the survey responses, SMEs in the energy sector, production and processing of metals, mineral industry, chemical industry, waste and wastewater management, paper and wood production and processing, as well as manufacturing of animal and vegetable products in the food production sector, are mainly reported to PRTRs as point sources. However, it is obvious that releases from very small units in these sectors (e.g. power plants < 5 MW)36 are reported as diffuse sources. SMEs are reported either as point or diffuse sources in the intensive livestock production, aquaculture and service-producing sector.
In national emission inventories, SMEs are often treated as diffuse sources for practical reasons, in order to make the work load of authorities compiling registers/inventories reasonable. In fact, authorities could decide the maximum number of point sources from which emissions must be reported individually. The rest of the emission sources are treated as diffuse sources.
SMEs having considerable impact on the environment are generally included in PRTRs as point sources, due to the reporting requirements in the environmental permits or in the PRTR reporting guidelines. The releases of SMEs not reported as point sources can easily be included in PRTRs as diffuse sources, for those substances/compounds/chemicals that are included in other inventory systems, where national total emissions are estimated.
The UNECE PRTR Protocol and the European PRTR Regulation include a legally binding obligation to collect and disseminate data of releases from diffuse sources.
RECOMMENDATION:
TO COVER THE REMAINING RELEASES AND OFF-SITE TRANSFERS FROM SMEs, DIFFUSE SOURCES SHOULD BE INCLUDED IN NATIONAL PRTRs.
36 E.g. in Canada with fuel use of < 10 000 BTU/hour capacity or if emissions do not meet the threshold of the NPRI. In Australia power plants < 50 MW are reported both as point and diffuse sources (threshold was not given in the reply by Australia).
52
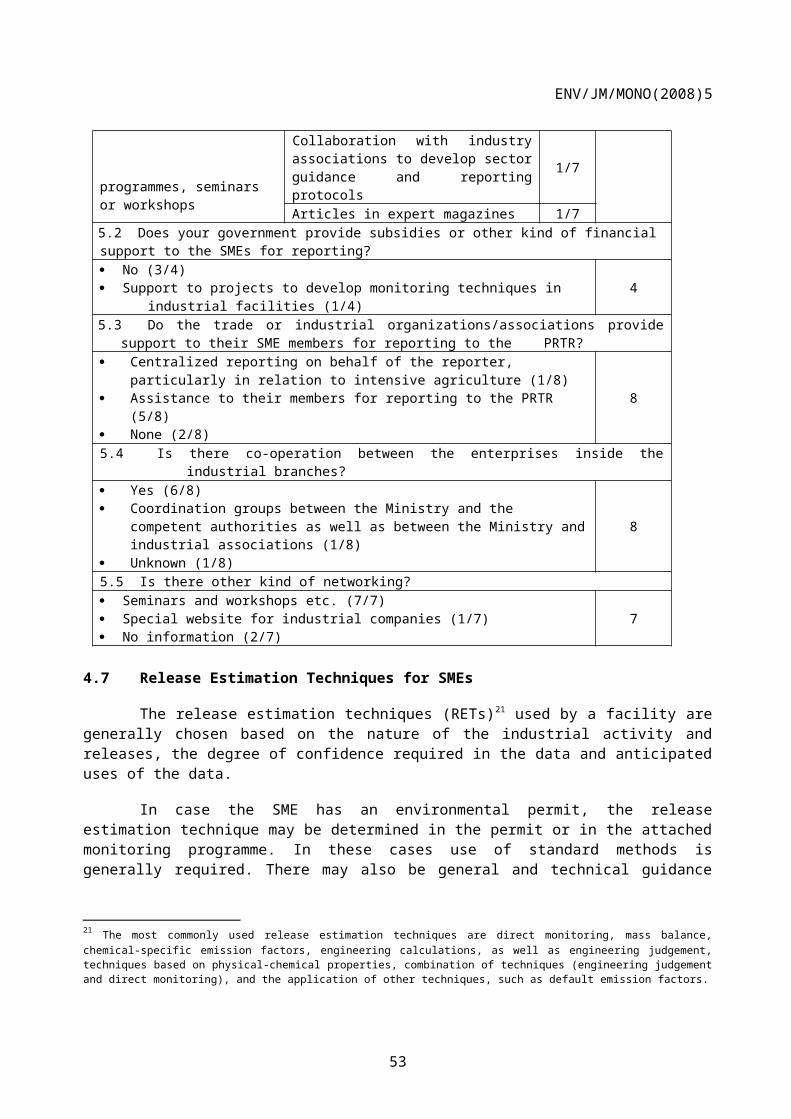
ENV/JM/MONO(2008)5
REFERENCES
Alberta Government (2006), Environment, Small and Medium-sized Enterprises (SMEs), http://www3.gov.ab.ca/env/waste/pprevention/sme.html.
Alikhan, S. (2005), Statement on behalf of the world association for small and medium enterprises (WASME) at the 40th series of meetings of assemblies of member states of WIPO, Geneva, 26.09.2005, http://www.wasmeinfo.org/state_wipo_geneva.htm.
Confederation of Indian Industry, Definition of Small Industry in Various Countries,http://www.ciionline.org/Services/112/Images/defsme.pdf.
DG ENTR (2004), Public Policy Initiative to Promote the Uptake of Environmental Management Systems in Small and Medium-Sized Enterprises, Final Report of the BEST Project Expert Group, 01/2004, European Commission, Brussels,http://www.stenum.at/download/EU%20policy%20EMS%20for%20SMEs.pdf.
EC (2003), Commission Recommendation (2003/361/EC) of 6 May 2003 concerning the definition of micro, small and medium-sized enterprises, OJ, L124/36, 20.5.2003, p.36,http://ec.europa.eu/enterprise/enterprise_policy/sme_definition/index_en.htm.
EC (2006), Annex II of the Regulation No 166/2006 of the European Parliament and the Council of 18 January 2006, http://www.eper.ec.europa.eu/eper/documents/E-PRTR%20Regulation.pdf.
Environmental Agency, SEPA, EHS Northern Ireland and the Small Business Service (2002), How green are small businesses?, A snapshot of environmental awareness and practice in small and medium-sized enterprises (SMEs), NetRegs Benchmarking Survey of Environmental Awareness, http://www.netregs.gov.uk/commondata/acrobat/nrbs2002.pdf#search=%22energy%20consumption%20small%20firms%22.
Mayers, J. (2006), “Small and medium-sized forestry enterprises”, ITTO Tropical Forest Update, 16/2:10-11.
National Competitiveness Council (1999), “6 Small and Medium-sized Enterprises (SMEs)” in Annual Competitiveness Report 1999, http://www.forfas.ie/ncc/reports/ncc99/smes.htm.
NPI Guide, National Pollutant Inventory, Guide to reporting. Australia,http://www.npi.gov.au/handbooks/guidetoreporting.html.
NPRI Substance lists, National Pollutant Release Inventory, Canada,http://www.ec.gc.ca/pdb/npri/npri_si_e.cfm.
OECD (2001), SMEs and Environmental Management, 17th Session, Working Party on Small and Medium-Sized Enterprises. (Not published)
OECD (2002), OECD Small and Medium Enterprise Outlook, OECD, Paris.
53

ENV/JM/MONO(2008)5
OECD (2003), Resource Compendium of PRTR Release Estimation Techniques, Part 2: Summary of Diffuse Source Techniques, ENV/JM/MONO(2003)14, http://www.olis.oecd.org/olis/2003doc.nsf/LinkTo/env-jm-mono(2003)14.
OECD (2005), Framework for Selecting and Applying PRTR Release Estimation Techniques,ENV/JM/MONO(2005)18, OECD, Paris,http://www.oecd.org/department/0,3355,en_2649_34411_1_1_1_1_1,00.html.
Otsuki, M. (2002), SMEs Supporting Systems in Saudi Arabia, Presentation 15 October, 2002, http://www.planning.gov.sa/PLANNING/ALL%20PAPERS/DAY3/Small%20and%20Medium%20Enterprises/SME%20Development%20in%20Saudi%20Arabia/SME%20Development%20in%20Saudi%20Arabia.doc.
PI Schedule, Pollutant Inventory, England and Wales, http://www.environment-agency.gov.uk/business/444255/446867/255244/255276/?version=1&lang=_e.
SMI Newsletter (2003), “GHG Emission Estimation for Indian Tea Sector”, SMI, Small and Medium Scale Industries (SMIs) in Asia: Energy, Environment and Climate Interrelations, 5(2):1-3.Thas, O. A. Bezegh, J.P. Ottoy (2003), Quality aspects in waste statistics.
TRI Chemicals, Toxics Release Inventory, US, http://www.epa.gov/tri/chemical/index.htm.
UNEP (2001), State of the Environment: South Asia 2001, UNEP, Thailand, http://www.rrcap.unep.org/reports/soe/sa_cover.pdf.
UNITAR (1998), “Guidance on estimating non-point source emissions”, UNITAR Series of PRTR Technical Support Materials, No.3, UNITAR, Geneva,http://www.unitar.org/cwg/publications/cw/prtr/prtr_en/prtr_tech_support_3_nov2003.pdf.
Vettori, A. (2006), European systainability policy: key elements and drivers. EBC Annual Congress, Edinbourgh 20.10.2006, http:// ww.eubuilders.org/DOC/Misc/1%20-%20Andrea%20Vettori.ppt .
54

ENV/JM/MONO(2008)5
SUPPORTING LITERATURE
Dhakal, S. (2004), Urban energy use and greenhouse gas emissions in Asian mega-cities - Policies for sustainable future, Urban Environmental Management Project of the Institute for Global Environmental Strategies (IGES), Japanhttp://www.globalcarbonproject.org/meetings/2004/urban%20development%20meeting/megacitiesasia&ghgs.iges2004.pdf#search=%22Success%20in%20Controlling%20SOX%20emissions%20in%20Kitakyushu%2C%20Japan%22
EC (2006), Guidance Document for the Implementation of the European PRTR http://www.eper.cec.eu.int/eper/documents/E-PRTR_GD-060606_FIN.pdf.
EC (2007), European PRTR Homepage on Releases from Diffuse sources, http://www.bipro.de/__prtr/index.htm.
ECOTEC (2000), Report on SMEs and the Environment, European Commission, Directorate General Environment http://ec.europa.eu/environment/sme/pdf/smestudy.pdf.
IGES (Institute for Global Environmental Strategies) (2003), 3.5.2. Improving environmental performance of small and medium-sized enterprises (SMEs), pp. 257-276.
LINDNER, A. (2004), SME statistics: towards more systematic statistical measurement of SME behaviour, Department of Economic and Social Affairs, Statistic Division, United Nationshttp://unstats.un.org/unsd/industry/meetings/eg2005/AC105-22.PDF.
OECD (1997), Pollutant release and transfer registers (PRTRs): A Tool for Environmental Management and Sustainable Development, OECD, Paris http://www.oecd.org/dataoecd/36/32/2348006.pdf.
OECD (2002), Resource Compendium of PRTR Release Estimation Techniques, Part 1: Summary of Point Source Techniques, ENV/JM/MONO(2002)20, OECD, Parishttp://www.olis.oecd.org/olis/2002doc.nsf/43bb6130e5e86e5fc12569fa005d004c/b3697d5137c6db14c1256c07003623a8/$FILE/JT00130099.PDF.
UNITAR (1998), “Guidance for facilities on PRTR data estimation and reporting” , UNITAR series of PRTR Technical Support Materials, No. 2, UNITAR, Geneva,http://www.unitar.org/cwg/publications/cw/prtr/prtr_en/prtr_tech_support_2_nov2003.pdf.
55

ENV/JM/MONO(2008)5
ANNEX 1: QUESTIONNAIRE
QUESTIONNAIRE ON THE INCLUSION OFSMALL AND MEDIUM-SIZED ENTERPRISES IN NATIONAL PRTRS
The OECD Task Force on PRTRs decided at its 7 th meeting on 21-23 June 2004 to include a scoping study on SMEs in the 2005-2008 work programme. Further, it was decided at the 9 th
meeting of the Task Force, 21-23 March 2006, to undertake a survey on the inclusion of SMEs in the national PRTRs.
The purpose of this questionnaire is to collect relevant information for the scoping study on SMEs from the OECD member countries. The questionnaire is sent to members of the Task Force on PRTRs.
Any other comments, experiences, concerns and thoughts related to the inclusion of SMEs in PRTRs. Space for your additional views has been reserved after each group of questions.
SCHEDULE FOR THE SURVEY
The survey is carried out in November 2006 and the responses from member countries will be analysed and summarised in the scoping study report which will be delivered to the OECD Task Force on PRTRs by mid 2007.
CONTACT INFORMATION
Please provide your contact information, since in addition to your written response we may need to interview you by telephone to get your views on certain specific questions.
Your name:Your organisation: Your country:Your e-mail address: Your telephone number:
56

ENV/JM/MONO(2008)5
1. DEFINITION OF SMEs IN YOUR COUNTRY
1.1 Do you have a definition for SMEs in your country?
Yes No The development of the definition is in progress
1.2 Is the definition legally binding?
Yes No
1.3 What are the thresholds for SMEs in your country for each of the listed sector:
Sector
Totalnumber of
employees:e.g. 250
employees
Number ofemployee
hours worked per
yeare.g. 2 000 h
Annual turnovere.g. € 50 million
Annual balance-sheet
totale.g. € 40 million
Production volume
e.g.20 tonnes per
day
OtherPlease, give the
threshold
Energy sectorProduction and processing of metalsMineral industryChemical industryWaste and wastewater managementPaper and wood production and processingIntensive livestock production and aquacultureAnimal and vegetable products from the food and beverage sectorService-producing sector (e.g. dry cleaners, car repair shops)Other activities Please, specify:
1.4 Do you have other kind of guidance for defining SMEs?
No Yes, please specify
57

ENV/JM/MONO(2008)5
58

ENV/JM/MONO(2008)5
1.5 Additional observations on the definition of SMEs
59

ENV/JM/MONO(2008)5
2. GENERAL QUESTIONS ON SMEs and PRTRs
2.1 Has your country established a national PRTR?
YesNoThe work is underway
2.2 Are SMEs included in your national PRTR?
YesNoThe work is underway
2.3 Please, tick with x in the table below both those industrial branches of SMEs that are included in the national PRTR and those that are currently included in different national emission inventories:
Sector PRTR Air emissioninventories
Wastewaterinventories
Waste reporting
Energy sectorProduction and processing of metalsMineral industryChemical industryWaste and wastewater managementPaper and wood production and processingIntensive livestock production and aquacultureAnimal and vegetable products from the food andbeverage sectorService-producing sector (e.g. dry cleaners, car repair shops)Other activities, please, specify:
2.4 In case the SMEs are not included in the PRTR, does your country have any plans to include them?
YesNo
In case you would like to provide more information about specific studies on inclusion of SMEs in PRTRs, please, provide more details or references under point 2.8.
2.5 Can you give an estimate of resources needed for the PRTR agency for obtaining the information of releases and transfers from the SMEs in your PRTR?
Annual financial resources per capita (please include the monetary unit) ________________ Annual working hours ________________________________________________
2.6 How do you get information on the SMEs that are included in the reporting? (you may tick several sources)
from municipal authorities from trade register from national statistics from trade organizations by inquiries to the SMEs other; please, specify:
60

ENV/JM/MONO(2008)5
2.7 Which reporting mode do you have for the SMEs?
as diffuse source as point source as point/diffuse source depending on the industrial branch in question.
Please, tick with x each of the listed sector in the table below indicating whether the SME sector is reported as a point or diffuse source.
Sector Point source Diffuse source
Energy sector
Production and processing of metals
Mineral industry
Chemical industry
Waste and wastewater managementPaper and wood production and processingIntensive livestock production and aquacultureAnimal and vegetable products from the food and beverage sectorService-producing sector (e.g. dry cleaners, car repair shops)Other activities, please specify:
2.8 Other general observations on the inclusion of SMEs in PRTRs
61

ENV/JM/MONO(2008)5
3. LEGAL BACKGROUND FOR REPORTING
3.1 Are there any legal obligations in your country for an SME to report releases and/or transfers to the national PRTR system?
Yes No
3.2 Specification of the legal background
62

ENV/JM/MONO(2008)5
4. REPORTING OF EMISSIONS FROM SMEs TO THE NATIONAL PRTR
4.1 Is the reporting on SMEs to the national PRTR
mandatory voluntary annual other frequency, please specify:
4.2 In case the emission data are delivered by the SMEs themselves, to whom do the SMEs send their emission reports?
the PRTR agency the supervising authority other; please specify:
For which SME sectors this might be the case?
4.3 In case the emission data are estimated on behalf of the SMEs by authorities, are the data based on
statistical data emission factors other; please specify:
For which SME sectors this might be the case?
4.4 Does the reporting on SMEs to PRTR cover:
releases to air releases to water releases to soil transfers to wastewater treatment plants transfers of waste off-site for treatment
4.5 Is the reporting on off-site waste transfers from SMEs to the national PRTR
chemical specific waste specific
4.6 Are there chemical specific reporting thresholds for SMEs in the national PRTR?
yes no
4.7 Are the chemical specific reporting thresholds the same for SMEs as for large installations?
yes no, please fill in the table under point 4.10
63

ENV/JM/MONO(2008)5
4.8 Give an estimate of the approximate share of emissions reported as point sources as % of all emissions from SMEs that are included in your national PRTR. As this may differ between the different releases, you are invited to complete the table for each relevant chemical. If more than one table is needed, please provide the additional responses in Annex1.
Sector Point source (%)
Percentageunknown
Energy sector
Production and processing of metals
Mineral industry
Chemical industry
Waste and wastewater managementPaper and wood production and processingIntensive livestock production and aquacultureAnimal and vegetable products from the food and beverage sectorService-producing sector (e.g. dry cleaners, car repair shops)Other activities, please specify:
64

ENV/JM/MONO(2008)5
4.9 Which chemicals, from which sources and to which destination are covered in the reporting of SMEs? Indicate the destination in the cells below by the following letters: A = air, W = water, S = soil, P = wastewater treatment plant.
CAS-number Substance
Ener
gy s
ecto
r
Prod
uctio
n an
d pr
oces
sing
of m
etal
s
Min
eral
indu
stry
Chem
ical in
dust
ry
Was
te a
nd w
aste
wate
r m
anag
emen
t
Pape
r and
woo
d pr
oduc
tion
and
proc
essin
gIn
tens
ive liv
esto
ck
prod
uctio
n an
d aq
uacu
lture
Anim
al a
nd v
eget
able
pr
oduc
ts fr
om th
e fo
od
and
beve
rage
sec
tor
Serv
ice-p
rodu
cing
sect
or
Oth
er a
ctivi
ties
Methane (CH4)Carbon monoxide (CO)Carbon dioxide (CO2)Hydro-fluorocarbons (HFCs)Nitrous oxide (N2O)Ammonia (NH3)Non-methane volatile organic compounds (NMVOC)Nitrogen oxides (NOx/NO2)Perfluorocarbons (PFCs)Sulphur hexafluoride (SF6)Sulphur oxides (SOx/SO2)Hydrochlorofluorocarbons (HCFCs)Chlorofluorocarbons (CFCs)HalonsArsenic and compounds (as As)Cadmium and compounds (as Cd)Chromium and compounds(as Cr)Copper and compounds (as Cu)Mercury and compounds (as Hg)Nickel and compounds (as Ni)Lead and compounds (as Pb)Zinc and compounds (as Zn)AldrinChlordaneChlordeconeDDT1,2-dichloroethane (EDC)Dichloromethane (DCM)DieldrinEndrinHeptachlorHexachlorobenzene (HCB)1,2,3,4,5, 6 -hexachlorocyclohexane (HCH)LindaneMirexPCDD + PCDF (dioxins + furans) (as Teq)PentachlorobenzenePentachlorophenol (PCP)Polychlorinated biphenyls (PCBs)Tetrachloroethylene (PER)Tetrachloromethane (TCM)Trichlorobenzenes (TCBs) (all isomers)1,1,1-trichloroethane1,1,2,2-tetrachloroethaneTrichloroethyleneTrichloromethaneToxapheneVinyl chlorideAnthraceneBenzeneEthylene oxideNaphthaleneDi-(2-ethyl hexyl) phthalate (DEHP)Polycyclic aromatic hydrocarbons (PAHs)Chlorine and inorganic compounds (as HCl)AsbestosFluorine and inorganic compounds (as HF)Hydrogen cyanide (HCN)Particulate matter (PM10)HexabromobiphenylOther, please specify
4.10 In case there are chemical specific reporting thresholds for reporting on SMEs, please give the
65

ENV/JM/MONO(2008)5
thresholds (as kg/a) in the table below. (The list presented below is taken from Annex II of the Regulation (EC) No 166/2006 of the European Parliament and the Council of 18 January 2006 and you are invited to stretch the list according to your national substance list.)
CAS-nr Pollutant Threshold for releases
To air (kg/a) To water (kg/a) To soil (kg/a)
Methane (CH4)Carbon monoxide (CO)Carbon dioxide (CO2)Hydro-fluorocarbons (HFCs)Nitrous oxide (N2O)Ammonia (NH3)Non-methane volatile organic compounds (NMVOC)Nitrogen oxides (NOx/NO2)Perfluorocarbons (PFCs)Sulphur hexafluoride (SF6)Sulphur oxides (SOx/SO2)Hydrochlorofluorocarbons (HCFCs)Chlorofluorocarbons (CFCs)HalonsArsenic and compounds (as As)Cadmium and compounds (as Cd)Chromium and compounds(as Cr)Copper and compounds (as Cu)Mercury and compounds (as Hg)Nickel and compounds (as Ni)Lead and compounds (as Pb)Zinc and compounds (as Zn)AldrinChlordaneChlordeconeDDT1,2-dichloroethane (EDC)Dichloromethane (DCM)DieldrinEndrinHeptachlorHexachlorobenzene (HCB)1,2,3,4,5, 6 -hexachlorocyclohexane (HCH)LindaneMirexPCDD + PCDF (dioxins + furans) (as Teq)PentachlorobenzenePentachlorophenol (PCP)Polychlorinated biphenyls (PCBs)Tetrachloroethylene (PER)Tetrachloromethane (TCM)Trichlorobenzenes (TCBs) (all isomers)1,1,1-trichloroethane1,1,2,2-tetrachloroethaneTrichloroethyleneTrichloromethaneToxapheneVinyl chlorideAnthraceneBenzeneEthylene oxideNaphthaleneDi-(2-ethyl hexyl) phthalate (DEHP)Polycyclic aromatic hydrocarbons (PAHs)Chlorine and inorganic compounds (as HCl)AsbestosFluorine and inorganic compounds (as HF)Hydrogen cyanide (HCN)Particulate matter (PM10)HexabromobiphenylOther, please specify
66

ENV/JM/MONO(2008)5
4.11 Additional observations on reporting
67

ENV/JM/MONO(2008)5
5. SUPPORTING MATERIAL AND TOOLS
5.1 Does your government provide technical support to the SMEs for reporting to the PRTR?
Guidance manuals / industry handbooks
General guidance on reporting General guidance on the estimation of releases Sector specific guidance on release estimation techniques
Energy sector Production and processing of metals Mineral industry Chemical industry Waste and wastewater management Paper and wood production and processing Intensive livestock production and aquaculture Animal and vegetable products from the food and beverage sector Service-producing sector (e.g. dry cleaners, car repair shops) Other activities, please specify
Is the information available
on a website as published material on request other, please specify
Does your government provide any personal assistance to the SMEs for their reporting?
Local technical assistance centers Plant visits Telephone service Other assistance; please, specify:
Does your government organize
Demonstration programmes, seminars or workshops. Specify the overall subject ofthese activities. How often and for which industries these activities are organized?
Other assistance; please specify:
5.2 Does your government provide subsidies or other kind of financial support to the SMEs for their reporting to the PRTR?
subsidies other kind of financial support; please specify:
5.3 Do the trade or industrial organizations/associations provide support to their SME members for reporting on releases and transfers to the PRTR?
No Yes, please specify:
68

ENV/JM/MONO(2008)5
5.4 Is there co-operation between the enterprises inside the industrial branches?
No Yes, please specify:
5.5 Is there other kind of networking?
No Yes, please specify:
5.6 In case the SME has an environmental permit, the release estimation technique may be determined in the permit or in the attached monitoring programme.
For which industrial sectors and releases this might be the case?
Sector The release estimation technique is determined in the permit/monitoring programme for the following substances
Energy sector
Production and processing of metalsMineral industry
Chemical industry
Waste and wastewater managementPaper and wood production and processingIntensive livestock production and aquacultureAnimal and vegetable products from the food and beverage sectorService-producing sector (e.g. dry cleaners, car repair shops)Other activities, please specify:
5.7 Additional observations on material and tools
69

ENV/JM/MONO(2008)5
6. PROPOSED ACTIVITIES
6.1 You are invited to propose work items and activities for the OECD to support member countries to obtain better information on releases and transfers from SMEs for national PRTRs.
70

ENV/JM/MONO(2008)5
7. FURTHER VIEWS ON THE ROLE OF SMEs IN NATIONAL PRTRs
You are invited to give your additional views below.
71

ENV/JM/MONO(2008)5
APPENDIX 1 of the Questionnaire
Give an estimate of the approximate share of emissions reported as point sources as % of all emissions from SMEs that are included in your national PRTR. As this may differ between the different releases, you are invited to complete the table for each relevant chemical.
Sector Point source (%)
Percentageunknown
Energy sector
Production and processing of metals
Mineral industry
Chemical industry
Waste and wastewater managementPaper and wood production and processing
Intensive livestock production and aquaculture
Animal and vegetable products from the food and beverage sector
Service-producing sector (e.g. dry cleaners, car repair shops)
Other activities, please specify:
72

ENV/JM/MONO(2008)5
ANNEX 2: ADDITIONAL QUESTION
QUESTIONNAIRE ON THE INCLUSION OFSMALL AND MEDIUM-SIZED ENTERPRISES IN NATIONAL PRTRS
The OECD Task Force on PRTRs decided at its 7 th meeting on 21-23 June 2004 to include a scoping study on SMEs in the 2005-2008 work programme. Further, it was decided at the 9 th
meeting of the Task Force, 21-23 March 2006, to undertake a survey on the inclusion of SMEs in the national PRTRs. At the 10th meeting of the Task Force, February 2007, it was decided to resend the questionnaire, due to the fact that only a limited number of replies were received thus far, and amend the form with an additional question.
The purpose of this questionnaire is to collect relevant information for the scoping study on SMEs from the OECD member countries. The questionnaire is sent to members of the Task Force on PRTRs. However, if you are not the right person to respond to this questionnaire, please kindly forward it to the correct recipient.
We would also appreciate any other comments, experiences, concerns and thoughts related to the inclusion of SMEs in PRTRs. Space for your additional views has been reserved after each group of questions.
The original questionnaire (Annex 1) is recirculated due to the limited number of responses received during the first survey carried out in November 2006.
An additional question (number 4.12a-d ) has been added to retrieve more detailed information on the RETs applied to certain activities. In case you have already replied to this questionnaire during the first round, you are only asked to reply to the new question No. 4.12 (a-d).
SCHEDULE FOR THE SURVEY
The survey is carried out in April 2007 and the responses from member countries will be analysed and summarised in the scoping study report, which will be delivered to the OECD Task Force on PRTRs by mid 2007.
CONTACT INFORMATION
Please provide your contact information, since in addition to your written response we may need to interview you by telephone to get your views on certain specific questions.
Your name:Your organisation: Your country:Your e-mail address: Your telephone number:
73

ENV/JM(2008)8
4.12a Do you compile information in your PRTR or in other reporting systems of the releases and off-site transfers from facilities within the following sectors (please, tick with “X”)
Sector PRTR OTHER REPORTING SYSTEM
YES NO YES NODry cleaningCar repairPower plants < 50 MW*Pig (< 2 000 animals) and poultry (<40 000 animals) farms *Urban wastewater treatment plants < 100 000 P.E*
* The aim of the questions 4.12a-d is to collect information of how the OECD countries estimate and report emissions from SMEs under the selected industry branches. The given thresholds refer to the size of activities that are under the scope of this study. Countries are invited to provide their national thresholds under questions 4.12c and 4.12d. The information of the various thresholds applied in the OECD countries for SMEs will be documented in the final report on SMEs.
4.12b In case of NO, are you planning to do this in the future
YES NO
4.12c How is the information reported?
Sector
Reported as a point source
If you have a national threshold for reporting these activities as point sources (e.g. > 5MW for power plants), please indicate also this threshold below.
Reported as a diffuse source
Dry cleaning
Car repair
Power plants < 50 MW
Pig (< 2 000 animals) and poultry (<40,000 animals) farms
Urban wastewater treatment plants < 100 000 P.E
This is difficult to answer but, where there are data reported the data are figures based on Sweden as whole and estimated with emission factors and activity data.
74

ENV/JM(2008)8
4.12d Please specify the methods used by the government/operator for emission calculation/estimation for the following sectors (** Other country specific capacity thresholds could be relevant and should be indicated)
Sector
Definition of the sector (e.g. national threshold)
Media Substance, pollutant
If a national method/emission factor was used, please, give description of the method and give the national emission factor (for WWTPs indicate also the codes of CEN or ISO standards used in the measurements)
If the method is from one of the following guidebooks, please indicate from which: IPCC,EMEP/Corinair, AP-42, NPI, Other (which, please describe)
Activity data (please describe, e.g. fuel consumption, production volume, animal number)
Additional data and comments
Dry cleaning CRF/NFR* 3B (under Solvent Use)
Car repair
Power plants < 50 MW (CRF/NFR 1A2 and 1A4 under Energy)**
Pig (< 2 000 animals) and poultry (< 40 000 animals) CRF/NFR 4B8 and 4B9 under Agriculture**
SectorAdditional data and comments
Urban wastewater treatment plants < 100 000 P.E**
* CRF = Common Reporting Format, source category in reporting to the UNFCCC, NFR = Nomenclature for Reporting, source category in reporting to the UNECE CLRTAP. NPI = Australian PRTR
75

ENV/JM/MONO(2008)5
ANNEX 3: SME DEFINITIONS
SME Definitions in OECD Countries (according to information from the responses to the questionnaire, and from the literature).
Australia
According to the Australian Bureau of Statistics (ABS) the definition for SMEs’ includes small enterprises that employ less than 20 people and medium-sized enterprises that employ more than 20 but less than 200 employees.
Canada
In Canada, the threshold for an enterprise regarded as an SME is 100 employees for goods-producing small firms and 50 employees for service-producing small firms. Medium-sized enterprises have up to 499 employees. Micro enterprises are defined as firms that have fewer than five employees.
Czech Republic
The definition for SMEs in the Czech Republic equals that of the EU37.
Denmark
In Denmark the threshold for an SME is less than 250 employees or a turnover of 32 million euros or an annual balance sheet total of 15 million euros. The definition for SMEs in the Danish Account Act (Årsregnskabsloven, 2003) corresponds to the European Union Commission Recommendation as well as to the Fourth Council Directive 78/660/EEC of 25 July 1978 based on Article 54 (3) (g) of the Treaty, regarding the annual accounts of certain types of companies, for the threshold of the annual turnover and balance sheet.
European Union
In the European Union, Commission Recommendation 2003/361/EC Article 2 of the Annex provides guidance for defining the thresholds for staff headcount and financial ceilings. According to the definition, enterprises employing less than 250 persons or having an annual turnover not exceeding 50 million euros, and/or an annual balance sheet total not exceeding 43 million euros, are regarded as SMEs.
Furthermore, within the SME category, the threshold between the small and medium-sized enterprises is set to an employee number of 50 persons or an annual turnover and/or annual balance sheet total not exceeding 10 million euros. According to the determination, a micro-enterprise employs fewer than 10 persons having an annual turnover and/or annual balance sheet total not exceeding 2 million euros.
Finland
The definition for SMEs in Finland equals that of the EU.
37 EC (2003), Commission Recommendation of 6 May 2003 concerning the definition of micro, small and medium-sized enterprises (2003/361/EC), OJ L 124: 36-41 (20.5.2003).
76

ENV/JM/MONO(2008)5
France
The definition for SMEs in France equals that of the EU.
Hungary
The Hungarian definition for SMEs equals that of the EU.
Japan
In Japan, the threshold for an enterprise regarded as an SME is 50 employees for the retail trade sector, for the wholesale trade and service sector 100 employees and for the manufacturing industry and other sectors the threshold is 300 employees.
Norway
SMEs in Norway are classified according to the threshold of 50 employees. The inclusion of a facility into the Norwegian PRTR system is based upon the need of a permit to perform the polluting activities of the facility, regardless of the size of the facility. The inclusion of an enterprise into the PRTR system is solely based on the potential pollution from this enterprise.
Poland
In Poland work to select the criteria and to develop the official SME definition is in progress (as assumptions, the threshold for a small enterprise would be 50 employees and for a medium-sized enterprise 250 employees).
Slovak Republic
In the Slovak Republic small enterprises are those having 1-24 employees and medium-sized those having 25-500 employees.
Spain
The definition in Spain equals to that of the EU.
Sweden
The definition in Sweden equals to that of the EU.
United Kingdom
The Department of Trade and Industry in the UK uses definition criteria of 0-9 employees to micro sized enterprises, 0-49 employees to small firms (the definition includes micro enterprises), 50-249 employees to medium firms and over 250 employees to large firms. However, in practice, schemes, which are nominally targeted at small firms, adopt a variety of working definitions depending on their particular objectives.
United States
The United States do not categorize SMEs into small, medium or micro sized enterprises. The Small Business Administration (SBA) defines an SME as an enterprise that is independently owned and operated and which is not dominant in its field of operation.
77

ENV/JM/MONO(2008)5
SME Definitions in selected non-OECD Countries
Country Employee thresholds
Financial thresholds Comments
Albania Small: 10-40Medium: 50-250
Azerbaijan Definition of small and medium enterprises varies between sectors
Belarus Definition small enterprises varies between sectors
Brunei Small: <10Medium: 10-100
Bulgaria Small: <50 Small: balance sheet maximum BGL 20 million
Estonia Small: <80 Small: turnover <EEK 15 million
Indonesia Maximum net worth (excluding land and building): 200 million Rupiahs orMaximum sales: 1 billion Rupiahs
The Undang-Undang (Regulation) No 9 Tabun 1995 definition of small businesses also requires that businesses are owned by Indonesian citizens and are independent
Kazakhstan Definition small enterprises varies between sectors
Kyrgyzstan Definition of small and medium enterprises varies between sectors
Latvia Small: <25 Small: turnover < Lats 200,000AndBalance sheet total < Lats 70,000
Lithuania Small: <50 Small: turnover<litas 500,000
The former Yugoslav Republic of Macedonia
Small: <50 Small: turnover < MD 8,000or balance sheet total < MD 6,000
Both employee and financial threshold must be met
Malaysia Small: ≤50Medium: 51-150
Small: annual sales turnover: <RM10 millionMedium: Annual sales turnover: RM10 million - RM25 million
Small and medium industries (SMIs) definition incorporated under the Companies Act 1965: companies involved in the manufacturing sector or companies providing manufacturing related services. Companies must have at least 70% of their shareholding held by Malaysians
Moldova Small: 20-75Philippines Small: 10-99
Medium: 100-199Small: 1.5 – 15 million pesosMedium: 15 – 60 million pesos
In the Philippines, SMEs are defined as business activities or enterprises engaged in industry, agri business and/or services whether a single proprietorship , a cooperative, a partnership or a corporation with a value of total assets inclusive of those arising from loans but exclusive of the land on which the office, plant and equipment of a particular business entity are situated.
78

ENV/JM/MONO(2008)5
Romania Small: 1-20Medium: 21-200
Small: turnover LEI 10 million – 2 billionMedium: LEI 10 million – 2 billion
Both criteria thresholds must be met.
Russian Federation
Definition of small enterprises varies between sectors
Singapore ≤200 Fixed productive assets: ≤$15 million
At least 30% locally owned
Slovenia Small: 1-50 in industry, mining and construction
Small enterprises also include craft cooperatives and individuals carrying out business activities
South Africa
20-250 Small or medium enterprise which is a formally registered business
Tajikistan Definition of small enterprises varies between sectors
Thailand No generally agreed definition of SMEs but each organization has a definition for convenience in their work.
Ukraine Definition of small enterprises varies between sectors
Uzbekistan Small: <300Medium: 300-1,000
Vietnam <500 Assets: <VND 10 billion The definition is used by researchers and economists for studies, however, there is no specific standard regulation on definition.
79