lakeeyrebasin.gov.aulakeeyrebasin.gov.au/.../files/lebra-2011-annual-monitorin… · web viewlake...
TRANSCRIPT

Lake Eyre Basin Rivers Assessment (LEBRA)
2011 Monitoring Report
Bernie Cockayne^, David Schmarr#, Angus Duguid&, Sonia Colville*, Rupert Mathwin# and Dale McNeil@
^ Queensland Department of Natural Resources and Mines (DNRM), 30 Tennyson St, Mackay, QLD 4740
# South Australian Research and Development Institute (SARDI) Aquatic Sciences, PO Box 120, Henley Beach, SA 5022
&Department of Natural Resources, Environment, the Arts and Sport (NRETAS),Natural Resources, Environment and Heritage Division, PO Box 1120, Alice Springs, NT 0871
*Regional Water Initiatives Section, Water Reform Division, Department of Sustainability, Environment, Water, Population and Communities (SEWPAC), Canberra, ACT 2600.
@Department of Environment, Water and Natural Resources, 25 Grenfell Street, Adelaide, SA 5000

Suggested citation:
Cockayne, B., Schmarr, D., Duguid, A., Colville, S., Mathwin, R., & McNeil, D. (2012) Lake Eyre Basin Rivers Assessment 2011 Monitoring Report, A report to the Department of Sustainability, Environment, Water, Population and Communities (SEWPaC), Canberra, ACT

Executive Summary
The Lake Eyre Basin Rivers Assessment (LEBRA) is a monitoring program designed to gain an understanding of, and report on, the condition of watercourses and catchments in the Lake Eyre Basin (LEB) as required under the LEB Intergovernmental Agreement. The aim of this report is to present monitoring from 2011 which was the first year of the current monitoring program. The scope of this report is set by the 2011 LEBRA Project Plan (SEWPaC 2011). The current phase of the LEBRA monitoring operates under the ‘LEBRA Implementation Plan 2010-2018’ which was endorsed, in principle, by LEB Ministerial Forum in April 2010. A more comprehensive scientific report that assesses the condition of LEB watercourses and catchments will be produced in 2014 as part of the mid-term assessment required under the LEBRA Implementation Plan.
The 2011 LEBRA Project Plan identified the monitoring indicators for the 2011 LEBRA as hydrology, water quality and fish. Monitoring was undertaken in autumn 2011 by the South Australian Research and Development Institute (SARDI) Aquatic Sciences Division, Queensland Department of Natural Resources and Mines (DNR&M) and Northern Territory Department of Natural Resources, Environment, the Arts and Sport (NRETAS).
Hydrology and water quality
Data was collected from 30 hydrological gauging stations throughout the basin and an additional 18 conductivity/temperature/depth loggers where installed in areas lacking hydrological monitoring. Comprehensive GIS-based bathymetric surveys were conducted at 8 waterholes.
Above average rainfall resulted in three consecutive years of above average flows in LEB catchments. Extensive floodplain and floodout inundation occurred in lower reaches of each of the major rivers (Cooper, Diamantina, Georgina, Finke and Neales) with associated flow into Lake Eyre. Most sites did not experience significant dry spells, to the extent that no monitoring sites dried completely in the two seasons leading up to the monitoring program. Water quality parameters (temperature, dissolved oxygen, conductivity, pH and turbidity) were collected at each fish monitoring site and were found to be within the range of tolerance for fish species in the LEB.
Fish
A structured monitoring methodology was applied consistently throughout the LEB. This provided novel baseline data for many waterholes, tributaries, and in some cases whole river systems; updated data on fish distribution and abundance from sites previously studied; and, continuing data for long-term monitoring sites. A total of 44 fish monitoring sites were sampled using the LEBRA fish monitoring methodology. Key fish results were:
Nineteen species of fish were recorded, including 17 native and 2 introduced exotic species (goldfish and eastern gambusia).
Site fish diversity ranged from 1 to 12 species. In many catchments and sub-catchments species were recorded for the first time (5 in the
Macumba, 1 in the Neales, 3 in the Ooratippra, 1 in the Rankin, 4 in the Sandover).
LEBRA 2011 Annual Monitoring Report i

Recent years of consistent river flows in all catchments promoted species recruitment, as demonstrated by fish size-classes and, in some cases, very high fish abundances (up to 52,000 fish caught at one site).
Disease levels and fish kills were low in most catchments, with the exception of some Queensland sites where diseased fish represented up to 80% of the total catch.
The data collected for the Northern Territory sites were the first systematic population oriented sampling for most sites and added to the list of species known at most waterholes;
The data collected for the Sandover River Catchment (Sandover River and Ooratippra Creek) were the first systematic fish survey of any kind in the catchment.
Fish species assemblages were unique in the Finke River, with the highest proportion of species endemic to a river catchment.
Fish species assemblages in the Upper Macumba were characterised by low species diversity, with rainbowfish, bony bream and spangled perch making up most of the catch.
The lower Macumba and the majority of the Georgina, Diamantina and Cooper catchment sites all contained higher diversity of fish species.
In addition to the data collected during 2011, the involvement of the Tjuwanpa Rangers in the monitoring program was an important outcome for indigenous participation in LEBRA. With continued involvement, they will be an important factor in keeping the LEBRA monitoring program viable in the Northern Territory segment of Lake Eyre Basin.
The implementation of the2011 LEBRA monitoring program enabled the testing of the fish sampling methodology. Survey techniques for catching some species of fish (e.g. Finke endemic species and desert goby) need further development to increase confidence in catch and to obtain meaningful scientific data for these species. Improvements to the fish monitoring protocols will be incorporated in the 2012 LEBRA Project Plan.
The 2011 round of LEBRA monitoring successfully implemented a consistent basin-wide sampling regime for the first time. The 2011 monitoring provides a basis for the 2012 LEBRA monitoring program and for potential expanded monitoring in the future.
LEBRA 2011 Annual Monitoring Report ii

AcknowledgmentsThe LEBRA requires the cooperation and goodwill of many. We acknowledge the Lake Eyre Basin Ministerial Forum and associated committees. We sincerely thank all members of the Community Advisory Committee (CAC) and the Scientific Assessment Panel (SAP) for your faith in bringing LEBRA to fruition, and all the jurisdictions (Commonwealth SEWPaC, SA, QLD and NT) who provided substantial levels of in-kind support. Glen Scholz and Satish Choy were instrumental in bringing the current monitoring program into being. Dr Dale McNeil was a leading contributor to the program design and operation of the field program. Derek White, Dr Sonia Colville, Gayle Partridge and Sue Stefanoski provided valuable support from the Australian Government.We acknowledge the current land owners and managers and the traditional Aboriginal custodians of the lands at all of the sites surveyed for this project and pay our respects to the elders. We would particularly like to thank the Tjuwanpa Rangers from the Central Land Council who participated in sampling at several locations on the Finke River and showed great enthusiasm for fishing and looking after country. James Aitken assisted in surveying sites on his traditional land in the Macumba catchment which was invaluable.The survey in the Northern Territory was conducted by NT government staff working with colleagues Dale McNeil and David Schmarr from South Australia (Finke catchment) and colleagues Richard Hunt, Niall Connolly, Konrad Czaja and Michaelie Pollard from Queensland (Georgina – Sandover catchments).Staff from the Natural Resources Division (Northern Territory Department of Natural Resources, Environment, the Arts and Sport - NRETAS) were the principal collaborators for NT site survey: Angus Duguid, Jochem Van Der Reijden, James Aitken and Anne Pye. NRETAS Parks and Wildlife Rangers participation in fieldwork and provided assistance with access to sites (Chris Day, Phil Cowan, Kelly Knights, Deon Grantham, Luke McLaren and Gary Weir). Ross Morton from Henbury Station provided valuable advice on the location and history of permanent water sources on the Finke River on his property. The Weir family provided valuable advice on waterhole longevity and access to sites on their properties. The Johnson family provided valuable advice on waterhole longevity and access to sites on Avon Downs Station. Staff from the Central Land Council assisted in consultation with traditional owners and arranging the involvement of the Tjuwanpa Rangers. Ian Fox provided managerial support for NT participation in LEBRA and various NRETAS staff assisted with equipment and other support. Naomi Wilson from the Barkly Landcare and Conservation Association assisted with identifying potential sites.The following SARDI staff and volunteers conducted the monitoring in South Australia: Dale McNeil, David Schmarr, Rupert Mathwin and David Cheshire. Owners and managers of several stations in South Australia are acknowledged for their help. Paul Broad and Jason Dunn at Etadunna station assisted us on several occasions with repairing equipment and giving directions to sites. Sharon Oldfield at Cowarie station is thanked for her support of the field work and her support of the LEBRA concept. Managers and owners of Peake, Allandale, Macumba and Pandie Pandie stations were, as always, very welcoming and patient with our enquiries. Gary Overton from Mulka station has helped us greatly with access to Lake Hope and advice. As usual, the staff and owners at Mungeranie and Pink roadhouse and many other businesses went out of their way to nourish and entertain us. The following Queensland Government staff undertook the field survey of sites in Queensland: Bernie Cockayne, Richard Hunt, Niall Connolly, Konrad Czaja, Michaelie Pollard, Kate Burndred, Luke Galea, Kate Cranney and Nissa Murphy. In Queensland we would like to thank Sam and Patricia Brown, Waddy Campbell, Joe and Michelle Cobb, Steve Cramer, Angus and Karen Emmott, Dot Gorringe, Lalena Graham, Judith Harrison, Wayne Hooper, Darren Lorenz, Gavin Miller, Linda and Gerard Penna, Steve and Wayne (Retreat station), Colin Saltmere, David Thompson, William and Elizabeth Tudehope, Brian and Marina Tully, Garth and Kathi Tully and Cheyne and Casey Williams.
LEBRA 2011 Annual Monitoring Report iii

Conducting fieldwork throughout the Lake Eyre Basin region required dozens of contributors and together we hope to gain a better understanding of this unique system.
LEBRA 2011 Annual Monitoring Report iv

Table of Contents
Executive Summary.................................................................................................................................... i
Acknowledgments.................................................................................................................................... iii
1 Introduction......................................................................................................................................1
2 Indicators: fish, hydrology and water quality...................................................................................3
2.1 Draft Hypotheses and Thresholds of Potential Concern (ToPC)................................................3
2.2 Fish and Water Quality Site Selection and Sampling Frequency...............................................6
2.3 Hydrology and Water Quality...................................................................................................8
2.4 Fish.........................................................................................................................................13
3 Results............................................................................................................................................17
3.1 Hydrology...............................................................................................................................17
3.2 Water Quality.........................................................................................................................25
3.3 Fish.........................................................................................................................................29
4 Outcomes.......................................................................................................................................39
5 References......................................................................................................................................40
6 Appendices.....................................................................................................................................42
List of Figures
Figure 1 Fish monitoring sites were spread through SA, QLD and the NT...............................................8
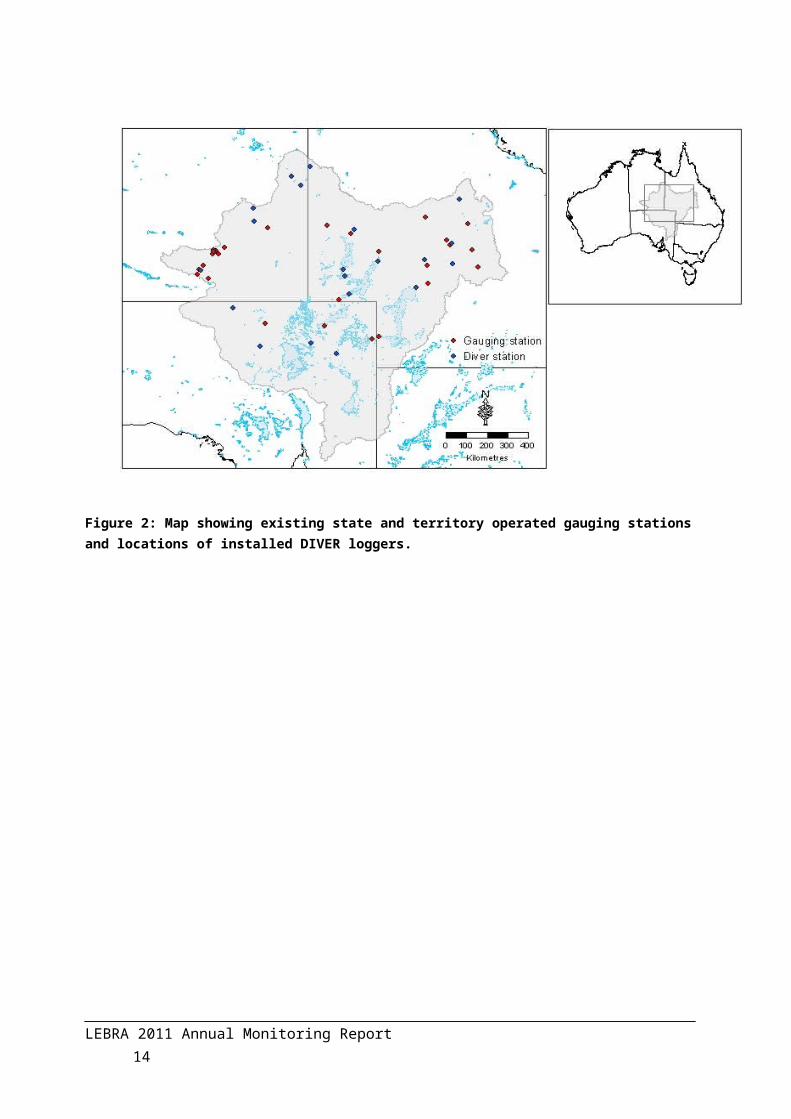
Figure 2: Map showing existing state and territory operated gauging stations and locations of installed DIVER loggers.........................................................................................................................................10
Figure 3 : Example of an installed CTD Diver. Note the secured cap (with stainless steel cable) and slotted galvanised pipe which was secured to a stable structure...........................................................12
Figure 4: River flow (ML/day- blue line) at Ranken River at Soudan homestead for the period between 2008 and 2011. The arrow indicates the period of fish sampling. This gauging station was closed in 2011.......................................................................................................................................................18
LEBRA 2011 Annual Monitoring Report v

Figure 5: River flow (ML/day- blue line) at Burke River at Boulia (top graph) and Georgina River at Roxborough Downs (bottom graph) for the period between 2008 and 2011. The arrow indicates the period of fish sampling...........................................................................................................................19
Figure 6: River flow (ML/day - blue line) at Diamantina River at Diamantina Lakes (top graph) and Mills Creek at Oondooroo (bottom graph) for the period between 2008 and 2011. The arrow indicates the period of fish sampling...........................................................................................................................20
Figure 7: River flow (ML/day - blue line) at Diamantina River at Birdsville for the period between 2008 and 2011. The arrow indicates the period of fish sampling...................................................................20
Figure 8: River flow (ML/day - blue line) at Alice River at Barcaldine (top) and Cornish Creek at Bowen Downs (bottom) for the period between 2008 and 2011. The arrow indicates the period of fish sampling.................................................................................................................................................21
Figure 9: River flow (ML/day - blue line) at Darr River at Darr (top) and Thomson River at Longreach (bottom) for the period between 2008 and 2011. The arrow indicates the period of fish sampling.....22
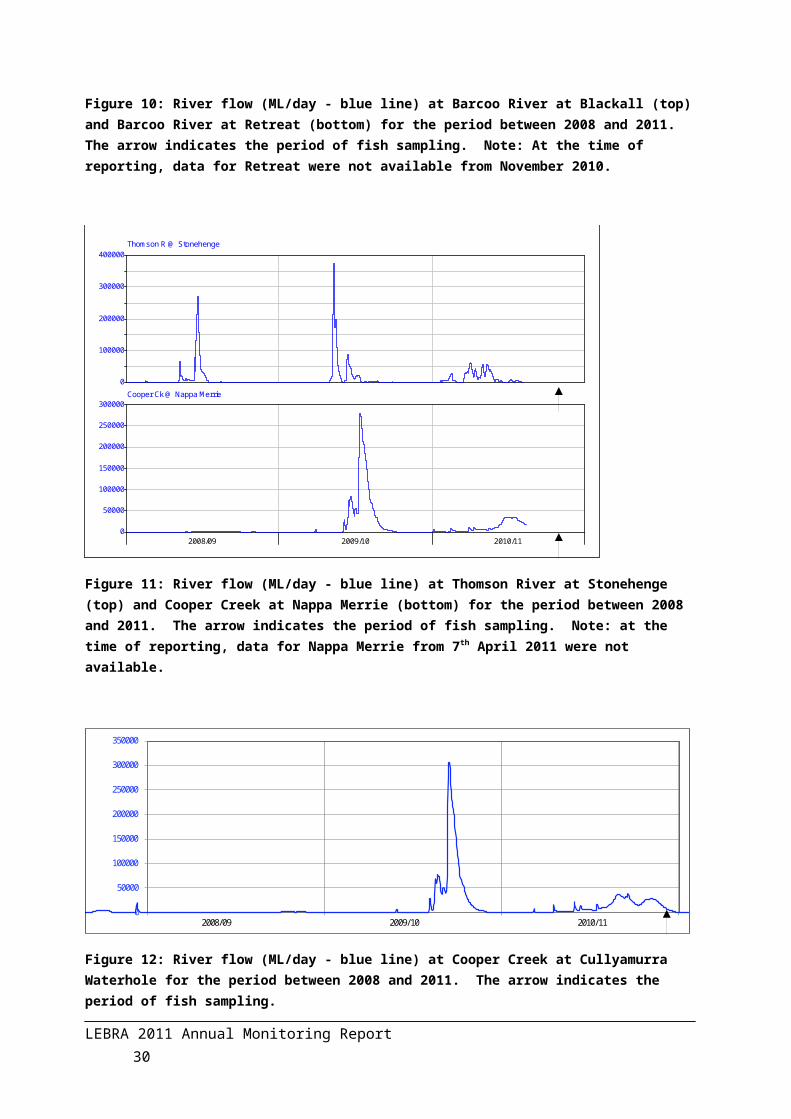
Figure 10: River flow (ML/day - blue line) at Barcoo River at Blackall (top) and Barcoo River at Retreat (bottom) for the period between 2008 and 2011. The arrow indicates the period of fish sampling. Note: At the time of reporting, data for Retreat were not available from November 2010...................22
Figure 11: River flow (ML/day - blue line) at Thomson River at Stonehenge (top) and Cooper Creek at Nappa Merrie (bottom) for the period between 2008 and 2011. The arrow indicates the period of fish sampling. Note: at the time of reporting, data for Nappa Merrie from 7th April 2011 were not available.................................................................................................................................................23
Figure 12: River flow (ML/day - blue line) at Cooper Creek at Cullyamurra Waterhole for the period between 2008 and 2011. The arrow indicates the period of fish sampling...........................................23
Figure 13: River flow (ML/day - blue line) at Finke River at Stuart Highway for the period between 2008 and 2011. The arrow indicates the period of fish sampling...................................................................24
Figure 14: Water quality data collected at Thomson River at Longreach (003202a) for the period from 2008 to 2011. Note: at the time of reporting, data were not available after 8 th April 2011..................28
Figure 15: Length frequency distribution of desert rainbowfish (Melanotaenia splendida tatei) populations in the Cooper, Diamantina, Georgina, Neales, Macumba and Finke catchments for the post 2010/11 wet season sampling........................................................................................................30
Figure 16: Length frequency distribution of silver tandan (Porochilus argenteus) for Cooper, Diamantina, Georgina and Macumba catchments for the post 2010/11 wet season sampling.............31
Figure 17: Length frequency distribution of Hyrtl’s tandan (Neosilurus hyrtlii) populations in the Cooper, Diamantina, Georgina, Macumba and Finke catchments for the post 2010/11 wet season sampling.................................................................................................................................................31
Figure 18: Length frequency distribution of Lake Eyre golden perch (Macquaria sp. B) populations in the Cooper, Diamantina and Georgina catchments for the post 2010/11 wet season sampling...........32
LEBRA 2011 Annual Monitoring Report vi

Figure 19: Length frequency distribution of Barcoo grunter (Scortum barcoo) populations in the Cooper and Diamantina catchments for the post 2010/11 wet season sampling...............................................33
Figure 20: Length frequency distribution graph of the exotic fish, eastern gambusia (Gambusia holbrooki) (top graph) and goldfish (Carassius auratus) (bottom graph) populations for the post-2010/11 wet season sampling................................................................................................................34
Figure 21. Classification (cluster analysis) of the species richness of fish communities at the 45 sites monitored during the 2011 post-wet season monitoring. The dendogram was constructed using Bray-Curtis similarity (Primer 5) based on presence/absence data. The vertical line and numbers to the right-hand indicate the site clusters.......................................................................................................37
Figure 22: NMDS ordination of the fish assemblages at the 45 sites monitored during the 2011 post-wet season monitoring. Groupings (and numbers) are based upon the group separations from the cluster analysis (seeFigure 21)................................................................................................................38
Figure 23: Geographic positions of cluster analysis groups of adult fish communities for the 2010/11 post-wet season. Colours of each site correspond to those in Figure 22..............................................38
List of Tables
Table 1 : LEBRA draft hypotheses and Thresholds of Potential Concern (ToPC).......................................4
Table 2: Number of fish sites by catchment and jurisdiction....................................................................8
Table 3: List of state and territory operated gauging stations and parameters they collect..................11
Table 4: Summary of in situ water quality data collected during the fish sampling of Autumn2011......26
Table 5: Number of sites affected and percent of diseased fish for each of the LEB catchments..........35
List of Appendices
Appendix A: Distribution of riverine fish fauna in the study area (updated from Unmack and Wager, 2000). ● known distribution; * exotic/introduced native fish; ^ endemic to the LEB............................42
Appendix B: Relative abundance of fish species collected during the 2011 post wet season sampling. Relative abundance : - <100; - 101 to 500; - > 500. Invasive species are indicated with #................................................................................................................................................................43
LEBRA 2011 Annual Monitoring Report vii

1 IntroductionThe Lake Eyre Basin Rivers Assessment (LEBRA) is a monitoring program designed to gain an understanding, and report on, the condition of watercourses and catchments in the Lake Eyre Basin (LEB) as required under the LEB Intergovernmental Agreement. The LEB Intergovernmental Agreement was enacted in the Parliaments of Australia, Queensland and South Australia in 2001, and joined by the Northern Territory in 2004.
In April 2010, the LEB Ministerial Forum endorsed, in principle, the LEBRA Implementation Plan (a report by Kiri-ganai Research), and agreed to fund a LEBRA monitoring program that addresses its key recommendations. The Implementation Plan by Kiri-ganai Research is published on the web at http://www.lebmf.gov.au/publications/
Based on the Implementation Plan, and in accordance with Ministerial Forum recommendations, the LEBRA Operations Group drafted the 2011 LEBRA Project Plan (SEWPaC 2011) that identified the suite of LEBRA indicators for the 2011 LEBRA as hydrology, water quality and fish. The 2011 LEBRA Project Plan was supported by detailed monitoring methodology that was developed in consultation with an independent reviewer, Keith Walker of the University of Adelaide (McNeil and Cockayne 2011).
The 2011 LEBRA objectives, as described in the 2011 LEBRA Project Plan, are listed below.
1. Establish a representative monitoring network for the fish assemblage diversity indicator that is distributed across the whole LEB and commence sampling based on consistent sampling methods. This will include sampling at representative reaches covering the whole basin.
2. Commence sampling of the first component of the water quality monitoring programme as recommended by Kiri-ganai research which is to sample water quality in conjunction with fish sampling during each survey time.
3. Propose preliminary hypotheses and possible Thresholds of Potential Concern.
4. Install or reinstall waterlogger depth recorders (including some depth/EC) at permanent monitoring sites. This includes installing a few new telemetered stations, and maintenance of existing telemetered stations and gauging stations.
5. Consider how to incorporate community/Aboriginal participation and engagement in the 2011 LEBRA sampling program, take any initial steps, and make recommendations to LEBRA Oversight Group for future participation and engagement.
Methodologies were designed under the principles of the Strategic Adaptive Management (SAM) Framework (Kingsford & Biggs, 2012) and were built around the ability to detect Thresholds of Potential Concern (ToPC). ToPCs were developed with a view to identifying clear threshold points at which aspects of river health change significantly in a negative trajectory for ecological health. This monitoring strategy was approved by the LEBRA Strategic Oversight Group (SOG), Scientific Advisory Panel (SAP), Technical Reference Group (TRG) and Ministerial Forum. Fieldwork began in autumn 2011.
LEBRA 2011 Annual Monitoring Report 1
The monitoring design included three types of sites:
- waterholes monitored for fish populations, water quality, waterhole bathymetry and habitat condition;
- pre-existing hydrographic stations (river flow gauges and rainfall);
- new hydrographic stations.
The sampling design incorporated some existing sites monitored by the Queensland (QLD), South Australian (SA), and Northern Territory (NT) governments. Representative sites were selected for monitoring water quality and fish population across the LEB, with an emphasis on permanent waterholes as well as other attributes (see Section 2.2 for further details).
The aim of this report is to present outcomes of the 2011 LEBRA monitoring program including summaries of monitoring data .Some elements of the methods are presented. Further details are in the 2011 LEBRA Project Plan and associated methodology documents (SEWPaC 2011, McNeil & Cockayne 2011).
LEBRA 2011 Annual Monitoring Report 2

2 Indicators: fish, hydrology and water qualityUnder the 2011 LEBRA Project Plan, the ‘no regrets’ condition indicators, as chosen by the LEBRA Operations Group and endorsed by the LEB Oversight Group in November 2010, are hydrology, fish and water quality (SEWPaC 2011). These include the fish assemblage indicator set combined with concurrent water quality sampling and ongoing hydrology monitoring, as per Kiri-ganai’s Implementation Plan (Thoms et al. 2009). Hydrology monitoring is supplemented by the installation of additional water dataloggers (non-telemetered) and bathymetric surveys of waterholes.
2.1 Draft Hypotheses and Thresholds of Potential Concern (ToPC)The project methodology was developed to be consistent with the SAM Framework (Kingsford and Biggs 2012), approved as the over-arching framework within which LEBRA monitoring, research and management will be integrated. The following hypotheses and ToPC (Table 1) were developed to help facilitate and guide the 2011 sampling efforts. These were developed on the understanding that:
ToPC require further refinement and would be subject to change following the 2011 assessment, SAM outputs and as monitoring improves our knowledge of the LEB system;
there are limitations to testing some of these hypotheses due to the sampling methodology, monitoring timeframe and focus of LEBRA as a monitoring program; and
some ToPCs may need to be more specific and/or rephrased (e.g. hypotheses for each fish species).
LEBRA 2011 Annual Monitoring Report 3

Table 1 : LEBRA draft hypotheses and Thresholds of Potential Concern (ToPC)
DRAFT LEBRA HYPOTHESES TABLE
HYPOTHESISA healthy LEB aquatic system
has:Informed by
Possible Threshold of Potential Concern (general)
Resilient fish populations with regular (i.e. within its generation time) spawning and recruitment (species
specific)
Fish spawning, age to spawning, length data, counts of each species, correlation curve between length and age,
genetic structure endemism
Regular spawning and recruitment not detected (species specific)
Loss of endemic fish species from any waterhole/site it was previously recorded
Wide range of fish size classes for each fish species
Fish length data, correlation between length and age
Even distribution of strong cohorts indicates past breeding success and future capacity to respond.
‘Ark’at refugia where all expected fish species can be
found at all times
Fish assemblage data, fish species diversity, hydrology,
waterhole persistenceLoss of (or impacts on) 'Ark' refugia
‘Disco'^ refugia where fish populations can build during
wet periods
Fish assemblage data, fish abundance, hydrology, waterhole persistence
Loss of 'Disco' refugiaFish not found in a reconnected waterhole after it
was once dry (in line with resilience traits)
Periods of floodplain inundation
Hydrology, fish assemblages, event based sampling
Periods without flood inundation exceeds species longevity.
Long extended periods (>5years) without flood inundation
Connectivity (in channel) most years
Hydrology, fish assemblages, fish movement tracking
Periods without in channel connectivity exceeds species longevity
Systems remain unconnected for more than 2 consecutive years? (based on some zonation)
Rapid recolonisation of dry regions following drought
Fish assemblagesSlow recolonisation rates of dry regions following
drought
Connectivity patterns that support slower migrants (i.e.
3 years of in channel flow)
Fish assemblages (long term), hydrology
Less than 3 years of in channel flow
Recovery from fish disease periods
Instances of diseased fish (long term)
Above average increase in the prevalence of disease and presence of new diseases
Increase >20% in the prevalence of disease and presence of new diseases, diseases appearing outside on regular occurrence, i.e. after drying
Stable fish sex ratios Sex of some fish species (where Fish sex ratios shift significantly, where one sex
LEBRA 2011 Annual Monitoring Report 4

DRAFT LEBRA HYPOTHESES TABLE
HYPOTHESISA healthy LEB aquatic system
has:
Informed byPossible Threshold of Potential Concern
(general)
visual estimates are possible) makes up >75% of population
A range of water quality to support tolerant and
intolerant fish species
Water quality, fish assemblages, fish tolerances (EC, oxygen,
temp, pollutants)
Water quality parameters exceed fish species range of tolerance (for juvenile and adults)
The ratio of tolerant and intolerant species across the LEB shifts significantly?
Water quality monitoring detects worsening conditions
Low impact of terrestrial ferals (goats, camels, pigs
etc.)
Evidence of pugging and compaction of water banks and
substrates, water quality, turbidity, damage to riparian
vegetation
Increase in damage caused by feral animals and unrestricted stock access
Riverine and floodplain habitat that provide
abundant food resources for fish in times of high
flood/flow
Habitat characteristics, macroinvertebrates (bycatch), food chain isotope study, fish
diet
Low fish abundance following high/flood flows
Low impact of exotic fish and other aquatic biota
Presence and abundance of exotic fish and/or aquatic biota
(e.g. red claw)
Spreading and increased abundance of exotic fish or high relative abundance of exotic fish
compared to native competitors. Appearance of new invaders
Low impact from cane toadsCane toad presence/abundance in fish nets or spotted at night
Spreading and increased abundance of cane toads
Fish assemblage or abundance changes in areas affected and unaffected by toads
Adapted from Robson et al. (2008)atArk Refugia= used to describe waterbodies where conditions are appropriate for resident individuals to form a secure, viable complement of males and females in numbers sufficient to assure that there is a capacity for survival, breeding, dispersal and recovery of a population following drought disturbance. The complement would also preserve most if not all of the regional genetic diversity typical of the species. In wetter areas, or in wet periods, many waterholes may serve as Ark refugia, but during drought, only a very few habitats may be available for all species to survive. Ark refugia are critical in preventing local extinction as a result of dry periods.^Disco Refugia = used during good times, especially during recovery from drought. They protect fish through short dry seasons, but dry out completely during long periods of drought. As such they are waterholes where fish migrate, access booming resources and reproduce to rebuild populations following drought. Disco waterholes are critical to build resilience between drought periods. Polo Refugia = Harsh waterholes (i.e. very saline) where only a select group of species can tolerate environmental conditions. Most species cannot persist in these habitats during drought, but may be able to move in during wetter periods where water quality may improve due to fresh inflows. These waterholes are very important for those tolerant species that use them as they can build up populations without competition and predation from weaker species.
LEBRA 2011 Annual Monitoring Report 5

2.2 Fish and Water Quality Site Selection and Sampling Frequency
2.2.1 Fish Site Selection MethodSelection of fish monitoring sites was based on the method agreed in the 2011 Project Plan. These sites were also sampled for water quality and a subset was sampled for hydrology (changes in water level) and a subset was sampled for bathymetry.
Additional information is provided here on factors contributing to the selection of sites actually sampled.
The LEBRA Operations Group discussed the merits of the different site selection methods and, based on the objectives of LEBRA, decided that representativeness and geographic spread of sites was more important than random selection. Random site selection, as used by the Murray-Darling Basin Authority’s Sustainable Rivers Audit (Davies et al. 2008), was not considered a practical option because it would be too resource-intensive to ensure both representative sampling and sufficient statistical power (i.e. to ensure that significant differences could be detected, if they exist). The approach adopted was selection of fixed long-term sites that were representative of variation in key parameters (stratified sampling). The intention is that fixed monitoring sites will be monitored for many years into the future. Site selection for fish and water quality was based on the following criteria:
Recommendations in Kiri-ganai reports (Thoms et al 2009),
spatial distribution between and within the major LEB catchments,
suitability to progressively address the hypotheses and ToPCs with repeated sampling,
a focus on refugia waterholes but including some temporary waterholes (as described by Silcock (2009) and based on LEBRA Operations Group catchment knowledge),
legacy sites (i.e. those which have been continuously monitored through other research/monitoring programs),
inclusion of significant/high conservation value sites,
representative of refugia types (Ark, Polo or Disco) (where known),
representative of the surrounding landscape, hydrology and geomorphic diversity,
representative of a gradient of identified disturbance (where possible),
proximity to existing river flow gauges, and
logistical issue of travel time in remote areas.
Where possible fish and water quality monitoring sites were co-located with gauging stations provided that fish site selection criteria were met.
LEBRA 2011 Annual Monitoring Report 6

A small number of contingency sites, which have similar site characteristics to the fixed long-term sites, were also identified to be monitored just in case some fixed sites were inaccessible in a particular monitoring period. In a few instances, additional sites were opportunistically sampled in the vicinity of fixed sites, where additional resources were available.
2.2.2 Planned Frequency of Fish SamplingFixed long-term sites were to be assessed twice yearly, in spring and autumn. Sampling in spring, when river systems are generally at their driest, provides maximal detail on refugia and potentially limiting thresholds (i.e. hydrologic conditions and antecedent flows and water quality). Autumn monitoring, when river systems are generally at their wettest, provides for assessment of connectivity, fish movement and recolonisation. Sampling twice a year in this way allows the assessment of catchment scale range expansions and contractions and indicates the impact of hydrologic extremes on the ecology of fishes. Understanding fish response to these extremes under natural ranges of hydrologic variability allows assessment of river health trajectories, and informs the suitability of the chosen river health indicators. The 2011 LEBRA Project Plan only covered the 2011 autumn sampling. It is anticipated that the 2012 LEBRA Project Plan will include the 2011 spring and 2012 autumn sampling.
2.2.3 Site Sampled in 2011During autumn 2011, 44 sites sampled for fish with the full method specified in McNeil and Cockayne (2011). The distribution of sites is shown in Figure 1, and number of sites by catchment and state is listed in Table 2. Site names are given in Appendix B.
Some of the sites selected for sampling in the stratification process could not be accessed due to rains and river flows preceding the survey. It is intended that the majority of the 44 sites surveyed will be repeatedly monitored and are therefore long-term fixed sites, as described in the project plan. However, some may be treated as contingency sites that will be monitored when access to other sites is not possible. In the Finke catchment knowledge of habitat characteristics and fish populations has been substantially added to by the 2011 LEBRA survey and this may result in some changes to which sites are considered to be the highest priority for long-term monitoring.
Two opportunistic sites were sampled with over-night netting but not with the full method. These were both in the Northern Territory, at Pioneer Creek Mound Spring in the Finke catchment, and at Ooratippra Creek in the Georgina catchment (the latter is not included in Appendix B).
LEBRA 2011 Annual Monitoring Report 7

Figure 1 Fish monitoring sites were spread through SA, QLD and the NT.
Table 2: Number of fish sites by catchment and jurisdiction
Qld S.Aus NT LEB
Georgina (including Sandover)
2 3 ( +1) 5 (+1)
Diamantina 5 2 7
Cooper 13 3 16
Finke - - 6 (+1) 6 (+1)
Macumba 5 5
Neales 5 5
LEB 44 (+2)
a (+b); a = full fish survey sites; b = opportunistic fish survey
2.3 Hydrology and Water QualityThe hydrology of the LEB contributes to maintenance of healthy aquatic and floodplain ecosystems, supports the social, cultural and aesthetic values of floodplains, channels and waterholes, and may
LEBRA 2011 Annual Monitoring Report 8

provide an indicator of anthropogenic disturbances such as water availability or regime change land use and floodplain modifications. Hydrologic data may also reveal broader climatic variations and climate change.
2.3.1 Monitoring equipment and methodsThere are 30 gauging stations in the LEB which are operated by state and territory government departments. These include 13 in Queensland (one station is operated by South Australia), 3 in South Australia and 14 in Northern Territory (Figure 2 and Table 3). All stations measure river height (and flow), and some record rainfall and water quality parameters. In 2011 no new hydrological stations were constructed under the LEBRA program, although plans were detailed for the construction of new stations in the 2011/12 financial year.
CTD-Diver water dataloggers were deployed at 20 of the fixed long-term fish monitoring sites that were not co-located with gauging stations (Figure 2). These dataloggers monitor water level (when compensated for ambient barometric pressure), water temperature and salinity as electrical conductivity. Dataloggers were generally installed in the deepest section of waterholes (to avoid drying out) where the datalogger housing (40mm slotted galvanised piping) could be securely fixed. Dataloggers were attached to stainless steel cable and lowered into the pipe to a depth of approximately 10cm above the riverbed level. The tops of the pipes were capped with a galvanised cap, which was secured with crimped stainless steel cable. An example of an installed logger setup is shown in Figure 3.
Bathymetric surveys were also undertaken at seven of the fish monitoring sites (Winton Jundah Rd site in the Diamantina Catchment, and for six waterholes in Cooper and Barcoo Catchments). These surveys, when combined with the waterhole depth (Diver) and/or gauged height data, will give an indication of the rate of loss of water from waterholes, thus permitting the development of estimates of maximum waterhole persistence. The bathymetric maps also provide an insight into the morphology of the waterhole and the different types of potential fish habitat. The intent is to undertake bathymetric surveys at all fish monitoring waterholes, but restrictions on the availability of the specialised equipment only permitted the surveying of eight waterholes. The remainder of waterholes will be surveyed over subsequent sampling rounds.
Each bathymetric survey included measurements of the waterhole boundary and a detailed cross-sectional analysis of waterhole depth. Cross-sectional depth locations were collected using GPS (Garmin GPS 76) coupled to a depth measuring altimeter (Tritech PA200). Waterhole boundary was determined using the cross-sectional data points and confirmed using detailed aerial/satellite imagery. Key habitat features (e.g. submerged structures, root masses etc.) were also identified.
Following the bathymetric survey, a Digital Elevation Model (DEM) is created for each waterhole using the 3D analyst extension of ArcMAP (ver. 10). Waterhole storage and surface area curves were created for each waterhole. To allow comparisons between waterholes, the data were standardised to cease-to-flow (CTF) level, which was estimated during the field surveys.
At sites in South Australia and at Finke River sites, digital bathymetric mapping equipment was not available in 2011. Depth in the deepest part of the waterhole was measured for each sampling visit. At
LEBRA 2011 Annual Monitoring Report 9
many of the waterholes a series of depths was measured across the waterhole (cross-section) to provide some bathymetric information.
Figure 2: Map showing existing state and territory operated gauging stations and locations of installed DIVER loggers.
LEBRA 2011 Annual Monitoring Report 10

Table 3: List of state and territory operated gauging stations and parameters they collect.
Gauging station Jurisdiction River height (m)
Rainfall (mm)
Water temp. (°C)
Electrical Conductivity (mS/cm)
Hugh R at South Road crossing NT
Finke R at South Road crossing NT
Palmer R at South Road crossing NT
Finke R at Finke railway NT
Unca R at Jervois Mine NT
Trephina Ck at Trephina Gorge NT
Roe Ck at South Road crossing NT
Todd R at Wills Terrace NT
Emily Ck at u/s Undoolya Road NT
Todd R at Amoonguna Settlement NT
Todd R at Near Rocky Ck NT
Todd R at Wigley Gorge NT
Charles R at Big Dipper NT
Todd R at Heavitree Gap NT
Alice Rat Barcaldine Qld
Barcoo Rat Blackall Qld
Barcoo Rat Retreat Qld
Burke Rat Boulia Qld
Cooper Ck at NappaMerrie Qld
Cornish Ckat Bowen Downs Qld
Darr R at Darr Qld
Diamantina Rat Diamantina Lakes Qld
Diamantina R at Birdsville Qld
Georgina R at Roxborough Downs Qld
Mills Ckat Oondooroo Qld
Thomson Rat Longreach Qld
Thomson Rat Stonehenge Qld
Diamantina River at Birdsville Qld (SA managed)
LEBRA 2011 Annual Monitoring Report 11

Gauging station Jurisdiction River height (m)
Rainfall (mm)
Water temp. (°C)
Electrical Conductivity (mS/cm)
Macumba Creek at Alguchina
Waterhole
SA
Warburton River at Poothapoota
Waterhole
SA
Cooper Creek at Cullyamurra
Waterhole
SA
Figure 3 : Example of an installed CTD Diver. Note the secured cap (with stainless steel cable) and slotted galvanised pipe which was secured to a stable structure.
LEBRA 2011 Annual Monitoring Report 12

2.4 FishThere are 37 known fish species from the LEB area, including 32 native species, four introduced natives and two exotic species (Wager and Unmack 2000). Of the native species, 21 of these are endemic to the LEB; nine of which are restricted to springs.
In the riverine habitats sampled there are 23 known native species, 12 of which are endemic to the LEB area (Appendix A).
The LEBRA fish indicators are based on information about the identity, origin and condition of individuals, their relative abundance and the species composition of communities. These methods were developed by the LEB Operations Group and were established using outcomes from previous LEB monitoring programs, including Pritchard et al. (unpublished data) and McNeil and Cockayne (2011).
The outcomes of the 2011 fish surveys (i.e. this report) will be used to test, refine and standardise methods for future LEBRA fish monitoring and estimation of indicators.
2.4.1 Monitoring EquipmentUnpublished data from the ARIDFLO survey (Pritchard, unpublished data) indicated that overnight (<24 hour) sets of fyke nets, combined with seining for smaller or more cryptic species provided the highest catches of resident fish species (see also Arthington et al. 2005).
Each site was sampled using up to twelve nets, including three types of fyke nets and a small seine net, and included:
6 x Fyke small meshed single-winged design (3 m wing, 4mm mesh, 3m funnel, 0.6m high)- these nets are effective at sampling smaller bodied fish in shallow water habitats along the banks.
4 x Fyke small meshed double-wing design (2 x 5m wing, 4mm mesh, 3 m funnels, 0.6m high)- these nets are effective at sampling smaller bodied fish in shallow water habitats.
2 x Fyke large hoop double-wing design (2 x 10m wing, 12mm mesh,5 m funnels, 1.2m high)- these large fyke nets target large bodied fish and can be set in deeper waters.
1 x Seine Net (3m x 1.2m drop, 2mm mesh, in built collection bag, leaded rope on bottom) – seine nets are effective at targeting very small fish and demersal (less mobile) species such as desert gobies, which are generally hard to catch using other gear types.
Additional ad hoc sampling was carried out using seine nets, box-style bait traps and expert visual surveys (spotlighting and daytime visual surveys when water was clear enough).
LEBRA 2011 Annual Monitoring Report 13

2.4.2 Sampling ProtocolsEvery effort was made to use all net types and numbers at each site; however this varied between sites depending on the size of waterholes and time allowed at each site.
The following process was undertaken in setting and retrieving the fyke and seine nets:
A rapid assessment of the physical structure of the waterhole, including identification of all major habitat types and depth profiles, was undertaken to determine the most appropriate location for net deployment
Small single fykes (6) were set with the wing (leader) perpendicular to and fixed to the bank and the net extending towards the centre of the river. The cod end was pulled tight and straight, with no gaps underneath. Small fykes were set at relatively shallow locations allowing the leader to remain in contact with the substrate. At deeper sites buoys were attached to the cod end and pulled straight to reduce net drop and allow mammals and reptiles to breath if caught in the net.
Double winged small fykes (2) were set in a variety of ways, either as a pair to determine directional movement or singly to target fish moving through or around significant habitat features such as backwaters, anabranch entrances, snags, overhangs, banks or macrophyte beds.
Two large double winged fykes were set in the middle of the channel in areas less than 2m deep; wings were opened in upstream and downstream directions.
All fyke nets were set overnight for a period between 12 to 21 hours. This time period allowed capture during crepuscular and nocturnal activity and allowed adequate time for nets to operate. The start and finish times for sampling were recorded for each net on DNRM trips and for the site on SARDI trips.
Seine sweeps were made opportunistically. Where possible these were undertaken along a 10m stretch of the bank with the bank-end operator moving only a short distance, whilst the deep end operator moved in an arc with the seine extended and returning to the bank ten metres from the start point.
2.4.3 Sample processingThe following outlines the fish processing procedures:
All fish were identified from past experience and where required using keys (Allen, Midgley and Allen 2002; Wager and Unmack 2000; J. Pritchard unpublished data). However field identification of carp gudgeon species (Hypseleotris spp.) was not attempted and their records were pooled under this genus.
LEBRA 2011 Annual Monitoring Report 14

All specimens from each taxon were counted and measured (total length [TL] in mm) and released near the point of capture. The planned method was to measure TL of at least 100 individuals of each taxon for each net. The remaining fish in the net were counted. In some instances where very large numbers of fish were captured, random sub-sampling was employed for counting numbers of fish at the discretion of the researcher. At some sites a volumetric method was used to sub-sample; i.e. number of buckets of fish. The amount of time to process the catch at some sites meant that some other variations of the methods were adopted to reduce fish death and in order to have time to travel to the next site. At some sites not all nets were counted. At sites in the Finke catchment and in South Australia the first 100 individuals of a species were measured for the site and not per net, and thereafter, fish of that species were counted only for any net, unless of an obviously larger or smaller size class.
Fish condition indicators (e.g. presence of external parasites, lesions or other abnormalities) were recorded for each individual before fish were returned to the water at the point of capture. Introduced and exotic fish species were euthanised. Voucher specimens were kept for any fish where identification was uncertain.
The collection or observations of the introduced redclaw crayfish (Cherax quadricarinatus) and the native yabby (Cherax destructor) were also recorded and at some sites other larger invertebrates were qualitatively recorded, such as diving beetles and Macrobrachium spp..
Large bodied angling species (Lake Eyre golden perch, Barcoo grunter and Welch’s grunter) over 250mm (TL) were tagged using individually numbered plastic T-bar tags (100mm length) implanted on the dorso-lateral surface at less than 45° from the body surface to minimise protrusion. Tag numbers were recorded along with the fish length and any other distinguishing features (e.g. gender and disease). All tagged fish records are stored in a central database (managed by InfoFish Australia).
Further samples of fish populations were collected to address specific questions about a species such as population genetics or age structure.
When moving between catchments, all nets were checked for aquatic and terrestrial weeds and thoroughly cleaned to prevent transfer of pathogens and pest plant and animal species. Within catchments, nets were thoroughly emptied and dried at each site to prevent movement of pest species within the catchment.
Water quality parameters, including temperature, dissolved oxygen, pH, conductivity/salinity and turbidity were measured at each site (at 1 location in a waterhole at/close to the fish sampling location) during each survey using a multi-station water quality meter. Water quality was measured at the surface and, where possible, at multiple depths.
Observations of the dominant substrate types, instream macrophytes and riparian vegetation were recorded at each site.
Photographs and site sketches were taken at each site on each sampling occasion to allow visual comparisons of sites from season to season.
LEBRA 2011 Annual Monitoring Report 15
2.4.4 Data assessment and analysisTotal length data for each fish species at each site were combined for the four sampling methods. Metrics derived from these primary data at each site included:
Species richness
Relative abundances of native, translocated and exotic species
Length-frequency histograms were also developed for the most abundant species.
Multivariate analyses were undertaken to examine variations in fish assemblage structure between sites. Prior to analysis, all data were transformed to presence/absence and Bray-Curtis similarity matrices were constructed (PRIMER-E ver. 5). Cluster analysis and non-metric multi-dimensional (NMDS) scaling were used to examine fish community patterns between sites. Fish species contributing to the differences between sites were identified.
LEBRA 2011 Annual Monitoring Report 16

3 Results
3.1 Hydrology
3.1.1 Georgina and Sandover CatchmentsThere was no surfacewater flow at any of the eight study sites during the fish sampling, with gauged flow records indicating that flows had ceased between 1-2 months prior to the fish sampling. Consequently, most waterholes were near their maximum size.
Significant flow events were recorded for the three years prior to sampling; however the magnitude and duration of these events varied considerably from year to year (Figure 4 and Figure 5). The 2008/09 wet season was characterised by a number of high flood events, spanning a period of over 2 months. The floods observed at Ranken R at Soudan homestead and Georgina R at Roxborough Downs during January/February 2009 were some of the highest on record. The 2009/10 wet season flows were less severe, however significant flows were still recorded at all three gauging stations. Major flooding was again observed at Roxborough Downs in 2010/11; the fifth largest on record.
Despite the large flow events, there were extended periods of no flow. At Boulia no flow periods during the preceding three years lasted for up to 263 days (Figure 5). Likewise, flows at Roxborough Downs ceased for up to 173 days. This is considered normal for those districts (DNRM 2011).
During large flow events, the Sandover River extends through the lower floodout to Bybby Creek/Milne River; a tributary of the Georgina River (Duguid et al. 2005). There are no hydrographic data for the Sandover River prior to the installation of a datalogger in Junction Waterhole in 2011. However, information obtained from George Scott (manager, Lake Nash Station) indicated that water had flowed into the Georgina catchment for up to a month at two locations in 2010 and 2011. These observations were made from light aircraft. Discussion with Stuart Weir (manager, Ammaroo Station)
LEBRA 2011 Annual Monitoring Report 17
Summary
Flood events were a significant feature of the hydrology of sampled rivers over the three wet seasons.
In some areas, major flooding had occurred
Most sites had not experienced significant dry spells

indicated that Ooratippra Creek connected from its floodout in the Dulcie Range to the Sandover River, via its extensive floodout in the 2010-11 period. Although not quantified, these records on connectivity are highly valuable for interpreting fish population data. The drought refuges in the Dulcie Range are regarded as permanent, even though they may be connected to the main Georgina River only occasionally (perhaps less than once a decade in the long-term) (Brim Box et al 2008; Duguid et al 2005; Angus Duguid and Robert Read unpublished data).
Diver loggers were installed at all six sites without a dedicated gauging station (Figure 2).
No bathymetric surveys were conducted in any of the Georgina catchment waterholes.
Figure 4: River flow (ML/day- blue line) at Ranken River at Soudan homestead for the period between 2008 and 2011. The arrow indicates the period of fish sampling. This gauging station was closed in 2011.
LEBRA 2011 Annual Monitoring Report 18

Burke River @ Boulia
Georgina River @ Roxborough Dow ns
0
50000
100000
150000
200000
250000
0
50000
100000
150000
200000
250000
2008/09 2009/10 2010/11
Figure 5: River flow (ML/day- blue line) at Burke River at Boulia (top graph) and Georgina River at Roxborough Downs (bottom graph) for the period between 2008 and 2011. The arrow indicates the period of fish sampling.
3.1.2 Diamantina & Warburton CatchmentsIn Queensland, none of the four Diamantina catchment sites were flowing during the study period; flows had ceased between 1-3 months prior to sampling (Figure 6). However flows were observed in the main channel in the lower end of the catchment near Birdsville (1,700 ML/day) and at the two SA sites (Figure 7). Access to the two Warburton catchment sites was restricted due to continued flooding and denied access by the landholders.
Major flood events occurred at Diamantina Lakes during 2008/09 wet season; the sixth largest on record (DNRM 2011). The following seasons also had significant flows above moderate flood levels (DNRM 2011); however these tended to be more protracted and include a number of separate flow events. Oondooroo Creek, in the upper Diamantina catchment near Winton, had less regular flows which generally lasted for less than a month. 2008/09 and 2009/10 had a number of flow events above minor flood levels, whereas 2010/11 was a relatively dry year with no flow event exceeding 100ML/day. The Diamantina River floods reached South Australia for the last three years with the 2008/09 flood about half the magnitude of the subsequent two events (Figure 6).
Flows at Diamantina Lakes ceased for less than half of the period from 2008 to 2011. In contrast Oondooroo was dry for the majority of the time (i.e. >75% of days).
LEBRA 2011 Annual Monitoring Report 19

Diver loggers were installed at all three sites without gauging stations (Figure 2).
One bathymetric survey was conducted at Mayne River at Winton Jundah Rd. Data from this site are yet to be processed.
Diamantina River @ Diamantina Lakes
Mills Creek @ Oondooroo
0
50000
100000
150000
200000
250000
300000
0
10000
20000
30000
40000
2008/09 2009/10 2010/11
Figure 6: River flow (ML/day - blue line) at Diamantina River at Diamantina Lakes (top graph) and Mills Creek at Oondooroo (bottom graph) for the period between 2008 and 2011. The arrow indicates the period of fish sampling.
0
50000
100000
150000
200000
250000
2008/09 2009/10 2010/11
Figure 7: River flow (ML/day - blue line) at Diamantina River at Birdsville for the period between 2008 and 2011. The arrow indicates the period of fish sampling.
LEBRA 2011 Annual Monitoring Report 20

3.1.3 Cooper and Barcoo CatchmentsMost of the sites within the upper to mid Cooper catchment (i.e. in QLD) were not flowing, or had a very low flow (i.e. est. <5 ML/day), at the time of sampling (Figure 8 to Figure 12). As with most other locations, these sites ceased to flow approximately 1-2 months prior to sampling. Kyabra Creek was the exception, where an estimated 10ML/day flow was observed. The two Lower Cooper catchment sites (i.e. in South Australia) were flowing during the sampling period. All sites in the Barcoo River were flowing (<20ML/day) (Figure 10). The two Lower Cooper catchment sites (i.e. in South Australia) were still in flood during the sampling period with flow at Cullyamurra recorded at 7,750 ML/day (Figure 12).
Flood events were again a significant feature of the hydrology of sampled rivers over the previous three wet seasons. Most notable were the 2009/10 floods at Nappa Merrie, which were the third largest in the gauged record (DNRM 2011) (Figure 11).
Bathymetric surveys were undertaken for six of the 14 waterholes. Data from these surveys are yet to be processed.
Alice R @ Barcaldine
Cornish Ck @ Bowen Downs0
10000
20000
30000
40000
50000
0
5000
10000
15000
20000
25000
2008/09 2009/10 2010/11
Figure 8: River flow (ML/day - blue line) at Alice River at Barcaldine (top) and Cornish Creek at Bowen Downs (bottom) for the period between 2008 and 2011. The arrow indicates the period of fish sampling.
LEBRA 2011 Annual Monitoring Report 21

Darr R @ Darr
Thomson R @ Longreach
0
10000
20000
30000
40000
50000
60000
0
50000
100000
150000
200000
250000
300000
2008/09 2009/10 2010/11
Figure 9: River flow (ML/day - blue line) at Darr River at Darr (top) and Thomson River at Longreach (bottom) for the period between 2008 and 2011. The arrow indicates the period of fish sampling.
Barcoo R @ Blackall
Barcoo R @ Retreat
0
10000
20000
30000
40000
50000
0
50000
100000
150000
2008/09 2009/10 2010/11
Figure 10: River flow (ML/day - blue line) at Barcoo River at Blackall (top) and Barcoo River at Retreat (bottom) for the period between 2008 and 2011. The arrow indicates the period of fish sampling. Note: At the time of reporting, data for Retreat were not available from November 2010.
LEBRA 2011 Annual Monitoring Report 22

Thomson R @ Stonehenge
Cooper Ck @ Nappa Merrie
0
100000
200000
300000
400000
0
50000
100000
150000
200000
250000
300000
2008/09 2009/10 2010/11
Figure 11: River flow (ML/day - blue line) at Thomson River at Stonehenge (top) and Cooper Creek at Nappa Merrie (bottom) for the period between 2008 and 2011. The arrow indicates the period of fish sampling. Note: at the time of reporting, data for Nappa Merrie from 7th April 2011 were not available.
0
50000
100000
150000
200000
250000
300000
350000
2008/09 2009/10 2010/11
Figure 12: River flow (ML/day - blue line) at Cooper Creek at Cullyamurra Waterhole for the period between 2008 and 2011. The arrow indicates the period of fish sampling.
3.1.4 Finke River CatchmentSeven sites were sampled in the Finke River Catchment. At the time of sampling all sites had either a slight flow or had only recently stopped flowing.
Significant floods had been a feature of the Finke River hydrology for the previous three wet seasons (Figure 13). In 2008/09 there had been several flow events, with the maximum event almost reaching
LEBRA 2011 Annual Monitoring Report 23

50,000 ML/day. The 2009/10 period was a relatively wet year, with two significant flow events recorded above 90,000ML/day. The Finke River experienced unusually long periods of connectivity in 2010 and the first half of 2011 (NRETAS unpublished data and records). Many parts of the river continued to flow during that period due to very high rainfall in early 2010, followed by regular follow up rains through much of 2010 and an extremely wet period in February 2011.
No bathymetric surveys were conducted in the Finke River; however depth profiles were manually measured.
Figure 13: River flow (ML/day - blue line) at Finke River at Stuart Highway for the period between 2008 and 2011. The arrow indicates the period of fish sampling.
3.1.5 Macumba River CatchmentFive sites were sampled in the Macumba catchment. Flow had recently ceased at all Macumba sites; however there are no data available during this sampling period.
No bathymetric surveys were conducted in the Macumba River.
LEBRA 2011 Annual Monitoring Report 24

3.1.6 Neales River CatchmentOf the five sites Neales River catchment fish sites, low flow observed at Algebuckina Waterhole and Peake Crossing. Flow had recently ceased at Hookeys Waterhole, Stewarts Waterhole and Warrarawoona Waterhole. River height dataloggers are installed at Stewarts, Algebuckina, and Peake Crossing by Justin Costello (University of Melbourne) but had not been downloaded at the time of this report (these data may be available for future reports).
3.2 Water Quality
In situ water quality measurements were collected at all but one site (Georgina River at Brumbie waterhole) (Table 4). Water quality varied between sites; however values were generally consistent for the sample period and hydrological conditions (e.g. Sheldon and Fellows 2010; Costelloe et al 2004). There were some exceptions, including low dissolved oxygen (DO) at sites in the lower Cooper Creek (Windorah and Durham Downs). Sites in the lower reaches of the Neales and Macumba catchments had much higher salinities than all other rivers, with the exception of the Finke River (Table 4). Cuttapirra Waterhole on the lower Cooper would be expected to have higher salinity but was in fact very low salinity (Table 4). Turbidity in the Diamantina River in South Australia was elevated due to ongoing flood conditions (Table 4).
Thomson River at Longreach (003202a) is the only Queensland gauging station which collects water quality data (Figure 14). Conductivity during the previous 3 years has been relatively low and did not exceed 0.230 mS/cm. Conductivity appears to be strongly influenced by flow. Water temperature follows a strongly seasonal pattern, with higher temperatures recorded over the summer periods.
LEBRA 2011 Annual Monitoring Report 25
Summary
Water quality were within the expected ranges, considering the time of year and flow conditions
Some sites experienced naturally saline water quality

Table 4: Summary of in situ water quality data collected during the fish sampling of Autumn2011.
Site Name Date Time depth (m) Temp (deg C) pHConductivity (mS/cm) Turbidity (NTU) DO (mg/L)
Barcoo R at Blackall 20/05/2011 7:10:00 AM 0.6 15.1 8.22 0.271 375 6
Barcoo R at Killman Waterhole 14/05/2011 7:00:00 AM 0.3 15.5 8.75 0.147 227 4.45
Barcoo R at Retreat 19/05/2011 7:00:00 AM 0.5 17.1 7.68 0.186 225 2.5
Burke R at Barracks Waterhole 15/05/2011 4:00:00 PM 0.33 18.32 7.29 0.155 8.1 7.98
Cooper Ck at Durham Downs 9/08/2011 7:00:00 AM 0.5 13.9 7.68 0.257 980 0.63
Cooper Ck at Windorah Bridge 11/08/2011 7:00:00 AM 0.4 15.8 7.89 0.202 57 0.62
Cooper Creek at Cullyamurra Waterhole 4/06/2011 4:48:00 PM 7.3 15.39 9.45 0.169 50.6 8.36
Cooper Creek at Cuttapirra Waterhole 13/04/2011 1:04:09 PM 1.9 21.85 9.9 0.638 35.3 9.33
Cooper Creek at Lake Hope 10/04/2011 8:14:43 AM 5.3 14.93 9.61 0.638 11.5 10.54
Cornish Ck at Bowen Downs 13/05/2011 7:00:00 AM 0.4 16.6 7.46 0.203 247 4.22
Darr R at Darr 13/05/2011 1 17.2 7.1 0.105 389.1 6.6
Diamantina R at Brumby waterhole No data collected
Diamantina R at Davenport Downs 3/08/2011 6:50:00 AM 0.3 14.7 7.7 0.114 940 3.62
Diamantina River at Cowarie Crossing 28/05/2011 12:44:30 PM 3 13.52 9.25 0.183 1113.3 9.41
Diamantina River at Pandi Pandi 30/05/2011 5:27:47 PM 4 14.1810.0
5 0.183 1334 9.3
Eyre Ck at Glengyle 5/08/2011 6:50:00 AM 0.3 16.9 7.82 0.334 170 2.74
Finke River at 2 Mile Waterhole 3/05/2011 1:27:07 PM 4.9 20.31 8.63 2.574 6 0.76
Finke River at Boggy Hole 5/05/2011 10:00:13 AM 3.85 19.74 9.24 1.2 4.2 8.55
Finke River at Fish Hole 6/05/2011 10:47:09 AM 4.6 16.29 9.3 0.33 2.2 9.07
Finke River at Glen Helen Gorge 4/05/2011 12:30:26 PM 12.3 18.92 8.76 2.041 3.5 6.96
Finke River at Pioneer Creek 4/05/2011 10:27:36 AM 1.5 17.94 8.73 7.77 1.7 8.39
Finke River at Running Waters 1/05/2011 8:49:21 AM 1.8 22.18 8.76 1.169 4.3 9.22
Finke River at Snake Hole 2/05/2011 10:25:38 AM 4.9 20.79 9.19 2.065 6.2 1.24
Georgina R at 8 Mile waterhole 23/05/2011 5:34:00 PM 0.3 20.49 7.49 0.145 76.5 8.18
Georgina R at Lake Mary 24/05/2011 11:24:00 AM 0.15 19.78 7.03 0.097 94.2 6.89
King Ck at Bedourie (FNARH) 4/08/2011 6:50:00 AM 0.3 16.5 8.28 0.251 63 3.48
Kyabra Ck at Tenham 18/05/2011 7:00:00 AM 0.3 16.7 0.202 321 3.89
Macumba River at Andaranna Waterhole 19/05/2011 12:09:44 PM 2.15 16.57 8.43 3.022 6.4 9.57
LEBRA 2011 Annual Monitoring Report 26

Site Name Date Time depth (m) Temp (deg C) pHConductivity (mS/cm) Turbidity (NTU) DO (mg/L)
Macumba River at Eringa Waterhole 9/05/2011 3:40:55 PM 4.4 20.58 9.97 0.083 19.2 5
Macumba River at Ethawarra Waterhole 10/05/2011 10:41:38 AM 2.55 18.27 9.59 0.151 5.7 9.12
Macumba River at Murdarinna Waterhole 11/05/2011 10:51:32 AM 1.58 16.19 8.5 0.141 99.1 8.7
Macumba River at Winkies Waterhole 20/05/2011 10:39:00 AM 1.9 16.73 9.17 0.658 12.4 8.91
Mayne R at Winton Jundah Rd 15/05/2011 7:00:00 AM 0.2 16.4 8.25 0.167 126 5.3
Mill Ck at Oondooroo 14/05/2011 9:10:00 AM 0.2 13.9 7.6 0.16 613 8.8Neales River at Algebuckina Waterhole (West) 23/05/2011 3:07:54 PM 3.45 18.02 8.86 10.67 17.9 7.37
Neales River at Hookeys Waterhole 12/05/2011 1:28:10 PM 2.9 17.24 7.69 0.383 10.7 7.32
Neales River at Peake Crossing 23/05/2011 11:16:24 AM 1.9 17.48 8.68 80.93 8 10.99
Neales River at Stewarts Waterhole 21/05/2011 8:51:38 AM 2.9 16.27 8.49 5.586 9.5 7.76
Neales River at Warrarawoona Waterhole 25/05/2011 5:01:17 PM 2.4 16.51 9.59 2.164 16.6 10.11
Ooratippra Ck at Arapunya (road crossing) 22/05/2011 3:18:00 PM 0.24 19.47 7.9 0.4 6.7 9.73
Ooratippra Ck at Ooratippra waterhole 22/05/2011 4:00:00 PM 0.17 18.47 7.87 0.865 3.8 8.38
Rankin R at Big Rankin Waterhole 17/05/2011 6:28:00 PM 0.11 19.19 7.18 0.075 138.6 8.12
Sandover R at Junction waterhole 20/05/2011 7:11:00 AM 0.15 15.65 6.64 0.091 22.8 6
Thomson R at Ag College waterhole 11/05/2011 8:00:00 AM 0.5 14.7 8.42 0.189 198 4.89
Thomson R at Stonehenge 17/05/2011 7:00:00 AM 0.4 14.6 8.05 0.181 612 5.46
Towerhill Ck at Lammermoor 12/05/2011 7:00:00 AM 0.2 15.6 8.43 0.101 238 4.41
Vergemont Ck at Noonbah 16/05/2011 7:30:00 AM 0.3 13.8 8.52 0.056 297 5.97
Wilson R at Nooccundra 8/08/2011 7:00:00 AM 0.15 12.4 8.1 0.197 370 3.12
LEBRA 2011 Annual Monitoring Report 27

Level (Metres)
Water Temp (Deg. C)
Electrical Conductivity (us/cm)
0123456
15
20
25
30
35
40
50
90
130
170
210
250
2008/09 2009/10 2010/11
Figure 14: Water quality data collected at Thomson River at Longreach (003202a) for the period from 2008 to 2011. Note: at the time of reporting, data were not available after 8th April 2011.
LEBRA 2011 Annual Monitoring Report 28

3.3 Fish
3.3.1 Fish richness, abundance and size-classesA total of 19 fish species was collected from 45 sites (Appendix B). The most commonly encountered fish were spangled perch, which were collected at 45 sites, followed by bony herring (44 sites), desert rainbowfish (39 sites) and Hyrtl’s tandan (32 sites) (Appendix B). The lowest site richness was one species (Finke River at Fish Hole [Jay Creek Fish Hole]), whilst 12 species were the highest recorded at Cooper Creek at Cullymulla waterhole (Appendix B).
Sixteen new fish distribution records were identified during the 2010/11 post-wet season sampling (per ARIDFLO 2007, Wager and Unmack 2000 and Duguid et al. 2005), and included:
Neales River: Welch’s grunter.
Macumba River: desert glassfish, barred grunter, Welch’s grunter, Lake Eyre hardyhead and Lake Eyre golden perch.
Ooratippra Creek: bony herring, Hyrtl’s tandan and silver tandan.
Sandover River: desert glassfish, spangled perch, desert rainbowfish and Hyrtl’s tandan.
Ranken River (upper Georgina River System): Welch’s grunter.
Mid-Finke River: Finke mogurnda and Hyrtl’s tandan
LEBRA 2011 Annual Monitoring Report 29
Summary
19 species of fish were collected
Spangled perch was the most commonly collected species
Site richness varied from 1 to 12 species per site
Some sites had very high fish abundance (> 52,000 individuals); many of these sites experienced fish kills (especially in the Cooper catchment)
16 new species distribution records were recorded for the Macumba River (5 species), Neales River (1 species), Ooratippra Creek (3 species), Sandover River (4 species), Rankin River (1 species) and mid-section of the Finke River (2 species)
Eastern gambusia and goldfish were the only exotic fish species collected; redclaw were also collected
Most of the abundant fish had a wide range of size-classes
Multivariate analysis revealed 6 main site groups

The most abundant fishes, taken across all sites, were silver tandan, Hyrtl’s tandan, desert rainbowfish, bony herring, Lake Eyre hardyhead and spangled perch, which together contributed to over 93% of the total fish abundance (Appendix A).The population structure of the three most abundant fish species (silver tandan, desert rainbowfish and Hyrtl’s tandan) showed a relatively wide range of size classes, which possibly suggests recruitment conditions have been favourable for a period of time (i.e. >2 years); however peaks in fish size-classes varied between catchments (Figure 15 and Figure 16).
The desert rainbowfish were generally larger in the Cooper and Georgina catchments (Figure 15), with the size-classes peaking at between 60-70mm TL, whereas desert rainbowfish in the Diamantina Catchment were most abundant between size-classes 30-70mm (however the low numbers of desert rainbowfish in the Diamantina [i.e. 77 fish] are likely to bias these results). The western drainages (i.e. Macumba, Neales and Finke) showed similar patterns, with smaller fish collected in the Neales and Macumba (size-class peak between 30-40mm) and larger fish collected in the Finke (size-class peak between 40-60mm) (Figure 15). Silver tandans were only reported for the Cooper, Diamantina, Georgina and Macumba catchments. Once again a wide range of size-classes possibly indicates favourable recruitment over a number of years, and size classes were generally similar with most fish measuring between 100-130mm (Figure 16). This pattern was also shown in Hyrtl’s tandans, where fish were generally measured between 90-130mm (Figure 17).
0
5
10
15
20
25
30
35
40
45
50
0-10 10-20 20-30 30-40 40-50 50-60 60-70 70-80 80-90 90-100 100-110 110-120
rela
tive
abun
danc
e (%
)
Total length (mm)
Cooper (n=1437)
Diamantina (n=77)
Georgina (n=765)
Neales (n=258)
Macumba (n=582)
Finke (n=578)
Figure 15: Length frequency distribution of desert rainbowfish (Melanotaenia splendida tatei) populations in the Cooper, Diamantina, Georgina, Neales, Macumba and Finke catchments for the post 2010/11 wet season sampling.
LEBRA 2011 Annual Monitoring Report 30

0
5
10
15
20
25
30
35
40
45
50re
lativ
e ab
unda
nce
(%)
total length (mm)
Cooper (n=2496)
Diamantina (n=1115)
Georgina (n=872)
Macumba (n=150)
Figure 16: Length frequency distribution of silver tandan (Porochilus argenteus) for Cooper, Diamantina, Georgina and Macumba catchments for the post 2010/11 wet season sampling.
0
5
10
15
20
25
30
35
40
rela
tive
abun
danc
e (%
)
total length (mm)
Cooper (n=1855)
Diamantina (n=231)
Georgina (n=339)
Macumba (n=60)
Finke (n=947)
Figure 17: Length frequency distribution of Hyrtl’s tandan (Neosilurus hyrtlii) populations in the Cooper, Diamantina, Georgina, Macumba and Finke catchments for the post 2010/11 wet season sampling.
LEBRA 2011 Annual Monitoring Report 31
Of the larger bodied species, Lake Eyre golden perch and Barcoo grunter had sufficient abundances to allow a length frequency assessment. The population structure of the Lake Eyre golden perch varied between catchments (Figure 18). The Diamantina catchment had a large proportion of fish in the 20-60mm size-class, followed by another peak in fish abundance around the 80-120mm size-class. Lake Eyre golden perch in the Cooper catchment were generally well spread out with no dominant fish size-class. In the Georgina catchment, Lake Eyre golden perch had a peak in fish size-class between 200-260mm. Barcoo grunter population size-classes also differed between the Cooper and Diamantina catchments (Figure 19). Barcoo grunter in the Cooper catchment were generally larger (i.e. >200mm), although there were also a number of fish between the 120-180mm size-class. The Cooper catchment Barcoo grunters were generally smaller, with a large peak in fish abundances between the 140-180mm size-class.
0
5
10
15
20
25
30
0-20
20-4
0
40-6
0
60-8
0
80-1
00
100-
120
120-
140
140-
160
160-
180
180-
200
200-
220
220-
240
240-
260
260-
280
280-
300
300-
320
320-
340
340-
360
360-
380
380-
400
400-
420
420-
440
440-
460
460-
480
rela
tive
abun
danc
e (%
)
total length (mm)
Cooper (n=334)
Diamantina (n=1191)
Georgina (n=410)
Figure 18: Length frequency distribution of Lake Eyre golden perch (Macquaria sp. B) populations in the Cooper, Diamantina and Georgina catchments for the post 2010/11 wet season sampling.
LEBRA 2011 Annual Monitoring Report 32

0
5
10
15
20
25
0-20 20-40 40-60 60-80 80-100 100-120 120-140 140-160 160-180 180-200 200-220 220-240 240-260 260-280 280-300 300-320 320-340
rela
tive
abun
danc
e (%
)
total length (mm)
Cooper (n=92)
Diamantina (n=102)
Figure 19: Length frequency distribution of Barcoo grunter (Scortum barcoo) populations in the Cooper and Diamantina catchments for the post 2010/11 wet season sampling.
Two exotic species were collected; eastern gambusia and goldfish. Eastern gambusia were collected at only five sites throughout the Cooper catchment and two in the Neales catchment. Abundances varied between sites, with abundances in excess of 100 individuals collected in some of the SA sites (Appendix B). Goldfish were collected at only five sites in the Cooper catchment downstream of Windorah; however they were locally abundant, contributing to up to 15% of the overall catch per site (Appendix B). Like many of the smaller bodied native species, the population structures of eastern gambusia and goldfish suggest a continuous recruitment pattern, with a wide size range in the fish collected (Figure 20).
LEBRA 2011 Annual Monitoring Report 33

15 20 25 30 35 40 45 50 55 60
total length (mm)
0
20
40
60
80
100
120No
of o
bs
20 40 60 80 100 120 140 160 180 200 220 240 260 280
total length (mm)
0
20
40
60
80
100
120
140
160
No o
f obs
Figure 20: Length frequency distribution graph of the exotic fish, eastern gambusia (Gambusia holbrooki) (top graph) and goldfish (Carassius auratus) (bottom graph) populations for the post-2010/11 wet season sampling.
Redclaw crayfish (Cherax quadricarinatus), which do not occur naturally within the LEB, were also collected and/or observed in the upper to mid reaches of the Georgina, Diamantina and Cooper catchments. In the Georgina catchment, redclaw were collected at sites as far south as Boulia, whilst in the Diamantina catchment, redclaw were found as far south as the Diamantina Gates National Park (B. Cockayne pers. obs). Redclaw movement in the Cooper catchment has extended to as far south as
LEBRA 2011 Annual Monitoring Report 34

Stonehenge (Angus Emmott pers com.). Future monitoring will track the movement of redclaw crayfish, and translocated other introduced fish species, throughout the LEB.
Collections of diseased fish and fish kills were a common occurrence during the 2010/11 post-wet season monitoring, particularly at Queensland sites (Table 5). Most sites had less than 5% of diseased fish; however diseased fish accounted for up to 80% of the total catch (Table 5).
Table 5: Number of sites affected and percent of diseased fish for each of the LEB catchments.
Catchment Total Sites (n) Sites with Disease Lowest disease rate Highest disease rate
Cooper 16 14 0% 31%
Georgina 5 3 0% 80%
Diamantina 7 7 <1% 5%
Finke 7 0 0% 0%
Macumba 5 5 9% 15%
Neales 5 1 0% <1%
3.3.2 Fish community patterns (multivariate analysis)Cluster analysis on presence/absence data revealed 6 main groups of fish communities (Figure 21 to Figure 23). These included:
Group 1- The largest conglomerate of sites contains 27 of the 45 sites, with the vast majority of Queensland sites (18 of 19 sites) falling into this group. For the most part, there was a large diversity of fish species, with most sites having more than eight taxa.
Group 2 –All six sites in Group 2 were within the Finke catchment. These were the only sites to contain the endemic Finke mogurnda and Finke goby (Chlamydogobius japalpa).
Group 3 –Three of the sites within this grouping were from the Macumba catchment, and were characterised by generally low species richness (3 taxa- bony herring, spangled perch and rainbowfish). These sites are located in the upper sections of the catchment.
Group 4- Four of the five Neales river sites were within this cluster group of six sites. Species richness was moderate and ranged from five to nine taxa. Like Group 3 bony herring, rainbowfish and spangled perch were common to these sites. Lake Eyre golden perch and eastern gambusia were both common at five of the six sites.
Group 5- this single site grouping, Finke River at Fish hole, contained only spangled perch. This site was located in the upper Finke catchment and is likely to dry out in extreme drought
LEBRA 2011 Annual Monitoring Report 35
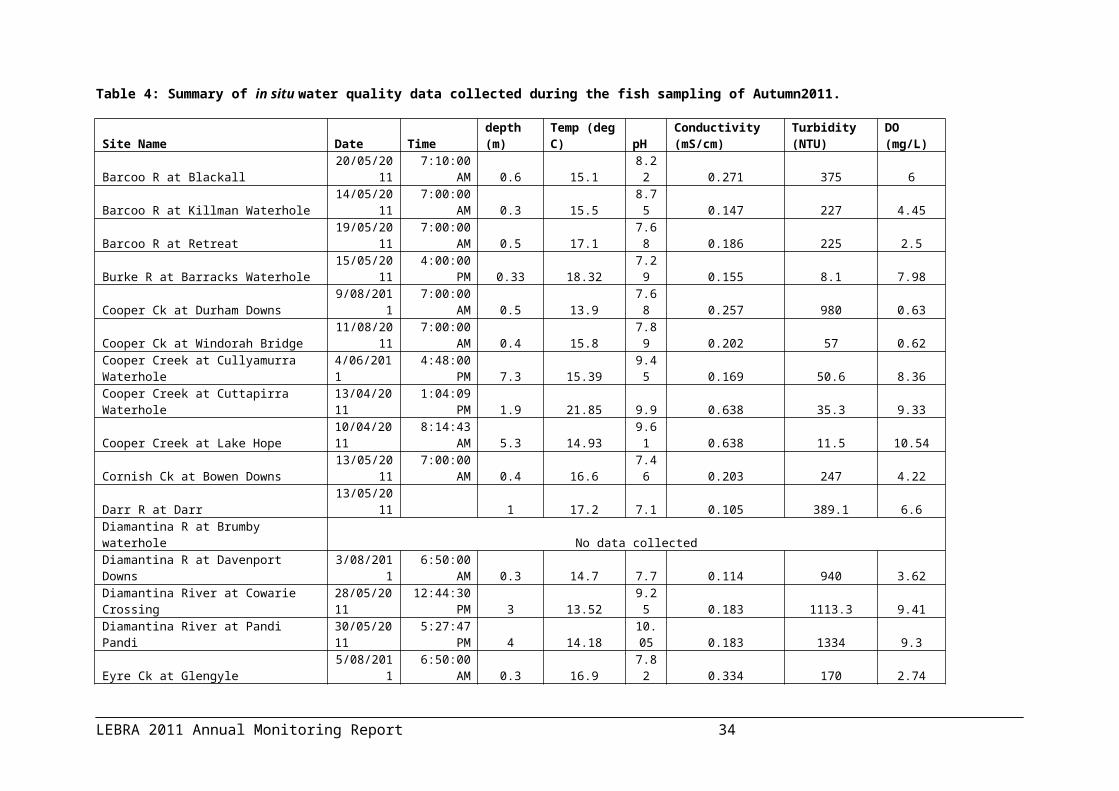
conditions. It is unclear whether this population of spangled perch is established in the site or represents transient immigrants from recent flows.
Group 6 – Peake Creek at Peake Ck crossing was the only site within grouping 6. This site is a shallow, hypersaline habitat which contained only four fish species; very large numbers of Lake Eyre hardyhead and desert goby and smaller numbers of bony herring and barred grunter.
LEBRA 2011 Annual Monitoring Report 36

Bray-Curtis Similarity
PeakeWaterhole (N)
Fish Hole (F)
Cowarie Crossing (D)
Algebuckina Waterhole (N)
Warrarawoona Waterhole (N)
Cuttapirra Waterhole (C)
Hookeys Waterhole (N)
Stewarts Waterhole (N)
Bowen Downs (C)
Murdarinna Waterhole (M)
Eringa Waterhole (M)
Ethawarra Waterhole (M)
Pioneer Creek (F)
Boggy Hole (F)
2 Mile Waterhole (F)
Snake Hole (F)
Glen Helen Gorge (F)
Running Waters (F)
Oondooroo (D)
Windorah Bridge (C)
Retreat (C)
Durham Downs (C)
Stonehenge (C)
Nooccundra (C)
Lake Hope (C)
Cullyamurra Waterhole (C)
Killman Waterhole (C)
Ag College waterhole (C)
Darr (C)
Blackall (C)
Lammermoor (C)
Winkies Waterhole (M)
Junction waterhole (S)
Ooratippra waterhole (S)
VergemontCk (C)
Winton Jundah Rd (D)
Brumby waterhole (D)
Davenport Downs (D)
Glengyle (G)
BedourieFnarh (G)
Big Ranken Waterhole (G)
PandiPandi (D)
Tenham (C)
Andaranna Waterhole (M)
Barracks Waterhole (D)
20 40 60 80 100
2
5
4
3
6
Figure 21. Classification (cluster analysis) of the species richness of fish communities at the 45 sites monitored during the 2011 post-wet season monitoring. The dendogram was constructed using Bray-Curtis similarity (Primer 5) based on presence/absence data. The vertical line and numbers to the right-hand indicate the site clusters.
LEBRA 2011 Annual Monitoring Report 37
1

1
2
3
4
5
6
Stress: 0.14
Figure 22: NMDS ordination of the fish assemblages at the 45 sites monitored during the 2011 post-wet season monitoring. Groupings (and numbers) are based upon the group separations from the cluster analysis (seeFigure 21).
Figure 23: Geographic positions of cluster analysis groups of adult fish communities for the 2010/11 post-wet season. Colours of each site correspond to those in Figure 22.
LEBRA 2011 Annual Monitoring Report 38

4 OutcomesThe first round of LEBRA sampling has been an important step towards the implementation of a monitoring program to improve our understanding of the ecosystems of the LEB. This report presents the data from the first monitoring round. Further analyses and testing of hypotheses and ToPCs will be included in the 2014 (mid-term assessment) and 2018 (10 year assessment) reports.
The first round of fish sampling identified some areas of refinement to the fish monitoring protocols. The fish sampling protocol for the 2012 LEBRA Project Plan will be refined to include:
o 6 x Fyke small meshed single-winged design (3 m wing, 4mm mesh, 3m funnel, 0.6m high) (same as previous sampling)
o 2 x Fyke large hoop double-wing design (2 x 10m wing, 12mm mesh,5 m funnels, 1.2m high) (same as previous sampling)
o 1 x Seine Net (3m x 1.2m drop, 2mm mesh, in built collection bag, leaded rope on bottom) (same as previous sampling)
o Bait traps- as a new method, a pilot study will be conducted during the post wet 2011/12 to identify the most effective ways of using bait traps. This will include un-baited, baited (cat food or similar) and glo-stick attractant.
The following methods will not be included in the 2012 LEBRA Project Plan methodology:
o 4 x Fyke small meshed double-wing design (2 x 5m wing, 4mm mesh, 3 m funnels, 0.6m high). It was found that these nets added too much additional time to net setting/retrieval and did not add new information about fish species richness and assemblage composition.
o Yabby nets- these generally did not add to presence/absence data for yabbies or redclaw which were effectively sampled with the Fyke nets.
LEBRA 2011 Annual Monitoring Report 39

5 References
Arthington, A.H., S. R. Balcombe, G.A. Wilson, M.C. Thoms, and J. Marshall (2005). Spatial and temporal variation in fish assemblage structure in isolated waterholes during the 2001 dry season of an arid-zone floodplain river, Cooper Creek, Australia. Marine and Freshwater Research 56: 25-35.
Allen, G.R., Midgley, S.H. and Allen, M. (2002). Field Guide to the Freshwater Fishes of Australia. CSIRO Publishing, Collingwood.
Brim Box, J., Duguid, A. Read, R. Kimber, R.G., Knapton, A., Davis, J. and Bowland, A.E., 2008, Central Australian waterbodies: the importance of permanence in a desert landscape. Journal of Arid Environments 72, pp. 1395-1413.
Costelloe, J.F., Hudson, P.J., Pritchard, J.C., Puckridge, J.T. and Reid, J.R.W. (2004). ARIDFLO Scientific Report: Environmental Flow Requirements of Arid Zone Rivers with Particular Reference to the Lake Eyre Drainage Basin. School of Earth and Environmental Sciences, University of Adelaide, Adelaide. Final Report to South Australian Department of Water, Land and Biodiversity Conservation and Commonwealth Department of Environment and Heritage.
Department of Natural Resources and Mines (DNRM) (2011) Queensland Water monitoring Database (Hydstra). Date accessed November 2011.
Department of Sustainability, Environment, Water, Population and Communities (SEWPaC) (2011). Lake Eyre Basin Rivers Assessment Project Plan (Tier 3), Canberra, ACT.
Duguid, A., Barnetson, J., Clifford, B., Pavey, C., Albrecht, D., Risler, J. and McNellie, M. (2005) Wetlands in the arid Northern Territory. A report to the Australian Government Department of the Environment and Heritage on the inventory and significance of wetlands in the arid NT. Northern Territory Government Department of Natural Resources, Environment and the Arts. Alice Springs.(http://www.nt.gov.au/nreta/wildlife/nature/aridwetlands.html)
Kingsford, R.T. and Biggs, H.C. (2012). Strategic adaptive management guidelines for effective conservation of freshwater ecosystems in and around protected areas of the world. IUCN WCPA Freshwater Taskforce, Australian Wetlands and Rivers Centre, Sydney.
LEBRA 2011 Annual Monitoring Report 40

McNeil, D. and Cockayne, B. J. (2011). Proposed Guidelines for Fish Monitoring Lake Eyre Basin Rivers Assessment (LEBRA).
Robson, B.J., Chester, E.T., Mitchell B.D., Matthews T.G. (2008). Identification and management of refuges for aquatic organisms: Waterlines report.' National Water Commission, Canberra.
Sheldon, F. & Fellows, C. S. (2010). Water quality in two Australian dryland rivers: spatial and temporal variability and the role of flow. Marine and Freshwater Research 61: 864–874.
Thoms, M., Capon, S., Price, R. & Watkins, D. (2009). Lake Eyre Basin Rivers Assessment Implementation Plan Project- Milestone 2 Report: Proposed LEB Rivers Assessment Methodology. Kiri-ganai Research.
Wager, R.N. & Unmack, P.J. (2000). Fishes of the Lake Eyre Catchment of Central Australia. Brisbane: Department of Primary Industries and Queensland Fisheries Service.
LEBRA 2011 Annual Monitoring Report 41

6 AppendicesAppendix A: Distribution of riverine fish fauna in the study area (updated from Unmack and Wager, 2000). ● known distribution; * exotic/introduced native fish; ^ endemic to the LEB
CatchmentFamily Genus Species Common name Cooper Diamantina Finke Georgina Macumba Neales Ambassidae Ambassis mulleri Desert Glassfish^ ● ● ● ● ● -Atherinidae Craterocephalus centralis Finke River Hardyhead^ - - ● - - -
Craterocephalus eyresii Lake Eyre Hardyhead^ ● ● - ● ● ●Clupeidae Nematalosa erebi Bony Bream ● ● ● ● ● ●Cyprinidae Carassius auratus# Goldfish* ● - - - - -Eleotridae Hypseleotris spp. (3 species) Carp Gudgeon ● - - - - -
Mogurnda clivicola Flinders Ranges Mogurnda^ ● - - - - -Mogurnda larapintae Finke Mogurnda^ - - ● - - -Mogurnda sp. Frew Mogurnda^ - - - ● - -Oxyeleotris lineolatus Sleepy cod* ● - - - - -
Gobiidae Chlamydogobius eremius Desert Goby^ - ● - - - ●Chlamydogobius japalpa Finke Goby^ - - ● - - -Glossogobius aureus Golden Goby^ - ● - ● - -
Melanotaeniidae Melanotaenia splendida tatei Desert Rainbow Fish^ ● ● ● ● ● ●Percichthyidae Macquaria ambigua Murray-Darling golden
perch* - - - ● - -
Macquaria sp. B Lake Eyre golden perch^ ● ● - ● ● ●Maccullochella peelii peelii Murray cod* ● - - - - -
Plotosidae Neosiluroides cooperensis Cooper Catfish^ ● - - - - -Neosilurus hyrtlii Hyrtl's Catfish ● ● ● ● ● ●Porochilus argenteus Silver Tandan ● ● - ● ● ●
Poeciliidae Gambusia holbrooki# Eastern Gambusia* ● ● - ● - ●Retropinnidae Retropinna semoni Australian Smelt ● - - - - -Terapontidae Amniataba percoides Barred Grunter - ● ● ● ● ●
Bidyanus bidyanus Silver Perch* - - - ● - -Bidyanus welchi Welch's Grunter^ ● ● - ● ● ●Leiopotherapon unicolour Spangled Perch ● ● ● ● ● ●Scortum barcoo Barcoo Grunter ● ● - ● - -
LEBRA 2011 Annual Monitoring Report 42
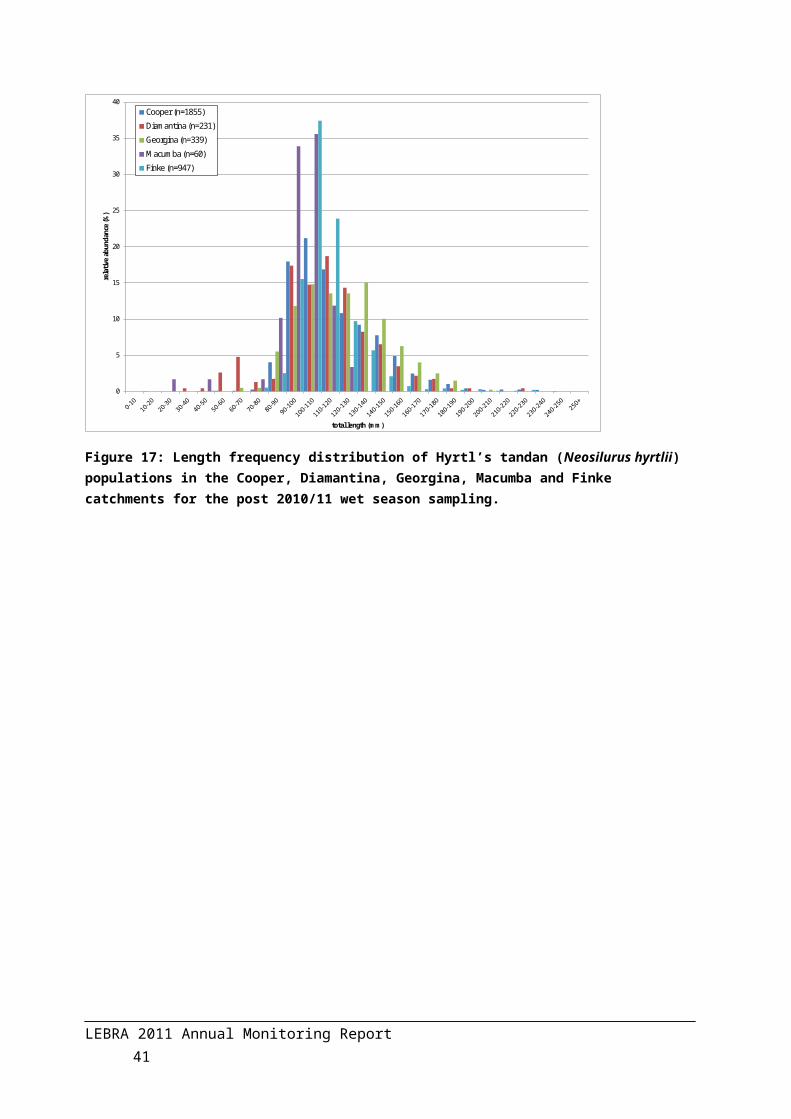
Appendix B: Relative abundance of fish species collected during the 2011 post wet season sampling. Relative abundance : - <100; - 101 to 500; - > 500. Invasive species are indicated with #.
Catchment Site
Amba
ssism
ulle
ri
Amni
atab
a pe
rcoi
des
Bidy
anus
wel
chi
Chla
myd
ogob
ius e
rem
ius
Chla
myd
ogob
iusja
palp
a
Crat
eroc
epha
lusc
entr
alis
Crat
eroc
epha
lus e
yres
ii
Glos
sogo
bius
aure
us
Hyps
eleo
tris
sp.
Leio
poth
erap
on u
nico
lour
Mac
quar
ia sp
. B
Mel
anot
aeni
a sp
lend
ida
tate
i
Mog
urnd
a la
rapi
ntae
Nem
atal
osa
ereb
i
Neo
silur
us co
oper
ensis
Neo
silur
us h
yrtli
i
Poro
chilu
s arg
ente
us
Retr
opin
na se
mon
i
Scor
tum
bar
coo
Cara
ssiu
s aur
atus
#
Gam
busia
hol
broo
ki#
Species richness
Cooper Ag College waterhole 10
Blackall 8
Bowen Downs 6
Cullyamurra Waterhole 12
Cuttapirra Waterhole 7
Darr 8
Durham Downs 9
Killman Waterhole 10
Lake Hope 10
Lammermoor 7
Nooccundra 10
Noonbah 8
Retreat 8
Stonehenge 8
Tenham 10
Windorah Bridge 7
Diamantina Barracks Waterhole 9
Brumby waterhole 8
Cowarie Crossing 9
Davenport Downs 8
Oondooroo 7
PandiPandi 9
Winton Jundah Rd 8
Finke 2 Mile Waterhole 9
Boggy Hole 7
Fish Hole 1
Glen Helen Gorge 8
LEBRA 2011 Annual Monitoring Report 43

Catchment Site
Amba
ssism
ulle
ri
Amni
atab
a pe
rcoi
des
Bidy
anus
wel
chi
Chla
myd
ogob
ius e
rem
ius
Chla
myd
ogob
iusja
palp
a
Crat
eroc
epha
lusc
entr
alis
Crat
eroc
epha
lus e
yres
ii
Glos
sogo
bius
aure
us
Hyps
eleo
tris
sp.
Leio
poth
erap
on u
nico
lour
Mac
quar
ia sp
. B
Mel
anot
aeni
a sp
lend
ida
tate
i
Mog
urnd
a la
rapi
ntae
Nem
atal
osa
ereb
i
Neo
silur
us co
oper
ensis
Neo
silur
us h
yrtli
i
Poro
chilu
s arg
ente
us
Retr
opin
na se
mon
i
Scor
tum
bar
coo
Cara
ssiu
s aur
atus
#
Gam
busia
hol
broo
ki#
Species richness
Pioneer Creek 7
Running Waters 8
Snake Hole 8
Georgina Junction waterhole 6
Ooratippra waterhole 6
Bedourie Fnarh 10
Big Ranken Waterhole 11
Glengyle 10
Macumba Andaranna Waterhole 10
Eringa Waterhole 3
Ethawarra Waterhole 3
Murdarinna Waterhole 3
Winkies Waterhole 7
Neales Algebuckina Waterhole (West) 8
Hookeys Waterhole 5
Peake Waterhole 4
Stewarts Waterhole 5
Warrarawoona Waterhole 6
% of total catch 1.8% 1.3% 0.4% 0.3% <0.1% <0.1% 6.0% <0.1% 0.1% 4.5% 1.1% 9.1% <0.1% 6.6% 0.1% 15.8% 52.4% <0.1% 0.4% 1.0% 0.9%
LEBRA 2011 Annual Monitoring Report 44