studynotesunisa.co.za · web viewmnm302-5 summary. study unit 1 – role of marketing research ....
TRANSCRIPT
MNM302-5 SUMMARYSTUDY UNIT 1 – ROLE OF MARKETING RESEARCH
DEFINING MARKETINGMarketing can be defined as those decisions made in a business organisation about whom to serve with what product. The definition refers to two decision making areas:
Demarcating the enterprise’s potential consumers into market segments and to decide which of these market segments to choose as a target market.
Developing a total product consisting of the actual product, the distribution to the target market, marketing the product to the consumers by means of advertising and determining the price that will be acceptable to the target market. These four components - product, price, promotion and place - are known as the marketing mix.
To determine the enterprise’s strengths and weaknesses, the opportunities open to the enterprise and the threats that it will face, an analysis of the business environment needs to be conducted. This is where “marketing research” comes into play. The analysis of the marketing environment is also called a “situation analysis”
DEFINING MARKETING RESEARCHMarketing research can be defined as the systematic collection, analysis and interpretation of information about all marketing problems by means of recognized scientific methods to provide information that marketing management can use in the decision-making process.
THE CHARACTERISTICS OF MARKETING RESEARCH: Quantitative vs. Qualitative - Can be scrutinized mathematically. Determining the effect which an increase in the fuel
price would have on the consumption of the organization’s product is qualitative in nature. Applied vs. Basic Research - Is aimed at analysing an opportunity or a threat in the marketplace. The research findings
can be applied to take advantage of the opportunity, or to address the threat in the marketing environment. Basic research is aimed at extending knowledge. For example – Years ago research was initiated to find alternative fuels to petrol. Hydrogen was one of these alternatives = basic research. Later on, motor vehicle manufacturers started to developed a hydrogen-powered car = applied research.
Inaccurate vs. Accurate - Marketing research findings can be highly accurate or fairly accurate. For example – Analysing the colour preferences of a firm’s consumers can result in accurate data regarding the need for each colour. Estimating the drop in sales when a firm decreases its advertising expenditure cannot be accurate.
Time vs. Budget Constraints - Most research ventures are aimed at addressing threats or opportunities which require rapid response. An elaborate research design and extensive fieldwork is time consuming and NOT possible. Visiting 300 consumers (respondents) at home and asking them about their usage of our product is a costly exercise.
THE ROLE OF MARKETING RESEARCH IN THE MARKETING MANAGEMENT PROCESSMarketing research is not only conducted as part of the situational analysis, it is also utilized in three phases of the marketing management process.
Who we plan to serve the target market with a specific product (marketing mix – 4 P’s) The marketing strategy is formulated by addressing two decisions
I. Defining served market segments. II. Establishing the competitive advantage of the product.
The development of the marketing mix programes (4 P’s). The final phase of the marketing planning process is the control phase during which the results of the marketing programmes are evaluated against the objectives that were set for them.
Marketing plays 3 functional roles in marketing decision making: DESCRIPTIVE – gathering and presenting statements and facts DIAGNOSTIC- Explaining of data or actions PREDICTIVE – Specification of how to use descriptive and diagnostic
BENEFITS OF MARKETING RESEARCH

Marketing research offers a range of benefits to marketers: It helps managers in decision-making, because they can be proactive by anticipating changes in the market and in
consumer desires. It helps a manager to present a more accurate definition of marketing problems and opportunities. It offers a reliable method of prediction. It provides the company with a competitive edge. It results in more efficient expenditure. Business risk can be reduced. The effectiveness of the marketing plan can be monitored.
STUDY UNIT 2: MARKETING INFORMATION SYSTEMS (MIS)
With so much marketing information available to the marketer, a way has to be found to organise this information so it can be readily accessed for use in decision making. The rapid growth of information has made the task easier because computers can now be used to store and organise this information.
A marketing information system can be defined as:A set of inter-related components that collect (or retrieve), process, store and distribute information to support decision making and control in an organisation.
Three types of information can be extracted: Recurrent information: Information that is continuously provided to managers. For example: weekly sales figures per
product or per region. Monitoring information: Information obtained from sources relevant to the particular company of industry. For
example: internet websites or trade publications. Requester information: Specific information that is requested and then collected as part of a specific query from
marketing management.
THE VALUE OF MARKETING INFORMATIONFor a marketing information system to be of any use, Information must be of high quality and add value to the decision making process therefore very important to ensure that information meets the following criteria.
Relevant (meaningful): Management must be able to use the information to make decisions about target markets, products, prices, distribution and marketing communication. Must be suitable for solving the problem on hand.
Useful: It must be made available in a form that the user can understand and apply. Timeous: Must be available on a continuous basis (whenever decision must be made) and up to date. Accurate: Must reflect the realities of the situation in which the organisation is operating and the problems being
experienced. Adequate: Sufficient qualitative and quantitative information. Available: Should be in a form that is easy to access.
Collecting information and operating MIS (marketing information system) has a cost component consist of direct costs and opportunity costs. Direct costs refer to the collection and management of information. Opportunity costs refer, for example, to costs arising from a decision that was delayed because of a lack of information.
OBJECTIVES OF AN MISThe primary objective of an MIS is to make relevant, useful, timeous information available to marketing management on a continuous basis and in so doing, reduce the risk of making wrong decisions.
The secondary objective of an MIS will vary according to the nature of the organisation and the products and / or services offered on the market. They may include:
To identify shortcomings. To distribute marketing activities more effectively. To identify the need for new products and provide information. To determine prices in order to remain competitive. To motivate sales staff.
TYPES OF MARKETING INFORMATION SYSTEMSThe type of MIS in an organisation will depend on its size and the industry in which it operates. A simple MIS consist of a routine data component and a special purpose component. Routine data can be obtained from internal sources (sales, stock, debtors and creditors) and external sources (population growth, competitive activities). For the special purpose component, marketing research must be conducted. If the establishment itself conducts it, it is called internal research. Research undertaken by a marketing research agent is referred to as external research.

COMPONENTS OF AN MIS1. The internal reporting subsystem: Such information is gathered by way of internal reports from within the
organisation. They may include: sales reports, stock records, debtors and creditors statements. Most valuable information comes from sales invoices, sales force information and accounting information. The internal reporting subsystem contains information about the organisation’s past results and used for identifying opportunities and threats.
2. The marketing intelligence subsystem: The internal reporting subsystem focuses on results and marketing intelligence focuses on happenings. It is set of procedures and sources used to acquire the information. Can be obtained by personnel who are assigned to look for anything that seems pertinent to the organisation or by scanning newspapers, magazines and trade publications.
3. The statistical subsystem: Combines various statistical data series and the application of statistical models. Information from the databases is processed statistically to develop certain predictions, scenarios and models that decrease the risk of decision making.
4. The marketing research subsystem: Marketing research is the collection, analysis and interpretation of information about specific marketing matters. This system is used only when specific information is needed.
5. Marketing decision support system (MDSS). The purpose of a statistical subsystem is to combine marketing data from diverse sources into a single database which marketing managers can enter interactively to identify problems and opportunities and then obtain standard, periodic reports and answers to analytical questions.
An MDSS defined as:A co-ordinated collection of data, systems, tools and techniques with supporting software and hardware by which an organisation gathers and interprets relevant information from business and the environment and turns it into a basis for marketing decisions.
CHARACTERISTICS OF A GOOD MDSS: Interactive. System should be easy to use by the user. Flexible. System should be able to provide information in different forms according to the needs of the user. Discovery oriented. The user should be able to use the system to identify new trends or patterns and then to ask new
questions based on these trends or patterns. User friendly. Should be easy to understand and use and not be a source of frustration to the user.
THE MDSS CONSISTS OF THE FOLLOWING COMPONENTS: Database (the data system). The data system with internal and external information from a wide variety of sources and
topics. The way which the information is stored in the system should be flexible enough to allow the information to be analysed from a number of different angles.
Reports and displays. The system is able to generate basic tables and reports as well as complex charts and other graphic representations.
Modelling. The system is able to manipulate data and conduct analyses according to the requirements of a specific user.
Analysis. Using the data contained in the system, the user is able to make more in-depth calculations and analyses including cross calculations, seasonal analyses etc.
It is important to remember that the type of marketing information system varies from organisation to organisation and depends on their requirements and available resources.
STUDY UNIT 3: The Marketing Research Industry
To obtain timely and relevant information, researchers need to be aware and have knowledge of the marketing research industry in South Africa so that they know where to obtain information if they need it.
STRUCTURE OF THE MARKETING RESEARCH INDUSTRYThe marketing research industry is structured into three levels:
Information user Research agencies Information sources
FIRST LEVEL - INFORMATION USERSBusiness organisations are the main users of data collected through marketing research. Large organisations sometimes have internal research departments that undertake mainly secondary research and minor, formal or primary projects, but they may

still occasionally employ professional marketing research organizations. Small businesses use mainly secondary sources, but when circumstances require it, they will contract a research firm to collect the primary data.Advertising agencies are the other users of data. They require information on demographic composition and changes in the consumer market, as well as data on media usage by consumers across a broad spectrum of products. These data could be obtained from syndicated sources which marketing research organization collect for a wide market. Example of a syndicated data source: The AMPS research project (All Media and Products Survey) containing a comprehensive survey of consumers’ media usage.
SECOND LEVEL - RESEARCH INSTITUTIONSThe second level in the marketing research industry consists of organisations that collect marketing data for information users. These organisations are called market research agencies; marketing consultants may also undertake marketing research on behalf of their clients. Large organizations (such as Toyota, Anglo American and Edgars) have internal marketing research departments. These departments collect secondary data, which they process, as well as primary data from their consumer corps. They also undertake large-scale research projects in collaboration with outside research agencies.
THIRD LEVEL - INFORMATION SOURCESSources of research data represent the third level in marketing research industry. Current and potential consumers are the main sources of primary data. The main source for secondary information is general, published data in newspapers, business journals and industry-specific publication, and the internet.A country’s marketing research environment can contribute greatly to the search for relevant and timely information needed by marketing managers. Let us now consider South Africa’s marketing research environment.
THE SOUTH AFRICAN MARKETING RESEARCH ENVIRONMENTMarketing research Institutions in South Africa include:
The South African Marketing Research Association (SAMRA) The South African Advertising Research Foundation (SAARF) The Bureau of Market Research (BMR) Research Suppliers of Southern Africa (RSSA)
STUDY UNIT 4: TYPES OF RESEARCH
Marketing research is undertaken for various reasons and there is a logical sequence of steps to be followed to ensure the identified problem is solved.Marketing research:
o specifies what information you will require o Selects data-collection methods o Implements & manages data-collection process o Analyses results o Communicates findings & implications to marketing management, in order to solve marketing problem meaningfully.
The marketing research process depends on the marketing problem. Projects could be relatively straightforward, completed quickly while others are complex and there is a lot more work involved. Due to variety of possible projects, each marketing problem determines its own procedure to a certain extent.
DISTINGUISH BETWEEN PRELIMINARY & FORMAL MARKETING RESEARCH Preliminary marketing research is undertaken to establish whether there is a need for research and what type of
research is required, as well as to establish the feasibility & value of conducting a formal research project. Besides the cost-benefit analysis, decision to conduct formal research is also influenced by the nature of the problem,
type of information required & amount of information available. Marketing problems encountered can be represented on a continuum with certainty & ambiguity at opposite ends and
each point has an influence on type & extent of research that needs to be carried out. o Certainty: All required information is available and accessible, problem clearly defined, answers obtainable,
then formal research should not be necessary o Uncertainty: Basic problem understood but insufficient information is available about alternatives & solutions.
In this case more effort needed to gain clarity on problem at hand

o Ambiguity: Exact nature of problem unclear & insufficient information available to solve it using secondary data, thus formal research will probably be necessary
PRELIMINARY MARKETING RESEARCH The following steps are performed during a preliminary marketing research investigation:
o Define the nature and extent of the marketing problem or opportunity o Develop hypotheses (depending on the nature of the problem at hand)o Formulate a comprehensive research problem o Set research objectives o Determine the research design & prepare a research proposal o Collect the secondary data
A situation analysis or internal & external marketing analysis is carried out to perform these steps. Creates a clearer picture of the internal & external situation surrounding the problem or opportunity. Situational analysis gathers information about:
o the marketing objectives & strategies of the enterprise: product, distribution, price & marketing communications strategy
o the resources of the enterprise: specifically its strengths & weaknesses o the enterprise market: specific information about the consumers, the market structure & competitors o the general situation in the external environment: economic conditions, socio-cultural factors, technological
developments & government action. Purpose of the preliminary marketing investigation is to research the secondary sources of information No further marketing research needs to be undertaken if management was able to solve the problem using the
secondary information collected.
FORMAL MARKETING RESEARCH If a problem is not solved then a formal marketing investigation is conducted Advisable to anticipate the probable findings & recommendations of the formal investigation Management must first decide if it is advisable to proceed with a formal investigation e.g. can they justify it
economically, do they have internal resources, if they do not the decision could be taken not to proceed. When management does proceed with a formal marketing investigation, the following steps must be taken:
o Select the method of primary-data collection o Design the questionnaire o Design the sample o Conduct the investigation o Process the data o Analyse the data o Interpret the results and compile the research report
RESEARCH DESIGN A research design is simply the outline, framework or plan for the research project that is used to guide data collection
& analysis The design ensures that the study addresses the relevant problem in the most cost-effective manner Many research designs can be classified according to the fundamental objective of the research into three basic
categories: exploratory, descriptive & causal
EXPLORATORY STUDIES/RESEARCH Exploratory studies are intended to explore a relatively unknown area. It is necessary when more information is
required about a problem, opportunity or phenomenon and especially to collect data that can contribute to more meaningful research questions.
Objectives of an exploratory study are as follows: To acquire new insight into the phenomenon To be a preliminary survey before a more structured study of the phenomenon To explain central concepts & constructs To determine priorities for further research
To develop new hypotheses about an existing phenomenon The ultimate objective is to acquire insight and develop understanding rather than to collect accurate, replicable data.
This type of study involves conducting in-depth interviews, analysing case studies and using sources. Methods for conducting exploratory research:
o Secondary data analysis, experience research, case studies & pilot studies.
DESCRIPTIVE STUDIES/RESEARCH Necessary when knowledge of a particular market aspect is vague Descriptive research can describe opportunities or threats and answer the questions: who, what, when, where & why? Descriptive research is based on some previous understanding of the nature of the research problem but the
conclusive evidence necessary to answer questions and determine a course of action has not been collected. The objective of descriptive research is to describe the research domain accurately and thoroughly. Methods used for
descriptive research include: longitudinal & cross-sectional studies. Longitudinal studies: Known as time-series studies & involve a repetitive measurement of the same sample of elements
over time. Two types of longitudinal studies:o Continuous or true panels rely on the repeated measure of the same variables. Each panel member
is measured on the same characteristic at each time o In discontinuous/omnibus panels the information collected from the members of the panel varies.
Each panel member is measured on a different characteristic each time Cross-sectional studies: Type of research design that involves collecting information from any given sample of
population at once. Two characteristics distinguish cross-sectional from longitudinal studies:o A snapshot of the variable concerned is provided at a given point in time o The sample of elements is representative of the target population.
CAUSAL STUDIES/RESEARCH Examines whether one variable causes or determines the value of another variable. The research is conducted
to reveal cause and effect between the dependent and independent variables. E.g. increased advertising expenditure (cause) is the independent variable & an increased sale (effect) is the dependent variable.
Causal research may be performed in laboratories or in carefully controlled field settings, such as restaurants or home where the researcher is able to exert some control over the environment.
Laboratory experiments: Researchers create the exact conditions of the situations in an artificial environment in order to control and manipulate variables and investigate the result
Field experiments: Experiments conducted in a natural setting or real market conditions where complete control of extraneous variables is not possible.
Causal research is directly linked to predictive studies. Predictive research is used to estimate future values such as sales income, market shares & retail orders.
PLAN THE RESEARCH PROJECT The research plan specifies the required data & the general outline of the procedures for collecting, processing &
analysing the data. How to draft a research plan: Researcher decides what type of data to be collected, method of data collection, sample
size, sampling method & data processing & data analysis methods. The following procedure must also be followed when drafting a research plan:
o Identify data requirements & determine the sources There are two broad groups of data requirements: secondary and primary data When determining type of data needed, researcher takes into account the problem, hypotheses & research
objectives. The required information can be facts, opinions, motivations, levels of awareness, preference or behaviour and depending on the nature of the problem or opportunity one or more of the above categories may be required.
o Identify the data sources The data sources are places where the researcher can obtain the data. Primary & secondary data can be obtained
from both internal & external sources o Determine the method of data collection
Determine what method to use for collecting the primary data
Primary data can be obtained in three ways: observation, experimentation or survey o Identify the research measurement instruments
Which instrument to use for collecting primary data. There are two principal research instruments: the questionnaire & mechanical or electronic equipment
o Design the sample plan Researcher must identify individuals/respondents who will be involved in research project Three basic aspects must be considered: the definition of the population, sample selection method and sample size
o Identify the methods of data analysis How collected data will be processed and prepared for analysis: how editing, coding & tabulating will be done Researcher must identify analysis technique to convert data into relevant information for decision making. This is
determined by the sample, data-collection method & measuring instrument
SCHEDULE THE RESEARCH PROJECT Researcher must decide how long particular project will take to complete. Thus a timetable must be drawn up to
calculate the shortest possible time. Time schedule is also an excellent control instrument Drawing up a time schedule, the different activities/steps must be identified & their duration determined. A daily
record must be kept of actual time spent on activities & compared with the time schedule. Apart from the days indicated to complete an activity, researcher can also specify the start dates of activities and the start & finish dates of project as a whole.
BUDGET FOR THE RESEARCH PROJECT Cost influences the decision to implement research projects thus cost estimates must be as accurate as possible & use
the time schedule as a basis when preparing a budget. The researcher must decide whether the project has any value or benefit. Two critical questions can be asked:
o What is the probable cost of the project? o Will the benefit/profit be greater than the cost?
Researcher does cost/benefit analysis
THE RESEACH PROPOSAL A planning & information document that the researcher gives to the marketing manager. A written summary of the
proposed steps in the research design Research proposal is also a sales document.
Important that proposal conveys a positive image of the researcher & project as it is an information document used by marketing manager in deciding whether to approve or reject the proposed implementation of project.
How to draft a research proposal: Researcher consults the research plan, time schedule and cost budget. The proposal contains all the details that the marketing manager requires to decide whether to implement project or not.
DECISION ON THE RESEARCH PROJECT Final step in research planning is to decide whether to implement research project or not After receiving the research proposal, the marketing manager has to decide whether the proposed project is
economically justified and worth implementing
The research project is judged by weighing up the estimated cost against the probable benefits that will accrue to the enterprise from the research project. The estimated cost of the project is compared the marketing research budget
The potential benefits of a research project for the enterprise can be determined by intuition, calculated judgement or decision theories
STUDY UNIT 5 THE MARKETING RESEARCH PROCESS
Marketing Research specifies what information is required It selects the data collection methods Implements and manages the data collection process
Analyses the results And communicates the findings and their implications to marketing management so that the marketing problem can be
solved meaningfully
THE DISTINCTION BETWEEN PRELIMINARY AND FORMAL MARKETING RESEARCH A research project should consist of two parts
(a) A Preliminary Research Investigation (PRI)(b) A Formal Marketing Investigation PRI is (1) undertaken to establish whether there is a need for research and what type of research is required and (2) to
ascertain the feasibility and value of conduction a formal research project
PRELIMINARY MARKETING RESEARCH COVERS STEPS 1 – 4 OF THE PROCESS, I.E: Identify and define the marketing problem Determine research objective Develop a research design Conduct secondary research
Then after step 4 above, the researcher should assess whether Formal Research is required or notNote that besides the normal cost benefit analyse, the decision to conduct a formal marking research is also influenced by the nature of the problem, the type of information required and the 3amount of information available.The marketing problems encountered can be represented on a continuum with certainty and ambiguity at opposite ends
Certainty means that all information is available and accessible plus the problem is clearly defined with the answers easily obtainableIn this case, formal marketing research is not necessaryUncertainty means the basic problem is understood but eh information that is available about the solutions is insufficient i.e more effort is needed to get clarity on the problemAmbiguity – Exact nature of the problem is unclearInformation that is available is insufficient to solve the problemTherefore formal research is necessary
PRELIMINARY MARKETING RESEARCHThe following steps are to be performed during a PMR investigation
1. Define the nature and extent of the marketing problem or opportunity2. Develop the hypotheses3. Formulate a comprehensive research problem4. Set research objectives5. Determine the research design and prepare a research proposal6. Collect the secondary data
A researcher should carry out a situational analysis in order to perform the above steps as this will create a picture of the situation surrounding the problemThis situational analysis gathers information about:
The marketing objectives and strategies of the enterprise The resources of the enterprise The enterprise market The general situation in the external environment
FOR THE PURPOSE OF THE SITUATIONAL ANALYSIS, ALL SECONDARY DATA IS FIRST RESEARCHED
FORMAL MARKETING RESEARCHA FMR will be conducted IF the problem is not solvedBefore undertaking a FMR investigation, marketing management must decide whether the formal investigation is justified and whether they have the means to act accordingly.
STEPS OF THE FMR ARE:o Select the method of primary-data collectiono Design the questionnaireo Design the sampleo Conduct the investigation

o Process the datao Analyse the dateo Interpret the results and compile the research report
THE MARKETING RESEARCH PROCESS The key characteristics of formal scientific marketing research are that it is a systematic process of collecting, analysing and interpreting information.The MRP is therefore an orderly and systematic procedure that provides reliable information for decision making.It is called a process because the successive steps should not be seen in isolation but as an integrated and interdependent whole.
Step 1
Identify & formulate the problem or opportunity
A clear definition of the problem or opportunity will result in a clear outline of the research needs. A situation analysis can familiarise marketers with the specific marketing problem or opportunityTasks that could be performed to gain preliminary information to properly define the problem include
Secondary data analysisResources & constraints or the organisationBuyer behaviorThe macro-environment of the organisationThe marketing & technological skills of the organisation
Step 2
Determine the research objectives
Three basic aspects Research questionDevelopment of a hypothesisResearch scope
Step 3
Develop a research design
Develop a research plan to carry out the research studyTranslate the set research objectives into specific data needsSpecify the info that is needed to meet the research objectives and thenSpecify the sources from which we are planning to get the information
Step 4
Conduct secondary research
Researchers usually begin their research with secondary research If marketers cannot achieve the research objectives that were stated and can’t solve the problem, they might consider moving to primary research
Step 5
Select a primary research method
3 primary research methodsObservationExperimentsSurveys
The decision to use a specific method depends on the problem or opportunityStep 6
Determine the research frame
In conducting primary research, marketers should select respondents who are representative of all their customers from whom the info is neededThis is called populationDepending on the problem or opportunity, marketers could conduct research by means of Census of SampleCensus – data is obtained from every member of the population interestSample – Refers to a subset of the population of interest.In this stage, researchers determine who is to be sampled, how large a sample is needed, and how the sampling units will be selected
Step 7
Gather the data Survey methodology is now put into practiceData are collected by field workers Supervisors are responsible for controlling the quality of the fieldwork
Step 8
Process the data Data should be converted to useful information, a format that will answer marketing management’s questions Data will 1st be prepared then analysed
Step 9
Reporting the research findings
Marketers interpret the information draw conclusions so that they can communicate the findings to decision makers.Marketers to prepare a report so as to formally communicate to the marketing decision makers. Or an oral presentation
Step 10
Follow-up Findings of the research should always be usedAs the decision makers may discover further areas of researchConclusions from the research might generate new ideas or problems

STUDY UNIT 6: COLLECTION OF SECONDARY DATA
USES OF SECONDARY DATA Formulating the decision making problem Suggesting methods and types of data for meeting information needs Interpreting and evaluating primary data Monitoring the enterprise’s external environment Providing the basis for final decision making Establishing trends in longitudinal research studies
INHERENT PROBLEMS RELATED TO SECONDARY DATA Tracing the desired data from numerous sources Processing or adapting the data to suit the problem situation Determining the accuracy and reliability of the data
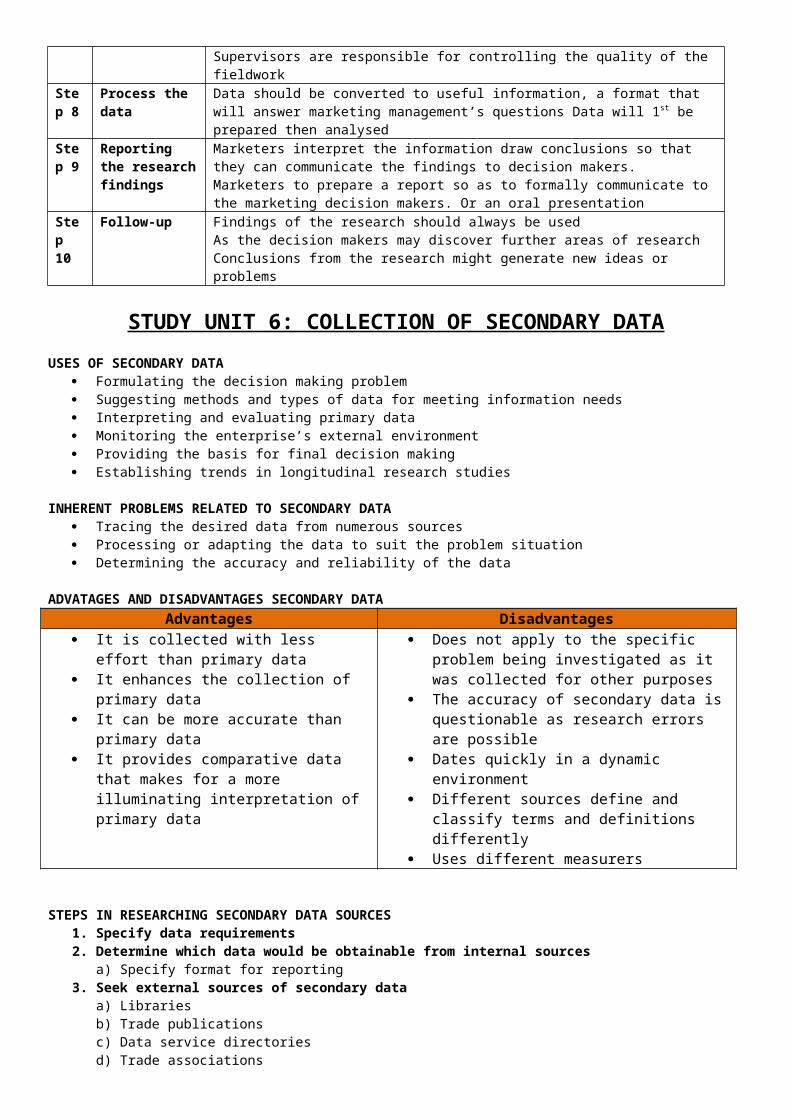
ADVATAGES AND DISADVANTAGES SECONDARY DATAAdvantages Disadvantages
It is collected with less effort than primary data
It enhances the collection of primary data
It can be more accurate than primary data
It provides comparative data that makes for a more illuminating interpretation of primary data
Does not apply to the specific problem being investigated as it was collected for other purposes
The accuracy of secondary data is questionable as research errors are possible
Dates quickly in a dynamic environment Different sources define and classify
terms and definitions differently Uses different measurers
STEPS IN RESEARCHING SECONDARY DATA SOURCES1. Specify data requirements2. Determine which data would be obtainable from internal sources
a) Specify format for reporting3. Seek external sources of secondary data
a) Librariesb) Trade publicationsc) Data service directoriesd) Trade associations
4. Obtain secondary data5. Scrutinize validity of data
a) Evaluate collecting organisationb) Consider objectives of the original studyc) Appraise
1) Methods employed2) Definitions and classifications3) Currency
6. Identify data that must be obtained from primary sources instead
SECONDARY DATA SOURCESInternalSales invoices, accounts receivable reports, quarterly sales reports, sales activity reports External
Published sources-information is more general in nature as it represents a broad view of the industry in which the business competes
Syndicated sources-more expensive they acquire, focuses on the specific information needs of the organisation External databases-internet
EVALUATION OF SECONDARY DATA Purpose-Secondary data was not gathered for the immediate study at hand but for some other purpose. The data must
therefore be evaluated to see how it relates to the current study. Accuracy-They need to consider the suitability of the data, whether it is applicable to the marketing problem or
opportunity in question.
Consistency-When evaluating data, researchers should seek multiple sources of the same data to ensure consistency. Credibility-The status of the publication and quality of the data source should be evaluated. Methodology-Flaws in the methodology can create results that are invalid or unreliable. The following should be
considered: The characteristics of the data collection method and the manner in which the data is presented The extent of the survey The definitions, terms and classifications used in the various sources The sampling method used The sample loss that occurred. The way in which fieldworkers were recruited, trained and managed. The freshness of the data The measures used in the various sources The research methods and the data collection methods used. The general proof that the data was carefully collected, analysed and presented.
Bias-researchers must determine the reason why the data was collected
STUDY UNIT 7: CONDUCTING PRIMARY RESEARCH
It is sometimes necessary to collect primary data. Primary data are new data that are collected to help solve a specific problem at hand. Primary data never existed before and can be collected through qualitative research or quantitative research.
QUALITATIVE RESEARCH VS. QUANTITATIVE RESEARCHQualitative research results in data that are not subject to quantitative analysis. Qualitative research is commonly used to investigate people’s attitudes. Quantitative research is a study that uses mathematical analysis.
Primary research can be collected through qualitative or quantitative research Qualitative research results in data that are not subject to quantification rt quantitative analysis Quantitative research is a study that use mathematical analysis Qualitative techniques include focus groups, in-depth interviews and projective techniques Quantitative techniques include surveys, observation and experimentation.
THE DIFFERENCE BETWEEN QUALITATIVE RESEARCH AND QUANTITATIVE RESEARCH
Dimension Qualitative Research Quantitative Research
Type of question Probing Limited probing
Sample Size Small Large
Information per respondent
Much Varies
Administration Interviewers with special skills Fewer specials required
Type of analysis Subjective & Interpretative Statistical & summarization
Ability to replicate Low High
Type of research Exploratory Descriptive or Casual
THREE IMPORTANT FACTORS WHEN CHOOSING METHODS FOR DATA COLLECTION The volume and variety of data required:
o More data can be obtained through personal interviews than through telephone survey, and a wider variety of data can be obtained through survey than through observation or experimentation.
o In-depth interview can provide the most details. The objectivity and reliability of the required data:

o It is directly influenced by the data collection methodo Critics of the qualitative approach point out that quantitative research is a lot more objective and reliable
The cost and duration of the study:o The survey method is usually quicker and cheaper than observation and experimentation, since the
interviewer has more control over the collection activities than the observer has. o Qualitative research can be relatively cheap to administer in some cases and in others, extremely costly.
QUANTITATIVE RESEARCH TECHNIQUESResearchers can use the following quantitative techniques to collect primary data. These include: Survey Research, Observation Research and Experiments
SURVEY RESEARCHThis is the most popular way of gathering primary data. Survey research entails the use of a questionnaire to gather facts, opinions and attitudes. Survey research answers questions for marketers such as why consumers behave the way they do; how consumers did what they did and if the customer is from a demographic or lifestyle perspective. Survey research is divided into four major types:
Personal interviews (respondents are contacted in person by the interviewer) Telephone interviews (respondents are contacted telephonically) Mail surveys (respondents receive questionnaires via the mail) Internet (respondents received questionnaires via the internet though web-based forms or e-mail questionnaires)
When assessing the quality of information obtained from survey research, the marketer must determine the accuracy of these results. There are two types of errors that might occur: Random sampling errors and systematic errors.
Random sampling – when all necessary precautions have been taken to obtain an accurate sample, however the sample does not accurately reflect the population.
Systematic Errors – Refer to actual design flaws in the sampling procedure.
OBSERVATION RESEARCHObservation research is a systematic process of recording behavioral patterns of people, objects and occurrences without questioning or communicating with them. Observation research is especially useful when consumers do not want to reveal their consumption patterns, because it’s socially unacceptable or consumed in private. Monitoring garbage for cigarette packets can reveal the brand of choice and quantity smoked. It is necessary to do observation research when:-
It Is the only way of obtaining data – e.g. food and toys preferences of babies Consumers are reluctant to reveal the correct facts e.g. contraceptives or toiletries There are budgetary constraints (observation research is relatively cheap) Competitive data is required – e.g. competitive prices or promotions campaigns can be observed.
Advantages of observation research Observation does not depend on the willingness of the respondent’s to answer questions. Data is observed and recorded as it happens in its natural environment Data can be collected from subjects that may not be able to communicate their views or opinions. Interviewer subjectivity or bias is illuminated. It can provide valuable insights in areas of advertising and brand preference.
Disadvantages of observation research Finding are limited to observed behavior Observed behavior is not necessarily the respondent’s normal behavior. It is time-consuming It focuses on what occurs in public. It works when respondents do not know that they are being observed.
The various approaches to observation are: Human versus machine observation. Human observation requires people to be present to view the activity. Machine
observations, such as cameras or scanners, record the activity. Natural versus contrived observation. Natural observation occurs when in the natural environment. Contrived
observation occurs when an artificial situation is created and the respondent’s behavior observed.
Disguised versus undisguised observation. Disguised observation occurs when the observer is hidden, which may encourage customers to behave natural. Undisguised observation occurs when the observer (human or machine) is visible.
Structured versus unstructured observation. Structured observation occurs when the observer fill out a form or counts the number a times an activity occur. Unstructured observation occurs when the observer simply take notes about the observed behavior.
Direct versus indirect observation. Direct observation occurs by observing present behavior as it happens. Indirect observation occurs by observing past behavior.
EXPERIMENTAL RESEARCHExperimentation entails manipulating one variable (independent) so as to determine its influence on another variable (dependant). In marketing the dependent variable is some measure of sales, such as total sales and the independent variable is the marketing mix (product, price, place, and promotion) The following issues must be addressed in the experimental research: The experimental setting
Laboratory setting versus field setting – Laboratory experiments are conducted in a controlled setting while the field experiments take place in an actual market environment. Laboratory experiments have higher internal validity, while the field experiments have higher external validity.
The manipulation of variables – Researches must know which variables they want to manipulate and how they want to manipulate them.
Selection and measurement of dependent variables – Researches must accurately identify the dependent variable. It might be that the independent variables, such as packaging or pricing, affect brand equity and not sales volumes, in which case brand equity is the dependent variable and not sales volume.
Selection and assignment of tests units. The experimental subjects must be representative of the population being studied.
Control over extraneous and other variables - Utmost care must be taken to control all of the variables that might affect the outcome of the experimental research. Weather, social or political forces are examples of extraneous variables and cannot be controlled. Their effect must therefore be minimized.
There are three types of experimental designs: Two group, after only Before-after The Solomon four-group design
QUALITATIVE RESEARCH TECHNIQUESFocus groupsFocus groups are 8 to 12 participants who are lead by a moderator in an in-depth discussion on one particular topic. The emphasis is getting people to talk at length and in detail about a subject concerned. Depth interviewsDepth interviews are unstructured, but highly probing one-on-one interviews. The researches have to be highly trained and skilled. A major advantage of depth interviews to focus groups is that the group pressure is removed and respondents and not influenced by the opinions of others. Depth interviews are extremely expensive and time-consuming. Psychologists often use depth interviews to elicit hidden or suppressed opinions. Projective techniquesProjective techniques are ways of reaching into respondents’ deepest feelings by having them project those feelings into an unstructured situation
CONDUCTING PRIMARY RESEARCH: The use of observation methods is strongly recommended in the following 3 situations:
1) Where observation is the only method to gather accurate information. 2) Where the relationship between data accuracy and data cost makes observation more favorable than other data
gathering methods.3) Where the researcher wants to confirm the results obtained when other research methods were used.
ADVANTAGES OF THE OBSERVATION RESEARCH METHOD

Does not rely on the respondent’s willingness and ability to answer questions. Less intrusive and does not affect the respondents activities.
Data is observed and recorded as it happens in its natural environment. Does not rely on recall. Data can be collected from subjects that may not be able to communicate their views/opinions egg. Young children. Possible interviewer subjectivity or bias is eliminated. Observation can provide valuable insights, in the areas of advertising and media research and brand preferences
studies.
DISADVANTAGES OF THE OBSERVATION RESEARCH METHOD Findings are limited to observed behaviours. The reason behind the behaviors and the thought processes are not
addressed. Observed behavior is not necessarily the respondent’s normal behavior. Observation can be extremely time-consuming. Observation focuses on what occurs in public. Observation works best when respondents are not aware of being observed.
OBSERVATION TECHNIQUES Structured and unstructured observation Disguised and non-disguised observation Direct and Indirect observation Natural and controlled observation Human and Mechanical observation.
STRUCTURED AND UNSTRUCTURED OBSERVATIONStructured Observation
Used when the decision-making process has been defined accurately enough so that the behavior and aspects of the observed event can be specified before the time.
Structured observation is more suitable for descriptive and casual research than for exploratory research. Structured observation decreases the possibility of observational bias and increases the reliability of the observation.
Unstructured observation Used in studies where the problem is not specifically defined. Observer is allowed freedom in terms of what is observed and how observations are recorded. Useful for creating an understanding of the various aspects of clients’ behavior.
DISGUISED AND NON-DISGUISED OBSERVATIONDisguised observation - object observed is not aware of being observedNon-disguised observation – object being observed in aware of the observation.
DIRECT AND INDIRECT OBSERVATIONDirect observation – The objects actions are directly observed and immediately noted e.g. Standing at the checkout and counting an item purchased during the day.Indirect observation (trace analysis – The evidence of situations that have already taken place is observed e.g. Counting the stock of an item to determine how many were sold during the day.
NATUAL AND CONTROLLED OBSERVATIONNatural observation - Takes place in a natural environment e.g. Supermarkets, restaurants.Controlled observation – Takes place in a controlled (artificial) environment or in a laboratory.
HUMAN AND MECHANICAL OBSERVATIONHuman observation – where one or more observers personally observe a specific execution and note the specific actions.Mechanical observation – a mechanical device replaces the human observer:
more accurate and objective reduces observation costs important mechanical devices used for observations

o mechanical counterso cameras that monitor movemento people – meters, eye cameras, psycho-galvanometers
OBJECTS THAT CAN BE OBSERVED Observation of people – Consumer marketing research mainly studies peoples’ actions and behavior. Observation of physical traces (trace analysis) – Deals with events that have already taken place. Observation of records and inventories – Usually done by means of some audits, automated store checkouts, home
audits and pantry audits. Observation of Contents (Content Analysis) – Focuses mostly on promotions and advertising
VOLUME AND VARIETY OF DATA THAT CAN BE COLLECTED BY OBSERVATION Data collected by observation methods is restricted to behavioral data since attributes, intentions, motivations and
knowledge cannot be observed. Smaller volume and variety of data is collected. Cannot be used to collect economic, demographic and psychological data about consumers.
OBJECTIVITY AND RELIABILITY OF OBSERVED DATA The sample composition, the observer and the observed object can affect the reliability of data collected through
observation.
OBSERVATION RESEARCH Observation research is necessary when:
This is the only way of obtaining data e.g. Babies toys etc. Consumers are reluctant to reveal the correct facts There are budgetary constraints. Competitive data is requested.
EXPERIMENTAL RESEARCH THE EXPERIMENTAL METHODIn the experimental method, the researcher determines the influence of an independent variable (e.g. price) on a dependent variable (e.g. sales).Definition of Experimentation – research investigation in which conditions are controlled so that an independent variable can be manipulated to test a hypothesis about a dependant variable. It allows evaluation of causal relationships among variables while all the other variables are eliminated or controlled.
Data is collected by means of communication ( surveys) or observation Experiments are carried out in a natural setting (field studies) or in an artificial one (laboratory) The amount and variety of data that can be collected with experimentation depends on whether surveys or
observations are used. More effective in the determination of cause-and-effect relations Main advantage – realistic Permits market testing and represents or imitates a real market situation. Expensive and can be sabotaged by competitors.
IMPORTANT TERMS IN RESPECT OF EXPERIMENTATION Variables: A variable is any characteristic or attribute that can be measured. Independent variables: An independent variable is a variable in an experiment/study that is systematically controlled
or manipulated by the researcher and is believed to predict or cause change in a dependant variable Dependent variables: The dependent variable is an observed variable in an experiment/study whose changes are
determined by the presence or degree of one or more independent variables. Extraneous Variables: The extraneous variables include all factors, except the determinants that influence the
dependant variable. There are two types of extraneous variable:o test units and or control unitso Uncontrollable extraneous factors such as weather conditions.

Treatments: Treatments represent the various test variables (independent variables) used by the researcher in the experiment.
Test Units (Test groups): Test units are the people or physical entities that provide the best basis for determining the independent variables influence on the dependent variable.
EXPERIMENTAL VARIATIONS AND THEIR CONTROL Variances (variations or differences) in observed behavior can develop as a result of the following:
Subject- related factors that act genetically or environmentally determined e.g. Age, sex intelligence, personality traits.
Environmental factors that relate to physical factors influencing the experimental situation. Experiment related factors that relate to the measurement instrument, devices and the researcher.
TYPES OF VARIANCES THAT MUST BE CONSIDERED1. Primary variance – which can be ascribed by the influence of independent variables or treatments.2. Secondary variance – which is the variance in the dependent variable resulting from extraneous forces e.g. Weather
conditions.3. Error variance – develops when certain non-experimental factors (e.g. measuring errors) influence the dependent
variable in a coincidental way.Experiments are carried out in order to measure primary variance. The controls aim is to increase the primary variance and to reduce or eliminate the secondary and error variances.
FOUR METHODS OF LIMITING SECONDARY VARIANCE CAUSED BY EXTRANEOUS FORCES: Randomisation – means that the allocation of treatments to test units takes place in an unbiased way. Random
allocation helps to ensure that the tests and control groups do not differ before the experiments begin Physical control – means keeping the value or level of the extraneous variable constant. One form of physical control is
the matching of respondents – when tests and control groups are formed based on age, sex and population group. Experimental Designs – influence of extraneous factors can be limited further by implementing specific experimental
designs. Statistically (ANCOVA) Analysis of covariance – Limiting the effort of extraneous factors can be done by using a
technique known as the analysis of covariance (ANCOVA). Achieved by means of a statistical variation of the dependent variables arithmetic mean value. ANCOVA can be used only if the extraneous variable is known and can be measured.
EXPERIMENTAL DESIGNSAn experimental design involves specifying:1. the independent variables being manipulated (treatment)2. The test units being used.3. the procedures of controlling extraneous variables
Two broad categories of experimental designs:1. Single-variable designs2. Multivariable designs
In single-variable design, a single independent variable (eg product packaging) is manipulated. In single-variable design, usually a test group and a control group are used. Multivariable designs use a number of groups which act as controls for one another. In multi-variable designs the various groups must be as homogenous as possible both the test and control groups are
very important. Random selection (preferably stratified random sampling) should be used.
SINGLE-VARIABLE DESIGNS A single treatment is used Varied at one level or in one way only.
The most important single-variable designs include: After only, without control
Simplest form of experimental design The test group is exposed to the treatment and the dependent variable is only measured afterwards.

Since there is no “before” treatment, this experiment is inaccurate and it cannot be said with certainty that the performance increased or decreased.
Before and after, without control Test units act as their own control and no formal control group is used. Measures the dependent variable before and after exposure to the treatment. No control over the influence of extraneous forces, which may be responsible for the observed differences.
Before and after, with control Extraneous variables are controlled by using groups Test and control groups must be equal in size and randomly selected Control group is not exposed to the treatment This method assumes that the extraneous factors influence the test group and the control group to the same
extent.
After only, with control After exposure to the new packaging, the test group’s sales are measured. At the same time the control group sales are measured. The differences in sales between the 2 groups are regarded as the effect of the treatment. Suitable to situations where data does not have to be collected at the pre-test stage, or where data collection
is impossible (new product) Most commonly used method – simpler to administrate and cheaper.
MULTIVARIABLE DESIGNS Involve monitoring 2 or more variables. Aim is to measure the effects of more than one treatment at the same time. Can also be used to control the effects of one or more extraneous variables Test units are formed through random selection. Results are analysed using advanced statistical techniques The experiment measured the effect of the various variables or levels of one treatment on the dependent variable.
THE MOST IMPORTANT MULTIVARIABLE DESIGNS INCLUDE: Completely randomized block designs: Simplest form of multivariable methods. Involves allocating randomly the
treatments to the test units. Randomized block designs: enables the researcher to control the effect of one of the main variables (e.g. Socio-
economic status), while at the same time measuring the effect of the treatment. Latin square design: Allows the researcher to exercise statistical control over two sources of extraneous variables,
provided they do not influence each other.
TEST MARKETING (happens under normal competitive conditions) Definition: A controlled experiment carried out in one or more limited, but carefully selected parts of a market area to
predict and explore the consequences of one or more marketing actions for new or modified product introductions, or to estimate the payoffs and costs of changes in the marketing mix for existing products.
Test marketing is not restricted to the testing of the product only but is also used to investigate the marketing mix elements under normal market conditions.
BENEFITS OF TEST MARKETING It offers a real test in a real environment It offers a final opportunity to fine-tune the product. It provides an opportunity to vary some of the marketing mix components. It allows the marketer to assess aspects that are difficult to predict on paper. It provides an opportunity to adjust the overall business plan and product launch strategy. It assists in providing a forecast for future sales. Test marketing is an extraordinarily expensive and time-consuming method of collecting information about consumers
reactions to new product items Should only be used as a last resort.
Usually used for cheap consumer products that are purchased regularly.
STEPS IN TEST MARKETING STEP 1: Decide on the need for test marketing – decision is influenced by the nature and extent of the risk and the size
of the investment involved in the manufacture and marketing of the new product STEP 2: Determine the objectives – give more and better knowledge of expected sales, test alternative marketing
strategies, find possible product errors etc. STEP 3: Decide who will undertake the test marketing – in-house or specialized institutions STEP 4: Select the test marketing approach. STEP 5: Choose the test markets and control markets STEP 6: Select the correct test market. The matching process is usually used. The selected test market must represent
the microcosm of the national market. STEP 7: Decide on the duration of the test marketing. STEP 8: Analyse the results and make a decision.
OBJECTIVITY AND RELIABILITY OF EXPERIMETAL DATA In experimentation, a distinction is made between the external and internal validity of results. External Validity – Refers to the applicability of the results to the actual marketing situation, and thus how
representative the results are of the population. Internal Validity – Refers to the extent to which the results can be ascribed to the effect of the treatment rather than
the influence of extraneous forces.
FACTORS THAT THREATEN THE INTERNAL VALIDITY OF AN EXPERIMENT Differences between tests and control groups Competitors’ actions and disproportionate influences of extraneous variables on test and /or control groups. Testing effects Reporting and observation errors Measurement errors Maturation test units (older, wiser, tired and bored over time) Interaction between test and control groups.
ISSUES TO BE ADDRESSED IN EXPERIMENTAL RESEARCH:1) The experimental setting – laboratory setting versus field setting.
- laboratory experiments have a higher internal validity- field settings have a higher external validity
2) The manipulation of variables – researchers must know which variables they want to manipulate and how they want to manipulate them.
3) Selection and measurement of dependent variables – researchers must accurately identify the dependent variable.4) Selection and assignment of test units – the experimental subjects must be representative of the population being
studied.5) Control over extraneous variables – utmost care must be taken to control all of the variables that might affect the
outcome of the experimental research.
STUDY UNIT 8 - MEASUREMENT CONCERPT
DEFINITIONSMeasurement: is the process of assigning numbers or labels to people or things, in accordance with the specific rules to represent quantities or qualities of attributes.Rule: is a guide, a method or a command that tells the researcher what to do. they ensure that relations between the symbols assigned reflect the actual relations between the objects with respect to the characteristics concerned.Scaling: is the process of creating a continuum, on which objects are located according to the amount of the measured characteristic they process.Measuring scale: are used to collect and record data from respondents.
4 BASIC LEVELS OF MEASUREMENTS:

Nominal: Numbers are merely a method of identification. No zero point can be identified. No order. Intervals are not equal.
Ordinal: Simplest and most used in marketing research. Rank respondents according to a specific characteristic or an item. No absolute zero Order Intervals not equal Chiefly used to measure relative attitudes, opinions, perceptions and preferences.
Interval: Have all qualities associated with ordinal scales as well as equal intervals between adjacent scale values. Distinguishes ranking order as well as the distance between ranking positions. No zero position is determined, so we can’t conclude. Equal interval.
Ratio Contains all attributes of the previous 3 scales and has an absolute zero point. Used to classify items, determine ranking order, intervals or deviation, and ratios or scale values. Order Equal intervals
3 CHARACTERISTICS OF NUMBERS: ORDER: numbers have a logical and known order. DISTANCE: each number is different from the preceding and following and the differences are ordered. ORIGIN: a series of numbers will have a unique origin indicated by zero.
FIXED ALTERNATIVE RESPONSE FORMATVarious types of fixed alternative response format1. Comparative Scale:
It requires the respondent to compare two or more objects, this means that data can be interpreted in a relative terms. The collected data focuses on ranking and is therefore said to have ordinal properties. Four Comparative scaling techniques are
I. Paired Comparison scale: Respondents are given products in pairs and asked to indicate their preference in each pair. The respondent is
given guidelines or criteria to base the comparison on and all possible pairing are compared in this way. The number of pairs is calculated as follows: N=n(n-1)/2 N stands for number of pairs and n stands for number of objects
II. Rank order scale: The respondent is required to compare or judge one aspect with another. E.g. a respondent might be given a
list of ten restaurants in Pretoria to rank in a scale of one to ten. Respondents are presented with several objects simultaneously and asked to order or rank them according to
some criterion. It is possible that the respondent may dislike the brand ranked 1 in an absolute sense. Furthermore, rank order scaling also results in ordinal data. Only (n - 1) scaling decisions need be made in rank order scaling. E.g. Instructions: Rank the various brands of toothpaste in order of preference. Begin by picking out the one
brand that you like most and assign it a number 1. Then find the second most preferred brand and assign it a number 2. Continue this procedure until you have ranked all the brands of toothpaste in order of preference. The least preferred brand should be assigned a rank of 10.
No two brands should receive the same rank number. The criterion of preference is entirely up to you. There is no right or wrong answer. Just try to be consistent.
III. Constant sum Scale: Respondents allocate a constant sum of units, such as 100 points to attributes of a product to reflect their
importance. If an attribute is unimportant, the respondent assigns it zero points. If an attribute is twice as important as some other attribute, it receives twice as many points. The sum of all the points is 100. Hence, the name of the scale.
IV. Q-sort Scaling

A comparative scaling technique that uses a rank order procedure to sort objects based on similarity with respect to some criterion.
E.g. preference, attitude or behavioral intent Using cards that notes an intent to be ranked is the most popular and simplest method to use in the sorting
process This is a rank order procedure where respondents are asked to sort a given number of items or statements
and classify them into a predetermined number of sets (usually 11) according to some criterion such as preference, attitude, or behavioral intent.
Using cards that note an item to be ranked is the most popular and simplest method to use in the sorting process.
A2. Non-Comparative Scale
They are called the monadic scales because only one object is evaluated at a time. There is no comparison to another objecta) Continuous Rating Scale
These scales offer a respondent a continuum with two extreme points Respondents must indicate their preferences somewhere on this continuum. Note that the continuum may have no marking on it, except at its extreme points, and may sometimes be marked
with scale positions that are described.b) Itemized rating scale
Here the respondents have to select an alternative from a limited number of ordered categories.Itemized rating scale includes the following:
The likert scale : Where respondents are given statements concerning a certain issue. These statements can be positively or negatively phrased and are mutually exclusive. A likert scale is what is termed a summated instrument scale. This means that the items making up a likert scale are summed to produce a total score.
The Semantic Differential Scale : Where respondents indicates their choices between two extreme points. Bipolar words are used to determine the respondents’ responses, and between the two bipolar words are ordered categories ranging from one to seven. Respondents describe their feelings about the products or brands on scales with semantic labels. When bipolar adjectives are used at the end of the scales, these are termed semantic differential scale
Staple scales : provides respondents with a phrase or word which they have to evaluate. These scales help to determine the direction and intensity of the respondents’ opinions
STUDY UNIT 9 - QUESTIONAIRES
QUESTIONAIRESA questionnaire is described as a set of questions designed to generate the data necessary to accomplish a research project’s objectives.A survey is only as good as the questions askedThe length of the questionnaire, the length of the individual questions, the number of alternative responses and the use of different question wording, formats and answers are determined by:
The research problem The aim of the research The nature of the population The size of the sample The choice of data-collection method The analysis of the data
QUESTIONNAIRE DESIGNAs part of the data collection process the questionnaire needs to fulfill the following purposes:
It must collect the relevant data required for the identified marketing problem It should ensure that the collected data is comparable It should minimize biases It should attract and motivate respondents to participate in the survey It should encourage respondents to be honest and accurate when answering It should facilitate the task of the interviewer and the data-processing activities
SPECIFY THE INFORMATION NEEDEDThe researcher must ask precisely what must be measured to satisfy the research objectives and to solve the original marketing problem. The research plan contains the proposed hypotheses.

The researcher must determine how to collect the information. This information will depend on the primary data required and the data collection method required. There are four main methods for conducting a questionnaire:
Mail Telephone Personal interview Internet
QUESTION CONTENTThis refers to the general nature of the question and the information it will provide.Five primary aspects or decision-making areas are involved in question content:
The need for the data asked for by the questionThe researcher must determine whether the question is necessary, and whether it contributes to the information required to solve the marketing problem.
The ability of the question to produce the required dataThe researcher must determine whether one question is enough or whether more than one is needed to obtain the information
The ability of the respondent to answer the question accuratelyThe researcher must consider the respondents ability to supply an accurate answer to the question.
The respondent’s inability to answer a question may be ascribed to three main factors: The first two involve factual information and the last one involves attitudes and motives
a. The respondent was never exposed to the answer and is uninformed of the subjectb. The respondent has been exposed to the answer but has forgotten the information. It is therefore advisable to
restrict the questions to recent events, actions and phenomena.c. The respondent is unable to express verbally the answer. Sometimes people do things for no particular reason.
The willingness of the respondent to answer accuratelySometimes the respondent may answer the question to be polite and in so doing provides acceptable but inaccurate information.
There are three major reasons why a respondent is not willing to answer a question: The question is too personal The question embarrasses e respondent The question involves the image or reputation of the respondent
When asking sensitive, personal and embarrassing questions, the researcher can overcome the non-response rate and measurement errors by using the following suggestions and techniques:
explain to the respondent why the specific information is needed Ask for personal data using categories instead of specific levels Use counter-biasing statements. Begin the question with a statement that makes it easier for the respondent to
acknowledge his embarrassing habit by making it sound quite ordinary Use randomized response techniques. This techniques involves three elements A sensitive question which required a yes or no answer A neutral question which requires a yes or no answer A random plan in which the specific respondent can choose which question he will answer The effect of external factors on the respondent’s answer
All external factors that may affect the respondent’s answer must be considered. E.g.: timing the question
QUESTION/RESPONSE FORMATThe researcher must consider the respondents possible reaction or expected answer. This will help determine the best question/response format use.
a) Structured questions with structured responses (Closed)A structured question contains specific mutually exclusive response categories from which the respondent chooses a category that best suits his response.Advantages:
a. Structured questions are easy to apply since they are pre-codedb. They are more economical and less time-consuming to implement
Disadvantages:a. Structured questions can result in a loss of rapport and respondent frustration because respondents may feel
that the given response options do not do justice to their opinions. Therefore they are forced to make choices they would not normally have made in other circumstances
b. Often less subtle than open ended questionsc. Different types of structured questions with structured responses
These include the following:
-Dichotomous questionsIt has only two alternative answers. It collects factual information or obtains a point of view on a matter
-Multiple-choice questionsIt has 3 or 4 alternative answers Used to obtain information that can be divided logically into reasonably fixed categories
-Ranking questionAssigns a relative value to a series of aspects
-Scaled questionsThe respondent answers this question by marking a certain point on a scale The respondent’s actual position is measured on the attitude continuum
b) Structured questions with unstructured responses (Open)Used particularly to obtain reasons for specific attitudes or views the respondent may haveAdvantages:
a. Respondent is not restrictedb. Is suitable when the researcher has limited knowledge of the topic being researched or is unsure about the
type of answers a specific question may evokec. More suitable when a are variety of answers are anticipatedd. Can help determine the underlying motives, expectations or feelings of the respondente. More suitable than closed questions when measuring sensitive or objectionable behaviourf. Generate more precise Reponses
Disadvantages:a. Time consuming, uneconomical and limit the number of questions that can be asked before the onset of
respondents fatigueb. Sometimes results in a wide range of response alternatives that the become statistically and analytically
insignificantc. Answers of some respondents can be difficult to interpretd. The analysis of opened ended questions demands specialised knowledge and therefore increases the cost of
the research e. It frequently evokes a lower response than structured questions as respondents may be de-motivated by
questions demanding considerable thought
QUESTION PHRASINGHow questions re formulated can result in the respondent refusing to answer the question or answering incorrectly, often because the respondent has not understood the question The following guidelines can be used when formulating questions:
Use simple words Avoid ambiguity Avoid leading questions that indicate the answer Avoid presumptive question and assumptions Avoid generalisation and pose the question in specific terms Avid two fold questions Avoid unreasonable questions/ explain unreasonable questions
QUESTION SEQUENCEIt affects the refusal rate and quality of the response obtainedThe following guidelines can be used when planning the question sequence:
Begin with non-threatening interesting questions that are easy to answer Ask sensitive questions last- little info is lost if respondent chooses to quit the questionnaire Classify the questions according to topics Use introductory statements when changing topics to inform the respondent what the following questions will be Vary the length, response format and type of questions Use the filter, method which is a handy technique for arranging questions- broader more general questions are posed
first followed by more specific questions
PHYSICAL CHARACTERISTICS AND LAYOUT OF QUESTIONNAIREThe following must be taken into account when doing the layout and technical completion of a questionnaire;
Items need to be adequately spaced to prevent any items being overlooked Use large more prominent letter types for instructions Use durable paper to withstand considerable handling. Make an effort to use different color paper Make the questionnaire look professional and easy to complete Number the question for data processing reasons

Clear instructions must be given on how to answer the questions The pages of the questionnaire must be bounded so that it makes it easy to handle and read Conclude by thanking the respondent for the co-operation and assistance
PRE-TESTING THE QUESTIONNAIREDraft questionnaire must be tested and redefinedTest the questionnaire on a small sample people representing the investigation groupThe pre-testing enables researchers to determine:
how long the respondent will take to complete the questionnaire Whether there are any problems in completing the questionnaire Whether the instructions on the questionnaire are clear and understandable Whether the interview is able to follow the questionnaire format Whether the flow of the questionnaire is neutral and conversational
After the pre-testing the researcher can adjust the questions that presented problems and eliminate those that provide irrelevant information. Once approved it can be used to collect primary data.
STUDY UNIT 10 SAMPLING
Sampling focuses most on population, sample and census where by population refers to the total group of people or entities where information is required... Sample is a subset (subgroup) of population and census refers to the circumstance where data is obtained from every member of population.
SAMPLING VS CENSUSSample Census
It is often more accurate It takes less time since only few members of
the population is surveyed It costs less since there is no need for higher
training, supervisors and data processing It is more practical
Its less accurate to sample It consumes more time since every member of
population of interest is surveyed It results in higher cost since there is a need for higher
training- knowledge is needed to ensure successful survey
It is less practical
THE FOLLOWING ARE THE STEP S INVOLVED IN SAMPLING PROCESSSTEP 1 DEFINE THE TARGET POPULATIONThe population must be clearly defined in terms of the sample unit, sample element, extent and time. In simple samples sample unit and elements are the same target population. Collection of all the elements or objects from which information is to be gathered to solve the research problem. Target population must be carefully defined or the wrong sample elements may be selected. Important issues in defining the target population may be the geographic area within which the population resides and or demographics of the population(age/gender)
STEP 2 DETERMINE THE SAMPLE FRAMEA sample frame contains the list of available sample units at a stage of the sampling process e.g. an index (any population record), mailing lists etc.
A reliable sample frame must meet the following requirements : All elements of the population are represented Must be up to date. Details of each entry must be compete and correct. Must be accessible and the information must be easily drawn from it. Should ideally contain additional information that facilitates stratification.
Shortcomings of sample frames : Note : Its rare to find a sample frame that meets all of the requirements: Missing sample units Duplicate entries – to avoid this use one sample frame and arrange the list alphabetically Foreign elements – elements listed but which do not fall part of the population.
Types of sample frames :

Sample frames for private householdso Lists of names and addresses of individualso List of dwellingso Large scale mapso Lists of census surveys
Sample frames of businesses, government bodies, professionals and NPO’so Computerized registers of names and addresseso Address directoryo Membership lists of organizationso Telephone directoryo Records of local authorities
STEP 3 SELECT A SAMPLING TECHNIQUESampling technique can be divided into two;
Probability sampling-whereby each unit of the population has a known positive chance of being selected as a sample unit
Non probability sampling-the possibility that a certain unit will be selected as sample unit is unknown
DIFFERENCES BETWEEN PROBABILITY AND NON PROBABILITY SAMPLINGProbability Non probability
It takes more time It can be expensive to implement
Sample error can be estimated statistically if sample design meets certain requirements
It takes less time It is more convenient and cheaper to implement No indication can be given of possible error margins
of estimated population characteristics
NON PROBABILITY SAMPLING METHODS: Convenience sampling :Only those units (people) which are at the same place as the researcher will stand to be
selected or interviewed including the units that are easily reached by the researcher. Judgement sampling :Only those units which have experience on an element in question are interviewed: This is
referred to those units which have tested, used or being in contact with the element in question for some time Quota sampling :The researcher classifies the sample according to pertinent characteristics such as income, age, sex
etc. Snowball sampling :The initial respondent interviewed refers the researcher to another person (e.g. a friend, a
colleague or family member) to be interviewed as an additional respondent. Internet samples:Respondents are being questioned via internet e.g. IM, E-mail etc.
PROBABILITY SAMPLING METHODS: Simple random sampling
The sample is being selected in a way that every element of the population has equal chance of being selected in a sample unitSteps for drawing a simple random sample
o Number the elements sequentiallyo Use the number of figures in the table that corresponds with the number of figures in No Determine the starting point in the table in a random wayo Move in the same random direction in the table
Systematic samplingThe entire is population is numbered and elements are drawn using a skip interval (it’s determined by dividing the population size by the sample size)
Stratified sampleo The heterogeneous population is grouped into homogenous segments that are mutually exclusive and
comprehensive (no population element is excluded)

o The researcher selects elements from a number of samples to represent the entire population e.g. the researcher can make a conclusion by interviewing 20% marketing research students.
Cluster samplingo One element is selected from the population after the surrounding elements are selected
STEP 4 DETERMINE THE SAMPLE SIZEThe more closer the sample size is to population, the more accurately the sample will represent the population
Methods of determining the sample sizeo Blind guesses-the researcher predicts the possibility of the sample sizeo Statistical methods- the researcher uses statistical formulae to determine the sample size
Factors that often restricts the sample sizeo Available budget – large samples are costly. Available budget may restrict sample size.o Rule of thumb – through experience, researchers may know that a particular sample size is sufficient upon
which to base realistic decisions about the population as a whole.o Number of sub groups. Larger the number of sub groups, larger the sample size.o Traditional statistical methodologies – In the case of a simple random sample, factors such as standard
deviation, sampling error and confidence intervals will determine sample size.\o Population size – May influence sample size but no direct relationship
STEP 5 EXECUTE THE SAMPLING PROCESSSampling plan must now be put into practice through fieldwork and the use of controls to ensure that the correct sample elements are selected. Researchers need to know what steps to take if the sampling elements are not available for inclusion (eg : respondent always on holiday)
STUDY UNIT 11: FIELDWORK
Fieldwork is usually carried out during the final stages of the marketing research process and it is during this stage that the data is actually collected. Previous steps in marketing research process are of little value if careful consideration is not given to planning fieldwork and managing fieldworkers.
DATA COLLECTION CAN BE CARRIED OUT BY:1. Company marketing research staff – more control when over the collection process and data quality when by using own
staff.2. Externally – Outside firms that specialize in the collection of data can often do the job faster, example is AC Nielsen
Data collection is generally the most expensive task in market research and is also the one that is the most subject to error. The marketing researcher should monitor the fieldwork closely to make sure that the plan is correctly implemented and to guard against problems in contacting respondents, with respondents that refuse to cooperate or who gives biased or dishonest answers or interviewers who makes mistakes or take shortcuts. Aim of study unit is to look at the importance of planning, organising, preparing and carrying out of fieldwork.DEFINING FIELDWORK Fieldwork involves the selection, training, supervision, validation and evaluation of persons who collect data. It is important to note that field workers can collect data for researchers in two ways, namely in the field of from an office. Example, a field worker can conduct telephonic surveys from his office and then record the answers given over the phone.
PLANNING AND ORGANISING THE FIELDWORKAfter deciding on the data-gathering method, finalising the questionnaire and drawing the sample, it is time to organise the fieldwork. Effective fieldwork organisations require a complete fieldwork programme. A fieldwork program will outline the following:
Operator’s sub districts Number of questionnaires per operator’s sub districts Division of questionnaires per fieldworker Daily quota Stratification (for example into rural or urban areas) Places of residence
Telephone numbers of contact pointsResearcher needs to remember that the quality of the data collected will have crucial effect on the research findings.Some limiting elements to consider are the availability of time, human resources, funds and infrastructure for doing the fieldwork. These elements are addressed while planning and provision is made for them in the research proposal.The planning and organisation of fieldwork programme are influenced by the research subject (problem), questionnaire, sample design and fieldworkers.
PREPARING FOR THE FIELDWORKBefore starting the fieldwork, certain administrative requirements must be fulfilled.
1. Sufficient manuals and questionnaires for the fieldwork – number printed must include sample size and questionnaires for control and training purposes.
2. In preparation for the fieldwork, questionnaires can be packed in the quantities that will be need daily. Identification can be printed or written on the covers of packages.
3. Sufficient stationary requirements are essential.4. In some cases official documents are required in which the authorities acknowledge the research in their relative
areas.5. A file should be kept for each fieldworker, to facilitate questionnaire administration and to record remuneration.
SELECTING, TRAINING AND CONTROLLING INTERVIEWERSResearcher had full control of the project until this stage, now reliable on other people, such as fieldworkersto determine the success of the investigation. The recruitment of potential fieldworks, the right selection procedures and effective training is there for very important.
Selecting Before selecting any fieldworkers, a proper recruitment process must be implemented that takes into account the
needs of each survey Advisable that specific criteria be established first (e.g. reliability, neat appearance, experience, bilingualism, specific
qualifications) and clearly stipulated during recruitment. After recruitment, the selection procedures can be implemented. The aim of this procedure is to establish whether the
candidate will make a good fieldworker, based on the qualities determined beforehand, the type of fieldworker needed for a survey is prescribed and determined by the survey group and the nature of the research subject. The selection standards will depend on the nature of the research subject, the nature of the questionnaire to be used, they type of respondent to be interviewed and other factors inherent in the scope of the survey
A fieldworker’s job consists of three components: Clerical activities Liaison with the public Awareness of the work environment
The task requirements determine the personal requirements. The following requirements can be used as guidelines: Communication – Field worker must be a good “sender” and “receiver”, attuned to the verbal and non-verbal
behaviour of the respondent and have good self-control. Interpersonal relationships – Get on well with people and accepted by others Language proficiency – The fieldworker must be capable of good verbal expression, reading comprehension and
preferably bilingual. Responsibility – act responsible and reliable Adaptability – adapt to a broad spectrum of situations and people. Sensitivity – must be sensitive and know how to behave in specific situations with different respondents. Emotional control – not get emotionally involved, must instil confidence so that respondents feel free to air their
opinions. Acceptability – the image and first impressions that the respondents form of the fieldworker will naturally
influence their responses.
Training field workers Effective training is required to reach the desired marketing research results. Field workers must know exactly what is
expected of them and receive the necessary guidance in this respect. Field workers must be particularly informed about potential problems during the fieldwork and how to overcome them.

Training programme takes place in 3 stages: Fieldworkers are provided with training manual They attend training classes They receive training in the field
Some guidelines that can be given during training and could be included in the training manual: The general background of the sample survey, such as research objectives, types of questions to be asked and
sampling method used; The way in which the interview must be prepared The action and approach that must be followed, and the external appearance of the interviewer; the probing method that can be used to prevent incomplete answers the way to record the answers the importance of honestyAdditional guidelines as per SG Speak to the store owner/manager/person in charge of the store upon entering the store. Identify yourself Explain what you are doing Hand the respondent the letter of introduction, or read it aloud if necessary. Complete the front page(name of store, owner, etc) Ask all the questions Record responses by following the instructions below each questions – for example, tick more than one item if
necessary Do not influence the respondent when asking the questions
Supervision Control of interviewers needs to be exercised continuously – possibility of making errors during data collection is very
high Evaluation must, if possible, take place in the field – helps solve any problems immediately or enable changes/
improvements to be made timeously Supervisor can accompany fieldworker on first few visits so that personal help is available immediately should a
problem arise Researcher needs to monitor and control every phase of implementation Questionnaires need to be checked by the supervisor especially at beginning of fieldwork – interviewers could falsify
parts or all of the questionnaires, or complete them themselves instead of interviewing correct respondents). Disciplinary steps must be taken against those that do not give satisfactory work
Sampling control should also be exercised to ensure field workers correctly follow sampling plan
Validation The supervisor needs to check the quality of the feedback from interviewers Important to monitor the fieldwork conducted to prevent any mistakes affecting the research The researcher might take a sample of completed questionnaires and call respondents to verify their answers
Evaluation Last step in process – supervisor evaluates feedback received from the field workers Done according to:
Time field workers spent on research Response rates Quality of interviews Quality of data collected
USING A THIRD PARTY FOR FIELDWORK An external company can be used to carry out the fieldwork – responsible for managing the fieldwork process and
related admin Researchers intentions are only communicated to those responsible for gathering data during the briefing sessions,
which means that good briefing is essential to the success of the research project Briefing the third party Should include:
Information on the market Marketing background Factors that gave rise to the research
Agreeing on procedures: Interview format to be determined – once established, researcher to ensure that third party uses fieldworkers who
are capable and experienced enough for the type of interview Admin procedure for handling matters in the field must be agreed upon in writing before fieldwork starts. Includes:
Checking of the first day’s work Way in which fieldworkers will be supervised Timing of quality checks Types and percentage of checks to be used Number of interviews to be completed per day
Briefing interviewers: A good explanatory written brief must be developed and sent to interviewers with the questionnaire
SURVEY ERRORS The reliability of gathered data contributes greatly to the scientific accountability of a specific research project Researcher must therefore be aware of any survey errors and the distortions they may cause in the data Basic types of errors in MR studies:
Sample errors Non-sample errors:
made by fieldworkers Non-sample errors are therefore the most important errors that occur in MR Primary cause of total sample survey errors occur as a result of fieldworker’s lack of conception, logic, arithmetical errors, misinterpretation of
results and stats, incorrect tabulation, coding, reporting Unwillingness errors:
Respondent not willing to answer the question or gives a misleading answer
STUDY UNIT 12: PREPARATION OF PRIMARY DATA
This is an important step in the marketing research process; it’s a phase whereby raw data that has been gathered can be converted into meaningful information to solve the original marketing problem.In order to prepare and process the raw primary data the following steps needs to take place:
STEP 1 - VALIDATION OF DATA: is declaration that the data gathered is valid and accurate. Guidelines of validation of data
o Check backs Between 10-20% of the respondents whose names appear on the questionnaire are randomly
selected from the work of the interviewers involved in a project and telephoned to check if they were in fact interviewed.
o Review the questionnaire and the interviewing instructions If the interviewer was told to interview a woman between 20-25 years but the respondent’s
classification data shows a 40year old man, that respondent should not have been interviewed. Questionnaire is checked to ensure that the respondent meets the sample
o Evaluate the reputation of the interviewers Checking of each interviewers sheet to make sure interview was conducted according to the sampling
procedures
STEP 2 - EDITING: during this process, the correctness and completeness of all the questionnaires and observation forms are checked.
Control and adjustment of questionnaires are usually done in two stageso Field Editing
This a preliminary editing of gathered data done by field organisers (supervisors)
Is useful for solving any misunderstandings regarding field work procedures at an early stage.o Central Office editing
Thorough scrutiny and adjustment of the completed questionnaire or observation forms. Is usually done at head office by single expert in the field of the gathered data
Handling unsatisfactory questionnairesWhen a researcher is dealing with unsatisfactory responses that do no comply with the editing requirements, the following options can be taken:
o Review quality of the interviewers and quastionnareso Go back to the interviewer or respondent for more satisfactory responses.o Have the questionnaires completed and corrected by the editor.o Discard unsatisfactory parts of the questionnaireo Discard unsatisfactory questionnaires completely.
STEP 3 - CODING: Is the process of data categorising, it convert raw data into symbols, usually numbers that are entered into a computer and tabulated. Allocating symbols means that data can be converted into a computer-readable form.
Three Basic Steps in Coding o Specification of categories 3x requirements;
Categories Should be a suitable size Catergories must be mutually exclusive and incompatible Categories must be exhaustive and comprehensive
o Allocation of code numbers For instance, in a question that asks which sex a respondent belongs to- male category can be
allocated # 1 and female #2 , the appropriate code number is then recorded in the data file.Pre-coding-: at this stage, code numbers are also allocated to each category, and printed on the questionnaires . Is done by mainly for closed ended questions such as dichotomies and multiple choice questions Post-coding -: is a process whereby data is coded once the total data has been gathered, and is mainly done with open-ended questions
o Compilation of a code book This is a book with general instructions about each variable or question is coded on the questionnaire
or observations form.
BUILDING A DATA FILEIn order for the computer to analyse the data, the codes from each questionnaire must be entered into an electronic format r data file that the computer can read Various methods can be used to enter data/capture data including; optical scanning using specially designed equipment, MSWord, spreadsheet, etc. CLEANING OF DATA Errors may occur when entering the data into the computer. Rectification of these errors is called data cleaning. These errors are usually ascribed to coding and capturing erros and may include the following
Values that cannot be executed Data transformation i.e the age of 52 is entered as 25 Includision of foreign data i.e same value entered more than once Missing data Records that are not in sequence i.e data mixed up with inappropriate data
If a specific category on the questionnaire contains no response, the computer can indicate that this is a missing data, if the questionnaire was not discarded during eding, the following possibilities apply;
Leave the response open Replace all empty space with a neutral value Allocate a value on the basis of the respondent’s response pattern to other questions Accept the response as don’t know or not applicable
Recontact the respondent.
STORING OF DATAThe raw data preparation phase is complete once the data has been entered and cleaned. The data is now ready for processing and analysis. The raw data can be stored in the computer memory or on discs, CD ROM, Memory Sticks, etc
STUDY UNIT 13 – DATA ANALYSIS
Setting analysis objectives involves: Content of an intended analysis and involves the selection of the variables to be included. Focus of the intended analysis.
Exploratory Data Analysis (EDA) also known as descriptive statistics or descriptive analysis, is a large body of statistical and graphical technique that provides ways of looking at data to determine relationships and trends, identify outliers and influential observation, and describe or summarize data sets.Inferential statistics: is the estimation of population values based on sample values, through the construction of confidence intervals and statistical hypothesis testing statistical analysis softwares include; SPSS, SAS or statistical, and Microsoft excel spreadsheet.
DESCRIBING SURVEY DATAThis is to enable someone to get to know the data before you try something more adventurous.
Objectives of exploratory data analysis include Investigate the description of values. Detect errors in the loading process. Provide summary measures describing the typical or average, variable distributions. Create the opportunity for checking whether the distributional assumptions fo sub sequent hypothesis tests are
satisfied. Exploratory Data Analysis involves a large body of statistical and graphical techniques including;
One way frequency tables and cross tabulations ( i.e. contingence tables or stub and banner tables) Graphical presentations of data i.e. histograms, frequency polygons, cumulative frequency polygons and ogives, pie
chart, bar column, stem and leaf displays and maps. Summary descriptive statistics, including central tendency variability and shape measure.
INFERENTIAL STATISTICS This covers the estimation population values base on a sample value and statistical hypothesis testing. Estimating population values and constructing confidence intervals sample statistical can be used as estimators of
unknown population values. Sample values such as sample mean or sample proportion will usually differ from the true value because of the error
sampling error. Sampling error can be reduced by increasing the size of the sample. Sample standard mean will also have its standard deviation called standard error. Central limit theorem is a statistical rule that states that if we take a large number of simple random samples (n>30)
from a population, then the resultant distribution of sample mean will approach a normal distribution, with an average equal to the population mean (µ) and a standard deviation Sx .
Sx = σ/ѵn where n = sample size while σ = the population standard deviation
A confidential interval is a range of number believed to include an unknown population parameter. This includes a measure of confidence that the population does contain the population parameter of interest. Two pieces of information needed to construct a confidence interval are: The Z value associated with a specific level of confidence interval. The calculation of standard error.
Ѵp(1-p)/n Sx = σ/ѵn where σ standard deviation while n is sample sizeConfidence
interval for population mean = x -+ Z value x s/ ѵn

P = x -+ Z value x Ѵp(1-p)/n
Finite population correction (FPC) – ѴN-n/N-1 where N is the population size while n is the sample size
HYPOTHESIS TESTINGThis is the assumption of informed guess about some characteristic of a population that may be true or not true.
Important differences encountered in research; Mathematical differences i.e. 9.999 is not 10 Statistical significant differences i.e. the difference larger enough to query. Managerially important differences; is the difference are large enough to matter from managerial perspective.
Four types of hypothesis; Hypothesis concerning the differences between two or more groups. Hypothesis concerning the differences between two or more measures. Hypothesis investigating the relationship between variables. Single variable hypotheses that postulate the value of a particular population parameter, shape distribution or the
nature of the observations. Steps in formulating and testing a hypothesis;
1. Formulating the null and alternative hypothesis.2. Specifying the level of significance to be used in the testing hypothesis3. Select an appropriate statistical test.4. Calculate the value of the test statistic.5. Obtain the critical value from the correct statistical table and defining the region.6. Interpret the result and deciding on the rejection or non rejection of the null hypothesis.
STUDY UNIT 14 – REPORTING RESEARCH RESULT
PRIMARY OBJECTIVES OF A RESEARCH REPORT AND ORAL PRESENTATION To effectively communicate the findings of the research in a user friendly understandable way. To provide interpretations of the findings in a the form of well-substantiated and logical conclusions and
recommendations To illustrate the credibility of the research project To serve as a future reference document for decision making
IMPORTANCE OF THE FINAL RESEARCH AND ITS PRESENTATIONS The Research report is important because it is the only aspect of the research project that the management of
enterprises look at. The research project is evaluated based on effectiveness of the presentation of the research report by management. Management not concerned with details of the research project but interested in the results and how well the
information can be used to solve the marketing problem.
CRITERIA OF A GOOD RESEARCH REPORT Completeness – a complete report covers all objectives set out in the brief and provides readers with the info required
in a language they understand Accuracy – refers to the correctness of info in the report Clarity – refers to the phrasing in the report, should be precise and understandable Conciseness – the report should be complete and standalone without any additional clarification
INTERPRETATION Is the transformation of the research results into integrated and meaningful conclusions and findings Conclusions and findings must be relevant to the research objectives and result in a solution to the marketing problem. When interpreting the results the researcher must decide:
o To what degree the data supports the original hypothesiso Which alternative hypothesis seem to provide a reasonable explanationo Which new questions and implications arise from the findings that must be investigated further.
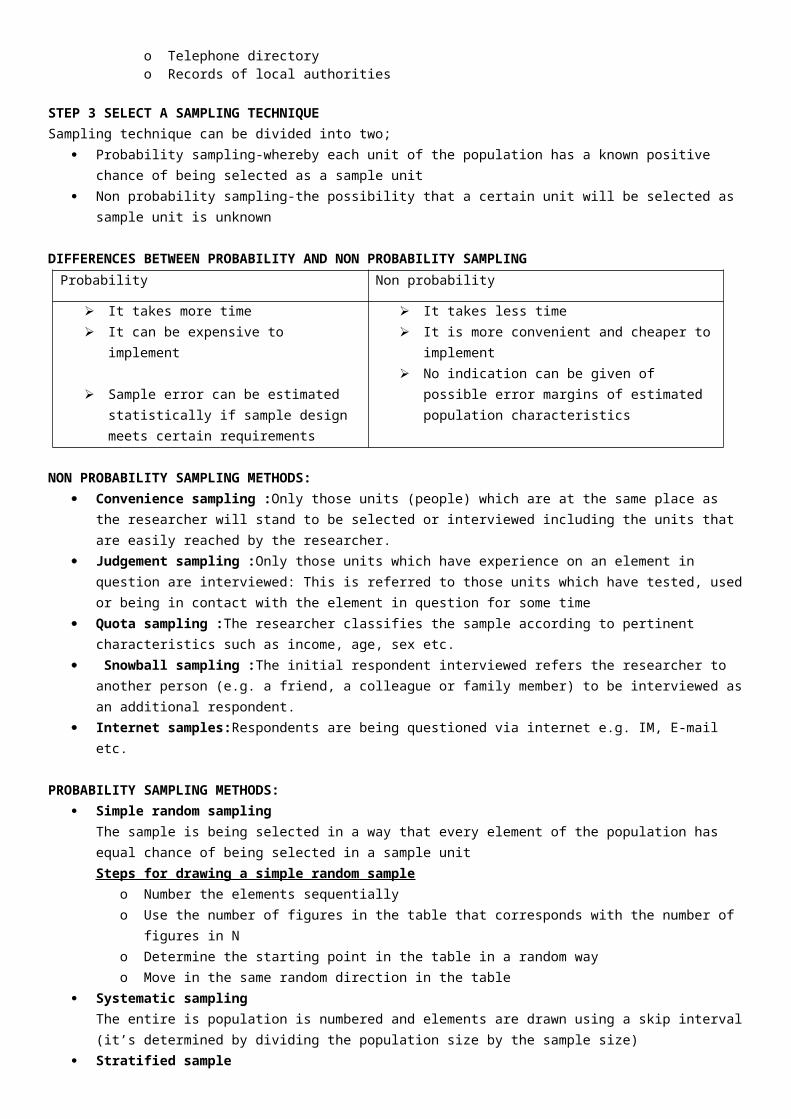
GENERALISATION Generalisation is when the interpretations and conclusions of the representative sample are generalised for the
population. Generalisations and predictions are made about the general population based on studying the behaviour of a
representative group of people. From this it is clear that an absolute representative sample is a scientific prerequisite for the generalisation of results
and interpretations.
FORMAT OF THE RESEARCH REPORTA) Introductory section of the research report
1. Title Page Contains title of the report, must be short, specific and precise Title must be explanatory as its main function is to indicate what is contained in the report. A well defined title immediately gets the reader’s attention
2. Table of Contents Lists the discussion points as they appear in the report with page references Headings of section and sub sections in the table of contents must correspond to headings in the report.
3. List of tables and graphs Tables and figures are indicated separately with their page references.
4. Proposal and letter of authorisation Proposal contains research objectives, research plan and the project’s cost and duration It refreshes managements memory, may be a few weeks since the marketing manager authorised the project Acts as a yardstick for assessing the value of the research project If the proposal is too long an excerpt should be included Letter of authorisation is a letter authorising the research project Letter includes details of the person responsible and resources available for the project. Letter is written by the marketing manager who orders the research
5. Executive Summary Includes a one or two page summary specifically for the use of management. Often the most important part of the research report as most members of management read only this section
especially if an oral supplements the written report It is a short synopsis of the contents and purpose of the research project. It is not a substitute for the research report as it only provides the decision maker with condensed research
results. A good summary contains the following aspects
- Scope of the marketing problem, research objectives, a short description of the sample and the data-gathering methods
- Results of the various elements of the study- Interpretation of results, conclusions and findings- Recommendations ( if required)
Should be between 100 and 175 words and must be written after the research report has been compiled.B) Main contents of the research report
1. Introduction Introduction provides the reader background information needed to understand the report Tells the reader about the content of the marketing problem in a broad context and the purpose and proposed
hypotheses of the research project. Background information about the service/product concerned and the marketing problem must be provided Definitions of terms can be included here Info about previous research into the marketing problem must be included in the introduction
2. Methodology Objective is to describe the research design, the sampling method and methods used for gathering and
analysing data. Do not use too many technical terms, use terminology that is understandable to the reader. Complicated formulae and techniques should appear in the annexure
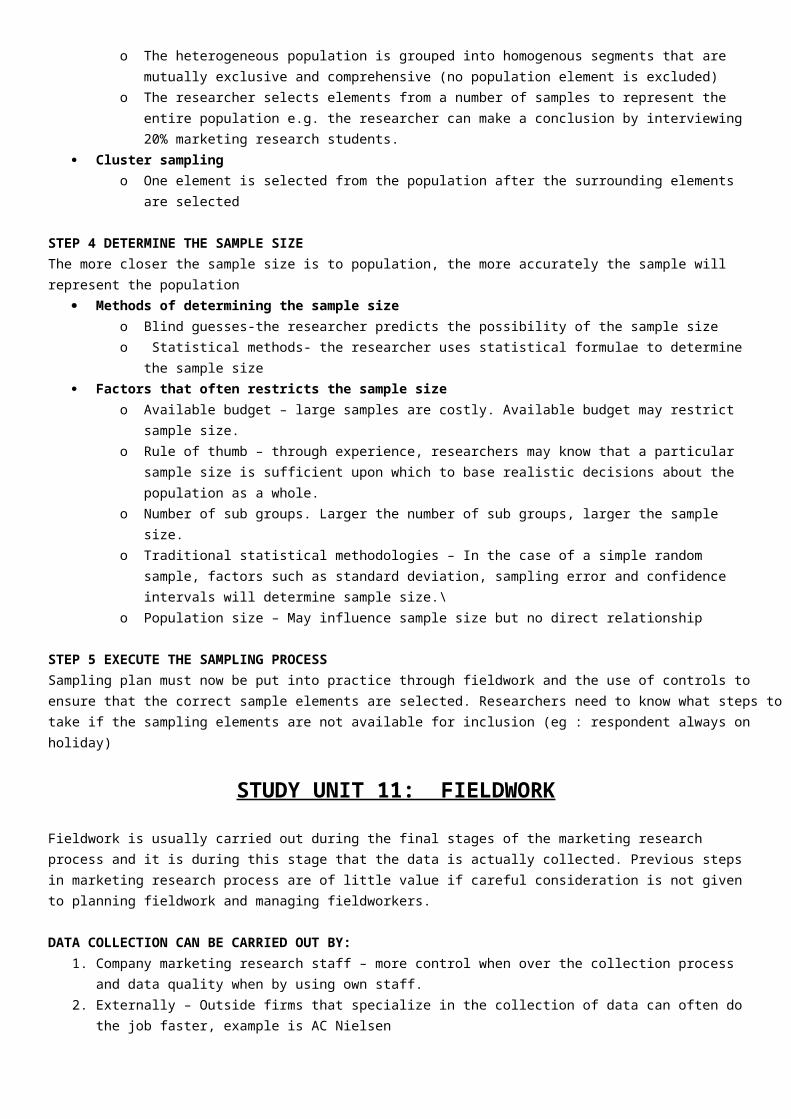
The researcher must explain to the manager the main points of the research method and provide reasons for selecting the method.
The main points include: questionnaires, sample size, and sampling method, types and sources of secondary data, and the method of analysis.
Start and finish dates of the primary steps in the research process must be given to provide readers with sufficient technical detail so they appreciate the quality of the gathered data and research findings.
Aspects generally discussed in the methodology section of the research report Research strategy
A description of the research strategy used and why the specific design was implemented. Research must indicate whether the research was exploratory, descriptive or causal
Data-collecting methods All applicable info about the method used to gather the data. Researcher must indicate whether data was collected from primary or secondary sources and what
type of data-collecting method was used: survey observation or experimentation. T Technique used must be shown eg personal interview, postal questionnaires. A copy of the
questionnaire or observation form must be included in the annexure. The Sample
This discussion must answer the following questions: Who was the population, what sample frame was used, what sample units were used? Which and how many respondents were involved in the research project.
What selection method was used to obtain a representative sample. Also demographic characteristics such as the sex and age and other relevant info about the sample must be provided.
Fieldwork Procedures Determines the degree of accuracy of the results, deals with the what and how of data collection. The researcher must indicate the number and type of fieldworkers used, the type of training and
supervision provided. Analysis
A Description of the statistical techniques used to analyse the collected data.3. Results
A discussion of the researchers interpretation of the results, deductions ad generalisations Results must be presented in a logical sequence to facilitate the decision making process. Findings must be linked to the research objective and to the initial marketing problem. Results can be presented in the form of tables, graphs and other and figures: tables used for numerical
presentation of data while graphs and other figures present data in visual form. Limitations and shortcomings of the results and findings
The research report must mention the limitations and shortcomings that affect the validity of results and final conclusions
Limitations can be related to sample errors and sample units as well as respondents who did not want to co-operate during the research project.
Researcher should not over emphasise these shortcomings and stumbling blocks as it could harm the creditability of the research project.
4. Summary and recommendations (if required) Important point of the summary is that it is a synopsis The summary must briefly cover the whole course of the investigation: the problem, method, results and
conclusions. Recommendations if required must follow the conclusions and findings Reasons for recommendations must be in given in detail. It may be necessary to differentiate between conclusions and recommendations: conclusions are opinions and
views based on results and recommendations are specific suggestions for action