· web viewmoreover, two additional and plausibly exogenous events drove the spread of slavery in...
TRANSCRIPT
Suffrage, labour markets and coalitions in colonial VirginiaAppendix
This Appendix consists of four parts. Part 1 presents additional figures and tables. Part 2 presents robustness checks. Part 3 discusses alternative mechanisms. Part 4 provides supplementary information about the data.
1

Part 1: Additional figures and tables
Fig. A1. Suffrage and inequality in VirginiaNotes: The shaded grey areas indicate periods without an elected Assembly. The broken line represents the share of the white male landless population (as a fraction of the total white male population).
2

Panel A: Suffrage in Virginia versus the rest of the South
Panel B: Suffrage in Virginia versus the North
Fig. A2. Suffrage in Virginia compared to suffrage in the South and in the NorthSource: McKinley (1905).Notes: The South includes Maryland, South Carolina and North Carolina, while the North includes Massachusetts, Rhode Island, Connecticut, New Hampshire, New York, New Jersey, Pennsylvania and Delaware. We do not include Georgia as part of the Southern colonies as it was established only in 1732, more than 100 years after Virginia. See the text on how the suffrage index is constructed. The broken lines are obtained by locally weighted least squares smoothing (lowess) with a bandwidth of 80% over all colony-year observations for the South (without Virginia) (Panel A) and the North (Panel B).
3
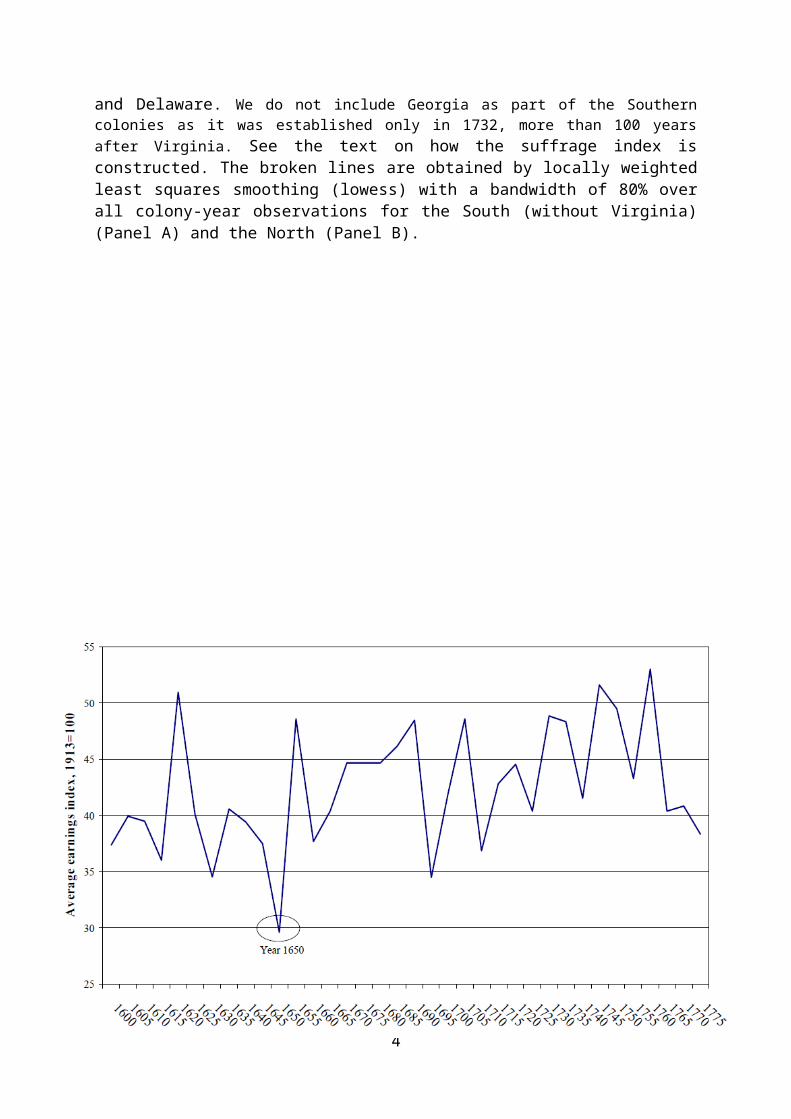
Fig. A3. Average real earnings in the United Kingdom, 1600-1775Source: Officer (2008).Notes: This graph shows the evolution of average real earnings in the United Kingdom in the 17th and 18th centuries, using five-year averages in order to minimise data volatility. The wage index is normalised so that 1913=100.
4

Table A1 Estimated population and population composition of Virginia, 1610-1780
Source: Historical Statistics of the United States (2006, Table Eg1-59).
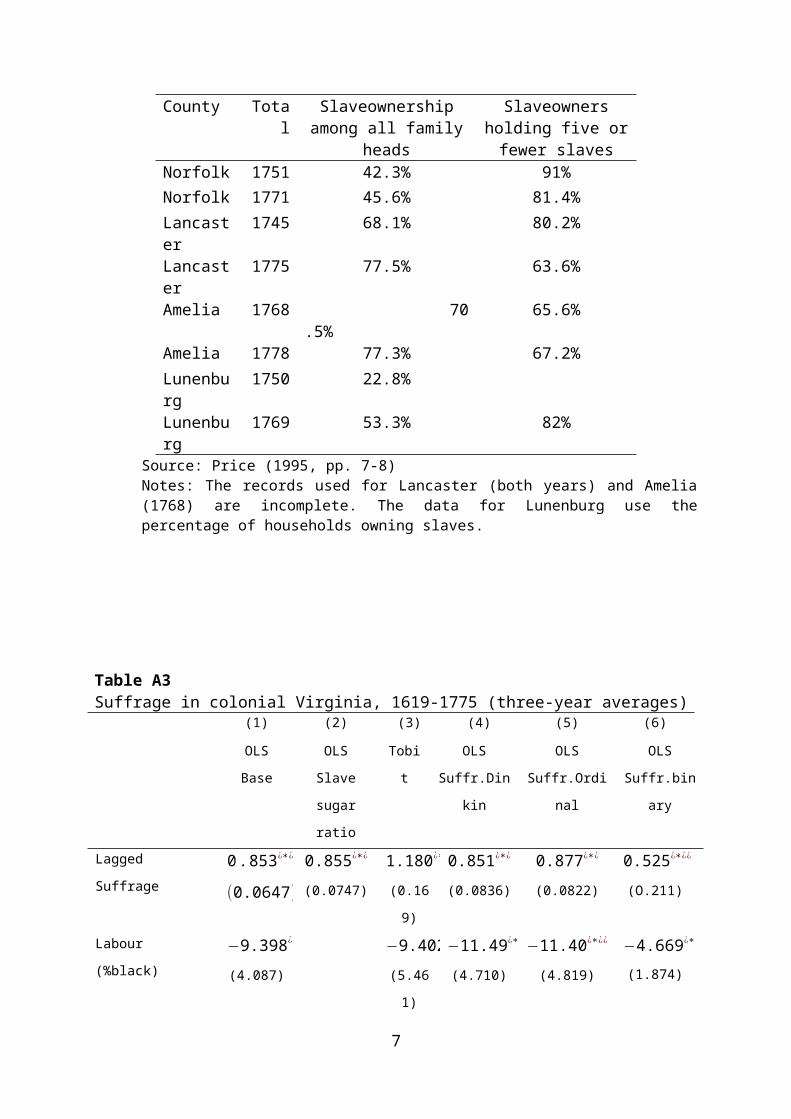
Table A2Slave ownership in four Virginia counties, 1751-1778
Source: Price (1995, pp. 7-8)
Notes: The records used for
Lancaster (both years) and Amelia (1768) are incomplete. The data for Lunenburg use the percentage of households owning slaves.
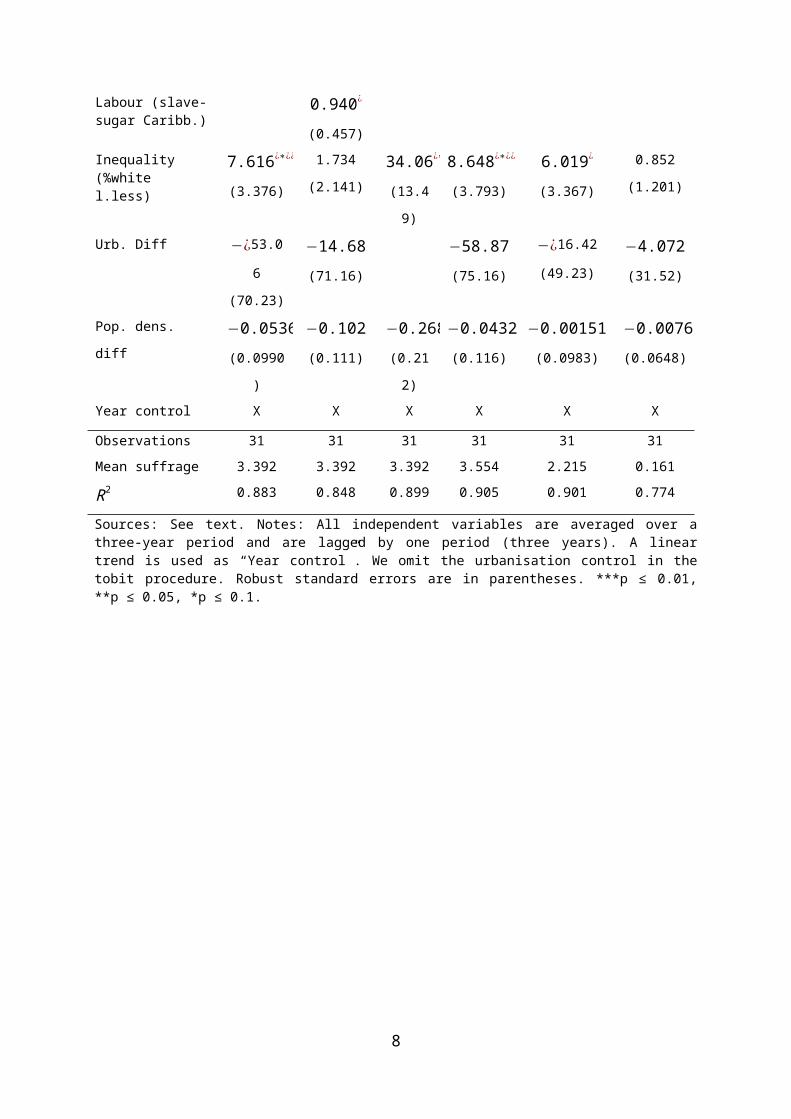
Table A3Suffrage in colonial Virginia, 1619-1775 (three-year averages)
(1) (2) (3) (4) (5) (6)
5
Year Total White Black %Black ∆%Black
1610 350 350 0 0.00%1620 2,200 2,180 20 0.91% 0.91pp1630 2,500 2,450 50 2.00% 1.09pp1640 10,442 10,292 150 1.44% -0.56pp1650 18,731 18,326 405 2.16% 0.73pp1660 27,020 26,070 950 3.52% 1.35pp1670 35,309 33,309 2,000 5.66% 2.15pp1680 43,596 40,596 3,000 6.88% 1.22pp1690 53,046 43,701 9,345 17.62% 10.74pp1700 58,560 42,170 16,390 27.99% 10.37pp1710 74,513 55,163 19,350 25.97% -2.02pp1720 87,757 61,198 26,559 30.26% 4.30pp1730 120,600 84,000 36,600 30.35% 0.08pp1740 180,440 120,440 60,000 33.25% 2.90pp1750 236,681 129,581 107,100 45.25% 12.00pp1760 339,726 199,156 140,570 41.38% -3.87pp1770 447,016 259,411 187,605 41.97% 0.59pp1780 538,004 317,422 220,582 41.00% -0.97pp
County Total Slaveownership among all family heads
Slaveowners holding five or fewer slaves
Norfolk 1751 42.3% 91%Norfolk 1771 45.6% 81.4%
Lancaster 1745 68.1% 80.2%Lancaster 1775 77.5% 63.6%
Amelia 1768 70.5% 65.6%Amelia 1778 77.3% 67.2%
Lunenburg 1750 22.8%Lunenburg 1769 53.3% 82%

OLS Base OLS
Slave sugar
ratio
Tobit OLS
Suffr.Dinkin
OLS
Suffr.Ordinal
OLS
Suffr.binary
Lagged Suffrage 0 .853¿∗¿
(0.0647)
0.855¿∗¿
(0.0747) 1.180¿∗¿
(0.169)0.851¿∗¿
(0.0836) 0.877¿∗¿
(0.0822) 0.525¿∗¿¿
(O.211)Labour (%black) −9.398¿∗¿¿
(4.087) −9.402¿
(5.461)−11.49¿∗¿ ¿
(4.710) −11.40¿∗¿ ¿
(4.819) −4.669¿∗¿ ¿
(1.874)Labour (slave-sugar Caribb.)
0.940¿
(0.457)Inequality (%white l.less)
7.616¿∗¿¿
(3.376) 1.734(2.141) 34.06¿∗¿¿
(13.49)8.648¿∗¿¿
(3.793) 6.019¿
(3.367) 0.852(1.201)Urb. Diff −¿53.06(70.23) −14.68(71.16) −58.87(75.16) −¿16.42(49.23) −4.072(31.52)Pop. dens. diff −0.0536(0.0990) −0.102(0.111) −0.268(0.212)
−0.0432(0.116) −0.00151(0.0983) −0.00760(0.0648)Year control X X X X X X
Observations 31 31 31 31 31 31Mean suffrage 3.392 3.392 3.392 3.554 2.215 0.161R2 0.883 0.848 0.899 0.905 0.901 0.774Sources: See text. Notes: All independent variables are averaged over a three-year period and are lagged by one period (three years). A linear trend is used as “Year control”. We omit the urbanisation control in the tobit procedure. Robust standard errors are in parentheses. ***p ≤ 0.01, **p ≤ 0.05, *p ≤ 0.1.
6
Part 2: Robustness Checks
In this section, we detail several identification threats and show robustness checks, which
confirm the validity of our econometric work.
What if the arrival of slavery in Virginia was not exogenous? Our use of the ratio of
Caribbean slave-sugar prices in the regressions partially mitigates such a concern. Moreover,
two additional and plausibly exogenous events drove the spread of slavery in the South. First,
data on English average real earnings (from Officer (2008)) in the 17 th and 18th centuries
suggest that rising incomes during the period 1655-1705 decreased the supply of indentured
servants, thus prompting Southern planters to switch from indentured servants to slaves
(Figure A3). Second, the dissolution of the Royal African Company in 1698, the entity that
managed the English slave trade since 1662, increased the supply of black workers by
opening the slave trade to private merchants.
In addition, omitted variables, which are correlated both with the composition of the
labour markets and with the extent of the suffrage could be biasing the results. For example,
we lack information on the educational attainment of the population and education not only
affects labour markets but also the extent of the franchise as it is typically associated with
reform. Unmeasurable cultural factors, to the extent that they vary over time, could also be
biasing the results. We mitigate the latter issue by adding time dummies. Data on education
are unfortunately unavailable.
In Table A4, we probe the robustness of our results in several ways. In column 1, we
include an alternative measure of economic development calculated by Allen et al. (2012, pp.
871-879) for Maryland. The welfare ratio is the full-time, full-year earnings of a male
unskilled worker relative to the cost of subsistence for a family of four.1 Including this
variable in our regressions makes little difference to our results, while rendering its own
coefficient insignificant.
Reverse causality, which in our case would imply that suffrage restrictions determined
the labour market composition in colonial Virginia via encouraging or discouraging
international and cross-colony migration, is theoretically possible. To alleviate concerns about
endogeneity related to reverse causality, in column 2 we take labour markets as a dependent
variable and regress it on lagged suffrage and our usual set of controls. We obtain a very
1 A welfare ratio of 1 indicates that the labourer earns just enough to keep his family at subsistence, while higher values imply more prosperity. Virginia and Maryland produced predominantly tobacco, so it is reasonable to assume that real wages followed similar patterns in the two colonies.
7
small positive coefficient on the suffrage index, suggesting that reverse causality is unlikely to
drive our results. In the next two columns of Table A4, we conduct Granger causality tests
between our proxy for labour markets and the suffrage index, using three lags of each.2
Unreported tests for joint significance of the coefficients indicate that labour markets matter
for political institutions, but not vice versa. Results using a VAR model for suffrage and
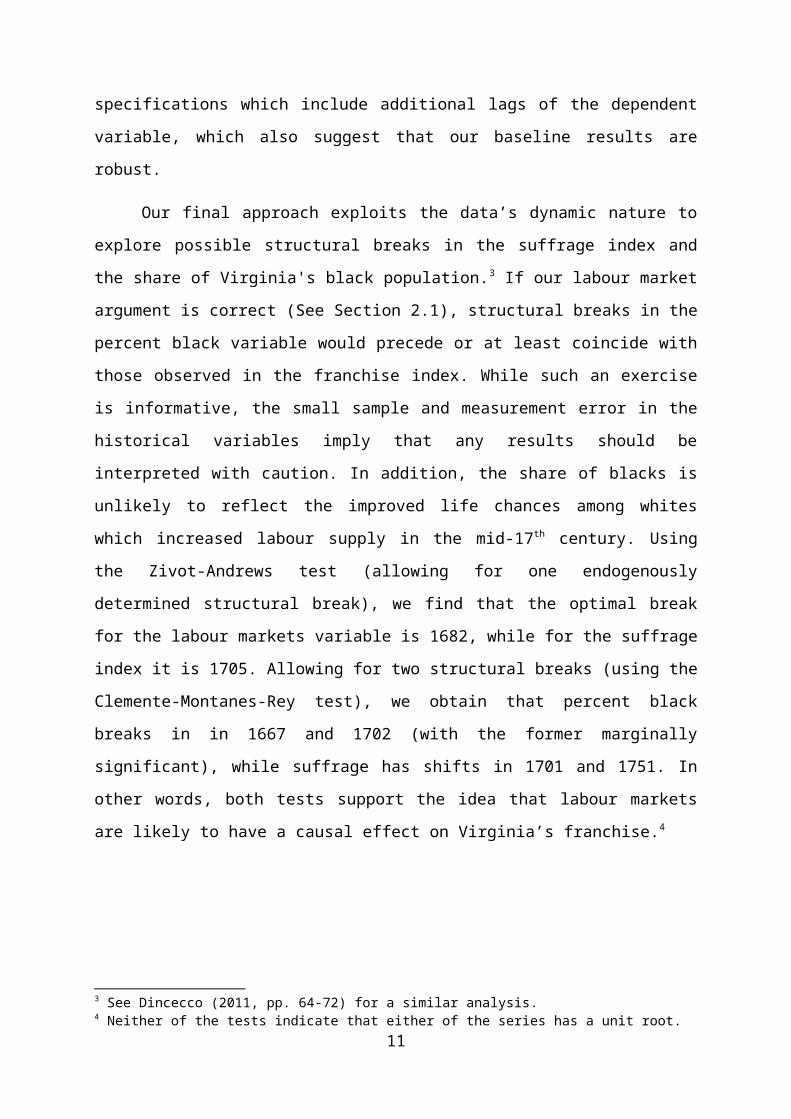
labour markets (reported in the last two columns of the table) are very similar. In Table A5,
we present specifications which include additional lags of the dependent variable, which also
suggest that our baseline results are robust.
Our final approach exploits the data’s dynamic nature to explore possible structural
breaks in the suffrage index and the share of Virginia's black population.3 If our labour market
argument is correct (See Section 2.1), structural breaks in the percent black variable would
precede or at least coincide with those observed in the franchise index. While such an exercise
is informative, the small sample and measurement error in the historical variables imply that
any results should be interpreted with caution. In addition, the share of blacks is unlikely to
reflect the improved life chances among whites which increased labour supply in the mid-17th
century. Using the Zivot-Andrews test (allowing for one endogenously determined structural
break), we find that the optimal break for the labour markets variable is 1682, while for the
suffrage index it is 1705. Allowing for two structural breaks (using the Clemente-Montanes-
Rey test), we obtain that percent black breaks in in 1667 and 1702 (with the former
marginally significant), while suffrage has shifts in 1701 and 1751. In other words, both tests
support the idea that labour markets are likely to have a causal effect on Virginia’s franchise.4
2 Results using fewer lags are similar and available upon request.3 See Dincecco (2011, pp. 64-72) for a similar analysis.4 Neither of the tests indicate that either of the series has a unit root.
8

Table A4 Suffrage in colonial Virginia, 1619-1775 (annual data): Robustness
(1) (2) (3) (4) (5) (6)
OLS
Welfare
ratio MD
OLS
Dep. Var.
Labour
OLS
Granger - dep.
var. Labour
OLS
Granger - dep.
var. Suffrage
VAR -
Suffrage
VAR -
Labour
Suffrage t-1 0 . 932¿∗¿
(0.0326)
0.00247¿∗¿
(0.000424)−0.000489(0.000645)
0.819¿∗¿
(0.0900) 0.819¿∗¿
(.0998) −0.000(0.001)Suffrage t-2 0.00197(0.00165) 0.0154(0.0422) 0.0154(0.131) 0.002(0.001)Suffrage t-3 −0.00107(0.00144) 0.0892¿
(0.0535) 0.0892(0.100) −0.001(0.001)Labour t-1 −2.786¿∗¿¿
(1.365) 0.943¿∗¿
(0.0178) 1.744¿∗¿
(0.130) −15.29¿
(7.885) −15.29(10.929) 1.744¿∗¿
(0.103)Labour t-2 −0.778¿∗¿
(0.124) 34.83¿∗¿¿
(16.76) 34.83¿
(20.098) −0.778¿∗¿
(0.190)Labour t-3 −0.00278(0.0261) −23.44¿
(12.11) −23.44¿∗¿
(10.601) −0.003(0.100)Welf.rat. MD 0.0581 (0.0517)Inequality (%white l.less)
2.018¿∗¿¿
(0.986) 0.0543¿∗¿
(0.0183) 0.0183¿
(0.00945) 2.081¿∗¿¿
(0.975) 2.081¿
(1.163) 0.0183¿
(0.011)Year control X X X X X X
Other controls X X X X X X
Observations 93 93 93 93 93 93R2 0.939 0.998 0.999 0.943 0.943 0.999Sources: See text. Notes: All independent variables are lagged by one period (one year). A linear trend is used as “Year control". Controls for differenced urbanisation and population density are included but not shown. Robust standard errors are in parentheses. ***p ≤ 0.01, **p ≤ 0.05, *p ≤ 0.1.
9

Table A5 Suffrage in colonial Virginia, 1619-1775 (annual data): Additional suffrage lags
(1) (2) (3) (4)
OLS Welfare
ratio MD
OLS
Dep. Var.
Labour
OLS
Granger - dep.
var. Labour
OLS
Granger - dep.
var. Suffrage
Lagged suffrage (1) 0 . 947¿∗¿
(0.0255)
0.864 ¿∗¿
(0.0723) 0.858¿∗¿
(0.0752) 0.851¿∗¿
(0.0787)Lagged suffrage (2) 0.0873(0.0592) 0.0131(0.0555) 0.0135(0.0578)Lagged suffrage (3) 0.0863(0.0618) 0.00641(0.0553)Lagged suffrage (4) 0.0936(0.0612)Labour (%black) −3.027¿∗¿¿
(1.516) −3.290¿∗¿¿
(1.647) −3.578¿∗¿¿
(1.790) −3.898¿∗¿¿
(1.941)Inequality (%white l.less) 2.004¿∗¿ ¿
(0.983) 2.202¿∗¿¿
(1.076) 2.440¿∗¿¿
(1.192) 2.708¿∗¿¿
(1.317)Year control X X X X
Other controls X X X X
Observations 93 93 93 93R2 0.938 0.939 0.939 0.940
Sources: See text. Notes: All independent variables (except where indicated) are lagged by one period (one year). Additional suffrage lags are included in columns (2)-(4). A linear trend is used as “Year control”. Controls for differenced urbanisation and population density are included but not shown. Robust standard errors are in parentheses. ***p ≤ 0.01, **p ≤ 0.05, *p ≤ 0.1.
10
Part 3: Alternative explanations
In this section, we explore the potential intervening impacts of income inequality, the threat of
revolution, the differential costs of democracy, ethnic fractionalisation and racism, and
ideology. We conclude that our results are robust to these alternative explanations.
First, although an advanced system of taxation and redistribution did not emerge in the
colony until after the American Revolution, several percentage points of the average
colonist’s income went to taxes. The government used these proceeds to finance in-kind
redistribution, such as poor relief and the building of roads, bridges, and schools (Rabushka,
2010, p. 14-17). As a result, increasing inequality, possibly driven by declining servant wages
following the arrival of slavery, could have increased redistribution demands and prompted
the establishment of autocratic institutions in the eighteenth century. Although we lack time
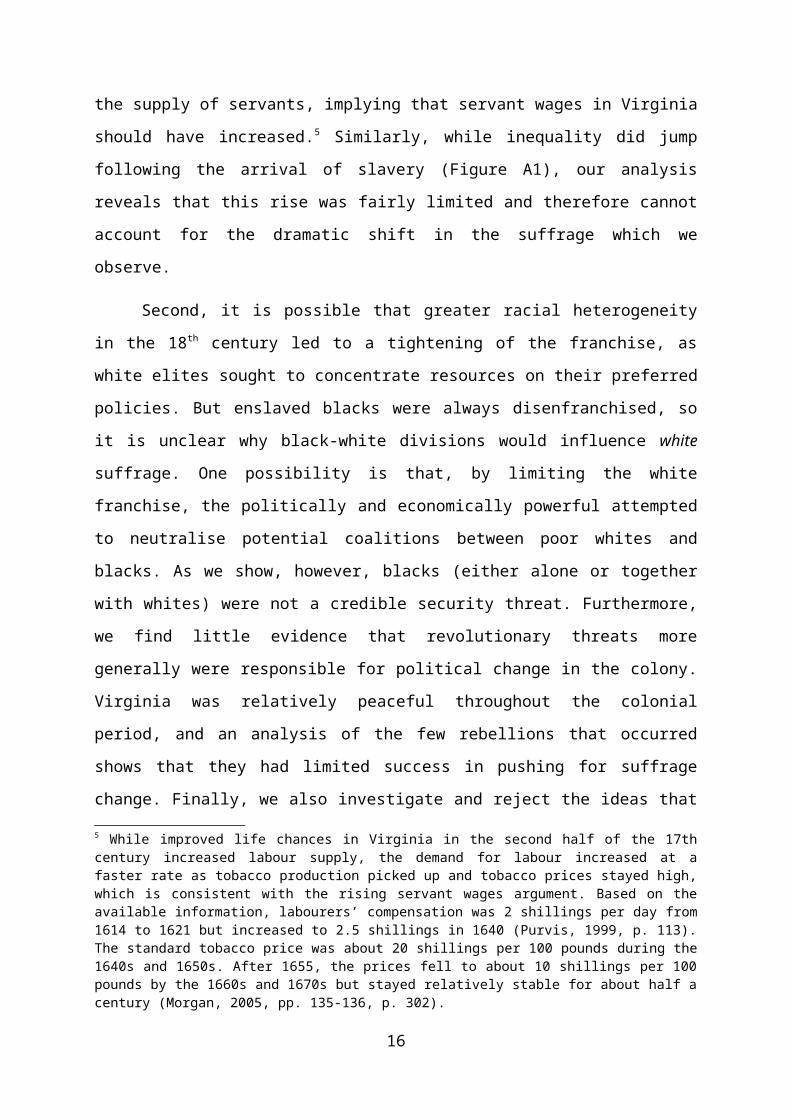
series data on servant compensation, rising incomes in Britain in the period 1655-1705
(Figure A3) as well as increasing regulation of the servant trade by the Crown in the late 17 th
century decreased the supply of servants, implying that servant wages in Virginia should have
increased.5 Similarly, while inequality did jump following the arrival of slavery (Figure A1),
our analysis reveals that this rise was fairly limited and therefore cannot account for the
dramatic shift in the suffrage which we observe.
Second, it is possible that greater racial heterogeneity in the 18 th century led to a
tightening of the franchise, as white elites sought to concentrate resources on their preferred
policies. But enslaved blacks were always disenfranchised, so it is unclear why black-white
divisions would influence white suffrage. One possibility is that, by limiting the white
franchise, the politically and economically powerful attempted to neutralise potential
coalitions between poor whites and blacks. As we show, however, blacks (either alone or
together with whites) were not a credible security threat. Furthermore, we find little evidence
that revolutionary threats more generally were responsible for political change in the colony.
Virginia was relatively peaceful throughout the colonial period, and an analysis of the few
rebellions that occurred shows that they had limited success in pushing for suffrage change. 5 While improved life chances in Virginia in the second half of the 17th century increased labour supply, the demand for labour increased at a faster rate as tobacco production picked up and tobacco prices stayed high, which is consistent with the rising servant wages argument. Based on the available information, labourers’ compensation was 2 shillings per day from 1614 to 1621 but increased to 2.5 shillings in 1640 (Purvis, 1999, p. 113). The standard tobacco price was about 20 shillings per 100 pounds during the 1640s and 1650s. After 1655, the prices fell to about 10 shillings per 100 pounds by the 1660s and 1670s but stayed relatively stable for about half a century (Morgan, 2005, pp. 135-136, p. 302).
11

Finally, we also investigate and reject the ideas that the rising costs of democratic institutions
and elite ideology, rather than labour market considerations, drove the tightening of the
franchise in the 18th century. In what follows, we explore each explanation in further detail.
Inequality
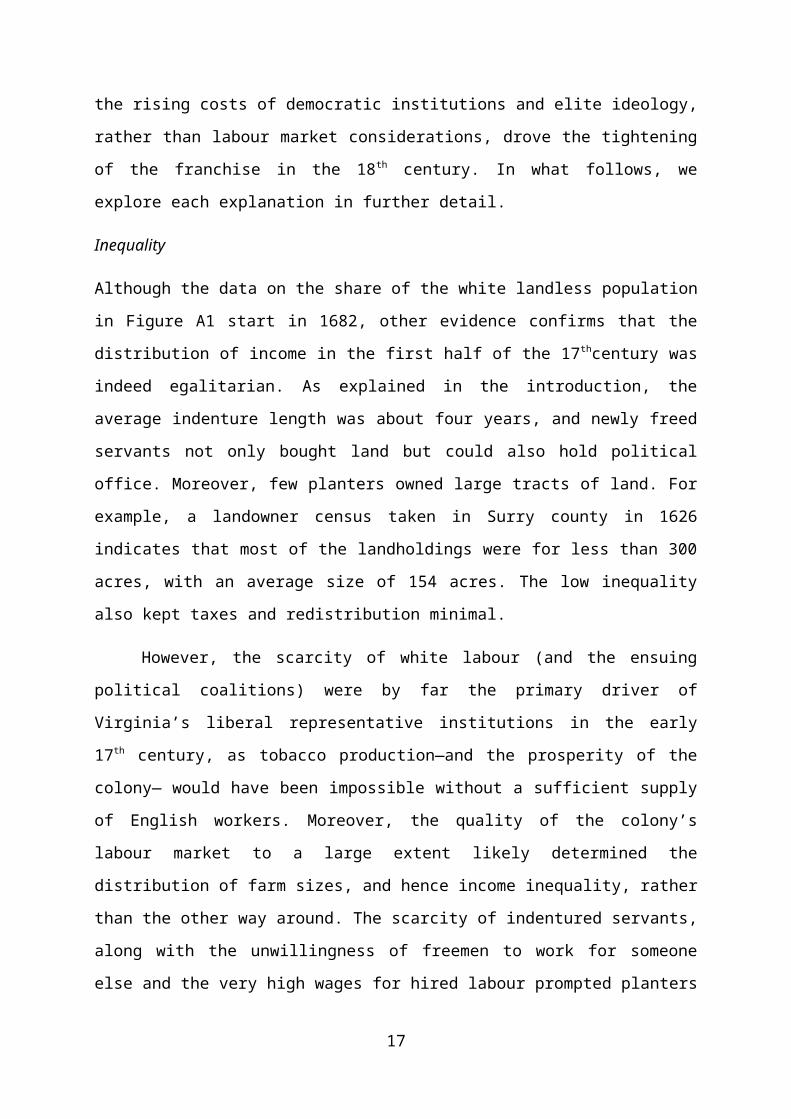
Although the data on the share of the white landless population in Figure A1 start in 1682,
other evidence confirms that the distribution of income in the first half of the 17 thcentury was
indeed egalitarian. As explained in the introduction, the average indenture length was about
four years, and newly freed servants not only bought land but could also hold political office.
Moreover, few planters owned large tracts of land. For example, a landowner census taken in
Surry county in 1626 indicates that most of the landholdings were for less than 300 acres,
with an average size of 154 acres. The low inequality also kept taxes and redistribution
minimal.
However, the scarcity of white labour (and the ensuing political coalitions) were by far
the primary driver of Virginia’s liberal representative institutions in the early 17 th century, as
tobacco production—and the prosperity of the colony— would have been impossible without
a sufficient supply of English workers. Moreover, the quality of the colony’s labour market to
a large extent likely determined the distribution of farm sizes, and hence income inequality,
rather than the other way around. The scarcity of indentured servants, along with the
unwillingness of freemen to work for someone else and the very high wages for hired labour
prompted planters to break up and sell off larger landholdings which they could not exploit
efficiently (Wertenbaker, 1922, pp. 44-47).
Furthermore, there is little evidence that the tightening of the franchise in the second
half of the 17th century was preceded by a rise in income inequality. According to Figure A1,
only approximately one third of Virginia’s white population was without land in the late 17 th
and early 18th centuries, which is comparable to the figures in the relatively equal Northern
colonies, such as Massachusetts, New Hampshire, and Rhode Island. Data covering the
distribution of servants, land transfer records and rent rolls also suggest that Virginia's
inequality remained low throughout the 17th century. Small and medium sized farms (of under
200-300 acres) were wide-spread, while large landholdings (larger than 300 acres) were
relatively rare (Wertenbaker, 1922, p. 43-45). Likewise, an analysis of wills in four Virginia
counties (Isle of Wright, Lower Norfolk, Surry and Westmoreland) during the 1680-1689
period shows that there was little difference in the quality of possessions among different
income groups. While the rich had more property than the poor, everyone owned a similar set 12

of goods, consisting of wood or rough iron cooking utensils, boiling pots, wooden furniture,
and in general little jewelry or silk clothing (Deen, 1972, p. 163-164).
Our inequality data also reveal that the arrival of slavery in the early 18 th century did
not significantly affect income inequality, implying that the inequality-suffrage link is less
convincing. While roughly one third of Virginia’s white population was landless in the 1680s,
by the 1750s, this figure increased by only around five percentage points.6 Slavery enabled
rich farmers to amass large fortunes by substituting black labourers with servants, and thus led
to the expansion of the upper class, while also impoverishing those farmers who were unable
to afford slaves. However, access to cheap labour also enlarged the class of farmers who had
enough capital to buy even a few slaves, which meant that a large middle class of farmers also
emerged.
The distribution of working-age adult males resident in a household (tithables) across
colonial households confirms this trend. Households with one tithable usually engaged in
subsistence farming, while the number of tithables was higher for those farmers holding
servants or slaves. As Table A6 shows, throughout the 17 th and 18th centuries, most families
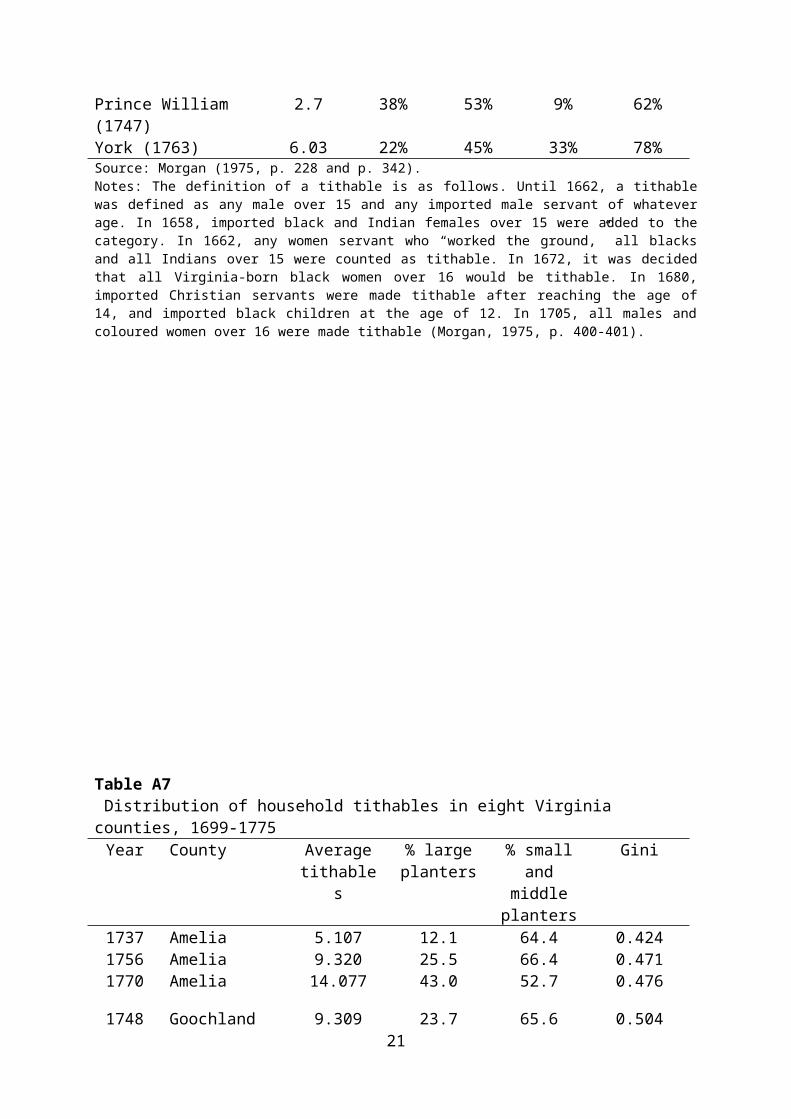
held small farms that had between 2 and 5 tithables. Table A7, which uses the distribution of
tithables to calculate Gini coefficients, also suggests that the distribution of resources stayed
fairly constant during the colonial period. Will evidence from Deen (1972, pp. 163-170)
covering the years 1700-1719 is consistent with these findings. Although only large planters
owned items such as carriages and horses, slaves, jewelry, clothes and imported furniture, the
quality of the average will improved significantly for all classes of freemen. For instance, all
farmers were enjoying luxury goods including silver and china utensils, silk clothing and rugs.
6 The unconditional correlation between percentage black (labour markets) and percent white landless (inequality) during the entire colonial period is merely -0.04.
13
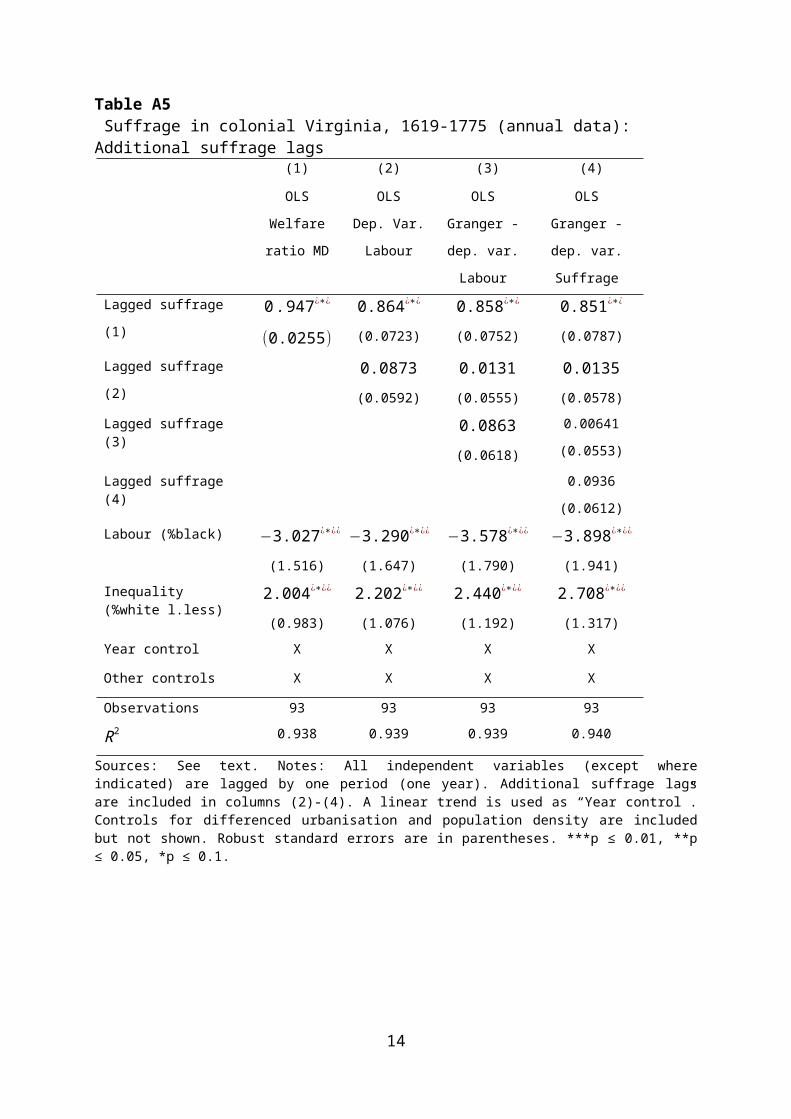
Table A6 Distribution of household tithables in Virginia in the 17th and 18th centuriesCounty Average
tithablesper HH
HHs withjust 1
tithable
HHs with2-5
tithables
HHs with5+
tithables
HHs with2+
tithablesBefore 1700Accomack (1679) 2.49 45.6% 47.1% 7.3% 54.4%Henrico (1679) 2.72 37.5% 55% 7.5% 62.5%Lancaster (1679) 3.18 36.4% 52.3% 11.4% 63.7%Northampton (1677) 2.29 53.7% 39% 7.3% 46.3%Northumberland (1679) 2.27 33.9% 55.4% 10.7% 66.1%Surry (1679) 1.98 58% 36.7% 5.3% 42%
After 1700Amelia (1753) 3.31 39% 45% 16% 61%Chestereld (1756) 3.17 41% 43% 16% 59%Goochland (1754) 3.46 31% 53% 16% 69%Lancaster (1745) 4.34 19% 54% 27% 81%Loudoun (1760) 2.67 45% 44% 11% 55%Lunenburg (1748) 1.95 64% 30% 6% 36%Norfolk (1754) 2.79 46% 43% 11% 54%Orange (1755) 4.22 25% 48% 27% 75%Prince William (1747) 2.7 38% 53% 9% 62%York (1763) 6.03 22% 45% 33% 78%Source: Morgan (1975, p. 228 and p. 342).Notes: The definition of a tithable is as follows. Until 1662, a tithable was defined as any male over 15 and any imported male servant of whatever age. In 1658, imported black and Indian females over 15 were added to the category. In 1662, any women servant who “worked the ground,” all blacks and all Indians over 15 were counted as tithable. In 1672, it was decided that all Virginia-born black women over 16 would be tithable. In 1680, imported Christian servants were made tithable after reaching the age of 14, and imported black children at the age of 12. In 1705, all males and coloured women over 16 were made tithable (Morgan, 1975, p. 400-401).
14

Table A7 Distribution of household tithables in eight Virginia counties, 1699-1775
Year County Average tithables
% largeplanters
% small and middle planters
Gini
1737 Amelia 5.107 12.1 64.4 0.4241756 Amelia 9.320 25.5 66.4 0.4711770 Amelia 14.077 43.0 52.7 0.476
1748 Goochland 9.309 23.7 65.6 0.5041754 Goochland 8.783 22.2 68.5 0.4801770 Goochland 13.883 37.1 54.7 0.513
1699 Surry 3.972 5.5 69.6 0.361
1699 Lancaster 8.141 17.7 71.6 0.4921720 Lancaster 11.865 28.6 58.6 0.567
1761 Loudoun 4.726 9.4 61.4 0.4361775 Loudoun 6.663 16.2 60.2 0.510
1748 Lunenburg 3.982 4.9 62.4 0.4111774 Lunenburg 7.227 17.8 73.4 0.365
1731 Norfolk 5.069 12.1 58.9 0.4481751 Norfolk 6.399 12.7 70.6 0.4621771 Norfolk 7.278 20.5 63.9 0.462
1739 Orange 5.922 12.5 74.5 0.3691756 Orange 9.948 25.0 65.5 0.4811769 Orange 10.239 28.8 63.9 0.445
Source: Price (1995). Notes: See the notes to Table A6 for the definition of a tithable. Large planters are those with more than 11 tithables, while small and middle planters are those with 2-10 tithables. The Gini calculations use data on the distribution of tithables.
The threat of revolution
A further scenario predicts that elites will extend the right to vote in order to credibly commit
themselves to economic concessions in the face of organised mass resistance (Acemoglu and
Robinson, 2006). Although the colony was peaceful for most of the 18 th century, it
experienced a series of uprisings in the period 1660-1683, among which the servant uprising
of 1663, Bacon´s rebellion in 1676, and the tobacco cutting riots of 1683. Those that chose to
rebel included a small number of slaves, poor whites and indentured servants who protested
15
against their working conditions and the gradual loss of political rights (Breen, 1973, pp. 10-
12).
Bacon’s rebellion followed the decision of the House to limit the suffrage to
householders and freeholders in 1670, but had mixed success in pushing for long-term
policies expanding popular participation in government. On the one hand, a representative
county levy court was established, in which members were elected by the majority of freemen
in each parish county. Similarly, previously appointed offices in the vestries and militia were
made elective (McKinley, 1905, p. 33). On the other hand, the 1676 decision to extend the
suffrage to all freemen was rescinded in the same year, and only freeholders and householders
could vote until 1683. Although a new law was passed which allowed essentially all freemen
to vote, the suffrage was limited to freeholders again in 1699.
Furthermore, Table 2 shows that the most liberal political institutions (which allowed
even indentured servants to vote) were adopted in the early 17th century, at a time when there
were in fact few uprisings. More importantly, it was the switch from indentured servitude to
slaves in the early 18th century that underlied both Virginia’s stability and its restrictive
representative institutions (Breen, 1973, pp. 13-17). As we argued in the analytic narrative,
slavery benefited not only large planters, but also smaller farmers who could afford even a
few slaves. As the latter class expanded and prospered and the number of indentured servants
and poor whites dwindled, the interests of big and small landholders became more closely
aligned. This not only prompted the tightening of the franchise to freeholders in 1699, but also
made it increasingly costly for small farmers to participate in lower class collective action,
thus improving the security situation in the colony.
The costs of democracy
It may be possible that even in an environment of stable labour markets and inequality, the
continued redistribution burden of a democratic regime becomes unsustainable, prompting
elites to constrain the franchise. For instance, even small amounts of redistribution may put
significant pressure on cash strapped governments that need to service debt or have high war
expenses. As a result, financial concerns and not labour markets may dictate if democracy is
feasible or not.
The major sources of taxation and redistribution in the colony were the poll tax and the
export duty on tobacco, amounting to 2 shillings per hogshead. The poll tax was levied on all
white males above 16, as well as on male and female servants and slaves, and consisted of
public, county and parish levies. At first glance, an examination of Figure A4 and Table A8 16
below suggests that 17th-century democracy may indeed have been expensive. The tax burden
of the average colonist was much higher in the 17 th century, when democratic institutions
prevailed, relative to the 18th century, when the suffrage was tightened. However, the spike in
tax rates in the early years of settlement was not due to increased redistribution, but rather to
increased military spending needed to ward off Indian attacks. Since a portion of colonial
taxes went to the English government, tax rates also rose when the mother country demanded
more funds, such as during the English Civil War of 1642-1651, as well as when the English
Parliament expanded public spending after the Glorious Revolution.
Fig. A4. Virginia poll tax rates, 1619-1775Source: Rabushka (2010). Data for 1629-1686: p. 243-244; data for 1687-1710: p. 426; data for 1711-1739: p. 535; data for 1739-1762: p. 671; data for 1763-1772: p. 840.Notes: Poll tax rates are in pounds of tobacco per person. The figures covering 1711 to 1718 are estimates.
It is possible that the multiple financial burdens placed on the Virginia government
made a generous suffrage regime unsustainable in the longer term. There are at least three
reasons that make such a conclusion less plausible. Virginia’s issuance of debt was minimal
throughout the colonial period and even during periods of increased expenses, such as the
French and Indian war of 1754-1763. Second, the increase in tobacco exports and prices after
1700 suggests that the colony, using receipts from export duties, could afford more liberal
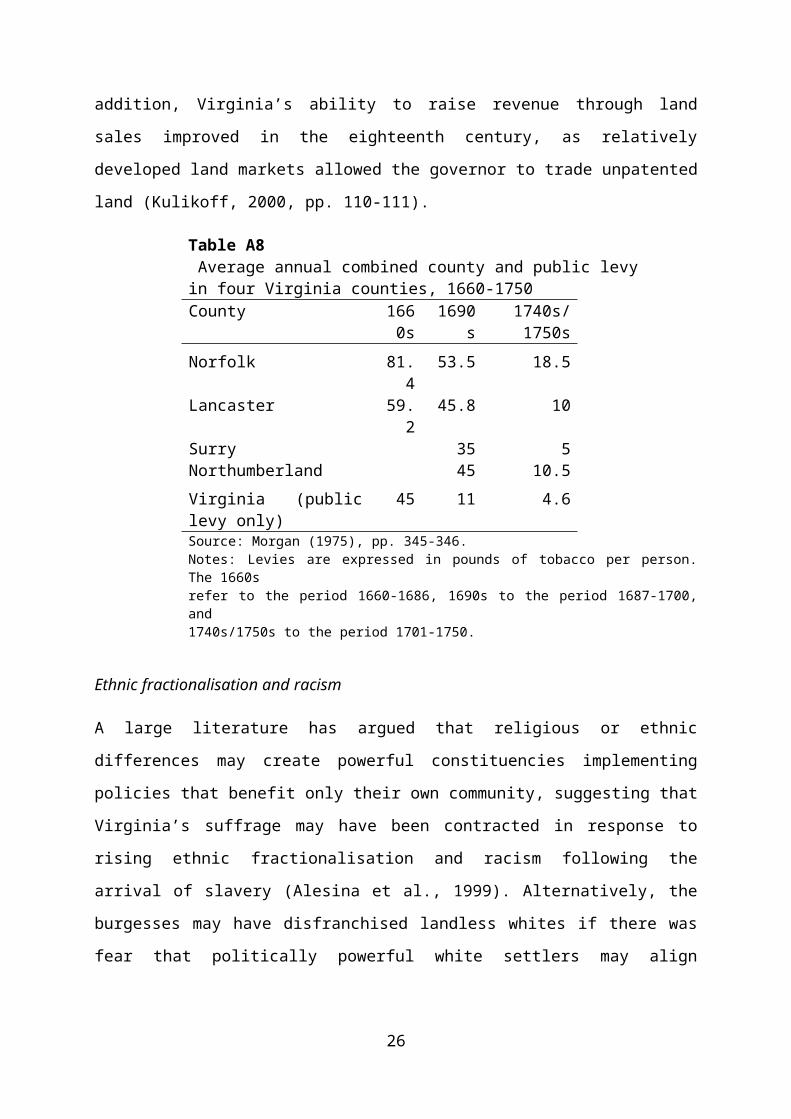
representative institutions and the arising redistribution. In addition, Virginia’s ability to raise
17

revenue through land sales improved in the eighteenth century, as relatively developed land
markets allowed the governor to trade unpatented land (Kulikoff, 2000, pp. 110-111).
Table A8 Average annual combined county and public levy in four Virginia counties, 1660-1750County 1660s 1690s 1740s/1750s
Norfolk 81.4 53.5 18.5Lancaster 59.2 45.8 10Surry 35 5Northumberland 45 10.5Virginia (public levy only) 45 11 4.6Source: Morgan (1975), pp. 345-346.Notes: Levies are expressed in pounds of tobacco per person. The 1660s refer to the period 1660-1686, 1690s to the period 1687-1700, and 1740s/1750s to the period 1701-1750.
Ethnic fractionalisation and racism
A large literature has argued that religious or ethnic differences may create powerful
constituencies implementing policies that benefit only their own community, suggesting that
Virginia’s suffrage may have been contracted in response to rising ethnic fractionalisation and
racism following the arrival of slavery (Alesina et al., 1999). Alternatively, the burgesses may
have disfranchised landless whites if there was fear that politically powerful white settlers
may align themselves with blacks in order to rebel against colonial authority.
These arguments are less convincing for a number of reasons. White planters did
regard blacks as inferior and limited their rights (Kulikoff, 1986, p. 381-420). Slaves were
considered property, and in the late 17th and early 18th century, even the small number of free
blacks in the colony lost a number of privileges held previously, such as the right to employ
white indentured servants, the ability to hold political office and the right to vote. However,
the rising disapproval of blacks cannot adequately explain why white freemen without land or
property were deprived of the right to vote only after the arrival of slavery and not before.
Most blacks did not have a voice in colonial politics, and therefore it is less likely that the
division of whites versus blacks directly influenced white suffrage. In addition, the suffrage
was changed very shortly after the arrival of slavery, or much before whites and blacks could
interact extensively and develop attitudes toward each other.
Moreover, it is less likely that slaves, either alone or in a coalition with poor whites,
presented a credible security threat to whites. In the 18 th century, capital crimes (excluding
burglary) were rare in Virginia, and data in Kulikoff (1986, p. 390) show that blacks were on 18

average only involved in one act of violence per county per decade.7 Slaves also did not attack
whites: between 1740 and 1779, there were only three cases of arson, one of perjury and three
assaults by slaves against whites.
Ideology
Many historians, such as Israel (2009), emphasise the importance of ideology in the
development of democratic institutions. Is it possible that Virgnia’s less liberal regime in the
late 17th and early 18th centuries was driven by politicians who were simply more conservative
or by changes in ideology?
There are four pieces of evidence which speak against this scenario. First, the political
experience of European migrants arriving in Virginia and the rest of the Southern colonies
was very similar throughout the colonial period. Although by 1680, nearly 90% of colonial
Americans were English, by the early 18th century more and more non-English migrants were
arriving in the colonies, with the largest groups including Scotch-Irish, Germans and Dutch
(Ward, 1991, pp. 109-116). In both the 17th and 18th centuries, the franchise in all these
sending countries was less inclusive than the one in the Southern colonies.8
Second, many of the same families which controlled Virginia’s Assembly in the 17th
century were also in charge of politics after the arrival of slavery. Given a large literature on
the intra-family transmission of cultural values (Bisin and Verdier, 2000), it is unlikely that
such politicians were affected by changes in ideology. For example, in Virgnia dynastic
groups like the First Families sent succeeding generations into public service. Similarly, in
New Jersey more than half of all assembly members elected since 1703 were related to
representatives who sat in either house of the legislature before their own election. This was
due not only to the property qualifications imposed upon candidates, but also because
attendance of assembly sessions required a lot of time and resources, particularly because
politician compensation was often set at minimum levels (Purvis, 1999, pp. 193-194).
Third, even if conservative ideology did not spread through Virginia via immigration
(from Europe or the other colonies), could it have taken root in the colony due to changes in
educational policy? Although the College of William and Mary was established in
Williamsburg 1693, in 1705 a fire and shortage of senior staff forced the administration to
offer classes only at the grammar-school level. By 1750, only 100 students had entered the
7 These are defined as rape, murder, attempted murder or poisoning. Burglary was more frequent than any of the latter events: around three cases per county every two years.8 See Nikolova (Forthcoming) for a detailed discussion.
19

college, but none had matriculated (Purvis, 1999, p. 242). It is therefore unlikely that an
ideological shift among Virginia’s elite would have taken place without the existence a strong
educational institution.
Finally, the inclusion of year dummies in all specifications in the regressions makes it
less likely that time-variant ideological shifts among Virginia’s politicians can explain away
the empirical results in the paper.
20
Part 4: Supplementary data information
Suffrage
These data are available annually from the first year of each colony’s settlement to 1775 from
McKinley (1905). The complete list of franchise regulations across all colonies includes: (1)
being a free person (indentured servants were not considered free during the terms of the
indenture); (2) the possession of land, or the combination of house and land (“freeholding”);
(3) the possession of income or property; (4) whether a minimum freeholding, property or
income amounts were required; (5) tax paying (such as income or poll taxes); (6) residency in
the colony in which voting was taking place; (7) holding any particular religious belief; (8)
being a non-felon; (9) being white; (10) the possession of a house; (11) having a particular
social status, such as men with a family, being the son of a freeholder, or being a person of
“good moral character”; (12) any other requirements, such as having one’s land formally
patented. Since all colonies allowed only men aged 21 and above to vote, we do not account
separately for restrictions related to gender or age. We do not focus on requirements for
voting in local elections, as these not only were similar to those for colony elections, but also
are not available consistently.
Section 4.1.1 in the main text describes how the suffrage variable is calculated in
colonial Virginia. To calculate suffrage in the rest of the colonies, we need to consider that in
some colonies (other than Virginia) voters were given the freedom to pick from two or more
requirements in order to vote, which likely implied that the size of the electorate was larger
than those in colonies which imposed only one of those restrictions. For example, while from
1698 onward, North Carolina required all voters to be free-holders, Maryland allowed electors
who did not possess land to vote if they owned property worth at least 40 pounds. We
therefore give the freeholding restriction in North Carolina a weight of 1, while in Maryland
the restrictions for (1) freeholding, and (2) income or property, each carry a weight of one
quarter, respectively. As we assume that having a choice of two voting criteria is only half as
restrictive as needing to satisfy one of those criteria, the sum of the two Maryland restrictions
is thus one half. A similar approach is adopted when one suffrage requirement can be
substituted with two or three others, yielding sums of one third and one fourth, respectively.
To illustrate how this coding works for non-Virginia colonies, consider the case of
South Carolina. From 1669 until 1691, the South Carolina suffrage index takes a value of 5.5,
as the colony allowed all freemen to vote (obtained by subtracting a coding for the existence
of a single restriction from the maximum number of restrictions in the sample (6.5)). In 1692, 21

electors instead had to possess income or property worth ten pounds, and to take an oath, so
we code the existence of restrictions for income or property, minimum income or property,
and oath taking, yielding a suffrage index of 3.5 (obtained by subtracting 3 from 6.5). In 1697,
an additional requirement for three-month residence in the colony prior to election was
introduced, which decreases the suffrage index to 2.5 (obtained by subtracting 4 from 6.5). In
1704, all previous requirements were kept, but voters were given a choice to satisfy either the
ten-pound income or property requirement, or the possession of land of fifty acres. We give a
weight of one quarter for both of the latter requirements, which means that the suffrage index
now takes a value of 4 (obtained by subtracting 2.5 from 6.5).
This weighting scheme is clearly imprecise. Given that estimates on the proportion of
voters under each suffrage regulation are unavailable for any of the colonies, Nikolova
(Forthcoming) experiments with several alternative operationalisations of the suffrage index,
including (1) assigning equal weights to all component restrictions (which implies not
accounting for any possible substitutions among restrictions); (2) assigning weights of 1/2 and
1/3 (instead of 1/4 and 1/9) to restrictions that can be substituted with one other or two other
restrictions, respectively; and (3) using principal component analysis, which creates data-
dependent weights. As comparing combinations of restrictions across colonies is arguably less
precise, we do not implement the ordinal coding approach used for Virginia (described below)
for the rest of the colonies. The cross-colony suffrage variable is also reasonably well
correlated with data on suffrage extensiveness (covering mostly the 18th century), as well as
when the suffrage coding is extended to cover the period 1775-1860. Although admittedly we
cannot claim to remove all sources of bias from these data, this information, along with the
several different coding approaches implemented in this paper, makes us more confident that
our results are not driven by the idiosyncrasies of a particular coding approach.
The ordinal coding (for Virginia only) takes the following values. First, we calculate a
raw suffrage index as follows: 0 if there were no restrictions; 1 if voters needed to be freemen;
2 if, in addition to 1, voters also needed to be both freeholders and households; or
householders with a family (regardless of whether a minimum freeholding requirement
existed or not); 3 if voters had to be freeholders and of a particular religion; OR if voters had
to be tax-paying freemen resident in the colony; 4 if voters had to satisfy restrictions for
freeholding, religion and race; 5 if voters had to satisfy restrictions for freeholding, residency,
religion and race; and 6 if no elections were held in the colony. We then subtract the raw
22

suffrage index from the maximum number of restrictions in the sample (6.5) to obtain the
ordinal suffrage index used in the regressions which ranges from 0.5 to 6.5.
Labour markets: percent black and white population density The data are available from
Historical Statistics of the United States (2006), in ten-year periods from 1610-1780. Missing
values are filled in by linear interpolation. Virginia’s size is from Purvis (1999, p. 19).
Labour markets: Ratio of Caribbean slave prices/sugar prices Eltis et al. (2005) provide
these data in constant prices. The years covered are 1674, as well as five-year periods from
then onward until 1775 (for instance, 1675-1679).
Inequality: percent white landless We assemble the data set on the share of Virginia’s white
male landless population from Kulikoff (1986, 2000), Main (1965), and Nash (1979). These
data are available for the following years: 1682-1709; 1745-1756, 1759-1764, and 1767-1773.
Remaining missing values are filled via linear interpolation (following by now a standard
approach in the literature - see, for instance, Boix (2003)).
The conclusions that we draw from the percent landless data—that inequality in
Virginia stayed broadly constant throughout the colonial period—square well with other
historical research focusing on the post-independence period. On the eve of the American
Revolution, the wealth distribution in New England, usually regarded as the most egalitarian,
was actually slightly more unequal than that in the South (Jones, 1980, p. 289). In 1774, the
richest 10 per cent of New Englanders who left probate records held 57 per cent of the net
worth, compared with 49 per cent in the South and 42 per cent in the Middle colonies. This
conclusion is echoed by Lindert and Williamson (2013, p. 756) who show that income
inequality in 1774 New England was similar to that in the South.9 These results provide
indirect evidence that the impact of slavery on inequality in the South was comparable to
inequality shifts in the slave-free North.
Although percent landless should capture to a considerable extent movements in
colonial inequality, it is of course possible that this variable also accounts for other factors
that may have an important - and independent - effect on the evolution of representative
institutions. A first possibility is that it simply is a proxy for poverty. A colony with many
poor people may be less likely to extend the suffrage, possibly because of the high cost of
sustaining a democratic system. Similarly, poor constituents may be less informed and may be
less likely to demand a change in political institutions. Alternatively, it is possible that
9 As in our case, this is true when slaves are excluded from the calculation.23

disgruntled and disenfranchised poor colonists may mobilise themselves in a rebellion with
the aim of obtaining the suffrage.
Even though we cannot rule out a priori that percent landless also proxies for these
other factors, there are several pieces of evidence that point against their importance. First,
income differences are likely correlated with population density and urbanisation for which
the regressions also control (as explained in Part 2 above, regression results are also robust to
controlling for the Maryland welfare ratio). Second, as argued above, adequate government
financing was never really an issue for Virginia. Moreover, literacy rates were uniformly high
throughout the colonial period in both the Northern and the Southern colonies (mostly in the
range 60%-80%), suggesting that information asymmetries across voters were less extensive.
Urbanisation is calculated by dividing Virginia’s total urban population (from Purvis
(1999) and Purvis and Balkin (1995)) by the settled area (for the latter, see the sources in the
description of population density). The urban population data include the following years and
cities: Norfolk, VA: 1766-1775, and Richmond, VA: 1790 - assumed that this value was the
same as in 1775. Missing data prior to the first year of available data are given a 0 value.
24

References
Acemoglu, D. and J. A. Robinson (2006): Economic Origins of Dictatorship and Democracy, Cambridge University Press.
Alesina, A., R. Baqir, and W. Easterly (1999): “Public Goods and Ethnic Divisions,” Quarterly Journal of Economics, 114, 1243-1284.
Allen, R. C., T. E. Murphy, and E. B. Schneider (2012): “The Colonial Origins of the Divergence in the Americas: A Labor Market Approach,” Journal of Economic History, 72, 863-894
Bisin, A. and T. Verdier (2000): “”Beyond The Melting Pot”: Cultural Transmission, Marriage, and The Evolution of Ethnic and Religious Traits,” Quarterly Journal of Economics, 955-988.
Boix, C. (2003): Democracy and Redistribution, Cambridge University Press.
Breen, T. H. (1973): “A Changing Labor Force and Race Relations in Virginia 1660-1710,” Journal of Social History, 7, 3-25.
Bruce, P. (1910): Institutional History of Virginia in the Seventeenth Century, G.P. Putnam´s sons.
Craven, W. (1971): White, Red, and Black: The Seventeenth-Century Virginian, James W. Richard lectures in history, University Press of Virginia.
Deen, J. W. (1972): “Patterns of Testation: Four Tidewater Counties in Colonial Virginia,” American Journal of Legal History, 16, 154-176.
Dincecco, M. (2011): Political Transformations and Public Finances: Europe, 1650-1913, Cambridge University Press.
Eltis, D., F. D. Lewis, and D. Richardson (2005): “Slave Prices, the African Slave Trade, and Productivity in the Caribbean, 1674-1807,” The Economic History Review, 58, 673-700.
Games, A. (1999): Migration and the Origins of the English Atlantic World, vol. 133, Harvard University Press.
Historical Statistics of the United States (2006): “Part E, Government and International Relations,” in Colonial Statistics, Millennial Edition Online, Cambridge University Press, ed. by R. Sutch and S. Carter.
Israel, J. (2009): A Revolution of the Mind: Radical Enlightenment and the Intellectual Origins of Modern Democracy, Princeton University Press.
Jones, A. H. (1980): Wealth of a Nation to Be: The American Colonies on the Eve of the Revolution, Columbia University Press.
Kulikoff, A. (1986): Tobacco and Slaves: The Development of Southern Cultures in the Chesapeake, 1680-1800, University of North Carolina Press.
25
(2000): From British Peasants to Colonial American Farmers, University of North Carolina Press.
Lindert, P. H. and J. G. Williamson (2013): “American Incomes Before and After the Revolution,” Journal of Economic History, 73, 725-765.
Main, J. T. (1965): The Social Structure of Revolutionary America, Princeton University Press.
McKinley, A. E. (1905): The Suffrage Franchise in the Thirteen English Colonies in America, Ginn & co., Boston.
Menard, R. (1988): “British Migration to the Chesapeake Colonies in the Seventeenth Century,” in Colonial Chesapeake Society, ed. by P. D. M. Lois Green Carr and J. B. Russo, University of North Carolina Press.
Morgan, E. S. (1975): American Freedom, American Slavery: The Ordeal of Colonial Virginia, W. W. Norton, New York.
Morgan, E. S. (2005). American Freedom, American Slavery: The Ordeal of Colonial Virginia. New York and London: History Book Club by arrangement with WW Norton & Company, Inc (1646).
Nash, G. B. (1979): The Urban Crucible: Social Change, Political Consciousness, and the Origins of the American Revolution, Harvard University Press Cambridge, Mass.
Nikolova, E. (Forthcoming): “Destined for Democracy? Labour Markets and Political Change in Colonial British America,” British Journal of Political Science.
Officer, L. H. (2008): “What Were the UK Earnings and Prices Then?” MeasuringWorth. Com.
Price, J. M. (1995): Tobacco in Atlantic trade: The Chesapeake, London, and Glasgow, 1675-1775, Variorum (Brookfield, Vt.).
Purvis, T. L. (1999): Colonial America to 1763, Infobase Publishing.
Purvis, T. L. and R. Balkin (1995): Revolutionary America, 1763 to 1800, Facts on File.
Rabushka, A. (2010): Taxation in Colonial America, Princeton University Press.
Villaflor, G. C. and K. L. Sokoloff (1982): “Migration in Colonial America: Evidence from the Militia Muster Rolls,” Social Science History, 6, 539-570.
Ward, H. M. (1991): Colonial America, 1607-1763, London: Pearson College Division.
Wertenbaker, T. J. (1922): The Planters of Colonial Virginia, Princeton University Press.
26