download.lww.comdownload.lww.com/.../mpg/a/mpg_2014_03_20_guari… · web viewn= 130 children...
TRANSCRIPT

ESPGHAN/ESPID Guidelines for the Management of AGE in Children in Europe
RISK FACTORS FOR SEVERE AND/OR PERSISTENT DISEASE
Table 1.1. Is there a relationship between severe or persistent diarrhea and etiology?
Reference Studytype
Period of observation
QoS Country In/OutPatients
Population Randomization Intervention Comparison FU n/N ITT Outcomes measures
RCT n Effectmeasure
Effectsize(95% CI)
Comments
Shai S, 2013
Surveillance system
Between April 2009 and March 2011
+ Germany Inpatients N= 130 children younger than 17 years with very severe RV gastroenteritis (101 were verified)
— Survey on hospital discharge data
— — No No. of severe RV gastroenteritis (N° nosocomial)
— Number 17/101 RV infection can have a life-threatening course
Incidence of very severe RV diarrhea in childrenless than 5 years of age;
Incidence rates
1.2/100,000/year( 0.9–1.4/100,000)
Valentini D, 2013
Prospective cohort study
March 2010 to April 2011
+ Italy Inpatients N=232 between 1 month and 16 years of age admitted for AGE
— Collection of clinical data and stool samples
Coinfections vs Monoinfections
232/275 No Max. no of diarrhea stools/24 h (≥6)
— OR (95%CI) 8.79 (3.32;23.28) p <0.001
Coinfection with different pathogens is associated with a more severe course of symptoms
Duration of diarrhea (days) (≥5)
3.81 (1.47;9.86) p= 0.006
Duration of vomiting (days) (≥3)
7.11 (2.74;18.42) p<0.001
Fever (≥38°) 17.78 (2.32;136.17) p=0.006
Severe dehydration (%)
28.70 (3.04;270.6) p=0.003
Friesema IH, 2012
Case-control study
May 2008 to November 2009
+ The Netherlands
Inpatients N=144 (+63 controls) children 0 -15 yr (73% being<2 yr), admitted for severe AGE
— Collection of clinical data and stool samples
Diarrhea vs not diarrhea
143/144 No Pathogens isolated from children (0-1yr) hospitalized with gastroenteritis (N=51)
— Rates Virus: 50/51(98%) [RV 65%, Adeno 31%, NV 23%]; Bacteria 12/51 (23%) [Campylobacter 4%, EPEC 16%, EAEC 4%]; Parasites 0%
Importance of viral pathogens, especially RV, in hospitalizations of children with gastroenteritis.

ESPGHAN/ESPID Guidelines for the Management of AGE in Children in Europe
Pathogens isolated from children (1-2yr) hospitalized with gastroenteritis (N=23)
Rates Virus: 21/23(91%) [RV 70%, Adeno 13%, NV 10%]; Bacteria 7/23 (30%) [Salmonella 10%, EPEC 13%]; Parasites 10%
Pathogens isolated from children (2-4yr) hospitalized with gastroenteritis (N=16)
Rates Virus: 7/16 (44%) [RV 31%, Adeno 12%, NV 7%]; Bacteria 8/16 (50%) [Salmonella 31%]; Parasites 31%
Pathogens isolated from children (>4yr) hospitalized with gastroenteritis (N=6)
Rates Virus: 1/6 (17%) [RV 17%]; Bacteria 4/6 (67%) [Salmonella 50%]; Parasites 20%
Consumption of eggs
OR (95%CI) 4.25; (1.06–17.06) p<0.05
Consumption of fish
OR (95%CI) 0.08; (0.01–0.97) p<0.05
Oldak E, 2012
Prospective cohort study
July 2009 and June 2010
+ Poland Inpatients N=242 children <5yr of age admitted for AGE
— Collection of clinical data and stool samples
RV vs NV infections
242/242 Yes Isolation of pathogens
— Rates RV 51/242 (21.1%) vs NV 35/242 (14.5%)
NV are a relevant cause of acute, community acquired gastroenteritis in Polish children
Duration of diarrhea (≥6 days)
Rates RV 11/51 (21.6%) vs NV 4/35 (11.4%)p= 0.17
Severity score (severe)
Rates RV 22/51 (43%) vs NV 5/35 (14.3%) p<0.01
Ogilvie I, 2012
Scoping review — — Western Europe
Inpatients 76 studies from 16 countries on European children <5 yr of age with
— — Community acquired vs Nosocomial diarrhea
— — Patients with severe nosocomial RVGE in France, Italy, Spain and the UK
2 (n=3734; n=251)
Rates (%) 42.6% RV gastroenteritis is a common disease associated with significant morbidity and

ESPGHAN/ESPID Guidelines for the Management of AGE in Children in Europe
community-acquired and nosocomial diarrhea
costsacross Western Europe
Patients with severe nosocomial RVGE in Austria, Germany, and Switzerland
Rates (%) 24.4%, 30.2% and 40%
Severe dehydration in children with community-acquired vs nosocomial gastroenteritis
2 (Ireland n=663; Sweden n=984)
Rates (%) 80% vs 55% (Ireland) 10.8% vs 0.8% (Sweden)
Mortality due to nosocomial RVGE (< vs > 12mo)
1(n=10,990)
Incidence rates
0.74 per 100,000 vs 0.16 per 100,000
Lorrot M, 2011
Prospective cohort study
November 2001 to May 2004
+ France Inpatients N=457 children 0-15 yr of age admitted for severe AGE (Patients with chronic diarrhea >10 days were excluded)
— Collection of clinical data and stool samples
RV vs NV infections
457/457 Yes Isolation of pathogens (0-6mo) N=177
— Rates RV 77 (43.5%) NV 15 (8.5%) Bacteria 8 (4%)
NV are the second leading causative agent of gastroenteritis in hospitalized young children and such infections are less severe than those caused by RV
Isolation of pathogens (6-12mo) N=106
Rates RV 63 (59.4%) NV 10 (9.4%)Bacteria 2 (2%)
Isolation of pathogens (12-24mo) N=102
Rates RV 59 (57.8%) NV 8 (7.8%) Bacteria 4 (4%)
Isolation of pathogens (24-60mo) N=49
Rates RV 22 (44.9%) NV 3 (6.1%) Bacteria 6 (12%)
Isolation of pathogens (>60mo) N=23
Rates RV 4 (17.4%) NV 2 (8.7%) Bacteria 5 (20%)
Length of hospitalization (days) (RV vs NV)
Median ± SD 3.02 (1.54) 1.85 (1.03) p<0.001
Severity score (Vesikari) RV vs NV
Median ± SD 12.6 (2.92) 10.47 (2.83) p<0.001

ESPGHAN/ESPID Guidelines for the Management of AGE in Children in Europe
Intravenous rehydration (%) RV vs NV (N=261, mixed infections excluded)
Rates 172 (77.13%) 21 (55.26%) p=0.005
Mrukowicz JZ, 1999*
Retrospective cohort study
1994-96 + Poland Inpatients N=953 children hospitalized for AGE
— Hospital discharge data
RV vs not RV — — Severe clinical conditions (Vesikari score >11) in children with RV associated diarrhea
— Rates 94% (61.6% of cases younger than five years) p<0.001
RV is a leading aetiological agent of severe gastroenteritis in young children in Poland and that the burden of this infection is significant (1999)
Duration of hospitalization (days)
Median ± SD 9.5 d (+/-9.8 d)
*Ogilvie 2011 (systematic review) cited this study and concluded that data on the burden of RVGE in terms of mortality, morbidity and economic burden is limited for Central and Eastern Europe.Rimoldi SG, 2011
Prospective cohort study
January 2008 to October 2009
+ Italy Inpatients N=273 children, suffering from acute gastroenteritis, in the age range from 0 to 222 mo
— Clinical data and stool samples
Different viruses-associated diarrhea
— — Severe clinical conditions (Vesikari score) in children 1-18mo with diarrhea
— Median ± SD RV 2.9±2.8 vs NV 3.1±3.5 Boca 11.5±4.5 Adeno 0.2 (Adeno vs others p<0.001)
The severity of AdV-associated infection was lower than for NoV, HRV and HBoV.
Gimenez-Sanchez F, 2010
Prospective cohort study
January, February and March of 2006
+ Spain Inpatients N=1192 children <5yr of age
— Clinical data and stool samples
RV (n = 584) vs not RV (n = 503)
— — Severe clinical conditions (Merck scale) in children <5yr with diarrhea
— Median ± SD 14.2 (3.8) vs 11.0 (4.2) p<0.001
RV is the primary causal agent of AGE in children under the age of 2 years in Spain and that it produces a more severe manifestation
Severe clinical conditions (Merck scale) in children <5yr with diarrhea
Rates 30% vs 12% p<0.001
Severe dehydration (degree >6%)
Rates 51 (20.2%) 10 (11%) NS
Wiegering V, 2011
Retrospective cohort study
April 1, 2005 to May 31, 2008
+ Germany Inpatients 650 charts of children with AGE. 262 (43.8%)
— — Comparisons between all viral infections and
— — Duration of diarrhea (all viral vs Salmonella)
— Mean number ±SD
3.4±0.1 vs 6.1±0.4, p<0.001
Children with viral infection had significanlty

ESPGHAN/ESPID Guidelines for the Management of AGE in Children in Europe
had RV, 188 (31.4%) NV, 58 (9.7%) AV, 47(7.9%) Salmonella.
Salmonella infection
more respiratory associated symptoms and vomiting, but less episodes of diarrhea and total duration of diarrhea when compared to children with Salmonella infection.
Diarrhea events (all viral vs Salmonella)
mean number ±SD
3.8±0.1 vs 10.4±0.5, p<0.001
Vomiting events (all viral vs Samonella)
mean number ±SD
2.6±0.2 vs 1±0.4, p<0.001
Airway inflammation score (all viral vs Salmonella)
mean number ±SD
1.8±0.1 vs 0.6±0.3; p<0.001
Gastroenteritis score (all viral vs Samonella and RV vs AV and NV)
mean number ±SD
All viral 12.7±0.1 vs Salmonella 13.4±0.5, p=NS; RV 13.5± 0.2 vs AV and NV 11.9± 0.2 and 11.5±0.4 , p<0.001
Muhsen K, 2009
MA 1970s through 2009
++ Developing countries
Inpatients and Outpatients
N=17030 mostly <6yr of age (1 case-control study 0-14 yr; 1 case-control study all ages); 13 case-control studies and 2 cohort studies
— Detailed clinical history and laboratory investigations
Acute vs persistent diarrhea vs controls
— — Association between Giardia Lamblia and PD
4 case-control, 1 cohort study
OR (95%CI) 3.18 (1.50-6.76) p<0.0001
G. lamblia was not associated with acute diarrhea. However, limited data suggest that initialGiardia infections in early infancy may be positively associated with diarrhea. Meta-analysis of 5 persistent diarrhea studies showed a positive link with Giardia
Association between Giardia Lamblia and AD
OR (95%CI) 0.60 (0.38-0.94) p=0.03
Abba K, 2009
Systematic review
Search date: May 20, 2008 (none after 2000)
++ Developing countries
Inpatients and Outpatients
N=3832 children <6yr of age
— Sample stools
Persistent Diarrhea vs no diarrhea
— — RV Weighted mean percentage
PD 5% vs no diarrhea 3%
There is no evidence that any particular pathogen or type of pathogen is
Enteric Adenovirus
Weighted mean percentage
PD 5% vs no diarrhea 1%

ESPGHAN/ESPID Guidelines for the Management of AGE in Children in Europe
associated with persistent diarrhea in children under the age of six in low and middle income countries. There is therefore no evidence to justify routine antimicrobial use for children with persistent diarrhea of unknown cause, in keeping with current guidelines.
Campylobacter
Weighted mean percentage
PD 6% vs no diarrhea 8%
Shigella 7 (680 cases and 1021 controls)
Weighted mean percentage
PD 4% vs no diarrhea 2%
Salmonella 6 (510 cases and 857 controls)
Weighted mean percentage
PD 4% vs no diarrhea 0%
Vibrio Cholerae
3 (405 cases and 813 controls)
Weighted mean percentage
PD 0% vs no diarrhea 1%
EPEC 7 (550 cases and 604 controls)
Weighted mean percentage
PD 41% vs no diarrhea 30%
EHEC 2 (143cases and 143 controls)
Weighted mean percentage
PD 0% vs no diarrhea 0%
Giardia 8 (688cases and 1062 controls)
Weighted mean percentage
PD 10% vs no diarrhea 7%
Cryptosporidium
0
Entamoeba histolytica
5 (688 cases and 1063 controls)
Weighted mean percentage
PD 2% vs no diarrhea 3%
Ochoa TJ, 2009
Prospective cohort study
September-2006 and December-2007
+ Perù Outpatients
N=1034 children from 2 to 12 months of age
Controls were selected randomly*
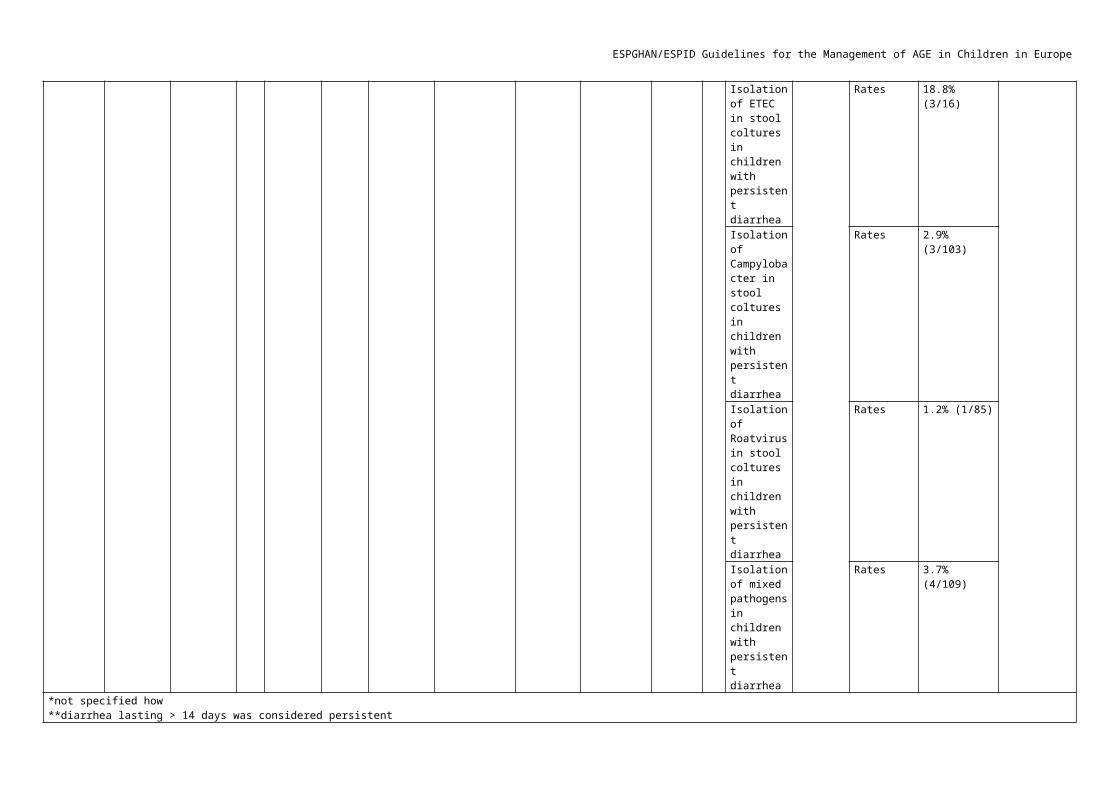
A field worker visited control children at home to collect stool samples. A field worker visited children with diarrhea at home at least once a
Diarrhea vs not diarrhea
992/1034
No Duration of diarrhea in accordance to age*
— Mean±SD 7.1 ± 6.1 (children < 6mo) vs 4.9 ± 3.8 (children ≥ 6mo)
Persistent diarrhea was more frequent in infants < 6mo of age. No specific bacterial species was associated with persistent diarrhea
Persistent diarrhea**
Rates 13.5% (children < 6mo) vs 3.6% (children ≥ 6mo)
Isolation of EAEC in stool coltures in children with persistent diarrhea
Rates 14.1% (12/85)

ESPGHAN/ESPID Guidelines for the Management of AGE in Children in Europe
week until the episode ended.
Isolation of EPEC in stool coltures in children with persistent diarrhea
Rates 7.9% (3/38)
Isolation of DAEC in stool coltures in children with persistent diarrhea
Rates 15% (3/20)
Isolation of ETEC in stool coltures in children with persistent diarrhea
Rates 18.8% (3/16)
Isolation of Campylobacter in stool coltures in children with persistent diarrhea
Rates 2.9% (3/103)
Isolation of Roatvirus in stool coltures in children with persistent diarrhea
Rates 1.2% (1/85)
Isolation of mixed pathogens in children with persistent diarrhea
Rates 3.7% (4/109)
*not specified how**diarrhea lasting > 14 days was considered persistentRivera FP, 2010
Prospective cohort study
26 months (September 2006-July 2008)
+ Perù Outpatients
N=1873 (1129 cases and 744 controls) children 2-24 months of age
— Collection of stool samples
Diarrhea vs not diarrhea
NO No Clinical and epidemiological characteristics of ETEC diarrhea
— Rates Isolated ETEC strains in cases (60/1129; 5.3%) and controls (32/744 ; 4.3%)
The duration of diarrhea caused by ETEC-LT strains tended to be longer (up to 24 days).Persistent
diarrhea* (single ETEC strain, N=38): 11%

ESPGHAN/ESPID Guidelines for the Management of AGE in Children in Europe
Persistent diarrhea (all ETEC isolates N=60): 8%
Presence of ST (heat-stable toxin) and LT (heat-labile toxin)
Rates Persistent diarrhea (ETEC-LT strain, N=31): 6%Persistent diarrhea (ETEC-ST isolates N=15): 0%*
*diarrhea lasting > 14 days was considered persistentMoore SR, 2010
Prospective cohort study
127 months (August 1989-March 2000)
++ Brazil Outpatients
N=414 children ≤ 5 years of age and newborns between August 1989 and March 2000
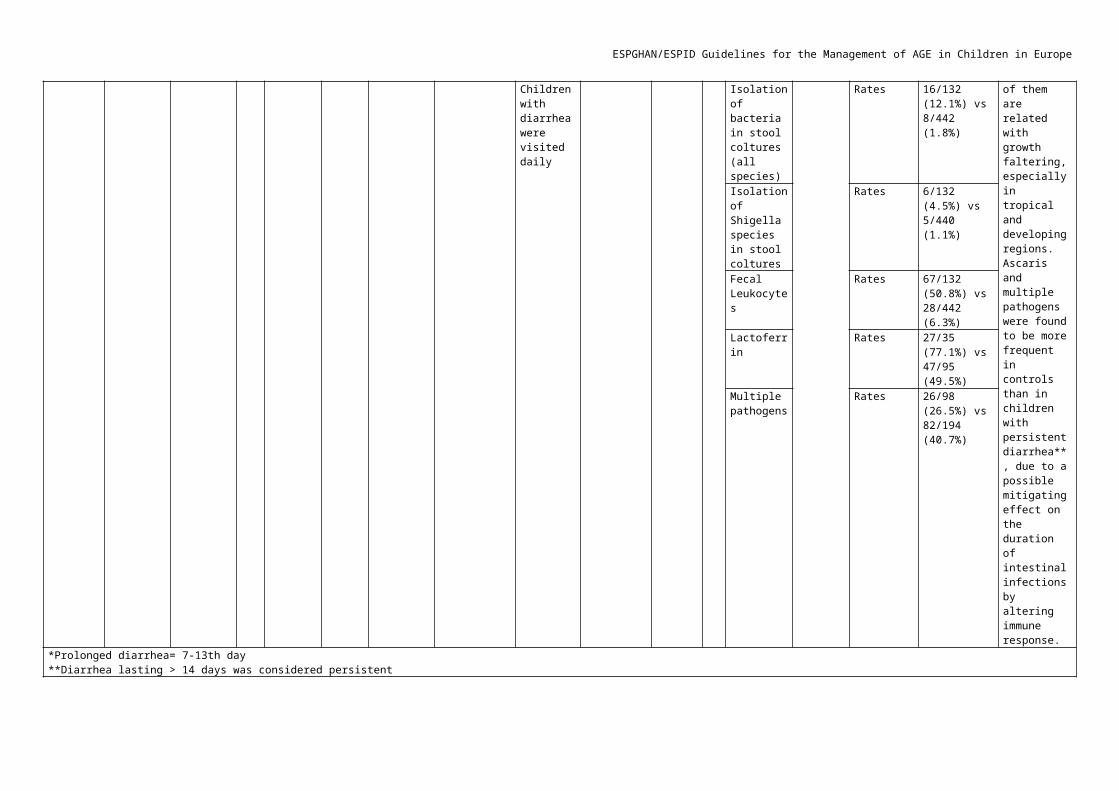
— Nurses visit home of each newborn child 3 times a week for the first 45 mo. Then twice a week. Children with diarrhea were visited daily
Diarrhea vs not diarrhea
414/414 Yes Isolation of Cryptosporidium species in stool coltures
— Rates 12/98 (12.2%) vs 15/289 (5.2%)
Shigella and Cryptosporidium are significantly associated with prolonged episodes* of diarrhea, and both of them are related with growth faltering, especially in tropical and developing regions. Ascaris and multiple pathogens were found to be more frequent in controls than in children with persistent diarrhea**, due to a possible mitigating effect on the duration of intestinal infections by altering immune response.
Isolation of Ascaris species in stool coltures
Rates 7/132 (5.3%) vs 61/442 (13.8%)
Isolation of bacteria in stool coltures (all species)
Rates 16/132 (12.1%) vs 8/442 (1.8%)
Isolation of Shigella species in stool coltures
Rates 6/132 (4.5%) vs 5/440 (1.1%)
Fecal Leukocytes
Rates 67/132 (50.8%) vs 28/442 (6.3%)
Lactoferrin Rates 27/35 (77.1%) vs 47/95 (49.5%)
Multiple pathogens
Rates 26/98 (26.5%) vs 82/194 (40.7%)
*Prolonged diarrhea= 7-13th day**Diarrhea lasting > 14 days was considered persistent

ESPGHAN/ESPID Guidelines for the Management of AGE in Children in Europe
Allison GM, 2011
Case-control study
— + Bangladesh
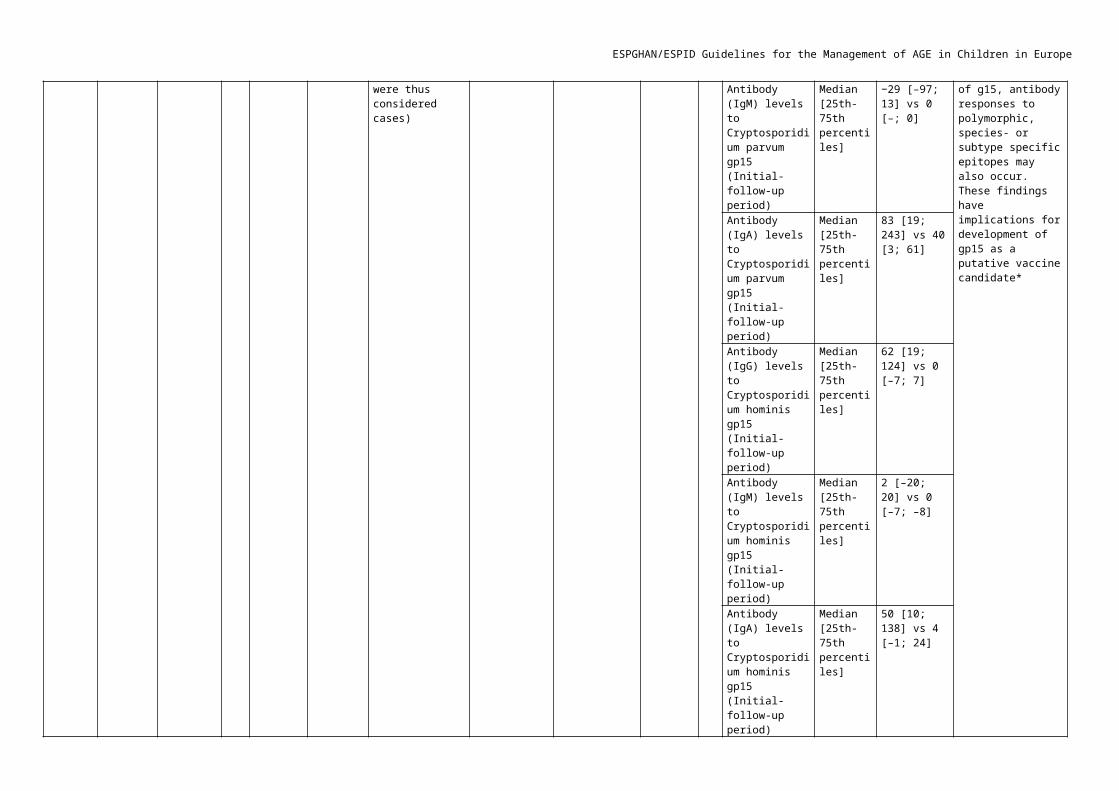
Inpatients N=92 children from 15 days to 60 mo of age with diarrhea (46 controls with negative stool coltures for Cryptosporidium; subsequently 7 controls were founf positive for PCR and were thus considered cases)
— Detailed clinical history and laboratory investigations
Positive for Cryptosp. vs Negative for Cryptosp.
50/92 (33 cases) - 3 weeks
No N° of persistent diarrhea* (Cases vs controls)
— Rates 37% (18/47) vs 0% (0/39)
In Bangladesh, wherecryptosporidiosis is endemic, it is associated with persistent diarrhea*. Although the dominant antibody response appears to be targeted to conserved peptide epitopes of g15, antibody responses to polymorphic, species- or subtype specific epitopes may also occur. These findings have implications for development of gp15 as a putative vaccine candidate
Antibody (IgG) levels to Cryptosporidium parvum gp15 (Initial-follow-up period)
Median [25th-75th percentiles]
68 [28; 110] vs 4 [0; 10]
Antibody (IgM) levels to Cryptosporidium parvum gp15 (Initial-follow-up period)
Median [25th-75th percentiles]
−29 [–97; 13] vs 0 [–; 0]
Antibody (IgA) levels to Cryptosporidium parvum gp15 (Initial-follow-up period)
Median [25th-75th percentiles]
83 [19; 243] vs 40 [3; 61]
Antibody (IgG) levels to Cryptosporidium hominis gp15 (Initial-follow-up period)
Median [25th-75th percentiles]
62 [19; 124] vs 0 [–7; 7]
Antibody (IgM) levels to Cryptosporidium hominis gp15 (Initial-follow-up period)
Median [25th-75th percentiles]
2 [–20; 20] vs 0 [–7; –8]

ESPGHAN/ESPID Guidelines for the Management of AGE in Children in Europe
Antibody (IgA) levels to Cryptosporidium hominis gp15 (Initial-follow-up period)
Median [25th-75th percentiles]
50 [10; 138] vs 4 [–1; 24]
*Diarrhea lasting > 14 days was considered persistent
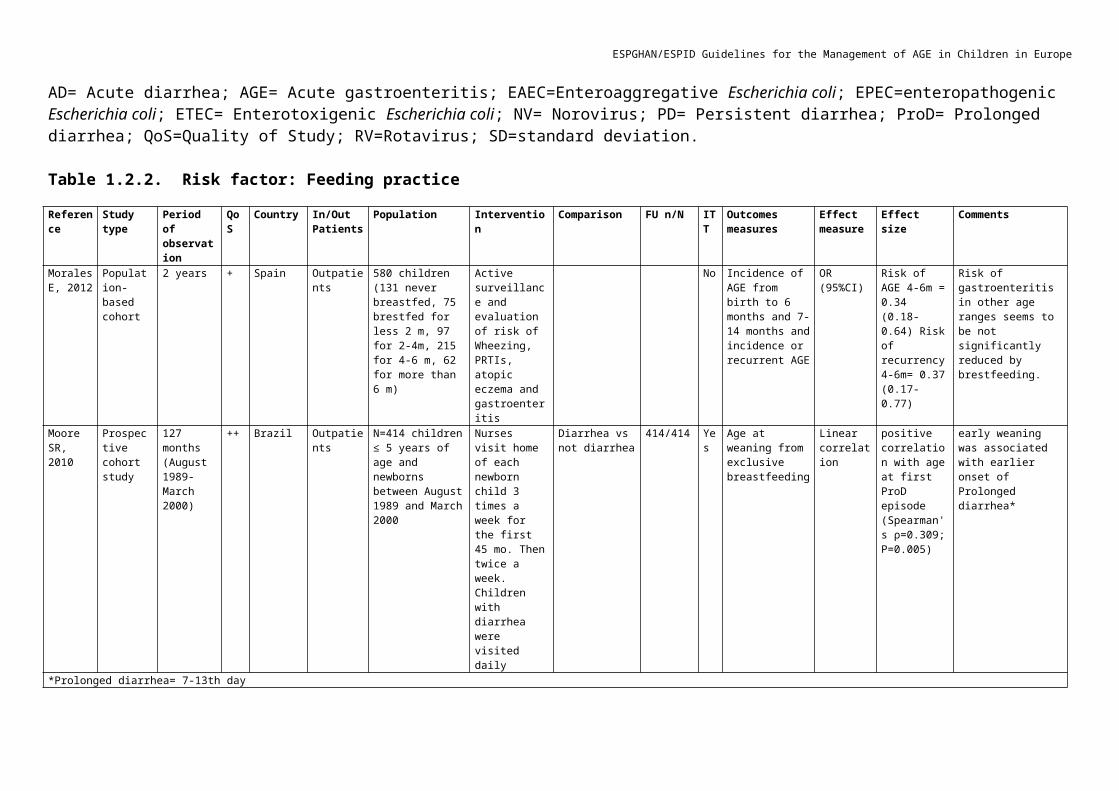
AGE= Acute gastroenteritis; AV= Adenovirus; DAEC= diffusely adherent Escherichia coli; EAEC=Enteroaggregative Escherichia coli; EPEC=enteropathogenic Escherichia coli; ETEC= Enterotoxigenic Escherichia coli; LT=heat-labile toxin; NV= Norovirus; OR=odd ratio; QoS=Quality of Study; RV=Rotavirus; RVGE= Rotavirus gastroenteritis; SD=standard deviation; ST= heat-stable toxin.
1.2. Is there a relationship between host-related factors and risk of severe or persistent diarrhea?
Table 1.2.1. Risk factor: younger age
Reference Study type Period of observation
QoS
Country In/Out Patients
Population Intervention Comparison FU n/N ITT Outcomes measures Effect measure
Effect size Comments
Friesema IH, 2012
Case-control study
May 2008 to November 2009
+ The Netherlands
Inpatients N=144 (+63 controls) children 0 -15 yr (73% being <2 yr), admitted for severe AGE
Collection of clinical data and stool samples
Diarrhea vs not diarrhea
143/144 No Pathogens isolated from children (0-1yr) hospitalized with gastroenteritis (N=51)
Rates Virus: 50/51(98%) [RV 65%, Adeno 31%, NV 23%]; Bacteria 12/51 (23%) [Campylobacter 4%, EPEC 16%, EAEC 4%]; Parasites 0%
Importance of viral pathogens, especially RV, in hospitalizated children with gastroenteritis
Pathogens isolated from children (1-2yr) hospitalized with gastroenteritis (N=23)
Rates Virus: 21/23(91%) [RV 70%, Adeno 13%, NV 10%]; Bacteria 7/23 (30%) [Salmonella 10%, EPEC 13%]; Parasites 10%
Pathogens isolated from children (2-4yr) hospitalized with gastroenteritis (N=16)
Rates Virus: 7/16 (44%) [RV 31%, Adeno 12%, NV 7%]; Bacteria 8/16 (50%) [Salmonella 31%]; Parasites 31%
ESPGHAN/ESPID Guidelines for the Management of AGE in Children in Europe
Pathogens isolated from children (>4yr) hospitalized with gastroenteritis (N=6)
Rates Virus: 1/6 (17%) [RV 17%]; Bacteria 4/6 (67%) [Salmonella 50%]; Parasites 20%
Lorrot M, 2011 Prospective cohort study
November 2001 to May 2004
+ France Inpatients N=457 children 0-15 yr of age admitted for severe AGE (Patients with chronic diarrhea >10 days were excluded)
Collection of clinical data and stool samples
Comparing children basing on clinical conditions and age
457/457 Yes Isolation of pathogens (0-6mo) N=177
Rates RV 77 (43.5%) NV 15 (8.5%) Bacteria 8 (4%)
Main role of RV in hospitalized gastroenteritis among Frenchchildren less than 2 years of age
Isolation of pathogens (6-12mo) N=106
Rates RV 63 (59.4%) NV 10 (9.4%)Bacteria 2 (2%)
Isolation of pathogens (12-24mo) N=102
Rates RV 59 (57.8%) NV 8 (7.8%) Bacteria 4 (4%)
Isolation of pathogens (24-60mo) N=49
Rates RV 22 (44.9%) NV 3 (6.1%) Bacteria 6 (12%)
Isolation of pathogens (>60mo) N=23
Rates RV 4 (17.4%) NV 2 (8.7%) Bacteria 5 (20%)
Lenght of hospitalization (days) in children 0-6 mo (RV vs NV)
Median ± SD
RV 3.26 (±1.84) NV 2.17 (±1.06) p=0.0293
Lenght of hospitalization (days) in children 6-24 mo (RV vs NV)
Median ± SD
RV 2.90 (±1.39) NV 1.78 (±1.06) p=0.0013
Lenght of hospitalization (days) in children >24mo (RV vs NV)
Median ± SD
RV 2.85 (±1.26) NV 1.2 (±0.45) p=0.0078 3.02
Lenght of hospitalization (days) (RV vs NV)
Median ± SD
3.02 (1.54) 1.85 (1.03) p<0.001
Severity score (Vesikari) in children 0-6 mo (RV vs NV)
Median ± SD
NS
Severity score (Vesikari) in children 6-24 mo (RV vs NV)
Median ± SD
13.48 (±2.54) 11.39 (±3.05) p<0.002
Severity score (Vesikari) in children 24 mo (RV vs NV)
Median ± SD
12.88 (±2.94) 8.8 (±2.28) p=0.007
Intravenous rehydration (%) in children 0-6mo; RV vs NV (N=261, mixed infections excluded)
Rates NS

ESPGHAN/ESPID Guidelines for the Management of AGE in Children in Europe
Intravenous rehydration (%) in children 6-24mo; RV vs NV (N=261, mixed infections excluded)
Rates 107 (87.7%) 12 (66.67%) p=0.031
Intravenous rehydration (%) RV vs NV (N=261, mixed infections excluded)
Rates NS
Moore SR, 2010
Prospective cohort study
127 months (August 1989-March 2000)
++ Brazil Outpatients
N=414 children ≤ 5 years of age and newborns between August 1989 and March 2000
Nurses visit home of each newborn child 3 times a week for the first 45 mo. Then twice a week. Children with diarrhea were visited daily
Diarrhea vs not diarrhea
414/414 Yes Age-specific attack rates
Rates Total, AD, and PD all peaked at 6-12 months of age (5.15, 4.22, and 0.68 episodes per child-year, respectively).
Infants with Prolonged diarrhea have a higher risk of developing PD in later childhood. *
Children with PD who experienced also ProD episode; children in the first year of life
Rates 57/71 (80.3%); 30/57 (52.6%)
Risk to develop PD in children who experienced ProD in their first year of life
OR 2.2, 95% CI; [1.32-3.54], P=0.002
*Prolonged diarrhea= 7-13th day, diarrhea lasting > 14 days was considered persistentPathela P, 2006 Prospective
cohort study
1993-1996 + Bangladesh Outpatients
N= 252 children < 5yr of age
Door-to-door censusconducted by community health workers
Age groups 244/252 YES
Risk to develop PD (n° episodes per child year) in children 0-5 mo
Incidence Rates
0.4 (45); p < 0.001
Significant differences between 0 /5-month age groups and all other age groups
Risk to develop PD in children 18-23 mo
OR (95%CI) 0.59 (0.48 /0.73); p<0.001
When adjustment for othercovariates was done, the relative odds of diarrhea in the older age groups were lower compared to the youngest age group.
Pereira AL, 2007
Case-control study
Not specified
+ Brasil Inpatients N=261 (134 cases and 127 controls) ≤ 5 years of age; controls were defined as children who did not present with diarrhea in the 4 weeks before sample collection
Collection of stool samples
Acute vs persistent diarrhea vs controls
— YES
Detection of EAEC virulance markers in fecal samples
Rates CVD432+ : Acute (11.1%) Persistent (23.9%%) Controls (9.7%) in children < 12 mo of age vs Acute (6.7%) Persistent (20.9%) Controls (12.7%) in children > 12 mo of age
The age-stratified analyses showed that different CVD432-related genotypes were associated with persistent diarrhea in the 2 groups studied. CVD432+ strains were associated with persistent diarrhea in children <12 months of age, whereas,
ESPGHAN/ESPID Guidelines for the Management of AGE in Children in Europe
inchildren >12 months of age, the genotype associated with protracteddiarrhea was CVD432+EAST1+
Detection of EAEC specific genotypes in fecal samples
Rates CVD432+ : Acute (6.8%) Persistent (15.2%%) Controls (3.8%) in children < 12 mo of age vs Acute (3.8%) Persistent (9.3%) Controls (8.1%) in children > 12 mo of age
Rates EAST1+ : diarrhea (13%) and controls (4%) in children 6-12 mo of age vs diarrhea (8.2%) and controls (4.2%) in children < 6 mo of age
Mukhopadhyay C, 2007
Case-control study
71 months (April 1998-March 2004)
+ Nepal Inpatients N=508 < 5 years of age (253 children with persistent diarrhea, 155 with acute diarrhea and 100 controls)
Collection of stool samples
Persistent diarrhea vs acute diarrhea vs controls*
— NO Rates of intestinal protozoal infections in age groups (6-11; 12-23; 24-35; 36-60)
Rates 13.8%, 19.3%, 25.2%, and 33.2%
In each age group, the rate of infection was significantly higher than the previous age group.
*diarrhea lasting > 14 days was considered persistentMoyo SJ, 2007 Prospective
cross-sectional study
December 2005 to February 2006.
+ Tanzania Inpatients N=218 children <5yr of age, admitted for acute/persistent diarrhea
Detailed clinical history and laboratory investigations
Age groups — YES
Detection of EAEC strains in children with acute/persistent diarrhea
Rates EAEC: 0-6mo 27.5%; 7-12mo 15.6%; 13-24 6%; 25-60mo 7.4%
EAEC and EPEC were significantly more prevalent among the age group 0–6 months
Detection of EPEC strains in children with acute/persistent diarrhea
Rates EPEC: 0-6mo 13.7%; 7-12mo 3%; 13-24 3%; 25-60mo 0%
Ochoa TJ, 2009 Prospective cohort study
September-2006 to December-2007
+ Perù Outpatients
N=1034 children from 2 to 12 months of age
A field worker visited control children at home to collect stool samples. A field worker visited children with diarrhea at
Diarrhea vs not diarrhea
992/1034 NO Duration of diarrhea in accordance to age
Mean±SD 7.1 ± 6.1 (children < 6mo) vs 4.9 ± 3.8 (children ≥ 6mo); p< 0.0001
Persistent diarrhea was more frequent in infants < 6mo of age.**
Persistent diarrhea Rates 13.5% (children < 6mo) vs 3.6% (children ≥ 6mo); p< 0.0001

ESPGHAN/ESPID Guidelines for the Management of AGE in Children in Europe
home at least once a week until the episode ended.
Passive surveillance diarrhea incidence, episodes/child/year
Incidence Rates
1.26 (children < 6 mo) vs 0.85 (children ≥ 6mo); p=0.0018
Isolation of RV in children with persistent diarrhea <6mo and ≥ 6mo of age
Rates 24/434 (5.9%) vs 137/530 (28.1%)
*not specified how**diarrhea lasting > 14 days was considered persistentRivera FP, 2010 Prospective
cohort study
26 months (September 2006-July 2008)
+ Perù Outpatients
N=1873 (1129 cases and 744 controls) children 2-24 months of age
Collection of stool samples
Diarrhea vs not diarrhea
— NO Clinical and epidemiological characteristics of ETEC diarrhea
Rates Isolated ETEC strains in cases (3.4%) and controls 1.2%) < 12 mo of age vs cases (14.5%) and controls (8.4%) > 12 mo of age
The incidence of ETEC diarrhea in our sample was significantly more frequent in children > 12 months of age than in younger children*
*diarrhea lasting > 14 days was considered persistent
Umamaheswari B, 2010
Case-control study
17 mo, November 2000-April 2002
+ India Inpatients N=120 children from 1 mo. to 10 yr. of age with persistent* or acute diarrhea
Detailed clinical history and laboratory investigations
Persistent vs acute diarrhea
55/120 - 3 months
YES
Children with PD and AD < 1yr
Rates PD 30/60(50%) vs AD 37/60 (61.7%)
Persistent diarrhea was more frequent in infants <5yr of age*Children with PD
and AD 1-5yrRates PD 29/60(48.4%)
vs AD 22/60 (36.7%)
Children with PD and AD >5yr
Rates PD 1/60(1.6%) vs AD 1/60 (1.6%)
Children with PD who died (all <5yr of age)
Rates 5/60 (8.3%)
*diarrhea lasting > 14 days was considered persistentSutra S, 2012 Cross-
sectional study
2011 + Thailand Inpatients Children < 5yr of age
The authors investigated the number of OPD visits (756,552; 1:5 ), IPD (124,403 admissions; 1:30)
— — Yes Persistent diarrhea N° of episodes and rates
202 episodes (1.6 per 1,000 admissions)
age, sepsis, anemia, chronic diseases, malnutrition and HIV are related to persistent diarrhea
Risk factors related to PD
Multivariate analysis
age, sepsis, anemia, chronic diseases, malnutrition and HIV.
Strand TA, 2012
Prospective cohort study
June 1998 to September
+ Nepal Outpatients
N=335 children 6-35 mo of age
Study physicians undertook the
— 334/335 — Risk of persistent diarrhea in children 6-11 mo of age
OR (95%CI) 17.0 (3.5, 83.1) The odds of prolonged illness was 9.3-fold higher if a child was not

ESPGHAN/ESPID Guidelines for the Management of AGE in Children in Europe
2000 initial interview and clinical examination, while trained field workers visited the homes for follow-up every fifth day until recovery
breastfed, this effect was not modified by age. This is an argument for recommending breastfeeding, also beyond infancy in populations where childhood diarrhea is common.
Risk of persistent diarrhea in not breast fed children
OR (95%CI) 9.3 (2.4, 35.7)
AD= Acute diarrhea; AGE= Acute gastroenteritis; EAEC=Enteroaggregative Escherichia coli; EPEC=enteropathogenic Escherichia coli; ETEC= Enterotoxigenic Escherichia coli; NV= Norovirus; PD= Persistent diarrhea; ProD= Prolonged diarrhea; QoS=Quality of Study; RV=Rotavirus; SD=standard deviation.
Table 1.2.2. Risk factor: Feeding practice
Reference Study type Period of observation
QoS
Country In/Out Patients
Population Intervention Comparison FU n/N ITT Outcomes measures
Effect measure
Effect size Comments
Morales E, 2012
Population-based cohort
2 years + Spain Outpatients
580 children (131 never breastfed, 75 brestfed for less 2 m, 97 for 2-4m, 215 for 4-6 m, 62 for more than 6 m)
Active surveillance and evaluation of risk of Wheezing, PRTIs, atopic eczema and gastroenteritis
No Incidence of AGE from birth to 6 months and 7-14 months and incidence or recurrent AGE
OR (95%CI) Risk of AGE 4-6m = 0.34 (0.18-0.64) Risk of recurrency 4-6m= 0.37 (0.17-0.77)
Risk of gastroenteritis in other age ranges seems to be not significantly reduced by brestfeeding.
Moore SR, 2010
Prospective cohort study
127 months (August 1989-March 2000)
++ Brazil Outpatients
N=414 children ≤ 5 years of age and newborns between August 1989 and March 2000
Nurses visit home of each newborn child 3 times a week for the first 45 mo. Then twice a week. Children with diarrhea were visited daily
Diarrhea vs not diarrhea
414/414 Yes
Age at weaning from exclusive breastfeeding
Linear correlation
positive correlation with age at first ProD episode (Spearman's ρ=0.309; P=0.005)
early weaning was associated with earlier onset of Prolonged diarrhea*
*Prolonged diarrhea= 7-13th dayMorrow AL, 2005
Prospective cohort study
1988–1991 + US Outpatients
N=93 children up to 2yr of age and their mothers
Mother–infant pairs were followed from birth up to 2 y postpartum with weekly collection of
Groups (low, intermediate, high) of specific and total 1,2-linked milk oligosaccharides (mmol/L)
93/93 Yes
Consumption of high levels of 2 -FL as a percentage of milk oligosaccharide (protection against Campylobacter)
Poisson regression
p= 0.004 Breast-feeding conveys natural anti-infective compounds tothe child and is the most effective intervention currentlyknown for preventing morbidity

ESPGHAN/ESPID Guidelines for the Management of AGE in Children in Europe
infant stool and infant feedingand illness data
and mortality, caused byinfectious disease in young children
Consumption of high levels of LDFH-I as a percentage of milk oligosaccharide (protection against Calicivirus)
Poisson regression
p= 0.012
Consumption of high levels of total 2-linked oligosaccharide as a percentage of milk oligosaccharide (protection against severe diarrhea)
Poisson regression
p<0.0001
Content of 2-linked oligosaccharides in children whocontracted ST-associated diarrhea while breast-feeding
Means±SD Children with diarrhea and ST-coli infection: 3.9 ± 0.7 SE (n = 4); children without diarrhea infected by ST-coli (7.6 ± 1.0, n= 43); uninfected controls (7.5 ± 1.0,n = 46) (P <0.01)
Manger MS, 2011
Prospective cohort study
February 1998-September 2000
+ India Outpatients
N=2296 children 6-30 mo of age
Detailed clinical history and laboratory investigations
— 2296/2296 Yes
Risk for PD in breast-fed children
OR (95%CI) 0.56 (0.37, 0.83) p= 0.004
Breast feeding is protective against PD
Allison GM, 2011
Case-control study
— + Bangladesh
Inpatients N=92 children from 15 days to 60 mo of age with diarrhea (46 controls with negative stool coltures for Cryptosporidium; subsequently 7 controls were found positive for PCR and were thus considered cases)
Detailed clinical history and laboratory investigations
Positive for Cryptosp. vs Negative for Cryptosp.
50/92 (33 cases) - 3 weeks
No N° of persistent diarrhea* (Cases vs controls)
Rates 37% (18/47) vs 0% (0/39)
In Bangladesh, wherecryptosporidiosis is endemic, it is associated with persistent diarrhea. Although the dominant antibody response appears to be targeted to conserved peptide epitopes of g15, antibody responses to polymorphic, species- or subtype specific epitopes may also occur. These findings
Antibody (IgG) levels to Cryptosporidium parvum gp15 (Initial-follow-up period)
Median [25th-75th percentiles]
68 [28; 110] vs 4 [0; 10]
Antibody (IgM) levels to Cryptosporidium parvum gp15 (Initial-follow-up period)
Median [25th-75th percentiles]
−29 [–97; 13] vs 0 [–; 0]

ESPGHAN/ESPID Guidelines for the Management of AGE in Children in Europe
have implications for development of gp15 as a putative vaccine candidate*
Antibody (IgA) levels to Cryptosporidium parvum gp15 (Initial-follow-up period)
Median [25th-75th percentiles]
83 [19; 243] vs 40 [3; 61]
Antibody (IgG) levels to Cryptosporidium hominis gp15 (Initial-follow-up period)
Median [25th-75th percentiles]
62 [19; 124] vs 0 [–7; 7]
Antibody (IgM) levels to Cryptosporidium hominis gp15 (Initial-follow-up period)
Median [25th-75th percentiles]
2 [–20; 20] vs 0 [–7; –8]
Antibody (IgA) levels to Cryptosporidium hominis gp15 (Initial-follow-up period)
Median [25th-75th percentiles]
50 [10; 138] vs 4 [–1; 24]
*diarrhea lasting > 14 days was considered persistent
AGE= acute gastroenteritis; PD= Persistent diarrhea; ProD= Prolonged diarrhea; QoS=Quality of Study.

ESPGHAN/ESPID Guidelines for the Management of AGE in Children in Europe
Table 1.2.3. Chronic diseases and Immune deficits
Reference Study type Period of observation
QoS Country In/Out Patients
Population Intervention Comparison FU n/N
ITT Outcomes measures
RCT n Effect measure
Effect size Comments
Sugata K, 2012
Prospective cohort study
Between September 2004 and February 2007
+/- Japan Inpatients N= 62 pediatric recipients at the time of HSCT, weekly for 3 or 4 months posttransplant
Collection of recorded clinical data and serum samples
HSCT recipients vs immunocompetent RV gastroenteritis patients
— No Levels of RV antigenemia
— mean number ±SD
0.22 ± 0.19 vs 0.49 ± 0.18, P = 0.0011
Although the duration of antigenemia was clearly longer in HSCT patients than in immunocompetent RV gastroenteritis patients, the levels of viral antigen were not as high.
HLA mismatch vs matched
HLA matching OR (95%CI) 9.44 (1.09–82.11) p=0.024
Pascarella F, 2009
Retrospective, single-center, observational,case-control study
between January 2005 andDecember 2007
+/- Italy Inpatients N= 193 patients aged 18 months to 18 years (81 affected by IBD or with an history of diarrhea and abdominal pain and 112 controls) who were admitted
Collection of recorded clinical data and stool samples
IBD vs no IBD — No Positive C difficile stool test results, n (%)
— Rates 20 (24.7) vs 10 (8.9) p=0.004
The present study has demonstrated a higher prevalence of C difficile infection in a pediatric population with IBD compared withone without IBD.
Nylund CM, 2011
Retrospective cohort study
Years 1997, 2000, 2003, and 2006
+ US Inpatients N= 10474454 children hospitalized (0.2% cases of clostridium infection)
Collection of hospital discharge data from national database
Comorbidity vs no comorbidity
— No Inflammatorybowel disease
— OR (95%CI) 11.42 (10.16-12.83)
Clostridium difficile is emerging as a major agent of severe diarrhea in children with chronic conditions
Solid organ transplant
4.53 (3.92-5.24)
HIV infection 1.36 (1.04-1.79)
Hematopoietic stem celltransplantation
3.31 (2.87-3.82)
Neoplastic disease 3.10 (2.89-3.31)
Fungal infection 2.71 (2.39-3.07)
Cystic fibrosis 2.65 (2.22-3.17)
Pancreatitis 2.86 (2.41-3.39)
Hematologic disorders
2.50 (2.34-2.66)
Gastrostomy 2.00 (1.67-2.39)
Liver disease 2.04 (1.80-2.32)

ESPGHAN/ESPID Guidelines for the Management of AGE in Children in Europe
Malnutrition 2.39 (2.14-2.67)
Renal disease 2.09 (1.99-2.19)Systemic lupus
erythematosus 2.06 (1.58-2.68)
Bandin F, 2009
Retrospective case series study
January 2006 to December 2008
- France Inpatients N=199 children who received renal transplantation
Collection of recorded clinical data and stool samples
(1) infectious diarrhea , (2)secondary to immunosuppressant treatment (3) unclassified diarrhea.
— No Etiologic group of reported diarrheal episodes (N=64)
— Rates Infectious 38/64 (59%), Immuno 14/64 (22%), Not classified 12/64 (19%)
Need to have a high index of suspicion for cryptosporidiosis in pediatric renal transplant patients who present with diarrhea. The routine stool evaluations for parasites may not identify Cryptosporidium.
Cryptosporidium in infectious diarrheal episodes
Rates 7/38 (18%)
Henke-Gendo C, 2009
Retrospective cohort study
1 January 2005 to 30June 2008
+ Germany Inpatients N=75 patients of all ages receiving high-level immunosuppressive drug therapy withcalcineurin inhibitors
Collection of recorded clinical data and stool samples
Comparing levels of NV excretions
— Yes Immunosoppression as a risk factor
— OR (95%CI) 9.19 (2.86–29.47) p<0.0001
Highly immunosuppressed patients as well as young children fail to eliminate NV infection and shed the virus at high loads for a long period of time.
Transplant recipient as a risk factor
OR (95%CI) 7.49 (2.06–28.32) p<0.001
Age < 3yr as a risk factor
OR (95%CI) 4.36 (1.23–15.85) p<0.008
Bok K, 2012 Review 2012 + High and low income countries
Inpatients Immunocompromised patients (all ages) with persistent diarrhea
— — — — — — — — NVs are increasingly recognized as an important cause of chronic gastroenteritis in immunocompromised patients, as reflected by the growing number of clinical case reports
Kaiser P, 2012
Retrospective study
1 October 2002 to 31 May 2008
++ Germany Inpatients 6884 children < 5 years, 4880 RV positive and 2118 RV negative.
— — — — Underlying Cardiac disease(RV pos vs RV neg)
— Number (%) 32 (1.5%) vs 89 (3.2%), p<0.001
The higher proportion of cardiac patients in the RV− group is due to multiple Clostridium infections in the cardiac wards in Giessen, where 56 of the 62 Clostridium infections (partially mixed infections) in the entire study group were observed (90.3%)
Underlying Neurologic disease (RV pos vs RV neg)
Number (%) 37 (1.7%) vs 79 (2.9%), p=0.013
Underlying Metabolic disease (RV pos vs RV neg)
Number (%) 21 (1%) vs 46 (1.7%), p=0.47

ESPGHAN/ESPID Guidelines for the Management of AGE in Children in Europe
Bhutta ZA, 2008
Systematic review
+ Low-income countries
Inpatients and Outpatients
Hospitalized and not hospitalized children ≤ 5 years of age with diarrhea (Perù, Brasil, USA, Bangladesh, Haiti, England)
— — — — Increase of risf for malnutrition at 24mo of age with each diarrheal episode
Black, Lancet 2008 (cross-sectional study in 3 World region - Asia, Africa and Latin America)
OR (95%CI) 4% with each diarrheal episode OR 1.04 (1.0–1.08; p < 0.03)
It is not possible to determine the population-attributable fractionof stunting and undernutrition that may be related to PD
— Lebenthal, New York Raven Press; 1984
Prolonged small intestinal mucosa injuries has been named as a central mechanism in the pathophysiology of PD, but we must discriminatebetween persisting infective colonization with enteropathyand a postinfective enteropathy that fails to heal or heals slowly
Mor SM, 2009
Prospective cohort study
from November 2002 through May 2003
+ Uganda Inpatients N=243 children ≤ yr of age with Persistent diarrhea
Collection of recorded clinical data and stool samples
Microsporidiosis in children with and without concurrent cryptosporidiosis and HIV
224/243
No Microsporidiosis in children with concurrent cryptosporidiosis
— OR (95%CI) 78.3 (30.8–199.1) p < 0.0001
microsporidian fungus Enterocytozoonbieneusi is associated with lower rates of weight gainin children in Uganda with persistent diarrhea. This relationshipremained after controlling for HIV and concurrent cryptosporidiosis.
Microsporidiosis in children with concurrent HIV
OR (95%CI) 41.8 (18.3–95.4) p<0.001
Microsporidiosis in children with concurrent HIV and cryptosporidiosis
OR (95%CI) 153.0 (43.1–543.5) p<0.001
Microsporidiosis in wasted children
OR (95%CI) 2.1 (1.2–3.7) p= 0.013
Microsporidiosis in underweight children
OR (95%CI) 1.2 (0.7–2.2)p= 0.525
Microsporidiosis in stunted children
OR (95%CI) 1.2 (0.7–2.2)p= 0.508

ESPGHAN/ESPID Guidelines for the Management of AGE in Children in Europe
Idris NS, 2010 Prospective cross-sectional study
April 2008 to February 2009
+ Indonesia Inpatients N=42 children aged 6mo.-18 yrs , with persistent and/or recurrent diarrhea and had at least one of the following conditions: HIV infection, malignancy, severe malnutrition, on immunosuppressive therapy for a minimum of four weeks, or primary immunodeficiency.
Collection of recorded clinical data and stool samples
Comparing rates of intestinal parasites infections between groups
38/42 Yes Immunocompromised state and presence of parasites infection
— Rates HIV 16/42 (42%); Malignancy 4/42 (9%); Severe malnutrition (NO HIV) 3/42 (7%); Immunosuppressive therapy 1/42 (2%)
The prevalence of intestinal parasitic infection among immunocompromised children with persistent and/or recurrent diarrhea was moderately high. The main groups affected were toddlers and preschoolers as well as those children infected with HIV who were not on antiretroviral therapy or with low CD4 counts.
Umamaheswari B, 2010
Case-control study
17 mo, November 2000-April 2002
+ India Inpatients N=120 children from 1 mo. to 10 yr. of age with persistent or acute diarrhea
Detailed clinical history and laboratory investigations
Persistent vs acute diarrhea
55/120 - 3 months
YES Children with PD and prior antibiotic use
— Rates 43/60 (72.2%) Protein energy malnutrition, vitamin A deficiency and prior antibiotic use were the risk factors for PD.*
OR (95%CI) 5.28 (2.01–13.74) p = 0.0003
Children with PD and steroid use
Rates 8/60 (13.3%)OR (95%CI) 4.46 (0.82-
31.9) p = 0.048Children with PD and anemia
Rates 48/60 (80%)OR (95%CI) 3.74 (1.55-
9.15) p = 0.002Children with PD and vitamin A deficiency
Rates 24/60 (40%)OR (95%CI) 4.28 (1.29–
14.09) p = 0.012
Children with PD and Z-score WFH <-2
Rates 35/60 (58.3%)OR (95%CI) 1.66 (1.0–2.77)
p = 0.04
*diarrhea lasting > 14 days was considered persistentAl Jarousha AM, 2011
Case-control study
February 2006-January 2007
+ Palestine Inpatients N= 465 children aged up to 12 yrs (165 controls)
Detailed clinical history and laboratory investigations
Diarrhea vs not diarrhea
— Yes Risk for PD in malnourished children
OR (95%CI) 8.57 (3.98–18.44)p <0.001
Malnutrition is a risk factor for PD

ESPGHAN/ESPID Guidelines for the Management of AGE in Children in Europe
Das SK, 2012 Case-control study
1991-2010 ++ Bangladesh
Inpatients N= 3776 children < 5yr of age with PD (944) and AD (2832)
Detailed clinical history and laboratory investigations
Persistent vs acute diarrhea
— Yes Children with PD who had wasting syndrome
— OR (95%CI) (36/294) OR 1.62 (1.18, 2.21) p<0.01
Malnutrition remains a risk factor for PD
Sutra S, 2012 Cross-sectional study
2011 + Thailand Inpatients Children < 5yr of age
The authors investigated the number of OPD visits (756,552; 1:5 ), IPD (124,403 admissions; 1:30)
— — Yes Persistent diarrhea — N° of episodes and rates
202 episodes (1.6 per 1,000 admissions)
age, sepsis, anemia, chronic diseases, malnutrition and HIV are related to persistent diarrhea
Risk factors related to PD
Multivariate analysis
age, sepsis, anemia, chronic diseases, malnutrition and HIV.
Manger MS, 2011
Prospective cohort study
February 1998-September 2000
+ India Outpatients
N=2296 children 6-30 mo of age
Detailed clinical history and laboratory investigations
— 2296/2296
Yes Risk for PD in children with folate plasma concentrations < 25th percentile
— OR (95%CI) 1.77 (1.14, 2.75) p = 0.01
Poor folate status was an independentpredictor of persistent diarrhea in this population
HSCT=haemopoietic stem cell transplantation; IBD=Inflammatory bowel disease; NV= Norovirus; PD=Persistent diarrhea; QoS=Quality of Study; RV=Rotavirus.

ESPGHAN/ESPID Guidelines for the Management of AGE in Children in Europe
Table 1.3. Is there a relationship between the child’s clinical conditions and risk of severe or persistent diarrhea?
Reference Study type Period of observation
QoS Country In/OutPatients
Population Randomization Intervention Comparison FU n/N ITT Outcomes measures
Effect measure
Effect size (95% CI)
Comments
Verrotti A, 2009
Systematic Review
1993-2007 + Japan, UK, Taiwan
Inpatients N=368 children <5 yr of age with mild RV gastroenteritis
_ _ _ _ _ Incidence of afebrile seizuresfollowing RV gastroenteritis
Rates (%) 2.1–6.4% Benign afebrile seizures, not related to severe dehydration or electrolyte imbalance, have been associated with RV gastroenteritis
Chan CM, 2011
Retrospective study
+ Hong-Kong
Inpatients N=405 children between 1mo. and 6yr of age with acute gastroenteritis (232 with RV infection and 173 with NV infection)
_ _ RV vs NV infection
_ _ Maximun body temperature (RV vs NV)
Mean ± SD 38.56 ± 1.01 vs 37.65 ± 0.78; p<0.001
Children with RV infection had higher temperature and more diarrhea episodes, while more blood-stained stools and afebrile seizures were noted in the NV group
Presence of diarrhea
Rates (%) 96% vs 84%; p<0.001
Presence of bloody diarrhea
Rates (%) 1% vs 5%;p=0.035
C-reactive protein mg/L
Mean ± SD 11.04 ± 18.18 vs 8.83 ± 16.96; p= 0.002
Sodium mmol/L
Mean ± SD 138.31 ± 3.20 vs 139.38 ± 2.92; p<0.001
Length of stay (days)
Mean ± SD 3.89 ± 1.83 vs 3.60 ± 1.67; p=0.049
Presence of afebrile seizure
Rates (%) 1% vs 9%; p<0.001
Fasheh Youssef W, 2011
Case-series _ Isolation of RV Number (%) 11/28 (39) Afebrile convulsion during mild gastroenteritis is a banal symptom with good prognosis
Isolation of Salmonella
1/28 (4)
ESPGHAN/ESPID Guidelines for the Management of AGE in Children in Europe
Day TG, 2012
Case-series _ _ _ _ First reported cluster of children presenting with neurological symptoms and stool virology positive for RV
Shai S, 2013 Surveillance system
Between April 2009 and March 2011
Cases of severe hypernatremia (>155mEq/L) between community-acquired gastroenteritis
Number 26/84 Although the incidence is relatively low comparedwith all RV cases, significant RV morbidity could be identified
Cases of severe hyponatremia (<125mEq/L) between community-acquired gastroenteritis
10/84
Cases of encephalopathy between community-acquired gastroenteritis
58/84
Cases of deaths between community-acquired gastroenteritis
3/84
Shkalim V, 2012
Retrospective comparative study
— +/- Israel Inpatients 17 otherwise healthy children aged 2-36 months with non-typhoid Salmonella and bacteremia
— — Cases were compared to 17 age-matched children with non-typhoid salmonella gastroenteritis
— — Toxic appearence (cases vs controls)
frequency (%)
4(24%) vs 1(6%), p=0.002
Toxic appearence and convulsions on admission were more common among children with non-typhoid Salmonella and bacteremia if compared to those with Salmonella AGE.
Convulsions (cases vs controls)
frequency (%)
3(19%) vs 0, p=0.002
Payne DC, 2008
Surveillance system
January 1, 2006 to June 30, 2006
+ USA Inpatients, ED patients and outpatients
516 children (181 inpatients, 201 ED and 134
— — RV positive and RV negative patients
— — Frequency of vomiting (RV pos vs RV neg)
frequency 95% vs 79%, p<0.001
Children with RV infection presented more frequently with vomiting, fever and lethargy compared
Fever (RV pos vs RV neg)
frequency 78% vs 63%, p=0.001

ESPGHAN/ESPID Guidelines for the Management of AGE in Children in Europe
outpatients). 44% with RV diarrhea.
to children with non RV infection.
Lethargy (RV pos vs RV neg)
frequency 53% vs 27%, p<0.001
Kaiser P, 2012
Retrospective study
1 October 2002 to 3 May 2008
+/- Germany Inpatients 6884 children < 5 years, 4880 RV positive and 2118 RV negative.
— — — — — Respiratory Infections Rate (RV pos vs RV neg)
Number (%) 648 (30.6%) vs 1,112 (40.2%), p<0.001
Hypernatremia is a specifc complication of RV positive AGE
Abdominal symptoms (RV pos vs RV neg)
Number (%) 23 (1.1%) vs 118 (4.2%), p<0.001
Neurological symptoms (RV pos vs RV neg)
Number (%) 50 (2.4%) vs 138 (5%), p<0.001
Metabolic disorders (RV pos vs RV neg)
Number (%) 85 (4%) vs 56 (2%), p<0.001
Hypertonic dehydration
Number (%) 49 (2.3%) vs 15 (0.5%), p<0.001
Ansaldi F, 2008
Prospective Cohort study
April 2005–April 2006
+/- Italy Outpatients 3611 children < 5 years surveyed by 10 primary pediatricians; 684 with AGE
— — RV positive and RV negative patients
— — Fever (RV pos vs RV neg)
frequency 56.2% vs 31.8%, p<0.01
Children with RV infection had significantly more fever and dehydration than RV negative patients. No difference in number of stools, blood in stools andabdominal pain.
Dehydration (RV pos vs RV neg)
frequency 18.7% vs 9.7%, p<0.01
Risk of RV AGE in patients with fever
OR(95% CI) 2.6 (1.8-3.7), p<0.01
Risk of RV AGE in patients with dehydration
OR(95% CI) 1.8 (1.1-3), p=0.02
Chisti MJ, 2011
Prospective Cohort study
September-December 2007
+/- Bangladesh
Inpatients 258 children <5yr of age admitted for severe diarrhea
— — Children who died vs children who survived
— — Absent peripheral pulse even after complete rehydration
OR(95% CI) 10.9 (2.1-56.8), p < 0.01
the absence of peripheral pulses even after full rehydration, severe malnutrition, hypoxaemia, lobar pneumonia and hypernatraemia are independent predictors of death
Severe malnutrition
OR(95% CI) 7.9 (1.8-34.8), p < 0.01
Hypoxaemia OR(95% CI) 8.5 (1.0-75.0), p = 0.05
Radiological lobar pneumonia
OR(95% CI) 17.8 (3.7-84.5), p < 0.01
Hypernatraemia
OR(95% CI) 15.8 (3.0-81.8), p < 0.01

ESPGHAN/ESPID Guidelines for the Management of AGE in Children in Europe
AGE=Acute gastroenteritis; NV= Norovirus; OR=odds ratio; QoS=Quality of Study; RV=Rotavirus.
1.4. Is there a relationship between setting or socio-economic factors and risk of severe or persistent diarrhea?
Table 1.4.1. Hospitalization
Reference Study type Period of observation
QoS
Country In/OutPatients
Population Randomization Intervention Comparison FU n/N
ITT Outcomes measures
RCT n Effect measure
Effect size (95% CI)
Comments
Waisbourd-Zinman O, 2011
Prospective Cohort study
Between 2003 and 2006
+/- Israel Inpatients N= 2287 children RV AGE (1931 community acquired 356 Nosocomial)
— Weekly surveillanceof the microbiologic laboratory for hospitalized childrenwith positive fecal RV antigen
Community acquired vs nosocomial
— — Percentage of nosocomial RV AGE in children treated in full compliance with hand hygiene
— Correlation P <.0001 Nosocomial cases can be easily prevented by adherence to hand hygiene measures
Waisbourd-Zinman O, 2009
Prospective Cohort study
From January 1, 2003 to December 31,2006
+/- Israel Inpatients N=356 children with Nosocomial-RV AGE
— Collection of clinical data
— — — Children with Nosocomial-RV AGE ≤ 2 years
— Number (%) 320/356 (90%)
The risk of nosocomial diarrhea is related to young age
Wildi-Runge S, 2009
Retrospective cohort study
January 2002 to March 2006
+/- Switzerland Inpatients N=590 children <3yr of age hospitalized for RV acute gastroenteritis
— — Community acquired vs Nosocomial diarrhea
— — Persistent Diarrhea (>5days) Community (23.6%) vs Nosocomial (18%)
— OR (95%CI) 1.3 (0.6–3.0), p=0.46
Nosocomial cases tended to be less severe than those acquired in the community
Vomiting events (>2/day) Community (78%) vs Nosocomial (35%)
OR (95%CI) 5.3 (2.6–10.8), p< 0.001
Dehydration (>5% of weight loss) Community (85%) vs Nosocomial (35%)
OR (95%CI) 11.3 (5.7–22.4), p <0.001
ESPGHAN/ESPID Guidelines for the Management of AGE in Children in Europe
Wiegering V, 2011
Retrospective cohort study
April 1, 2005 to May 31, 2008
+ Germany Inpatients 650 charts of children with AGE. 262 (43.8%) had RV, 188 (31.4%) NV, 58 (9.7%) Adenovirus, 47(7.9%) Salmonella.
— — Community acquired vs Nosocomial diarrhea
— — Gastroenteritis score (Community acquired vs Nosocomial infections): pulmonary symptoms
— mean number ±SD
1.5±0.2 vs 3.6±0.3, p<0.001
The underlying disease which led to admission, predominantly airway infections, explains the high respiratory symptoms score
Gastroenteritis score (Community acquired vs Nosocomial infections): gastrointestinal symptoms
mean number ±SD
13±0.1 vs 9.8±0.2 , p<0.001
Garcia-Basteiro AL, 2011
Cross-sectional study
2003-2008 + Spain Inpatients N=3265 children < 5 years of age admitted for RV-AGE
— — Community acquired vs Nosocomial diarrhea
— — Nosocomial RV-AGE
— Rates (%) 892/3265 (27%)
Children under 12 months old appear to be at higherrisk of acquiring nosocomial RV gastroenteritis than older children
Annual incidence ofpresumed nosocomial RV-AGE per 1000 hospitalizations
Mean Incidence rate (95%CI)
2.5 cases per 1,000 (2.0 to 2.8)
Age of hospitalized children with RV-AGE (nosocomial vs community acquired) (mo)
Mean ±SD 5.08±9.4 vs 7.6±10.1
Gleizes O, 2006
Review — + France, Germany, Italy, Poland, Spain and the United Kingdom
Inpatients Children with a diagnosis of Nosocomial RV-AGE
— — Community acquired vs Nosocomial diarrhea
— — Nosocomial/Community acquired RV in children <5yr of age
— Ratio France: 0.61 ; Germany 1.04; Poland: 0.64; Spain: 0.96; UK: 0.76
Asymptomatic manifestations of Nosocomial RV infection in children <3mo of age
Rates (%) 18-39%
ESPGHAN/ESPID Guidelines for the Management of AGE in Children in Europe
RV-infected health-care workers taking care of children with community-acquired RV-AGE
Rates (%) 76–78% The main vectors of transmission are contaminated(mostly uninfected) health care workers
Duration of hospital stay (days) Nosocomial vs Community-acquired AGE
Mean difference
France: +5d; Italy: +1.7d; Poland: +5.9; Spain: +1.8; UK +4
The rate of NV infection can rise to 70% if patients stay hospitalized for 6 days
Age of hospitalized children with RV-AGE (nosocomial vs community acquired) (0-5 mo)
Rates (%) 48% vs 20%
Age of hospitalized children with RV-AGE (nosocomial vs community acquired) (6-11 mo)
Rates (%) 26% vs 30%
Age of hospitalized children with RV-AGE (nosocomial vs community acquired) (12-23 mo)
Rates (%) 19% vs 28%
Age of hospitalized children with RV-AGE (nosocomial vs community acquired) (24-59 mo)
Rates (%) 7% vs 22%

ESPGHAN/ESPID Guidelines for the Management of AGE in Children in Europe
Nosocomial diarrhearequiring rehospitalization
Rates (%) 2 and 13%
Ogilvie I, 2012
Scoping review
— — Western Europe
Inpatients 76 studies from 16 countries on European children <5 yr of age with community-acquired and nosocomial diarrhea
— — Community acquired vs Nosocomial diarrhea
— — Patients with severe nosocomial RVGE in France, Italy, Spain and the UK
2 (n=3734; n=251)
Rates (%) 42.6% RV gastroenteritis is a common disease associated with significant morbidity and costsacross Western Europe
Patients with severe nosocomial RVGE in Austria, Germany, and Switzerland
Rates (%) 24.4%, 30.2% and 40%
Severe dehydration in children with community-acquired vs nosocomial gastroenteritis
2 (Ireland n=663; Sweden n=984)
Rates (%) 80% vs 55% (Ireland) 10.8% vs 0.8% (Sweden)
Mortality due to nosocomial RVGE (< vs > 12mo)
1(n=10,990)
Incidence rates
0.74 per 100,000 vs 0.16 per 100,000
AGE= acute gastroenteritis; NV= Norovirus; OR=odds ratio; QoS=Quality of Study; RV=Rotavirus; RVGE= Rotavirus gastroenteritis.

ESPGHAN/ESPID Guidelines for the Management of AGE in Children in Europe
Table 1.4.2. Socioeconomic factors
Reference Study type Period of observation
QoS Country In/OutPatients Population Randomization Intervention Comparison FU n/N
ITT Outcomes measures
Effect measure
Effect size (95% CI)
Comments
Pockett RD, 2011
Retrospective cohort study
1st April 2009 and 31st March 2010
+/- UK Inpatients N=1334 children ≤5 yr of age with RV-AGE
— — Correlation with deprivation rank
— — Variation of hospital admissions' rates in relation to the decrease of a deprivation ranking
Rates from 0.346 to 0.287 per 10,000 (p < 0.001)
Hospital admissions increased as deprivation increased*
*Index of Multiple Deprivation (IMD) 2007 for EnglandKyle RG, 2011
Retrospective study
— + UK Inpatients (ED) 24,481 children under 15 years admitted to ED for breathing difficulty, fever or diarrhoea during 2007/2008.
— — — — — Index of Multiple Deprivation
Sperman rho
0.31, p=0.09 There were no statistically significant relationships between the ED admission rate of children admitted for diarrhoea and the Index multiple derivation and its single indicators.
overcrowding Sperman rho
0.21, p=0.267
houses in poor condition
Sperman rho
0.11, p=0.543
air quality Sperman rho
0.16, p=0.387
homelessness Sperman rho
0.14, p=0.439
AGE= acute gastroenteritis; ED=emergency department; QoS=Quality of Study; RV=Rotavirus.

ESPGHAN/ESPID Guidelines for the Management of AGE in Children in Europe
Table 1.4.3. Day care attendance
Reference Study type
Period of observation
QoS Country In/OutPatients
Population Randomization Intervention Comparison FU n/N ITT Outcomes measures RCT n
Effect measure
Effect size Comments
Sandora TJ, 2005
RCT — + USA Outpatients N= 292 families with children aged < 5yr
Computered permuted-blocks design with random block sizes
Supply of alcohol-based hand sanitizer to use at home
Controls 281/292 Yes Gastrointestinal-Illness transmission (treated vs controls)
— IRR (95% CI)
0.41 (0.19–0.90) p=.03
This intervention significantly reduced the transmission of GI illnesses in the homes of families with children who were enrolled in out-of-home child care.
Kotch JB, 2007
RCT September 2002 to January 2003
+ USA Outpatients N=388 infants and toddlers attending child-care centers (23 matched-paired centers)
Appropriate Installation of diaper-changing, hand-washing, and food-preparation equipment
Controls 388/388 No Child Diarrhea Frequency per 100 Child-Days (treated vs controls)
— Incident rates
0.90 vs 1.58 (p<0.001)
High-quality equipment is associated with significantly fewer episodes of diarrhea among children and fewer sick days among staff.
% of Days Child Ill per 100 Child-Days (treated vs controls)
Incident rates
4.0 vs 5.0 (p<0.001)
% of Days Caregiver Absent because of Illness (treated vs controls)
Incident rates
0.77 vs 1.73 (p<0.001)
Grimprel E, 2010
Surveillance study
December 2006 and May 2007
+ France Outpatients N=371 children aged <3yr attending child-care centers
— — — — No Cases of RVGE per 100,000 person-days
— Incidence rate (95%CI)
46.7 (26.7-75.8) RV can easily spread in a day care setting
Age-distribution of children with RV-AGE
Rates (%) 0-11 mo: 50%; 12-23mo: 37%; >24mo: 13%
AGE= Acute gastroenteritis; GI=Gastrointestinal; QoS=Quality of Study; RV=Rotavirus; RVGE=Rotavirus gastroenteritis.

ESPGHAN/ESPID Guidelines for the Management of AGE in Children in Europe
CLINICAL EVALUATION AND DISEASE SEVERITY
Table 2.1. What are the indications for a medical visit?
Reference Study type Period of observation
QoS Country In/Out Patients
Population Randomization Intervention Comparison FU n/N
ITT Outcomes measures GL n
Effectmeasure
Effect size(95% CI)
Comments
Williams DJ, 2012
Retrospective surveillance system
May 1, 2004 to April 30, 2007May 1, 2007 to April 30, 2010
+ US Outpatients N= 19731 AGE-related calls
— Vanderbilt Telephone Triage Program
Postlicensure period (2007–2010)) vs Prevaccine period (2004–2007
— — AGE-related Call Proportions After RV Vaccine Licensure (RV Season)
— IRR (95% CI) 0.72 (0.67–0.78)
A telephone consultation can be appropriate in the management of uncomplicated cases of AGE
van den Berg J, 2011
Systematic review
2011 ++ Europe, USA, Canada
Outpatients N=8 guidelines
— Assess the quality of international CPG for the management of acute diarrhea in children in high income countries with the Appraisal of Guidelines, Research and Evaluation (AGREE) instrument
— — — Indication to medical visit: Young age
n=4 Consensus (n/N) and Consistency (Y/N) of the recommendation
3/4; Y Not recommended by ESPGHAN, to be included*
Indication to medical visit: High Output --> 6 diarrheal stool in 24 h, or > 3 vomits in 24 h or watery diarrhea > 6 times a day > 3 days (<2 years: > 1 day)
Consensus (n/N) and Consistency (Y/N) of the recommendation
4/4; Y
Indication to medical visit: Persistent vomiting or >2 vomits/24h
Consensus (n/N) and Consistency (Y/N) of the recommendation
3/4; Y
Indication to medical visit: Reported signs of severe dehydration*
Consensus (n/N) and Consistency (Y/N) of the recommendation
3/4; Y*
Indication to medical visit: Signs of severe cause for diarrhea/underlying disease
Consensus (n/N) and Consistency (Y/N) of the recommendation
4/4; Y
*Consistency of recommendations: If more than 50% of these guidelines made an identical recommendation, it was considered consistent
AGE= acute gastroenteritis; CPG=Clinical practice guidelines; ESPGHAN= European Society for Paediatric Gastroenterology, Hepatology, and Nutrition; QoS=Quality of Study; RV=Rotavirus.

ESPGHAN/ESPID Guidelines for the Management of AGE in Children in Europe
2.2. Is there any clinical feature that may suggest a bacterial versus viral etiology of diarrhea?
Table 2.2.1. Bacterial versus viral
Reference Study type QoS Country In/Out Patients
Population Randomization Intervention Comparison FU ITT Outcomes measures
Effect measure
Effect size (95% CI) Comments
Wiegering V, 2011
Retrospective cohort study
+ Germany Inpatients 650 charts of children with AGE reviewed between 2005 and 2008. 262 (43.8%) had RV, 188 (31.4%) NV, 58 (9.7%) Adenovirus, 47(7.9%) Salmonella.
_ _ Comparisons between all viral infections and Salmonella infection
_ _ Respiratory symptoms score (all viral vs Salmonella)
mean score (0-6)±SD
1.8±0.1 vs 0.6±0.3, p<0.001 Children with viral infection had significantly more respiratory associated symptoms and vomiting, but less episodes of diarrhea and total duration of diarrhea when compared to children with Salmonella infection.
Duration of diarrhea (all viral vs Salmonella)
mean number ±SD
3.4±0.1 vs 6.1±0.4, p<0.001
Diarrhea events (all viral vs Salmonella)
mean number ±SD
3.8±0.1 vs 10.4±0.5, p<0.001
Vomiting events (all viral vs Samonella)
mean number ±SD
2.6±0.2 vs 1±0.4, p<0.001
Comparisons between viral infections: RV vs NV vs Adenovirus
_ _ Duration of diarrhea (RV vs NV vs AV)
mean number ±SD
4.1±0.2 vs 2.7±0.2 vs 3.4±0.3, p<0.001
Children with RV infection had significantly higher severity scores, more diarrheal events and long-lasting diarrhea. In contrast NV infection had more vomiting events.
Diarrhea events (RV vs NV vs AV)
mean number ±SD
4.4±0.2 vs 3.2±0.2 vs 3.4±0.4, p<0.001
Vomiting events (RV vs NV vs AV)
mean number ±SD
2.4±0.2 vs 3.2±0.2 vs 1.6±0.3, p=0.05
Gastroenteritis score (RV vs NV vs AV)
mean score (0-15)±SD
13.5±0.2 vs 11.9±0.2 vs 11.5±0.4, p<0.001
Payne DC, 2008
Surveillance system
+ USA Inpatients, ED patients and outpatients
516 children (181 inpatients, 201 ED and 134 outpatients). 44% with RV diarrhea.
_ _ RV positive and RV negative patients
_ _ Fever (RV pos vs RV neg)
frequency 78% vs 63%, p=0.001 Children with RV infection presented more frequently with vomiting, fever and lethargy compared to children with non RV infection.
Lethargy (RV pos vs RV neg)
frequency 53% vs 27%, p<0.001
Narkeviciute I, 2008
Retrospective study
+/- Lithuania Inpatients Random retrospective selection of 140 charts of children < 3y with NV (70) and RV (70) infection.
Random selection of charts; no allocation to any intervention
_ RV vs NV infection
_ _ High grade fever (BT> 38°C) (RV vs NV)
frequency 81% vs 48%, p<0.0001 RV infection presents more likely with fever, usually high grade (>38°) and frequent diarrheal episodes (>7/d). NV AGE is commonly characterized by the presence of vomiting (71% more than 4episodes/d) and in 1/5 of cases without diarrhea
Frequency of fever (RV vs NV)
frequency 97% vs 66%, p<0.0001
Diarrhea >7 episodes/d (RV vs NV)
frequency 42% vs 12%, p<0.0001
Vomiting > 4/d (RV vs NV)
frequency 49% vs 71%, p=0.01

ESPGHAN/ESPID Guidelines for the Management of AGE in Children in Europe
Children without diarrhea (RV vs NV)
frequency 4% vs 19%, p=0.01
Ansaldi F, 2008
Prospective Cohort study
+/- Italy Outpatients 3611 children < 5 years surveyed by 10 primary pediatricians; 684 with AGE
_ _ RV positive and RV negative patients
_ _ Fever (RV pos vs RV neg)
frequency 56.2% vs 31.8%, p<0.01 Children with RV infection had significantly more fever and dehydration than RV negative patients. No difference in number of stools, blood in stools and abdominal pain.
Dehydration (RV pos vs RV neg)
frequency 18.7% vs 9.7%, p<0.01
Risk of RV AGE in patients with fever
OR(95% CI)
2.6 (1.8-3.7), p<0.01
Risk of RV AGE in patients with dehydration
OR(95% CI)
1.8 (1.1-3), p=0.02
Ghorashi Z, 2010
Case-control study
+/- Iran Inpatients 49 cases with convulsion due to AGE (in absence of electrolyte imbalance) and 51 controls with AGE but without convulsions
_ _ _ _ _ Frequency of Shigellosis (cases vs controls)
frequency 8 vs 2, p=0.014 The frequency of Shigellosis in the case group was significantly higher than in the control group.
Chen SM, 2012
Prospective Cohort study
+ Taiwan Inpatients 168 children (1.2 - 4.7 years) admitted for AGE. 30 with RV, 25 NV, 26 Salmonella (SA).
_ _ _ _ _ Maximum number of diarrheal episodes/d (RV vs NV vs SA)
Median (IQR)
RV 6(4-9.5) vs NV 4 (3-6.25) vs SA 8(6-10), p<0.001
Children with Salmonellosis demonstrated higher fever, bloody diarrhea and more diarrheal episodes when compared to RV and NV positive patients.Maxiumun
number of vomiting episodes/d (RV vs NV vs SA)
Median (IQR)
RV 4 (2-7) vs NV 2.5 (1-5.2) vs SA 1 (1-2), p<0.001
Fever > 38°C (RV vs NV vs SA)
Frequency (%)
RV 36 (87.8%) vs NV 13 (38.2%) vs SA 29 (100%), p<0.001
Maximun body temperature (RV vs NV vs SA)
Median (IQR)
RV 38.8 (38.4 -39) vs NV 37.9 (37.2-38.7) vs SA 39.1 (38.9-39.6), p<0.001
Stool occult blood Frequency (%)
RV 16 (39%) vs NV 8 (23.5%) vs SA 18 (62.1%), p<0.001
Kaiser P, 2012
Retrospective study
Germany Inpatients 6884 children < 5 years, 4880 RV positive and 2118 RV negative.
_ _ _ _ _ Respiratory Infections Rate (RV pos vs RV neg)
Number (%)
648 (30.6%) vs 1,112 (40.2%), p<0.001
Hypernatremia is a specific complication of RV positive AGE
Abdominal symptoms (RV pos vs RV neg)
Number (%)
23 (1.1%) vs 118 (4.2%), p<0.001
Neurological symptoms (RV pos vs RV neg)
Number (%)
50 (2.4%) vs 138 (5%), p<0.001

ESPGHAN/ESPID Guidelines for the Management of AGE in Children in Europe
Metabolic disorders (RV pos vs RV neg)
Number (%)
85 (4%) vs 56 (2%), p<0.001
Hypertonic dehydration
Number (%)
49 (2.3%) vs 15 (0.5%), p<0.001
AGE= acute gastroenteritis; NV=Norovirus; QoS=Quality of Study; RV=Rotavirus.
Table 2.2.2. Systemic Involvement
Reference Study type QoS
Country In/Out Patients
Population Randomization Intervention Comparison FU
ITT Outcomes measures
Effect measure
Effect size (95% CI)
Comments
Shkalim V, 2012
Retrospective comparative study
+/- Israel Inpatients 17 otherwise healthy children aged 2-36 months with non-typhoid Salmonella and bacteremia
_ _ Cases were compared to 17 age-matched children with non-typhoid salmonella gastroenteritis
_ _ Toxic appearence (cases vs controls)
frequency (%)
4(24%) vs 1(6%), p=0.002
Toxic appearence and convulsions on admission were more common among children with non-typhoid Salmonella and bacteremia if compared to those with Salmonella AGE.
Convulsions (cases vs controls)
frequency (%)
3(19%) vs 0, p=0.002
AGE=acute gastroenteritis; QoS=Quality of Study.
2.3 How is dehydration assessed?
Table 2.3.1. Clinical dehydration scale
Reference Study design Country Aim Setting N Age range Inclusion criteria
Outcome measures Results/conclusions
Friedman JN, 2004
Prospective cohort study
Canada To develop a clinical dehydration scale for use in children <3 y of age.
ED 137 1-36 mo (median: 18 mo)
GE Urine output; general appearance; eyes; mucous membranes (tongue); tears; respiratory rates; heart rate.
‘Clinicians and researchers may consider this four-item, 8-point rating scale, developed using formal measurement methodology, as an alternative to scales developed ad hoc.’
Goldman RD, 2008
Prospective cohort study
Canada To validate the CDS with a new cohort of patients with AGE.
Tertiary care ED
205 1 mo -5 y (22.4 ± 14.9 mo)
Symptoms of AGE
Length of stay, proportion of children receiving intravenous rehydration; proportion of children with abnormal serum pH values or bicarbonate levels.
The CDS was valuable in predicting a longer length of stay and the need for intravenous rehydration in children with symptoms of AGE.
Bailey B, 2010
Prospective cohort study
Canada To validate the CDS for children with gastroenteritis in a different ED from where it was initially derived and validated.
Tertiary care ED
150 1 mo – 5 y Vomiting and/or diarrhea
Primary: the association between the CDS for children and the length of stay in ED after being seen by the attending physician.
The CDS is a good predictor of (1) length of stay in the ED after being seen by a physician; (2) perceived need for IV rehydration; (3) utilization of laboratory blood tests.

ESPGHAN/ESPID Guidelines for the Management of AGE in Children in Europe
Gravel J, 2010
Prospective cohort study
Switzerland, Canada
To validate the association between the CDS and markers of dehydration in children aged 1 mo to 5 y visiting ED for vomiting and/or diarrhea.
ED 219 1 mo -5 y (mean age: 22 ± 14 mo;range 4 mo to 4 y)
Vomiting and/or diarrhea
Primary: the percentage of dehydration calculated by the difference in weight at first evaluation and after recovery.
Secondary: proportion of blood test measurements, intravenous use, hospitalization, and inter-rater agreement.
‘CDS categories correlate well with markers of dehydration four young children complaining of vomiting and/or diarrhea in the ED.’
Kinlin LM, 2012
Prospective cohort study
Canada To evaluate the reliability and validity of the CDS in a cohort of children with gastroenteritis and evidence of dehydration.
Tertiary ED
226 ≥3 mo GE and dehydration requiring intravenous rehydration
Reliablity (by comparing the scores assigned independently by a trained research nurse and a physician).Validity (by using parameters reflective of disease severity: weight gain; baseline laboratory results; willingness of the physician to discharge the patient; hospitalization; length of stay).
‘In children administered intravenous rehydration, the CDS was characterized by moderate interobserver reliability and weak associations with objective measures of disease severity. These data do not support its use as a tool to dictate the need for intravenous rehydration or to predict clinical course.’
Pringle K, 2011
Prospective cohort study
Rwanda To determine whether the WHO scale, the Gorelick scale and the CDS scales can accurately assess dehydration status in children when performed by nurses or GP in a low-income country.
Hospital 49 <15 y (but analysis limited to children fitting within the predefined age ranges for each of the scales)
Diarrhea and/or vomiting
Sensitivity; specificity. ‘In this sample of children, the WHO scale, Gorelick scale, and CDS did not provide an accurate assessment of dehydration status when used by GP and nurses in a developing world setting’.
Pruvost I, 2013
Prospective cohort study
France To estimate the value of post-illness weight gain prospectively as a gold standard for acute weight lossin a larger population.
Tertiary ED
293 1 to 24 months of age
Acute diarrhea, and daily weightsurveillance for 7 days following the ED visit, were included
Pearson correlation between post-illness and theoretical weight
The correlation between post-illness and theoretical weight was excellent (0.978), butbootstrapped linear regression analysis showed that post-illness weight underestimated theoretical weight by 0.48 kg. These data suggest that post-illness weight is of little value as a gold standard to determine the true level of dehydration
CDS=clinical dehydration scale; ED=emergency department; WHO=World Health Organization.

ESPGHAN/ESPID Guidelines for the Management of AGE in Children in Europe
Table 2.3.2. Severity scores
Reference Study design Country Aim Setting N Age range Inclusion criteria Outcome measures Results/conclusionsSchnadower D, 2013
Prospective cohort study
US To evaluate the reliability, construct validity, and generalizabilityof the Modified Vesikari Score by studying its characteristics in a network of pediatricEDs in the United States
ED 282
Between 91 days and 48 months of age)
AGE Reliability, construct validity, and generalizabilityof the Modified Vesikari Score
‘The Modified Vesikari Score effectively measures global severity of disease andperforms similarly in varying populations within the US health care system. Its characteristics support its use in multisite outpatient clinical trials.’
Ruuska T, 1990 Prospective cohort study
Finland To assess the use of the classical Vesikari score for clinical severity of diarrhoeal episodes
Hospital
336
24-32 months of age AGE Severity of symptoms between RV e non-RV AGE
Using this system, the mean severity score for the 65 episodes of RV diarrhoea was 11.0 +/- 3.7 as compared to 5.6 +/- 3.2 for the 183 episodes of non-RV diarrhoea (p<0.001).
AGE= acute gastroenteritis; ED=emergency department; RV=Rotavirus.
Table 2.3.3. Clinical and laboratory assessment
Reference Study design Country Aim Setting N Age range
Inclusion criteria
Outcome measures Results/conclusions
Parkin PC, 2010
Data werecollected prospectively; however the analysis waspost hoc.
Canada To evaluate clinical and laboratory assessment (serum bicarbonate and venous pH) of dehydration severity in children.
ED 93 1-36 mo AGE For a clinical score of 0, the LR+ 2.2 (0.9-5.3);For a clinical score of 1 to 4, the LR+ was 1.3 (0.90-1.74);For a clinical score of 5 to 8, the LR+ was 5.2 (2.2-12.8);For a venous pH <7.32, the LR+ was 7.2 (2.4-21.9);For serum bicarbonate <18 mmol/L, the LR+ was 11.6 (3.5-38.0).
Clinicians may find it useful to incorporate the Clinical Dehydration Scale and laboratory measures into clinical decision-making algorithms to assess dehydration severity in children with acute gastroenteritis.
AGE= acute gastroenteritis; ED=emergency department; LR=likelihood ratio.

ESPGHAN/ESPID Guidelines for the Management of AGE in Children in Europe
Table 2.3.4. Standardized Scoring System
Reference Study design Country Aim Setting N Age range Inclusion criteria Outcome measures Results/conclusionsRoland D, 2010 Prospective
observational study
Australia To determine if scoring system based on standardized clinical signs would reduce the variability between doctors’ assessment of dehydration.
ED 100 1 mo-12 y (median 24 mo)
GE Estimated percentage dehydration. Agreement between raters.
The clinical scoring system used did not reduce the variability of assessment of dehydration
ED=emergency department; GE=gastroenteritis.
Table 2.3.5. Ultrasound
Reference Study design Country Aim Setting N Age range Inclusion criteria Outcome measures Results/conclusionsChen L, 2007 Prospective
observational study
US To compare the IVC and Ao diameters ratio of dehydrated children with controls and to compare the IVC/Ao ratio before and after IV rehydration in children with dehydration.
ED 72 6 mo-16 y Subjects with evidence of dehydration plus matched controls
IVC/Ao ratio The ratio of inferior vena cava diameter is lower in children with clinical dehydration. It increases with administration of IV fluid boluses.
Chen L, 2010 Prospective observational study
US To validate the use of bedside ultrasound measurement of IVC/Ao diameter by investigating whether IVC/Ao ratio correlated with dehydration in children with AGE.To investigate the inter-rater variability of the IVC/Ao measurements.
ED 112 6 mo-18 y GE Sensitivity, specificity, likelihood ratios, area under the receiver operator characteristic curves.
IVC to Ao diameter was a marginally accurate measurement of acute weight loss in children with dehydration from gastroenteritis
Levine AC, 2010
Prospective cohort study
Rwanda To determine the test characteristics for two different ultrasound measures of severe dehydration in children (Ao to IVC) ratio and IVC inspiratory collapse and the WHO dehydration scale.
ED 73 1 mo-10 y Diarrhea and/or vomiting
Sensitivity, specificity, likelihood ratios, area under the receiver operator characteristic curves.
Ao to IVC and IVC inspiratory collaps. Ultrasound if the aorta/IVC ratio can be used to identify severe dehydration in children presenting with acute diarrhea.
AGE= acute gastroenteritis; Ao=aorta; ED=emergency department. IVC=inferior vena cava; WHO=World Health Organization.
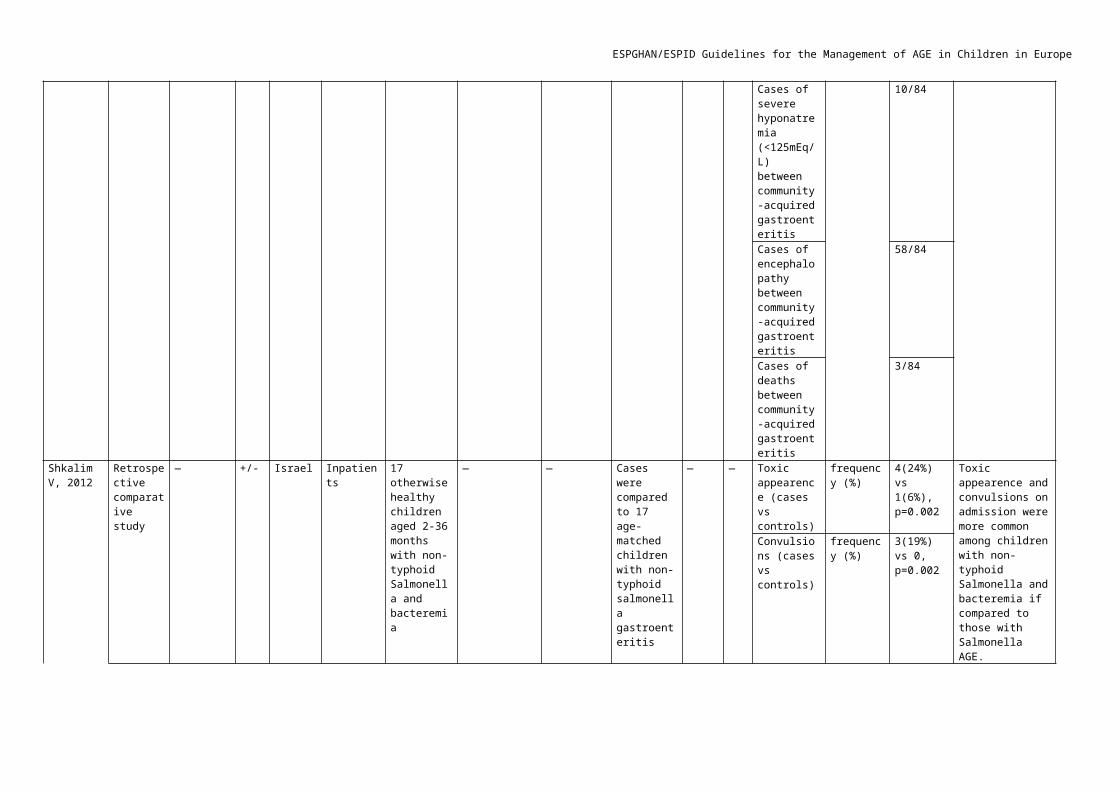
ESPGHAN/ESPID Guidelines for the Management of AGE in Children in Europe
Table 2.3.6. Hand-held bladder ultrasound
Reference Study design Country
Aim Setting N Age range Inclusion criteria Outcome measures Results/conclusions
Enright K, 2010 Prospective observational study
UK To evaluate the utility of a hand-held bladder ultrasound scanner in monitoring urine production in children attending the emergency department with suspected dehydration.
Tertiary ED 45 4 mo – 10 y Possible dehydration
Primary: the ability to document the hourly rate of urine production for each child, using the hand-held bladder scanner.Secondary: the relationship between the measured urine production and clinical features of dehydration, patient disposal and rehydration therapy.
Serial bladder ultrasound scanning using a hand-held device is a convenient non-invasive and objective adjunct in the management of suspected dehydration in ED.
ED=emergency department;
Table 2.3.7. Digital videography to measure capillary refill time
Reference Study design Country Aim Setting N Age range Inclusion criteria Outcome measures Results/conclusionsShavit I, 2006
Prospective cohort study
Canada To determine whether digitally measured capillary-refill time assesses the presence of significant dehydration (≥5%) in young children with GE more accurately than conventional capillary refill and overall clinical assessment.
Tertiary ED
83 1 mo – 5 y Gastroenteritis judged to be at least mildly dehydrated.
Sensitivity, specificity, likelihood ratios, area under the receiver operator characteristic curves.
Digitally measured capillary-refill time more accurately predicts significant dehydration (≥5%) in young children with GE than overall clinical assessment.
ED=emergency department; GE=gastroenteritis.
Table 2.3.8. Bioelectric impedance
Reference Study design Country Aim Setting N Age range Inclusion criteria Outcome measures Results/conclusionsDunkelmann L, 2012
Case series Switzerland To compare a bioimpedance device to the validated clinical score for the determination of the degree of dehydration in children with AGE.
26 0.5 to 10 y AGE The subgroup of children with mild dehydration (n=14) had significantly lower Ω50 compared to the subgroup of children with moderate/severe dehydration (n=12), p=0.003.
Possible usefulness of bioelectric impedance for the assessment of dehydration.
AGE= acute gastroenteritis;

ESPGHAN/ESPID Guidelines for the Management of AGE in Children in Europe
Table 2.3.9. Plasma water
Reference Study design Country Aim Setting N Age range Inclusion criteria Outcome measures Results/conclusionsPlaisier A, 2010 Prospective
cohort studyThe Netherlands
To evaluate plasma water as a diagnostic tool in the assessment of dehydration in children with AGE admitted to hospital with moderate to severe dehydration.
ED 101 Up to 12 y AGE and dehydration
Plasma water did not correlate with the percentage of weight loss.
There is insufficient evidence to justify the use of plasma water as a diagnostic tool in the assessment of dehydration in children with AGE.
AGE=acute gastroenteritis; ED=emergency department; GE=gastroenteritis.

ESPGHAN/ESPID Guidelines for the Management of AGE in Children in Europe
DIAGNOSTIC WORKUP
Table 3.1. Is There Any Reliable Hematological Marker of Bacterial Diarrhea?
Reference Type of Study Country Inpatient Outpatient
Follow-up n/N
Population Intervention Comparison Outcome measures Results /Effect size Risk of Bias
Source of Funding
Conclusions and Comments
Wiegering V, 2011
RetrospectiveApr 2005 to May 2008
Germany Inpatient Not reported
650/1157 children with pathogen proven AGEAge22d-17.9y(mean 2.4y)
NA Clinical score to differentiate between different etiologies
EtiologyDuration of diarrheaLaboratory and other hematologic markers
Etiology:84.9% viral7.9% Salmonella7.2% multiple agentsDuration of diarrhea:All viral 3.4±0.1 daysSalmonella 6.1±0.4 days(p<0.001)CRPViral AGE 1.2±0.1Salmonella AGE 6.9±0.4(p<0.001)ESRViral AGE 15±0.8Salmonella AGE 27±2.2(p<0.001)
NA None RV was the commonest cause of viral AGE and Salmonella the commonest cause of bacterial AGEChildren with bacterial AGE were older, had a more severe clinical course, significantly longer duration and significantly more elevated inflammatory markersThese parameters may make possible to differentiate between viral and bacterial AGE
Marcus N, 2007
ProspectiveConvenient sampleAug 2002 toFeb 2003
Israel OutpatientER
7-12 days (med 2.4)
75 childrenAGEAge 4d - 17y44 children includedBacterial 8/44 (18%)Viral AGE 36/44 (82%)
NA Bacterial vsViral AGE
Validity and feasibility of QR-CRP in diagnosis of bacterial vs viral AGE
QR-CRP (mg/L), mean±SDBacterial 22.3.8±150.3Viral 30±50(P<0.001)QR-CRP ≥ 24.5 mg/LOR 1.49 (95%CI 1.13-1.90PPV 70%, NPV 97%QR-CRP ≥ 95 mg/LOR 1.49 (95%CI 1.13-1.90PPV 91.7%, NPV 87%
NA QR-CRP assay kit was provided by OrionDiagnosFinland
CRP levels of 95mg/L or more within 48 hours of presentation had a high sensitivity and specificity for predicting culture-confirmed bacterial AGE

ESPGHAN/ESPID Guidelines for the Management of AGE in Children in Europe
Chen SM, 2012
ProspectiveMarch 2008 toJan 2009
Taiwan Inpatients NA 168 childrenAGEAge 4m- 14y
Pathogens identified in 123/16882 viral AGE36 bacterial AGE
IL-6, IL-10 assayed:55 viral AGE 26 Salmonel11 healthy controls
NA Bacterial vsViral AGE
Diagnostic performanceIL-6, IL-10,ANC, CRPRV vsNV
Viral vs bacterial AGE
RV vs SalmonellaANC, mm3
8075 (4225-13407) vs4444 (3118-5867)P= 0.004CRP, mg/dl0.62 (0.3-1.59) vs6.42 (3.06-12.25)P≤ 0.001IL-6, IL-10 (p<0.001)
RV vs NVAUC±SE (95% CI)IL-6 0.663±0.075(0.515±0.81)P=0.039IL-100.710±0.69 (0.574-0.84)P= 0.008
NA Chung Shan Hospital(CSH 97A-03)
IL-10 exhibited a significant high level in the acute phase of RV and NV AGE in children and showed a significant discriminating ability between the two most common viral pathogens
Korczowski B, 2004
Prospective Poland Inpatients NA 129 children diarrhea37 systemic infections36 bacterial AGE43 RV AGE13 IBD
NA Different etiologies of diarrhea
Performance of PCT compared to CRP
PCT> 5ng/ml100% systemic infections61% bacterial AGE7% RV AGE23% IBDCRP> 2mg/dl89% systemic infections61% bacterial AGE19% RV AGE46% IBD
NA None declared In this study PCT was a more reliable marker than CRP of systemic bacterial infection in children with diarrhea. PCT was more specific but less sensitive in the differentiation of bacterial and non-bacterial etiology of inflammation.
AGE= acute gastroenteritis; ANC=absolute neutrophil count; AUC=area under the curve; IL-6=interleukin 6; IL-10=interleukin 10; CI=confidence interval; CRP=C-reactive protein; NPV=negative predictive value; NV=norovirus; OR=odds ratio; PCT=procalcitonin; PPV=positive predictive value; QR-CRP=quick-read C-reactive protein; RV= rotavirus; SE=sensitivity; SP=specificity.

ESPGHAN/ESPID Guidelines for the Management of AGE in Children in Europe
Table 3.2. Stool markers for identification of bacterial diarrhea
Reference
Type of Study
Country Inpatient Outpatient
Follow-up n/N
Population Intervention Comparison Outcome measures
Results /Effect size Risk of Bias
Source of Funding
Conclusions and Comments
Sykora J, 2010
Prospective Czech Republic
Inpatients and Outpatient
NA 66 children AGEAge 1-36m
34 bacterial32 viral25 unknown
41 healthy controls
NA BGAvsVGE
Reference fCP in healthy children
Performance of fCP in bacterial vs viral AGE
fCPBGA 219.9µg/g (119-350)P<0.001 vs VGE/ controlVGE 49.3µg/g (8.8-131.1)Controls 26.5µg/g (14.9-55)
fCP≥103.9 µg/gAUC 0.95 (CI 0.89-0.98)CRP≥16.9mg/mlAUC 0.87 (0.83-0.96)WBC≥9.5X10³
AUC 0.77 (0.69-0.82)ESR≥15MM/HAUC 0.84 (0.79-0.89)
AUC fCP vs CRP, p<0.05AUC fCP vs WBC, p<0.001AUC fCP vs ESR, p<0.01AUC fCP vs IL-6, p<0.001
NA None declared
fCP is a valuable, non-invasive and esily measured laboratory testfCP is variable and is age dependent in children <3 yearsfCP was superior to clinical symptoms (fever, stool frequency and vomiting ) and laboratory (CRP, WBC) in the diagnosis of bacterial AGE.
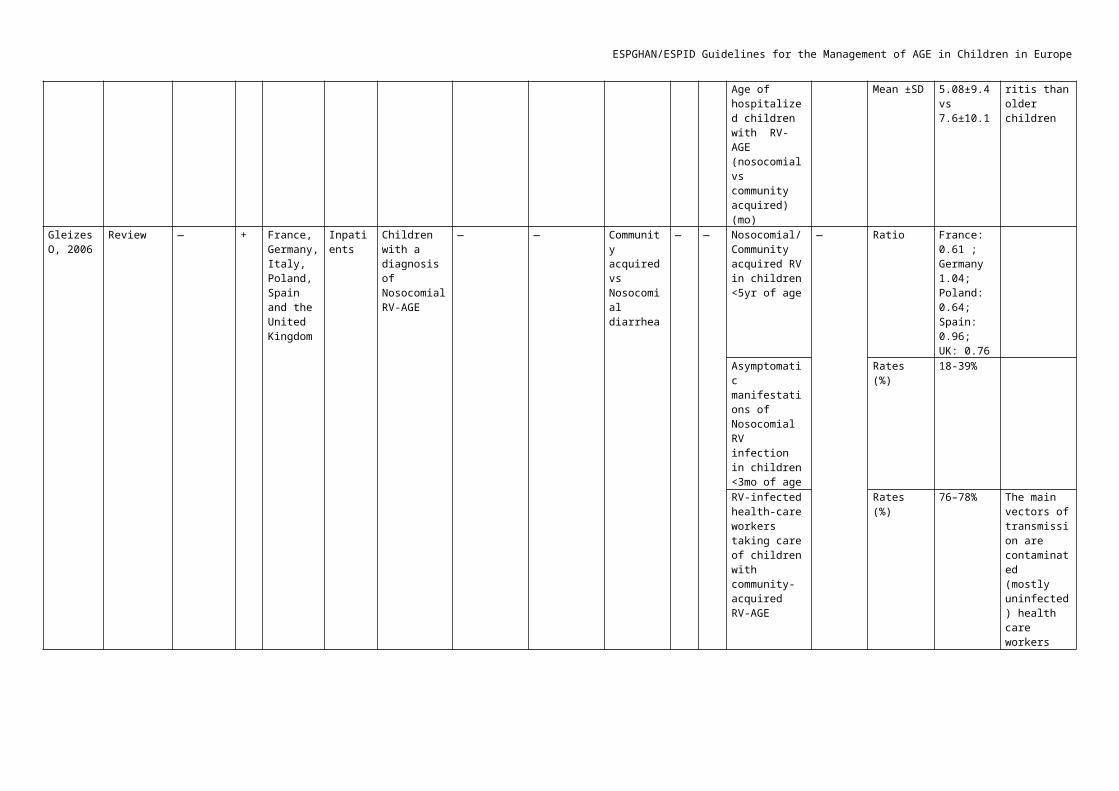
ESPGHAN/ESPID Guidelines for the Management of AGE in Children in Europe
Opintan JA, 2010
Prospective Cross-sectionalAug 2007 to May 2008
Ghana Outpatient NA Children<5y170 AGE104 controls without diarrhea
NA Well nourish vsMalnurished
Etiology of bacterial AGE
Fecal lactoferrin in AGE vs controls
Bacterial agents isolated161/170 AGE80/104 controlsEAEC isolated145/170 diarrhea79/84 controls without diarrhea
f-Lactoferrin, µg/mlChildren with diarrhea, n=1431658.9±204.2Control without diarrhea, n=84935.5±194.4P=0.019
NA Ghana University andPfizer-fundsVirginia UniversityUS
EAEC and cryptosporidium were the most common agents isolated in children with and without diarrhea in this study in children < 5 years from GhanaFecal lactoferrin was significantly elevated in children with diarrhea
Chen CC, 2011
ProspectiveCross-sectionalSept 2008 to May 2010
Taiwan Inpatient NA 117 childrenAge 3.23y(3m-10y)
NA Clinical severity of infectious diarrhea(Vesikari and Clark scores)
Fecal lactoferrin as marker of severity of AGE
AGE etiology41/117 RV28/41 NV31/117 Salmonella17/117 Campylobacter
f-Lactoferrin, µg/gRV 2.82±1.27NV 3.16±1.18Salmonells 11.17±2.73(p<0.05 vs viral)Campylobacter 10.32±2.9(p<0.05 vs viral)
f-Lactoferrin, µg/gSevere AGE 11.32±3.29P<0.05 vs moderate AGEP<0.05 vs mild AGEModerate 3.77±2.08Mild 1.51±1.36
NA Chung Shan HospitalGrants
Fecal lactoferrin is a non-invasive marker able to predict bacterial vs viral infection, and the relative values may be associated with the severity of AGE, corresponding to Vesikari and Clark scores
AGE=acute gastroenteritis; AUC=area under the curve; BGA=bacterial acute gastroenteritis; CRP=C-reactive protein; EAEC=enteroaggregative E coli; fCP=fecal calprotectin; NV=norovirus; RV=rotavirus; VGE= viral acute gastroenteritis.
Table 3.3. Does Any Biochemical Test Change the Approach to the Child With Gastroenteritis? (Biochemistry)

ESPGHAN/ESPID Guidelines for the Management of AGE in Children in Europe
Reference Type of Study Country
InpatientOutpatient
Follow-upn/N
Population Intervention Comparison Outcome measures Results /Effect size Risk of Bias
Source of Funding
Conclusions and Comments
Hayajneh WA, 2010
ProspectiveCross-sectionalJan 2007 to May 2007
Jordan Inpatient NA 251 childrenAGEDehydrationSevere 9%Mild 91%
NA Dehydration severity
Clinical and laboratory associations with severity of dehydration
Severe vs mild dehydration:More hyperNa52% vs 3%, p<0.001More hyperK17% vs 3%, p<0.001Less isoNa39% vs 95%, p<0.001Mean urea,mmol/L16.2 vs 5.5, p<0.001Mean creatinine,µmol/L69 vs 38, p<0.001Mean glucose, mmol/L5.9 vs 4.7, p<0.001
AUC urea0.991 (95%CI 0.98-1.001)P<0.001AUC Natrium0.862 (95% CI 0.74-0.97)P<0.001AUC creatinine0.850 (95%CI 0.75-0.94)P<0.001AUC Kalium0.69 (CI 95% 0.55-0.82)P<0.006AUC glucose0.684 (CI 95% 0.57-0.79)P<0.007
NA None declared
Historical and clinical characteristics in this cohort did not correlate with the degree of dehydrationSerum urea, creatinine, sodium, potassium and glucose were independently correlated with the degree of dehydration.Serum urea performed bestThe results from this study are in conflict with the results from previous studies and AAP and ESPGHAN guidelines

ESPGHAN/ESPID Guidelines for the Management of AGE in Children in Europe
Steiner MJ, 2007
Prospective cohort studyConvenience sample
USA Outpatient ER
Variable 74/79Children AGEAge 17.3m(3-36m)
NA Presence of dehydration
Urine specific gravity, urine ketones and output during rehydration
Urine specific gravity correlation with % dehydrationr=-0.06, p=0.64Urine ketone levels correlation with % dehydrationr=0.08, p=0.52Urine output during rehydrationcorrelation with % dehydrationr=0.01, p=0.96
NA None declared
Elevated urine specific gravity and urine ketones , low urine output were not useful diagnostic tests for the identification of dehydration during the initial assessment of children with AGE
AAP=American Academy of Pediatrics; AGE=acute gastroenteritis; AUC=area under the curve; CI=confidence interval; ER=Emergency room; ESPGHAN= European Society for Paediatric Gastroenterology, Hepatology, and Nutrition.

ESPGHAN/ESPID Guidelines for the Management of AGE in Children in Europe
HOSPITAL MANAGEMENT
Table 4.1. What are the indications for hospitalization?
Reference Study type QoS Country In/OutPatients
Population Randomization Intervention Comparison FU ITT Outcomes measures
Effect measure
Effect size (95% CI)
Comments
Pockett RD, 2011
Retrospective cohort study
+/- UK Inpatients N=1334 children ≤5 yr of age with RV-AGE
— — Correlation with deprivation rank
— — Variation of hospital admissions' rates in relation to the decrease of a deprivation ranking*
Rates from 0.346 to 0.287 per 10,000 (p < 0.001)
Hospital admissions increased as deprivation increased*
*Index of Multiple Deprivation (IMD) 2007 for EnglandKyle RG, 2011
Retrospective study
+ UK Inpatients (ED)
24,481 children under 15 years admitted to ED for breathing difficulty, fever or diarrhoea during 2007/2008.
No No No _ _ Index of Multiple Deprivation
Sperman rho 0.31, p=0.09 There were no statistically significant relationships between the ED admission rate of children admitted for diarrhoea and the Index multiple derivation and its single indicators.
overcrowding Sperman rho 0.21, p=0.267
houses in poor condition
Sperman rho 0.11, p=0.543
air quality Sperman rho 0.16, p=0.387
homelessness Sperman rho 0.14, p=0.439
Freedman SB, 2011
Prospective cohort study
+ Canada Inpatients (ED)
647 children 3-48 months admitted to 11 different ED. Exclusion: children already enrolled in other studies or families that were unavailable/unable to complete telephone follow-up
No No No 398/446 (89%)
_ proportion of children treated with IV rehydration
number and %
149/647 (23%, range 6-66%)
The use of IV rehydration varied dramatically among different institutions. IV rehydration at the index visit was significantly associated with the institution providing care and was not associated with a reduction in the need for follow-up care
risk of readmission after IV therapy in target visit vs no IV therapy
rate 20% vs 9%, p=0.002
Volume of IV fluids range and variation
15-87 ml/kg, p=0.003
Predictors of IV rehydration:
institution location OR (95%CI) 3.0 (1.8 –5.0)
vomiting bile or blood
OR (95%CI) 2.6 (1.2–5.5)
previous physician visit
OR (95%CI) 1.7 (1.0–2.7)
n° vomiting in 24 hours
OR (95%CI) 1.1 (1.0 –1.1) per additional episode
AGE=acute gastroenteritis; ED=Emergency department; OR=odds ratio; QoS=Quality of Study; RV=rotavirus.

ESPGHAN/ESPID Guidelines for the Management of AGE in Children in Europe
Table 4.2. What hygiene and isolation precautions are indicated for a child with AGE?
Reference Studytype
QoS Country In/OutPatients
Population Randomization Intervention Comparison FU ITT Outcomes measures Effect measure
Effect size (95% CI) Comments
Valentini D, 2013 Prospective cohort study
+ Italy Inpatients
N=232 between 1 month and 16 years of age admitted for AGE
— Collection of clinical data and stool samples
Coinfections vs Monoinfections
232/275
— Max. no of diarrhea stools/24 h (≥6)
OR (95%CI)
8.79 (3.32;23.28) p <0.001
Coinfection with different pathogens is associated with a more severe course of symptoms
Duration of diarrhea (days) (≥5)
3.81 (1.47;9.86) p= 0.006
Duration of vomiting (days) (≥3)
7.11 (2.74;18.42) p<0.001
Fever (≥38°) 17.78 (2.32;136.17) p=0.006
Severe dehydration (%)
28.70 (3.04;270.6) p=0.003
AGE=acute gastroenteritis; OR=odds ratio.
Table 4.3. What are the indications for nasogastric rehydration?
Reference Study type QoS Country In/Out Patients
Population Randomization
Intervention Comparison FU ITT Outcomes measures RCT n Effect measure
Effect size(95% CI)
Comments
Freedman SB, 2012
Prospective cross-sectional study
+ Canada Inpatients (ED)
N=434 children aged 3-48 months with AGE; N=113 health care providers
— Phase1: caregivers were asked to complete a survey on nasogastric rehydration (vs IV). Phase 2: data recorded. Phase 3: health-care providers completed a survey
IV rehydration
— — Caregivers who did not believe that IV/NG insertion is easy (NG group vs IV group)
Rates 77% vs 59% (p<0.001)
Most health care providers are unfamiliar with the use of NG rehydration and this treatment choice is in keeping with caregivers desires
Caregivers who did not believe that IV/NG rehydration will replenish fluids (NG group vs IV group)
Rates 11% vs 3% (p<0.001)
Estimated pain with IV/NG insertion according to caregivers ‘perception (0=no pain 100= worst possible pain) (NG group vs IV group)
Interquartiles
80(60-100) vs 70(50-90); p<0.001

ESPGHAN/ESPID Guidelines for the Management of AGE in Children in Europe
Estimated pain with NG insertion according to health-care providers (0=no pain 100= worst possible pain) (Nurses vs Medical staff vs Fellows)
Median±SD 64±18 vs 52±25 vs 50±16; p=0.007
Estimated percentage of vomiting in children rehydrated with NG according to health-care providers (Nurses vs Medical staff vs Fellows)
Median±SD 24±19 vs 11±11 vs 22±20; p=0.001
Estimated percentage of shorter ED stay in children rehydrated with NG according to health-care providers (Nurses vs Medical staff vs Fellows)
Rates 38% vs 56% vs 75%; p<0.001
MA (17 RCTs)
++ High income (USA, Australia, Finland) and low income (Puerto Rico, Egypt, Mexico, Iran, Afghanistan, Colombia,Peru)
Inpatients and Outpatients
N=1811 (most trials included children from 3mo to 5y)
— ORT orally or via NGT (40-50 ml/kg administered in 3-6 h)
IV therapy — — Failure to rehydrate 18(1811) Weighted mean difference (95%CI)
0.04 (0.01 to 0.07)
see GL
Weight gain (g) at discharge
6 (369) Weighted mean difference (95%CI)
-26 (-207 to 154) NS
Percent weight gain (g) at discharge
5 (767) Weighted mean difference (95%CI)
-0.26 (-1.56 to 1.05) NS
Length of hospital stay
6 (526) Weighted mean difference (95%CI)
-1.2 (-2.38 to -0.02) ↓
Incidence of hyponatremia
2 (248) NS
Incidence of hypernatremia
10 (1062)
Weighted mean difference (95%CI)
0.0 (-0.01 to 0.01) NS

ESPGHAN/ESPID Guidelines for the Management of AGE in Children in Europe
Duration of diarrhea (h)
8 (960) Weighted mean difference (95%CI)
-5.9 (-12.7 to -0.89) ↓
Total fluid intake (ml/kg) at 6h
8 (985) Weighted mean difference (95%CI)
32.1 (-26.7 to 90.9) NS
Total fluid intake (ml/kg) at 24h
7 (835) Weighted mean difference (95%CI)
73.45 (-31.8 to 178.7) NS
Phlebytis More often with IVT
Paralytic ileus More often with ORS but NS
Varavithya W, 1978
RCT - Thailand Inpatients N= 22, 4–17 months of age, moderate dehydration
NO Nasogastric Rehydration (150 mL/kg/day - 10–20 mL/kg/h for 2 h, then a costant rate over 22 h)
IV rehydration with 5% dextrose 0.3% Na+ (150 mL/kg/day - 10-20 mL/kg/h for 2h, then a costant rate over 22h)
22/22 Yes Weight gain — Similar weight gain, oral intake, and improvement in laboratory test results between groups; sodium and osmolarity returned to normal without complications in both groups**
Stool lossOral intakeBlood SodiumOsmolaritySerum specific gravity
Hidayat S, 1988
RCT - Indonesia Inpatients N=75 , 1–59 months of age, severe dehydration (WHO)
NO Nasogastric rehydration (WHO standard ORS) 40 ml/kg in the first hour, 30 ml/kg in the second, 20 ml/kg in the third and fourth hours
IV rehydration: lactated Ringer's solution (40 mL/kg X 1h, then 30 mL/kg X 1h, then 20 mL/kg X 2h)
75/75 Yes Weight gain — Rates No difference**
Hourly assessment of degree of dehydration
Rates No difference**
4-h assessment of degree of dehydration
Rates No difference**
Mean hospital stay Mean difference
No difference**
Duration of vomiting Mean difference
No difference**
Pignatelli S, 2000
Prospective cohort
+ Burkina Faso Inpatients N=4131 < 5y of age with acute
— Nasogastric rehydration
— — Yes Increased weight at 4-5 h (%)
— Rates 3717/4131 (90%); p<.001
Safe and effective in the

ESPGHAN/ESPID Guidelines for the Management of AGE in Children in Europe
study diarrhea and severe dehydration
(50-100 mL/kg/day for the first 10 kg of weight and 25 to 50 mL/kg per day for the remaining)
treatment and prevention of dehydration in developing countries
Longer period of infusion (%)
Rates 413/4131 (10%)
Powell CV, 2011
Non-inferiority RCT
+ Australia Inpatients (ED)
N=254 , 6-72 months of age, moderate degree of dehydration (Gorelick)
Appropriate Rapid Nasogastric Rehydration (100 ml/kg ORS in 4 h)
Standard Nasogastric Rehydration (according to the % of weight loss)
207/254
NO Additional loss of >2% compared with admission weight
Rates Difference (95%CI)
2.6% (-5.3% to 10.5%); p=0.524
No differences between groups (Rapid in 4h vs 24 hours) in terms of efficacy and safety. However, even if RNR administered in ED could reduce the need of hospitalization, discharge failed in about one fourth of patients. Limits: ITT is missing; 21/254 patients were lost at FU and no reason provided; single-blinding
Inability to tolerate the insertion of NGT
Rates (95%CI)
0.8% (0-2.4) vs 1.8% (0-4.4); p=0.51
Persistent vomiting Rates (95%CI)
5%(1.0-9.0) vs 2.8%V(0-5.9%); p=0.38
Commencement of IV rehydration
Rates (95%CI)
5.9% (2.9-11.7) vs 4.9% (2.0-10.3); p=0.66
Continued signs of moderate dehydration (>3 clinical signs)
Rates (95%CI)
18.4%v(11.4-25.4) vs 28.4% (19.6-37.2) p=0.08
Need for NGT fluids beyond 24 hours (SNR only)
Rates (95%CI)
9.2% (3.7-14.7)
**Rouhani
AGE=acute gastroenteritis; ED=emergency department; IV=Intravenous; NG=Nasogastric; NGT=Nasogastric tube; NS= Not significant; ORS= Oral Rehydration Solution; QoS=Quality of Study; RNR=rapid nasogastric rehydration; SNR=standard nasogastric rehydration.

ESPGHAN/ESPID Guidelines for the Management of AGE in Children in Europe
4.4. What are the indications for intravenous rehydration?Table 4.4.1 Composition
Reference Study type
QoS Country In/OutPatients
Population Randomization Intervention Comparison FU ITT Outcome measures
Effect measure
Effect size (95% CI)
Comments
Neville KA, 2006 RCT + Australia
Inpatients (ED)
124 children with AGE (62 per group). Exclusion criteria: Renal or pulmonary disease, abnormal ADH secretion, ADH active drugs, pituitary/hypotalamic disease.
Not clearly described
IV rehydration with 0.45% saline in 2.5% dextrose (N/2)
IV rehydration with 0.9% saline in 2.5% dextrose (NS)
102/124
Not clear Change in [Na] mmol/L in hyponatremic patients (N/2 vs NS)
mean (SD) 0.4 (1.7) vs 2.4 (2.0), p=0.003
Hypotonic saline solutions exacerbate the tendency to develop dilutional hyponatremia while isotonic solutions are protective. The maximum decrease in [Na] was of 6mmol/L in the 2 patients treated with rapid hypotonic rehydration
Change in [Na] mmol/L in normonatremic patients (N/2 vs NS)
mean (SD) -2.3 (2.2) vs +0.8 (2.4), p<0.001
[Na] decrease > 2 mmol/L in hyponatremic patients (N/2 vs NS)
prevalence 13% vs 0%
[Na] decrease > 2 mmol/L in normonatremic patients (N/2 vs NS)
prevalence 51% vs 13%
Hanna M, 2010 Retrospective study
+/- USA Inpatients 141 records of patients admitted for AGE having at least two registration of serum electrolytes.
_ 10-40 ml/kg fluids containing 5% dextrose in 0.2, 0.3 or 0.45 % saline.
_ _ _ Development of hyponatremia
prevalence 18/97 (18,5%)
18,5% developed a mild hyponatremia (Na 133,4±0,9 mEq/L)
Han JJ, 2009 RCT +/- Korea Inpatients 33 neonates with acidosis secondary to AGE (Ph<7.25 or BE-15). In addition to
Not clearly described
10 ml/kg of 5% Albumin
10 ml/kg of 0.9% normal saline
33/33 Not reported
Weight gain (Albumin vs normal saline)
mean % of weight gain±SD
5.08±6.33 vs 5.67±5.73, p=NS
No differences either in the pH, BE and HCO3 levels, in the body weight and weight gain 4
Length of stay (Albumin vs normal saline)
mean days±SD
8.13±3.23 vs 9.36±4.16, p=NS

ESPGHAN/ESPID Guidelines for the Management of AGE in Children in Europe
interventions, all patients received maintenance with 5% dexstrose and NaCl 20 mEq/L, correction of acidosis and potassium supplementation.
days after treatment or in the length of hospital stay.
Persistence of acidosis after 3 h rehydration
rate 80% vs 61.1%, p=NS
Levy JA, 2007 Case-control study
+/- USA Inpatients (ED)
56 cases and 112 controls arriving at the ED for dehydration due to AGE. Cases were those children requiring return visit with admission
_ _ _ _ _ Risk of return visit with admission for children receiving no dextrose-containing fluids
OR [95%CI] 3.9 [1.8 to 8.7]
children who received more IV dextrose independently from fluid amount, were less likely to have a return visit requiring admission.
Risk of return visit with admission for children receiving no dextrose-containing fluids, according to fluid amounts
OR [95%CI] <500 mg/kg=3.0 [1.6 to 5.8] <750 mg/kg=3.7 [1.7 to 8.1] <1000 mg/kg= 5 [1.7 to 14.9]
Hoorn EJ, 2004 Observational study
Canada Inpatients 40 children who had a hospital-acquired hyponatremia (Na<136 mmol/L) compared with non-hyponatremic patients who had at least 2 [Na] evaluation during their stay (1:3 ratio)
_ _ _ _ _ Electrolyte free water received (cases vs controls)
2±2 vs 1±1, p=0.001
Cases received 3-fold more elecrolyte free water than controls and had a greater positive fluid balance than the control group (P=0.02). No significant differences related to the underlying disease.
Saba TG, 2011 RCT + Canada Inpatients 59 children (34 surgical and 25 medical, NO AGE) aged 3 months to 18 years admitted to ED for medical or surgical
Adequate IV rehydration with 0.9% Saline in 5% dextrose (Isotonic)
IV rehydration with 0.45% saline in 5% dextrose (Hypotonic)
12/25 medical and 25/34 surgical patients
not performed
Rate of change in [Na]
median [IQR] 0.20[0.03 to 0.4] vs 0.08[-0.15 to 0.16]
The absolute change in [Na] was greater for 0.9% saline group compared with the 0.45% group (+3mmol/L vs +1 mmol/L), but not
Number of patients with decrease in [Na]
number (%) 3 (19%) vs 5 (24%)
Hyponatremia [Na<136]
number (%) 1(6%) vs 1 (5%)

ESPGHAN/ESPID Guidelines for the Management of AGE in Children in Europe
problems. Exclusion criteria: electhrolyte alterations, neurological, cardiac or renal illness, edema and diuretic drugs use.
statistically significant
Hypernatemia [Na>145]
Yung M, 2009 4 arms RCT
+/- Australia
Inpatients (PICU)
50 children admitted to PICU for different reasons (37 surgery, 15 of them ventilated). NO AGE
Adequate Rehydration with 0.9% saline (Isotonic). Subdivision in two groups 1. full maintenance regimen and 2. restricted fluids
Rehydration with 4% dextrose and 0.18% saline (hyposmolar). Subdivision in two groups 1. full maintenance regimen and 2. restricted fluids
50/50 not performed
Overall [Na] fall mean mmol/L 2.3 (+ 4.0) The change in [Na] was significantly affected by fluid type (P = 0.0063) but not fluid rate (P = 0.12). Among surgical patients, there were significantly greater falls in mean [Na] for hyposmolar compared with isosmolar fluids: 4.4 (1.9, 6.8) mmol/L, P = 0.0009
[Na] fall difference (hypotonic vs isotonic)
difference (95%CI) in mmol/L
3.0 (0.8–5.1), p=0.006
[Na] fall difference full (maintenance vs restricted)
difference (95%CI) in mmol/L
1.6 (-0.7, 3.9), p=NS
Akech SO, 2010 Phase II RCT
+ Africa Inpatients children with severe malnutrition and shock, septic shock BUT Not DUE TO AGE .
Isotonic fluids were associated with modest improvement when compared to half-strength Darrow's in 5% dextrose
ADH=Antidiuretic hormone; AGE=acute gastroenteritis; ED=emergency department; IV= intravenous; QoS=Quality of Study SD=standard deviation.

ESPGHAN/ESPID Guidelines for the Management of AGE in Children in Europe
Table 4.4.2. Regimen
Reference Study type QoS Country In/OutPatients
Population Randomization Intervention Comparison FU ITT Outcomes Outcome measure
Effect size (95% CI)
Comments
Freedman SB, 2013
Overview of 4 systematic reviews of RCTs (3 cochrane reviews)
++ High and middle income
In and outpatients
95 unique randomized controlled trials (N=12478)87 randomized controlled trials included subjects < 18 years (N = 10 954)
All studies included in the review were RCTs
Oral rehydration
IV rehydration
- - Length of stay (6 trials = 526 patients)
Mean difference
−1.20 (−2.38 to −0.02)
Complication (phlebitis)
Risk difference
−0.02 (−0.04 to −0.01)
Freedman SB, 2013
RCT + Canada Inpatients (ED)
224 children (114 intervention group vs 110 control group) aged 3 months-11 years with dehydration (CDS>3) due to AGE and no response to ORT. Exclusion criteria: underlying chronic diseases.
Adequate IV rehydration with 60 ml/kg 0.9% saline solution in 1 h followed by 5% dextrose in 0.9% saline at a maintenance rate.
IV rehydration with 20 ml/kg 0.9% saline solution in 1 h followed by 5% dextrose in 0.9% saline at a maintenance rate.
Yes Change in sodium levels (mEq/L) (60mL/Kg vs 20 mL/Kg)
Mean±SD 1.6±2.4 vs 0.9±2.2 (p=0.04)
Large volume IV fluids does not promote the development oh hyponatraemia
Sodium decrease ≥2 mEq/L from 0-4 h
Rates 8/112 (7%) vs 17/105 (16%); (p=0.04)
Sodium increase ≥2 mEq/L from 0-4 h
Rates 59/112 (53%) vs 39/105 (37%); (p=0.02)
Freedman SB, 2011
RCT + Canada Inpatients (ED)
226 children (114 intervention group vs 112 control group) aged 3 months-11 years with dehydration (CDS>3) due to AGE and no response to ORT. Exclusion criteria: underlying chronic dieases.
Adequate IV rehydration with 60 ml/kg 0.9% saline solution in 1 h followed by 5% dextrose in 0.9% saline at a maintenance rate.
IV rehydration with 20 ml/kg 0.9% saline solution in 1 h followed by 5% dextrose in 0.9% saline at a maintenance rate.
Yes Rehydration (CDS<1) within 2 hours after treatment
absolute difference (95%CI), NNT
6.5% (CI 5.7% to 18.7%, p=0.32) NNT=15
Children were moderately dehydrated. No difference in major outcomes between the two treatment arms was found. No relevant benefit of the rapid rehydration regimen. Time to discharge was slightly higher in rapid dehydration group although it did not achieve significance settled at 0.01 (6.3 h vs 5 h, p=0.03)
Prolonged IV treatment
absolute difference (95%CI)
8.9% (CI 21% to -5%, p=0.19)
Clinical dehydration scores
rate p=0.96
Time to discharge
mean time (h)
6.3 h vs 5 h (p=0.03)
Physician comfort to discharge within 4 hours (Rapid vs standard group)
5 point Likert scale
61(54) vs 74 (66), p=0.06
Nager AL, 2010
RCT + USA Inpatients (ED)
88 children aged 3-36 months with moderate dehydration due
Adequate IV rehydration with 50 ml/kg 0.9% saline in 1 h
IV rehydration with 50 ml/kg 0.9%
88/88
No mean weight (g) gain (% of weight), rapid vs standard group
Mean (%) 474 (4.2%) vs 408 (3.8%), p=0.34
Early discharge for cases (2 h vs 4 h). No difference between the two groups for all the outcomes.

ESPGHAN/ESPID Guidelines for the Management of AGE in Children in Europe
to AGE. Exclusion criteria: electrolyte alteration, severe dehydration/shock, surgical conditions.
saline in 3 h Return visits Frequency (95%CI)
15.6%(6.5 to 29.5) rapid vs 14% (5.3 to 28), p=0.99
Electrolyte alteration
single values NS difference
Freedman SB, 2011
Prospective cohort study
+ Canada Inpatients (ED)
647 children 3-48 months admitted to 11 different EDs. Exclusion criteria: children already enrolled in other studies or families that were unavailable/unable to complete telephone follow-up
No No No 398/446 (89%)
_ proportion of children treated with IV rehydration
number and %
149/647 (23%, range 6-66%)
The use of IV rehydration varied dramatically among different institutions. The volume of IV fluids administered also varied according to site (P .003), with a range between 15 and 87 ml/kg).
Frequency of readmission in patients undergoing IV therapy vs no IV therapy
rate 20% vs 9%, p=0.002
Volume of IV fluids
range and variation
15 -87 ml/kg, p=0.003
Predictors of IV rehydration:institution location
OR (95%CI) 3.0 (1.8 –5.0)
bilious or bloody vomiting
OR (95%CI) 2.6 (1.2–5.5)
previous physician visit
OR (95%CI) 1.7 (1.0–2.7)
n° vomiting in 24 h
OR (95%CI) 1.1 (1.0 –1.1) per additional episode
Moineau G, 1990
Prospective Cohort study
- Canada Inpatients (ED)
17 children with isonatremic mild-to-moderate dehydration due to AGE, aged 1-6 years
No 30 ml/kg 3.3% dextrose + 0.3% saline over 3 h
_ 17/17
no No patients required hospitalization. Only one patient required a new course of rapid IV rehydration.
Success of treatment at 4 hours (defined as resolution of dehydration, weight gain, correction of urine output, absence of severe emesis)
percentage of responders and risk difference
ORT 55.6% vs IV 56.8%, RD= -1.2% [95%CI -24% to 21.6%]
Initiating treatment with ORT was quicker than with IVT. ORT gained less weight than IVT

ESPGHAN/ESPID Guidelines for the Management of AGE in Children in Europe
Spandorfer PR, 2005
RCT + USA Inpatients (ED)
73 children (ORT 36 vs IV 37) aged < 3 years (mean age 15 m) with moderate dehydration (Gorelick score) secondary to AGE. Exclusion criteria: hypotention, diarrhea > 5 d, chronic illnesses, malnutrition
Adequate Oral rehydration with 50 ml/Kg (for dehydration score 3,4,5) or 75 ml/Kg (for score >6) hyposmolar ORS
IV rehydration with 2 bolus of 20ml/Kg saline solution in 1 h. Then oral rehydration for 3 h
67/73 (3 ORT, 3 IVT)
yes Time to initiate therapy
time and difference [95%CI]
ORT 15 min vs IV 36 min, RD 21.2 [CI 10.3 to 32.1]
Improvement of dehydration after 2 h
% of responders and difference
ORT 78.8% vs IV 80%, RD -1.2% [95%CI -20.5% to 18%]
Hospitalization rate
rate ORT 30.1% vs IV 48.7%, RD -18.1% [-40.1% to 4%]
Phin SJ, 2003 Prospective study with historical controls
+/- Australia Inpatients (ED)
145 children aged 6 months to 16 years, with AGE < 48h prospectively enrolled, 170 historic controls. Exclusion criteria: bloody stools, bilious vomiting, chronic medical conditions.
_ Pathway including oral administration of fluids in 1 h followed by 20 ml/kg/h of 0.45% + 2.5% dextrose or Gastrolyte per NGT.
Hystoric pathway, IV rehydration over 24 h and NGT rarely used.
_ _ discharge in 8 h (mild dehydration)
rate 61.3% vs 72.7%, p=NS
rapid rehydration in children moderately dehydrated is effective in reducing admission rate and lengths of stay in ED
discharge in 8 h (moderate dehydration)
rate 44.2% vs 3.7%, p<0.001
admission rate (mild dehydration)
rate 26.9% vs 25.9%, p=NS
admission rate (moderate dehydration)
rate 55.8% vs 96.3%, p<0.001
procedure rate (mild dehydration)
rate 62.4% vs 23.9%, p<0.001
procedure rate (moderate dehydration)
rate 94.2% vs 88.9%, p=NS
Reid SR, 1996 Prospective cohort study
USA Inpatients (ED)
58 patients aged 6 months to 13 years (median age 22 months) with moderate dehydration
_ 20-30 ml/kg isotonic cristalloid solution IV in 1-2 h followed by 30-90 ml of ORT
_ _ _ All patients demonstrated improvement of hydration degree. 28% did not tolerate ORT and were admitted to continue IVT. No complications were registered during IVT.
AGE=acute gastroenteritis; ED=emergency department; IVT=Intravenous therapy; NGT=Nasogastric tube; ORS= Oral Rehydration Solution; ORT=Oral rehydration therapy; QoS=Quality of Study.

ESPGHAN/ESPID Guidelines for the Management of AGE in Children in Europe
Table 4.4.3. Treatment of hypernatremia
Reference Study type QoS Country In/Out Patients
Population Randomization Intervention Comparison FU ITT Outcomes measures
Effect measure
Effect size (95% CI)
Comments
El-Bayoumi MA, 2012
Retrospective study
+ Egypt Inpatients (PICU)
48 children (mean age 21.8 m) with AGE and hypernatremic dehydration [Na]>150 (mean 163 mmol/L). Exclusion criteria: renal failure and diseases
_ No Intervention. Rehydration regimen: Fluid bolus of 20ml/kg 0.9% saline in 20 min followed by 48h infusion of 25-50 ml/kg/day of 0.9% saline in 5% dextrose. Velocity was 4 ml/kg/h first 10 Kg, 2 ml/kg/h 10-20 kg and 1ml/kg/h above 20 kg.
_ _ _ risk of mortality in children receiving > 40 ml/kg initial fluid bolus
OR (95%CI) 3.3 (1.5 to 7.2)
Serum Na should be lowered slowly with rate of 0.5mEq/L/h. No difference in [Na] between children who presented seizures and not.
risk of seizures rate 6.3%Hourly delta of Na 0-6 h
mean delta (mEq/L/h)
0.58 seizures vs 0.52 not (p=0.08)
Hourly delta of Na 0-24 h
mean delta (mEq/L/h)
0.65 seizures vs 0.51 not (p=0.02)
Hourly delta of Na 6-24 h
mean delta (mEq/L/h)
0.63 seizures vs 0.51 not (p=0.037)
Robertson G, 2007
Retrospective study
South Africa
Inpatients (PICU)
57 children with hypernatremia (Na>145, meadian 165 mmol/L)
_ No intervention: Maintenance according to Holliday-Segar + 50 ml/kg/day for moderately dehydrated children and 100 ml/kg/day for severely dehydrated with half Darrow's Dexstrose (5% dexstrose and 61 mEq/L Na)
_ _ _ Median rate of Na fall
velocity mmol/L/h
0.6 The majority of children in this study received a hypotonic IV infusion containing 61 mmol/L sodium. Although univariate analysis demonstrated a non-significant trend towards a more rapid fall in serum sodium in children who received solutions containing <61 mmol/L of sodium, this was not associated with a difference in outcome.
Incidence of seizures (fall <0.6 group vs >0.6 mmol/L/h group)
p=0.43
Incidence of adverse event (fall <0.6 group vs >0.6 mmol/L/h group)
p=0.31
Mortality Percentage 7%Sharifi J, 1985
RCT +/- Iran Inpatients (PICU)
470 children aged 1-18 months admitted for severe AGE
Not appropriately described
NGT rehydration 40 ml/kg/h (max 400 ml/h) ORS for 6 h followed by maintenance per os or NGT with hypotonic ORS
IV 20-30 ml/Kg/h Ringer Solution followed by maintenance fluids for 48 h
No Seizures in hypernatremic patients treated with NGT vs IV rehydration
rate (%) 2/34 (6%) vs 6/24 (25%), p=0.05
ORT through NGT is successful in treating severe dehydration due to AGE and superior to IV therapy in reducing the complications associated with the treatment of hypernatremia. Methodological limitations: protocol, randomization and allocation concealment not described.
AGE=acute gastroenteritis; NGT=Nasogastric tube; ORS=oral rehydration solution; QoS=Quality of Study.

ESPGHAN/ESPID Guidelines for the Management of AGE in Children in Europe
Table 4.5. When to discharge a child admitted because of gastroenteritis
Reference Study type QoS Country In/OutPatients Population Randomization Intervention Comparison FU ITT Outcomes measures
Effect measure Effect size (95% CI)
Comments
Patel B, 2009 Intervention study
+/- US ED Patients aged 3 months to 18 years with
No Written discharge instructions reinforced verbally by the bilingual discharge facilitator
Standard discharge group vs intervention group
_ No Recall of 7 warning signs and symptoms assessed 24 to 48 hours after the ED visit (English speakers)
Mean (95%CI) 3.5 (3.26-3.78) vs 4.1 (3.83-4.43)
Verbal reinforcement of written discharge instructions by a bilingual DF improves parental recall of discharge instructions for gastroenteritis.Recall of 7 warning
signs and symptoms assessed 24 to 48 hours after the ED visit (Spanish speakers)
Mean (95%CI) 3 (2.67-3.36) vs 4.5 (4.18-4.88)
Callery P, 2010 Retrospective
+ UK Inpatients (ED) All children under 15 years of age discharged following emergency admission for breathing difficulty, feverish illness and/or diarrhea during 2005/2006 (n=20,354) or 2006/2007 (n=23,018)
No No No No No Rate of readmission after same day discharge The total number of admissions to hospital in the year was associated with its readmission rate (Kendall's tau(b)=0.71, p=0.002). Variations between hospitals suggest that other factors can also affect readmission rates.
Overall Kendall's tau 0,61, p=0,007
Respiratory illnesses Kendall's tau 0,83, p<0,001
Feverish illnesses Kendall's tau 0,50, p=0,023
Acute diarrhea Kendall's tau 0,37, p=0,098
DF= discharge facilitator; ED=emergency department; QoS=Quality of Study.

ESPGHAN/ESPID Guidelines for the Management of AGE in Children in Europe
Table 4.6. Can any therapeutic intervention reduce the length of hospital stay?Reference Study
typeQoS Country In/OutPatients Population Randomization Intervention Comparison FU ITT Outcomes
measuresRCT (n/N)
Effect measure
Effect size (95% CI)
Comments
Dupont C, 2009 RCT + Peru and Malaysia
Outpatients and Inpatients
N=602 (1-36 mo)
DB Smectite (6-12 g)
Placebo. - Yes Duration of diarrhea (hours)
- - - Peru: lower 72-hour cumulative stool output (P=0.032); shorter duration of diarrhea (P=0.001).Malaysia: lower 72-hour stool output (P=0.007); shorter duration of diarrhea (P=0.001).
Mujawar QM, 2012
RCT +/- India ED N=117 (2-5 y) with AGE.
Single blinded Diosmectite (4.5 g/d for 5 d)
no intervention
- - Duration of diarrhea
- - - Shorter time for resolution of diarrhea (P<0.001).
Lehert P, 2011 MA ++ high- or middle-income countries
Outpatients and Inpatients
(9 RCTs, n=1384, 1 mo- 15 y)
Heterogeneous Racecadotril (typically 1.5 mg/kg TID)
placebo or equivalent (in particular, kaolin-pectin)
- - Patients with recovery defined as patients with a diarrhea duration of less than 2 days
9 HR (95%CI) 2.04 (1.85 to 2.32)P<0.001
Proven effective in reducing the duration of symptoms in children with AGE
Macgillivray S, 2013
MA ++ high- or middle-income countries
Inpatients (1 outpatient)
N= 2973 children aged two months to 59Months (29 RCT)
Heterogeneous Lactose-free milk, milk products, or foodstuffs
Lactose-containing milk, milk products, or foodstuffs
- Yes Duration of diarrhea (hours)
16/29 Mean difference (range)
-17.77(25.32 to 10.21) vs (28.8 to 230)
In young children with acute diarrhea who are not predominantly breast-fed, change to a lactose-free diet may result in earlier resolutionof acute diarrhea and reduce treatment failure. Diluting lactose-containing formulas may also have some benefits but further trials arerequired to have confidence in this finding. However data were different in outpatients setting.
Treatment failure 18/29 Relative effect(95% CI)
0.52(0.39 to 0.68)
Need for hospitalization
1/29 Relative effect(95% CI)
0.79(0.09 to 6.65)
Szajewska H, 2013
MA ++ High income (Europe) and low income
In and outpatients
N= 2963patients (1603 in the experimental group and 1360 inthe control group) 15 studies
5 unclear Dailydoses of LGG ranging from 1.2 x 10⁸ CFU to 2 x 10¹² CFU in additionto rehydration therapy
Placebo (10) _ Yes Duration of diarrhea in days. (High dose and low dose).
12/15 Mean (95%CI)
–1.11 [–1.91, –0.31] and –0.90 [–2.50, 0.69]
LGG reduces the duration of diarrhea either in terms of days and hospitalization
Duration of diarrhea in days. Setting (Europe and non-Europe).
11/15 Mean (95%CI)
–1.27 [–2.04, –0.49]
and –0.87 [–1.81, 0.08]
Hospitalization in days.
4/15 Mean (95%CI)
–1.42 [–3.05, 0.21]

ESPGHAN/ESPID Guidelines for the Management of AGE in Children in Europe
Dinleyici EC, 2012
MA ++ high- or middle-income countries
Inpatients 13 RCTs Heterogeneous S boulardii Placebo or no intervention
Yes Yes Duration of hospitalization
n=449 Mean difference (95%CI)
-0.84 (-1.14 to -0.54)
administration of this probiotic strain may reduce the duration of hospitalization in inpatient children
Freedman SB, 2013
Overview of 4 systematic reviews of RCTs (3 cochrane reviews)
++ High and middle income
In and outpatients
95 unique randomized controlled trials (N=12478)87 randomized controlled trials included subjects < 18 years (N = 10 954)
All studies included in the review were RCTs
Probiotics Oral rehydration
- - Length of stay 10 trials = 1932 patients
Mean difference
−1.12 (−1.16 to −0.38)
Piescik-Lech M, 2013
RCT + LGG (6 x 10⁹) plus scmectite
LGG plus Placebo
81/87
Yes Duration of intravenous therapy after randomization,days
- Median (range)
1 (0–1) vs 1 (0–3) p=0.02
LGG plus smectite andLGG alone are equally effective for treating young childrenwith AGE. Combined use of the two interventions is notjustified.
Duration of hospitalization after randomization,days
No difference
Vomiting, number No difference
Need for hospitalization
Number (%) No difference
Rautenberg TA, 2012
cost utility analysis
+ UK Outpatients 10 individual studies, 2 SR and 2 MA
- Racecadotril + ORS
ORS - - Total incremental QALY gain
Probabilistic sensitivity analysis
+0.0008 Considering the bestavailable evidence, racecadotril is cost effective in the treatment of AGE in children
Drug cost Cost results £12.17 vs £3.03
Primary care £51.12 vs £62.64
Secondary care £40.20 vs £416.82
Adverse events £0.35 vs £0.46
Total mean cost per patient
£103.84 vs £482.95
AGE=acute gastroenteritis; LGG= Lactobacillus rhamnosus GG; ORS=Oral rehydration solution; QALY=quality adjusted life year.

ESPGHAN/ESPID Guidelines for the Management of AGE in Children in Europe
TREATMENT
Table 5.1. Rehydration
Reference Intervention Randomization Allocation concealment Blinding ITT analysis Population Main results(experimental group vs. control group)
Santucci KA, 1998
Frozen solution (FS) (Revital-ICE, PTS Labs, Deerfield, Ill) vs conventional glucose electrolyte solution (CS)
Prospective controlled crossover trial. N=91 (6 months to 13 years of age) children with AGE seen in pediatric ED
Children with mild or moderate dehydration are more likely to tolerate FS than CS. Conventional solution failures crossed over to FS had a greater tolerance rate than the reverse.
Freedman SB, 2012
ORS with improved taste
2 sucralose-sweetened ORSs vs. rice syrup solid ORS
Adequate Adequate DB + N=66 (5-10 y), healthy children
Sucralose-sweetened ORSs significantly more palatable (P<0.001).
Diez-Gandia A, 2010
4 ORSs (cola, strawberry, fruit, neutral)
Adequate No Single-blinded Yes N=116 (6-9 y), healthy children
Preference for cola (rated as good or really good by 87.9%) and strawberry flavor (62.1%).
Piescik-Lech M, 2012
Apple taste ORS vs. regular taste ORS
Adequate Adequate DB No (ACA) N=130 (4-48 mo) children with AGE
Similar resolution of signs of dehydration (P=0.28), adequate weight gain (P=0.48), urine production at 24 h (P=0.95).
Wadhwa N, 2011
ORS with zinc ORS with vs. ORS without zinc (40 mg/L)
Adequate Adequate DB Yes N=500 (boys, 1-35 mo)
Similar stool output (P=0.25); no difference or reduction in recovery time (HR 1.06, 95%CI 0.88 to 1.27).
Passariello A, 2011
ORS with zinc and prebiotics
ORS with zinc (1 mmol/L) & prebiotics vs. standard ORS
Adequate Adequate SB Yes N=119 (3-36 mo) Higher resolution of diarrhea at 72 h (P=0.01); reduced number of daily outputs at 24 h (P=0.002).
Gregorio GV, 2009
ORS with polymers
Polymer-based ORS vs. glucose-based ORS
Of the 34 trials, the methods used to generate the allocation sequence were adequate (computer-generated or random-numbers table) in 24 trials and unclear in the remaining 10 trials. Less than half of the trials (12) used an adequate method to conceal allocation. The method was unclear in the other 22 trials.Blinding of the participants, providers, and assessors was only done in three trials. Blinding was difficult or impossible in most trials because of the difference in the appearance of the ORS formulation after reconstitution.All but two trials included an adequate (> 90%) number of randomized participants in the analysis. The number was assessed as inadequate in two trials.
MA (34 RCTs, n=4214; 27 RCTs in children)
Fewer unscheduled intravenous infusions in the polymer-based ORS group compared with glucose-based ORS (ORS ≥ 310 and ≤ 270 groups combined) (RR 0.75, 95% CI 0.59 to 0.95; 2235 participants, 19 trials).
Wheat-based ORS resulted in lower total stool output in the first 24 hours compared with ORS ≤ 270 (MD -119.85 g/kg, SD -114.73 to -124.97; 129 participants, 2 trials). Adverse effects were similar for polymer-based ORS and glucose-based ORS.
Alam NH, 2011
ORS with L-isoleucine
ORS with vs. ORS without L-isoleucine (2 g/L)
Adequate Adequate DB Yes N=50 (boys, 6-36 mo)
Reduced stool output on day 3 (P=0.03); smaller ORS intake on day 1 (P=0.04); similar duration of diarrhea (P=0.96).
Abdulrhman et al. 2010 *
ORS with honey
ORS with vs. ORS without honey
N=100 (aged approx. 1.3 y)
Reduction in vomiting (P<0.001) and diarrhea frequency (P<0.05).
*Article not entirely accessedEsteban Carretero J, 2009
Gelatin tannate + ORS
Gelatin tannate + ORS vs ORS alone
No – observational study - - No 239 children aged 3 months to 12 years with AGE (mean age 2.3 y)
Stool decrease index ORS-0.1894 vs ORS + gelatin tannate -0.6023 (p<0.0001). The two groups of treatment differ at baseline with controls having more stools per day.
AGE=acute gastroenteritis; ORS=Oral rehydration solution.

ESPGHAN/ESPID Guidelines for the Management of AGE in Children in Europe
Table 5.2. Nutritional management
Reference Type of Study
Country In/OutPatients
FU n/N Population Intervention Comparison Outcome measures
Results /Effect size
Risk of Bias Source of Funding
Conclusions and CommentsRandomization Allocation
ConcealmentBlinding ITT
Gregorio GV, 2011
Systematic review
16 countries Europe, USA, Africa, Asia
10 trials Inpatient 2 trials Outpatient
Variable 12 trials, 1226 children AGE 0-5 years 724 early 502 late refeeding
Early refeeding < 12h vs Late refeeding >12h Different feedings
Efficacy and Adverse effects
Primary: Duration of diarrhea (7 Secondary: Stool output Weight gain IV fluids Vomiting
Early vs Late Refeeding Duration of diarrhea 7/12 trials, 685 particip MD -6.90 h,CI -18.70 to 4.91 Unscheduled IV fluids 6/12 trials, 813 particip RR 0.87, CI 0.48 to -1.59 Stool output 24-48h 3/12 trials No difference Weight gain after 24h 3/12 trials No difference Vomiting 5/12, 456 participants RR 1.16, CI 0.72 to 1.86
All studies were RCT
Yes – 2 studies Unclear -10 studies
No – 11 studies Yes – 1 study, single blinding
Yes, for all outcomes – 5 trials Yes, for some outcomes – 7 trials
Different sources: Industry Academic WHO
The present meta-analysis did not provide evidence that early refeeding increases unscheduled use of IV fluids, episodes of vomiting, and development of persistent diarrhea. The results support existing practice of early refeeding during or after start of rehydration of patients. No conclusion could be made regarding the duration of diarrhea.

ESPGHAN/ESPID Guidelines for the Management of AGE in Children in Europe
Saneian H, 2012
Prospective controlled trial Jan 2009 to Aug 2009
Iran Outpatient
7 days 71 Children AGE Mean age 7.1±3.7m 1-24 months Formula fed
Refeeding with Lactose-free vs Lactose containing formula
Advantages of refeeding lactose-free formula
Time to relief from diarrhea
Diarrhea relief, days Lactose-free vs lactose 1.7±0.7 vs 2.6±0.7 95%CI 1.5 to 3.9, p<0.001 P<0.001
No NA NA Not reported
Isfahan University Grant
Early administration of lactose-free formula for formula fed children presenting with AGE can result in a more rapid relief of diarrhea However there were baseline differences between the groups (more days with diarrhea in the intervention group,p=0.047, more severe dehydration in the control, p=0.015)
Rabbani GH, 2009
DB-RCT Sept 2004 to May 2005
Bangladesh
Inpatient 73 Children Shigella AGE 6-60m All treated Ciprofloxacin
Cooked green addition of banana (GB) 250g/L in children with Shigellosis
Effect on diarrhea severity
Success rate
Effect of GB on stools: Reduction of volume Reduction of numbers/d Clearance of blood, mucus Reduction of fever Reduction of ORS volume GB vs control Clinical success 85.3% vs 66.7%, p=0.001 Clinical failure 14.7% vs 33.6%, p= 0.05
Yes- computer generated random number
Yes-Investigators and patients
Yes- Investigators and patients
Not reported
None declared
GB diet improved clinical severity of childhood Shigellosis and can use as a simple and useful adjunct for dietary management of AGE Shigellosis

ESPGHAN/ESPID Guidelines for the Management of AGE in Children in Europe
Macgillivray S, 2013
MA ++ high- or middle-income countries
Inpatients (1 outpatient)
N= 2973 children aged two months to 59 Months (29 RCT)
Lactose-free milk, milk products, or foodstuffs
Lactose-containing milk, milk products, or foodstuffs
Duration of diarrhea (hours)
Mean difference (range): -17.77 (25.32 to 10.21) vs (28.8 to 230)
Yes Heterogeneous
Heterogeneous
Yes University of Dundee, UK. Hull York Medical School and NIHR Centre for Reviews and Dissemination, University of York, UK. Tenovus Scotland, UK.
In young children with acute diarrhea who are not predominantly breast-fed, change to a lactose-free diet may result in earlier resolution of acute diarrhea and reduce treatment failure. Diluting lactose-containing formulas may also have some benefits but further trials are required to have confidence in this finding. However data were different in outpatients setting.
Treatment failure
Relative effect(95% CI) 0.52(0.39 to 0.68)
Need for hospitalization
Relative effect(95% CI) 0.79(0.09 to 6.65)
AGE=acute gastroenteritis; NIHR=National Institute for Health Research; ORS=Oral rehydration solution.
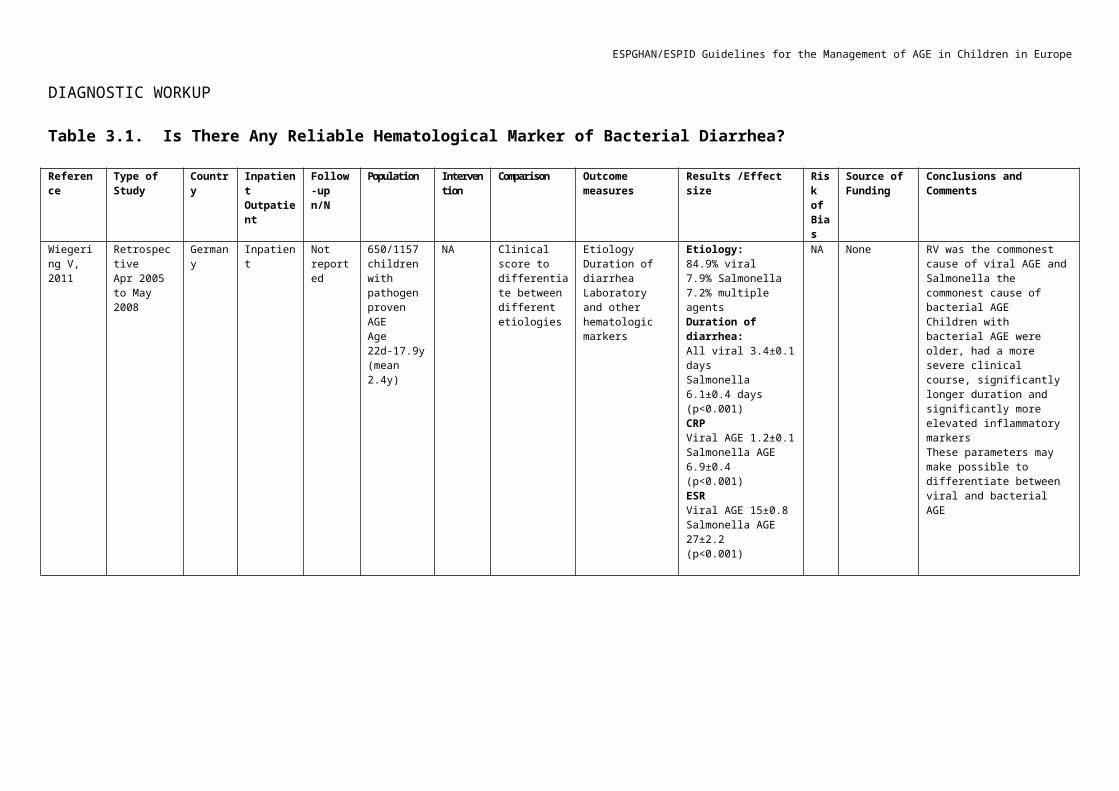
ESPGHAN/ESPID Guidelines for the Management of AGE in Children in Europe
Table 5.3. Pharmacological Therapy
Reference Intervention Randomization Allocation concealment
Blinding ITT analysis Population Main results(experimental group vs. control group)
Freedman SB, 2013
Antiemetics Ondansetron vs. placebo. All studies included in the review were RCTs 95 unique randomized controlled trials (N=12478)87 randomized controlled trials included subjects < 18 years (N = 10 954)
Rate of admission to hospital (during ED stay) Relative Risk and NNT: 0.40 (0.19 to 0.83),NNT= 17 (13-60).Rate of IV rehydration (during ED stay) Relative Risk and NNT: 0.41 (0.29 to 0.59),NNT= 5 (4-8).Revisit rate ewlative risk: 0.09 (0.66 to 1.79)
DeCamp LR, 2008
Ondansetron (oral: 2-8 mg; 1.6-4 mg; IV: 0.15-0.3 mg/kg) vs. placebo.
Validity assessment was undertaken using two scales and a summary score was calculated. The two scales used were the Downs and Black checklist (maximum score 31) and the Delphi List (maximum score 9). Validity assessment was undertaken by two independent reviewers.
MA (6 RCTs, n=745, 1 mo-12 y with vomiting and AGE)
Reduced risk of persistent vomiting (RR 0.45, 95% CI 0.33 to 0.62; NNT 5); reduced need for IV therapy (RR 0.41, 95% CI 0.28 to 0.62, NNT 5); and reduced risk of immediate hospital admission (RR 0.52, 95% CI 0.27 to 0.95, NNT 14). Increased diarrheal episodes (3 RCTs, data not pooled). No effect on return to care (RR 1.34, 95% CI 0.77 to 2.35).
Carter B, 2012
Ondansetron (oral: 2-8 mg; IV: 0.15-0.3 mg/kg) vs. placebo
Quality of the evidence (GRADE) as assessed by the authors – low to moderate (depending on the outcome) due to design limitation (risk of bias) and/or inconsistency due to possible change of effect of intervention over time and inconsistent follow up.
MA (7 RCTs, n=760, <18 y with vomiting and AGE)
Increased cessation of vomiting: (oral administration: 4 RCTs, RR 1.44, 95% CI 1.29 to 1.61; IV administration: 3 RCTs, RR 2.01, 95% CI 1.49 to 2.71; NNT 3). Reduced need for IV therapy: (oral administration, 4 RCTs, RR 0.41, 95% CI 0.29 to 0.59; NNT 5). Increased number of episodes of diarrhea (P<0.05).
Gouin S, 2012 Dimenhydrinate (oral: dosage of 1 mg/kg per dose every 6 hours for 4 doses, with a maximum dose of 200 mg/day) vs placebo
Adequate Adequate DB No N=152 (76 cases and 76 controls)
The prescription of oral dimenhydrinate did not significantly decrease the frequency of vomiting in children with acute gastroenteritis compared with placebo.
Kita F, 2012 Domperidone plus ORS vs ORS alone
Adequate N=56 (24controls) It appears that domperidone in combination with ORT in the treatment of acute gastroenteritis does not reduce vomiting in the early period.
Lehert P, 2011
Racecadotril Racecadotril (typically 1.5 mg/kg TID) vs. placebo or equivalent (in particular, kaolin-pectin)
The methodological quality of each study was assessed usingChalmers scale (including sequence generation, allocation concealment, adequacy of blinding and handling of incomplete outcome data). Included studies were of various methodological quality.
MA (9 RCTs, n=1384, 1 mo- 15 y)
Higher proportion of patients with recovery defined as patients with a diarrhea duration of less than 2 days (HR 2.04, 95%CI 1.85 to 2.32; P<0.001).Reduced mean stool output in inpatients (HR 0.59, 95%CI 0.51 to 0.74; P<0.001).Reduced mean number of diarrheal stools in outpatients (HR 0.63, 95%CI 0.51 to 0.74; P<0.001).
Dupont C, 2009
Smectite Smectite (6-12 g) vs. placebo. Adequate Unclear DB Per protocol analysis
N=602 (1-36 mo) Peru: lower 72-hour cumulative stool output (P=0.032); shorter duration of diarrhea (P=0.001).Malaysia: lower 72-hour stool output (P=0.007); shorter duration of diarrhea (P=0.001).
Mujawar QM, 2012
Diosmectite (4.5 g/d for 5 d)vs. no intervention
Adequate Unclear Single blinded
? N=117 (2-5 y) with AGE.
Shorter time for resolution of diarrhea (P<0.001).
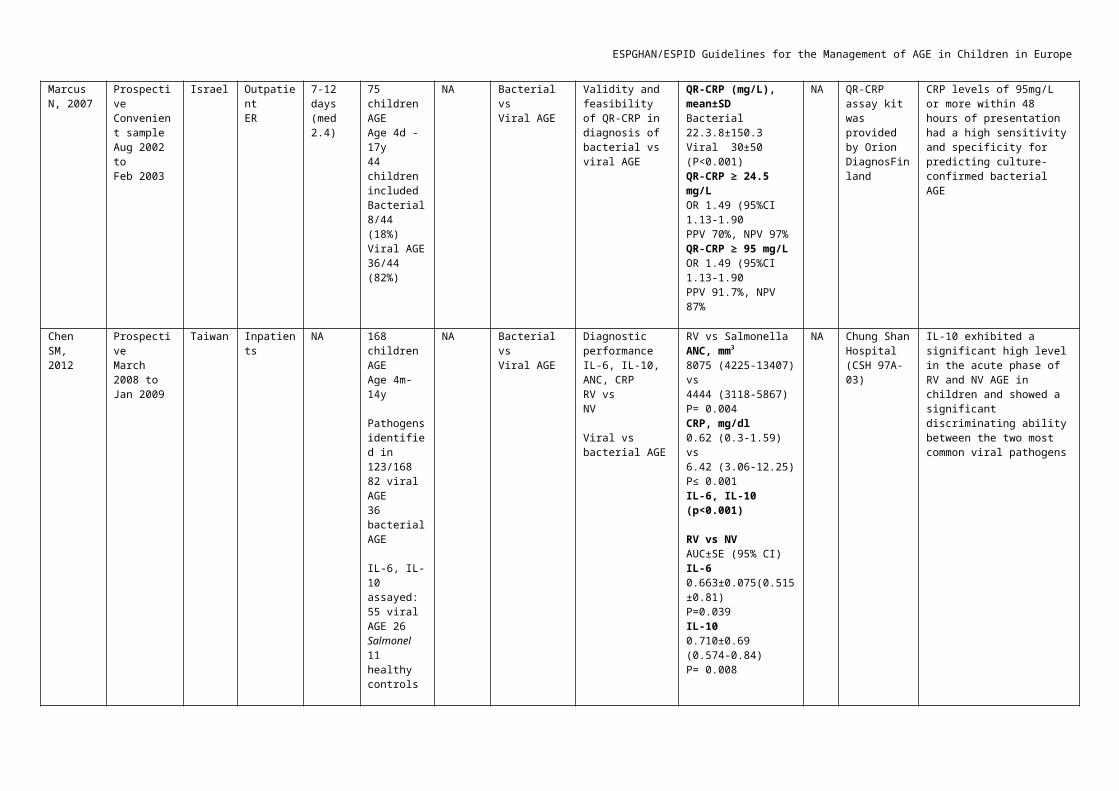
ESPGHAN/ESPID Guidelines for the Management of AGE in Children in Europe
Patro B, 2008 Zinc Zinc vs. placebo or zinc in other dose or no intervention
Key criteria assessed included the adequacy of allocation concealment, blinding (investigators, participants, outcome assessors and data analysts), ITT analysis and completeness of follow‐up. Study quality was reported to be high.
MA (18 RCTs, n=11,180 with AGE, <5y)
Reduced duration of diarrhea (13 RCTs, n=5643, MD -0.7 day; 95% CI -0.97 to -0.40).Reduced the risk of diarrhea lasting >7days (8 RCTs, n=5769, RR 0.71; 95% CI 0.53–0.96).Increased chance of vomiting (5 RCTs, n=3156, RR 1.2; 95% CI 1.05–1.4).
Patel A, 2010 Zinc vs. placebo or no intervention
No report of the formal assessment of the risk of bias in included trials. MA (26 RCTs, n=20,480)
Shorter duration of diarrhea (19 RCTs; n=8957; shortened by 19.7%; 95% CI 11.9% to 27.4%).Increased chance of vomiting (10 RCTs; n=6779; OR 2.13; 95%CI 1.37-3.31).No effect on stool frequency and stool output.
Lazzerini M, 2012
Zinc vs. placebo Quality of the evidence (GRADE) as assessed by the authors – very low (death; hospitalization); low (duration of diarrhea all trials); moderate (diarrhea on day 7); high (duration of diarrhea in trials limited to children with signs of moderate malnutrition; adverse events).
MA (24 RCTs, n=9128, age 1 mo- 5 y)
Reduced duration of diarrhea in children > 6 mo (MD -10 h; 95%CI -21.12 to 0.25).Reduced duration of diarrhea in malnourished children (MD -27 h; 95%CI -14.7 to -39).
Allen SJ, 2010 Probiotics(as a group)
Probiotics vs. placebo or no intervention.
The methodological quality (i.e. generation of allocation sequence, allocation concealment, blinding, and loss to follow) varied considerably. Twenty-three studies were considered adequatefor generation of the allocation sequence, 15 for concealment of allocation, 35 for blinding and 45 for loss to follow up. Ten studies were adequate for all of the four methodological quality assessmentparameters and five studies were inadequate for all four parameters.
MA (63 RCTs, n=8014)
Reduced duration of diarrhea (35 RCTs, n=4555; MD -25 h; 95% CI 16 to 34); reduced risk of diarrhea lasting ≥4 days (29 RCTs, n=2853, RR 0.41, 95% CI 0.32 to 0.53).
Allen SJ, 2010 Lactobacillus GG Lactobacillus GG vs. placebo or no intervention
See above MA, 11 RCTs, n=2072
Reduced duration of diarrhea (MD -26.69; 95%CI -40.5 to -12.88), mean stool frequency on day 2 (6 RCTs, n=1335; MD -0.76, 95%CI -1.32 to -0.2), and the risk of diarrhea lasting ≥4 days (4 RCTs, n=572; RR 0.59, 95%CI 0.40 to 0.87).
Szajewska H, 2013
Lactobacillus GG Daily doses of LGG ranging from 1.2 x 10⁸ CFU to 2 x 10¹² CFU in addition to rehydration therapy vs Placebo
The methodological quality of the studies (generation of randomization, allocation concealment, blinding, ITT analysis, and completness to follow-up) varied.
MA, N= 2963patients (1603 in the experimental group and 1360 inthe control group) 15 studies
Lactobacillus GG reduces the duration of diarrhea either in terms of days and hospitalization
Allen SJ, 2010 Saccharomyces boulardii
S boulardii vs. placebo or no intervention
See above MA (10 RCTs, n=860) Reduced risk of diarrhea lasting ≥4 d (6 RCTs, n=606, RR 0.37; 95% CI 0.21 to 0.65; NNT 3, 95% CI 2-3).
Szajewska H, 2009
S boulardii vs. placebo or no intervention
The methodological quality of the trials varied. MA (9 RCTs, n=1117) Reduced duration of diarrhea (7 RCTs, n=944, MD 1.08 d, 95%CI -1.64 to -0.53
Dinleyici EC, 2012
S boulardii vs. placebo or no intervention
All included trials had a number of methodological limitations; however, >80% of the studies have follow-up and ITT analysis. Small sample sizes in some of the trials.
MA (13 RCTs) Reduced duration of diarrhea (11 RCTs, n=1306; MD -0.99 d (-1.4 to -0.58).Diarrhea on day 3 (9 RCTs, n= 1128; RR 0.52; 95% CI 0.42 to 0.65)Duration of hospitalization (n=449; MD -0.84 d (-1.14 to -0.54)
Riaz M, 2012 S boulardii vs. placebo Unclear Unclear DB No (ACA) N=108 (3-59 mo) Reduced duration of diarrhea (P=0.03)Shorter time of appearance of first semi- formed stool (P=0.008).
Correa NB, 2011
S boulardii vs. placebo Adequate Unclear DB No(ACA)
N=176 (6-48 mo) Reduced frequency of diarrhea at day 2 (P<0.01).Reduced frequency of diarrhea at day 3 (P<0.01).

ESPGHAN/ESPID Guidelines for the Management of AGE in Children in Europe
Chmielewska A, 2008
L. reuteri ATCC 5573
L. reuteri ATCC 5573 vs. placebo The methodological quality of the studies (generation of randomization, allocation concealment, blinding, ITT analysis, and completeness to follow-up) varied.
MA (2 RCTs, n=106) Reduced duration of diarrhea (MD -25 h; 95%CI-39.4 to -10.9).Reduced risk of diarrhea on day 1 (RR 0.88; 95%CI 0.8 to 0.99), on day 2 (RR 0.6; 95%CI 0.4 to 0.8), on day 3 (RR 0.45; 95%CI 0.3 to 0.8), and on day 4 (RR 0.36; 95%CI 0.1 to 0.7).
Francavilla R, 2012
L. reuteri DSM 17938
L. reuteri DSM 17938 vs. placebo Adequate Unclear DB Yes N=74 (6-36 mo) Reduced duration of watery diarrhea (P<0.03).Smaller number of patients with persistent diarrhea on day 2 (P<0.01) and on day 3 (P<0.03).Lower relapse rate (P<0.03).
Piescik-Lech M, 2013
LGG (6 x 10⁹) plus scmectite
LGG (6 x 10⁹) plus scmectite vs LGG plus Placebo
Adequate Adequate DB Yes N=88 children (44 treated and 44 controls) aged 4 to 60 months
LGG plus smectite andLGG alone are equally effective for treating young childrenwith AGE. Combined use of the two interventions is notjustified.
Vandenplas Y, 2011
Synbiotics 5 probiotic strains & fructooligosaccharides vs. placebo
Adequate Adequate DB Yes N=111 (1-186 mo) Reduced duration of diarrhea [3 days (IQR 2-4) vs. 4 days (IQR 4-5); P<0.005].
Passariello A, 2012
L. paracasei B21060 plus arabinogalactan and xilooligosaccharides vs. placebo
Adequate Adequate DB Yes N=107 (3-36 mo) Higher rate of resolution of diarrhea at 72 hours (P=0.005).Reduced duration of diarrhea (P=0.04).Reduced number of daily stool outputs from 48 to 72 hours after treatment (P=0.005).
Teran CG, 2009
Nitazoxanide Nitazoxanide 15 mg/kg/d for 3 days vs. placebo
Adequate Unclear SB No (ACA) N=75 (1-24 mo) Reduced duration of diarrhea (52.9±27.7 vs. 74.6±26.6 h; MD -21.7 h, 95% CI -34.74 to -8.66).Reduced duration of hospitalization (81.8±30.8 vs. 100.9±27.3; MD -19.1 h; 95% CI -33.27 to -4.93).
AGE=acute gastroenteritis; ACA=available-case-analysis; CI=confidence interval; ED=Emergency department; HR=hazard ratio; IV=intravenous; LGG= Lactobacillus rhamnosus GG; MA=meta-analysis; MD=mean difference; OR=odds ratio; ORS=oral rehydration solution; ORT=oral rehydration treatment; RR=risk ratio; TID= three times a day.
5.4. Anti-infective therapyTable 5.4.1. Pathogen-based approach: Shigella gastroenteritis
Reference Study type Population Intervention Comparison OutcomeVinh H, 2011 RCT, open-label
Allocation concealment494 hospitalized children with dysentery (107 with confirmed shigellosis)
Gatifloxacin 10mg/kg/d (single dose), for 3 days
Ciprofloxacin 30mg/kg/d (bid), for 3 days
Similar duration of symptoms (95 vs 93 hs) and clinical failure rates
Christopher PR, 2010 Meta-analysis 1748 children and adults with Shigella dysentery
16 controlled trials of antibiotics for Shigella dysentery
Placebo or comparative antibiotics
Appropriate antimicrobial therapy shotened the duration of Shigella dysenteryInsufficient evidence to support superior efficacy of any class of antibiotics
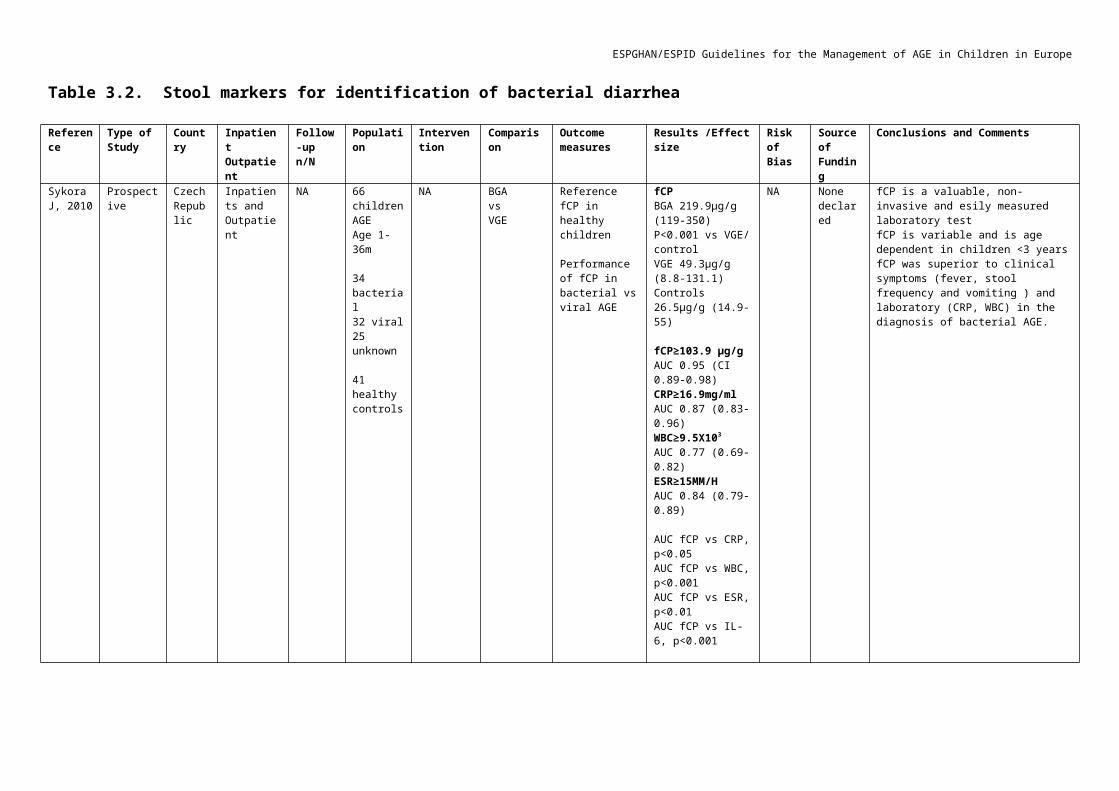
ESPGHAN/ESPID Guidelines for the Management of AGE in Children in Europe
Boumghar-Bourtchai L, 2008
Case series 50 children, mostly hospitalized, with shigellosis, during an outbreak
Identification of plasmid-mediated macrolide resistance -
Macrolide-resistant S. Sonnei in France
Centers for Disease Control and Prevention (CDC), 2012
Report of an outbreak 43 cases of suspected shigellosis, 14 confirmed S. sonnei
Clinical and laboratory investigation -
Plasmid-mediated azithronycin resistance (MIC>16 mcg/ml),Single clone by PFGE
Centers for Disease Control and Prevention (CDC), 2010
Case series 2 hospitalized children and an adult with clinical shigellosis
Descriptive antibiotic resistance -
Reprt from the US of S.flexneri 2a resistant to cefriaxone and ciprofloxacin
Vrints M, 2009 Descriptive 7307 Shigella isolates (children and adults) in BelgiumDuring 1990-2007
Descriptive antibiotic resistance -
Very high resistance to ampicillin and TMP-SMXResistance to nalidixic acid (12.8%); no resistance to ciprofloxacin
Shiferaw B, 2012 Descriptive 1376 Shigella isolates (children and adults) in the USDuring 2000-2010
Descriptive antibiotic resistance -
High resistance to ampicillin and TMP-SMXLow resistance to nalidixic acid (2%) and ciprofloxacin (0.5%)
Haltalin KC, 1967 Double-blindRCTAllocation concealment
52 children hospitalizedWith Shigella GE
Ampicllin vs sulfadiazine vs placebo
Length of symptoms andFecal excretion
Ampicillin (vs placebo) shortened the duratin of diarrhea by 45%(3.3 d vs 6), of fever by 50% (1.3 vs 2.6) and excretion by 60% (2 vs %)
Basualdo W, 2003 Open-labelRCTAllocation concealment
182 children with bloody diarrhea of whom 75 had shigellosis, mostly S. flexneri
Azithromycin (12 and then 6 mg/d) vs cefixime (8mg/d), both for 5 d
Length of symptoms andFecal excretion, clinical and bacteriologic relapse during 1w after end of therapy
Azithro vs cefixime: clinical success 93% vs 78%, clinical failure 2 vs 7 children, legth of diarrhea 2.5 vs 3.9 d, bacterial eradication 93% vs 59% (p<0.01, 95% CO 1.7-69.7), clinical relapse 1 child in azithro group, bacteriologic relapse 1 vs 2 patients
Ashkenazi S, 1993 Double-blindRCTAllocation concealment
102 children with inflammatory diarrhea, of whom 79 had shigellosis, mostly S. sonnei
Cefixime (8 mg/kg/d, bid vs T-S, 5d
Length of symptoms andFecal excretion
Better clinical and bacteriological efficacy of cefixime, mainly because 32/39 treated with T-S were resistant to it. Bacteriologic eradication by cefixime was 78% (sub-optimal )
Miron D, 2004 Non-randomized controlled study during outbreak
29 children with S. sonnei Azithromycin 10mg/kg for 3 d vs nalidixic acid 55mg/kg/d qid for 5 d
Length of symptoms andFecal excretion
Better efficacy of azithromycin: clinical response 100% vs 65%, p<0.01, bacterilogic response 100% vs 72%, p=0/012
Varsano I, 1991 OpenRCT
49 children with severe dysentery, of whom 40 had shigellosis, mostly S. sonnei
Ceftriaxone 50mg/kg/d, IV then IM vs ampicillin 100mg/kg/d, IV then PO, both for 5d
Length of symptoms andFecal excretion, relapse rates
Better efficacy of ceftriaxone: diarrhea 2.5 vs 6.8 d (p<0.005), bacterial eradication 100% vs 60% (p<0.001), bacteriologic relapse 0 vs 40% (p<0.001)
Eidlitz-Marcus T, 1993 OpenRCT
40 children with shigellosis, mostly S. sonnei
Ceftriaxone 50mg/kg/d, IV then IM 5d vs 2d
Length of symptoms andFecal excretion
No difference between 2 and 5 days
Salam MA, 1988 Double-blindRCT
9o children with dysentery, of whom 74 had shigellosis, mostly S. dysenteriae and S. sonnei
Nalidixic acid 55 mg/kg/d vs ampicillin 100 mg/kg/d, both for 5d
Length of symptoms andFecal excretion
Nalidixic acid and Ampicillin effective, when the isolate susceptible to Ampicillin. Clinical response 81% vs 77%, Bacteriologic response 100% for both groups on d 3, but the response after 1d was better (38% vs 12%)
Bennish ML, 2006 Review of 7 studies and follow up of 20 children prospectively
378 patients with S. dysenteriae, 250 children, 128 adults
Appropriate antibiotic therapy Rate of the HUS complication, fecal Stx level
Low risk of developing HUS with therapy( 0.0026), early antibiotics reduces fecal Stx levels
Leibovitz E, 2000 Double-blind RCT 221 children with invasive diarrhea, 73 with shigellosis
Ciprofloxacin PO 20mg/kg/d bid vs IM ceftriaxone 50/mg/kg, both 3d
Length of symptoms andFecal excretion
No differences in the clinical or bacteriologic response. No joint problems related to cipro treatmet for 3 d
Prado D, 1992 RCT 93 children with dysentery, of whom 22 had shigellosis or EIEC
Ceftibuten 9 mg/kg/d vs T-S 10-50mg/kg/dBoth bid, for 5d
Length of symptoms andFecal excretion
Similar clinical and bacteriologic responses unless the pathogen was resistant to T-S

ESPGHAN/ESPID Guidelines for the Management of AGE in Children in Europe
DuPont HL, 2001 Double-blindRCT
187 adults with traveler’s diarrhea, 9 with Shigella, no studt in children
Rifaximin 400 mgX2/d vs Ciprofloxacin 500 mgX2/d, both for 3 d
Length of symptoms andFecal excretion
Similar clinical and bacterial efficay. But: only 9 Shigella, 64 ETEC; no studies in children
AGE=acute gastroenteritis; ED=Emergency department; EIEC=enteroinvasive E. coli; ETEC=enterotoxigenic E. coli; HUS=hemolytic-uremic syndrome; IM=intramuscular; IV=Intravenous; LGG=Lactobacillus rhamnosus GG; ORS=Oral rehydration solution; ORT=Oral rehydration treatment; PO=Oral; Stx=Shiga toxin; TID= three times a day; T-S=trimethoprim-sulfamethoxazole.
Table 5.4.2. Pathogen-based approach: Salmonella (non-typhoidal) gastroenteritis
Reference Study type Population Intervention Comparison OutcomeOnwuezobe IA, 2012
Systematic Reviewof RCTs1980-8/2012
12 trials identifiedIncluding 767 patients with Salmonella gastroenteritis, of whom 258 were children
Antibiotics vs placebo or no antibiotics
Clinical and bacteriologic responses, relapse, adverse effects
No significant differences in length of diarrhea or fever between any antibiotic regimen and placebo. Antibiotics result in more negative cultures during the 1st week of treatment, but more cases of positive cultures after 3 weeks. Relapse more frequent in those receiving antibiotics. Adverse effects more common with antibiotics
Shkalim V, 2012
Descriptive study
17 children with non-typoidal Salmonella bacteremia during 1995-2010
- -Salmonella bacteremia was associated with toxic appearance and convulsions (17%) and occurred in children older than 3 months
Chiu CH, 1999 Open-label RCTAllocation concealment
42 children with Salmonella GE Azithromycin 10mg/kg/d vs cefixime 10mg/kg/d bid, both for 5 days vs no antibiotics
Clinical and bacteriologic responses
Duration of diarrhea or fever not affected by antibiotics. No effects of antibiotics on fecal eradication
Sirinavin S, 2003
Open-label RCT 265 asymptomatic carriers of Salmonella
Norfloxacin 400 mgx2/d vs Azithromycin 500 mg/d, both for 5 days, vs placebo
Fecal eradication: stool cultures on days 7, 30, 60, 90.
Antibiotic regimens had no significant effect vs placebo on fecal eradication, and was associated with development of antibiotic resistance
Table 5.4.3. Pathogen-based approach: Campylobacter gastroenteritis
Reference Study type Population Intervention Comparison OutcomeVukelic D, 2010 RCT
Assessor-blindAllocation concealment
120 children (<12 y) with Campylobacter enterocolitis
Single dose (20 or 30 mg/kg) azithromycin
1. Erythromycin for 5 days
2. No antibiotics
1. Erythromycin was not better than no antibiotics2. A single dose of azithromycin, 30 mg/kg, was superior to no antibiotics and
to erythromycin3. All antibiotic regimens had 100% bacteriologic cure
Ternhag A, 2007 Meta-analysis 11 double-blind RCTs Antibiotics vs no treatment or placebo
Clinical and bacteriologic outcome
Antibiotics reduced the duration of intestinal symptoms by a mean of 1.3 days
Salazar-Lindo E, 1986
Double-blind RCTAllocation concealment
170 children 3-60 mo with acute dysentery, of whom 30 had Campylobacter jejuniTreatment started within 5 days of diarrhea
Erythromycin 50mg/kg/d qid for 5 days vs placebo
Clinical and bacteriologic responses
Treatment failure clinically 0% vs 42% (p<0.01), diarrhea after 2d 0% vs 64% (p<0.05), normal stools after 5 d 7% vs 50% (p<0.02), shorter excretion of the pathogen. Clinical and bacteriologic efficacy documented with the early treatment, for dysenteric Campy GE and with a dose of 50mg/kg/d

ESPGHAN/ESPID Guidelines for the Management of AGE in Children in Europe
Williams MD, 1989 Open-labelRCTAllocation concealment
20 children (>6m) and 23 adults with acute (<72h) inflammatory diarrhea were enrolled.21 were C. Jejuni positive
Erythromycin 50mg/kg/d tid vs TMP-SMX, both for 5 days
Clinical and bacteriologic responses
In those with Campy GE: eryhromycin was bacterilogical efficacious – fecal eradication on d3 was 100% vs 10% (p<0.002) and on d5 100% vs 20% (p<0.001). Clinically, no significant effect on mean days of diarrhea, mean stools per day and mean symptom score
Pai CH, 1983 Open-label RCT
27 children with confirmed Campy GE
Erythromycin 40mg/kg/d qid for 7 days vs no treatmentNean diarrhea before treatment: 5.5 vs 6.4d!!!
Clinical and bacteriologic responsesrelapse
Duration of diarrhea (3.2 vs 3.8) or feverBacterial shedding: 2 vs 16.8 d (p<0.05)Relapse: 6.7% vs 25%
Ashkenazi S, 1987 Intervention during a DCC outbreak
Ongoing outbreak of Campy GE in a DCC,22 children
Erythromycin 50mg/kg/d qidFor 7 days
Fecal eradication, outbreak course.
The ongoing outbreak stopped
DCC=day-care center; D=day; GE=gastroenteritis.
Table 5.4.4. Pathogen-based approach: E. coli, cholera, others gastroenteritis
Reference Study type Population Intervention Comparison OutcomeKaushik JS, 2010 RCT
Allocation concealment
180 hospitalized children with confirmed cholera diarrhea
Azithromycin, single 20/mg/kg dose
Ciprofloxacin, single 20mg/kg dose
Azithromycin superior: clinical efficacy 95% vs 71%, bacteriologic efficacy 100% vs 96%, duration of diarrhea 55 vs 72 h and vibrio excretion 35 vs 52 h and less IV fluid needed (3491 vs 4705 ml.
Wong CS, 2012 Case-control study
259 children with O157:H7 diarrhea Antibiotics No antibiotics HUS rate: 36% with antibiotics vs 12% without (p=0.001)
Geerdes-Fenge HF, 2013
Case-control study
24 patients with EHEC (O104:H4) diarrhea Ciprofloxacin Other or no antibiotics HUS rate: 40% with ciprofloxacin vs 89% without ciprofloxacin (p=0.043)
Trehan I, 2009 RCTDouble-blindAllocation concealment
144 ambulatory children aged 3-5 years with tropical enteropathy
PO rifaximin for 7 days Placebo No beneficial effect of rifaximin, "suggesting that small-bowel bacterial over growth in not an important etiology in this condition
Hu Y, 2012 Meta-analysis 4 RCTs including 502 participants PO rifaximin Placebo Rifaximin reduced significantly the rate of non-invasive E. coli (mainly ETEC) diarrheaSafdar N, 2002 Meta-analysis
O157:H7 and HUS
26 publications were identified; 9 fulfilled the criteria for inclusion in the analysisOnly one randomized, the others prospective cohort or retrospective case-control studies
Antibiotic therapy of E. Coli O157:H7 and the risk of HUS
Risk of developing HUS A total of 1121 patients with E. coli O157:H7 enteritis were analyzed, of whom 175 developed HUS.Various antibiotics were usedThe odds ratio was 1.15 (95% CI 0.79-1/68)Recommended a prospective large RCT
Proulx F, 1992 Open-labelRCT
47 children with E. coli O157:H7 enteritisRandomization 7.4 days after the onset of diarrhea
T-S for 5 d vs no antibiotics Length of symptoms andFecal excretion, risk of developing HUS
Antibiotics (vs no treatment) did not affect the resolution of clinical symptoms or bacterial eradication. The risk of HUS was 9% vs 16%
Oberhelman RA, 1987
Double-blindRCT
141 children with acute diarrhea, of whom 31 had enterotoxigenic E. coli
TMP-SMX for 5 d vs placebo Length of symptoms andfecal excretion
IN children with ETEC: significant (p<0.01) improvement in the clinical symptoms with antibiotics and in bacteriological efficacy
Ericsson CD, 1987
Double-blindRCT
191 adults with travelers diarrhea were enrolled, of whom 73 had ETEC
Ciprofloxacin or T-S or placebo for 5 days
Length of symptoms andFecal excretion, relapse
Clinical efficacy of both antibiotics: average h of diarrhea were 33, 26, and 84 (p<0.001). Bacteriologic efficacy also documented: fecal eradication rates were 100%, 100% and 71%

ESPGHAN/ESPID Guidelines for the Management of AGE in Children in Europe
Adachi JA, 2003 Double-blindRCT
217 adults with traveler’s diarrhea, of whom 110 had ETEC
Azithromycin 100 mg vs levofloxacin 500 mgd
Length of symptoms andFecal excretion
Similar clinical efficacy of azithromycin and levofloxacin: duration of diarrhea 22.3 vs 21.5 h. Bacteriologic eradication 55% vs 61%
Infante RM, 2004
Double-blindRCT
Adults with traveler’s diarrhea caused by EaggEC
PO rifaximin vs placebo Length of symptoms Shorter duration of diarrhea with rifaximin: 22 vs 72 hours, (p=0.03)
Thoren A, 1980 Open-labelRCTAllocation concealment
49 infants with EPEC diarrhea Mecillinam vs T-S vs placebo Length of symptoms andFecal excretion
Better clinical response with both antimicrobial agents: 79% vs 73% vs 7% (p<o.001). Bacteriologic response: 53% for both antibiotic groups vs 0% (p<o.001).
EPEC=enteropathogenic Escherichia coli; ETEC= Enterotoxigenic Escherichia coli; HUS=hemolytic-uremic syndrome; T-S=trimethoprim-sulfamethoxazole.
Table 5.4.5. Antimicrobial therapy of parasite-induced gastroenteritis
Reference Study type Population Intervention Comparison OutcomeVandenberg O, 2012
Prospective cohort study
130 children (3mo-3yr) attending a day-care center in Brussels
Collection of stool samples over - Our study underscores the need to rule out Cryptosporidium etiology in a diarrheal outbreak in a DCC. Rapid implementation of infection control measures can most likely halt the spread of infection
Granados CE, 2012
MA (19 RCTs) 1817 patients (1441 children) with giardiasis infection
Albendazole (400 mg once daily for five to 10 days)
metronidazole (250 mg to 500 mg three times daily for five to 10 days)
Studies were generally small, with poor methods reporting. Albendazole may be of similar effectiveness to metronidazole, may have fewer side effects, and has the advantage of a simplified regimen.
Escobedo AA, 2008
Controlled trial 166 children infected with G. lamblia, with those of
tinidazole, given as a single dose of 50 mg/kg. (63 completed the study)
nitazoxanide, given at a dose of 7.5 mg/kg twice a day for 3 days.(74 completed the study)
Cure rate: G. lamblia not found in both post-treatment samples: 90.5% Tinidazole vs 78.4% Nitazoxanide (P<0.05)
Canete R, 2012
Double-blind, randomized, controlled trial
150 Adults patients had a confirmed symptomatic G. duodenalis mono-infection
Albendazole, 400 mg/daily for 5 days (75 pts)
Metronidazole 250 x3/die for 5 days (75 pts)
Cure rate: 82,6% vs 85,3 %, p>0.05 . Side effects : bitter taste, headache, vomiting and dizziness significantly higher in the Mentronidazole group. Abdominal pain significantly higher in Albendazole group
DCC=day-care center.
Table 5.4.6 Antiviral treatment
Reference Study type
QoS Country In/OutPatients
Population Randomization Blinding Allocation concealment
Intervention Comparison FU ITT Outcomes measures
Effect measure
Effect size (95% CI)
Comments
Guarino A, 1994
RCT + Italy Inpatients
N=98 children with acute gastroenteritis
Appropriate Double-blinded
Not clear Single oral dose of 300 mg/kg body weight of human serum immunoglobulin
Placebo 98/98
Yes Mean duration of diarrhea (h)
Number 76 vs 131 (p<0.01)
Consistent evidence demonstrated that oral administration of immunoglobulin (300 mg/kg) may be beneficial for rotaviral infection and is associated with a faster recovery from acute diarrhea
Viral excretion (h)
Number 114 vs 180 (p<0.01)
Hospital stay (h)
- *reduced in treated chilren
Sarker SA, 1998
RCT + Bangladesh
Inpatients
N=85 male infants and children aged 4 to
Appropriate Double-blinded
Appropriate Immunoglobulin from immunized bovine
Placebo 80/85
No Stool rate (grams/kg/day)
Mean±SD Day 1 (P = 0.006), Day 2 (0.006) and Day 3 (0.02)

ESPGHAN/ESPID Guidelines for the Management of AGE in Children in Europe
24 months with a history of acute watery diarrhea
colostrum (10 g in 20ml of water in 4 divided doses for 4 days)
Intake of ORS (ml/kg/day)
Mean±SD 281±30 vs 410±39; p<0.001
Stool frequency (number/days 1-4)
Number 29 vs 42; p=0.007
Number of days required for RV ELISA-negative stool (days)
Mean±SD 1.5 vs. 2.9, P < 0.001
Duration of diarrhea after initiation of therapy (h)
Mean±SD 72.6±38.9 vs 96.4±46.7; p=0.0016
Rahman S, 2012
RCT + Myanmar
Inpatients
N=54 infants and children aged between 2 and36months with acute watery diarrhea and dehydration
Appropriate Double-blinded
Appropriate Rotamix IgY four times daily for 8 consecutive days in addition to rehydration therapy
Placebo 52/54
Yes Intake of ORS (ml)
Mean±SD 699.3±111.1 vs. 919.1±171.31, p=0.004
Oral administration of IgY could improve clinical outcomes (ORS intake, and duration of IV administration, of diarrhea, and of RV clearance), even for patients with mixed (RV and non-RV) enteric infections, and is a potentially useful adjunct to general supportive therapy in pediatric patients
Mean duration of intravenous fluid administration (days)
Mean 5 vs 8; p=0.03
No. of stools/day (day 2)
Mean±SD 6.7±4.3 vs 10.2±8.8 (p=0.03)
Total duration of diarrhea from day of admission (h)
Mean±SD 135.3±42.0 vs 185.5±41.7; p=0.01
Florescu DF, 2011
Case-control study
+ USA Inpatients
N=24 immunocompromised patients (16 children) diagnosed with NV gastroenteritis
- - - 25 mg/kg of oral human immunoglobulin administered every six h for a total of eight doses in adjunct to standard therapy
Controls - - Resolution of diarrhea
OR 65.3; p=0.008 Oral immunoglobulin treatment has been proposed for NV enteritis. Resolution of diarrhea and decreased stool output were observed at 7 days, but no benefit was found for length of hospital stay or hospital cost
Stool output seven days after treatment (mL/kg/day)
Mean -22.15 vs -10.20; p=0.009
NV=Norovirus; OR=odds ratio; ORS=Oral rehydration solution; QoS=Quality of Study; RV=Rotavirus.

ESPGHAN/ESPID Guidelines for the Management of AGE in Children in Europe

ESPGHAN/ESPID Guidelines for the Management of AGE in Children in Europe
Table 5.4. Nitazoxanide
Reference Intervention Randomization Allocation concealment
Blinding ITT analysis
Population Main results(experimental group vs. control group)
Teran CG, 2009
Nitazoxanide 15 mg/kg/d for 3 days vs. placebo
Adequate Unclear SB No (ACA) N=75 (1-24 mo)
Reduced duration of diarrhea (52.9±27.7 vs. 74.6±26.6 h; MD -21.7 h, 95% CI -34.74 to -8.66).Reduced duration of hospitalization (81.8±30.8 vs. 100.9±27.3; MD -19.1 h; 95% CI -33.27 to -4.93).
ACA=available case analysis; CI=confidence interval; MD=Median duration.

ESPGHAN/ESPID Guidelines for the Management of AGE in Children in Europe
Bibliography
Abba K, Sinfield R, Hart CA, et al. Antimicrobial drugs for persistent diarrhoea of unknown or non-specific cause in children under six in low and middle income countries: systematic review of randomized controlled trials. BMC Infect Dis 2009;9:24.Adachi JA, Ericsson CD, Jiang ZD, et al. Azithromycin found to be comparable to levofloxacin for the treatment of US travelers with acute diarrhea acquired in Mexico. Clin Infect Dis 2003;37:1165-71.Akech SO, Karisa J, Nakamya P, et al. Phase II trial of isotonic fluid resuscitation in Kenyan children with severe malnutrition and hypovolaemia. BMC Pediatr 2010;10:71.Al Jarousha AM, El Jarou MA and El Qouqa IA. Bacterial enteropathogens and risk factors associated with childhood diarrhea. Indian J Pediatr 2011;78:165-70.Alam NH, Raqib R, Ashraf H, et al. L-isoleucine-supplemented oral rehydration solution in the treatment of acute diarrhoea in children: a randomized controlled trial. J Health Popul Nutr 2011;29:183-90.Allen SJ, Martinez EG, Gregorio GV, et al. Probiotics for treating acute infectious diarrhoea. Cochrane Database Syst Rev 2010;CD003048.Allison GM, Rogers KA, Borad A, et al. Antibody responses to the immunodominant Cryptosporidium gp15 antigen and gp15 polymorphisms in a case-control study of cryptosporidiosis in children in Bangladesh. Am J Trop Med Hyg 2011;85:97-104.Ansaldi F, Lai P, Valle L, et al. Burden of rotavirus-associated and non-rotavirus-associated diarrhea among nonhospitalized individuals in central Italy: a 1-year sentinel-based epidemiological and virological surveillance. Clin Infect Dis 2008;46:e51-5.Ashkenazi S, Danziger Y, Varsano Y, et al. Treatment of Campylobacter gastroenteritis. Arch Dis Child 1987;62:84-5.Ashkenazi S, Amir J, Waisman Y, et al. A randomized, double-blind study comparing cefixime and trimethoprim-sulfamethoxazole in the treatment of childhood shigellosis. J Pediatr 1993;123:817-21.Bailey B, Gravel J, Goldman RD, et al. External validation of the clinical dehydration scale for children with acute gastroenteritis. Acad Emerg Med 2010;17:583-8.Bandin F, Kwon T, Linas MD, et al. Cryptosporidiosis in paediatric renal transplantation. Pediatr Nephrol 2009;24:2245-55.Basualdo W and Arbo A. Randomized comparison of azithromycin versus cefixime for treatment of shigellosis in children. Pediatr Infect Dis J 2003;22:374-7.Bennish ML, Khan WA, Begum M, et al. Low risk of hemolytic uremic syndrome after early effective antimicrobial therapy for Shigella dysenteriae type 1 infection in Bangladesh. Clin Infect Dis 2006;42:356-62.Bhutta ZA, Nelson EA, Lee WS, et al. Recent advances and evidence gaps in persistent diarrhea. J Pediatr Gastroenterol Nutr 2008;47:260-5.Bok K and Green KY. Norovirus gastroenteritis in immunocompromised patients. N Engl J Med 2012;367:2126-32.Boumghar-Bourtchai L, Mariani-Kurkdjian P, Bingen E, et al. Macrolide-resistant Shigella sonnei. Emerg Infect Dis 2008;14:1297-9.Callery P, Kyle RG, Campbell M, et al. Readmission in children's emergency care: an analysis of hospital episode statistics. Arch Dis Child 2010;95:341-6.Canete R, Rodriguez P, Mesa L, et al. Albendazole versus metronidazole in the treatment of adult giardiasis: a randomized, double-blind, clinical trial. Curr Med Res Opin 2012;28:149-54.Carter B and Fedorowicz Z. Antiemetic treatment for acute gastroenteritis in children: an updated Cochrane systematic review with meta-analysis and mixed treatment comparison in a Bayesian framework. BMJ Open 2012;2:

ESPGHAN/ESPID Guidelines for the Management of AGE in Children in Europe
Centers for Disease Control and Prevention (CDC). Notes from the field: emergence of Shigella flexneri 2a resistant to ceftriaxone and ciprofloxacin --- South Carolina. MMWR Morb Mortal Wkly Rep 2010;59:1619.Centers for Disease Control and Prevention (CDC). Notes from the field: Outbreak of infections caused by Shigella sonnei with decreased susceptibility to azithromycin--Los Angeles, California. MMWR Morb Mortal Wkly Rep 2012;62:171.Chan CM, Chan CW, Ma CK, et al. Norovirus as cause of benign convulsion associated with gastro-enteritis. J Paediatr Child Health 2011;47:373-7.Chen CC, Chang CJ, Lin TY, et al. Usefulness of fecal lactoferrin in predicting and monitoring the clinical severity of infectious diarrhea. World J Gastroenterol 2011;17:4218-24.Chen L, Kim Y and Santucci KA. Use of ultrasound measurement of the inferior vena cava diameter as an objective tool in the assessment of children with clinical dehydration. Acad Emerg Med 2007;14:841-5.Chen L, Hsiao A, Langhan M, et al. Use of bedside ultrasound to assess degree of dehydration in children with gastroenteritis. Acad Emerg Med 2010;17:1042-7.Chen SM, Ku MS, Lee MY, et al. Diagnostic performance of serum interleukin-6 and interleukin-10 levels and clinical predictors in children with rotavirus and norovirus gastroenteritis. Cytokine 2012;59:299-304.Chisti MJ, Pietroni MA, Smith JH, et al. Predictors of death in under-five children with diarrhoea admitted to a critical care ward in an urban hospital in Bangladesh. Acta Paediatr 2011;100:e275-9.Chiu CH, Lin TY and Ou JT. A clinical trial comparing oral azithromycin, cefixime and no antibiotics in the treatment of acute uncomplicated Salmonella enteritis in children. J Paediatr Child Health 1999;35:372-4.Chmielewska A, Ruszczyński M and Szajewska H. Lactobacillus reuteri strain ATCC 55730 for the treatment of acute infectious diarrhoea in children: a meta-analysis of randomized controlled trials. Pediatria Współczesna. Gastroenterologia, Hepatologia i Żywienie Dziecka 2008;10:33-7.Christopher PR, David KV, John SM, et al. Antibiotic therapy for Shigella dysentery. Cochrane Database Syst Rev 2010;CD006784.Correa NB, Penna FJ, Lima FM, et al. Treatment of acute diarrhea with Saccharomyces boulardii in infants. J Pediatr Gastroenterol Nutr 2011;53:497-501.Das SK, Faruque AS, Chisti MJ, et al. Changing trend of persistent diarrhoea in young children over two decades: observations from a large diarrhoeal disease hospital in Bangladesh. Acta Paediatr 2012;101:e452-7.Day TG, Jackson C and Bryant PA. Cluster of neurological manifestations of rotavirus infection in children. BMJ Case Rep 2012;2012:20.DeCamp LR, Byerley JS, Doshi N, et al. Use of antiemetic agents in acute gastroenteritis: a systematic review and meta-analysis. Arch Pediatr Adolesc Med 2008;162:858-65.Diez-Gandia A, Ajenjo MA, Navalon AB, et al. [Palatability of oral rehydration solutions (ORS) in healthy 6 to 9 year-old children. A multicentre, randomised single blind clinical trial]. An Pediatr (Barc) 2010;72:111-5.Dinleyici EC, Eren M, Ozen M, et al. Effectiveness and safety of Saccharomyces boulardii for acute infectious diarrhea. Expert Opin Biol Ther 2012;12:395-410.Dunkelmann L, Bucher BS, Tschumi S, et al. Estimation of dehydration using bioelectric impedance in children with gastroenteritis. Acta Paediatr 2012;101:e479-81.Dupont C, Foo JL, Garnier P, et al. Oral diosmectite reduces stool output and diarrhea duration in children with acute watery diarrhea. Clin Gastroenterol Hepatol 2009;7:456-62.Dupont C and Vernisse B. Anti-diarrheal effects of diosmectite in the treatment of acute diarrhea in children: a review. Paediatr Drugs 2009;11:89-99.

ESPGHAN/ESPID Guidelines for the Management of AGE in Children in Europe
DuPont HL, Jiang ZD, Ericsson CD, et al. Rifaximin versus ciprofloxacin for the treatment of traveler's diarrhea: a randomized, double-blind clinical trial. Clin Infect Dis 2001;33:1807-15.Eidlitz-Marcus T, Cohen YH, Nussinovitch M, et al. Comparative efficacy of two- and five-day courses of ceftriaxone for treatment of severe shigellosis in children. J Pediatr 1993;123:822-4.El-Bayoumi MA, Abdelkader AM, El-Assmy MM, et al. Normal saline is a safe initial rehydration fluid in children with diarrhea-related hypernatremia. Eur J Pediatr 2012;171:383-8.Enright K, Beattie T and Taheri S. Use of a hand-held bladder ultrasound scanner in the assessment of dehydration and monitoring response to treatment in a paediatric emergency department. Emerg Med J 2010;27:731-3.Ericsson CD, Johnson PC, Dupont HL, et al. Ciprofloxacin or trimethoprim-sulfamethoxazole as initial therapy for travelers' diarrhea. A placebo-controlled, randomized trial. Ann Intern Med 1987;106:216-20.Escobedo AA, Alvarez G, Gonzalez ME, et al. The treatment of giardiasis in children: single-dose tinidazole compared with 3 days of nitazoxanide. Ann Trop Med Parasitol 2008;102:199-207.Esteban Carretero J, Durban Reguera F, Lopez-Argueta Alvarez S, et al. A comparative analysis of response to vs. ORS + gelatin tannate pediatric patients with acute diarrhea. Rev Esp Enferm Dig 2009;101:41-8.Fasheh Youssef W, Pino Ramirez R, Campistol Plana J, et al. Benign afebrile convulsions in the course of mild acute gastroenteritis: a study of 28 patients and a literature review. Pediatr Emerg Care 2011;27:1062-4.Florescu DF, Hermsen ED, Kwon JY, et al. Is there a role for oral human immunoglobulin in the treatment for norovirus enteritis in immunocompromised patients? Pediatr Transplant 2011;15:718-21.Francavilla R, Lionetti E, Castellaneta S, et al. Randomised clinical trial: Lactobacillus reuteri DSM 17938 vs. placebo in children with acute diarrhoea--a double-blind study. Aliment Pharmacol Ther 2012;36:363-9.Freedman SB, Gouin S, Bhatt M, et al. Prospective assessment of practice pattern variations in the treatment of pediatric gastroenteritis. Pediatrics 2011;127:e287-95.Freedman SB, Parkin PC, Willan AR, et al. Rapid versus standard intravenous rehydration in paediatric gastroenteritis: pragmatic blinded randomised clinical trial. BMJ 2011;343:d6976.Freedman SB, Keating LE, Rumatir M, et al. Health care provider and caregiver preferences regarding nasogastric and intravenous rehydration. Pediatrics 2012;130:e1504-11.Freedman SB, Ali S, Oleszczuk M, et al. Treatment of acute gastroenteritis in children: an overview of systematic reviews of interventions commonly used in developed countries. Evid Based Child Health 2013;8:1123-37.Freedman SB and Geary DF. Bolus fluid therapy and sodium homeostasis in paediatric gastroenteritis. J Paediatr Child Health 2013;49:215-22.Friedman JN, Goldman RD, Srivastava R, et al. Development of a clinical dehydration scale for use in children between 1 and 36 months of age. J Pediatr 2004;145:201-7.Friesema IH, de Boer RF, Duizer E, et al. Etiology of acute gastroenteritis in children requiring hospitalization in the Netherlands. Eur J Clin Microbiol Infect Dis 2012;31:405-15.Garcia-Basteiro AL, Bosch A, Sicuri E, et al. Hospitalizations due to rotavirus gastroenteritis in Catalonia, Spain, 2003-2008. BMC Res Notes 2011;4:429.Geerdes-Fenge HF, Lobermann M, Nurnberg M, et al. Ciprofloxacin reduces the risk of hemolytic uremic syndrome in patients with Escherichia coli O104:H4-associated diarrhea. Infection 2013;41:669-73.

ESPGHAN/ESPID Guidelines for the Management of AGE in Children in Europe
Ghorashi Z, Nezami N, Soltani-Ahari H, et al. Convulsion following gastroenteritis in children without severe electrolyte imbalance. Turk J Pediatr 2010;52:301-5.Gimenez-Sanchez F, Delgado-Rubio A, Martinon-Torres F, et al. Multicenter prospective study analysing the role of rotavirus on acute gastroenteritis in Spain. Acta Paediatr 2010;99:738-42.Gleizes O, Desselberger U, Tatochenko V, et al. Nosocomial rotavirus infection in European countries: a review of the epidemiology, severity and economic burden of hospital-acquired rotavirus disease. Pediatr Infect Dis J 2006;25:S12-21.Goldman RD, Friedman JN and Parkin PC. Validation of the clinical dehydration scale for children with acute gastroenteritis. Pediatrics 2008;122:545-9.Gouin S, Vo TT, Roy M, et al. Oral dimenhydrinate versus placebo in children with gastroenteritis: a randomized controlled trial. Pediatrics 2012;129:1050-5.Granados CE, Reveiz L, Uribe LG, et al. Drugs for treating giardiasis. Cochrane Database Syst Rev 2012;12:CD007787.Gravel J, Manzano S, Guimont C, et al. [Multicenter validation of the clinical dehydration scale for children]. Arch Pediatr 2010;17:1645-51.Gregorio GV, Gonzales ML, Dans LF, et al. Polymer-based oral rehydration solution for treating acute watery diarrhoea. Cochrane Database Syst Rev 2009;CD006519.Gregorio GV, Dans LF and Silvestre MA. Early versus Delayed Refeeding for Children with Acute Diarrhoea. Cochrane Database Syst Rev 2011;CD007296.Grimprel E, Garbarg-Chenon A, Pircon JY, et al. Surveillance to estimate the burden of rotavirus gastroenteritis in children aged less than 3 years attending day care centers in Paris, France. Hum Vaccin 2010;6:399-406.Guarino A, Canani RB, Russo S, et al. Oral immunoglobulins for treatment of acute rotaviral gastroenteritis. Pediatrics 1994;93:12-6.Haltalin KC, Nelson JD, Ring R, 3rd, et al. Double-blind treatment study of shigellosis comparing ampicillin, sulfadiazine, and placebo. J Pediatr 1967;70:970-81.Han JJ, Yim HE, Lee JH, et al. Albumin versus normal saline for dehydrated term infants with metabolic acidosis due to acute diarrhea. J Perinatol 2009;29:444-7.Hanna M and Saberi MS. Incidence of hyponatremia in children with gastroenteritis treated with hypotonic intravenous fluids. Pediatr Nephrol 2010;25:1471-5.Hayajneh WA, Jdaitawi H, Al Shurman A, et al. Comparison of clinical associations and laboratory abnormalities in children with moderate and severe dehydration. J Pediatr Gastroenterol Nutr 2010;50:290-4.Henke-Gendo C, Harste G, Juergens-Saathoff B, et al. New real-time PCR detects prolonged norovirus excretion in highly immunosuppressed patients and children. J Clin Microbiol 2009;47:2855-62.Hidayat S, Srie Enggar KD, Pardede N, et al. Nasogastric drip rehydration therapy in acute diarrhea with severe dehydration. Paediatr Indones 1988;28:79-84.Hoorn EJ, Geary D, Robb M, et al. Acute hyponatremia related to intravenous fluid administration in hospitalized children: an observational study. Pediatrics 2004;113:1279-84.Hu Y, Ren J, Zhan M, et al. Efficacy of rifaximin in prevention of travelers' diarrhea: a meta-analysis of randomized, double-blind, placebo-controlled trials. J Travel Med 2012;19:352-6.Idris NS, Dwipoerwantoro PG, Kurniawan A, et al. Intestinal parasitic infection of immunocompromised children with diarrhoea: clinical profile and therapeutic response. J Infect Dev Ctries 2010;4:309-17.Infante RM, Ericsson CD, Jiang ZD, et al. Enteroaggregative Escherichia coli diarrhea in travelers: response to rifaximin therapy. Clin Gastroenterol Hepatol 2004;2:135-8.

ESPGHAN/ESPID Guidelines for the Management of AGE in Children in Europe
Kaiser P, Borte M, Zimmer KP, et al. Complications in hospitalized children with acute gastroenteritis caused by rotavirus: a retrospective analysis. Eur J Pediatr 2012;171:337-45.Kaushik JS, Gupta P, Faridi MM, et al. Single dose azithromycin versus ciprofloxacin for cholera in children: a randomized controlled trial. Indian Pediatr 2010;47:309-15.Kinlin LM and Freedman SB. Evaluation of a clinical dehydration scale in children requiring intravenous rehydration. Pediatrics 2012;129:e1211-9.Kita F, Hinotsu S, Yorifuji T, et al. Domperidone With ORT in the Treatment of Pediatric Acute Gastroenteritis in Japan: A Multicenter, Randomized Controlled Trial. Asia Pac J Public Health 2012;Korczowski B and Szybist W. Serum procalcitonin and C-reactive protein in children with diarrhoea of various aetiologies. Acta Paediatr 2004;93:169-73.Kotch JB, Isbell P, Weber DJ, et al. Hand-washing and diapering equipment reduces disease among children in out-of-home child care centers. Pediatrics 2007;120:e29-36.Kyle RG, Kukanova M, Campbell M, et al. Childhood disadvantage and emergency admission rates for common presentations in London: an exploratory analysis. Arch Dis Child 2011;96:221-6.Lazzerini M and Ronfani L. Oral zinc for treating diarrhoea in children. Cochrane Database Syst Rev 2012;6:CD005436.Lehert P, Cheron G, Calatayud GA, et al. Racecadotril for childhood gastroenteritis: an individual patient data meta-analysis. Dig Liver Dis 2011;43:707-13.Leibovitz E, Janco J, Piglansky L, et al. Oral ciprofloxacin vs. intramuscular ceftriaxone as empiric treatment of acute invasive diarrhea in children. Pediatr Infect Dis J 2000;19:1060-7.Levine AC, Shah SP, Umulisa I, et al. Ultrasound assessment of severe dehydration in children with diarrhea and vomiting. Acad Emerg Med 2010;17:1035-41.Levy JA and Bachur RG. Intravenous dextrose during outpatient rehydration in pediatric gastroenteritis. Acad Emerg Med 2007;14:324-30.Lorrot M, Bon F, El Hajje MJ, et al. Epidemiology and clinical features of gastroenteritis in hospitalised children: prospective survey during a 2-year period in a Parisian hospital, France. Eur J Clin Microbiol Infect Dis 2011;30:361-8.Macgillivray S, Fahey T and McGuire W. Lactose avoidance for young children with acute diarrhoea. Cochrane Database Syst Rev 2013;10:CD005433.Manger MS, Taneja S, Strand TA, et al. Poor folate status predicts persistent diarrhea in 6- to 30-month-old north Indian children. J Nutr 2011;141:2226-32.Marcus N, Mor M, Amir L, et al. The quick-read C-reactive protein test for the prediction of bacterial gastroenteritis in the pediatric emergency department. Pediatr Emerg Care 2007;23:634-7.Miron D, Torem M, Merom R, et al. Azithromycin as an alternative to nalidixic acid in the therapy of childhood shigellosis. Pediatr Infect Dis J 2004;23:367-8.Moineau G and Newman J. Rapid intravenous rehydration in the pediatric emergency department. Pediatr Emerg Care 1990;6:186-8.Moore SR, Lima NL, Soares AM, et al. Prolonged episodes of acute diarrhea reduce growth and increase risk of persistent diarrhea in children. Gastroenterology 2010;139:1156-64.Mor SM, Tumwine JK, Naumova EN, et al. Microsporidiosis and malnutrition in children with persistent diarrhea, Uganda. Emerg Infect Dis 2009;15:49-52.Morales E, Garcia-Esteban R, Guxens M, et al. Effects of prolonged breastfeeding and colostrum fatty acids on allergic manifestations and infections in infancy. Clin Exp Allergy 2012;42:918-28.Morrow AL, Ruiz-Palacios GM, Jiang X, et al. Human-milk glycans that inhibit pathogen binding protect breast-feeding infants against infectious diarrhea. J Nutr 2005;135:1304-7.Moyo SJ, Maselle SY, Matee MI, et al. Identification of diarrheagenic Escherichia coli isolated from infants and children in Dar es Salaam, Tanzania. BMC Infect Dis 2007;7:92.Mrukowicz JZ, Krobicka B, Duplaga M, et al. Epidemiology and impact of rotavirus diarrhoea in Poland. Acta Paediatr Suppl 1999;88:53-60.

ESPGHAN/ESPID Guidelines for the Management of AGE in Children in Europe
Muhsen K, Shulman L, Rubinstein U, et al. Incidence, characteristics, and economic burden of rotavirus gastroenteritis associated with hospitalization of israeli children <5 years of age, 2007-2008. J Infect Dis 2009;200 Suppl 1:S254-63.Mujawar QM, Naganoor R, Ali MD, et al. Efficacy of dioctahedral smectite in acute watery diarrhea in Indian children: a randomized clinical trial. J Trop Pediatr 2012;58:63-7.Mukhopadhyay C, Wilson G, Pradhan D, et al. Intestinal protozoal infestation profile in persistent diarrhea in children below age 5 years in western Nepal. Southeast Asian J Trop Med Public Health 2007;38:13-9.Nager AL and Wang VJ. Comparison of ultrarapid and rapid intravenous hydration in pediatric patients with dehydration. Am J Emerg Med 2010;28:123-9.Narkeviciute I and Tamusauskaite I. Peculiarities of norovirus and rotavirus infections in hospitalised young children. J Pediatr Gastroenterol Nutr 2008;46:289-92.Neville KA, Verge CF, Rosenberg AR, et al. Isotonic is better than hypotonic saline for intravenous rehydration of children with gastroenteritis: a prospective randomised study. Arch Dis Child 2006;91:226-32.Nylund CM, Goudie A, Garza JM, et al. Clostridium difficile infection in hospitalized children in the United States. Arch Pediatr Adolesc Med 2011;165:451-7.Oberhelman RA, Javier de la Cabada F, Vasquez Garibay E, et al. Efficacy of trimethoprim-sulfamethoxazole in treatment of acute diarrhea in a Mexican pediatric population. J Pediatr 1987;110:960-5.Ochoa TJ, Ecker L, Barletta F, et al. Age-related susceptibility to infection with diarrheagenic Escherichia coli among infants from Periurban areas in Lima, Peru. Clin Infect Dis 2009;49:1694-702.Ogilvie I, Khoury H, Goetghebeur MM, et al. Burden of community-acquired and nosocomial rotavirus gastroenteritis in the pediatric population of Western Europe: a scoping review. BMC Infect Dis 2012;12:62.Oldak E, Sulik A, Rozkiewicz D, et al. Norovirus infections in children under 5 years of age hospitalized due to the acute viral gastroenteritis in northeastern Poland. Eur J Clin Microbiol Infect Dis 2012;31:417-22.Onwuezobe IA, Oshun PO and Odigwe CC. Antimicrobials for treating symptomatic non-typhoidal Salmonella infection. Cochrane Database Syst Rev 2012;11:CD001167.Opintan JA, Newman MJ, Ayeh-Kumi PF, et al. Pediatric diarrhea in southern Ghana: etiology and association with intestinal inflammation and malnutrition. Am J Trop Med Hyg 2010;83:936-43.Pai CH, Gillis F, Tuomanen E, et al. Erythromycin in treatment of Campylobacter enteritis in children. Am J Dis Child 1983;137:286-8.Parkin PC, Macarthur C, Khambalia A, et al. Clinical and laboratory assessment of dehydration severity in children with acute gastroenteritis. Clin Pediatr (Phila) 2010;49:235-9.Pascarella F, Martinelli M, Miele E, et al. Impact of Clostridium difficile infection on pediatric inflammatory bowel disease. J Pediatr 2009;154:854-8.Passariello A, Terrin G, De Marco G, et al. Efficacy of a new hypotonic oral rehydration solution containing zinc and prebiotics in the treatment of childhood acute diarrhea: a randomized controlled trial. J Pediatr 2011;158:288-92 e1.Passariello A, Terrin G, Cecere G, et al. Randomised clinical trial: efficacy of a new synbiotic formulation containing Lactobacillus paracasei B21060 plus arabinogalactan and xilooligosaccharides in children with acute diarrhoea. Aliment Pharmacol Ther 2012;35:782-8.Patel A, Mamtani M, Dibley MJ, et al. Therapeutic value of zinc supplementation in acute and persistent diarrhea: a systematic review. PLoS One 2010;5:e10386.Patel B, Kennebeck SS, Caviness AC, et al. Use of a discharge facilitator improves recall of emergency department discharge instructions for acute gastroenteritis. Pediatr Emerg Care 2009;25:558-64.

ESPGHAN/ESPID Guidelines for the Management of AGE in Children in Europe
Pathela P, Zahid Hasan K, Roy E, et al. Diarrheal illness in a cohort of children 0-2 years of age in rural Bangladesh: I. Incidence and risk factors. Acta Paediatr 2006;95:430-7.Patro B, Golicki D and Szajewska H. Meta-analysis: zinc supplementation for acute gastroenteritis in children. Aliment Pharmacol Ther 2008;28:713-23.Payne DC, Staat MA, Edwards KM, et al. Active, population-based surveillance for severe rotavirus gastroenteritis in children in the United States. Pediatrics 2008;122:1235-43.Pereira AL, Ferraz LR, Silva RS, et al. Enteroaggregative Escherichia coli virulence markers: positive association with distinct clinical characteristics and segregation into 3 enteropathogenic E. coli serogroups. J Infect Dis 2007;195:366-74.Phin SJ, McCaskill ME, Browne GJ, et al. Clinical pathway using rapid rehydration for children with gastroenteritis. J Paediatr Child Health 2003;39:343-8.Piescik-Lech M, Szymanski H and Szajewska H. Efficacy and safety of a new apple-flavoured oral rehydration solution in children with acute gastroenteritis: a double-blind randomized controlled trial. Acta Paediatr 2012;101:e458-64.Piescik-Lech M, Urbanska M and Szajewska H. Lactobacillus GG (LGG) and smectite versus LGG alone for acute gastroenteritis: a double-blind, randomized controlled trial. Eur J Pediatr 2013;172:247-53.Pignatelli S, Simpore J, Ruggieri M, et al. Effectiveness of forced rehydration and early re-feeding in the treatment of acute diarrhoea in a tropical area. Minerva Pediatr 2000;52:357-66.Plaisier A, Maingay-de Groof F, Mast-Harwig R, et al. Plasma water as a diagnostic tool in the assessment of dehydration in children with acute gastroenteritis. Eur J Pediatr 2010;169:883-6.Pockett RD, Adlard N, Carroll S, et al. Paediatric hospital admissions for rotavirus gastroenteritis and infectious gastroenteritis of all causes in England: an analysis of correlation with deprivation. Curr Med Res Opin 2011;27:777-84.Powell CV, Priestley SJ, Young S, et al. Randomized clinical trial of rapid versus 24-hour rehydration for children with acute gastroenteritis. Pediatrics 2011;128:e771-8.Prado D, Lopez E, Liu H, et al. Ceftibuten and trimethoprim-sulfamethoxazole for treatment of Shigella and enteroinvasive Escherichia coli disease. Pediatr Infect Dis J 1992;11:644-7.Pringle K, Shah SP, Umulisa I, et al. Comparing the accuracy of the three popular clinical dehydration scales in children with diarrhea. Int J Emerg Med 2011;4:58.Proulx F, Turgeon JP, Delage G, et al. Randomized, controlled trial of antibiotic therapy for Escherichia coli O157:H7 enteritis. J Pediatr 1992;121:299-303.Pruvost I, Dubos F, Chazard E, et al. The value of body weight measurement to assess dehydration in children. PLoS One 2013;8:e55063.Rabbani GH, Ahmed S, Hossain I, et al. Green banana reduces clinical severity of childhood shigellosis: a double-blind, randomized, controlled clinical trial. Pediatr Infect Dis J 2009;28:420-5.Rahman S, Higo-Moriguchi K, Htun KW, et al. Randomized placebo-controlled clinical trial of immunoglobulin Y as adjunct to standard supportive therapy for rotavirus-associated diarrhea among pediatric patients. Vaccine 2012;30:4661-9.Rautenberg TA, Zerwes U, Foerster D, et al. Evaluating the cost utility of racecadotril for the treatment of acute watery diarrhea in children: the RAWD model. Clinicoecon Outcomes Res 2012;4:109-16.Reid SR and Bonadio WA. Outpatient rapid intravenous rehydration to correct dehydration and resolve vomiting in children with acute gastroenteritis. Ann Emerg Med 1996;28:318-23.Riaz M, Alam S, Malik A, et al. Efficacy and safety of Saccharomyces boulardii in acute childhood diarrhea: a double blind randomised controlled trial. Indian J Pediatr 2012;79:478-82.

ESPGHAN/ESPID Guidelines for the Management of AGE in Children in Europe
Rimoldi SG, Stefani F, Pagani C, et al. Epidemiological and clinical characteristics of pediatric gastroenteritis associated with new viral agents. Arch Virol 2011;156:1583-9.Rivera FP, Ochoa TJ, Maves RC, et al. Genotypic and phenotypic characterization of enterotoxigenic Escherichia coli strains isolated from Peruvian children. J Clin Microbiol 2010;48:3198-203.Robertson G, Carrihill M, Hatherill M, et al. Relationship between fluid management, changes in serum sodium and outcome in hypernatraemia associated with gastroenteritis. J Paediatr Child Health 2007;43:291-6.Roland D, Clarke C, Borland ML, et al. Does a standardised scoring system of clinical signs reduce variability between doctors' assessments of the potentially dehydrated child? J Paediatr Child Health 2010;46:103-7.Ruuska T and Vesikari T. Rotavirus disease in Finnish children: use of numerical scores for clinical severity of diarrhoeal episodes. Scand J Infect Dis 1990;22:259-67.Saba TG, Fairbairn J, Houghton F, et al. A randomized controlled trial of isotonic versus hypotonic maintenance intravenous fluids in hospitalized children. BMC Pediatr 2011;11:82.Safdar N, Said A, Gangnon RE, et al. Risk of hemolytic uremic syndrome after antibiotic treatment of Escherichia coli O157:H7 enteritis: a meta-analysis. Jama 2002;288:996-1001.Salam MA and Bennish ML. Therapy for shigellosis. I. Randomized, double-blind trial of nalidixic acid in childhood shigellosis. J Pediatr 1988;113:901-7.Salazar-Lindo E, Sack RB, Chea-Woo E, et al. Early treatment with erythromycin of Campylobacter jejuni-associated dysentery in children. J Pediatr 1986;109:355-60.Sandora TJ, Taveras EM, Shih MC, et al. A randomized, controlled trial of a multifaceted intervention including alcohol-based hand sanitizer and hand-hygiene education to reduce illness transmission in the home. Pediatrics 2005;116:587-94.Saneian H, Yaghini O, Modaresi M, et al. Lactose-free compared with lactose-containing formula in dietary management of acute childhood diarrhea. Iran J Pediatr 2012;22:82-6.Santucci KA, Anderson AC, Lewander WJ, et al. Frozen oral hydration as an alternative to conventional enteral fluids. Arch Pediatr Adolesc Med 1998;152:142-6.Sarker SA, Casswall TH, Mahalanabis D, et al. Successful treatment of rotavirus diarrhea in children with immunoglobulin from immunized bovine colostrum. Pediatr Infect Dis J 1998;17:1149-54.Schnadower D, Tarr PI, Gorelick MH, et al. Validation of the Modified Vesikari Score in Children with Gastroenteritis in 5 U.S. Emergency Departments. J Pediatr Gastroenterol Nutr 2013;57:514-9.Shai S, Perez-Becker R, von Konig CH, et al. Rotavirus disease in Germany--a prospective survey of very severe cases. Pediatr Infect Dis J 2013;32:e62-7.Sharifi J, Ghavami F, Nowrouzi Z, et al. Oral versus intravenous rehydration therapy in severe gastroenteritis. Arch Dis Child 1985;60:856-60.Shavit I, Brant R, Nijssen-Jordan C, et al. A novel imaging technique to measure capillary-refill time: improving diagnostic accuracy for dehydration in young children with gastroenteritis. Pediatrics 2006;118:2402-8.Shiferaw B, Solghan S, Palmer A, et al. Antimicrobial susceptibility patterns of Shigella isolates in Foodborne Diseases Active Surveillance Network (FoodNet) sites, 2000-2010. Clin Infect Dis 2012;54 Suppl 5:S458-63.Shkalim V, Amir A, Samra Z, et al. Characteristics of non-typhi Salmonella gastroenteritis associated with bacteremia in infants and young children. Infection 2012;40:285-9.

ESPGHAN/ESPID Guidelines for the Management of AGE in Children in Europe
Sirinavin S, Thavornnunth J, Sakchainanont B, et al. Norfloxacin and azithromycin for treatment of nontyphoidal salmonella carriers. Clin Infect Dis 2003;37:685-91.Spandorfer PR, Alessandrini EA, Joffe MD, et al. Oral versus intravenous rehydration of moderately dehydrated children: a randomized, controlled trial. Pediatrics 2005;115:295-301.Steiner MJ, Nager AL and Wang VJ. Urine specific gravity and other urinary indices: inaccurate tests for dehydration. Pediatr Emerg Care 2007;23:298-303.Strand TA, Sharma PR, Gjessing HK, et al. Risk factors for extended duration of acute diarrhea in young children. PLoS One 2012;7:e36436.Sugata K, Taniguchi K, Yui A, et al. Analysis of rotavirus antigenemia in hematopoietic stem cell transplant recipients. Transpl Infect Dis 2012;14:49-56.Sutra S, Kosuwon P, Chirawatkul A, et al. Burden of acute, persistent and chronic diarrhea, Thailand, 2010. J Med Assoc Thai 2012;95 Suppl 7:S97-107.Sykora J, Siala K, Huml M, et al. Evaluation of faecal calprotectin as a valuable non-invasive marker in distinguishing gut pathogens in young children with acute gastroenteritis. Acta Paediatr 2010;99:1389-95.Szajewska H and Skorka A. Saccharomyces boulardii for treating acute gastroenteritis in children: updated meta-analysis of randomized controlled trials. Aliment Pharmacol Ther 2009;30:960-1.Szajewska H, Skorka A, Ruszczynski M, et al. Meta-analysis: Lactobacillus GG for treating acute gastroenteritis in children--updated analysis of randomised controlled trials. Aliment Pharmacol Ther 2013;38:467-76.Teran CG, Teran-Escalera CN and Villarroel P. Nitazoxanide vs. probiotics for the treatment of acute rotavirus diarrhea in children: a randomized, single-blind, controlled trial in Bolivian children. Int J Infect Dis 2009;13:518-23.Ternhag A, Asikainen T, Giesecke J, et al. A meta-analysis on the effects of antibiotic treatment on duration of symptoms caused by infection with Campylobacter species. Clin Infect Dis 2007;44:696-700.Thoren A, Wolde-Mariam T, Stintzing G, et al. Antibiotics in the treatment of gastroenteritis caused by enteropathogenic Escherichia coli. J Infect Dis 1980;141:27-31.Trehan I, Shulman RJ, Ou CN, et al. A randomized, double-blind, placebo-controlled trial of rifaximin, a nonabsorbable antibiotic, in the treatment of tropical enteropathy. Am J Gastroenterol 2009;104:2326-33.Umamaheswari B, Biswal N, Adhisivam B, et al. Persistent diarrhea: risk factors and outcome. Indian J Pediatr 2010;77:885-8.Valentini D, Vittucci AC, Grandin A, et al. Coinfection in acute gastroenteritis predicts a more severe clinical course in children. Eur J Clin Microbiol Infect Dis 2013;32:909-15.van den Berg J and Berger MY. Guidelines on acute gastroenteritis in children: a critical appraisal of their quality and applicability in primary care. BMC Fam Pract 2011;12:134.Vandenberg O, Robberecht F, Dauby N, et al. Management of a Cryptosporidium hominis outbreak in a day-care center. Pediatr Infect Dis J 2012;31:10-5.Vandenplas Y and De Hert SG. Randomised clinical trial: the synbiotic food supplement Probiotical vs. placebo for acute gastroenteritis in children. Aliment Pharmacol Ther 2011;34:862-7.Varavithya W, Posayanond P, Tontisirin K, et al. Oral hydration in infantile diarrhoea. Southeast Asian J Trop Med Public Health 1978;9:414-9.Varsano I, Eidlitz-Marcus T, Nussinovitch M, et al. Comparative efficacy of ceftriaxone and ampicillin for treatment of severe shigellosis in children. J Pediatr 1991;118:627-32.Verrotti A, Tocco AM, Coppola GG, et al. Afebrile benign convulsions with mild gastroenteritis: a new entity? Acta Neurol Scand 2009;120:73-9.Vinh H, Anh VT, Anh ND, et al. A multi-center randomized trial to assess the efficacy of gatifloxacin versus ciprofloxacin for the treatment of shigellosis in Vietnamese children. PLoS Negl Trop Dis 2011;5:e1264.

ESPGHAN/ESPID Guidelines for the Management of AGE in Children in Europe
Vrints M, Mairiaux E, Van Meervenne E, et al. Surveillance of antibiotic susceptibility patterns among Shigella sonnei strains isolated in Belgium during the 18-year period 1990 to 2007. J Clin Microbiol 2009;47:1379-85.Vukelic D, Trkulja V and Salkovic-Petrisic M. Single oral dose of azithromycin versus 5 days of oral erythromycin or no antibiotic in treatment of campylobacter enterocolitis in children: a prospective randomized assessor-blind study. J Pediatr Gastroenterol Nutr 2010;50:404-10.Wadhwa N, Natchu UC, Sommerfelt H, et al. ORS containing zinc does not reduce duration or stool volume of acute diarrhea in hospitalized children. J Pediatr Gastroenterol Nutr 2011;53:161-7.Waisbourd-Zinman O, Ben-Ziony S, Solter E, et al. Hospitalizations for nosocomial rotavirus gastroenteritis in a tertiary pediatric center: a 4-year prospective study. Am J Infect Control 2009;37:465-9.Waisbourd-Zinman O, Ben-Ziony S, Solter E, et al. The percentage of nosocomial-related out of total hospitalizations for rotavirus gastroenteritis and its association with hand hygiene compliance. Am J Infect Control 2011;39:166-8.Wiegering V, Kaiser J, Tappe D, et al. Gastroenteritis in childhood: a retrospective study of 650 hospitalized pediatric patients. Int J Infect Dis 2011;15:e401-7.Wildi-Runge S, Allemann S, Schaad UB, et al. A 4-year study on clinical characteristics of children hospitalized with rotavirus gastroenteritis. Eur J Pediatr 2009;168:1343-8.Williams DJ, Edwards KM, Payne DC, et al. Decline in gastroenteritis-related triage calls after rotavirus vaccine licensure. Pediatrics 2012;130:e872-8.Williams MD, Schorling JB, Barrett LJ, et al. Early treatment of Campylobacter jejuni enteritis. Antimicrob Agents Chemother 1989;33:248-50.Wong CS, Mooney JC, Brandt JR, et al. Risk factors for the hemolytic uremic syndrome in children infected with Escherichia coli O157:H7: a multivariable analysis. Clin Infect Dis 2012;55:33-41.Yung M and Keeley S. Randomised controlled trial of intravenous maintenance fluids. J Paediatr Child Health 2009;45:9-14.