specworld.inspecworld.in/wp-content/uploads/2019/03/unit-2.docx · web viewspecworld.in
TRANSCRIPT

UNIT IIDATA MINING
2.1 What motivated data mining? Why is it important?The major reason that data mining has attracted a great deal of attention in information industry inrecent years is due to the wide availability of huge amounts of data and the imminent need for turning such data into useful information and knowledge. The information and knowledge gained can be used for applications ranging from business management, production control, and market analysis, to engineering design and science exploration.
2.2 What is data mining?Data mining refers to, extracting or mining" knowledge from large amounts of data. There aremany other terms related to data mining, such as knowledge mining, knowledge extraction, data/pattern analysis, data archaeology, and data dredging. Many people treat data mining as asynonym for another popularly used term, Knowledge Discovery in Databases", or KDD
2.3 Knowledge Discovery of Data (KDD)Essential step in the process of knowledge discovery in databases
Knowledge discovery as a process is depicted in following figure and consists of an iterativesequence of the following steps:
data cleaning: to remove noise or irrelevant data data integration: where multiple data sources may be combined
data selection: where data relevant to the analysis task are retrieved from the database
data transformation: where data are transformed or consolidated into forms appropriate for mining by performing summary or aggregation operations
data mining :an essential process where intelligent methods are applied in order to extract data patterns
pattern evaluation to identify the truly interesting patterns representing knowledge based on some interestingness measures
knowledge presentation: where visualization and knowledge representation techniques are used to present the mined knowledge to the user.
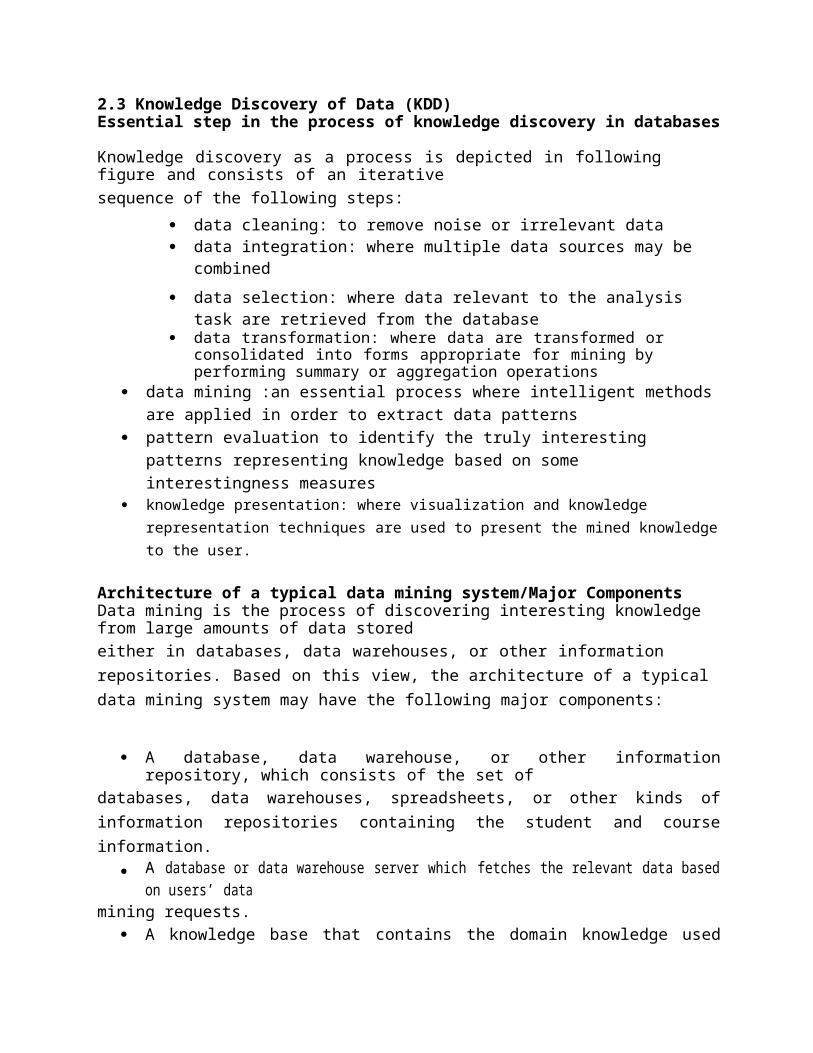
Architecture of a typical data mining system/Major ComponentsData mining is the process of discovering interesting knowledge from large amounts of data storedeither in databases, data warehouses, or other information repositories. Based on this view, the architecture of a typical data mining system may have the following major components:
A database, data warehouse, or other information repository, which consists of the set of
databases, data warehouses, spreadsheets, or other kinds of information repositories containing the student and course information.
A database or data warehouse server which fetches the relevant data based on users’ data
mining requests. A knowledge base that contains the domain knowledge used to guide the search or to
evaluate the interestingness of resulting patterns. For example, the knowledge base may contain metadata which describes data from multiple heterogeneous sources.
A data mining engine, which consists of a set of functional modules for tasks such as classification, association, classification, cluster analysis, and evolution and deviation analysis.
A pattern evaluation module that works in tandem with the data mining modules by employing interestingness measures to help focus the search towards interestingness patterns.
A graphical user interface that allows the user an interactive approach to the data mining
How is a data warehouse different from a database? How are they similar?
Differences between a data warehouse and a database: A data warehouse is a repository ofinformation collected from multiple sources, over a history of time, stored under a unified schema, and used for data analysis and decision support; whereas a database, is a collection of interrelated data that represents the current status of the stored data. There could be multiple heterogeneous databases where the schema of one database may not agree with the schema of another. A database system supports ad-hoc query and on-line transaction processing.
Similarities between a data warehouse and a database: Both are repositories of information,storing huge amounts of persistent data.
2.2.1 Data mining: on what kind of data? / Describe the following advanced database systemsand applications: object-relational databases, spatial databases, text databases, multimedia databases, the World Wide Web.In principle, data mining should be applicable to any kind of information repository. This includesrelational databases, data warehouses, transactional databases, advanced database system, flat files and the World-Wide Web. Advanced database systems include object-oriented and object- relational databases, and special c application-oriented databases, such as spatial databases, time- series databases, text databases, and multimedia databases.
Flat files: Flat files are actually the most common data source for data mining algorithms,especially at the research level. Flat files are simple data files in text or binary format with a structure known by the data mining algorithm to be applied. The data in these files can be transactions, time-series data, scientific measurements, etc.

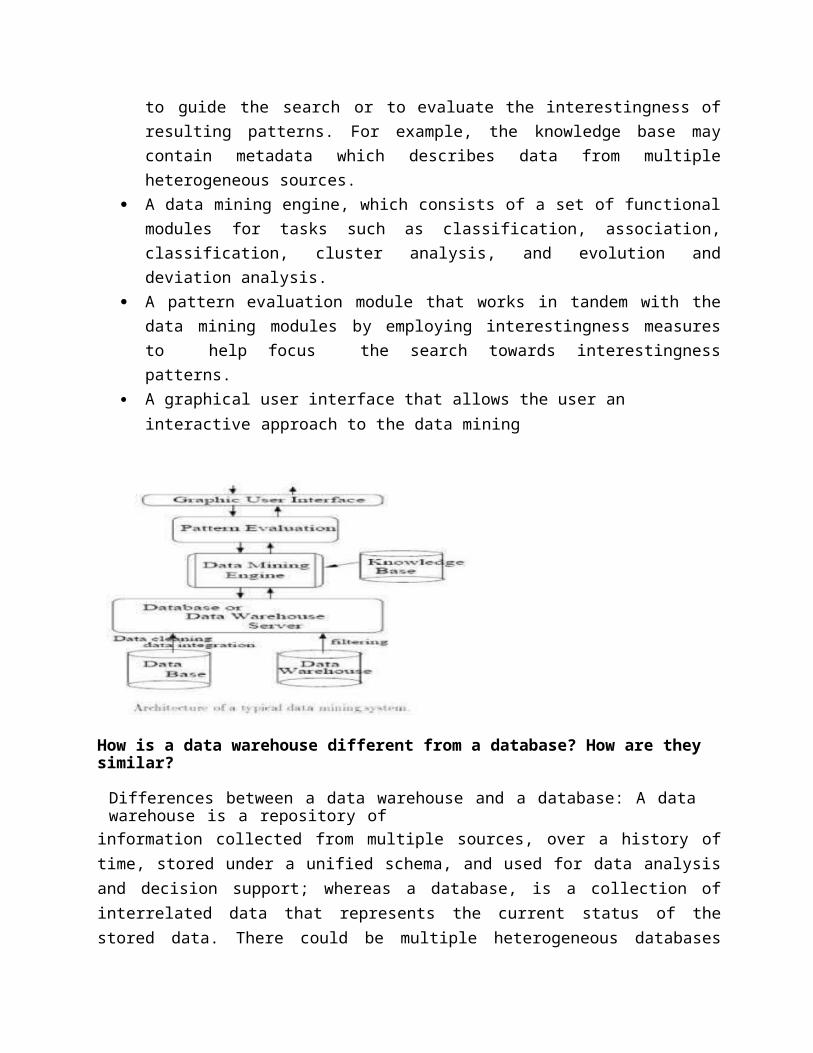
Relational Databases: a relational database consists of a set of tables containing either values ofentity attributes, or values of attributes from entity relationships. Tables have columns and rows, where columns represent attributes and rows represent tuples. A tuple in a relational table corresponds to either an object or a relationship between objects and is identified by a set of attribute values representing a unique key. In following figure it presents some relations Customer, Items, and Borrow representing business activity in a video store. These relations are just a subset of what could be a database for the video store and is given as an example.
The most commonly used query language for relational database is SQL, which allows retrievaland manipulation of the data stored in the tables, as well as the calculation of aggregate functions such as average, sum, min, max and count. For instance, an SQL query to select the videos grouped by category would be:
SELECT count(*) FROM Items WHERE type=video GROUP BY category.
ata mining algorithms using relational databases can be more versatile than data mining algorithmsspecifically written for flat files, since they can take advantage of the structure inherent to relational databases. While data mining can benefit from SQL for data selection, transformation and consolidation, it goes beyond what SQL could provide, such as predicting, comparing, detecting deviations, etc.
Data warehousesA data warehouse is a repository of information collected from multiple sources, stored under a
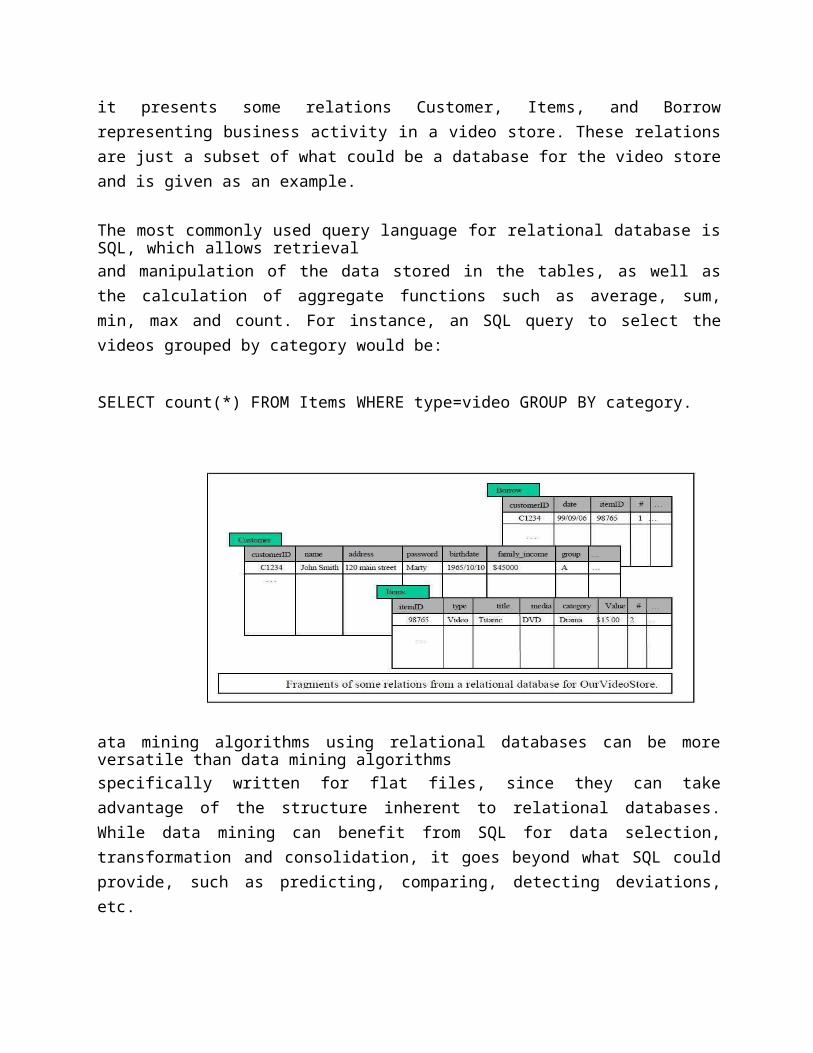
unified schema, and which usually resides at a single site. Data warehouses are constructed via a process of data cleansing, data transformation, data integration, data loading, and periodic data refreshing. The figure shows the basic architecture of a data warehouse.
In order to facilitate decision making, the data in a data warehouse are organized around majorsubjects, such as customer, item, supplier, and activity. The data are stored to provide information from a historical perspective and are typically summarized.
A data warehouse is usually modeled by a multidimensional database structure, where eachdimension corresponds to an attribute or a set of attributes in the schema, and each cell stores the value of some aggregate measure, such as count or sales amount. The actual physical structure of a data warehouse may be a relational data store or a multidimensional data cube. It provides a multidimensional view of data and allows the precomputation and fast accessing summarized data.
The data cube structure that stores the primitive or lowest level of information is called a basecuboid. Its corresponding higher level multidimensional (cube) structures are called (non-base) cuboids. A base cuboid together with all of its corresponding higher level cuboids form a data cube. By providing multidimensional data views and the precomputation of summarized data, data warehouse systems are well suited for On-Line
Analytical Processing, or OLAP. OLAP operations make use of background knowledge regardingthe domain of the data being studied in order to allow the presentation of data at different levels of abstraction. Such operations accommodate different user viewpoints. Examples of OLAP operations include drill-down and roll-up, which allow the user to view the data at differing degrees of summarization, as illustrated in above figure.
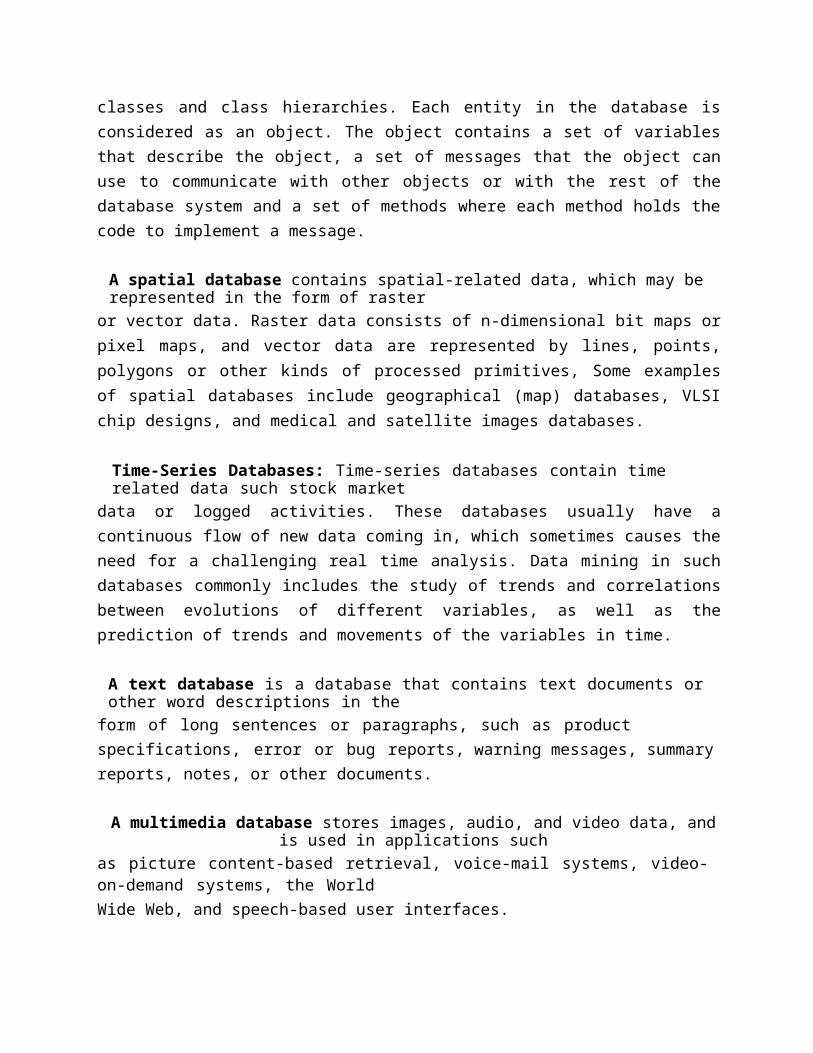
Transactional databasesIn general, a transactional database consists of a flat file where each record represents a
transaction. A transaction typically includes a unique transaction identity number (trans ID), and a list of the items making up the transaction (such as items purchased in a store) as shown below:
SALES
Advanced database systems and advanced database applications
An objected-oriented database is designed based on the object-oriented programmingparadigm where data are a large number of objects organized into classes and class hierarchies. Each entity in the database is considered as an object. The object contains a set of variables that describe the object, a set of messages that the object can use to communicate with other objects or with the rest of the database system and a set of methods where each method holds the code to implement a message.
A spatial database contains spatial-related data, which may be represented in the form of raster
or vector data. Raster data consists of n-dimensional bit maps or pixel maps, and vector data are represented by lines, points, polygons or other kinds of processed primitives, Some examples of spatial databases include geographical (map) databases, VLSI chip designs, and medical and satellite images databases.
Time-Series Databases: Time-series databases contain time related data such stock marketdata or logged activities. These databases usually have a continuous flow of new data coming in, which sometimes causes the need for a challenging real time analysis. Data mining in such databases commonly includes the study of trends and correlations between evolutions of different variables, as well as the prediction of trends and movements of the variables in time.
A text database is a database that contains text documents or other word descriptions in theform of long sentences or paragraphs, such as product specifications, error or bug reports, warning messages, summary reports, notes, or other documents.
A multimedia database stores images, audio, and video data, and is used in applications suchas picture content-based retrieval, voice-mail systems, video-on-demand systems, the World
Wide Web, and speech-based user interfaces.
The World-Wide Web provides rich, world-wide, on-line information services, where dataobjects are linked together to facilitate interactive access. Some examples of distributed information services associated with the World-Wide Web include America Online, Yahoo!, AltaVista, and Prodigy.
2.4 Data mining functionalities/Data mining tasks: what kinds of patterns can be mined?Data mining functionalities are used to specify the kind of patterns to be found in data miningtasks. In general, data mining tasks can be classified into two categories:
Descriptive Predictive
Descriptive mining tasks characterize the general properties of the data in the database. Predictivemining tasks perform inference on the current data in order to make predictions.
Describe data mining functionalities, and the kinds of patterns they can discover (or)Define each of the following data mining functionalities: characterization, discrimination,association and correlation analysis, classification, prediction, clustering, and evolution analysis. Give examples of each data mining functionality, using a real-life database that you are familiar with.
2 .4.1 Concept/class description: characterization and discriminationData can be associated with classes or concepts. It describes a given set of data in a concise andsummarative manner, presenting interesting general properties of the data. These descriptions can be derived via data characterization, by summarizing the data of the class under study (often called the target class) data discrimination, by comparison of the target class with one or a set of comparative classes both data characterization and discrimination.
Data characterizationIt is a summarization of the general characteristics or features of a target class of data.
Example: A data mining system should be able to produce a description summarizing thecharacteristics of a student who has obtained more than 75% in every semester; the result could be a general profile of the student.Data Discrimination is a comparison of the general features of target class data objects with thegeneral features of objects from one or a set of contrasting classes.
Example
The general features of students with high GPA’s may be compared with the general features of students with low GPA’s. The resulting description could be a general comparative profile of the students such as 75% of the students with high GPA’s are fourth-year computing science students while 65% of the students with low GPA’s are not.The output of data characterization can be presented in various forms. Examples include pie charts, bar charts, curves, multidimensional data cubes, and multidimensional tables, including crosstabs. The resulting descriptions can also be presented as generalized relations, or in rule form called characteristic rules.
Discrimination descriptions expressed in rule form are referred to as discriminant rules.
2.4.2 Mining Frequent Patterns, Association and Correlations
It is the discovery of association rules showing attribute-value conditions that occur frequentlytogether in a given set of data. For example, a data mining system may find association rules like
major(X, “computing science””) ⇒ owns(X, “personal computer”)
[support = 12%, confidence = 98%]
where X is a variable representing a student. The rule indicates that of the students under study,12% (support) major in computing science and own a personal computer. There is a 98%probability (confidence, or certainty) that a student in this group owns a personal computer.
Example:A grocery store retailer to decide whether to but bread on sale. To help determine the impact ofthis decision, the retailer generates association rules that show what other products are frequently purchased with bread. He finds 60% of the times that bread is sold so are pretzels and that 70% of the time jelly is also sold. Based on these facts, he tries to capitalize on the association between bread, pretzels, and jelly by placing some pretzels and jelly at the end of the aisle where the bread is placed. In addition, he decides not to place either of these items on sale at the same time.
2.4.3 Classification and prediction
Classification: Classification: It predicts categorical class labels
It classifies data (constructs a model) based on the training set and the values (class labels)in a classifying attribute and uses it in classifying new data
Typical Applications credit approval o target marketing o medical diagnosis treatment effectiveness analysis
Classification can be defined as the process of finding a model (or function) that describes and distinguishes data classes or concepts, for the purpose of being able to use the model to predict

the class of objects whose class label is unknown. The derived model is based on the analysis of a set of training data (i.e., data objects whose class label is known).
Example:
An airport security screening station is used to deter mine if passengers are potential terrorist orcriminals. To do this, the face of each passenger is scanned and its basic pattern(distance between eyes, size, and shape of mouth, head etc) is identified. This pattern is compared to entries in a database to see if it matches any patterns that are associated with known offenders
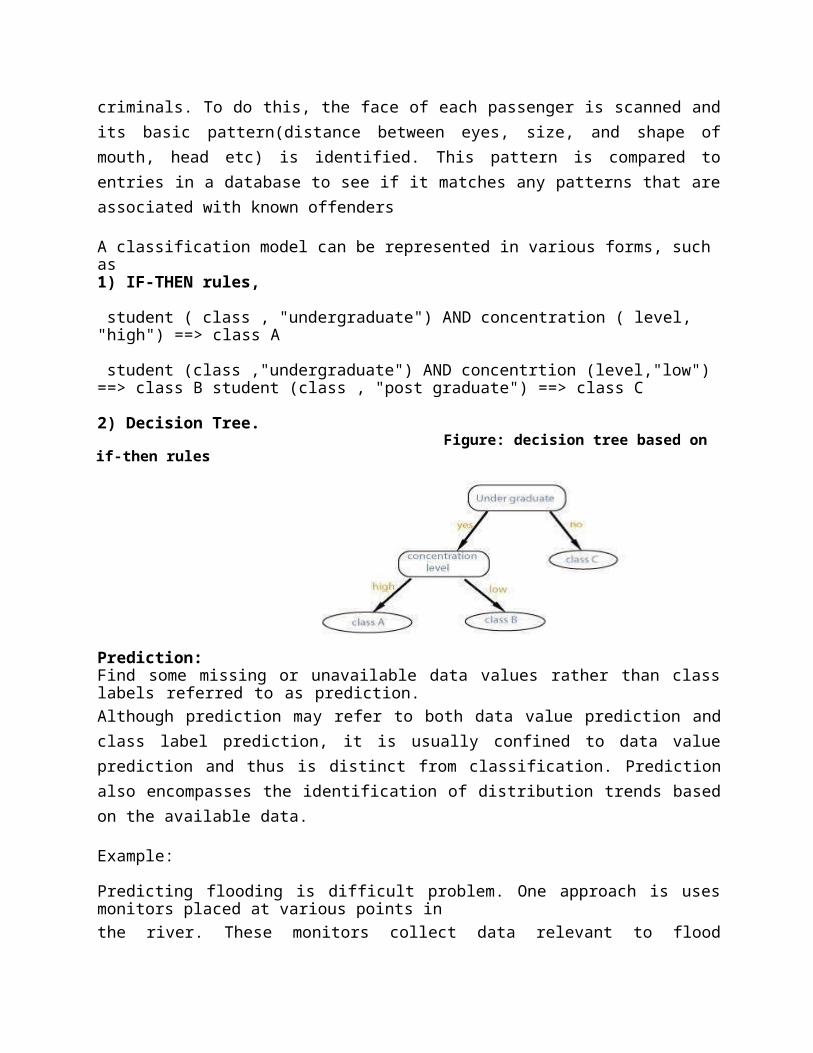
A classification model can be represented in various forms, such as1) IF-THEN rules, student ( class , "undergraduate") AND concentration ( level, "high") ==> class A
student (class ,"undergraduate") AND concentrtion (level,"low") ==> class B student (class , "post graduate") ==> class C
2) Decision Tree. Figure: decision tree based on if-then rules
Prediction:Find some missing or unavailable data values rather than class labels referred to as prediction.Although prediction may refer to both data value prediction and class label prediction, it is usually confined to data value prediction and thus is distinct from classification. Prediction also encompasses the identification of distribution trends based on the available data.
Example:
Predicting flooding is difficult problem. One approach is uses monitors placed at various points inthe river. These monitors collect data relevant to flood prediction: water level, rain amount, time, humidity etc. These water levels at a potential flooding point in the river can be predicted based on the data collected by the sensors upriver from this point. The prediction must be made with respect to the time the data were collected.
Classification vs. PredictionClassification differs from prediction in that the former is to construct a set of models (or functions)that describe and distinguish data class or concepts, whereas the latter is to predict some missing or unavailable, and often numerical, data values. Their similarity is that they are both tools for prediction: Classification is used for predicting the class label of data objects and prediction is typically used for predicting missing numerical data values.
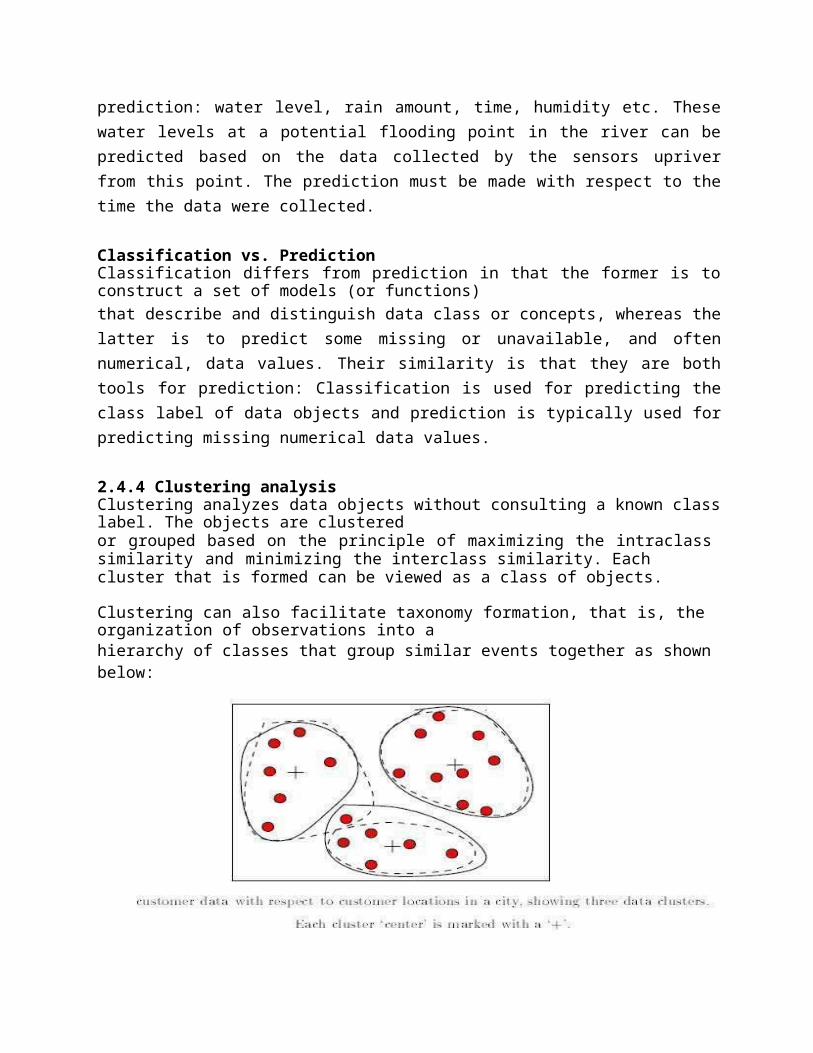
2.4.4 Clustering analysisClustering analyzes data objects without consulting a known class label. The objects are clusteredor grouped based on the principle of maximizing the intraclass similarity and minimizing the interclass similarity. Each cluster that is formed can be viewed as a class of objects.
Clustering can also facilitate taxonomy formation, that is, the organization of observations into ahierarchy of classes that group similar events together as shown below:
Example:
A certain national department store chain creates special catalogs targeted to various demographicgroups based on attributes such as income, location and physical characteristics of potential customers (age, height, weight, etc). To determine the target mailings of the various catalogs and to assist in the creation of new, more specific catalogs, the company performs a clustering of potential customers based on the determined attribute values. The results of the clustering exercise are the used by management to create special catalogs and distribute them to the correct target population based on the cluster for that catalog.
Classification vs. Clustering

In general, in classification you have a set of predefined classes and want to know which class a new object belongs to. Clustering tries to group a set of objects and find whether there is some relationship between the objects.
In the context of machine learning, classification is supervised learning and clustering isunsupervised learning.
2.4.5 Outlier analysis: A database may contain data objects that do not comply with general model of data. These data objects are outliers. In other words, the data objects which do not fall within the cluster will be called as outlier data objects. Noisy data or exceptional data are also called as outlier data. The analysis of outlier data is referred to as outlier mining.
Example
Outlier analysis may uncover fraudulent usage of credit cards by detecting purchases of extremelylarge amounts for a given account number in comparison to regular charges incurred by the same account. Outlier values may also be detected with respect to the location and type of purchase, or the purchase frequency.
2.4.6 Data evolution analysis describes and models regularities or trends for objects whose behavior changes over time.
Example:The data of result the last several years of a college would give an idea if quality of graduatedproduced by it.
Correlation analysisCorrelation analysis is a technique use to measure the association between two variables. Acorrelation coefficient (r) is a statistic used for measuring the strength of a supposed linear association between two variables. Correlations range from -1.0 to +1.0 in value.
A correlation coefficient of 1.0 indicates a perfect positive relationship in which high values of one variable are related perfectly to high values in the other variable, and conversely, low values on one variable are perfectly related to low values on the other variable.
A correlation coefficient of 0.0 indicates no relationship between the two variables. That is, one cannot use the scores on one variable to tell anything about the scores on the second variable.
A correlation coefficient of -1.0 indicates a perfect negative relationship in which high values of one variable are related perfectly to low values in the other variables, and conversely, low values in one variable are perfectly related to high values on the other variable.
What is the difference between discrimination and classification? Between characterization and clustering? Between classification and prediction? For each of these pairs of tasks, how are they similar?
Answer:
Discrimination differs from classification in that the former refers to a comparison of the generalfeatures of target class data objects with the general features of objects from one or a set ofcontrasting classes, while the latter is the process of finding a set of models (or functions) thatdescribe and distinguish data classes or concepts for the purpose of being able to use the model to predict the class of objects whose class label is unknown.
Discrimination and classification are similar in that they both deal with the analysis of class dataobjects.
Characterization differs from clustering in that the former refers to a summarization of thegeneral characteristics or features of a target class of data while the latter deals with the analysis of data objects without consulting a known class label. This pair of tasks is similar in that theyboth deal with grouping together objects or data that are related or have high similarity in comparison to one another.
Classification differs from prediction in that the former is the process of finding a set of models (or functions) that describe and distinguish data class or concepts while the latter predicts missing or unavailable, and often numerical, data values. This pair of tasks is similar in that they both are tools for
Prediction: Classification is used for predicting the class label of data objects and prediction is typically used for predicting missing numerical data values.
Are all of the patterns interesting? / What makes a pattern interesting?
A pattern is interesting if, It is easily understood by humans, Valid on new or test data with somedegree of certainty, Potentially useful, and Novel.
A pattern is also interesting if it validates a hypothesis that the user sought to confirm. Aninteresting pattern represents knowledge.
2.5 Classification of data mining systemsThere are many data mining systems available or being developed. Some are specialized systemsdedicated to a given data source or are confined to limited data mining functionalities, other are more versatile and comprehensive. Data mining systems can be categorized according to various criteria among other classification are the following:
Classification according to the type of data source mined: this classification categorizes data
mining systems according to the type of data handled such as spatial data, multimedia data, time- series data, text data, World Wide Web, etc.
Classification according to the data model drawn on: this classification categorizes datamining systems based on the data model involved such as relational database, object-oriented database, data warehouse, transactional, etc.
Classification according to the king of knowledge discovered: this classification categorizes
data mining systems based on the kind of knowledge discovered or data mining functionalities, such as characterization, discrimination, association, classification, clustering, etc. Some systems tend to be comprehensive systems offering several data mining functionalities together.
Classification according to mining techniques used: Data mining systems employ and provide
different techniques. This classification categorizes data mining systems according to the data analysis approach used such as machine learning, neural networks, genetic algorithms, statistics, visualization, database oriented or data warehouse-oriented, etc. The classification can also take into account the degree of user interaction involved in the data mining process such as query- driven systems, interactive exploratory systems, or autonomous systems. A comprehensive system would provide a wide variety of data mining techniques to fit different situations and options, and offer different degrees of user interaction.
2.5.1 Five primitives for specifying a data mining taskTask-relevant data: This primitive specifies the data upon which mining is to be performed. It
involves specifying the database and tables or data warehouse containing the relevant data, conditions for selecting the relevant data, the relevant attributes or dimensions for exploration, and instructions regarding the ordering or grouping of the data retrieved.
Knowledge type to be mined: This primitive specifies the specific data mining function to beperformed, such as characterization, discrimination, association, classification, clustering, or evolution analysis. As well, the user can be more specific and provide pattern templates that all discovered patterns must match. These templates or meta patterns (also called meta rules or meta queries), can be used to guide the discovery process.
Background knowledge: This primitive allows users to specify knowledge they have about the
domain to be mined. Such knowledge can be used to guide the knowledge discovery process and evaluate the patterns that are found. Of the several kinds of background knowledge, this chapter focuses on concept hierarchies.
Pattern interestingness measure: This primitive allows users to specify functions that are used
to separate uninteresting patterns from knowledge and may be used to guide the mining process,
as well as to evaluate the discovered patterns. This allows the user to confine the number of uninteresting patterns returned by the process, as a data mining process may generate a large number of patterns. Interestingness measures can be specified for such pattern characteristics as simplicity, certainty, utility and novelty.
Visualization of discovered patterns: This primitive refers to the form in which discoveredpatterns are to be displayed. In order for data mining to be effective in conveying knowledge to users, data mining systems should be able to display the discovered patterns in multiple forms suchas rules, tables, cross tabs (cross-tabulations), pie or bar charts, decision trees, cubes or other visualrepresentations.
2.5.2 Integration of a Data Mining System with a Database or Data Warehouse SystemThe differences between the following architectures for the integration of a data mining systemwith a database or data warehouse system are as follows.
No coupling:The data mining system uses sources such as flat files to obtain the initial data set to be minedsince no database system or data warehouse system functions are implemented as part of the process. Thus, this architecture represents a poor design choice.
Loose couplingThe data mining system is not integrated with the database or data warehouse system beyond theiruse as the source of the initial data set to be mined, and possible use in storage of the results. Thus, this architecture can take advantage of the flexibility, efficiency and features such as indexing that the database and data warehousing systems may provide. However, it is difficult for loose coupling to achieve high scalability and good performance with large data sets as many such systems are memory-based.
Semitight coupling:Some of the data mining primitives such as aggregation, sorting or pre computation of statisticalfunctions are efficiently implemented in the database or data warehouse system, for use by the data mining system during mining-query processing. Also, some frequently used inter mediate mining results can be pre computed and stored in the database or data warehouse system, thereby enhancing the performance of the data mining system.
Tight coupling:The database or data warehouse system is fully integrated as part of the data mining system andthereby provides optimized data mining query processing. Thus, the data mining sub system is treated as one functional component of an information system. This is a highly desirable architecture as it facilitates efficient implementations of data mining functions, high system performance, and an integrated information processing environment.
From the descriptions of the architectures provided above, it can be seen that tight coupling is the
best alternative without respect to technical or implementation issues. However, as much of the technical infrastructure needed in a tightly coupled system is still evolving, implementation of such a system is non-trivial. Therefore, the most popular architecture is currently semi tight coupling as it provides a compromise between loose and tight coupling.
2.5.3 Major issues in data mining Major issues in data mining is regarding mining methodology, user interaction, performance, and diverse data types
1. Mining methodology and user-interaction issues:Mining different kinds of knowledge in databases: Since different users can be interested indifferent kinds of knowledge, data mining should cover a wide spectrum of data analysis and knowledge discovery tasks, including data characterization, discrimination, association, classification, clustering, trend and deviation analysis, and similarity analysis. These tasks may use the same database in different ways and require the development of numerous data mining techniques.
Interactive mining of knowledge at multiple levels of abstraction: Since it is difficult to knowexactly what can be discovered within a database, the data mining process should be interactive.
_ Incorporation of background knowledge: Background knowledge, or information regardingthe domain under study, may be used to guide the discovery patterns. Domain knowledge related to databases, such as integrity constraints and deduction rules, can help focus and speed up a data mining process, or judge the interestingness of discovered patterns.
_ Data mining query languages and ad-hoc data mining: Knowledge in Relational querylanguages (such as SQL) required since it allow users to pose ad-hoc queries for data retrieval.
_ Presentation and visualization of data mining results: Discovered knowledge should beexpressed in high-level languages, visual representations, so that the knowledge can be easily understood and directly usable by humans
_ Handling outlier or incomplete data: The data stored in a database may reflect outliers: noise,exceptional cases, or incomplete data objects. These objects may confuse the analysis process, causing over fitting of the data to the knowledge model constructed. As a result, the accuracy of the discovered patterns can be poor. Data cleaning methods and data analysis methods which can handle outliers are required.
_ Pattern evaluation: refers to interestingness of pattern: A data mining system can uncover
thousands of patterns. Many of the patterns discovered may be uninteresting to the given user, representing common knowledge or lacking novelty. Several challenges remain regarding the development of techniques to assess the interestingness of discovered patterns,
2. Performance issues. These include efficiency, scalability, and parallelization of data miningalgorithms._ Efficiency and scalability of data mining algorithms: To effectively extract information from a huge amount of data in databases, data mining algorithms must be efficient and scalable._ Parallel, distributed, and incremental updating algorithms: Such algorithms divide the datainto partitions, which are processed in parallel. The results from the partitions are then merged.
3. Issues relating to the diversity of database types_ Handling of relational and complex types of data: Since relational databases and datawarehouses are widely used, the development of efficient and effective data mining systems for such data is important._ Mining information from heterogeneous databases and global information systems: Localand wide-area computer networks (such as the Internet) connect many sources of data, forming huge, distributed, and heterogeneous databases. The discovery of knowledge from different sources of structured, semi-structured, or unstructured data with diverse data semantics poses great challenges to data mining.
2.6 Data preprocessingData preprocessing describes any type of processing performed on raw data to prepare it for another processing procedure. Commonly used as a preliminary data mining practice, data preprocessing transforms the data into a format that will be more easily and effectively processed for the purpose of the user.Data preprocessing describes any type of processing performed on raw data to prepare it foranother processing procedure. Commonly used as a preliminary data mining practice, data preprocessing transforms the data into a format that will be more easily and effectively processed for the purpose of the user
2.6.1 Why Data Preprocessing?Data in the real world is dirty. It can be in incomplete, noisy and inconsistent from. These dataneeds to be preprocessed in order to help improve the quality of the data, and quality of the mining results.
If no quality data, then no quality mining results. The quality decision is always based on the quality data.
If there is much irrelevant and redundant information present or noisy and unreliable
data, then knowledge discovery during the training phase is more difficult
Incomplete data: lacking attribute values, lacking certain attributes of interest, or containing only aggregate data. e.g., occupation=“ ”.
Noisy data: containing errors or outliers data. e.g., Salary=“-10” Incomplete Data: Containing discrepancies in codes or names . e.g, AGE =“42 Birthday =” 03/07/1997Incomplete data may come from
“Not applicable” data value when Different considerations between the time when the data was collected and when it
is nalyzed
Human/hardware/software problems
Noisy data (incorrect values) may come
Faulty data collection by instruments
Human ot computer error ar data entry
Errors in data transmission
Inconsistent data may come from different data sources
Functional dependency violation(eg: modify some linked data)
Major Tasks in Data Preprocessing
Data cleaning Fill in missing values, smooth noisy data, identify or remove outliers, and resolve inconsistencies Data integration

Integration of multiple databases, data cubes, or files
Data transformationNormalization and aggregation
Data reductionObtains reduced representation in volume but produces the same or similar analytical results
Data discretizationPart of data reduction but with particular importance, especially for numerical data
Forms of Data Preprocessing.
2.6.2 Descriptive Data Summarization
Categorize the measures: A measure is distributive, if we can partition the dataset into smallersubsets, compute the measure on the individual subsets, and then combine the partial results in order to arrive at the measure’s value on the entire (original) dataset.
A measure is algebraic if it can be computed by applying an algebraic function to one or moredistributive measures.
A measure is holistic if it must be computed on the entire dataset as a whole.
2.6.3 Measure the Central TendencyA measure of central tendency is a single value that attempts to describe a set of data by identifyingthe central position within that set of data. As such, measures of central tendency are sometimes called measures of central location.In other words, in many real-life situations, it is helpful to describe data by a single number that ismost representative of the entire collection of numbers. Such a number is called a measure of central tendency. The most commonly used measures are as follows. Mean, Median, and Mode
Mean: mean, or average, of numbers is the sum of the numbers divided by n. That is:

Example 1The marks of seven students in a mathematics test with a maximum possible mark of 20 are
given below:
15 13 18 16 14 17 12
Find the mean of this set of data values.
Solution:
So, the mean mark is 15.
MidrangeThe midrange of a data set is the average of the minimum and maximum values.
Median: median of numbers is the middle number when the numbers are written in order.If is even, the median is the average of the two middle numbers.
Example 2The marks of nine students in a geography test that had a maximum possible mark of 50 are givenbelow: 47 35 37 32 38 39 36 34 35
Find the median of this set of data values.
Solution:Arrange the data values in order from the lowest value to the highest value:
32 34 35 35 36 37 38 39 47
The fifth data value, 36, is the middle value in this arrangement.
So, the mean mark is 15.
In general:
If the number of values in the data set is even, then the median is the average of the two middlevalues.
Example 3Find the median of the following data set:
Solution:Arrange the data values in order from the lowest value to the highest value: 10 12 13 16 17 18 19
21
The number of values in the data set is 8, which is even. So, the median is the average of the two middle values.

12 18 16 21 10 13 17 19Trimmed meanA trimming mean eliminates the extreme observations by removing observations from each endof the ordered sample. It is calculated by discarding a certain percentage of the lowest and the highest scores and then computing the mean of the remaining scores.
Mode of numbers is the number that occurs most frequently. If two numbers tie for most frequentoccurrence, the collection has two modes and is called bimodal.
The mode has applications in printing . For example, it is important to print more of the mostpopular books; because printing different books in equal numbers would cause a shortage of some books and an oversupply of others.
Likewise, the mode has applications in manufacturing. For example, it is important to manufacturemore of the most popular shoes; because manufacturing different shoes in equal numbers would cause a shortage of some shoes and an oversupply of others.