· web viewthe excitation source was an 808-nm diode laser at a power density of 40 mw cm-2, and...
TRANSCRIPT
A Nnovel Mmultimodal NIR-II Nnanoprobe for the Ddetection of Mmetastatic Llymph nodes and tTargeting Cchemo--Pphotothermal Ttherapy in Ooral
Ssquamous Ccell CcarcinomaYufeng Wang1,2*, Wansu Zhang3*, Pengfei Sun3, Yu Cai2, Wenguang Xu1,2, Quli
Fan3#, Qingang Hu1,2#, Wei Han 1,2#.
1. Department of Oral and Maxillofacial Surgery, Nanjing Stomatological
Hospital, Medical School of Nanjing University, No 30 Zhongyang Road, Nanjing
210008, China.
2. Central Laboratory of Stomatology, Nanjing Stomatological Hospital, Medical
School of Nanjing University, No 22 Hankou Road, Nanjing 210093, China.
3. Key Laboratory for Organic Electronics and Information Displays & Jiangsu
Key Laboratory for Biosensors, Institute of Advanced Materials (IAM), Jiangsu
National Synergetic Innovation Center for Advanced Materials (SICAM),
Nanjing University of Posts & Telecommunications, No 9 Wenyuan Road,
Nanjing 210023, China.
#Corresponding authors:
Wei Han, Department of Oral and Maxillofacial Surgery, Nanjing
Stomatological Hospital, Medical School of Nanjing University, Nanjing, China.
Phone: +86-025-83620140; Fax: +86-025-83620140; E-mail:
Qingang Hu, Department of Oral and Maxillofacial Surgery, Nanjing
Stomatological Hospital, Medical School of Nanjing University, Nanjing, China.
Phone: +86-025-83620202; Fax: +86-025-83620202; E-mail: [email protected];
Quli Fan, Key Laboratory for Organic Electronics and Information Displays &
Jiangsu Key Laboratory for Biosensors, Institute of Advanced Materials (IAM),
Jiangsu National Synergetic Innovation Center for Advanced Materials
(SICAM), Nanjing University of Posts & Telecommunications, Nanjing, China.
Phone: +86-025-83620173; Fax: +86-025-83620173; E-mail:
1

*These authors contributed equally to this work.
[Please add page number]
Abstract: Current surgical treatment for oral squamous cell carcinoma (OSCC) must be as
precise as possible to fully resect the tumors and preserve functional tissues.
Thus, it is urgent to develop efficient fluorescent probes to clearly identify tumor
delineation, as well as metastatic lymph nodes. Combined photothermal and
chemotherapy Chemo-photothermal therapy combination attracted a growing
attention to increase anti-tumor effect in various types kinds of cancer tumors,
including OSCC. In the present study, we designed a multimodal NIR-II probe
that involves involving combining photothermal therapy with chemotherapy a
combination of photothermal and chemotherapy, imaging OSCC tumors and
detecting metastatic lymph nodes.
Methods: In this study, we synthesized a novel near infrared (NIR)-II probe
named TQTPA [spell out] [4,4'-((6,7-bis(4-(hexyloxy)phenyl)-[1,2,5]thiadiazolo
[3,4-g]quinoxaline-4,9-diyl)bis(thiophene-5,2-diyl))bis(N,N-diphenylaniline)] via the
Suzuki reaction and prepared multimodal nanoparticles (NPs) loading TQTPA
and cis-Ddichlorodiammine platinum (CDDP) (HT@CDDP) by hyaluronic acid.
The characteristics of the NPs, including their photothermal and imaging capabilities,
The characteristics [specify what type of characteristics (physico-chemical,
biological, etc.), photothermal effect, as well as the imaging property [you can also
re-write this sentence as: “The characteristics of the NPs, including their photothermal
and imaging capabilities, were investigated …”] were investigated in vitro and in
vivo. Their anti-tumor efficacy effect was evaluated using orthotopic, tongue
tumor-bearing, nude mice.
Results: The NPs possessed good stability and water-solubility, stability and were
pH/hyaluronidase-sensitive. The good tissue penetration quality and active
2

targeting ability enabled made the NPs to draw the outline of orthotopic tongue
tumors and metastatic lymph nodes as small as 1 mm in nude mice by IR-808
under NIR exposure. In vitro and in vivo experiments validated the
biocompatibility and low systematic toxicity of the NPs. At the same time, the
NPs acted as multimodal therapy agents, combining photothermal therapy with
chemotherapy. in combination with photothermal and chemotherapy.
Conclusion: With a good imaging capability property and anti-tumor efficacy
effect, our NPs successfully outlined orthotopic tongue tumors and metastatic
lymph nodes, as well as enabled chemo-photothermal therapy combination.
combined photothermal and chemotherapy. Our study established a solid
foundation for the application of new clinical diagnosis and treatment patterns in
the future.
Key words: NIR-II imaging, chemo-photothermal therapy photothermal/chemo-
therapy, active- targeting, metastatic lymph nodes detectionng.
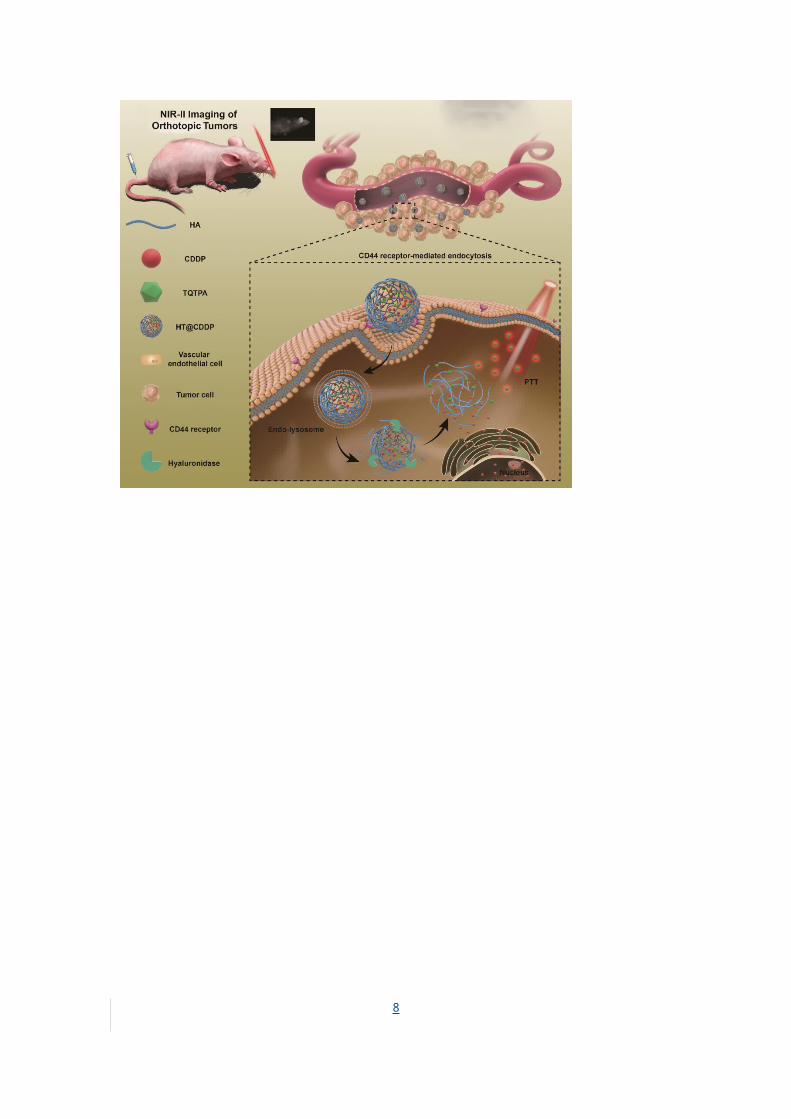
Graphical Aabstract
3

4

For this figure and the rest, please ensure that the text size used is set to a minimum 8 pt (Arial font type). Use the following guidelines: Figures should be the size in which they will appear when published so that no reduction is necessary. Figures should be either single-column format (8.5 cm), mid-size format (11.4 cm), or double-column format (17.4 cm). The Arial font should be used for all figure text, and the size should be 8-12 points. Use consistent font sizes across all figures. Composite figures should be preassembled, with each figure part (e.g., A, B, C) lettered in 12-point Helvetica type in the upper left corner.Introduction
Over the past decades, limited improvements have been made in for the 5-
year survival rate of oral squamous cell carcinoma (OSCC) patients, in spite of
the availability of a multidisciplinary modality treatment [1, 2]. The leading
causes for treatment failure might be related to incomplete resection of tumor
tissues and neglected metastatic lymph nodes, especially the tiny ones metastatic
lymph nodes, which in turn will causes a postoperative recurrence and
locoregional metastasis [3]. Surgery is the most effective treatment in OSCC, and
but surgery trauma inevitably affects the functions and aesthetics of the orofacial
region [4]. Hence, surgical treatments must be precise and, upon complete
removal of cancerous tissue, surgery should preserve normal tissue and organs
as much as possible. Another feature of OSCC is the complicated lymph node
drainage. To iIdentifying metastatic lymph nodes intraoperatively is essential in
determining the scope of lymph node dissection. Furthermore, some tiny
metastatic lymph nodes are often neglected during traditional neck dissection
[5]. At present, clinical doctors physicians obtain get information about tumor
location, size, and metastatic lymph nodes mostly by palpation and computed
tomography (CT) examination, which can miss the detection of easily lead to
residual tumor tissues and metastatic lymph nodes [6]. Thus, to clearly drawing
the outline of OSCC tumor and establishing a new method to identify metastatic
lymph nodes intraoperatively is extremely important to the survival rate of
OSCC patients [7]. Currently, research interests in near-infrared (NIR),
fluorescence-based imaging have become popular, as NIR can be utilized used to
observe biological processes non-invasively in living subjects with high sensitivity, 5

and biological safety, and without the use of nonionizing radiation, and non-
invasive procedure[8-16]. Many materials have been used in NIR imaging and
cancer therapy in recent years, including antimonene, quantum dots and
borophene , etc[17-23]. Zhang et al. used black phosphorus as a biodegradable
drug delivery system, realizing NIR imaging of tumors and smart NIR-light-
controlled drug release for cancer therapy, and which showed an excellent anti-
tumor effect [24-25]. Most studies, however, have focused on first-window
materials, with wavelengths ranging from 650 to 950 nm (NIR-I), such as the
most widely-applied, FDA-approved small molecule indocyanine green material in
clinics: Food and Drug Administration–approved small-molecule (ICG) [26]. ICG
has been used in many clinical applications fields, such as tumor imaging and the
detection of draining lymph nodes [27]. As well reported, hHowever, ICG has
shortcomings as a NIR-I probe due to of the photon scattering in biological
tissues and the non-ignorable background signal of normal tissue, which leads to
poor image resolution and clinical limitations [28]. Consequently, imaging in the
NIR-II region (1000 nm to 1700 nm) has attracted much attention. Compared
with NIR-I probes, NIR-II probes have less interference by endogenous
substances in living organisms, thereby thus enabling deeper penetration depths
and lower tissue background signals [29-36]. Some Previous studies have used an
NIR-II probes to image and observe tumors, vascular systems, and lymph node
drainage. Hong et al. reported a probe, Ga-CHS2, for tumor delineation and
NIR-II imaging guided surgery to dissect xenograft tumors. for guided operation
during a xenograft [please re-write the highlighted phrase to clarify], but they did
not combine image-guided surgery with other therapies [37]. Cheng et al.
synthesized a novel NIR-II molecule, CQS1000, for many uses, such as the
evaluation of circulatory system, assessment of tumor angiogenesis and imaging
of for lymphatic drainage [8]. Although there are a lot of studies on NIR-II
materials at present, few reports combining the characteristics of materials with
cancer therapy in the field of OSCC. They Previous studies focused on the NIR-II 6
imaging capabilities, but did not investigate its multimodal potential. Therefore,
it is essential to explore a variety of capabilities functions of NIR-II molecules,
such as photothermal therapy (PTT). Moreover, the xenograft models s used in
most studies hardly mimicked the true condition of the tumor. Therefore, most
notably, we have established an OSCC orthotopic model, using OSCC cell lines in
nude mice for our in vivo study, rather than the common subaxillary tumor
models, to simulate the growth of OSCC in living subjects [38, 39].
In addition to surgery, chemotherapy is widely regarded as one of the major
treatments for OSCC [3]. CDDP [spell out] [cis-dichlorodiammine platinum] is one
of the first-line chemotherapeutic drugs for OSCC patients., hHowever, as a kind
of solid tumors, OSCC exhibits a hypoxic microenvironment which leads to
chemo-resistance, especially the so-called cancer stem cells (CSCs) [40-45]. but as
reported, many tumor cells have resistance to CDDP, especially cancer stem cells
(CSCs). Therefore, to account for this deficiency, other therapies are often
combined with chemotherapy. PTT is considered to be a novel and effective
method to destroy tumor cells, converting light energy into heat energy [46-47].
As reported, cancer cells under hypoxia are usually resistant to
chemotherapeutic drugs but sensitive to PTT, as the latter destroys cancer cells
by protein degeneration and cell membrane rupture, independent of oxygen[20].
Currently, researchers are focused on increasing this chemo- and photothermal
[clarify what this is referring to] therapeutic effect while and simultaneously
decreasing side effects. Nano drug delivery systems have received much attention
in recent years. Through the enhanced permeability and retention (EPR) effect,
nanoparticles (NPs) can accumulate in tumor sites, and reducinge the side effects
damage to normal tissues [48-50]. Compared with conventional NPs, tumor-
targeteding NPs can enter cells through receptors-mediated endocytosis on the
surface of cancer cells, therebyus increasing the concentration of NPs in tumor
tissues. Hyaluronic acid (HA) is an ideal, biocompatible nano-carrier, and it is
one of the main components of the extracellular matrix [51]. In addition, HA is 7
one of the ligands of CD44, which is highly expressed at the OSCC cellular
membranes surface[52]. As one of the markers of CSCscancer stem cells, CD44
participates in a variety of cell signal transduction pathways and is closely
related to tumor growth, proliferation, and metastasis [53,54]. Therefore, HA, as
a nano-carrier, can achieve passive enrichment in tumors via the EPR effect and
can actively target tumor cells with high CD44 expression.
This paper reports, for the first time, new tumor-targeteding NPs
(HT@CDDP) for NIR-II imaging and combined chemo-PTT, as schematically
illustrated in Figure 1. We synthesized HT@CDDP NPs with the following
considerations: (1) organic molecule, TQTPA [spell out] [4,4'-((6,7-bis(4-
(hexyloxy)phenyl)-[1,2,5]thiadiazolo [3,4-g]quinoxaline-4,9-diyl)bis(thiophene-5,2-
diyl))bis(N,N-diphenylaniline)], was synthesized as the NIR-II- absorbing
material; and (2) HA was used to encapsulate CDDP and TQTPA, enhancing the
targeting ability and accumulation of NPs in tumors. Through in vivo study, we
demonstrated that the NPs accumulated at tumor sites, delineating the tumor
and enabling sensitive imaging of metastatic lymph nodes in the NIR-II range. In
addition, the NPs produced played an anti-tumor effectrole in OSCC orthotopic
models. The combination of HT@CDDP NPs with chemotherapy and PTT
improved the anti-tumor effect to a great degree. Together, the in vivo and in
vitro results revealed that the NPs could not only play an important role in tumor
and metastatic lymph node imaging, but also as well as enable enhanced anti-
tumor effects of chemotherapy and PTT treatments. Thus, the NP-based NIR-II
probe shows a great potential in clinical in the for a possible clinical use in the
future.
Materials and mMethodsMaterials
Sodium HA (molecular weight 12–14 kDa) was purchased from Freda Biochem
Co. Ltd. (Shandong, China). CDDP was purchased form Sigma–Aldrich (St.
8
Louis, MO, USA). All antibodies were purchased from Abcam (Cambridge, UK).
TQ and TPA were obtained ordered from SunaTech Inc (add location)(Suzhou
Industrial Park, Jiangsu, China). Dulbecco’s modified Eagle’s medium (DMEM,
Gibco, America), phosphate buffer saline (PBS, Gibco, America) and fetal bovine
serum (FBS, Gibco, America) were purchased from Gene Tech Co. (Shanghai,
China).
Synthesis of TQTPA
TQTPA was synthesized via the Suzuki reaction between 4,9-bis- (5-bromo-thiophen-
2-yl)-6,7-bis-(4-hexyloxy-phenyl)-2-thia-1,3,5,8-tetraaza cyclopenta[b]naphthalene
(TQ) and diphenyl-[4-(4,4,5,5-tetramethyl-[1,3,2] dioxaborolan- 2-yl)-phenyl]-amine
(TPA). The TQTPA molecule has a donor-acceptor-donor (D-A-D) structure, in which
triphenylamine acts as the electron donor, and TPA acts as the electron acceptor. The
obtained TQTPA molecule was characterized by 1
H NMR, high resolution mass
spectrometry, 13C NMR and MALDI-TOF.
Synthesis of HT@CDDP
We synthesized HT@CDDP using ultra- sonication. Briefly, we co-dissolved HA
(20 mg) and CDDP (2 mg) in deionized water (10 mL) to obtain Solution A. Then,
we dissolved TQTPA (2 mg) in THF [Tetrahydrofuran] (2 mL) to obtain Solution
B. Solution A was sonicated via an ultrasound probe at a power of 180 W.
Solution B was added drop-wise at room temperature into Solution A with ultra-
sonication for 5 min to prepare HT@CDDP. We removed the unloaded TQTPA
and free CDDP using a 30- K ultrafiltration tube at 5000 rpm for 20 min and
washed them with deionized water three times. We collected the filtrate in the
lower portion of the tube to measure the amount of unloaded TQTPA and free
CDDP. We collected the concentrated HT@CDDP solution in the upper part of
the tube for the following experiments.
Encapsulation efficiency (EE) of CDDP- and TQTPA-loaded particles
We detected the concentration of CDDP using AAS [spell out] [Atomic Absorption
Spectroscopy] and recorded the concentration of TQTPA using a multifunctional
9
continuous spectrometer. We calculated the NP encapsulation efficiency (EE) as
follows: EE (% )=W 0−WtW 0
×100 %, (1) wWhere W0 and Wt are the weight of the
initial CDDP (TQTPA) and the total amount of CDDP (TQTPA) detected in the
filtrate solution after ultrafiltration, respectively.
NPs Ccharacterization
NMR spectra were recorded on a Bruker Ultra Shield Plus [provide
manufacturer’s location] [Bruker BioSpin Scandinavia AB Vallgatan 5, SE-170 67
Solna, Sweden] 400 MHz spectrometer (1H, 400 MHz) using tetramethylsilane
(TMS) as the internal reference. We used Ddynamic light scattering (DLS) and
transmission electron microscopy (TEM) to characterize the particle size and
morphology. TEM images were performed on a HT7700 transmission electron
microscope operating at an acceleration voltage of 100 kV. DLS studies were
conducted using a commercial laser light scattering spectrometers (ALV-7004;
ALV, Langen, Germany) equipped with a multi-τ digital time correlator and a
He–Ne laser (at λ = 632.8 nm). A CONTIN analysis was used to extract the ⟨Rh⟩
data (from the scattering intensity). All test samples were prepared and made
optically clean by filtration through 0.45- mm Millipore filters before
measurement and each sample was tested three times. The scattering angle was
90° and all measurements were carried out at room temperature. For all the
samples, the final concentration of CPs was 0.1 mg mL-1. We conducted
spectrophotometry measurements on a Shimadzu UV-3600 UV-vis-NIR
spectrophotometer [Kanda-nishiki-cho 1-chome Chiyoda-ku, Tokyo 101-8448,
Japan]. [provide manufacturer’s location for this one and all other equipment and
materials]. The NIR-II fluorescence spectrum of TQTPA and NPs in the region of
900 - 1500 nm was used a [please re-write to clarify] measured using a NIR-II
spectroscopy (Fluorolog 3) with InGaAs NIR detector under an 808- nm diode
laser (RMPC lasers) excitation. To examine the ability of the NIR-II signal of the
NPs to penetrate muscle, we used chicken breasts tissues with different
10

thicknesses to cover a tube filled with HT@CDDP NPs particles and measured
the decayed NIR-II signal.
Release rate of CDDP from NPs
NPs were dissolved in 1 mLl of phosphate- buffered saline (PBS) and placed in a
sealed dialysis tube (MWw cut-off 8000–10,000 Da, Wako, Japan). The dialysis
bag was then submerged in 50-mLl tubes (Falcon, BDLabware, NJ) containing
40 mLl sodium phosphate buffer (50 mM) of different pH (7.4, 6.8 and 5.2), and
with or without hyaluronidase, and incubated in a water- bath at 37 °C with
reciprocal shaking at 1 Hz. The CDDP released from the dialysis bags was were
collected at scheduled time intervals and its amount was quantified by AAS.
Temperature increase curve in vitro
We used an NIR laser (808 nm, power density of 0.5, 1, and 1.5 W cm-2) to
irradiate the PBS solution (pH 7.4) of HT@CDDP ([TQTPA] = 0, 37.5, 75, 150,
300 μg mL-1) for 5 min at an initial temperature of 25°C. We recorded the
temperature values of the HT@CDDP solution at different time points using an
IR thermal imager. To obtain the heating and cooling curve, the PBS solution of
HT@CDDP ([TQTPA] = 300 μg mL-1) was irradiated with a NIR laser (808 nm,
1.5 W cm-2). Irradiation was ceased when a maximum temperature was reached,
and the solution was subsequently cooled to room temperature. We repeated this
process three times.
NIR-II Ffluorescence Iimaging Ssetup
The NIR-II fluorescence imaging system was designed and built for in vivo and
in vitro fluorescence imaging in the second near-infrared fluorescence range
(1000−1700 nm), with a 640-by × -512 pixel, two-dimensional InGaAs array
(Princeton Instruments). The excitation source was an 808- nm diode laser at a
power density of 40 mW cm-2, and the emission light was collected through
various long pass filters (980 nm) as required and focused onto the detector by a
50- mm lens.
11

In order to determine the dDetection depth of HT@CDDP NPs,. Wwe placed the
HT@CDDP NPs in a tube covered by chicken breast tissues with different
thicknesses (1 mm, 3 mm, 6.5 mm, 9 mm, 12 mm, and 15mm), as shown in the
Supplementary Material.
Cell Cculture
Human oral squamous cell carcinoma lines, HSC3 and SCC4, were kindly
provided by the Ninth Hospital of Shanghai. They were cultured in DMEM with
10% FBS, 100 U mL-1 penicillin and 100 mg mL-1 streptomycin at 37 °C in a
humidified atmosphere containing 5% CO2 and 95% air.
Cellular uptake efficiency
We seeded HSC3, and SCC4 cells in 6-well plates at a density of 5.0 × 10⁴ cells
and cultured them for 24 h, followed by a treatment with HT@CDDP NPs
([TQTPA] = 0.1 mg mL-1) in a normal culture medium and in a culture medium
with anti-CD44 antibody, respectively. After incubatingon for 1 h, 9 h, 13 h, and
20 h, the cells were digested with trypsin (EDTA) and centrifuged at 1000 rpm
for 5 min. The cells were then washed three times with using PBS to remove the
remaining culture medium, and they cells were reseeded in 96-well plates in PBS
(100 μL). The 96-well plates were irradiated with using the NIR-II fluorescence
imaging system to measure the NIR-II signal and analyze the targeting efficiency
of HT@CDDP NPs particles to CD44- expressinged cells.
Cytotoxicity assay
The toxicities of T@CDDP [is this referring to the free CDDP? Please clarify],
[referring to free CDDP] and HT@CDDP NPs, with or without irradiation, were
tested using CCK-8[spell out] [Cell Counting Kit-8] kits. Cells were plated in 96-
well plates at densities of 5,500–6,500 cells in a 100 µL complete culture medium.
Blank control wells containing the same volume of complete culture medium
were included in each assay. The microplate was incubated at 37 °C until cells
adhered to the plates. The cells were then washed with PBS buffer and incubated
with T@CDDP, and HT@CDDP, which were serially diluted in the a complete
12
culture medium before use. The plate was further incubated for a further 24–36
hours. For the HT@CDDP with irradiation group, cells were exposed under an
808- nm laser at 1.0 W cm-2 for 10 minutes. CCK-8 (10 µL) was added to each
well. The optical density (OD) of formazan at 450 nm was recorded every 30
minutes until the OD was 1.0–2.0. Six wells corresponded to each concentration
of the aforementioned above drugs. Cell viability was calculated as follows: cell
viability = ([OD]test - [OD]control)/([OD]control - [OD]blank) ×100%.
In Vvivo NIR-II and ICG Iimaging
We administered HT@CDDP NPs in PBS solution ([TQTPA] = 1mg mL-1) and
ICG in PBS solution ([ICG] = 1mg mL-1) to mice bearing orthotopic tongue
squamous carcinoma via tail injection at a dose volume of 100 μL per mouse. At
0, 4, 10, 20, 24, and 30 h post-injection, mice were anesthetized and imaged via
the in vivo NIR-II imaging system. Typically, at 30 h post-injection, we carefully
removed major organs of mice, including heart, liver, spleen, lung, kidney,
tumor, and lymph nodes, and rinsed the organs for visualization. We analyzed
the NIR-II signal intensity using the in vivo NIR-II imaging system’s software.
OSCC model establishment
For To establish an orthotopic xenograft model of human OSCC, the human
OSCC cells line HSC3 (1×10⁶ cells in 50 μL PBS) were submucosally inoculated
into the tongues of nude mice (4 mice per group). We measured the tumor
dimensions volume every other day by a caliper and calculated the volume by the
formula (V = (L×W2)/2, where L is, tumor length and , W, is tumor width). When
the tumor volume was approximately 12 mm3, the mice were ready for the in vivo
anti-tumor efficacy experiments.
In Vvivo chemo-photothermal therapy combination Combined PTT and
Chemotherapy
We randomly divided the tumor-bearing mice into 7 8 groups (n = 4). Then, we
administered the mice were administered with the following: (1) saline, (2) saline
with irradiation, (3) HT, (4) HT with irradiation, (5) HT@CDDP, (6) HT@CDDP
13

with irradiation, or (7) free CDDP T@CDDP, and (8) T@CDDP with irradiation.
The different formulations were administrated via tail vein injection (CDDP
dose: 5 mg kg-1). Mice of groups (2), (4), and (6), and (8) received irradiation via
an 808- nm laser (1.0 W) for 10 min in the tumor regions. We used a thermal
imager to detect the change in temperature in tumor regions. We measured
tumor volume and mice weight every other day. When the treatment was
complete, we removed tissues for HE (hematoxylin and eosin) H&E staining and
immunoe staining.
Statistical analysis
All data shown are expressed as the mean ± SE for at least three separate
experiments unless otherwise stated. Statistical analyses were carried out using a
two-tailed sStudent's t- test and homogeneity of variance tests (p values < 0.05
were considered significant).
Ethical Sstatement
Institutional review board approval was obtained from Nanjing Stomatological
Hospital Ethics Committee (approval number, 2017NL-003). All animal
experiments and experimental protocols were in accordance with the Animal
Care and Use Committee of the Medical School of Nanjing University.
Results and discussionWe synthesized the small-molecule TQTPA via the Suzuki reaction between
4,9-Bbis- (5-bromo-thiophen-2-yl)-6,7-bis-(4-hexyloxy-phenyl)-2-thia-1,3,5,8-
tetraaza cyclopenta[b]naphthalene (TQ) and diphenyl-[4-(4,4,5,5-tetramethyl-
[1,3,2] dioxaborolan- 2-yl)-phenyl]-amine (TPA), as shown in Scheme 1 [please
rename as Figure 2 and renumber subsequent figures accordingly]. The synthesis
and structure of TQTPA was shown as Figure 2 and Figure S1-S4.The TQTPA
molecule has a donor-acceptor-donor (D-A-D) structure, in which
triphenylamine acts as the electron donor, and TPA acts as the electron acceptor.
The obtained TQTPA molecule was characterized by 1H NMR, high resolution
14
mass spectrometry, 13C NMR and MALDI-TOF (Figure S1-S4), and S2. [The
aforementioned information in cyan should be in the Methods section, not
here].The fluorescence quantum yield of TQTPA in THF solution under an
excitation of 808 nm was about 3.03%, measured against a standard IR1061 dye
in dichloromethane as a reference. As shown in Figure S3a S5Aa, TQTPA has
strong absorption in the NIR region, with a main absorption peak at 760 nm in
tetrahydrofuran (THF) [spell out this abbreviation at its in-text first appearance in the
Method section, not here], and its extinction coefficient is 6.762 mL g-1 cm-1. The
fluorescence emission spectrum showed a maximum NIR-II emission peak at
1016 nm, using 808 nm as the excitation wavelength (Figure S3b S5Ab). This
indicates a large Stokes shift of about 256 nm.
We conducted nanoprecipitation to prepare water-soluble, semiconducting
HT@CDDP NPs, using the hydrophilic polymer HA as a stabilizer to encapsulate
the hydrophobic molecule TQTPA and anti-cancer drug CDDP. The diameter
and morphology of HT@CDDP NPs in aqueous solution were characterized with
dynamic light scattering (DLS) and transmission electron microscopy (TEM)
(Figure 32Aa). HT@CDDP NPs had were well-dispersed sphere structures, with
an average diameter of 110 nm. The NPs exhibited good water-solubility and a
nano-size formulation similar to many other polymeric CDDP
complex/conjugates [55]. The hydrodynamic radius of the HT@CDDP NPs in
different media, including phosphate buffer saline (PBS), fetal bovine serum (FBS),
and Dulbecco’s Modified Eagle’S Medium (DMEM), showed no obvious difference
(Figure S4 S6). In Figure 32Bb, the HT@CDDP NPs also showed good NIR
absorption, with a predominant absorption peak at 760 nm. The fluorescence
emission spectrum showed a maximum NIR-II emission peak at 1057 nm. In
addition, the HT@CDDP NPs exhibited high photostability, zeta potential
stability-stbality and size-stability (Figure S5 Figure S7 and S8). NP detection
depth was evaluated by NIR-II imaging for samples covered by chicken breasts
tissues with varying different thicknesses. The NIR-II signals of the NPs decreased 15
slightly as the thickness of the chicken breasts tissue increased from 0 to 3 mm.
Notably, we found that even when the samples were covered by chicken breasts
tissue as thick as 6.5 mm, its NIR-II signal was still detectable (Figure 2D-E3C-
Dc & d, and Figure S6 S9). Therefore, the as-prepared HT@CDDP NPs can be
used in NIR-II imaging.
As reported, HA is an ideal DDS[spell out. If you meant drug delivery system,
then please delete the word “carrier”] [Drug Delivery System] carrier that can be
combined with CDDP via ionic interactions between Pt2+ of CDDP and carboxylic
acid of HA [56-59]. We used atomic absorption spectrophotometry (AAS) [again,
spell out abbreviations only once at their first in-text appearance] to confirm the
successful encapsulation of CDDP by measuring the concentration of CDDP in an
HT@CDDP-containing PBS solution. In order to compare the capacity of loading
CDDP between HA and PEG [polyethylene glycol], we also used PEG to load CDDP
and TQTPA. The encapsulation efficiency of CDDP was 32.33% (Equation 1),
which is higher than that when polyethylene glycol PEG is used as a nano-carrier
(20.59%), which is consistent with other published studies [60, 61]. [please provide a
reference for this information]. This is possibly due to the electrostatic binding
between HA and CDDP.
Next, we studied the in vitro release profile of CDDP from HT@CDDP NPs
in different mediaum. As shown in Figure 43Aa, about 12.35 ± 0.67% of CDDP
was released after 16 h in PBS at pH 7.4. The release of CDDP, however,
increased from 22.19 ± 0.74% to 33.84 ± 1.01% as the pH decreased from 6.8 to
5.2, respectively. This was attributed to an the increase in HA dissolution in an
acidic environment. These findings suggest that the weak acidic condition of solid
tumors tissues could accelerate the release of CDDP from the HT@CDDP NPs,
and, upon their internalization of HT@CDDP in tumor cells via endocytosis, the
lower pH of lysosomes would facilitate a more rapid release of CDDP [29]. In
addition, because HA can be hydrolyzed by hyaluronidase [6260, 6361], we
evaluated the effect of hyaluronidase on the release of CDDP from the NPs. The
16

NPs were treated with PBS containing 150 U mL-1 hyaluronidase at pH 7.4 and
5.2, respectively. The addition of hyaluronidase expedited the release of CDDP to
28.34 ± 0.51% at pH 7.4 and 45.68 ± 1.26% at pH 5.2 at 16 h, respectively. This
result suggests that the enriched hyaluronidase in tumor cells will facilitate the
release of CDDP from NPs. Moreover, the release of NPs is influenced by pH and
hyaluronidase, suggesting good stability in blood circulation and rapid release in
the low pH environment of the phago-lysosomal system [56].
To study the efficiency of the HT@CDDP NPs for PTT, we exposed different
concentrations of NPs to an 808- nm NIR laser (1.5 W cm-2). The results in Figure
43Bb show that the temperature of the NPs increased with increasing TQTPA
concentration. When TQTPA concentration reached 300 μg mL-1, the solution
temperature increased by 40.5 °C. In addition, the temperature of the solution
(300 μg mL-1 TQTPA) increased by 40.5°C at 1.5 W cm-2, which was higher than
that at 0.5 W cm-2 (19.0 °C) and at 1.0 W cm-2 (27 °C) (Figure 43Cc). To evaluate
the stability of the photothermal property, we performed three replications of an
irradiation experiment. The heating and cooling curve indicated that the NPs
exhibited a great optical stability after three cycles of laser-induced heating
(Figure 43Dd). The value of photothermal conversion efficiency was calculated
out to be 22% [642, 653]. The satisfactory photothermal property properties of
our NPs including excellent photothermal conversion efficiency, good photo-stability
and favorable absorbance features make them suitable for PTT [66]. is preferred for
PTT therapeutic agents [please clarify and provide a reference for this].
HA is a ligand of the CD44 receptor, which is highly expressed on the cell
membrane surface of many solid tumor cells, including OSCC. To investigate the
targeting ability of the HT@CDDP NPs on OSCC cells, we selected two human
OSCC cell lines with high levels of CD44 expression (Figure S7 S10). We first
examined the influence of blocking CD44 on the intracellular uptake of
HT@CDDP NPs in OSCC cells. As shown in Figure 45A-Ba and 4b, we observed
a time-dependent increase in the NIR-II signal intensity, which indicatinged the an
17
intracellular accumulation of the HT@CDDP NPs. More importantly, the cellular
-uptake of the NPs was significantly suppressed by the addition of anti-CD44
antibody, emphasizing the importance of receptor-mediated endocytosis. We
evaluated the cytotoxicity of the HT@CDDP NPs by a CCK8 assay. The
cytotoxicity of the NPs HT@CDDP against OSCC cells was comparable to that of
free CDDP T@CDDP in vitro. As expected, we observed an enhanced anti-tumor
effect of the HT@CDDP NPs upon laser stimulation with a laser (Figure 54C-Dc
and 4d). The IC50 values of the HT@CDDP NPs with irradiation and free CDDP
T@CDDP were 9.863 μM and 1.281 μM in HSC3 cells, respectively (9.531μM
and 2.893μM in SCC4 cells, respectively), confirming the excellent anti-tumor
efficacy ability of the HT@CDDP NPs with irradiation in vitro.
We also conducted a flow cytometry analysis using an Annexin V-FITC/PI
staining kit to evaluate the effect of the HT@CDDP NPs with or without
irradiation on cell apoptosis. The results in Figure 56 and Figure S8-S10 S11-S-
13 show the apparent enhanced cell apoptosis of HSC3 and SCC4 cells when
treated with HT@CDDP NPs and stimulated with irradiation. The HT@CDDP
NPs showed no obvious difference from free CDDP T@CDDP on cell apoptosis
at the same concentration of CDDP (IC50). Upon irradiation, however, the
number of apoptotic cells increased significantly, regardless of the presence of
CDDP. This result demonstrated that HT@CDDP NPs with irradiation could
promote cell apoptosis significantly in vitro.
As noted, NIR-II materials possess better imaging capabilities properties than
NIR-I materials, offering less interference by endogenous substances, lower
tissue background, and higher resolution. To explore the potential of HT@CDDP
as a novel NIR-II probe in living subjects, we injected the NPs into mice via their
tail veins, using ICG for as a comparison. As shown in Figure S11a S14Aa, at 15
min post-injection, the NIR-II images showed that the circulatory system was
clearly visualized, whereas ICG gave a lower quality image with blurry features.
From Figure S11b S14Bb, the femoral artery was clearly depicted by
18
HT@CDDP, but ICG failed to produce give a distinct image of the femoral
artery. The signal intensity was measured by plotting cross sections of the same
vessel (femoral artery), marked by red arrows. As shown in Figure S11c S14Cc,
an obvious peak from the HT@CDDP group was observed, with a the Gaussian-
fitted full width at half maximum (FWHM) of the cross-sectional intensity profile
of 0.606 mm. Conversely, the intensity analysis obtained for the ICG group
showed a broad, less intense peak. These findings demonstrated that the
HT@CDDP NPs, as NIR imaging agents, produced ossessed better contrast and
higher resolution images ing than the clinically-approved ICG.
After NIR imaging of HT@CDDP and ICG in blood vessels, we aimed to
study the tumor imaging properties of each agent solution. Nude mice with HSC3
orthotopic xenografts were randomly divided into three groups (n = 3 per group)
and arranged as: (1) ICG, (2) HT@CDDP and (3) HT@CDDP with excess HA
blocking. The ICG and HT@CDDP solutions were injected in tail veils, whereas
the HA PBS solution was administered through paracancerous injection 6 h
ahead of the HT@CDDP injection. The mice in the ICG group were imaged with
NIR-I, whereas the mice of the HT@CDDP group were imaged with NIR-II. As
shown in Figure 76, the tumors could be clearly visualized in the NIR-II images,
at different time points. The ICG-enhanced imaging, however, failed to make a
distinction between the tumor nodule and the adjacent tissues, possibly due to
because of its inherently high background signals. The enrichment of the
HT@CDDP NPs in tumor regions was significantly inhibited when CD44 was
blocked by HA, through the HA (ligand)-CD44 (receptor) interaction.
Interestingly, the tumor vascular branches could be discerned immediately after
injectingon of ICG and HT@CDDP solutions. At 4 h post-injection, the vascular
image of the ICG group disappeared, whereas the image of the HT@CDDP
group was still visible. On the basis of this result, the HT@CDDP NPs shows a
great potential for visualizing the vascular network in tumors, observing tumor
progression and assessing the efficacy of some anti-angiogenic drugs.19

The signal intensity- to- background ratio (SBR) is shown in Figure 78Aa
and Figure S15. The NIR-II imaging of tumors hasve a high SBR, with an
average value signal of 2.78 immediately after tail vein injection. Although the
SBR declined to 2.18 at 4 h, it seemed that the HT@CDDP NPs became more
homogeneously distributed at tumor region. The SBR gradually increased and
reached 8.06 at 24 h, and it but later decreased to 3.65 at 30 h post-injection.
Conversely, the SBR in the HA blocking group showed no obvious increase over
20 h, and the maximum SBR at 24 h was only about 2.35. Interestingly, a lymph
node image (Figure 76, LN#1, green circle) with an SBR of 1.72 appeared at 10 h
in the HT@CDDP group. At 20 h, the SBR of LN#1 reached 3.17, and it revealed
another lymph node image (Figure 76, LN#2, blue circle) with an SBR of 2.92.
The SBR of LN#2 reached a maximum of 3.55 at 24 h (Figure 87Cc). On the
basis of these findings, we hypothesize that the HT@CDDP NPs could be used
for tumor and lymph node imaging.
To validate whether the two lymph node images represented two metastatic
lymph nodes, we dissected these mice at 30 h post-injection. As shown in Figure
87Bb and Figure S12 S16, the NIR-II signals were mainly enriched in tumors,
livers, and spleens, suggesting a low damage to hearts and kidneys. This is an
important result for assessing the in vivo safety of the NPs. The two excised
removed lymph nodes were apparently displayed;, and LN#2 was very small, but
had a strong fluorescence signal. According to HE the hematoxylin and -eosin
(H&E) [spell out abbreviations only once at their first in-text appearance] staining
and cytokeratin (CK) staining results in Figure 87Dd, LN#1 and LN#2 showed a
positive expression of CK. Therefore, they were confirmed to be metastatic
lymph nodes. Note, hHowever, that the image of the metastatic lymph nodes
appeared later than that of the tumor, but that the SBRs of the tumor and the two
lymph nodes achieved the maximum values at about 24 h post-injection, which
met the requirement of a clinical application. This provided a promising evidence
that the HT@CDDP NPs could accumulate at tumor sites and be used to detect 20

metastatic lymph nodes, especially tiny ones lymph nodes that could be easily
overlooked.
The photothermal characteristics of the HT@CDDP NPs have been
confirmed in vitro; therefore, we further studied their potential of HT@CDDP in
combined chemo-PTT. This study used an orthotopic OSCC mice tumor orthotopic
mouse models described previously. First, we proved that the NPs exhibited
excellent photothermal effects in vivo and used a thermal imager to monitor the
temperature changes. As shown in Figure 98A-Ba and 8b, the temperature of the
tumor regions increased immediately upon an 808- nm (1.0 W) laser irradiation.
After about 3–4 min of irradiation, the temperature reached 50.5 °C, which is
sufficient to destroy tumor cells [47]. As shown in Figure 98C-Dc, 8d and Figure
S18Aa, CS18c, HT@CDDP induced a remarkable tumor growth delay, and, 13
days after treatment, the tumor size (5.70 ± 1.14 mm3) was reduced by 82.78%,
compared with the untreated control (33.11 ± 4.63 mm3)., whereas tThe tumor
volume of mice in the free CDDP T@CDDP group, on the other hand, increased
by 33.93% (13.92 ± 1.24 mm3
at day 1, and 19.48 ± 0.72 mm3
at day 13, mm3). We
then performed a histological analysis (HE, Ki67, and Bcl2 staining) to further
evaluate the in vivo anti-tumor activity of the HT@CDDP NPs. Tumor tissues
and other organs were collected on day 14. As shown in Figure 109 and Figure
S18Dd, the HT@CDDP, HT, and HT@CDDP (with laser) groups presented
lower levels of the cell proliferation marker Ki67 and cell apoptosis inhibitor Bcl2
compared with the other groups. The anti-tumor effect of T@CDDP showed no
obvious difference, no matter with or without irradiation. Therefore, the both in
vivo experiments and histological analysis are in agreement with the efficient anti-
tumor effects of the HT@CDDP NPs observed in vitro. Thus, the HT@CDDP NPs
are expected to be potential biomedicines that combine chemotherapy and PTT
with effective anti-tumor abilities.
To evaluate the in vivo systematic toxicity of HT@CDDP, we measured the
weight of mice every other day from the beginning of the treatment. As shown in
21

Figure S13b S17Bb and S18Bb, the weight of mice in the HT@CDDP group, with
or without irradiation, did not change significantly, compared with the beginning
(21.50 ± 0.32 g to 20.35 ± 0.12 g with irradiation, and 23.70 ± 01.14 g to 23.95 ±
0.96 g without irradiation, g, respectively). The slight decrease in the weight of for
mice in the HT@CDDP with laser group may be due to the tongue pain, of
tongues which was caused by heating. The mice, however, experienced an obvious
decrease in weight from 24.88 ± 0.38 g to 21.02 ± 1.25 g in the control group and
from 20.53 ± 1.00 g to 17.42 ± 1.33 g in the HT group. A decrease in weight was
also observed in the free CDDP T@CDDP group, from 22.20 ± 0.44 g to 19.48 ±
0.63 g, though without no a statistical significance. H&E staining of mice hearts,
livers, and kidneys also revealed that the NPs did less damage to these organs
than free CDDP T@CDDP (Figure S13a S17Aa and S18Dd). To further assess
the biosafety of HT@CDDP, we injected HT@CDDP PBS solution and free
CDDP T@CDDP into tumor-bearing mice and healthy rats via tail veins. We
dissected tumors, hearts, livers and kidneys from the mice and measured the
contents of CDDP content in the different organs at 7 days post-injection. In
addition, we collected blood from rat orbits and used it for a serological
examination to evaluate liver and renal functions at 2 and 4 weeks post-injection.
The concentration of CDDP in the tumor of the HT@CDDP group was more
than twofold that of the free CDDP T@CDDP group. This confirmed the
enrichment effect in tumor regions (Figure S13c S17Cc). In livers, the
concentration of CDDP for the HT@CDDP group was slightly higher than that
of the free CDDP T@CDDP group, but it was much lower the concentration of
CDDP for the HT@CDDP group in kidneys was much lower than free CDDP
T@CDDP group. This indicated that our HT@CDDP NPs could reduce the renal
toxicity of CDDP, which is one of the most significant limitations in clinical use.
As shown in Table S1, we detected changes in blood urea nitrogen (BUN),
creatinine (Cr), aspartate aminotransferase (AST), and alanine aminotransferase
(ALT) at 2 and 4 weeks post-injection. To determine see whether there was any 22

substantial damage to livers and kidneys, we dissected the rats 6 weeks post-
injection and conducted a histological analysis. As shown in Figure S13d S17Dd,
H&E staining indicated that there was no obvious damage to the livers and
kidneys. Therefore, the HT@CDDP NPs have been shown to accumulate at tumor
sites and reduce renal toxicity, compared to free CDDP T@CDDP. Through in
vivo experiments, we confirmed that in short periods, the NPs did less damage to
living organs than free CDDP T@CDDP. MoreoverBesides, the NPs show a good
bio-degradation property (Figure S19). The active and passive targeting
characteristics of nanomaterials reduce the damage caused by of CDDP to
normal tissues. In addition, the low toxicity of TQTPA and
biocompatilitybiocompatibility of HA contribute to the biosafety of the HT@CDDP
NPs. Therefore, we can look forward in the future to the clinical translation
practice of these NPs in the future.
Conclusions
In this study, we synthesized a new NIR-II molecule, TQTPA, with stable
photothermal characteristics, which are essential for NIR-II imaging and PTT.
On the basis of a nano-technique, we synthesized HT@CDDP NPs with a good
water solubility and dimensional stability. OSCC cell lines expressing high levels
of CD44 receptors showed an obvious NIR-II signal after incubation with
HT@CDDP, whereas the signal declined significantly when the cells were blocked
with anti-CD44 antibody. HT@CDDP can be used for tumor delineation,
metastatic lymph nodes detection, lymphatic system imaging and combined
chemo-PTTphotothermal therapy.
Abbreviations
AAS: atomic absorption spectroscopy; CDDP: cisplatin cis-Ddichlorodiammine
platinum; CK: cytokeratin; DLS: dynamic light scattering; EPR: enhanced
permeability and retention effect; HA: hyaluronic acid; H&E: hematoxylin &-
23
eosin staining; ICG: indocyanine green; NIR: near- infrared; NPs:
nanoparticles; OSCC: oral squamous cell carcinoma; PTT: photothermal
therapy; SBR: signal-to- background ratio; TEM: transmission electron
microscope.
Acknowledgements The National Natural Science Foundation of China [No. 21604042], Natural Science
Foundation of Jiangsu Province [BK20160051], Key Research and Development
Program of Jiangsu Province [BE2017741] and Nanjing Municipal Science and
Technology Commission [201715039] supported this work.
Conflicts of interest Competing interests
The authors have declared that no competing interest exists.
Funding
The National Natural Science Foundation of China [No. 21604042], Natural Science
Foundation of Jiangsu Province [BK20160051], Key Research and Development
Program of Jiangsu Province [BE2017741] and Nanjing Municipal Science and
Technology Commission [201715039] supported this work.
References1. Siegel R, Naishadham D, Jemal A. Cancer statistics, 2012. CA: a cancer
journal for clinicians. 2012; 62: 10-29.
2. Gupta S, Kong W, Peng Y, Miao Q, Mackillop WJ. Temporal trends in the
incidence and survival of cancers of the upper aerodigestive tract in Ontario and
the United States. International journal of cancer Journal international du
cancer. 2009; 125: 2159-65.
3. Argiris A, Karamouzis MV, Raben D, Ferris RL. Head and neck cancer.
Lancet. 2008; 371: 1695-709.
4. Hinni ML, Ferlito A, Brandwein-Gensler MS, Takes RP, Silver CE, Westra
24
WH, et al. Surgical margins in head and neck cancer: a contemporary review.
Head & neck. 2013; 35: 1362-70.
5. Pitman KT. Sentinel node localization in head and neck tumors. Semin Nucl
Med. 2005; 35: 253-6.
6. Atallah I, Milet C, Henry M, Josserand V, Reyt E, Coll JL, et al. Near-
infrared fluorescence imaging-guided surgery improves recurrence-free survival
rate in novel orthotopic animal model of head and neck squamous cell
carcinoma. Head & neck. 2016; 38 Suppl 1: E246-55.
7. Eldeeb H, Macmillan C, Elwell C, Hammod A. The effect of the surgical
margins on the outcome of patients with head and neck squamous cell
carcinoma: single institution experience. Cancer Biol Med. 2012; 9: 29-33.
8. Shou K, Qu C, Sun Y, Chen H, Chen S, Zhang L, et al. Multifunctional
biomedical imaging in physiological and pathological conditions using a NIR-II
probe. Adv Funct Mater. 2017; 27.
9. Jiang Y, Pu K. Molecular Fluorescence and Photoacoustic Imaging in the
Second Near-Infrared Optical Window Using Organic Contrast Agents.
Advanced Biosystems. 2018; 2: 1700262.
10. Xu G, Yan Q, Lv X, Zhu Y, Xin K, Shi B, et al. Imaging of Colorectal
Cancers Using Activatable Nanoprobes with Second Near-Infrared Window
Emission. Angewandte Chemie. 2018; 57: 3626-30.
11. Hong G, Antaris AL, Dai H. Near-infrared fluorophores for biomedical
imaging. Nature Biomedical Engineering. 2017; 1: 0010.
12. Shi B, Yan Q, Tang J, Xin K, Zhang J, Zhu Y, et al. Hydrogen sulfide-
activatable second near-infrared fluorescent nanoassemblies for targeted
photothermal cancer therapy. Nano Lett. 2018; 18:6411-6416.
13. Lin SL, Chen ZR, Chang CA. Nd(3+) sensitized core-shell-shell
nanocomposites loaded with IR806 dye for photothermal therapy and up-
conversion luminescence imaging by a single wavelength NIR light irradiation.
Nanotheranostics. 2018; 2: 243-57.
25
14. Xu F, Zhao Y, Hu M, Zhang P, Kong N, Liu R, et al. Lanthanide-doped core-
shell nanoparticles as a multimodality platform for imaging and photodynamic
therapy. Chemical communications. 2018; 54: 9525-8.
15. Zhen X, Zhang J, Huang J, Xie C, Miao Q, Pu K. Macrotheranostic Probe
with Disease-Activated Near-Infrared Fluorescence, Photoacoustic, and
Photothermal Signals for Imaging-Guided Therapy. Angewandte Chemie. 2018;
57: 7804-8.
16. Xu Y, Tian M, Zhang H, Xiao Y, Hong X, Sun Y. Recent development on
peptide-based probes for multifunctional biomedical imaging. Chinese Chemical
Letters. 2018; 29: 1093-7.
17. Tao W, Ji X, Xu X, Islam MA, Li Z, Chen S, et al. Antimonene Quantum
Dots: Synthesis and Application as Near-Infrared Photothermal Agents for
Effective Cancer Therapy. Angewandte Chemie. 2017; 56: 11896-900.
18. Tao W, Ji X, Zhu X, Li L, Wang J, Zhang Y, et al. Two-Dimensional
Antimonene-Based Photonic Nanomedicine for Cancer Theranostics. Advanced
materials. 2018; 30: e1802061.
19. Zhao P, Xu Q, Tao J, Jin Z, Pan Y, Yu C, et al. Near infrared quantum dots
in biomedical applications: current status and future perspective. Wiley
interdisciplinary reviews Nanomedicine and nanobiotechnology. 2018; 10: e1483.
20. Shen S, Zhang Y, Peng L, Du Y, Wang Q. Matchstick-shaped Ag2S-ZnS
heteronanostructures preserving both UV/blue and near-infrared
photoluminescence. Angewandte Chemie. 2011; 50: 7115-8.
21. Dong B, Li C, Chen G, Zhang Y, Zhang Y, Deng M, et al. Facile Synthesis of
Highly Photoluminescent Ag2Se Quantum Dots as a New Fluorescent Probe in
the Second Near-Infrared Window for in Vivo Imaging. Chemistry of Materials.
2013; 25: 2503-9.
22. Li C, Li F, Zhang Y, Zhang W, Zhang X, Wang Q. Real-time monitoring
surface chemistry-dependent in vivo behaviors of protein nanocages via
encapsulating an NIR-II Ag2S quantum dot. Acs Nano. 2015; 9: 12255-12263.
26
23. Du Y, Xu B, Fu T, Cai M, Li F, Zhang Y, et al. Near-infrared
photoluminescent Ag2S quantum dots from a single source precursor. Journal of
the American Chemical Society. 2010; 132: 1470-1471.
24. Qiu M, Wang D, Liang W, Liu L, Zhang Y, Chen X, et al. Novel concept of
the smart NIR-light-controlled drug release of black phosphorus nanostructure
for cancer therapy. Proc Natl Acad Sci U S A. 2018; 115: 501-6.
25. Qiu M, Ren WX, Jeong T, Won M, Park GY, Sang DK, et al. Omnipotent
phosphorene: a next-generation, two-dimensional nanoplatform for
multidisciplinary biomedical applications. Chemical Society reviews. 2018; 47:
5588-601.
26. Fan Q, Cheng K, Yang Z, Zhang R, Yang M, Hu X, et al. Perylene-diimide-
based nanoparticles as highly efficient photoacoustic agents for deep brain tumor
imaging in living mice. Adv Mater. 2015; 27: 843-7.
27. Wang H, Li X, Tse BW, Yang H, Thorling CA, Liu Y, et al. Indocyanine
green-incorporating nanoparticles for cancer theranostics. Theranostics. 2018; 8:
1227-42.
28. Welsher K, Sherlock SP, Dai H. Deep-tissue anatomical imaging of mice
using carbon nanotube fluorophores in the second near-infrared window. Proc
Natl Acad Sci U S A. 2011; 108: 8943-8.
29. Chen G, Tian F, Li C, Zhang Y, Weng Z, Zhang Y, et al. In vivo real-time
visualization of mesenchymal stem cells tropism for cutaneous regeneration
using NIR-II fluorescence imaging. Biomaterials. 2015; 53: 265-73.
30. Antaris AL, Chen H, Cheng K, Sun Y, Hong G, Qu C, et al. A small-molecule
dye for NIR-II imaging. Nature materials. 2016; 15: 235-42.
31. Antaris AL, Chen H, Diao S, Ma Z, Zhang Z, Zhu S, et al. A high quantum
yield molecule-protein complex fluorophore for near-infrared II imaging. Nature
communications. 2017; 8: 15269.
32. Feng Y, Zhu S, Antaris AL, Chen H, Xiao Y, Lu X, et al. Live imaging of
follicle stimulating hormone receptors in gonads and bones using near infrared
27
II fluorophore. Chemical science. 2017; 8: 3703-11.
33. Sun Y, Ding M, Zeng X, Xiao Y, Wu H, Zhou H, et al. Novel bright-emission
small-molecule NIR-II fluorophores for in vivo tumor imaging and image-guided
surgery. Chemical science. 2017; 8: 3489-93.
34. Sun Y, Qu C, Chen H, He M, Tang C, Shou K, et al. Novel benzo-bis(1,2,5-
thiadiazole) fluorophores for in vivo NIR-II imaging of cancer. Chemical science.
2016; 7: 6203-7.
35. Xue Z, Zeng S, Hao J. Non-invasive through-skull brain vascular imaging
and small tumor diagnosis based on NIR-II emissive lanthanide nanoprobes
beyond 1500nm. Biomaterials. 2018; 171: 153-63.
36. Yang J, Hong X. New glowing dyes in vivo imaging with wavelengths beyond
1500 nm. Science China Chemistry. 2018; 61: 1869-1870..
37. Sun Y, Zeng X, Xiao Y, Liu C, Zhu H, Zhou H, et al. Novel dual-function
near-infrared II fluorescence and PET probe for tumor delineation and image-
guided surgery. Chem Sci. 2018; 9: 2092-7.
38. Kim S. Animal models of cancer in the head and neck region. Clin Exp
Otorhinolaryngol. 2009; 2: 55-60.
39. Lu SL, Herrington H, Wang XJ. Mouse models for human head and neck
squamous cell carcinomas. Head & neck. 2006; 28: 945-54.
40. Huang C, Yan T, Xu Z, Wang M, Zhou X, Jiang E,et al. Hypoxia enhances
fusion of oral squamous carcinoma cells and epithelial cells partly via the
epithelial-mesenchymal transition of epithelial cell. Biomed Research
International. 2018, 5015203.
41. Joseph J, Harishankar M, Pillai A, Devi A. Hypoxia induced EMT: a review
on the mechanism of tumor progression and metastasis in OSCC. Oral oncology.
2018, 80: 23-32.
42. Yoshiba S, Ito D, Nagumo T, Shirota T, Hatori M, Shintani S. Hypoxia
induces resistance to 5-fluorouacil in oral cancer cells via G1 phase cell cycle
arrest. 2009. 45: 109-115.
28
43. Huang CE, Yu CC, Hu FW, Chou MY, Tsai LL. Enhanced chemosensitivity
by targeting Nanog in head and neck squamous cell carcinomas. Int J Mol Sci.
2014; 15: 14935-48.
44. Tonigold M, Rossmann A, Meinold M, Bette M, Marken M, Henkenius K, et
al. A cisplatin-resistant head and neck cancer cell line with cytoplasmic p53(mut)
exhibits ATP-binding cassette transporter upregulation and high glutathione
levels. J Cancer Res Clin Oncol. 2014; 140: 1689-704.
45. Bai X, Ni J, Beretov J, Graham P, Li Y. Cancer stem cell in breast cancer
therapeutic resistance. Cancer treatment reviews. 2018; 69: 152-63.
46. Zhou J, Wang X, Du L, Zhao L, Lei F, Ouyang W, et al. Effect of
hyperthermia on the apoptosis and proliferation of CaSki cells. Mol Med Rep.
2011; 4: 187-91.
47. Wust P, Hildebrandt B, Sreenivasa G, Rau B, Gellermann J, Riess H, et al.
Hyperthermia in combined treatment of cancer. Lancet Oncol. 2002; 3: 487-97.
48. Torchilin V. Tumor delivery of macromolecular drugs based on the EPR
effect. Adv Drug Deliv Rev. 2011; 63: 131-5.
49. Maeda H. Toward a full understanding of the EPR effect in primary and
metastatic tumors as well as issues related to its heterogeneity. Adv Drug Deliv
Rev. 2015; 91: 3-6.
50. Maeda H, Nakamura H, Fang J. The EPR effect for macromolecular drug
delivery to solid tumors: Improvement of tumor uptake, lowering of systemic
toxicity, and distinct tumor imaging in vivo. Adv Drug Deliv Rev. 2013; 65: 71-9.
51. Huang Y, Yao X, Zhang R, Ouyang L, Jiang R, Liu X, et al. Cationic
conjugated polymer/fluoresceinamine-hyaluronan complex for sensitive
fluorescence detection of CD44 and tumor-targeted cell imaging. ACS Appl
Mater Interfaces. 2014; 6: 19144-53.
52. Cai S, Alhowyan AA, Yang Q, Forrest WC, Shnayder Y, Forrest ML.
Cellular uptake and internalization of hyaluronan-based doxorubicin and
cisplatin conjugates. J Drug Target. 2014; 22: 648-57.
29
53. Chen J, Zhou J, Lu J, Xiong H, Shi X, Gong L. Significance of CD44
expression in head and neck cancer: a systemic review and meta-analysis. BMC
Cancer. 2014; 14: 15.
54. Nam K, Oh S, Lee KM, Yoo SA, Shin I. CD44 regulates cell proliferation,
migration, and invasion via modulation of c-Src transcription in human breast
cancer cells. Cell Signal. 2015; 27: 1882-94.
55. Mochida Y, Cabral H, Miura Y, Albertini F, Fukushima S, Osada K, et al.
Bundled assembly of helical nanostructures in polymeric micelles loaded with
platinum drugs enhancing therapeutic efficiency against pancreatic tumor. ACS
Nano. 2014; 8: 6724-38.
56. Fan X, Zhao X, Qu X, Fang J. pH sensitive polymeric complex of cisplatin
with hyaluronic acid exhibits tumor-targeted delivery and improved in vivo
antitumor effect. Int J Pharm. 2015; 496: 644-53.
57. Cai S, Xie Y, Davies NM, Cohen MS, Forrest ML. Pharmacokinetics and
disposition of a localized lymphatic polymeric hyaluronan conjugate of cisplatin
in rodents. J Pharm Sci. 2010; 99: 2664-71.
58. Jeong YI, Kim ST, Jin SG, Ryu HH, Jin YH, Jung TY, et al. Cisplatin-
incorporated hyaluronic acid nanoparticles based on ion-complex formation. J
Pharm Sci. 2008; 97: 1268-76.
59. Saisyo A, Nakamura H, Fang J, Tsukigawa K, Greish K, Furukawa H, et al.
pH-sensitive polymeric cisplatin-ion complex with styrene-maleic acid copolymer
exhibits tumor-selective drug delivery and antitumor activity as a result of the
enhanced permeability and retention effect. Colloids Surf B Biointerfaces. 2016;
138: 128-37.
60. Seiichi O, Shota H, Yuki A, Shigenobu E, Hironori Y, Hironori S, et al.
Intraperitoneal delivery of cisplatin via a hyaluronan-based Nanogel/in situ cross-
linkable hydrogel hybrid system for peritoneal dissemination of gastric cancer. Mol.
Phamaceutics. 2017; 14: 3105-3113.
61. Liu B, Han L, Liu J, Han S, Chen Z, Jiang L. Co-delivery of paclitaxel and TOS-
30

cisplatin via TAT-targeted solid lipid nanoparticles with synergistic antitumor activity
against cervical cancer. Int J Nanomedicine. 2017; 12:955-968.
6062. McAtee CO, Barycki JJ, Simpson MA. Emerging roles for
hyaluronidase in cancer metastasis and therapy. Adv Cancer Res. 2014; 123: 1-
34.
6163. Pavan M, Beninatto R, Galesso D, Panfilo S, Vaccaro S, Messina L, et al.
A new potential spreading factor: Streptomyces koganeiensis hyaluronidase. A
comparative study with bovine testes hyaluronidase and recombinant human
hyaluronidase of the HA degradation in ECM. Biochim Biophys Acta. 2016;
1860: 661-8.
6264. Zhou J, Jiang Y, Hou s, Upputuri P, Wu D, Li J, et al. Compact plasmonic
blackbody for cancer theranosis in the near-infrared II window. Acs Nano.2018;
12(3): 2643-2651.
6365. Lyu Y, Xie C, Chechetka S, Miyako E, Pu K. Semiconducting polymer
nanobioconjugates for targeted photothermal activiation of neurons. J. Am.
Chem. Soc. 2016; 138: 9049-9052.
66. Jung H, Verwilst P, Sharma A, Shin J, Sessler J, Kim J. Organic molecule-based
photothermal agents: an expanding photothermal therapy universe. Chem Soc Rev.
2018; 47:2280-2297.
31

FiguresAbbreviations used in each figure should be defined in the caption in alphabetical order. Do this for each figure please.
32
33
Figure 1. add a legend title in bold here The schematic illustration of the preparation and application of HT@CDDP NPs. (Aa) A sSchematic illustration of the preparation of HT@CDDP NPs. (Bb) Specifically NIR-II imaging/PTT applications of HT@CDDP NPs in orthotopic OSCC tumors of HT@CDDP NPs.
Each figure part (e.g., A, B, C) should be lettered in 12-point Helvetica type in the upper left corner. Use uppercase letters in this figure and the rest.
34

Scheme 1Figure 2. Synthesis procedures for TQTPA. Please rename this as Figure 2 and renumber subsequent figures accordingly, both here and in the manuscript text.
35

Figure 13. Characterization of HT@CDDP NPs. (Aa) The hydrodynamic radius
(Rh) of HT@CDDP NPs in PBS determined by dynamic light scattering (DLS) and
transmission electron microscopy (TEM) image of HT@CDDP NPs., Sscale bars
represent 200 nm. (Bb) The absorption and fluorescence emission spectra of
HT@CDDP NPs. (Cc) NIR-II imaging and (D) signals intensitiesy (d) of HT@CDDP
NPs covered by chicken breasts tissues with varying different thicknesses. The results
36
represent mean ± SE (n=3).
For the TEM image in figure A, if possible, increase the font size for the scale bar to improve readability. Also, define what the error bars in figure D represent (e.g. STD, SEM, number of measurements [n]). Do this here and for the rest of the figures in this manuscript.
37

Figure 24. Add a bold figure legend title here The release profile and
photothermal property of NPs.. (Aa) The cumulative drug release profile of
HT@CDDP NPs at different pH values and in the case of hyaluronidase. The results
represent mean ± SD (n=3). (Bb) The heating curves of HT@CDDP NPs at different
concentrations by an 808- nm laser at a power density of 1.5 W cm-2. (Cc) The heating
curves of HT@CDDP NPs (300 μg mL-1 TQTPA) by an 808- nm laser at different
radiant power values energy. (Dd) The heating-cooling curve of HT@CDDP NPs
38
(300 μg mL-1 TQTPA) by an 808- nm laser at a power density of 1.5 W cm-2.
39

Figure 53. Add a bold legend title here. Cellular uptake and cytotoxity of NPs.
(a) (A) NIR-II imaging (a) and (B) signals intensitiesy (b) of HSC3 and SCC4 cell
lines treated with and without anti-CD44 antibody blocking after incubatingon with
HT@CDDP NPs at different time points. (C) Cell viability, determined using a CCK8
assay, of free CDDP T@CDDP and HT@CDDP NPs at different concentrations of
40
CDDP with or without irradiation of different concentrations of CDDP in (c) HSC3
and (Dd) SCC4 cell lines. The results represent mean ± SE (n=3). *p<0.05, **p<0.01,
**** p < 0.0001, ANOVA analysis.by CCK8 assay.
Please define what the asterisks and error bars represent in figures B, C and D.
Figure 46. Cell apoptosis of HSC3 cells treated with different mediaum and
examined by Annexin V-FITC/PI staining kit and flow cytometry.
Increase the font size to improve readability. Please note that The Arial font should be used for all figure text, and the size should be 8-12 points. Use consistent font sizes across all figures. Composite figures should be preassembled, with each figure part
41

(e.g., A, B, C) lettered in 12-point Helvetica type in the upper left corner.
42

Figure 57. The NIR-I/NIR-II images of HSC3 orthotopic tumor- bearing mice (n
= 3 per group). The images were acquired at immediately, 4 h, 10 h, 20 h, 24 h, and
30 h after tail vein injection of ICG and HT@CDDP NPs, with or without excess HA
blocking. Red circles indicate tumors. Green and blue circles indicate two lymph
nodes. (NIR-I: 808 nm excitation, 830 LP and 300 ms; NIR-II: 1064 LP and 2000
ms).
43

Figure 68. Add a bold legend title here. The fluorescence intensity of tumor,
metastatic lymph nodes and dissected organs. (Aa) The NIR-II SBR (signal
intensity- to- -background ratio) of tumors in the HT@CDDP group and HA blocking
groups at different time points. Data shown here are mean ± SE (n=3). (Bb) The NIR-
II imaging of dissected organs, tumor tissues, and lymph nodes at 30 h post-injection.
(Cc) The NIR-II signal intensity of lymph nodes at different time points. The results
represent mean ± SE (n=3). (Dd) HE and CK staining of LN#1 and LN#2.
Figures A and C: Describe what the error bars represent and add values for n (number
44

of measurements) in the legend above. For Figure D, please enlarge the scale bar font
to improve readability.
45
Figure 79. Add a bold legend title here. The photothermal property in vivo and
anti-tumor ability of NPs. (Aa) Heat imaging [it is more commonly referred to as
thermal imaging or you can say heat map. Please provide values for the range min-
max in A] Heat map of the tumors in vivo, after injectingon of HT@CDDP and HT.
The range min-max represents 24.2 -54.3 .℃ ℃ (Bb) The in vivo temperature curves
in vivo [please indicate what errors bars represent in figure B]. The results represent
mean ± SE (n=4). (C) In vivo anti-tumor efficacy ect is detected by tumor volumes
sizes and the results are expressed as the mean ± SE (n = 4), *P < 0.05, **P < 0.01. (c)
Mice tumor volume curves. (Dd) Mice tumor photographs.[please add scale bars
with units]
46
Figure 810. Add a bold legend title here. HE and IHC staining of dissected
tumors. HE, Ki67, and Bcl2 staining of tumors for evaluating anti-tumor effect, as
well as the effect of inhibiting tumor proliferation and promoting cell apoptosis.
Please add scale bars.
Increase the font size to improve readability. Please note that The Arial font should be used for all figure text, and the size should be 8-12 points. Use consistent font sizes across all figures.
47