accountbuster.files.wordpress.com · web viewthrough the retail giants such as myer and david...
TRANSCRIPT
ACCT11059 – Accounting Learning & Online CommunicationAss#2 - Step 7 - 10
S0049661 – Toni Daniel
STEP 7 – Contribution MarginsGAZAL import brand name clothing and accessories and both wholesale and retail these products to the public.
I have chosen three different products of three different brands that GAZAL retail and have easily identified the retail price of each of these through the internet.
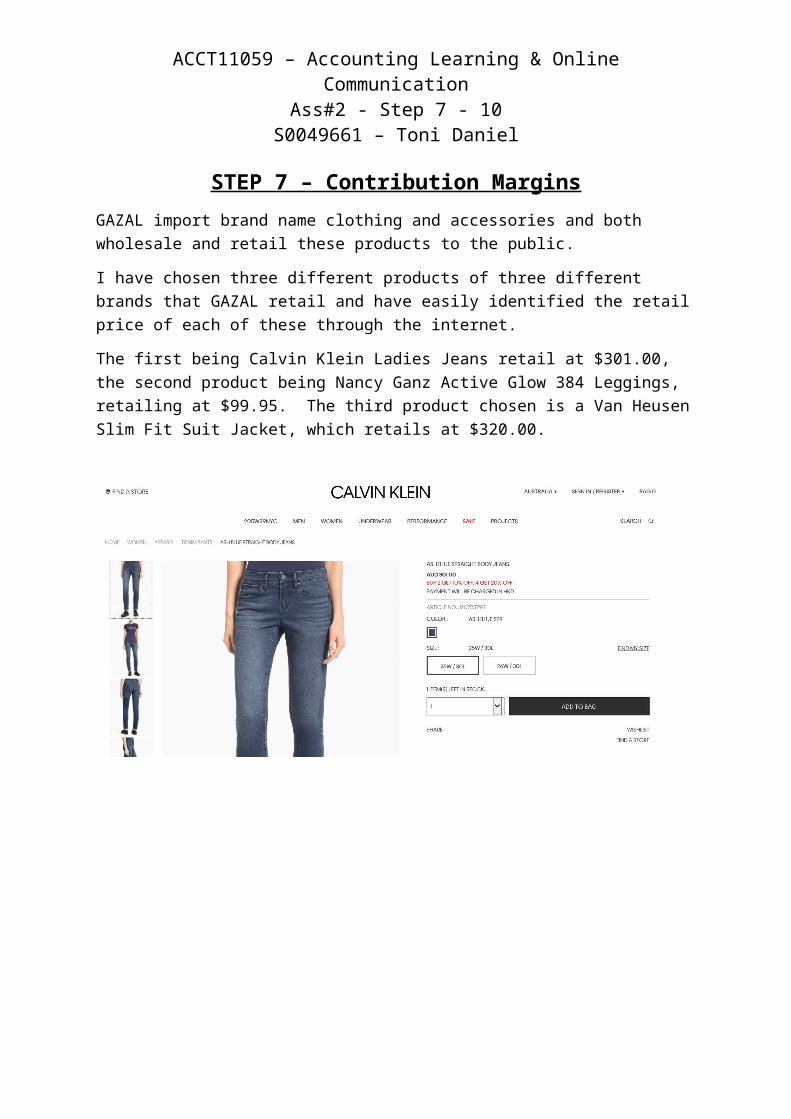
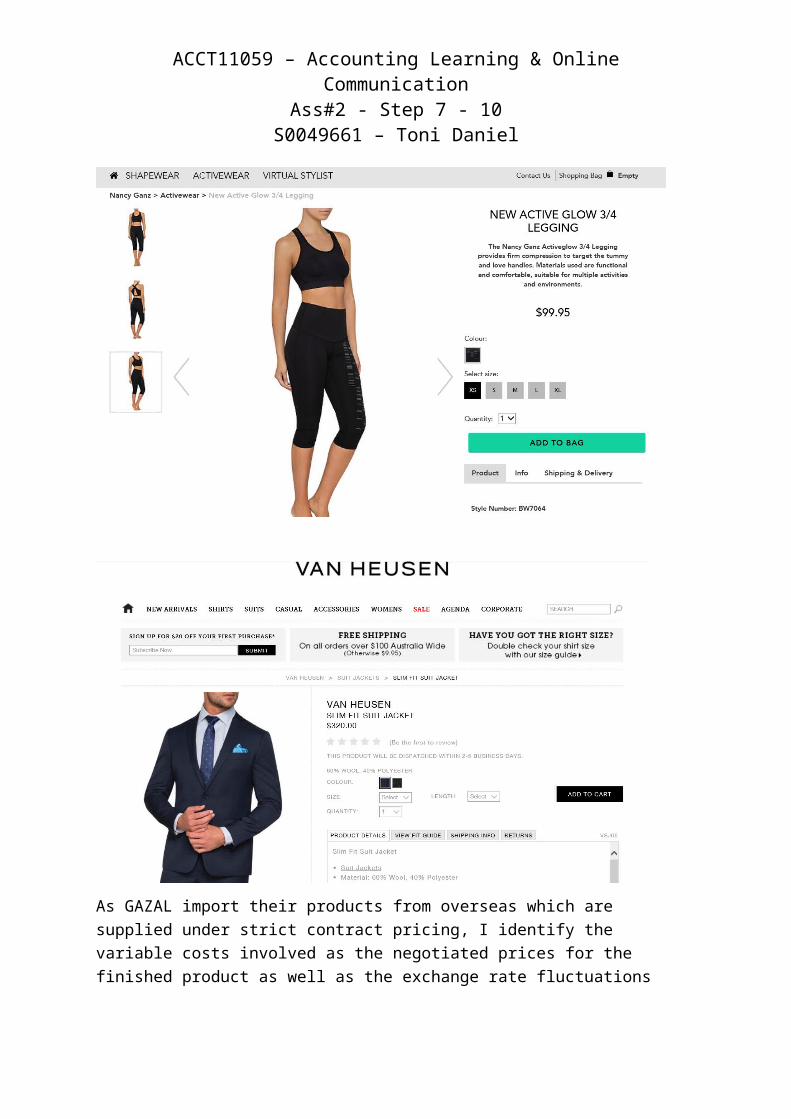
The first being Calvin Klein Ladies Jeans retail at $301.00, the second product being Nancy Ganz Active Glow 384 Leggings, retailing at $99.95. The third product chosen is a Van Heusen Slim Fit Suit Jacket, which retails at $320.00.
ACCT11059 – Accounting Learning & Online CommunicationAss#2 - Step 7 - 10
S0049661 – Toni Daniel
As GAZAL import their products from overseas which are supplied under strict contract pricing, I identify the variable costs involved as the negotiated prices for the finished product as well as the exchange rate fluctuations which once the products are paid for should be included in the cost of the goods.
GAZAL both retail their goods through their own retail stores and online platforms, as well as wholesaling their goods through retail giants such as Myer & David Jones. This alone would create much fluctuation in the margins that they are making on the sale of their products as they would expect much higher margins in the sale of their product through their own retail stores (where they have other fixed costs to cover such as store costs and wages for sales assistants/store managers) and lower margins where they are utilising bulk wholesale options.
GAZAL through their own retailing would also have much higher expected first margins and then lower margins where mark downs would be made to allow for high stock turnover to pave the way for everchanging new season fashions. I also imagine through their contracts with Myer and David Jones that they would have both strict first margins to adhere to as well as rebates, subsidies and settlement terms to abide by, the joys of dealing with retail giants.
I also imagine that different brands would have better margins than other brands. GAZAL would utilise the performance of the brands to set retail prices. For some brands consumers would be willing to pay much higher retail prices for the luxury of wearing a particular brand name and this of course, would be reflected in the retail pricing. GAZAL has a broad range of brand name clothing which allows for expansion through the retail industry under a different range of products and would also allow for easier ‘access’ to wholesaling
ACCT11059 – Accounting Learning & Online CommunicationAss#2 - Step 7 - 10
S0049661 – Toni Daniel
through the retail giants such as Myer and David Jones, who would prefer to deal with bigger clients than a lot of little clients.
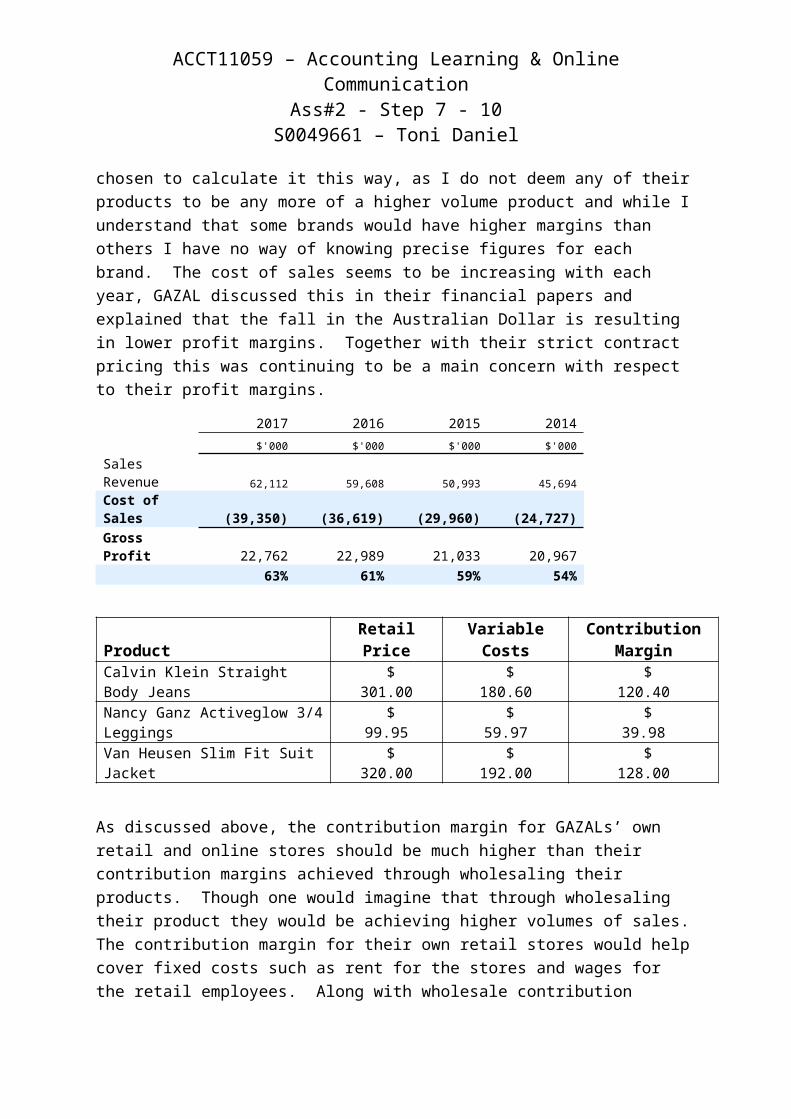
For the purpose of this exercise I have utilised the percentage over the last four years of figures where the cost of sales is approximately 60% of the sales revenue. I have chosen to calculate it this way, as I do not deem any of their products to be any more of a higher volume product and while I understand that some brands would have higher margins than others I have no way of knowing precise figures for each brand. The cost of sales seems to be increasing with each year, GAZAL discussed this in their financial papers and explained that the fall in the Australian Dollar is resulting in lower profit margins. Together with their strict contract pricing this was continuing to be a main concern with respect to their profit margins.
2017 2016 2015 2014 $'000 $'000 $'000 $'000Sales Revenue 62,112 59,608 50,993 45,694Cost of Sales (39,350) (36,619) (29,960) (24,727)Gross Profit 22,762 22,989 21,033 20,967 63% 61% 59% 54%
Product Retail Price Variable CostsContribution
Margin
Calvin Klein Straight Body Jeans $
301.00 $
180.60 $
120.40
Nancy Ganz Activeglow 3/4 Leggings $
99.95 $
59.97 $
39.98
Van Heusen Slim Fit Suit Jacket $
320.00 $
192.00 $
128.00
As discussed above, the contribution margin for GAZALs’ own retail and online stores should be much higher than their contribution margins achieved through wholesaling their products. Though one would imagine that through wholesaling their product they would be achieving higher volumes of sales. The contribution margin for their own retail stores would help cover fixed costs such as rent for the stores and wages for the retail employees. Along with wholesale contribution margins, costs such as marketing, administration and distribution expenses would be covered through these contribution margins along with other capital expenses such as depreciation on buildings, repairs and maintenance on building, plant and equipment.
One constraint of trade that has been mentioned in the news of late, that will affect not only the trade of GAZAL, but the retail industry generally is the introduction of online shopping giant Amazon to Australia. Analysts are predicting that local retailers’ sales will be
ACCT11059 – Accounting Learning & Online CommunicationAss#2 - Step 7 - 10
S0049661 – Toni Daniel
dampened by the online shopping giant and the likes of GAZAL will not be unaffected by the online shopping giant.
STEP 8 – Ratio AnalysisProfitability Ratios – Net Profit Margin
2015 & 2016 saw a very high Net Profit Margin on Sales Revenue. Both years saw a high profit from discontinued operations. In the notes to the financials, the year 2015 recorded the sale of a brand – Heritage and Shapewear. Gross Profits recorded from this sale were $28.7M. In year 2016, GAZAL recorded the sale of brand Trade Secret reporting after tax profits of $34M. This has greatly skewed the profit margin calculated for these years. The profit from 2014, while also having reported profits from discontinued operations, was lower, being only 20%. This year saw a lower profit on the Sales vs COGS and as the joint venture – PVH Brands Australia - only kicked off early in 2014, profits from this JV were not starting to be fully realised in this financial year.
The profit margin of 26.2% I consider to be quite good for the financial year 2016/2017. This financial year seems to have been a year of normal trade, where no major sales or purchases were made to skew figures. While the director Michael Gazal discusses the fall in the AUD being a problematic area which has reflected on their profit margins, I still believe the margin achieved to be very high and would hope that GAZAL could continue in this trading capacity.
Profitability Ratios – Return on Assets
This ratio is in proportion each year to the Net Profit Margin as discussed above. Using 2017 as an ‘ordinary year’, saw a return of 10% on their assets. Their asset value of 160M is generating a 10% yearly profit, which shows that GAZAL are utilising their assets very well to generate a return.
Efficiency Ratios – Days of Inventory
The days of inventory ratio enables the calculation of how many days it would take GAZAL to turn over the value of its inventory in entirety. While I imagine that some of the inventory would ‘fly off the shelves’ it is a good calculation to show that not all of the inventory would be the same. Some of the products sold would be required to be high turnover, due to the fickle nature of fashion, while some of the products sold would not need to be such a high turnover. Excepting the year of 2014, which was generally a lower profit margin year, the turnover average of 172 days for 2015 – 2017 though possibly a little slow is generally not alarming. The year of 2014 however tells a different story, being a 755day turnover. While sales were generally lower in the year of 2014, the inventory was extremely high, being more than $30M higher than in any of the other years. Perhaps this is what prompted the sale of the Heritage Brand in the next financial year.

ACCT11059 – Accounting Learning & Online CommunicationAss#2 - Step 7 - 10
S0049661 – Toni Daniel
Efficiency Ratios – Total Asset Turnover Ratio
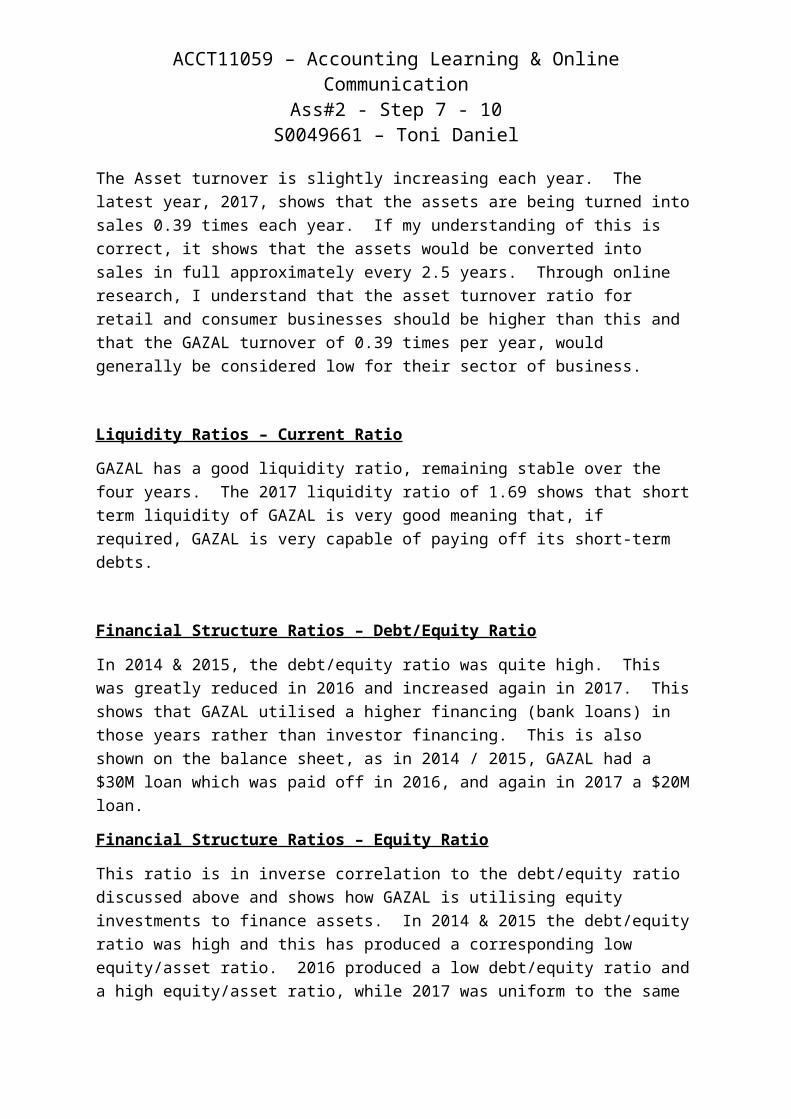
The Asset turnover is slightly increasing each year. The latest year, 2017, shows that the assets are being turned into sales 0.39 times each year. If my understanding of this is correct, it shows that the assets would be converted into sales in full approximately every 2.5 years. Through online research, I understand that the asset turnover ratio for retail and consumer businesses should be higher than this and that the GAZAL turnover of 0.39 times per year, would generally be considered low for their sector of business.
Liquidity Ratios – Current Ratio
GAZAL has a good liquidity ratio, remaining stable over the four years. The 2017 liquidity ratio of 1.69 shows that short term liquidity of GAZAL is very good meaning that, if required, GAZAL is very capable of paying off its short-term debts.
Financial Structure Ratios – Debt/Equity Ratio
In 2014 & 2015, the debt/equity ratio was quite high. This was greatly reduced in 2016 and increased again in 2017. This shows that GAZAL utilised a higher financing (bank loans) in those years rather than investor financing. This is also shown on the balance sheet, as in 2014 / 2015, GAZAL had a $30M loan which was paid off in 2016, and again in 2017 a $20M loan.
Financial Structure Ratios – Equity Ratio
This ratio is in inverse correlation to the debt/equity ratio discussed above and shows how GAZAL is utilising equity investments to finance assets. In 2014 & 2015 the debt/equity ratio was high and this has produced a corresponding low equity/asset ratio. 2016 produced a low debt/equity ratio and a high equity/asset ratio, while 2017 was uniform to the same results from previous years, with 48.8% debt/equity ratio and a 67.2% equity/asset ratio. Each of the years still showed that if GAZAL were required to pay all the liabilities, the investors will still end up with remaining assets.
Market Ratios – Earnings per Share
The earnings per share calculated for 2017 is 28C. Not a great deal for the average investor but considering that the directors of the company are the majority shareholders, this figure would be quite substantial and a very good return. 2015 & 2016 showed a much higher return of 77C & 62C respectively, which would be higher due to the profit of discontinued

ACCT11059 – Accounting Learning & Online CommunicationAss#2 - Step 7 - 10
S0049661 – Toni Daniel
operations in those years, as discussed in the profitability ratios above. 2014 was quite low, but also as discussed this was generally not a profitable year. Interestingly, the earnings per share as quoted in GAZAL financial statements do not agree with what I have calculated, being 49.7C, 59C & 18.1C for 2015, 2016 & 2017 respectively.
Market Ratios – Dividends per Share
The dividends paid per share for 2016 & 2017 were both 48C. 2015 was 17C & 2014 was 18C. This is not in correlation with the earnings per share and the notes in the financials applicable to retained profits and dividends noted a special franked dividend of 35C paid at the end of both 2015 & 2016, possibly pertaining to the profit realised upon the sale of discontinued operations as discussed in profitability ratios above.
Market Ratios – Price Earnings Ratio
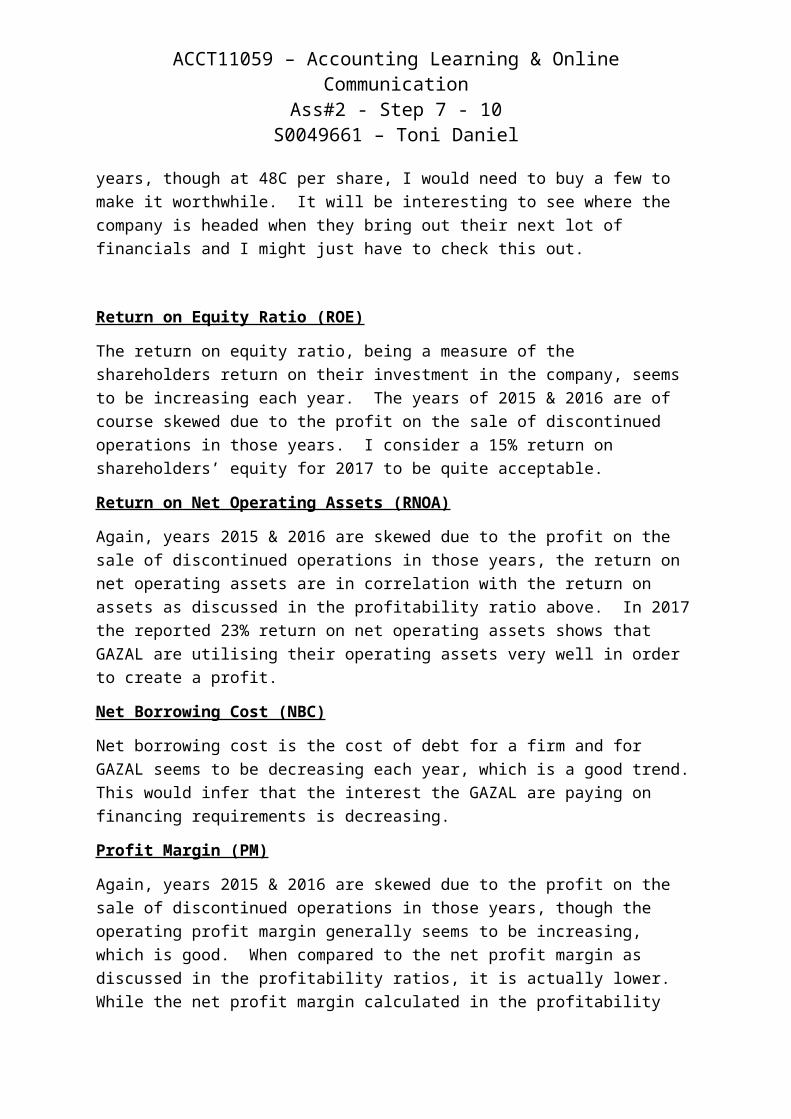
In 2017 the market price per earnings ratio tells me that it would take approximately 8 years to recoup my share buy into GAZAL. Upon further viewing, if I had bought into GAZAL in time to receive the special dividend at the end of 2015 I would have recouped nearly half of my investment in 2 short years, though at 48C per share, I would need to buy a few to make it worthwhile. It will be interesting to see where the company is headed when they bring out their next lot of financials and I might just have to check this out.
Return on Equity Ratio (ROE)
The return on equity ratio, being a measure of the shareholders return on their investment in the company, seems to be increasing each year. The years of 2015 & 2016 are of course skewed due to the profit on the sale of discontinued operations in those years. I consider a 15% return on shareholders’ equity for 2017 to be quite acceptable.
Return on Net Operating Assets (RNOA)
Again, years 2015 & 2016 are skewed due to the profit on the sale of discontinued operations in those years, the return on net operating assets are in correlation with the return on assets as discussed in the profitability ratio above. In 2017 the reported 23% return on net operating assets shows that GAZAL are utilising their operating assets very well in order to create a profit.
Net Borrowing Cost (NBC)
Net borrowing cost is the cost of debt for a firm and for GAZAL seems to be decreasing each year, which is a good trend. This would infer that the interest the GAZAL are paying on financing requirements is decreasing.
Profit Margin (PM)
ACCT11059 – Accounting Learning & Online CommunicationAss#2 - Step 7 - 10
S0049661 – Toni Daniel
Again, years 2015 & 2016 are skewed due to the profit on the sale of discontinued operations in those years, though the operating profit margin generally seems to be increasing, which is good. When compared to the net profit margin as discussed in the profitability ratios, it is actually lower. While the net profit margin calculated in the profitability ratio above only incorporated the core sales, the operating profit margin considers other operating revenues such as rent and joint venture which does lower the operating profit margin significantly.
Asset Turnover (ATO)
The asset turnover ratio is a comparison with the operating sales and the net operating assets. GAZAL seems to be moving in the correct direction, with a direct comparison to the return on assets turnover ratio as calculated in the efficiency ratio above. In 2017 GAZAL is turning over the operating assets 1.1 times per year in sales. This is a better trend than calculated in the efficiency ratio above and may be closer to industry standards.
Economic Profit
Economic Profit is a calculation used to work out the return on the net operating assets of a firm. For GAZAL, I utilised the percentage of 10% as the Weighted Average Cost of Capital, as I could not find any correspondence in the financial statements stating otherwise. As this WACC of 10% is for each year less than the return on net operating assets (RNOA) GAZAL has a continued positive result for the economic profit for each of its years. Though in 2014 the result was not amazing due to the low profits achieved in that year. 2015 & 2016 figures again, were skewed by the profit on the sale of discontinued operations with both years recording quite high profits due to these transactions. In 2017 an economic profit of $9.48M was achieved. I believe that 2017 was a standard trading year with no major changes in trading and would show a standard example of the economic profit achievable in a standard trading year.
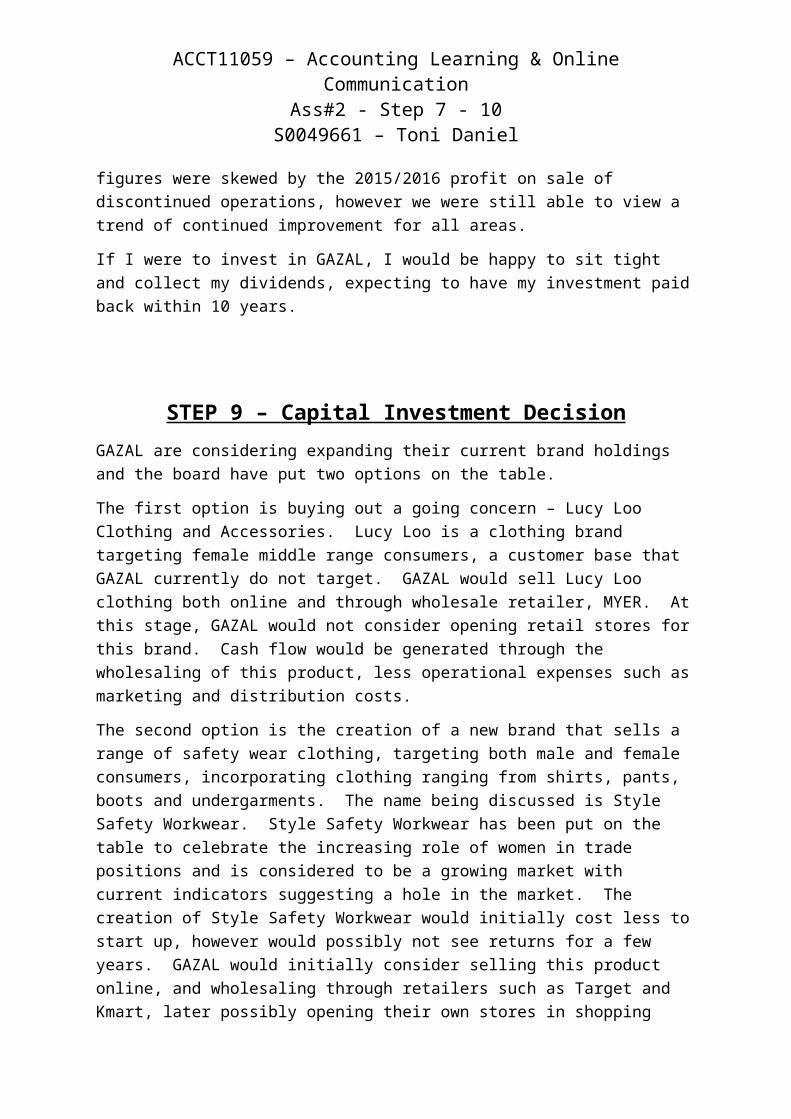
All indicators are that GAZAL is trading very well. The efficiency ratios were shown to be a little high for the industry sector, but the liquidity ratios, financial structure ratios and market ratios were all very acceptable. Most figures were skewed by the 2015/2016 profit on sale of discontinued operations, however we were still able to view a trend of continued improvement for all areas.
If I were to invest in GAZAL, I would be happy to sit tight and collect my dividends, expecting to have my investment paid back within 10 years.
STEP 9 – Capital Investment DecisionGAZAL are considering expanding their current brand holdings and the board have put two options on the table.

ACCT11059 – Accounting Learning & Online CommunicationAss#2 - Step 7 - 10
S0049661 – Toni Daniel
The first option is buying out a going concern – Lucy Loo Clothing and Accessories. Lucy Loo is a clothing brand targeting female middle range consumers, a customer base that GAZAL currently do not target. GAZAL would sell Lucy Loo clothing both online and through wholesale retailer, MYER. At this stage, GAZAL would not consider opening retail stores for this brand. Cash flow would be generated through the wholesaling of this product, less operational expenses such as marketing and distribution costs.
The second option is the creation of a new brand that sells a range of safety wear clothing, targeting both male and female consumers, incorporating clothing ranging from shirts, pants, boots and undergarments. The name being discussed is Style Safety Workwear. Style Safety Workwear has been put on the table to celebrate the increasing role of women in trade positions and is considered to be a growing market with current indicators suggesting a hole in the market. The creation of Style Safety Workwear would initially cost less to start up, however would possibly not see returns for a few years. GAZAL would initially consider selling this product online, and wholesaling through retailers such as Target and Kmart, later possibly opening their own stores in shopping department centres. Cash flow would be generated through the wholesaling of the product, less operational expenses such as initial design, procuring manufacturer of goods, and legal costs, with ongoing expenses such as marketing, and distribution costs.
The purchase of Lucy Loo would initially cost a lot more to purchase but would see returns on investment immediately as it is a going concern. While GAZAL have included a residual value in their workings, the purpose of the investments would be to keep the new brands to create continued profit, not to sell them off at a later date.
GAZAL have outlined original costs, estimated useful life, residual value and expected future cash flows in the table below:
Lucy Loo Clothing and Accessories
Style Safety Workwear
Original Cost $30 Million $10 MillionEstimated Useful Life 10 years 10 yearsResidual Value $30 Million $30 MillionEstimated Future Cash Flows31 May 2019 +$1 Million -$2 Million31 May 2020 +$2 Million -$1 Million31 May 2021 +$3 Million +$0 Million31 May 2022 +$5 Million +$2 Million31 May 2023 +$5 Million +$3 Million31 May 2024 +$5 Million +$4 Million31 May 2025 +$5 Million +$5 Million31 May 2026 +$5 Million +$5 Million31 May 2027 +$5 Million +$5 Million31 May 2028 +$5 Million +$5 Million
ACCT11059 – Accounting Learning & Online CommunicationAss#2 - Step 7 - 10
S0049661 – Toni Daniel
For the purposes of this exercise the WACC value used is 10%.
Option 1 – Lucy Loo Clothing & Accessories
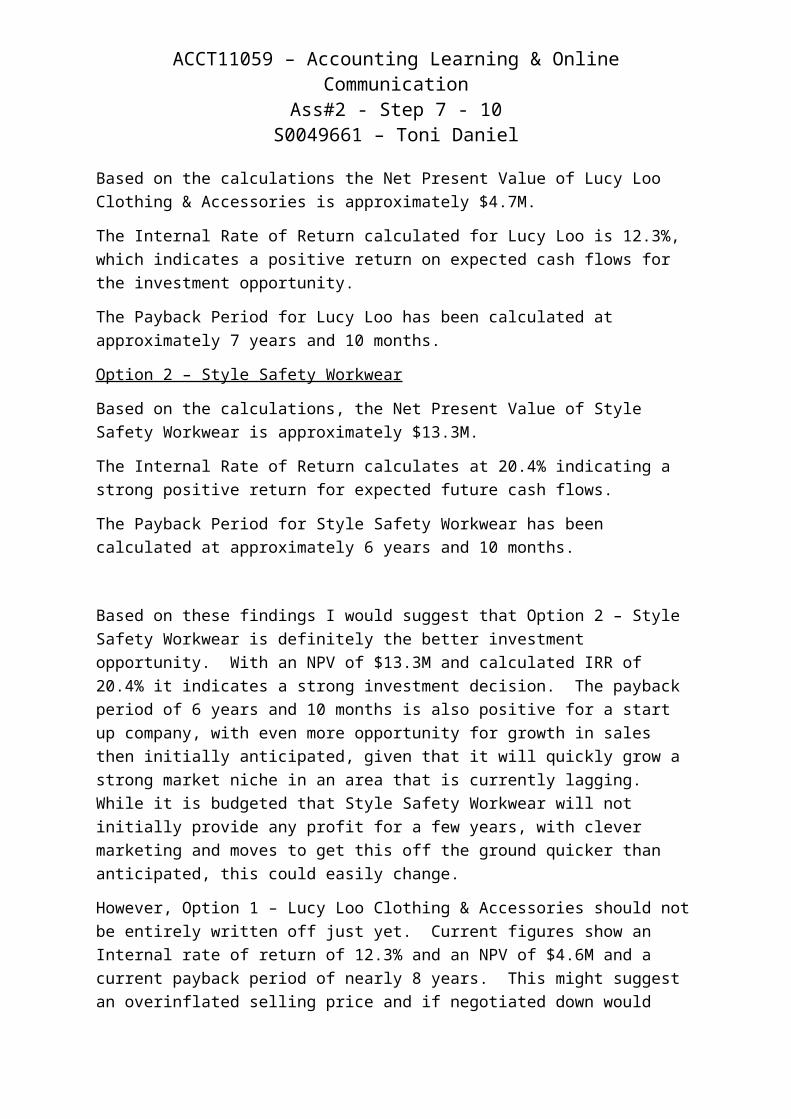
Based on the calculations the Net Present Value of Lucy Loo Clothing & Accessories is approximately $4.7M.
The Internal Rate of Return calculated for Lucy Loo is 12.3%, which indicates a positive return on expected cash flows for the investment opportunity.
The Payback Period for Lucy Loo has been calculated at approximately 7 years and 10 months.
Option 2 – Style Safety Workwear
Based on the calculations, the Net Present Value of Style Safety Workwear is approximately $13.3M.
The Internal Rate of Return calculates at 20.4% indicating a strong positive return for expected future cash flows.
The Payback Period for Style Safety Workwear has been calculated at approximately 6 years and 10 months.
Based on these findings I would suggest that Option 2 – Style Safety Workwear is definitely the better investment opportunity. With an NPV of $13.3M and calculated IRR of 20.4% it indicates a strong investment decision. The payback period of 6 years and 10 months is also positive for a start up company, with even more opportunity for growth in sales then initially anticipated, given that it will quickly grow a strong market niche in an area that is currently lagging. While it is budgeted that Style Safety Workwear will not initially provide any profit for a few years, with clever marketing and moves to get this off the ground quicker than anticipated, this could easily change.
However, Option 1 – Lucy Loo Clothing & Accessories should not be entirely written off just yet. Current figures show an Internal rate of return of 12.3% and an NPV of $4.6M and a current payback period of nearly 8 years. This might suggest an overinflated selling price and if negotiated down would make the deal more lucrative. As expected cash flow is based on current cash flows for Lucy Loo (given that it is a going concern), the only negotiable point in this instance is the purchase price.
Even if the current owners of Lucy Loo were willing to heavily negotiate, I would still recommend Option 2 – Style Safety Workwear as the clear winner.

ACCT11059 – Accounting Learning & Online CommunicationAss#2 - Step 7 - 10
S0049661 – Toni Daniel
STEP 10 – FeedbackI found both the process of giving and receiving feedback quite rewarding. Going through other peers’ figures, checking their ratio formulas and interpreting the results helped cement the concepts in my mind. Through receiving feedback and also reviewing feedback that was given by other peers not for me (!) I found two mistakes that I had made with my calculations, that I would not have picked up on myself. While I have not been active on Facebook in association with this particular assignment, I have also picked up on a couple of things through scrolling through comments given by other peers. Initially, at the start of this term, I presumed that I would be working in isolation doing this course. However, I found that I both enjoyed and gained an advantage through the contact and discussion with other students.
PEER FEEDBACK SHEET: ASS#2 Step 7-10
Feedback From: Toni Daniel
Feedback To: Jacqui Watts
My Comments
Step 7
Identify three products or services of your firm
Estimate selling price, variable cost & CM Commentary – contribution margins
Constraints – identify & commentary
Your discussion on the Contribution Margins shows a lot of thought and research has been put into this. Prices were not readily available (unlike mine, I was lucky!), however you have shown fantastic reasoning behind the selling price chosen for the three products identified for your firm and given great details on the variable costs and estimations. Your commentary on Step7 showed a clear understanding of CM’s.You have clearly identified both a marketing and resource constraint for Crowdspark, being the cheaper competing companies and the crowdsourced material and gave good reasons on why this would impact their CM’s.I am impressed by your Step 7.
Step 8
Calculation of ratios
Ratios – commentary (blog)
Calculate economic profit
Commentary – drivers of
I have checked each cell for your Ratio Calc sheet and cannot fault any. I have seen your commentary on FB which shows you have put a lot of thought into each area, also picked up on a mistake with the NBC on my ratio S/S which I had not thought about, so Thank You. Your blog commentary also shows a lot of thought was put into the deciphering of all the figures produced. Well done on this. Your commentary inc in the assignment, on each of the ratios produced, shows a good understanding and you applied this
ACCT11059 – Accounting Learning & Online CommunicationAss#2 - Step 7 - 10
S0049661 – Toni Daniel
economic profit (blog)
knowledge to the results produced for Crowdspark which reaffirmed your knowledge of each ratio.Your calcs and commentary of the economic profit for Crowdspark also show your research and understanding of this area.I would include a link to your blog in your assignment, as you have given some insight your blog also.
Step 9
Develop capital investment decision for your firm
Calculation of payback period, NPV & IRR
Recommendation & discussion
I very much liked your 2 capital investment decisions, it showed a lot of thought had been put into it. Your discussion on these investment decisions showed a lot of knowledge.On your Spreadsheet Option 1 is set out well. Minor error in the payback period, it should be 3 years and whatever months, days etc. Wrong cells are used, easy fix though.Option 2 also has a minor error in comparison to your table on the word doc, 3-5 should be 100, 6-10 should be 50 – or change the table in the word doc Payback period also needs to be looked at for Option 2.Year 10 for both options should also include your residual value, I have also made this mistake in my spreadsheet and will need to correct this also. This may also create the need to change your recommendations, depending on the new results.
Step 10
Individual feedback with other students
I have received feedback from you for my assignment and feel that you always find things that I do not, which is greatly appreciated. Your feedback is always thoughtful and thorough and very greatly appreciated.
Overall ASS#3 I very much enjoyed reading your Ass#2 Step 7-9. It shows a great understanding of the topics as well as a lot of applicable research and thought put into it and projected onto your company. Very well done.
PEER FEEDBACK SHEET: ASS#2 Step 7-10
Feedback From: Toni Daniel
Feedback To: Steven Minehan
My Comments
Step 7
Identify three products or services
Your discussion and identification of 3 products for Dynamic Holdings showed a good understanding of your company. The costs used inc the sale and explanation for the variable cost of 80%

ACCT11059 – Accounting Learning & Online CommunicationAss#2 - Step 7 - 10
S0049661 – Toni Daniel
of your firm
Estimate selling price, variable cost & CM Commentary – contribution margins
Constraints – identify & commentary
showed that you put a lot of thought and research into your costings, which were great.Your commentary showed your understanding of the CM and you were able to apply this understanding to your company. E.g. Diff between residential & comm sales.You discussed the constraints of the firm e.g. flooded market and sourcing land in an already built out city.I enjoyed reading your Step 7 and thought the use of pics gave it a nice touch also.
Step 8
Calculation of ratios
Ratios – commentary (blog)
Calculate economic profit
Commentary – drivers of economic profit (blog)
All formulas look good, excepting any formula which needs TOTAL ASSETS – should be using the total of the current and non-current assets, (Fin Stmt D39 + D50). You are using NET ASSETS which I do not think to be correct. Please research this before changing though! My spreadsheet already has this added in a cell, which is easier to refer to, you will just have to chuck a quick formula in. This is referring to your formulas for Return on Assets, Total Asset Turnover Ratio, Equity Ratio & Debt Ratio.Your commentary on each of the ratios was easy to understand and you were able to apply it to Dynamic Holdings which was great.Your workings and commentary for economic profit were good. I like that you questioned the WACC of 10% as generally your co is doing well until you get to this figure.
Step 9
Develop capital investment decision for your firm
Calculation of payback period, NPV & IRR
Recommendation & discussion
I very much liked your 2 capital investment decisions, your calcs on the spreadsheet were all good. I agree with your Beijing recommendation as the payback period is less and the NPV is higher. Only one recommend in this area is to do a spellcheck and double check the use of all the acronyms (noted NVP instead of NPV)
Step 10
Individual feedback with other students
I have received feedback from you for my assignment and feel that it was thoughtful and kind – Thank You.
Overall ASS#3 I very much enjoyed reading your Ass#2 Step 7-9. It showed a great understanding of all concepts involved and I believe that you covered
ACCT11059 – Accounting Learning & Online CommunicationAss#2 - Step 7 - 10
S0049661 – Toni Daniel
all that was required. Very good.
PEER FEEDBACK SHEET: ASS#2 Step 7-10
Feedback From: Toni Daniel
Feedback To: Jessica Wilkie
My Comments
Step 7
Identify three products or services of your firm
Estimate selling price, variable cost & CM Commentary – contribution margins
Constraints – identify & commentary
You have identified 3 products that Capilano produce and sell, like my co yours were also easy to identify, along with selling prices. You might want to put some evidence for your research on your selling prices, e.g. Where did you get them from? screenshot WW online shopping etc.You gave thought into why the CM for each of the products might vary, e.g. costs of packaging, costs of sourcing diff types of honey, though I would argue that the cost of sourcing ‘Manuka’ honey might be more than other honey sources, given that you pay a lot more for it at the checkout…You have not discussed constraints that Capilano might be currently facing in their markets. Capilano are currently in the news RE their importing of Chinese ‘sugar’ honey and selling it to consumers as Aust honey, as well as contaminating local markets, they have yet again lost their latest court battle against ‘Save The Bees Australia’. I would consider that a constraint on their market and I believe it has also affected their share prices. Perhaps sourcing honey also might be a constraint given the general concern for the global bee populations currently in the media.
Step 8
Calculation of ratios
Ratios – commentary (blog)
Calculate economic profit
Commentary – drivers of economic profit (blog)
You have noted where you have retrieved the figure used for your days of inventory calc, this is good.I have checked all other formulas, they all seem to be good.Your commentary of each of the margins produced showed a good understanding and you were able to apply it to your results for Capilano which was very good.You were able to discuss the Economic Profit results found for Capilano and discuss why these results may have varied over the years.
In your word doc you did have two different options for your capital investment decisions which were well thought out, they
ACCT11059 – Accounting Learning & Online CommunicationAss#2 - Step 7 - 10
S0049661 – Toni Daniel
Step 9
Develop capital investment decision for your firm
Calculation of payback period, NPV & IRR
Recommendation & discussion
showed cashflow throughout the years, but did not seem to have a residual value inc, your workings were on your word doc, however were not included in your excel spreadsheet which still had the example provided by Maria – so I was unable to check all of the workings. Your discussion on the reasoning behind your choice showed a lot of thought had been put into it.
Step 10
Individual feedback with other students
N/A at this stage, I have not seen feedback provided.
Overall ASS#3 I enjoyed reading your Step7-8, though I think you may still have a bit more work to do. Finish off the excel sheet for Step 9 is a must!
Overall a good sound result at this stage though. Well done.