village14.com€¦ · web viewvillage14.com
TRANSCRIPT

ENROLLMENT PLANNING & CLASS SIZE REPORT
January 28, 2019
100 Walnut StreetNewtonville, MA 02460

David Fleishman Superintendent
Liam HurleyAssistant Superintendent/Chief Financial and Administrative Officer
Eva ThompsonInterim Assistant Superintendent for Elementary Education
Toby RomerAssistant Superintendent for Secondary Education and Special Programs
Karen ShmuklerAssistant Superintendent for Student Services
Mary EichAssistant Superintendent for Teaching and Learning
Contributors:
Henry Turner, Principal, Newton North High School Joel Stembridge, Principal, Newton South High School
Amy Winston, Vice Principal, Newton North High School Candice Beermann, Vice Principal, Newton South High School
Meghan Smith, Data Analyst/Scheduler, Newton North High School Jordan Kraus, Science Teacher, Newton South High School
Mary Scott, Scheduler, Newton South High School Paula Black, Assistant Director of Student Services
Maura Tynes, Director of Elementary Special Education Julie Kirrane, Director of Business and Planning
Katy Hogue, District Student Data Manager Sean Mannion, Finance Director

TABLE OF CONTENTS
PageExecutive Summary 1-2
Table 1: Average Class Sizes for Elementary and Secondary School Classes 2Table 2: Percent of Classes with 25 or More Students and with Fewer Than 20 Students 2
Elementary Class Size Statistics 3
Table 3: Enrollment Statistics and Distribution of Class Sizes for 2018-19 4-6
Elementary Enrollment Planning 7
Tables 4-9: Class Sizes as of October 1, 2018 and through 2023-24 (projected) 8-19Table 10: Elementary School 2018-19 Space Utilization and Capacity 21-24
Middle School Class Size Statistics 25
Table 11: Enrollment Statistics and Distribution of Class Sizes for 2018-19 25-27
Middle School Enrollment Planning 28
Table 12: Team and Class Sizes for 2018-19 and through 2023-24 (projected) 29-34Table 13: Middle School 2018-19 Space Utilization 35-37
High School Class Size Statistics 38
Table 14: Distribution of Class Sizes 2018-19 for High Schools 39
Table 15: Average Class Size by Department and Curriculum Level 2018-19 42
Table 16: Total for 5 Academic Areas for 2017-18 and 2018-19 43
Table 17: Classes with 25 or More Students November 1, 2018 and 2017 44
Table 18: Newton North High School Course Enrollment 2018-19 45-53
Table 19. Newton South High School Course Enrollment 2018-19 54-62
Table 20. Newton North High School Departmental Enrollments 2018-19 63
Table 21. Newton South High School Departmental Enrollments 2018-19 64
Table 22. Newton North High School Projected Future Class Sizes for 5 Academic Areas 65
Table 23. Newton South High School Projected Future Class Sizes for 5 Academic Areas 66

- 1 -
EXECUTIVE SUMMARY
The purpose of this report is to provide an overview of current class sizes and student-to-teacher ratios in the context of current and projected enrollment. Enrollment planning information for future years is provided for all three grade levels, based upon the November 2018 five-year enrollment projections. Information in this report is used in the development of the annual operating budget to allocate staffing resources, and for short- and long-term enrollment and facilities planning. Enrollment statistics in this report are presented as of October 1, 2018 for elementary schools and November 1, 2018 for secondary schools.
At the elementary level, the report provides both statistical information on class sizes and student-to-teacher ratios and information on current classroom utilization, space availability and capacity in elementary buildings, as well as anticipated classroom needs over the next five school years. At the middle school level, the report presents similar statistics and five-year theoretical future team and class sizes. Current year classroom utilization in the middle schools is included in the report.
The number and size of instructional spaces currently in use for special education students who are enrolled in their districted school or in district wide programs in elementary and middle schools is included in this report, as well as the current enrollment capacity of the district wide programs. Enrollment and capacity of district wide programs is a factor of student need, which is dynamic, and the information in this report is subject to change. The district is expanding capacity of the Stride program for autism and related needs by adding a site at Cabot Elementary School in the 2019-20 school year.
At the high school level, the report details class sizes in each curriculum area and level. Departmental enrollments and individual course enrollments are also presented. In addition, new tables are included this year that project future class sizes for the five major academic areas assuming that course enrollment patterns and the number of sections remain the same as the current year.
Class size statistics
The district has had stable average class sizes since a peak in class size for elementary and middle schools in the 2011-12 school year. In 2018-19, average class sizes have remained the same or decreased slightly from last year at all three grade levels. The number of large classes with 25 or more students has also remained the same or decreased from last year at all three levels.
Historical and current year data on class size averages and the distribution of large and small classes are shown in Table 1 and Table 2. These tables illustrate trends in average class sizes over the past ten years and trends in the distribution of class sizes for the past four years.

- 2 -
TABLE 1AVERAGE CLASS SIZES FOR ALL GRADE LEVELS - TEN YEARS
Grade Level 2009-10 2010-11 2011-12 2012-13 2013-14 2014-15 2015-16 2016-17 2017-18 2018-19
Elementary 22.0 22.3 22.3 22.0 21.2 20.6 20.5 20.7 21.0 21.0
Middle 21.7 21.7 22.8 21.9 21.7 20.9 20.9 21.2 21.7 21.3
High School 21.3 21.6 21.9 21.9 22.0 21.6 21.4 22.0 22.3 22.0
TABLE 2PERCENT OF CLASSES WITH 25 OR MORE AND WITH
FEWER THAN 20 STUDENTS2015-16 THROUGH 2018-19
Grade Level
25 Students or More Fewer Than 20 Students
2015-16 2016-17 2017-18 2018-19 2015-16 2016-17 2017-18 2018-19
Elementary 5% 4% 5% 5% 37% 31% 29% 24%
Middle 8% 5% 10% 7% 29% 20% 19% 22%
High 22% 29% 30% 29% 25% 22% 22% 22%
Enrollment Planning Information
The report includes anticipated theoretical class and team needs for elementary and middle school during the next five years and anticipated theoretical class sizes for high schools during the next three years. This information highlights where issues of class and team size are expected to arise next year and may arise in future years through 2023-24.
Enrollment planning information in this report is new this year for high schools. Tables 22 and 23 illustrate theoretical projected class sizes by department and curriculum level for the next three years, using the November 2018 enrollment projections and assuming that enrollment patterns in departments and course levels remain the same as the current year (2018-19). The information in these tables can be used to plan for future year course offerings, understanding that offerings may need to shift as enrollment patterns change. The inclusion of these tables, however, provides an earlier look at possible course offerings for future years than previously available.
This report also documents current year utilization of core instructional spaces including information about the number of full size, small size and modular classrooms in use at elementary and middle schools, as well as space used for district wide special education programs. Synthesizing enrollment and capacity information provides guidance for the district on broad resource needs in the short- and long-term.

- 3 -
ELEMENTARY SCHOOL CLASS SIZES
The elementary school average class size has remained the same as last year at 21.0 students (see Table 1). The ten-year peak in elementary school class size averages was 22.3 students in the 2010-11 and 2011-12 school years. Class sizes at the elementary schools range from 15 to 26 students; only 5% of classes (or 15 classes) have 25 students or more (see Table 2), the same as last year when 5% of classes (or 14 classes) had 25 students or more.
Table 3 summarizes overall enrollment at the elementary schools and provides detailed information about enrollments, the distribution of class sizes, average class sizes, and student-to- adult ratios. Table 3 includes enrollment of students requiring special education services and English Language Learners for each school. It also provides information about the number of regular education teachers, regular education teacher specialists, and regular education paraprofessionals in each building, as well as the student-to-teacher ratios for each of these groups of staff. The elementary average class sizes range from a high of 22.3 students to a low of 18.5 students. Underwood has the highest average class size this year with 22.3 students, although all but one of its classes are in the preferred range of 20-24 students, with the remaining class at 25 students. Ward again has the lowest average class size at 18.5, followed by Williams (19.9) and Burr (20.2).

TABLE 3SCHOOL ENROLLMENT STATISTICS AND DISTRIBUTION OF CLASS
School Name Angier Bowen Burr Cabot Countryside
Special Education Programs Citywide Integrated ACHIEVE Program
Stride
Total Enrollment (October 1, 2018)Students requiring special education services* English Language Learners*
5038238
3976456
3845843
3863825
4136370
Distribution of Class Sizes15-19 Students 7 6 10 1 120-24 Students 15 13 9 17 1525-29 Students 2 3
Total No. of Classes 24 19 19 18 19Average Class Size 21.0 20.9 20.2 21.4 21.7
Regular Education Teachers 24 19 19 18 19Students:Teachers 21:1 21:1 20:1 21:1 22:1
Regular Education Teacher Specialists 4.9 4.4 4.4 4.4 4.2Students:Specialists 104:1 90:1 87:1 88:1 98:1
Regular Education Paraprofessionals 3.1 3.2 3.6 2.5 3.9Students:Aides 164:1 123:1 106:1 153:1 107:1
Teachers: Teacher Specialists:Teacher Literacy Specialists
Paraprofessionals: Intervention SpecialistsAide Art Teachers
Music TeachersPhysical Education Teachers Title IIA and Title I funded
* As reported in the MA DESE October 1, 2018 SIMS Report.** Please note that although Neighborhood Co-Taught has been reported as a special education program by school in this table in previous years, it is no longer reported in this table as all schools offer co-teaching in classrooms.
- 4

TABLE 3, cont.SCHOOL ENROLLMENT STATISTICS AND DISTRIBUTION OF CLASS
School Name Franklin Horace Mann Lincoln-Eliot Mason RiceMemorial- Spaulding
Special Education Programs Cohort
Total Enrollment (October 1, 2018)Students requiring special education services* English Language Learners*
4275727
3993839
3657562
4875836
4647746
Distribution of Class Sizes15-19 Students 5 6 5 220-24 Students 16 17 12 14 1725-29 Students 1 3 3
Total No. of Classes 21 18 18 22 22Average Class Size 20.3 22.2 20.3 22.1 21.1
Regular Education Teachers 21 18 18 22 22Students:Teachers 20:1 22:1 20:1 22:1 21:1
Regular Education Teacher Specialists 5.5 4.4 4.4 5.7 5.6Students:Specialists 78:1 91:1 83:1 85:1 83:1
Regular Education Paraprofessionals 2.3 3.8 3.2 4.0 3.2Students:Aides 183:1 106:1 115:1 122:1 145:1
Teachers: Teacher Specialists:Teacher Literacy Specialists
Paraprofessionals: Intervention SpecialistsAide Art Teachers
Music TeachersPhysical Education Teachers Title IIA and Title I funded
* As reported in the MA DESE October 1, 2018 SIMS Report.** Please note that although Neighborhood Co-Taught has been reported as a special education program by school in this table in previous years, it is no longer reported in this table as all schools offer co-teaching in classrooms.
- 5

TABLE 3, cont.SCHOOL ENROLLMENT STATISTICS AND DISTRIBUTION OF CLASS
School Name Peirce Underwood Ward Williams Zervas
Special Education Programs Stride
Total Enrollment (October 1, 2018)Students requiring special education services* English Language Learners*
2713314
2903421
2964118
2783531
4277243
Distribution of Class Sizes15-19 Students 4 9 7 420-24 Students 9 12 7 7 1425-29 Students 1 2
Total No. of Classes 13 13 16 14 20Average Class Size 20.8 22.3 18.5 19.9 21.4
Regular Education Teachers 13 13 16 14 20Students:Teachers 21:1 22:1 19:1 20:1 21:1
Regular Education Teacher Specialists 3.3 3.1 3.4 3.3 4.4Students:Specialists 82:1 94:1 87:1 84:1 97:1
Regular Education Paraprofessionals 2.0 2.9 4.4 3.9 3.9Students:Aides 133:1 99:1 68:1 72:1 109:1
Teachers: Teacher Specialists:Teacher Literacy Specialists
Paraprofessionals: Intervention SpecialistsAide Art Teachers
Music TeachersPhysical Education Teachers Title IIA and Title I funded
* As reported in the MA DESE October 1, 2018 SIMS Report.** Please note that although Neighborhood Co-Taught has been reported as a special education program by school in this table in previous years, it is no longer reported in this table as all schools offer co-teaching in classrooms.
- 6

- 7 -
The current year array (Table 4) shows the current year’s class size distribution by school and provides a detailed look at class sizes and rooms at individual schools; there are 276 total elementary classrooms in the 2018-19 school year. The theoretical projected arrays (Tables 5 through 9) show projected future needs for elementary school classes for October 2019 through October 2023. Elementary enrollments are projected to decrease over the next five years by 200 students, as compared to the stable enrollment of around 5,800 students experienced since 2012. Rather than a steady decline, the number of elementary classes required fluctuates in the next five years from a high of 276 to a low of 272 classrooms.
The five-year theoretical arrays show that future average class sizes may become more favorable at the elementary level and improve from an average of 21 students per class to an average of20.2 students per class. Also, over the next five years, the number of classes needed to support average class sizes that do not exceed 25 students per class remains similar. In 2023-24, with projected enrollment lower by 200 students, the theoretical array shows the need for 274 elementary classes with 3% of classes at 25 or more students, compared to 5% in 2018-19.
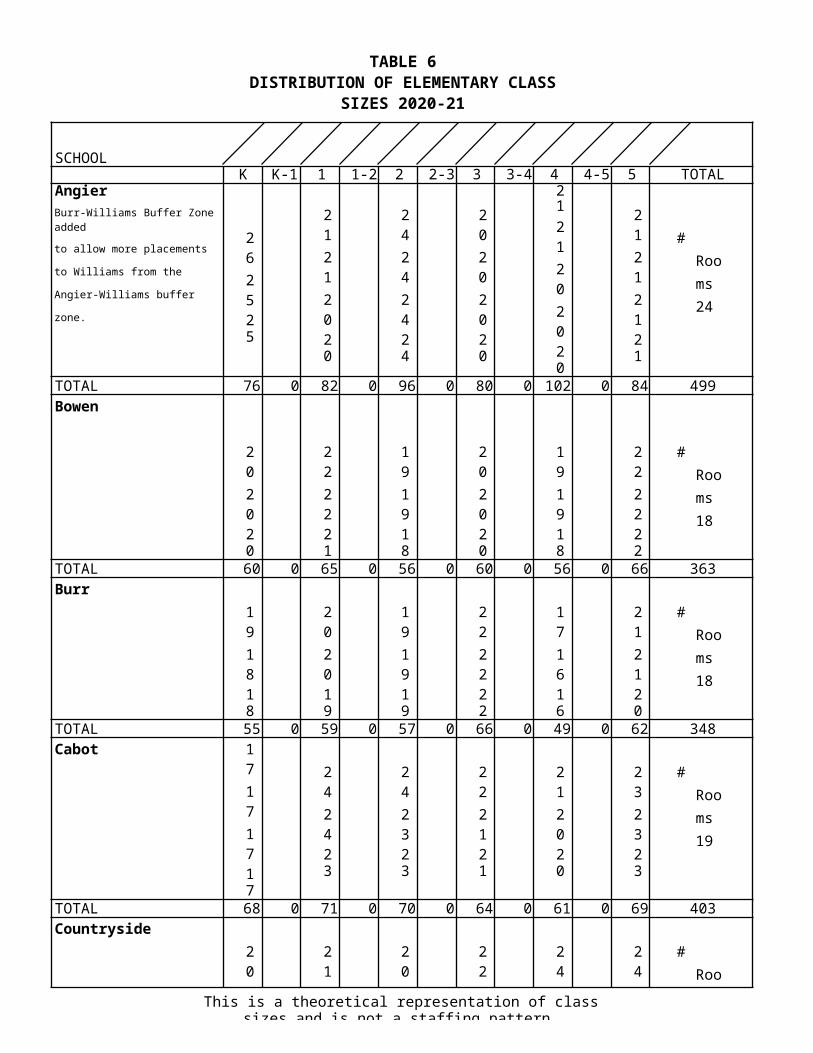
The arrays illustrate where the district will need to carefully manage enrollment at two schools: Angier and Peirce. As of this year, Angier is fully occupied with 24 classrooms and 503 students; the second grade is currently 97 students, has five classes and is projected to grow to over 102 students by fourth grade. As a result, it will be important to maintain three versus four kindergarten classes at Angier for the next three years through 2021-22. However, with three kindergarten sections, the arrays show that Angier would have more than 25 students per class in kindergarten, based on current enrollment projections. As a result, the district added a Burr- Williams buffer zone in November 2018 that should allow for more buffer zone placements next year to Williams from the Angier-Williams buffer zone (and fewer to Angier) to help reduce the above average kindergarten class sizes as projected.
The 2018 student assignment changes took advantage of additional capacity projected at Peirce to relieve crowding at Franklin. Prior to these changes, Peirce enrollment was projected to decrease to about 250 students and 12 classes. As enrollment grows in the next five years, Peirce is projected to have 15 classes (the school’s recommended capacity) and several large classes may result by 2022. Small schools typically are challenged in balancing class sizes especially with cohorts around 50 students, and class sizes sometimes exceed 25 students. The district will need to manage enrollment closely at Peirce in the upcoming years as student assignment changes are fully phased-in.

TABLE 4DISTRIBUTION OF ELEMENTARY CLASS
SIZES 2018-19ENROLLMENT OCTOBER 1
- 8 -
SCHOOLK K-1 1 1-2 2 2-3 3 3-4 4 4-5 5 TOTAL
Angier21212121
19181818
2020191919
22222121
23222222
252524
# Rooms 24
TOTAL 84 0 73 0 97 0 86 0 89 0 74 503Bowen
181818
232222
202020
222222
191818
24242423
# Rooms 19
TOTAL 54 0 67 0 60 0 66 0 55 0 95 397Burr
191818
232323
171717
212120
242424
19191918
# Rooms 19
TOTAL 55 0 69 0 51 0 62 0 72 0 75 384Cabot
202020
202019
212020
232222
242323
232323
# Rooms 18
TOTAL 60 0 59 0 61 0 67 0 70 0 69 386Countryside
202019
222121
222222
232222
21202020
262525
# Rooms 19
TOTAL 59 0 64 0 66 0 67 0 81 0 76 413Franklin
202019
222121
22212121
212020
22222121
18181818
# Rooms 21
TOTAL 59 0 64 0 85 0 61 0 86 0 72 427Horace Mann
212020
212020
242323
252424
212120
242424
# Rooms 18
TOTAL 61 0 61 0 70 0 73 0 62 0 72 399Lincoln-Eliot 19
1919
212120
222221
171717
212121
232222
# Rooms 18
TOTAL 57 0 62 0 65 0 51 0 63 0 67 365

TABLE 4, Continued DISTRIBUTION OF ELEMENTARY CLASS SIZES
2018-19
- 9 -
SCHOOLK K-1 1 1-2 2 2-3 3 3-4 4 4-5 5 TOTAL
Mason-Rice
191918
232322
262625
23232323
2020201919
24242424
# Rooms 22
TOTAL 56 0 68 0 77 0 92 0 98 0 96 487Memorial- Spaulding 20
2020
20202019
20202019
21212020
23222222
252525
# Rooms 22
TOTAL 60 0 79 0 79 0 82 0 89 0 75 464Peirce
2222
2222
2322
2221
201919
1918
# Rooms 13
TOTAL 44 0 44 0 45 0 43 0 58 0 37 271Underwood
2221
2020
2524
2322
222222
2423
# Rooms 13
TOTAL 43 0 40 0 49 0 45 0 66 0 47 290Ward
2120
2019
161615
171717
201919
202020
# Rooms 16
TOTAL 41 0 39 0 47 0 51 0 58 0 60 296Williams
2423
171717
2121
201919
1918
2221
# Rooms14
TOTAL 47 0 51 0 42 0 58 0 37 0 43 278Zervas 17
171717
232222
22222121
222222
252524
222222
# Rooms
20
TOTAL 68 0 67 0 86 0 66 0 74 0 66 427
K K-1 1 1-2 2 2-3 3 3-4 4 4-5 5 TOTALGrand Total 848 0 907 0 980 0 970 0 1058 0 1024 5,787
Avg. Class Size 19.7 0.0 20.6 0.0 20.9 0.0 21.1 0.0 21.2 0.0 22.3 21.0
# of Rooms/Classes 43 0 44 0 47 0 46 0 50 0 46 276

TABLE 5DISTRIBUTION OF ELEMENTARY CLASS
SIZES 2019-20ENROLLMENT OCTOBER 1
- 10
SCHOOLK K-1 1 1-2 2 2-3 3 3-4 4 4-5 5 TOTAL
AngierBurr-Williams Buffer Zone added
to allow more placements to Williams
from the Angier-Williams buffer zone.
252524
23232322
20191919
2120202020
22222221
22222221
# Rooms 24
TOTAL 74 0 91 0 77 0 101 0 87 0 87 517Bowen
202020
202019
212121
201919
222221
191918
# Rooms 18
TOTAL 60 0 59 0 63 0 58 0 65 0 56 361Burr
191919
201919
232323
171616
212120
242424
# Rooms 18
TOTAL 57 0 58 0 69 0 49 0 62 0 72 367Cabot
222221
222222
212121
212120
222222
252424
# Rooms 18
TOTAL 65 0 66 0 63 0 62 0 66 0 73 395Countryside
202020
212020
212121
232322
242323
21212020
# Rooms 19
TOTAL 60 0 61 0 63 0 68 0 70 0 82 404Franklin
212020
212020
212121
22222121
202020
22222121
# Rooms 20
TOTAL 61 0 61 0 63 0 86 0 60 0 86 417Horace Mann
191918
222121
212020
242423
252525
212020
# Rooms 18
TOTAL 56 0 64 0 61 0 71 0 75 0 61 388Lincoln-Eliot 18
1818
191918
212121
212120
181717
232322
# Rooms 18
TOTAL 54 0 56 0 63 0 62 0 52 0 68 355

TABLE 5, Continued DISTRIBUTION OF ELEMENTARY CLASS SIZES
2019-20
This is a theoretical representation of class sizes and is not a staffing pattern.
SCHOOLK K-1 1 1-2 2 2-3 3 3-4 4 4-5 5 TOTAL
Mason-Rice
212020
202020
242323
20201919
24242323
2020202019
# Rooms 22
TOTAL 61 0 60 0 70 0 78 0 94 0 99 462Memorial- Spaulding
18181818
212121
20202020
20201919
21212121
23232222
# Rooms 23
TOTAL 72 0 63 0 80 0 78 0 84 0 90 467Peirce 17
1717
2423
2221
2323
2121
191818
# Rooms 14
TOTAL 51 0 47 0 43 0 46 0 42 0 55 284Underwood
2019
2323
2019
2524
2323
222221
# Rooms 13
TOTAL 39 0 46 0 39 0 49 0 46 0 65 284Ward
2121
2423
2020
171616
181717
201919
# Rooms 15
TOTAL 42 0 47 0 40 0 49 0 52 0 58 288Williams
2424
2424
171717
2020
201919
1717
# Rooms14
TOTAL 48 0 48 0 51 0 40 0 58 0 34 279Zervas 18
181717
20191919
232323
23232323
232322
20202020
# Rooms
22
TOTAL 70 0 77 0 69 0 92 0 68 0 80 456
K K-1 1 1-2 2 2-3 3 3-4 4 4-5 5 TOTALGrand Total 870 0 904 0 914 0 989 0 981 0 1066 5,724
Avg. Class Size 19.8 0.0 21.0 0.0 20.8 0.0 20.6 0.0 21.3 0.0 20.9 20.7
# of Rooms/Classes 44 0 43 0 44 0 48 0 46 0 51 276

TABLE 6DISTRIBUTION OF ELEMENTARY CLASS
SIZES 2020-21ENROLLMENT OCTOBER 1
This is a theoretical representation of class sizes and is not a staffing pattern.
SCHOOLK K-1 1 1-2 2 2-3 3 3-4 4 4-5 5 TOTAL
AngierBurr-Williams Buffer Zone added
to allow more placements to Williams
from the Angier-Williams buffer zone.
262525
21212020
24242424
20202020
2121202020
21212121
# Rooms 24
TOTAL 76 0 82 0 96 0 80 0 102 0 84 499Bowen
202020
222221
191918
202020
191918
222222
# Rooms 18
TOTAL 60 0 65 0 56 0 60 0 56 0 66 363Burr
191818
202019
191919
222222
171616
212120
# Rooms 18
TOTAL 55 0 59 0 57 0 66 0 49 0 62 348Cabot 17
171717
242423
242323
222121
212020
232323
# Rooms 19
TOTAL 68 0 71 0 70 0 64 0 61 0 69 403Countryside
202019
212121
202020
222221
242423
242323
# Rooms 18
TOTAL 59 0 63 0 60 0 65 0 71 0 70 388Franklin
202019
222121
202020
212121
22212121
202020
# Rooms 19
TOTAL 59 0 64 0 60 0 63 0 85 0 60 391Horace Mann
201919
202020
222221
212120
252424
252524
# Rooms 18
TOTAL 58 0 60 0 65 0 62 0 73 0 74 392Lincoln-Eliot 19
1918
181818
191919
202020
212121
191918
# Rooms 18
TOTAL 56 0 54 0 57 0 60 0 63 0 56 346

TABLE 6, Continued DISTRIBUTION OF ELEMENTARY CLASS SIZES
2020-21
This is a theoretical representation of class sizes and is not a staffing pattern.
SCHOOLK K-1 1 1-2 2 2-3 3 3-4 4 4-5 5 TOTAL
Mason-Rice
191919
222222
212120
242423
20202019
24242423
# Rooms 20
TOTAL 57 0 66 0 62 0 71 0 79 0 95 430Memorial- Spaulding
19181818
19191919
222121
20202020
21202020
22222121
# Rooms 23
TOTAL 73 0 76 0 64 0 80 0 81 0 86 460Peirce 17
1716
181818
2323
2322
2322
2020
# Rooms 14
TOTAL 50 0 54 0 46 0 45 0 45 0 40 280Underwood
2120
2121
2322
2020
2525
2322
# Rooms 12
TOTAL 41 0 42 0 45 0 40 0 50 0 45 263Ward
2121
161615
161616
2121
2525
2626
# Rooms 14
TOTAL 42 0 47 0 48 0 42 0 50 0 52 281Williams
2423
171716
2424
2524
2020
181817
# Rooms14
TOTAL 47 0 50 0 48 0 49 0 40 0 53 287Zervas 19
191918
20202019
20202020
19191818
24242423
252524
# Rooms
23
TOTAL 75 0 79 0 80 0 74 0 95 0 74 477
K K-1 1 1-2 2 2-3 3 3-4 4 4-5 5 TOTALGrand Total 876 0 932 0 914 0 921 0 979 0 986 5,608
Avg. Class Size 19.5 0.0 19.8 0.0 20.8 0.0 20.9 0.0 21.3 0.0 21.9 20.6
# of Rooms/Classes 45 0 47 0 44 0 44 0 47 0 45 272

TABLE 7DISTRIBUTION OF ELEMENTARY CLASS
SIZES 2021-22ENROLLMENT OCTOBER 1
This is a theoretical representation of class sizes and is not a staffing pattern.
SCHOOLK K-1 1 1-2 2 2-3 3 3-4 4 4-5 5 TOTAL
AngierBurr-Williams Buffer Zone added
to allow more placements to Williams
from the Angier-Williams buffer zone.
252524
21212121
22222121
2020202020
21202020
25252524
# Rooms 24
TOTAL 74 0 84 0 86 0 100 0 81 0 99 524Bowen
202020
222221
212120
181817
202019
201919
# Rooms 18
TOTAL 60 0 65 0 62 0 53 0 59 0 58 357Burr
191918
191919
202019
191818
222221
2524
# Rooms 17
TOTAL 56 0 57 0 59 0 55 0 65 0 49 341Cabot 18
181717
19191818
20201919
242423
212121
222121
# Rooms 21
TOTAL 70 0 74 0 78 0 71 0 63 0 64 420Countryside
201919
212121
212120
212120
232322
242424
# Rooms 18
TOTAL 58 0 63 0 62 0 62 0 68 0 72 385Franklin
191918
212120
212120
202020
212121
21212121
# Rooms 19
TOTAL 56 0 62 0 62 0 60 0 63 0 84 387Horace Mann
191919
212020
202020
222222
222121
242424
# Rooms 18
TOTAL 57 0 61 0 60 0 66 0 64 0 72 380Lincoln-Eliot 18
1818
181818
191818
181818
212020
232322
# Rooms 18
TOTAL 54 0 54 0 55 0 54 0 61 0 68 346

TABLE 7, Continued DISTRIBUTION OF ELEMENTARY CLASS SIZES
2021-22
This is a theoretical representation of class sizes and is not a staffing pattern.
SCHOOLK K-1 1 1-2 2 2-3 3 3-4 4 4-5 5 TOTAL
Mason-Rice
191919
212121
232323
212121
252424
20202020
# Rooms 19
TOTAL 57 0 63 0 69 0 63 0 73 0 80 405Memorial- Spaulding
18181818
19191919
20191919
222121
21212020
21212020
# Rooms 23
TOTAL 72 0 76 0 77 0 64 0 82 0 82 453Peirce 18
1717
191818
181817
2423
2222
2221
# Rooms 15
TOTAL 52 0 55 0 53 0 47 0 44 0 43 294Underwood
2020
2322
2120
2323
2020
2525
# Rooms 12
TOTAL 40 0 45 0 41 0 46 0 40 0 50 262Ward
2120
161616
171616
171717
2221
2525
# Rooms 15
TOTAL 41 0 48 0 49 0 51 0 43 0 50 282Williams
2323
171616
171717
2323
2524
1918
# Rooms14
TOTAL 46 0 49 0 51 0 46 0 49 0 37 278Zervas 19
191818
21212121
21212020
22222121
19191919
26262625
# Rooms
24
TOTAL 74 0 84 0 82 0 86 0 76 0 103 505
K K-1 1 1-2 2 2-3 3 3-4 4 4-5 5 TOTALGrand Total 867 0 940 0 946 0 924 0 931 0 1011 5,619
Avg. Class Size 19.3 0.0 19.6 0.0 19.7 0.0 20.5 0.0 21.2 0.0 22.5 20.4
# of Rooms/Classes 45 0 48 0 48 0 45 0 44 0 45 275

TABLE 8DISTRIBUTION OF ELEMENTARY CLASS
SIZES 2022-23ENROLLMENT OCTOBER 1
This is a theoretical representation of class sizes and is not a staffing pattern.
SCHOOLK K-1 1 1-2 2 2-3 3 3-4 4 4-5 5 TOTAL
Angier20191919
21212020
22222222
23232222
26252525
20201919
# Rooms 24
TOTAL 77 0 82 0 88 0 90 0 101 0 78 516Bowen
201919
222121
212020
202019
181717
202020
# Rooms 18
TOTAL 58 0 64 0 61 0 59 0 52 0 60 354Burr
191818
202019
191919
191918
191818
222221
# Rooms 18
TOTAL 55 0 59 0 57 0 56 0 55 0 65 347Cabot 18
181717
19191919
20201919
20202019
242323
222221
# Rooms 22
TOTAL 70 0 76 0 78 0 79 0 70 0 65 438Countryside
202019
212120
212120
222121
222221
232322
# Rooms 18
TOTAL 59 0 62 0 62 0 64 0 65 0 68 380Franklin
191919
202019
212020
212121
202019
212120
# Rooms 18
TOTAL 57 0 59 0 61 0 63 0 59 0 62 361Horace Mann
201919
202020
212020
212120
232222
212121
# Rooms 18
TOTAL 58 0 60 0 61 0 62 0 67 0 63 371Lincoln-Eliot 18
1817
181818
191818
181717
191818
222222
# Rooms 18
TOTAL 53 0 54 0 55 0 52 0 55 0 66 335

TABLE 8, Continued DISTRIBUTION OF ELEMENTARY CLASS SIZES
2022-23
This is a theoretical representation of class sizes and is not a staffing pattern.
SCHOOLK K-1 1 1-2 2 2-3 3 3-4 4 4-5 5 TOTAL
Mason-Rice
191918
212120
222221
242323
222121
252424
# Rooms 18
TOTAL 56 0 62 0 65 0 70 0 64 0 73 390Memorial- Spaulding
18171717
19191918
20201919
19191919
222222
21212120
# Rooms 23
TOTAL 69 0 75 0 78 0 76 0 66 0 83 447Peirce15 core classrooms
171717
191918
181818
2827
2323
2120
# Rooms 15
TOTAL 51 0 56 0 54 0 55 0 46 0 41 303Underwood
2020
2221
2322
2121
2323
2020
# Rooms 12
TOTAL 40 0 43 0 45 0 42 0 46 0 40 256Ward
2120
2322
171616
171717
171717
2221
# Rooms 15
TOTAL 41 0 45 0 49 0 51 0 51 0 43 280Williams 16
1616
2323
171716
2424
2323
2323
# Rooms14
TOTAL 48 0 46 0 50 0 48 0 46 0 46 284Zervas 19
191918
21212120
22222221
22222221
23222222
21212020
# Rooms
24
TOTAL 75 0 83 0 87 0 87 0 89 0 82 503
K K-1 1 1-2 2 2-3 3 3-4 4 4-5 5 TOTALGrand Total 867 0 926 0 951 0 954 0 932 0 935 5,565
Avg. Class Size 18.4 0.0 20.1 0.0 19.8 0.0 20.7 0.0 21.2 0.0 21.3 20.2
# of Rooms/Classes 47 0 46 0 48 0 46 0 44 0 44 275

TABLE 9DISTRIBUTION OF ELEMENTARY CLASS
SIZES 2023-24ENROLLMENT OCTOBER 1
This is a theoretical representation of class sizes and is not a staffing pattern.
SCHOOLK K-1 1 1-2 2 2-3 3 3-4 4 4-5 5 TOTAL
Angier19191818
22212121
22222121
23232322
23232222
25252424
# Rooms 24
TOTAL 74 0 85 0 86 0 91 0 90 0 98 524Bowen
202019
212120
202020
201919
201919
181817
# Rooms 18
TOTAL 59 0 62 0 60 0 58 0 58 0 53 350Burr
191818
202019
202019
191818
191918
181818
# Rooms 18
TOTAL 55 0 59 0 59 0 55 0 56 0 54 338Cabot 18
171717
19181818
20202019
20202020
262626
252424
# Rooms 22
TOTAL 69 0 73 0 79 0 80 0 78 0 73 452Countryside
201919
212020
212020
222121
232222
222221
# Rooms 18
TOTAL 58 0 61 0 61 0 64 0 67 0 65 376Franklin
202019
202019
201919
212120
212120
202019
# Rooms 18
TOTAL 59 0 59 0 58 0 62 0 62 0 59 359Horace Mann
201919
212121
212020
212120
212121
232222
# Rooms 18
TOTAL 58 0 63 0 61 0 62 0 63 0 67 374Lincoln-Eliot 18
1818
181817
191818
181717
181817
202019
# Rooms 18
TOTAL 54 0 53 0 55 0 52 0 53 0 59 326

TABLE 9, Continued DISTRIBUTION OF ELEMENTARY CLASS SIZES
2023-24
This is a theoretical representation of class sizes and is not a staffing pattern.
SCHOOLK K-1 1 1-2 2 2-3 3 3-4 4 4-5 5 TOTAL
Mason-Rice
191919
212020
222221
222222
242423
222221
# Rooms 18
TOTAL 57 0 61 0 65 0 66 0 71 0 65 385Memorial- Spaulding
18181717
18181817
19191918
20191919
20202019
232222
# Rooms 23
TOTAL 70 0 71 0 75 0 77 0 79 0 67 439Peirce15 core classrooms
171717
191818
191818
2827
2727
2222
# Rooms 15
TOTAL 51 0 55 0 55 0 55 0 54 0 44 314Underwood
2020
2221
2121
2322
2121
2323
# Rooms 12
TOTAL 40 0 43 0 42 0 45 0 42 0 46 258Ward
2120
2322
2423
181717
181717
2625
# Rooms 14
TOTAL 41 0 45 0 47 0 52 0 52 0 51 288Williams 16
1615
161616
2423
2424
2424
2121
# Rooms14
TOTAL 47 0 48 0 47 0 48 0 48 0 42 280Zervas 19
191818
21212120
22222121
23232323
23222222
24242424
# Rooms
24
TOTAL 74 0 83 0 86 0 92 0 89 0 96 520
K K-1 1 1-2 2 2-3 3 3-4 4 4-5 5 TOTALGrand Total 866 0 921 0 936 0 959 0 962 0 939 5,583
Avg. Class Size 18.4 0.0 19.6 0.0 20.3 0.0 20.8 0.0 21.4 0.0 21.8 20.4
# of Rooms/Classes 47 0 47 0 46 0 46 0 45 0 43 274

- 20
Table 10 details the current number and usage of full-size, small size and modular classrooms in the elementary schools in the 2018-19 school year. This table is presented in a format that aligns with standard Massachusetts School Building Authority (MSBA) education program components for core instructional spaces. (The MSBA’s format for presenting this information was adapted for Newton.)
Considering future class and team needs together with information about how instructional classroom spaces are utilized highlights opportunities and challenges at school facilities. For each school, information relevant to district enrollment planning is noted alongside the information on space utilization and capacity. Table 10 documents the number of full size, small size and modular classrooms in use at schools to provide the core instructional program. Space used for district wide special education programs is also explained.
The classroom utilization at elementary schools is described by comparing the number of 2018- 19 classes based on enrollment to the recommended number of classrooms available, which is established by taking into account space necessary for art, music and special education services, and discounting certain classrooms in buildings not preferred for core instructional use.
Spaces used for elementary district wide special education programs are also included in Table10. Newton’s newest school buildings (Angier, Zervas and Cabot) have all been designed to accommodate district wide programs for the elementary student population. A summary of these programs is also included below. As shown below, the Zervas Stride program for students with autism and related needs continues to operate at capacity. The district is adding a second Stride program at the Cabot School in 2019-20 to be able to continue to meet student need locally in- district.
Elementary School Programs Program Description Program Space GradesServed
AverageEnrollment Capacity
Angier ACHIEVE© Language Based Program Inclusion / Classroom-based Grade 2-5 24 28Countryside Stride Autism and Related Needs Substantially separate classroom Grade 4-5 5 8Horace Mann Cohort Autism and Related Needs Partial Inclusion / Classroom-based Grade 3-5 2 8Zervas Stride Autism and Related Needs Substantially separate classrooms Grade K-3 16 16Note 1: Stride Program will be expanded to Cabot beginning in 2019-20 to meet enrollment needs.Note 2: Horace Mann Cohort is in its final year.

TABLE 102018-19 UTILIZATION OF CORE INSTRUCTIONAL SPACE - ELEMENTARY
BOWEN ELEMENTARY SCHOOL # OF CLASSROOMS
Core Instructional SpaceFull SizeCR
Small SizeCR
Modular
CR Total
CORE ACADEMIC SPACES 24
General Classrooms 15 4
Five-Year Enrollment Planning Information through 2023-24
Angier is expected to be enrolled at full capacity for the next five years with 24 classes and enrollment just over 500 students. Angier has a larger than average second grade cohort of 97 students, expected to grow to over 100 students in 2020-21. As a result, the Burr-Williams buffer zone has been restored (November 2018) and placements to Angier from its buffer zones with Williams and Zervas will be managed closely.The ACHIEVE program is housed at Angier and is a language development districtwide program that enrolls up to 8 students per grade in grades 2-5. This is an integrated program with students receiving services within the regular classroom and in small group instruction.Elementary Student Stabilization Program (ESSP) staff are based at Angier.Angier has buffer zones with Zervas and Williams.
Five-Year Enrollment Planning Information through 2023-24
Bowen is projected to have decreased enrollment next year in 2019-20 with 18 classes followed by stable enrollment 360 students for the next four years.
Bowen is the preferred placement for students in its buffer zones with Memorial-Spaulding, where enrollments are projected to grow, and Mason-Rice, where classroom capacity is fully utilized and classes sizes still remain above the district average.
A full-size classroom has been adapted for use as a cafeteria at Bowen.
- 21
ANGIER ELEMENTARY SCHOOL # OF CLASSROOMS
Core Instructional SpaceFull Size CR
Small
Size CR
Total
CORE ACADEMIC SPACES 31General Classrooms 24Reading Program/Literacy LibraryLearning Center, ELL, Small Group Instruction 7
STUDENT SERVICES 5Districtwide Special EducationSmall Group Instruction, OT/PT, S&L, Inclusion 5
ART, MUSIC 2Art Classroom 1Music Classroom 1
TOTAL INSTRUCTIONAL SPACES 38CURRENT UTILIZATION
2018-19 Enrollment 5032018-19 Core Classes 24# of Core Classrooms Available 24
Percentage Classroom Utilization 100%

TABLE 102018-19 UTILIZATION OF CORE INSTRUCTIONAL SPACE - ELEMENTARY
CABOT AT CARR # OF CLASSROOMS
Core Instructional SpaceFull SizeCR
Small SizeCR
Modular
CR Total
CORE ACADEMIC SPACES 20
BOWEN ELEMENTARY SCHOOL # OF CLASSROOMS
Core Instructional SpaceFull SizeCR
Small SizeCR
Modular
CR Total
CORE ACADEMIC SPACES 24
General Classrooms 15 4
Five-Year Enrollment Planning Information through 2023-24 Burr is projected to have decreased enrollment next year in 2019-20 with18 classes and 367 students. Burr's enrollment is projected to decrease to around 350 students by 2020 and to require 17 or 18 classes over the next four years.
The Burr-Williams buffer zone has been reinstated for the 2019-20 school year to manage kindergarten enrollment at both Williams and Angier, and utilize capacity at Burr.
Burr has a large buffer zone with Franklin which will be helpful in balancing enrollment between Burr and Franklin.
Five-Year Enrollment Planning Information through 2023-24
Cabot is in its final year at the Carr building and is fully occupying the facility with just under 400 students enrolled in18 classes.
Next year, in its brand new facility, Cabot is projected to increase to 495 students in 18 classrooms. (Enrollment will be assessed regularly over the course of the spring and summer.) Over the next four years, Cabot's enrollment is projected to grow each year, reaching 452 students in 22 classrooms by October 2023. This phased enrollment growth is the result of the 2018 student assignment changes that enlarged the Cabot district and balanced enrollment among north side schools (Burr, Franklin, Horace Mann, Lincoln-Eliot and Peirce).
Cabot also will have two classrooms for the districtwide STRIDE program in 2019-20. The STRIDE program is currently located at Zervas, and enrollment has increased to the point that a two locations are necessary.This is a program for with students with autism and related needs receiving services in substantially separate classrooms.
- 22
BURR ELEMENTARY SCHOOL # OF CLASSROOMS
Core Instructional SpaceFullSize CR
SmallSize CR
Modular
CR Total
CORE ACADEMIC SPACES 20General Classrooms 19Reading Program/LiteracyLearning Center, ELL, Small Group Instruction 1
STUDENT SERVICES 1Districtwide Special EducationSmall Group Instruction, OT/PT, S&L, Inclusion 1
ART, MUSIC 2Art Classroom 1Music Classroom 1
TOTAL INSTRUCTIONAL SPACES 23
CURRENT UTILIZATION2018-19 Enrollment 3842018-19 Core Classes 19# of Core Classrooms Available 18
Percentage Classroom Utilization 106%

TABLE 102018-19 UTILIZATION OF CORE INSTRUCTIONAL SPACE - ELEMENTARY
FRANKLIN ELEMENTARY SCHOOL # OF CLASSROOMS
Core Instructional SpaceFull SizeCR
Small SizeCR
Modular
CR Total
CORE ACADEMIC SPACES 23General Classrooms 21
CABOT AT CARR # OF CLASSROOMS
Core Instructional SpaceFull SizeCR
Small SizeCR
Modular
CR Total
CORE ACADEMIC SPACES 20
Five-Year Enrollment Planning Information through 2023-24
Countryside is projected to have stable enrollmentnext year in 2019-20 with 19 classes and just over 400 students. Enrollment is projected to decrease for the next four years to about 380 students and to require 18 classes for the next four years, beginning in 2020-21.
The STRIDE program for children with autism and related needs is located at Countryside serving students in grades 4-5. The program was relocated to Zervas in 2017-18 but an older cohort group remains at Countryside.
Countryside has buffer zones with Bowen and Memorial-Spaulding. One of Newton's large residential complexes, Avalon at Newton Highlands, is located in a buffer zone with Countryside and Zervas.
The multi-purpose room at Countryside serves as a cafeteria, cafetorium and music classroom.
Five-Year Enrollment Planning Information through 2023-24
Franklin has gotten enrollment relief in the current year, with enrollment below projections at 427 students in 21 classrooms.
Buffer zones with Burr and Horace Mann have been important in balancing enrollment. The enrollment projections for Franklin further decrease in 2019-20 to 417 students in 20 classrooms.
The 2018 student assignment changes are planned to further ease crowding at Franklin to maintain classroom utilization at 19 or 20 classrooms for the next five years.
- 23
COUNTRYSIDE ELEMENTARY SCHOOL # OF CLASSROOMS
Core Instructional SpaceFullSize CR
SmallSize CR
Modular
CR Total
CORE ACADEMIC SPACES 25General Classrooms 18 1Reading Program/Literacy 1Learning Center, ELL, Small Group Instruction 1 2 2
STUDENT SERVICES 1Districtwide Special Education 1Small Group Instruction, OT/PT, S&L, Inclusion
ART, MUSIC 0Art Classroom 1Music Classroom stage
TOTAL INSTRUCTIONAL SPACES 26
CURRENT UTILIZATION2018-19 Enrollment 4132018-19 Core Classes 19Target # of Core Classrooms 20Percentage Classroom Utilization 95%

TABLE 102018-19 UTILIZATION OF CORE INSTRUCTIONAL SPACE - ELEMENTARY
LINCOLN-ELIOT ELEMENTARY SCHOOL # OF CLASSROOMS
Core Instructional SpaceFull SizeCR
Small SizeCR
Modular
CR Total
CORE ACADEMIC SPACES 21General Classrooms 18
FRANKLIN ELEMENTARY SCHOOL # OF CLASSROOMS
Core Instructional SpaceFull SizeCR
Small SizeCR
Modular
CR Total
CORE ACADEMIC SPACES 23General Classrooms 21
Five-Year Enrollment Planning Information through 2023-24
Horace Mann is projected to have stable enrollment over the next five years with enrollment of 380-400 students.
Horace Mann is in its final year in its current building and will move to the Carr building in 2019-20 which has been renamed Horace Mann, and will be a permanent home. Carr was renovated in 2013 and is a fully accessible building with a cafeteria and dedicated music, art, media center/library and gymnasium.
The 2018 student assignment changes shifted the Horace Mann district slightly east and north, though the vast majority of the district remained unchanged. Horace Mann continues to have buffer zones with Franklin, Lincoln-Eliot and Cabot.Horace Mann has a small cohort of students with autism or related needs who are served in a substantially separate program.
Five-Year Enrollment Planning Information through 2023-24
Lincoln-Eliot is projected to have decreased enrollment for the next five years with enrollment from 330 to 360 students in 18 classrooms.
Lincoln-Eliot is Newton's current school building priority for a full school addition/renovation at 150 Jackson Road. The school renovation project is in active feasibility study.
The long-range plan is for an active construction period from 2021-2023 and to relocate Lincoln-Eliot to the renovated school at 150 Jackson Road in September 2023.
- 24
HORACE MANN ELEMENTARY SCHOOL # OF CLASSROOMS
Core Instructional SpaceFullSize CR
SmallSize CR
Modular
CR Total
CORE ACADEMIC SPACES 20General Classrooms 14 4Reading Program/LiteracyLearning Center, ELL, Small Group Instruction 1 1
STUDENT SERVICES 1Districtwide Special EducationSmall Group Instruction, OT/PT, S&L, Inclusion 1
ART, MUSIC 0Art ClassroomMusic Classroom stage
TOTAL INSTRUCTIONAL SPACES 21
CURRENT UTILIZATION2018-19 Enrollment 3992018-19 Core Classes 18# of Core Classrooms Available 15
Percentage Classroom Utilization 120%
- 25
LINCOLN-ELIOT ELEMENTARY SCHOOL # OF CLASSROOMS
Core Instructional SpaceFull SizeCR
Small SizeCR
Modular
CR Total
CORE ACADEMIC SPACES 21General Classrooms 18
MIDDLE SCHOOL CLASS AND TEAM SIZES
In middle school, overall average class size has decreased slightly from last year to 21.3 students (see Table 11). The middle school average team size has decreased from 90 students in 2017-18 to 88 students this year, with average team sizes at individual schools ranging from 79 to 97 students (see Table 12). For a seventh consecutive year, there are no teams of over 100 students, and this year, there has been a decrease in the number of large classes of 25 students or more at the middle schools (large classes comprise 7% of all classes this year compared to 10% last year; see Table 2).
The middle schools are continuing to maintain previous improvement in both average class size and the number of large classes after a peak in 2011-12. Table 11 shows that the overall average middle school class size has decreased slightly compared to last year at 21.3 students and that this decrease occurred in all five major subjects except for math, which maintained a similar average class size to last year. Three prior years of average class sizes are also provided in Table 11.
The individual school charts in Table 11 show that three of the four middle schools have overall average class sizes that have decreased from last year; the average class size at Oak Hill increased from last year. The percentage of large classes of 25 or more students ranges from 0% (at Bigelow) to 11% (at Oak Hill). All four middle schools have the majority of their classes in the preferred range of 20-24 students.
TABLE 11DISTRIBUTION OF CLASS SIZES
2018-19ALL MIDDLE SCHOOLS
Class Size
SUBJECT TOTAL
English ScienceSocialStudies Math
WorldLanguage N %
30 or more25-2920-2415-1910-1410 or fewer
492322
510420
1094241
128729
147020101
045
447125131
0%7%
71%20%2%0%
Total 130 129 129 128 115 631 100%Avg. Class Size2018-19 20.7 21.8 21.4 21.4 21 21.32017-182016-172015-16
21.120.920.2
22.421.721.2
2221.420.9
21.321.120.6
21.620.921.8
21.721.220.9

TABLE 11, cont.DISTRIBUTION OF CLASS
SIZES 2018-19BIGELOW MIDDLE SCHOOL
- 26
Class Size
SUBJECT TOTAL
English ScienceSocialStudies Math
WorldLanguage N %
30 or more25-2920-2415-1910-1410 or fewer
1671
186
1491
195
995
00763670
0%0%
64%30%6%0%
Total 24 24 24 24 23 119 100%Avg. Class Size2018-19 19.7 20.9 19.6 20.5 17.9 19.72017-182016-172015-16
20.320.519.5
21.821
20.2
20.620.319.9
2120.920
19.819.420
20.720.419.9
TABLE 11, cont.DISTRIBUTION OF CLASS SIZES
2018-19BROWN MIDDLE SCHOOL
Class Size
SUBJECT TOTAL
English ScienceSocialStudies Math
WorldLanguage N %
30 or more25-2920-2415-1910-1410 or fewer
2510
1276
3274
2239
5194
011
1213300
0%7%
73%20%0%0%
Total 35 34 34 34 28 165 100%Avg. Class Size2018-19 20.4 21.6 21.5 21.3 22.7 21.42017-182016-172015-16
21.521.221.4
22.421.521.9
22.121.421.8
22.121.221.6
23.923.424.4
22.321.722.1

TABLE 11, cont.DISTRIBUTION OF CLASS
SIZES 2018-19DAY MIDDLE SCHOOL
- 27
Class Size
SUBJECT TOTAL
English ScienceSocialStudies Math
WorldLanguage N %
30 or more25-2920-2415-1910-1410 or fewer
132111
386
3338
62711
920431
019
1504041
0%9%
70%19%2%0%
Total 45 44 44 44 37 214 100%Avg. Class Size2018-19 20.7 21.8 21.8 21.2 21.4 21.42017-182016-172015-16
21.320.920
22.221.920.7
22.221.920.7
21.421.220.3
21.320.321.8
21.721.220.6
TABLE 11, cont.DISTRIBUTION OF CLASS SIZES
2018-19OAK HILL MIDDLE SCHOOL
Class Size
SUBJECT TOTAL
English ScienceSocialStudies Math
WorldLanguage N %
30 or more25-2920-2415-1910-1410 or fewer
3194
4212
4203
4184
2232
015
1001620
0%11%75%12%2%0%
Total 26 27 27 26 27 133 100%Avg. Class Size2018-19 21.9 23 22.5 22.8 21.2 22.32017-182016-172015-16
21.120.719.5
23.522.121.9
22.721.421.2
20.421.120.3
21.120.620.4
21.721.220.7

- 28
Table 12 focuses on middle school team sizes and includes additional statistics, including student-to-teacher ratios, to plan for future years. Table 12 provides detailed statistics on the average team and class sizes at each middle school at each grade level and provides five years of anticipated theoretical future team and class sizes based on November 2018 enrollment projections.

TABLE 12MIDDLE SCHOOL AVERAGE TEAM SIZES AND TEACHER
School Grade Number of Students
Number ofTeams
Number ofCore
Teachers
Students to Teachers
Student: Teacher
Ratio Team SizeBigelow 6 170 2.00 8.00 21.3 21:1 85Bigelow 7 157 2.00 8.00 19.6 20:1 79Bigelow 8 174 2.00 8.00 21.8 22:1 87Total Bigelow 501 6.00 24.00 20.9 21:1 84Change from Prior -8 0.00 0.00
Brown 6 274 3.00 12.00 22.8 23:1 91Brown 7 231 2.75 11.00 21.0 21:1 84Brown 8 239 2.75 11.00 21.7 22:1 87Total Brown 744 8.50 34.00 21.9 22:1 88Change from Prior -36 0.25 1.00
Day 6 323 3.50 14.00 23.1 23:1 92Day 7 351 4.00 16.00 21.9 22:1 88Day 8 302 3.50 14.00 21.6 22:1 86Total Day 976 11.00 44.00 22.2 22:1 89Change from Prior 49 0.00 0.00
Oak Hill 6 206 2.25 9.00 22.9 23:1 92Oak Hill 7 193 2.00 8.00 24.1 24:1 97Oak Hill 8 231 2.63 10.50 22.0 22:1 88Total Oak Hill 630 6.88 27.50 22.9 23:1 92Change from Prior 28 0.13 0.50
Total Middle School 2,851 32.38 129.50 22.0 22:1 8833 0.38 1.50
- 29
OCTOBER 1 2018

This is a theoretical representation of class sizes and is not a staffing
TABLE 12MIDDLE SCHOOL AVERAGE TEAM SIZES AND TEACHER
School Grade Number of Students
Number ofTeams
Number ofCore
Teachers
Students to Teachers
Student: Teacher
Ratio Team SizeBigelow 6 182 2.00 8.00 22.8 23:1 91Bigelow 7 171 2.00 8.00 21.4 21:1 86Bigelow 8 159 2.00 8.00 19.9 20:1 80Total Bigelow 512 6.00 24.00 21.3 21:1 85Change from Prior 11 0.00 0.00
Brown 6 272 3.00 12.00 22.7 23:1 91Brown 7 270 3.00 12.00 22.5 23:1 90Brown 8 229 2.50 10.00 22.9 23:1 92Total Brown 771 8.50 34.00 22.7 23:1 91Change from Prior 27 0.00 0.00
Day 6 321 3.50 14.00 22.9 23:1 92Day 7 322 3.50 14.00 23.0 23:1 92Day 8 351 4.00 16.00 21.9 22:1 88Total Day 994 11.00 44.00 22.6 23:1 90Change from Prior 18 0.00 0.00
Oak Hill 6 237 2.50 10.00 23.7 24:1 95Oak Hill 7 206 2.25 9.00 22.9 23:1 92Oak Hill 8 193 2.25 9.00 21.4 21:1 86Total Oak Hill 636 7.00 28.00 22.7 23:1 91Change from Prior 6 0.125 0.50
Total Middle School 2,913 32.50 130.00 22.4 22:1 90Change since prior year 62 0.13 0.50
- 30
OCTOBER 1 2019

TABLE 12MIDDLE SCHOOL AVERAGE TEAM SIZES AND TEACHER
This is a theoretical representation of class sizes and is not a staffing
School Grade Number of Students
Number ofTeams
Number ofCore
Teachers
Students to Teachers
Student: Teacher
Ratio Team SizeBigelow 6 202 2.00 8.00 25.3 25:1 101Bigelow 7 183 2.00 8.00 22.9 23:1 92Bigelow 8 173 2.00 8.00 21.6 22:1 87Total Bigelow 558 6.00 24.00 23.3 23:1 93Change from Prior 46 0.00 0.00
Brown 6 285 3.00 12.00 23.8 24:1 95Brown 7 268 3.00 12.00 22.3 22:1 89Brown 8 268 3.00 12.00 22.3 22:1 89Total Brown 821 9.00 36.00 22.8 23:1 91Change from Prior 50 0.50 2.00
Day 6 340 3.50 14.00 24.3 24:1 97Day 7 319 3.50 14.00 22.8 23:1 91Day 8 321 3.50 14.00 22.9 23:1 92Total Day 980 10.50 42.00 23.3 23:1 93Change from Prior -14 -0.50 -2.00
Oak Hill 6 227 2.50 10.00 22.7 23:1 91Oak Hill 7 236 2.50 10.00 23.6 24:1 94Oak Hill 8 206 2.25 9.00 22.9 23:1 92Total Oak Hill 669 7.25 29.00 23.1 23:1 92Change from Prior 33 0.25 1.00
Total Middle School 3,028 32.75 131.00 23.1 23:1 92115 0.25 1.00
- 31
OCTOBER 1 2020

TABLE 12MIDDLE SCHOOL AVERAGE TEAM SIZES AND TEACHER
This is a theoretical representation of class sizes and is not a staffing
School Grade Number of Students
Number ofTeams
Number ofCore
Teachers
Students to Teachers
Student: Teacher
Ratio Team SizeBigelow 6 160 2.00 8.00 20.0 20:1 80Bigelow 7 203 2.00 8.00 25.4 25:1 102Bigelow 8 185 2.00 8.00 23.1 23:1 93Total Bigelow 548 6.00 24.00 22.8 23:1 91Change from Prior -10 0.00 0.00
Brown 6 286 3.00 12.00 23.8 24:1 95Brown 7 281 3.00 12.00 23.4 23:1 94Brown 8 266 3.00 12.00 22.2 22:1 89Total Brown 833 9.00 36.00 23.1 23:1 93Change from Prior 12 0.00 0.00
Day 6 301 3.25 13.00 23.2 23:1 93Day 7 338 3.50 14.00 24.1 24:1 97Day 8 319 3.50 14.00 22.8 23:1 91Total Day 958 10.25 41.00 23.4 23:1 93Change from Prior -22 -0.25 -1.00
Oak Hill 6 225 2.50 10.00 22.5 23:1 90Oak Hill 7 227 2.50 10.00 22.7 23:1 91Oak Hill 8 237 2.50 10.00 23.7 24:1 95Total Oak Hill 689 7.50 30.00 23.0 23:1 92Change from Prior 20 0.25 1.00
Total Middle School 3,028 32.75 131.00 23.1 23:1 92- 0.00 0.00
- 32
OCTOBER 1 2021

TABLE 12MIDDLE SCHOOL AVERAGE TEAM SIZES AND TEACHER
This is a theoretical representation of class sizes and is not a staffing
School Grade Number of Students
Number ofTeams
Number ofCore
Teachers
Students to Teachers
Student: Teacher
Ratio Team SizeBigelow 6 176 2.00 8.00 22.0 22:1 88Bigelow 7 161 2.00 8.00 20.1 20:1 81Bigelow 8 205 2.00 8.00 25.6 26:1 103Total Bigelow 542 6.00 24.00 22.6 23:1 90Change from Prior -6 0.00 0.00
Brown 6 267 3.00 12.00 22.3 22:1 89Brown 7 281 3.00 12.00 23.4 23:1 94Brown 8 279 3.00 12.00 23.3 23:1 93Total Brown 827 9.00 36.00 23.0 23:1 92Change from Prior -6 0.00 0.00
Day 6 305 3.25 13.00 23.5 23:1 94Day 7 299 3.25 13.00 23.0 23:1 92Day 8 338 3.50 14.00 24.1 24:1 97Total Day 942 10.00 40.00 23.6 24:1 94Change from Prior -16 -0.25 -1.00
Oak Hill 6 250 2.50 10.00 25.0 25:1 100Oak Hill 7 225 2.50 10.00 22.5 23:1 90Oak Hill 8 227 2.50 10.00 22.7 23:1 91Total Oak Hill 702 7.50 30.00 23.4 23:1 94Change from Prior 13 0.00 0.00
Total Middle School 3,013 32.50 130.00 23.2 23:1 93(15) -0.25 -1.00
- 33
OCTOBER 1 2022

TABLE 12MIDDLE SCHOOL AVERAGE TEAM SIZES AND TEACHER
This is a theoretical representation of class sizes and is not a staffing
School Grade Number of Students
Number ofTeams
Number ofCore
Teachers
Students to Teachers
Student: Teacher
Ratio Team SizeBigelow 6 156 2.00 8.00 19.5 20:1 78Bigelow 7 176 2.00 8.00 22.0 22:1 88Bigelow 8 163 2.00 8.00 20.4 20:1 82Total Bigelow 495 6.00 24.00 20.6 21:1 83Change from Prior -47 0.00 0.00
Brown 6 246 2.75 11.00 22.4 22:1 89Brown 7 263 3.00 12.00 21.9 22:1 88Brown 8 280 3.00 12.00 23.3 23:1 93Total Brown 789 8.75 35.00 22.5 23:1 90Change from Prior -38 -0.25 -1.00
Day 6 291 3.25 13.00 22.4 22:1 90Day 7 304 3.25 13.00 23.4 23:1 94Day 8 299 3.25 13.00 23.0 23:1 92Total Day 894 9.75 39.00 22.9 23:1 92Change from Prior -48 -0.25 -1.00
Oak Hill 6 233 2.50 10.00 23.3 23:1 93Oak Hill 7 250 2.50 10.00 25.0 25:1 100Oak Hill 8 225 2.50 10.00 22.5 23:1 90Total Oak Hill 708 7.50 30.00 23.6 24:1 94Change from Prior 6 0.00 0.00
Total Middle School 2,886 32.00 128.00 22.5 23:1 90(127) -0.50 -2.00
- 34
OCTOBER 1 2023

- 35
Table 13 documents the 2018-19 use of instructional spaces in middle schools, including the current number and usage of full-size, small size and modular classrooms. The information is presented in a similar format as for elementary schools. Additional information on other core spaces in middle schools, including cafeterias, library/media centers, auditoriums and gymnasiums, is also included. The size of these spaces is considered through the lens of the school’s largest grade cohort. For these spaces, a calculation of the available square foot per student allows a comparison among the four schools. The middle schools face different space constraints in these areas.
For each middle school, information relevant to district enrollment planning through 2023-24 is noted alongside the information on space utilization and capacity. Peak enrollment years and significant enrollment changes over five years are described. The anticipated middle school enrollment increase has a short-term duration of one to three years for all middle schools except Oak Hill. Oak Hill’s enrollment growth is due to growth at the new Zervas Elementary School.
Space used for special education programs, including district wide programs, is also documented in Table 13. Middle schools offer special programming to meet the academic needs of all students. Day Middle School, when renovated in 2013, was designed to accommodate key district wide programs for the middle school student population; Brown has also been able to accommodate a number of programs as Newton’s next largest middle school facility. Bigelow and Oak Hill each offer one district wide program.
A summary of these programs is also included below. This chart illustrates the average typical program enrollment and program capacity. Planning for the incoming grade 6 cohorts is in process in the district and will continue throughout the remainder of the year; numbers can be expected to fluctuate. Both Brown and Day have district wide programs that are enrolled at levels close to program capacity (Focus, Bridge, Reflections). Planning for all programs will be a focus as placement needs are confirmed in the next few months.
Middle School Programs Program Description Program Space GradesServed
AverageEnrollment Capacity
Bigelow BOOST© Other Special Program Inclusion / Classroom-based Grade 7-8 11 15Brown Stride Autism and Related Needs Substantially separate program Grade 6-8 8 12Brown FOCUS© Other Special Program Inclusion / Classroom-based Grade 6-8 22 25Brown SPARK© Other Special Program Substantially separate classroom Grade 6-8 14 18Day LLD© Language Based Program Inclusion / Classroom-based Grade 6-8 30 36Day BRIDGE© Other Special Program Substantially separate classroom Grade 6-8 18 20Day REFLECTIONS © Other Special Program Substantially separate classroom Grade 6-8 10 12Oak Hill LLD© Language Based Program Inclusion / Classroom-based Grade 6-8 26 36Note: Bigelow BOOST© program is in its final year.

TABLE 13
2018-19 UTILIZATION OF CORE INSTRUCTIONAL SPACE - MIDDLE
- 36
2018-19 Utilization of Core Instructional Space
BIGELOW BROWN
Classroom Space
SmallSize
Space
Modular CR Total
Classroom Space
SmallSize
Space
Modular CR Total
GENERAL ACADEMIC SPACESCore, World Language, Electives and Small Group Instructional Rooms 33 33 40 1 2 43
STUDENT SERVICESDistrictwide Special Education 1 2 3 2 3 5Academic Support/Learning Center/Inclusion 2 3 5 2 5 7
ART & MUSICArt Classroom 1 1 1 1Music Classroom 1 1 1 1
TOTAL INSTRUCTIONAL CLASSROOMS 38 5 43 46 9 2 57
OTHER SFLargestCohort SF/Student SF
LargestCohort SF/Student
Cafeteria 2,750 174 16 3,000 274 11Library/Media Center 3,300 174 19 2,870 274 10Auditorium 3,400 174 20 4,340 274 16Gymnasium 3,200 174 18 10,160 274 37
Enrollment Planning Information Through 2023-24
Bigelow• Bigelow experiences its five year peak enrollment in October 2020 (558 students, +57 above the current year) and is projected to maintain 6 teams with an average team size of 93 students.• In October 2020, grade 6 is projected to be the largest cohort at 202 students and to result in an above average team size of over 100 students.• In October 2023, Bigelow enrollment is projected to have decreased 63 students from this peak.
Brown• Brown experiences its five year peak enrollment in October 2021 (833 students, +89 above the current year) and is projected to maintain 9 teams with an average team size of 93 students.• In October 2021, grade 6 is projected to be the largest cohort at 286 students with an average team size of 95 students.• In October 2023, Brown enrollment is projected to have decreased 44 students from this peak.

TABLE 13
2018-19 UTILIZATION OF CORE INSTRUCTIONAL SPACE - MIDDLE
- 37
2018-19 Utilization of Core Instructional Space
DAY OAK HILL
Classroom Space
SmallSize
Space
Modular CR Total
Classroom Space
Small Size
Space
Modular CR Total
GENERAL ACADEMIC SPACESCore, World Language, Electives and Small Group Instructional Rooms 58 2 60 32 3 4 39
STUDENT SERVICESDistrictwide Special Education 2 2Academic Support/Learning Center/Inclusion 1 5 6 1 4 5
ART & MUSICArt Classroom 2 2 1 1Music Classroom 2 2 1 1
TOTAL INSTRUCTIONAL CLASSROOMS 65 7 72 35 7 4 46
OTHER SFLargestCohort SF/Student SF
LargestCohort SF/Student
Cafeteria 5,000 351 14 5,000 231 22Library/Media Center 5,576 351 16 6,000 231 26Auditorium 5,266 351 15 6,000 231 26Gymnasium 11,088 351 32 5,568 231 24
Enrollment Planning Information Through 2023-24
Day• Day experiences its five year peak enrollment next year in October 2019 (994 students, +18 above the current year) and is projected to remain at 11 teams with an average team size of 90 students.• In October 2019, grade 8 is projected to be the largest cohort at 351 students with an average team size of 88 students.• In October 2023, Day enrollment is projected to have decreased by 100 students from this peak.
Oak Hill • Oak Hill experiences its five year peak enrollment in October 2023 (708 students, +76 above the current year) and is projected to increase from 7 to 7.5 teams with an average team size of 94 students.• In October 2023, grade 7 is projected to be the largest cohort at 250 students and to result in an above average team size of 100 students.• Capacity at Oak Hill potentially may become tighter in the next five years and the planning is needed to manage enrollment growth.• The growth at Oak Hill is attributable to the growth at Zervas Elementary School, and is a result of the larger Zervas school district. The middle school impact of student assignment changes takes six years, at minimum, to phase-in, and the enrollment projections are estimates.

- 38
HIGH SCHOOL CLASS SIZES
At the high school level, the average class size for the five major subjects (English, World Languages, Science, History & Social Science, and Mathematics) has decreased from 22.3 students last year to 22.0 students in 2018-19 (see Table 1), with the number of high school classes with 25 or more students decreasing slightly from 30% to 29% (see Table 2).
This year, the overall average class size at Newton North has decreased to 21.9 students (compared to 22.2 students last year), while the overall average class size at Newton South has decreased slightly to 22.1 students (compared to 22.3 students last year). The difference in average class size between the two high schools is 0.2 students, compared to 0.1 students last year. Typically, North tends to have a lower average class size than South due to higher enrollment numbers in the College Prep (CP) level of classes, which require smaller class sizes. This year, like last year, the two schools have nearly identical average class sizes. Table 14 displays average class sizes for the five major academic departments for each school, as well as historical comparisons, and provides a distribution of class sizes for the five major academic departments.

- 39
TABLE 14November 1, 2018
Newton North High School
Class Size
Department
EnglishWorld
Languages ScienceHistory &
Social Science Mathematics TotalN % N % N % N % N % N %
Below 11 2 2% 1 1% 0 0% 1 1% 3 3% 7 2%11-19 26 27% 35 44% 13 14% 13 15% 14 15% 101 23%20-24 69 71% 33 41% 39 43% 28 33% 35 37% 204 46%25-30 0 0% 11 14% 39 43% 42 50% 43 45% 135 30%
Above 30 0 0% 0 0% 0 0% 0 0% 0 0% 0 0%Total* 97 100% 80 100% 91 100% 84 100% 95 100% 447 100%
Avg. Class Size20.3 19.6 22.9 23.3 23.2 21.92018-19
2017-18 20.5 20.0 23.1 23.3 24.0 22.22016-17 19.9 19.8 22.0 22.7 23.3 21.62015-16 20.0 19.8 22.4 23.0 23.0 21.7
Newton South High School
Class Size
Department
EnglishWorld
Languages ScienceHistory &
Social Science Mathematics TotalN % N % N % N % N % N %
Below 11 0 0% 2 3% 1 1% 2 2% 1 1% 6 1%11-19 17 20% 15 22% 19 21% 6 7% 12 14% 69 17%20-24 65 77% 31 45% 40 44% 47 58% 38 45% 221 54%25-30 2 2% 21 30% 30 33% 26 32% 33 39% 112 27%
Above 30 0 0% 0 0% 0 0% 0 0% 0 0% 0 0%Total* 84 100% 69 100% 90 100% 81 100% 84 100% 408 100%
Avg. Class Size21.2 21.5 22.0 23.0 22.9 22.12018-19
2017-18 21.0 21.4
22.4
23.2 23.2
22.3
2016-17 21.3 21.7
22.4
23.5 23.5
22.5
2015-16 20.1 20.2
21.0
21.9 21.9
21.1
* The class size data above is calculated using the five major subject areas and does not include special education, ELL and other special program offerings.

- 40
During the annual budget process, high school class size data is used in a planning model designed to produce equitable class sizes at the two high schools. The differential in enrollment in CP level classes is evaluated annually. Factors that are finalized during the late spring and summer, after the completion of the budgeting cycle, ultimately result in the actual class size statistics at the high schools. These factors include: class enrollment decisions of students, staffing decisions including the distribution of faculty based on enrollment, shifts in actual enrollment versus projections, and the rate of enrollment by department.
This year, similar to the prior three years, the lowest average class sizes at North are in the World Languages Department, with an average class size of 19.6 students, followed by the English Department, with 20.3 students. At South, again similar to the prior three years, the lowest average class size is in English with 21.2 students, followed by World Languages with 21.5 students. At North, the highest average class size is in History and Social Science, with 23.3 students. At South, History and Social Science also has the highest average class size of the major academic disciplines at 23 students.
Table 15 has been redesigned this year to detail the average class sizes by curriculum level for each of the five major academic areas. It includes the overall average class size for each curriculum level for all five major academic areas combined, as well as overall average class sizes for each academic department and for the school. Table 16 provides a detailed view of class enrollment that totals the five academic areas by curriculum designation, including special education classes, for each high school for the current school year and for last year. Please note that Curriculum I and Curriculum II levels were renamed Advanced College Prep (ACP) and College Prep (CP) in 2014-15.
Table 17 displays a detailed distribution of sections of courses within the five major academic areas with 25 or more students. The number of large classes at the high schools overall has decreased slightly this year from 30% to 29%, a decrease of 14 large class sections from last year. North has 13 fewer large class sections this year, while Newton South has 1 section less of large classes with 25 or more students.
Tables 18 and 19 detail the individual course enrollments by department (Table 18 for North and Table 19 for South). These tables include a complete catalogue of high school course offerings. The tables provide the following information for each course:
1. Curriculum level for each course2. Total course enrollment3. Number of sections for each course4. Average class size for each course5. Distribution of class sizes for each course
Tables 20 and 21 display total enrollment by department and have been redesigned this year to include the enrollment rate for courses in each department, including certain courses that are not included in the calculation of average class size for each department (these are courses marked with a ~ in Table 18 or 19). Tables 20 and 21 include enrollment in ELL, special education, and special program courses offered in each department to provide an accurate enrollment rate in each department (these courses are not included in average class size calculations due to their small class sizes specific to the services that they provide). The enrollment rate for each

- 41
department measures the number of students enrolled in departmental courses compared to the total enrollment of the school, providing an indication of the frequency with which students enroll in courses in each department. For example, an enrollment rate of 1.00 in a department indicates that on average, every student in the school is enrolled in a course in that department (please note that this is described as an average, as the enrollment in each department is a total count of all enrollments, and may include students who are taking more than one course in that department).
Tables 22 and 23 are new this year and display projected future class sizes for the five major academic areas by curriculum level for each high school (Table 22 for North and Table 23 for South). The projected average class sizes in these tables use the projected enrollments for each school from November 2018. They also assume that enrollment patterns by department and curriculum level will remain the same in future years (meaning that the same percentage of students will enroll in courses by department and curriculum level in future years as 2018-19 percentages) and that the number of sections offered in future years will remain the same as 2018-19. The tables also include a column calculating the change in the number of sections required for each department and curriculum level to maintain the current average class size.These tables are intended for planning purposes only and do not represent staffing patterns for each school.

- 42
TABLE 15November 1, 2018
Newton North High School
Average Class SizeDepartment
Curriculum EnglishWorld
Languages Science
History & Social
Science Mathematics Total
H 21.7 18.1 26.1 26.0 26.0 23.9
ACP 21.3 21.4 22.9 24.2 23.1 22.5
CP 12.2 12.3 14.0 13.7 14.2 13.3
Unleveled N/A N/A N/A N/A N/A N/A
Total 20.3 19.6 22.9 23.3 23.2 21.9
Newton South High School
Average Class SizeDepartment
Curriculum EnglishWorld
Languages Science
History & Social
Science Mathematics Total
H 21.2 21.8 24.1 25.0 25.9 23.7
ACP 22.0 22.1 22.7 23.0 22.7 22.5
CP 13.0 13.5 12.7 11.3 14.6 13.2
Unleveled N/A N/A N/A N/A N/A N/A
Total 21.2 21.5 22.0 23.0 22.9 22.1
* The class size data above does not include special education, ELL and other special program offerings.

- 43
TABLE 16TOTAL FOR 5 ACADEMIC AREAS
November 1, 2018
Newton North High School
CurriculumAvg. Number of Classes
Total N Class Below 11 11 to 19 20 to 24 25 to 30 Above 30Enroll. Sections Size N % N % N % N % N %
H 3,209 134 23.9 0 0% 19 14% 49 37% 66 49% 0 0%ACP 5,861 260 22.5 1 0% 37 14% 153 59% 69 27% 0 0%CP 705 53 13.3 6 11% 45 85% 2 4% 0 0% 0 0%Unleveled Courses 0 0 N/A 0 N/A 0 N/A 0 N/A 0 N/A 0 N/ASpecial Ed., etc.* 890 140 6.4 112 80% 14 10% 12 9% 1 1% 1 1%Total 10,665 587 18.2 119 20% 115 20% 216 37% 136 23% 1 0%*Includes special education, special program, ELL, MCAS, classroom aides, work study, and independent study courses
Newton South High School
CurriculumAvg. Number of Classes
Total N Class Below 11 11 to 19 20 to 24 25 to 30 Above 30Enroll. Sections Size N % N % N % N % N %
H 2,895 122 23.7 1 1% 14 11% 46 38% 61 50% 0 0%ACP 5,691 253 22.5 0 0% 28 11% 174 69% 51 20% 0 0%CP 435 33 13.2 5 15% 27 82% 1 3% 0 0% 0 0%Unleveled Courses 0 0 N/A 0 N/A 0 N/A 0 N/A 0 N/A 0 N/ASpecial Ed., etc.* 616 142 4.3 118 83% 16 11% 6 4% 2 1% 0 0%Total 9,637 550 17.5 124 23% 85 15% 227 41% 114 21% 0 0%*Includes special education, special program, ELL, MCAS, classroom aides, work study, and independent study courses
November 1, 2017
Newton North High School
CurriculumAvg. Number of Classes
Total N Class Below 11 11 to 19 20 to 24 25 to 30 Above 30Enroll. Sections Size N % N % N % N % N %
H 3,370 140 24.1 0 0% 19 14% 51 36% 66 47% 4 3%ACP 5,901 256 23.1 0 0% 30 12% 150 59% 73 29% 3 1%CP 827 58 14.3 7 12% 51 88% 0 0% 0 0% 0 0%Unleveled Courses 67 3 22.3 0 0% 1 33% 1 33% 1 33% 0 0%Special Ed., etc.* 525 109 4.8 101 93% 6 6% 1 1% 0 0% 1 1%Total 10,690 566 18.9 108 19% 107 19% 203 36% 140 25% 8 1%*Includes special education, special program, ELL, MCAS, classroom aides, work study, and independent study courses
Newton South High School
CurriculumAvg. Number of Classes
Total N Class Below 11 11 to 19 20 to 24 25 to 30 Above 30Enroll. Sections Size N % N % N % N % N %
H 3,069 125 24.6 0 0% 11 9% 45 36% 64 51% 5 4%ACP 5,515 245 22.5 1 0% 27 11% 173 71% 44 18% 0 0%CP 435 32 13.6 4 13% 28 88% 0 0% 0 0% 0 0%Unleveled Courses 163 10 16.3 1 10% 7 70% 2 20% 0 0% 0 0%Special Ed., etc.* 414 148 2.8 135 91% 13 9% 0 0% 0 0% 0 0%Total 9,596 560 17.1 141 25% 86 15% 220 39% 108 19% 5 1%*Includes special education, special program, ELL, MCAS, classroom aides, work study, and independent study courses

TABLE 17HIGH SCHOOL CLASSES WITH 25 OR MORE STUDENTS
November 1, 2018
Newton North High School
Size of Class
English World Languages Science History &Social Science Mathematics Total
17-18 18-19 17-18 18-19 17-18 18-19 17-18 18-19 17-18 18-19 17-18 18-1925 2 5 7 11 8 8 14 7 10 33 3926 4 1 18 16 13 12 7 12 42 4127 2 6 5 4 4 10 8 20 1928 2 5 8 5 2 9 6 21 1629 1 2 3 3 13 5 16 1130 1 2 7 6 2 9 931 4 2 6 032 0 0
Above 32 1 1 0Total 2 0 13 11 40 39 39 42 54 43 148 135
Newton South High School
Size of Class
English World Languages ScienceHistory &
Social Science Mathematics Total17-18 18-19 17-18 18-19 17-18 18-19 17-18 18-19 17-18 18-19 17-18 18-19
25 7 2 4 10 11 11 7 14 10 8 39 4526 2 4 9 8 9 6 5 9 25 2727 2 3 8 8 3 10 6 21 1928 1 2 6 3 2 5 4 12 1129 2 1 2 1 4 3 8 530 2 1 2 3 3 531 3 332 2 2
Above 32 0Total 7 2 9 21 29 30 27 26 41 33 113 112
- 44

TABLE 18North High School Course
Enrollment 2018-19(Enrollment as of November 1,
- 45
Course Cur. Total Enroll.
NSec- tions
Avg. Class Size
Number of ClassesBelow 11 11-19 20-24 25-30 Above 30N % N % N % N % N %
ENGLISH DEPARTMENT
English 10 H 110 H 135 6 22.5 1 17% 5 83%English 11 H 120 H 103 5 20.6 1 20% 4 80%AP English 11 129 H 66 3 22.0 3 100%American Studies (English) H 121 H 23 1 23.0 1 100%AP English 12 130 H 24 1 24.0 1 100%English 9 ACP 100 ACP 451 20 22.6 2 10% 18 90%English 10 ACP 111 ACP 274 13 21.1 3 23% 10 77%English 11 ACP 122 ACP 208 10 20.8 3 30% 7 70%American Studies (English) ACP 123 ACP 42 2 21.0 2 100%English 9 CP 101 CP 46 4 11.5 1 25% 3 75%English 9 CP 101* CP 12 1 12.0 1 100%English 10 CP 112 CP 33 3 11.0 1 33% 2 67%English 10 CP 112* CP 17 1 17.0 1 100%English 11 CP 124 CP 13 1 13.0 1 100%English 11 CP 124* CP 14 1 14.0 1 100%American Studies (English) CP 125 CP 11 1 11.0 1 100%Philosophy as Literature H 131, ACP 1314 H, ACP 40 2 20.0 1 50% 1 50%The Short Story 134 H, 135 ACP H, ACP 86 4 21.5 1 25% 3 75%Asian American Literature H 138, ACP 139 H, ACP 44 2 22.0 2 100%Diverse Perspectives in Lit, H 132, ACP 133 H, ACP 44 2 22.0 2 100%The Art and Technique of Film ACP 137, H 136 ACP, H 118 5 23.6 5 100%Literature and Composition for College ACP 142, CP 143 ACP, CP 36 2 18.0 2 100%Hiphop: Its Lit, Culture, and Music ACP 144, CP 145 ACP, CP 66 4 16.5 4 100%Horror & SciFi Literature ACP 150, CP 151 ACP, CP 41 2 20.5 2 100%Contemporary Voices ACP 148, 149 CP ACP, CP 20 1 20.0 1 100%
~Speech 171 # 12 1 12.0 1 100%~Newspaper Editing & Management 167 # 39 1 39.0 1 100%~Journalism 1 165 # 16 1 16.0 1 100%~Learning Center English 9 102^ CP 9 1 9.0 1 100%~Learning Center English 10 114^ CP 8 1 8.0 1 100%~English Review 198^ CP 8 1 8.0 1 100%~Learning Center English 11 126^ CP 6 1 6.0 1 100%~Learning Center English 12 128^ CP 5 1 5.0 1 100%~Power English 10 113 (MCAS)° CP 50 8 6.3 8 100%~ELL Entering/Beginning English CP 181 ACP 9 1 9.0 1 100%~ELL Developing English ACP 182 ACP 11 1 11.0 1 100%~ELL Expanding English ACP 183 ACP 14 1 14.0 1 100%~ELL Bridging English ACP 184 ACP 14 1 14.0 1 100%~ELL English Literacy- Reading CP 179 CP 8 1 8.0 1 100%~ELL English Literacy- Writing CP 180 CP 12 1 12.0 1 100%~ELL Power English 1 185 CP 5 1 5.0 1 100%~ELL Power English 2 186 ACP 10 1 10.0 1 100%~ELL Components of Reading 1941 # 1 1 1.0 1 100%~Pilot English 1 CP 116^ CP 2 1 2.0 1 100%~Pilot English 2 CP 117^ CP 8 1 8.0 1 100%~Pilot English 3 CP 118^ CP 8 1 8.0 1 100%~Pilot English 4 CP 119^ CP 5 1 5.0 1 100%~Pilot MCAS English 079^ # 2 1 2.0 1 100%~Community Living English 305^ # 11 1 11.0 1 100%~Community Living English 3052^ # 7 1 7.0 1 100%~English Classroom Aide 196 # 1 0.0 1 100%~Independent Study - Diverse Perspectives in Lit 199 # 1 0.0 1 100%TOTAL ENGLISH 2,247 131 17.2 28 21% 33 25% 69 53% 0 0% 1 1%TOTAL ENGLISH MINUS SPECIAL EDUCATION, SPECIAL PROGRAM, ELL, MCAS, CLASSROOM AIDES & INDEPENDENT STUDY COURSES 1,967 97 20.3 2 2% 26 27% 69 71% 0 0% 0 0%#Course not counted in weighted or unweighted grade point average~Course not counted in average class size* Includes sections co-taught with special education teacher^ Taught by a special education teacher° Taught by a regular education teacher

TABLE 18North High School Course
Enrollment 2018-19(Enrollment as of November 1,
- 46
Course Cur. Total Enroll.
NSec- tions
Avg. ClassSize
Number of ClassesBelow 11 11-19 20-24 25-30 Above 30N % N % N % N % N %
WORLD LANGUAGE DEPARTMENT
French 3 H 203 H 37 2 18.5 2 100%French 4 H 204 H 22 1 22.0 1 100%AP French 205 H 16 1 16.0 1 100%French 1 ACP 211, French 2 CP 222, French 1 CP 221 ACP, CP 18 1 18.0 1 100%French 2 ACP 212 ACP 99 4 24.8 1 25% 3 75%French 3 ACP 213 ACP 39 2 19.5 2 100%French 4 ACP 214, French 5 ACP 215 ACP 63 3 21.0 1 33% 2 67%French 3 CP 223, French 4 CP 224 CP 6 1 6.0 1 100%Novice Spanish 1 ACP 241 ACP 58 3 19.3 2 67% 1 33%Novice Spanish 2 ACP 232 ACP 20 1 20.0 1 100%Novice Spanish 2 ACP 232, Novice Spanish 3 ACP 2331 ACP 21 1 21.0 1 100%Intermediate Spanish 2 ACP 242 ACP 236 10 23.6 7 70% 3 30%Spanish 3 ACP 243 ACP 133 6 22.2 6 100%Spanish 4 ACP 244 ACP 107 5 21.4 1 20% 3 60% 1 20%Spanish 5 ACP 245 ACP 43 2 21.5 1 50% 1 50%Spanish 3 H 246 H 52 2 26.0 2 100%Spanish 4 H 247 H 29 2 14.5 2 100%AP Spanish 5 248 H 33 2 16.5 2 100%Spanish 1 CP 251, Spanish 2 CP 2 2522 CP 13 1 13.0 1 100%Spanish 2 CP 252, Spanish 3 CP 2 2532 CP 22 2 11.0 2 100%Spanish 3 CP 253 CP 12 1 12.0 1 100%Spanish 3 CP 253, Spanish 4 CP 2 2542 CP 11 1 11.0 1 100%Spanish 4 CP 254, Spanish 5 CP 255 CP 21 1 21.0 1 100%Italian 3 H 263 H 33 2 16.5 2 100%Italian 4 H 264 H 20 1 20.0 1 100%AP Italian 5 265 H 11 1 11.0 1 100%Italian 1 ACP 271, Italian 1 CP 276 ACP, CP 16 1 16.0 1 100%Italian 2 ACP 272 ACP 58 3 19.3 2 67% 1 33%Italian 3 ACP 273 ACP 27 1 27.0 1 100%Italian 4 ACP 274 ACP 29 1 29.0 1 100%Italian 5 ACP 275 ACP 17 1 17.0 1 100%Italian 2 CP 277, Italian 3 CP 278, Italian 4 CP 279 CP 13 1 13.0 1 100%Latin 1 ACP 281 ACP 14 1 14.0 1 100%Latin 3 ACP 283, Latin 2 ACP 272, ACP 13 1 13.0 1 100%Latin 4 H 284, Latin 4 ACP 288, Adv Latin Lit 2842 H, ACP 16 1 16.0 1 100%Chinese 2 ACP 292 ACP 43 2 21.5 2 100%Chinese 3 ACP 297 ACP 17 1 17.0 1 100%Chinese 4 ACP 298, Chinese 5 ACP 299 ACP 19 1 19.0 1 100%Chinese 3 H 293 H 22 1 22.0 1 100%Chinese 4 H 294 H 37 2 18.5 1 50% 1 50%Chinese 5 H 295 H 36 2 18.0 2 100%AP Chinese 296 H 17 1 17.0 1 100%
~Independent Study Latin 2861 H 5 1 5.0 1 100%~World Languages Classroom Aide 285 # 4 4 1.0 4 100%~Independent Study Spanish 2481, Chinese 249 # 2 2 1.0 2 100%TOTAL WORLD LANGUAGE 1,580 87 18.2 8 9% 35 40% 33 38% 11 13% 0 0%WORLD LANGUAGE MINUSWORLD LANGUAGE CLASSROOM AIDES & INDEPENDENT STUDY COURSES 1,569 80 19.6 1 1% 35 44% 33 41% 11 14% 0 0%#Course not counted in weighted or unweighted grade point average~Course not counted in average class size

- 47
TABLE 18North High School Course Enrollment
2018-19(Enrollment as of November 1, 2018)
Course Cur.
N Avg. Number of ClassesTotal Sec- Class Below 11 11-19 20-24 25-30 Above 30
Enroll. tions Size N % N % N % N % N %SCIENCE DEPARTMENT
Chemistry H 602 H 192 8 24.0 4 50% 4 50%Physics H 603 H 22 1 22.0 1 100%Biology H 6011 H 320 12 26.7 12 100%AP Biology 605 H 79 3 26.3 3 100%AP Chemistry 606 H 84 3 28.0 3 100%AP Physics 607 H 85 3 28.3 3 100%Biology ACP 611 ACP 106 5 21.2 5 100%Chemistry ACP 612 ACP 231 10 23.1 6 60% 4 40%Physics ACP 613 ACP 24 1 24.0 1 100%Introductory Physics ACP 614 ACP 472 21 22.5 1 5% 19 90% 1 5%Biology CP 621 CP 32 2 16.0 2 100%Biology CP 621* CP 17 1 17.0 1 100%Biology CP 621, Basic Biology 661 CP 12 1 12.0 1 100%Chemistry CP 622 CP 27 2 13.5 2 100%Chemistry CP 622* CP 15 1 15.0 1 100%Intro Physics Lab CP 670 CP 24 2 12.0 2 100%Introductory Physics CP 670, Basic Intro Physics CP 671* CP 27 2 13.5 2 100%Anatomy & Physiology ACP 630 ACP 103 4 25.8 4 100%Astronomy ACP 632 ACP 12 1 12.0 1 100%Sustainability Enviromental Science 634 ACP 29 1 29.0 1 100%Marine Biology 635 ACP 69 3 23.0 2 67% 1 33%Forensics ACP 637 ACP 72 3 24.0 1 33% 2 67%Organic Chemistry ACP 638 ACP 26 1 26.0 1 100%
~ELL Power Physics 645 # 15 2 7.5 2 100%~ELL Science for Beginning English Learners 652 CP 10 1 10.0 1 100%~ELL Physics Lab ACP 644, ELL Basic Intro Physics Lab CP 646 ACP, CP 15 1 15.0 1 100%~Pilot Physics CP 067° CP 2 1 2.0 1 100%~Pilot Biology CP 068° CP 9 1 9.0 1 100%~Community Living Physics 679^ # 5 1 5.0 1 100%~Biology Concepts and Skills 6621 # 5 5 5 100%~Science Classroom Aide 668 # 37 37 1.0 37 100%~Independent Study in Science 6691 # 2 2 1.0 2 100%TOTAL SCIENCE 2,180 142 15.4 50 35% 14 10% 39 27% 39 27% 0 0%TOTAL SCIENCE MINUS SPECIAL EDUCATION,
2,080 91 22.9SPECIAL PROGRAM ELL, MCAS, CLASSROOMAIDES & INDEPENDENT STUDY COURSES 0 0% 13 14% 39 43% 39 43% 0 0%#Course not counted in weighted or unweighted grade point average~Course not counted in average class size* Co-taught with special education teacher° Taught by a regular education teacher

TABLE 18North High School Course
Enrollment 2018-19(Enrollment as of November 1,
- 48
Course Cur. Total Enroll.
NSec- tions
Avg. ClassSize
Number of ClassesBelow 11 11-19 20-24 25-30 Above 30N % N % N % N % N %
HISTORY & SOCIAL SCIENCE DEPARTMENT
World History 300-1787 ACP 411 ACP 447 18 24.8 8 44% 10 56%World History 300-1787 CP 412 CP 47 4 11.8 1 25% 3 75%World History 300-1787 CP 412* CP 12 1 12.0 1 100%World History 1787-2000 H 420 H 137 5 27.4 5 100%World History 1787-2000 ACP 421 ACP 270 11 24.5 4 36% 7 64%World History 1787-2000 CP 422 CP 32 2 16.0 2 100%World History 1787-2000 CP 422* CP 15 1 15.0 1 100%AP U.S. History 430 H 93 4 23.3 3 75% 1 25%AP American Studies 438 H 23 1 23.0 1 100%American History ACP 431 ACP 262 11 23.8 6 55% 5 45%American Studies (History) ACP 439 ACP 42 2 21.0 2 100%American History CP 432 CP 18 1 18.0 1 100%American History CP 432* CP 16 1 16.0 1 100%American Studies (History) CP 433 CP 11 1 11.0 1 100%AP Comparative Government 456 H 42 2 21.0 2 100%AP European History 440 H 30 1 30.0 1 100%AP Psychology 450 H 150 5 30.0 5 100%Mid East Asia & Latin America H 442, ACP 443 H, ACP 70 3 23.3 2 67% 1 33%Introduction to Psychology ACP 451 ACP 54 2 27.0 2 100%Ethics in Modern World ACP 453 ACP 18 1 18.0 1 100%Economics ACP 455 ACP 44 2 22.0 1 50% 1 50%American History thru the Hollywood Lens I 448 ACP 29 1 29.0 1 100%Law and Society ACP 460 ACP 83 3 27.7 3 100%Contemporary Conflicts ACP 462 ACP 11 1 11.0 1 100%
~Close-up: Government 470 # 27 1 27.0 1 100%~ELL History for Beginning English Learners CP 417 CP 10 1 10.0 1 100%~World History 1787-2000 CP 425 CP 7 1 7.0 1 100%~ELL World History ACP 426° ACP 12 1 12.0 1 100%~ELL U.S. History ACP 436° ACP 24 1 24.0 1 100%~World History 300-1787 415^ CP 8 1 8.0 1 100%~American History 435^ CP 7 1 7.0 1 100%~Pilot World History 1 CP 057^ CP 2 1 2.0 1 100%~Pilot Modern World 2 CP 058^ CP 8 1 8.0 1 100%~Pilot US History CP 059^ CP 12 1 12.0 1 100%~Pilot Humanities 075^ CP 11 1 11.0 1 100%~Community Living History 8593^ # 4 1 4.0 1 100%~Independent Study 481 # 2 2 1.0 2 100%TOTAL HISTORY & SOCIAL SCIENCE 2,090 98 21.3 11 11% 15 15% 29 30% 43 44% 0 0%TOTAL HISTORY & SS MINUS SPECIAL EDUCATION, SPECIAL PROGRAM, ELL, MCAS, CLASSROOMAIDES & INDEPENDENT STUDY COURSES 1,956 84 23.3 1 1% 13 15% 28 33% 42 50% 0 0%#Course not counted in weighted or unweighted grade point average~Course not counted in average class size* Co-taught with special education teacher^ Taught by a special education teacher° Taught by a regular education teacher

TABLE 18North High School Course
Enrollment 2018-19(Enrollment as of November 1,
- 49
Course Cur. Total Enroll.
NSec- tions
Avg. ClassSize
Number of ClassesBelow 11 11-19 20-24 25-30 Above 30N % N % N % N % N %
MATHEMATICS DEPARTMENT
Math 1 H 501 H 190 7 27.1 7 100%Math 2 H 502 H 171 7 24.4 3 43% 4 57%Math 3 H 503 H 175 7 25.0 3 43% 4 57%AP Calculus 4 BC 504 H 102 4 25.5 1 25% 3 75%AP Statistics 505 H 175 6 29.2 6 100%AP Calculus 4 AB 508 H 123 5 24.6 3 60% 2 40%Math 1 ACP Acc 511 ACP 167 8 20.9 3 38% 5 63%Math 2 ACP Acc 512 ACP 176 7 25.1 2 29% 5 71%Math 3 ACP Acc 513 ACP 184 7 26.3 1 14% 6 86%Introduction to Calculus ACP Acc 514 ACP 120 5 24.0 2 40% 3 60%Math 1 ACP 516 ACP 96 4 24.0 4 100%Math 2 ACP 517 ACP 101 4 25.3 1 25% 3 75%Math 3 ACP 518 ACP 85 4 21.3 4 100%Pre-Calculus ACP 519 ACP 115 5 23.0 1 20% 4 80%Math 1 CP 541 CP 12 1 12.0 1 100%Math 1 CP 541, Mathematics 9 571* CP 32 2 16.0 2 100%Math 2 CP 542 CP 6 1 6.0 1 100%Math 2 CP 542, Mathematics 10 572* CP 31 2 15.5 2 100%Math 3 CP 543 CP 10 1 10.0 1 100%Math 3 CP 543, Mathematics 11 573* CP 20 1 20.0 1 100%Topics in Pre-Calculus CP 544 CP 32 2 16.0 2 100%Business Math CP 858* CP 13 1 13.0 1 100%Math 1 (SIMMS) ACP 581 ACP 23 1 23.0 1 100%Math 2 (SIMMS) ACP 582 ACP 14 1 14.0 1 100%Math 3 (SIMMS) ACP 583 ACP 30 2 15.0 2 100%
~Intro to Computer Science ACP 549 ACP 64 3 21.3 3 100%~Intro to Computer Programming H 551, Intro to Computer Programming ACP 552 H, ACP 150 7 21.4 1 14% 6 86%~Computer Science Principles H 553 H 47 2 23.5 2 100%~ELL Math CP 540 ° CP 6 1 6.0 1 100%~Math Concepts and Skills 532° # 45 4 11.3 1 25% 3 75%~Pilot Math 1 CP 063^ CP 2 1 2.0 1 100%~Pilot Math 2 CP 064^ CP 7 1 7.0 1 100%~Pilot Math 3 CP 065^ CP 9 1 9.0 1 100%~Pilot MCAS Math 062^ # 7 1 7.0 1 100%~Community Living Math 859^ # 10 1 10.0 1 100%~Community Living Math 8592^ # 7 1 7.0 1 100%~Math Classroom Aide 580 # 11 11 1.0 11 100%TOTAL MATHEMATICS 2,568 129 19.9 22 17% 18 14% 46 36% 43 33% 0 0%TOTAL MATHEMATICS MINUS SPECIAL EDUCATION, SPECIAL PROGRAM, ELL, MCAS, CLASSROOMAIDES & INDEPENDENT STUDY COURSES 2,203 95 23.2 3 3% 14 15% 35 37% 43 45% 0 0%#Course not counted in weighted or unweighted grade point average~Course not counted in average class size* Co-taught with special education teacher^ Taught by a special education teacher° Taught by a regular education teacher

TABLE 18North High School Course
Enrollment 2018-19(Enrollment as of November 1,
- 50
Course Cur. Total Enroll.
NSec- tions
Avg. ClassSize
Number of ClassesBelow 11 11-19 20-24 25-30 Above 30N % N % N % N % N %
ART DEPARTMENT
Art Minor 1 701 # 85 4 21.3 1 25% 3 75%Art Minor 2 702, 3 703, 4 704 # 36 2 18.0 2 100%Ceramics Minor 1 705 # 119 6 19.8 2 33% 4 67%Ceramics Minor 2 706, Ceramics Minor 3 707 # 38 2 19.0 1 50% 1 50%Art Major 1 ACP 708 ACP 37 2 18.5 1 50% 1 50%Art Major 2 ACP 709 ACP 18 1 18.0 1 100%Art Major 3 ACP 710 ACP 14 1 14.0 1 100%Art Major 4 H 711 H 16 1 16.0 1 100%Ceramics Major 2 H 732 H 27 2 13.5 2 100%Ceramics Major ACP 730 ACP 18 1 18.0 1 100%Photo Minor 1 715 # 82 4 20.5 4 100%Photo Minor 2 716, Photo Minor 3 717 # 29 2 14.5 1 50% 1 50%Photo Major 1 ACP 718, Photo Major 3 H 720, Photo Major 2 H 719 ACP, H 34 2 17.0 1 50% 1 50%
~Independent Study Art 724 # 2 2 1.0 2 100%TOTAL ART DEPARTMENT 555 32 17.3 3 9% 15 47% 14 44% 0 0% 0 0%ART MINUS INDEPENDENT STUDY 553 30 18.4 1 3% 15 50% 14 47% 0 0% 0 0%
MUSIC DEPARTMENT
Concert Choir ACP 800 ACP 11 1 11.0 1 100%Vocal Ensemble ACP 801 ACP 14 1 14.0 1 100%Family Singers H 802 H 20 1 20.0 1 100%Tiger BeBop ACP 803 ACP 15 1 15.0 1 100%Jubilee Singers ACP 804 ACP 39 1 39.0 1 100%Symphony Orchestra Strings ACP 805 ACP 18 1 18.0 1 100%Symphonic Band ACP 808 ACP 24 1 24.0 1 100%Honors Wind Ensemble 809 H 37 1 37.0 1 100%Jazz Ensemble 1 811 H 21 1 21.0 1 100%Jazz Ensemble 2 833 # 19 1 19.0 1 100%Jazz/Rock Workshop ACP 831 ACP 10 1 10.0 1 100%Advanced Jazz Improv ACP 832 ACP 13 1 13.0 1 100%Music Theory ACP 812 ACP 11 1 11.0 1 100%AP Music Theory 813 H 15 2 7.5 2 100%Music Technology 814 # 32 2 16.0 2 100%Film Scoring ACP 815 ACP 10 1 10.0 1 100%Music of the Beatles 819 # 10 1 10.0 1 100%
~Independent Study Music # 2 2 1.0 2 100%TOTAL MUSIC DEPARTMENT 321 21 15.3 7 33% 9 43% 3 14% 0 0% 2 10%MUSIC MINUS INDEPENDENT STUDY 319 19 16.8 5 26% 9 47% 3 16% 0 0% 2 11%
THEATRE DEPARTMENT
Theatre Arts 1 820 # 24 1 24.0 1 100%Stage Techniques 823 # 39 2 19.5 1 50% 1 50%Intro to Costume Design 837, 836 # 19 2 9.5 1 50% 1 50%Intro to Tech Theater 829, 822 # 14 1 1 100%American Musical Theatre 8382 # 9 1 9.0 1 100%
~Advanced Theatrical Directing/Practicum 826 # 9 1 9.0 1 100%~Stage Production Work Study 824 # 1 1 1.0 1 100%~Classroom Aide Theater 827 # 1 1 1.0 1 100%~Independent Study in Theater 828 # 4 4 1.0 4 100%TOTAL THEATRE DEPARTMENT 120 14 8.6 9 64% 3 21% 2 14% 0 0% 0 0%THEATRE DEPARTMENT MINUS WORK STUDY, INDEPENDENTSTUDY, CLASSROOM AIDE, AND DIRECTING PRACTICUM 105 7 15.0 2 29% 3 43% 2 29% 0 0% 0 0%#Course not counted in weighted or unweighted grade point average~Course not counted in average class size

TABLE 18North High School Course
Enrollment 2018-19(Enrollment as of November 1,
- 51
Course Cur. Total Enroll.
NSec- tions
Avg. ClassSize
Number of ClassesBelow 11 11-19 20-24 25-30 Above 30N % N % N % N % N %
CAREER & TECHNICAL EDUCATION DEPARTMENT
Automotive Technology Exploratory 880, 8801 # 26 3 8.7 3 100%Automotive Technology Major 1 882**, 2 883**, 3 884 ACP, # 8 4 2.0 4 100%Carpentry Technology Exploratory 887, 8871 # 26 2 13.0 2 100%Carpentry Technology Major 1 889, 1 Sr. 8891, 2 890, 2.4 8901, 2.6 8902, 2 H 8904, 3 8911 ACP, #, H 42 9 4.7 8 89% 1 11%Child Development Exploratory 894, 8941 # 29 2 14.5 2 100%Early Education & Care Major 1 895, 2 896, 2 H 8964, 3 897, 3 H 8974 ACP, H 21 3 7.0 2 67% 1 33%Culinary Arts Exploratory 902, 9021 # 61 4 15.3 4 100%Culinary Arts Major 1 905**, 2 906, 2 H 9064, 3.8 907421, 3 H 9074** ACP, H 69 7 9.9 3 43% 3 43% 1 14%Drafting Exploratory 911, 9111 # 38 3 12.7 1 33% 2 67%Drafting Major 1 915, 1 Sr, 9152, 1 919, 1 9192, 2 916, 2 H 9164, 2 H 9204, 3 H 9174, 3 H 9214 ACP, H, # 37 6 6.2 4 67% 2 33%Graphics Communication Exploratory 932, 93211 # 48 4 12.0 2 50% 2 50%Graphics Communication Major 1 934, 1 Sr 9341, 2 9342, 2.6 9343, 2 935, 2 H 9354, 3.1 93631, 3 H 9364
ACP, H, # 61 9 6.8 6 67% 2 22% 1 11%
Design and Visual Communications Exploratory 978, 9781 # 30 4 7.5 3 75% 1 25%Design and Communication Major 1 979, 2 981, 2 H 9814, 3.8 H 98341 H 30 5 6.0 4 80% 1 20%Television Production Exploratory 173, 1731 # 24 4 6.0 4 100%TV & Video Production Major 1 175, 1 Sr. 1751, 2 176, 2 H 1764, 3 178, 3 H 1784 H, ACP, # 32 6 5.3 5 83% 1 17%
~Carpentry Classroom Aide 8931 # 1 1 1.0 1 100%~Culinary Arts Classroom Aide 909 # 2 2 1.0 2 100%~Auto Classroom Aide 866 # 1 1 1.0 1 100%~Child Care Classroom Aide 8981 # 1 1 1.0 1 100%~Auto Classroom Aide 866 # 1 1 1.0 1 100%~Design Classroom Aide 9782 # 4 4 1.0 4 100%~Independent Study CTE 888 # 1 1 1.0 1 100%~Work Study Graphic Arts 948 # 1 1 1.0 1 100%TOTAL CAREER & TECHNICAL EDUCATION 594 87 6.8 63 72% 20 23% 3 3% 1 1% 0 0%TOTAL CAREER & TECHNICAL EDUCATION MINUSAIDES AND INDEPENDENT STUDY COURSES 582 75 7.8 51 68% 20 27% 3 4% 1 1% 0 0%
BUSINESS DEPARTMENT
Accounting 1 ACP 855, Accounting 2 ACP 856 ACP 25 1 25.0 1 100%Business Law 857 # 24 1 24.0 1 100%Entrepreneurship 860 # 24 1 24.0 1 100%Financial Planning and Banking 861 # 15 1 15.0 1 100%Microsoft Office 2010 8661 # 10 1 10.0 1 100%Marketing and Management 863 # 20 1 20.0 1 100%Interactive Multimedia 864 # 22 1 22.0 1 100%Money Matters: Intro to Personal Finance 867 # 81 4 20.3 1 25% 3 75%Web Site Development 868 # 17 1 17.0 1 100%TOTAL BUSINESS 238 12 19.8 1 8% 3 25% 5 42% 3 25% 0 0%**Includes students cross-registered from Newton South High School #Course not counted in weighted or unweighted grade point average~Course not counted in average class size

TABLE 18North High School Course
Enrollment 2018-19(Enrollment as of November 1,
- 52
CourseCur.
Total Enroll.
NSec- tions
Avg. ClassSize
Number of ClassesBelow 11 11-19 20-24 25-30 Above 30N % N % N % N % N %
TECHNOLOGY & ENGINEERING DEPARTMENT
Engineering TechnologyACP 636Exploring Technology 1 963Engineering 1 ACP 959Robotics I 965Engineering 3 H 961, Robotics 3 H 968Computer Repair ACP 972, Computer Repair H 973
ACP #
ACP #
H, ACP ACP,
H
133665722012
124411
13.018.016.318.020.012.0
1 100%244
1
100%100%100%
100%1 100%
~Engineering Research ACP 969 (Independent Study) ACP 3 3 1.0 3 100%TOTAL TECHNOLOGY & ENGINEERING 221 16 13.8 4 25% 11 69% 1 6% 0 0% 0 0%TECH & ENG MINUS INDEPENDENT STUDY 218 13 16.8 1 8% 11 85% 1 8% 0 0% 0 0%
PHYSICAL EDUCATION/WELLNESS DEPARTMENT
Freshman Core PE 001 # 272 10 27.2 2 20% 8 80%Sexuality & Health 09, 002 # 253 12 21.1 1 8% 11 92%Personal Fitness 003 # 41 2 20.5 2 100%Stress Management Techniques 005 # 182 6 30.3 2 33% 4 67%Personal & Group Awareness 006 # 86 4 21.5 1 25% 2 50% 1 25%Get Fit 007 # 30 1 30.0 1 100%Intro to Rock Climbing 008 # 79 4 19.8 1 25% 2 50% 1 25%Lifeguard Training 017 # 17 2 8.5 2 100%Team Sports 1 022 # 92 3 30.7 1 33% 2 67%Team Sports 2 023 # 27 1 27.0 1 100%World Games 024 # 16 1 16.0 1 100%Lifetime Activities 025 # 44 2 22.0 2 100%Dance in Action 030 # 24 1 24.0 1 100%Aquatic Instruction 015 # 10 1 10.0 1 100%Prevention and Care of Athletic Injuries 031 # 23 1 23.0 1 100%Career Wellness 033** # 44 2 22.0 2 100%Sexuality and Health 2 009 # 46 2 23.0 1 50% 1 50%AM Swim 042 # 28 1 28.0 1 100%
~Adaptive Physical Education 029^ # 8 1 8.0 1 100%~Pilot Physical Education 073 # 24 1 24.0 1 100%~Pilot Fitness 0761 # 10 1 10.0 1 100%TOTAL PHYSICAL EDUCATION/WELLNESS 1,356 59 23.0 6 10% 3 5% 27 46% 16 27% 7 12%PHYS ED MINUS SPECIAL EDUCATION ANDSPECIAL PROGRAMS 1,314 56 23.5 4 7% 3 5% 26 46% 16 29% 7 13%^Taught by a special education teacher#Course not counted in weighted or unweighted grade point average~Course not counted in average class size**Includes students cross-registered from Newton South High School

TABLE 18North High School Course
Enrollment 2018-19(Enrollment as of November 1,
- 53
CourseCur.
Total Enroll.
NSec- tions
Avg. ClassSize
Number of ClassesBelow 11 11-19 20-24 25-30 Above 30N % N % N % N % N %
SPECIAL EDUCATION*
Reading Seminar 107, 108, 1072, 1082 # 35 14 2.5 14 100%Academic Support (2 Blocks & 4 Blocks combined) 306-319 # 377 97 3.9 96 99% 1 1%Study Skills 30922 # 6 4 1.5 4 100%Communiction Seminar 325, 326, 3262 # 86 39 2.2 39 100%Social Seminar 324 # 21 11 1.9 11 100%Support and Strategies 321 # 186 33 5.6 29 88% 4 12%Community Living English 305, 3052 # 18 2 9.0 2 100%Community Living Math 859, 8592 # 17 2 8.5 2 100%Community Living Physics 6791 # 5 1 5.0 1 100%Community Living History 85931 # 4 1 4.0 1 100%Classroom Aide Special Ed 3001 # 2 2 1.0 2 100%TOTAL SPECIAL EDUCATION 757 206 3.7 ## 98% 5 2% 0 0% 0 0% 0 0%
PILOT PROGRAM*
Pilot World History 1 CP 057 CP 2 1 2.0 1 100%Pilot Modern World History 2 CP 058 CP 8 1 8.0 1 100%Pilot US History CP 059 CP 12 1 12.0 1 100%Pilot Humanities 075 CP 11 1 11.0 1 100%Pilot Math 1 CP 631 CP 2 1 2.0 1 100%Pilot Math 2 CP 064 CP 7 1 7.0 1 100%Pilot Math 3 CP 065 CP 9 1 9.0 1 100%Pilot Physics CP 067 CP 3 1 3.0 1 100%Pilot Biology CP 068 CP 9 1 9.0 1 100%Pilot English 1 CP 116 CP 2 1 2.0 1 100%Pilot English 2 CP 117 CP 8 1 8.0 1 100%Pilot English 3 CP 118 CP 10 1 10.0 1 100%Pilot English 4 CP 119 CP 5 1 5.0 1 100%Pilot Men's & Women's Group 054, 055 # 22 2 11.0 1 50% 1 50%Pilot Physical Education 073 # 24 1 24.0 1 100%Pilot Elective 076 # 10 1 10.0 1 100%Pilot Fitness 0761 # 9 1 9.0 1 100%Pilot Individual Meeting 077 # 27 1 27.0 1 100%Pilot Academic Support 060 # 2 1 2.0 1 100%Pilot MCAS English 079 # 9 1 9.0 1 100%Pilot MCAS Math 062 # 7 1 7.0 1 100%TOTAL PILOT 198 22 9.0 19 86% 2 9% 1 5% 0 0% 0 0%
LINKS PROGRAM*
# # # #
18231220
2731
9.03.34.020.0
Links Choices 337Links Academic Strategies 339 Links Individual Meeting 340 LinksIndependant Meeting 340
163
50%86%
100%
11
50%14%
1 100%TOTAL LINKS 73 13 5.6 10 77% 2 15% 1 8% 0 0% 0 0%TOTAL SPECIAL EDUCATION 1,028 241 4.3 ## 95% 9 4% 2 1% 0 0% 0 0%*No special education courses are included in the average class sizeOTHER OFFERINGS
Guidance Aide 344 # 45 1 45.0 1 100%Stress Management Workshop 342 # 3 1 3.0 1 100%Peer Mentor Program 345 # 21 1 21.0 1 100%Peer Mentor Leader 655 # 1 1 1.0 1 100%Big Brother/Big Sister 478 # 37 4 9.3 2 50% 2 50%Leadership in a Diverse Society 401 # 49 1 49.0 1 100%Intro to Sustainability 653 # 19 2 9.5 2 100%Peer Tutor 333 # 9 3 3.0 3 100%Classroom Aide Library 843 # 2 2 1.0 2 100%Classroom Aide Civic 8401 # 1 1 1.0 1 100%TOTAL OTHER OFFERINGS 187 17 11.0 12 71% 2 12% 1 6% 0 0% 2 12%

- 54
TABLE 19South High School Course Enrollment
2018-2019(Enrollment as of November 1, 2018)
Course Cur.N Avg. Number of Classes
Total Sec- Class Below 11 11-19 20-24 25-30 Above 30Enroll. tions Size N % N % N % N % N %
ENGLISH DEPARTMENT
Ninth Grade English ACP 211, 2111 ACP 325 15 21.7 15 100%Ninth Grade English 212 CP 12 1 12.0 1 100%Ninth Grade English 212, 2126 * CP 28 2 14.0 2 100%Literature & World History ACP 213, 2131 ACP 86 4 21.5 4 100%Sophomore English H 220 H 105 5 21.0 1 20% 4 80%Sophomore English ACP 221 ACP 182 8 22.8 1 13% 7 88%Sophomore English 222 CP 14 1 14.0 1 100%Sophomore English 222, 2226* CP 12 1 12.0 1 100%Global Comm English ACP 2241, H 2240, CP 2242 ACP, H, CP 92 4 23.0 2 50% 2 50%New Media Comm English ACP 2251, CP 2252 ACP,CP 43 2 21.5 2 100%Junior English H 230 H 100 5 20.0 2 40% 3 60%Junior English ACP 231 ACP 176 8 22.0 1 13% 7 88%Junior English ACP 231, CP232, 2328, 2326* ACP,CP 84 4 21.0 4 100%Global Comm - Am Lit ACP 2341, H 2340, CP 2342 ACP, H, CP 91 4 22.8 4 100%Senior English ACP 241 ACP 70 3 23.3 2 67% 1 33%Senior English 242, 2426* CP 12 1 12.0 1 100%Shakespeare H 2430, ACP 243 H, ACP 65 3 21.7 1 33% 2 67%Global Comm English ACP 2441, H 2440, CP 2442 ACP, H, CP 22 1 22.0 1 100%Horror & Science Fiction ACP 245 ACP 18 1 18.0 1 100%Women in Literature H 2460, ACP 2461 H, ACP 18 1 18.0 1 100%AP Eng Literature & Comp 250 H 15 1 15.0 1 100%Our Voices, Our Eyes ACP 251, CP 2512 ACP, CP 23 1 23.0 1 100%African American Lit H 2520, ACP 2521 H, ACP 44 2 22.0 2 100%Film Studies H 2550, ACP 255 H, ACP 96 4 24.0 3 75% 1 25%AP Eng Lang & Comp 260 H 45 2 22.5 2 100%
~Creative Writing Workshop 264 # 24 2 12.0 1 50% 1 50%~Publications 263, Intro Publications 261 # 28 2 14.0 2 100%~Southside 9th Grade English 1212, 10th Grade 1222 ^ CP 6 1 6.0 1 100%~Southside English 11th CP 1232, 12th CP 1242, 12th ACP ^ CP, ACP 11 1 11.0 1 100%~ELL English 1-2 ACP 151 ACP 3 1 3.0 1 100%~ELL English 3 ACP 153 ACP 13 1 13.0 1 100%~ELL English 4 ACP 154 ACP 12 1 12.0 1 100%~ELL English 5 ACP 155 ACP 17 1 17.0 1 100%~LP Ninth Grade English 2128 (RISE), 218 Learning Program ^ CP 6 1 6.0 1 100%~Connections English 982 ^ # 10 1 10.0 1 100%~CORE Prog Sophomore English ACP 2291, 2292** ACP, CP 18 1 18.0 1 100%~CORE Prog Junior English ACP 2391, 2392** ACP, CP 16 1 16.0 1 100%~Writing Center 295 2951 # 4 4 1.0 4 100%~Peer Tutor-Writing 296 269F # 2 2 1.0 2 100%~English Teaching Assist 298 298F # 11 11 1.0 11 100%~Ind Study English 299 # 2 2 1.0 2 100%TOTAL ENGLISH 1,961 117 16.8 24 21% 26 22% 65 56% 2 2% 0 0%ENGLISH WITHOUT ELL, CORE PROGRAM,
1,778 84 21.2SPECIAL EDUCATION, MCAS POWER ENGLISH,TUTORS, ASSISTANTS OR IND STUDY 0 0% 17 20% 65 77% 2 2% 0 0%*Co-taught with a special education teacher**Supported by a special education aide^Taught by a special education teacher#Course not counted in weighted grade point average~Course not counted in average class size

TABLE 19South High School Course
Enrollment 2018-2019(Enrollment as of November 1,
- 55
Course Cur. Total Enroll.
NSec- tions
Avg. ClassSize
Number of ClassesBelow 11N %
11-19N %
20-24N %
25-30N %
Above 30N %
WORLD LANGUAGE DEPARTMENT
French 3 H 303 H 30 1 30.0 1 100%French 4 H 304 H 23 1 23.0 1 100%AP French Language 305 H 13 1 13.0 1 100%French 1 ACP 311, 3111 ACP 21 1 21.0 1 100%French 2 ACP 312, 3121 ACP 75 4 18.8 4 100%French 3 ACP 313, 3131 ACP 51 2 25.5 2 100%French 4 ACP 314, 3141 ACP 59 2 29.5 2 100%French 5 ACP 315 ACP 16 1 16.0 1 100%Chinese 2 ACP 342 ACP 35 2 17.5 1 50% 1 50%Chinese 3 ACP 343 ACP 21 1 21.0 1 100%Chinese 3 H 3430 H 16 1 16.0 1 100%Chinese 4 ACP 344 ACP 16 1 16.0 1 100%Chinese 4 H 3440 H 26 1 26.0 1 100%Chinese 5 ACP 345 ACP 12 1 12.0 1 100%Chinese 5 H 3450 H 21 1 21.0 1 100%AP Chinese Lang & Culture 346 H 10 1 10.0 1 100%Latin 1 ACP 351, 3511 ACP 27 1 27.0 1 100%Latin 2 ACP 352+ ACP 28 1 28.0 1 100%Latin 3 H 3530, ACP 353 H, ACP 20 1 20.0 1 100%Latin 4 H 3540, 3550, ACP 354 H, ACP 17 1 17.0 1 100%Russian 2 ACP 362, 361, H 369 H, ACP 23 1 23.0 1 100%Spanish 3 H 373 H 103 4 25.8 4 100%Spanish 4 H 374 H 92 4 23.0 3 75% 1 25%AP Spanish Language 375 H 64 3 21.3 1 33% 2 67%Novice Spanish 1 ACP 381a ACP 58 3 19.3 1 33% 2 67%Novice Spanish 2 ACP 381b ACP 62 3 20.7 1 33% 2 67%Spanish 2 ACP 382, 3821 ACP 232 10 23.2 8 80% 2 20%Spanish 3 ACP 38, 3831 ACP 129 5 25.8 5 100%Spanish 4 ACP 384, 3841 ACP 89 4 22.3 1 25% 2 50% 1 25%Spanish 5 ACP 385 ACP 41 2 20.5 1 50% 1 50%Spanish 1 CP 391 CP 13 1 13.0 1 100%Spanish 2 CP 392 CP 12 1 12.0 1 100%Spanish 3 CP 393 CP 10 1 10.0 1 100%Spanish 4 CP 394, 395 CP 19 1 19.0 1 100%
~American Sign Language 1 331 # 16 1 16.0 1 100%~American Sign Language 2 ACP 332, 3 ACP 333 ACP 8 1 8.0 1 100%~World Language Teach Assistant 339, 398 # 14 10 1.4 10 100%TOTAL WORLD LANGUAGE 1,522 81 18.8 13 16% 16 20% 31 38% 21 26% 0 0%WORLD LANGUAGE WITHOUT ASSISTANTS 1,484 69 21.5 2 3% 15 22% 31 45% 21 30% 0 0%#Course not counted in weighted grade point average~Course not counted in average class size+Includes 8 students from middle schools

TABLE 19South High School Course
Enrollment 2018-2019(Enrollment as of November 1,
- 56
Course Cur. Total Enroll.
NSec- tions
Avg. ClassSize
Number of ClassesBelow 11N %
11-19N %
20-24N %
25-30N %
Above 30N %
SCIENCE DEPARTMENT
Physics I with Trig ACP 8111 ACP 72 3 24.0 2 67% 1 33%Physics (lab) ACP 811 ACP 266 12 22.2 1 8% 10 83% 1 8%Physics (lab) CP 812, 8124, 8126, 8128* CP 55 4 13.8 4 100%Physics & Engineering(lab) ACP 813 ACP 86 4 21.5 4 100%Chemistry (lab) H 820 H 142 6 23.7 3 50% 3 50%Chemistry (lab) ACP 821 ACP 250 10 25.0 2 20% 8 80%Chemistry (lab) CP 822 CP 33 3 11.0 1 33% 2 67%Chemistry (lab) CP 822, 8226* CP 12 1 12.0 1 100%Intro Adv Chemistry ACP 8241, CP 8242 ACP,CP 19 1 19.0 1 100%da Vinci Biochemistry 1 ACP 8271, H 8270, CP 8272 ACP, H, CP 21 1 21.0 1 100%Honors Biology (Lab) 830 H 188 7 26.9 7 100%Biology (lab) ACP 831 ACP 178 8 22.3 1 13% 6 75% 1 13%Biology (lab) CP 832, 8324, 8326, 8328, 8329* CP 27 2 13.5 2 100%Global Biology ACP 8341, H 8340, CP 8342 ACP, H, CP 40 2 20.0 1 50% 1 50%daVinci Biology ACP 8371, H 8370, CP 8372 ACP,H, CP 38 2 19.0 1 50% 1 50%Organic Chemistry ACP 849 ACP 21 1 21.0 1 100%Honors Chemistry II H 25 1 25.0 1 100%AP Chemistry (lab) 840 H 54 3 18.0 3 100%Physics II ACP 841 ACP 24 1 24.0 1 100%Physics & Music ACP 843, CP 8432 ACP,CP 23 1 23.0 1 100%da Vinci STEAM Project H 8470, ACP 8471 (4/2 split) H, ACP 10 1 10.0 1 100%AP Biology (lab) 850 H 79 3 26.3 1 33% 2 67%Astronomy & Earth Science ACP 851, CP 8512 ACP, CP 24 1 24.0 1 100%Neurobiology H 860, ACP 8601 H, ACP 48 2 24.0 1 50% 1 50%Marine Biology ACP 861 ACP 76 3 25.3 1 33% 2 67%Global Marine Biology ACP 862, H 8620, CP 8622 ACP, H, CP 46 2 23.0 2 100%AP Physics C Mech 870 H 54 2 27.0 2 100%AP Physics C Mech E&M 880 H 26 1 26.0 1 100%Anatomy & Physiology ACP 881, CP 882 ACP,CP 40 2 20.0 1 50% 1 50%
~Intro. Physics Study 890, Physics Topics 891 # 10 2 5.0 2 100%~Science Teach Assistant, Tutor 897,898 8983, 8984 # 34 25 1.4 25 100%~Ind Study Science 899 899F # 2 2 1.0 2 100%TOTAL SCIENCE 2,023 119 17.0 30 25% 19 16% 40 34% 30 25% 0 0%SCIENCE WITHOUT ASSISTANTS, INDEPENDENTSTUDY, OR SPECIAL EDUCATION 1,977 90 22.0 1 1% 19 21% 40 44% 30 33% 0 0%*Co-taught with a special education teacher#Course not counted in weighted grade point average~Course not counted in average class size

- 57
TABLE 19South High School Course Enrollment
2018-2019(Enrollment as of November 1, 2018)
Course Cur.N Avg. Number of Classes
Total Sec- Class Below 11 11-19 20-24 25-30 Above 30Enroll. tions Size N % N % N % N % N %
HISTORY & SOCIAL SCIENCE DEPARTMENT
World History to 1775 ACP 411, 4111 ACP 246 10 24.6 4 40% 6 60%World History to 1775 ACP 411, CP 4112 ACP, CP 92 4 23.0 4 100%World History to 1775 412, 4126* CP 26 2 13.0 2 100%World History & Literature ACP 413, 4131 ACP 86 4 21.5 2 50% 2 50%World History 1775-pres H 420 H 170 7 24.3 3 43% 4 57%World History 1775-pres ACP 421 ACP 93 4 23.3 4 100%World History 1775-pres ACP 421, CP 422 ACP,CP 44 2 22.0 2 100%World History 1775-pres 422, 4226* CP 10 1 10.0 1 100%Global World History ACP 4241, H 4240, CP 4242 ACP, H, CP 92 4 23.0 4 100%New Media Comm ACP 4251, CP 4252 ACP, CP 43 2 21.5 2 100%AP U.S. History 430 H 176 7 25.1 1 14% 6 86%U.S. History ACP 431 ACP 94 4 23.5 2 50% 2 50%U.S. History ACP 431, CP 43212, 4314 ACP,CP 88 4 22.0 1 25% 3 75%U.S. History 432, 4326* CP 9 1 9.0 1 100%Global-US History ACP 4341, H 4340, CP 4342 ACP, H, CP 91 4 22.8 4 100%AP European History 440, ACP 4401 H,ACP 24 1 24.0 1 100%Contemporary World History ACP 441, H 4410, CP 4412 ACP, H, CP 68 3 22.7 2 67% 1 33%Race, Class, Gender H 4420, ACP 4421, CP 4422 ACP, H, CP 93 4 23.3 4 100%Ethics in Mod World H 4430, ACP 443 H, ACP 44 2 22.0 2 100%Sustainability ACP 4441, H 4440, CP 4442 ACP, H, CP 43 2 21.5 1 50% 1 50%AP US Government & Politics 450, ACP 451 H, ACP 54 2 27.0 2 100%AP Comparative Government 460, ACP 4601 H, ACP 47 2 23.5 1 50% 1AP Psychology 470 H 84 3 28.0 3 100%Psychology ACP 471, CP 4712 ACP, CP 45 2 22.5 1 50% 1 50%
~Southside World History CP, 1412 CP 6 1 6.0 1 100%~Southside U.S. History 14321^ CP 7 1 7.0 1 100%~ELL World History to 1775 ACP 161, 160 ACP, CP 12 1 12.0 1 100%~ELL U.S. History ACP 162 ACP 18 1 18.0 1 100%~Power History 414 # 13 2 6.5 2 100%~CORE Prog World/American History ACP 4291 4292* ACP, CP 18 1 18.0 1 100%~CORE Prog U.S. History ACP 4391 4392* ACP, CP 14 1 14.0 1 100%~History Teach Assistant 498, 498F # 10 10 1.0 10 100%~Independent Study History, 499 # 1 1 1.0 1 100%TOTAL HISTORY & SOCIAL SCIENCE 1,961 100 19.6 17 17% 10 10% 47 47% 26 26% 0 0%HISTORY WITHOUT ELL, NETWORK,
1,862 81 23.0OR SPECIAL EDUCATION 2 2% 6 7% 47 58% 26 32% 0 0%*Co-taught with a special education teacher^Taught by a special education teacher#Course not counted in weighted grade point average~Course not counted in average class size

TABLE 19South High School Course
Enrollment 2018-2019(Enrollment as of November 1,
- 58
Course Cur. Total Enroll.
NSec- tions
Avg. ClassSize
Number of ClassesBelow 11N %
11-19N %
20-24N %
25-30N %
Above 30N %
MATHEMATICS DEPARTMENT
Mathematics 1 H 601, 6017, 6018 + H 186 7 26.6 2 29% 5 71%Mathematics 2 H 602 6027 H 140 5 28.0 5 100%Precalculus H 603 H 132 5 26.4 5 100%AP Calculus BC 604 H 104 4 26.0 1 25% 3 75%AP Statistics 605 H 97 4 24.3 2 50% 2 50%AP Calculus AB 608 H 65 3 21.7 3 100%Mathematics 1 Accel ACP 611, 6117 ACP 150 7 21.4 1 14% 6 86%Mathematics 2 Accel ACP 612, 6127 ACP 145 6 24.2 4 67% 2 33%Mathematics 3 Accel ACP 613, 6137 ACP 157 6 26.2 1 17% 5 83%Precalculus Accel ACP 614, 6147 ACP 75 3 25.0 1 33% 2 67%Precalculus & Statistics ACP 616 ACP 46 2 23.0 1 50% 1 50%Applied Precalc. & Calc. ACP 618 ACP 41 2 20.5 2 100%Algebra 1 CP 620, 6206* CP 28 2 14.0 2 100%Mathematics 1 ACP 621, 6217 ACP 97 5 19.4 2 40% 3 60%Mathematics 2 ACP 622, 6227 ACP 95 4 23.8 3 75% 1 25%Mathematics 3 ACP 623, 6237 ACP 109 5 21.8 1 20% 3 60% 1 20%Precalculus ACP 624 ACP 91 4 22.8 3 75% 1 25%da Vinci Mathematics 2 ACP 6271, H 6270 ACP,H 21 1 21.0 1 100%da Vinci Mathematics 3 ACP 6371, H 6370, CP 6372 ACP,H,CP 38 2 19.0 1 50% 1 50%Foundations of Math CP 630 CP 12 1 12.0 1 100%Mathematics 1 CP 631, 6316* CP 8 1 8.0 1 100%Mathematics 2 CP 632, 6326*, 6328 CP 39 2 19.5 1 50% 1 50%Mathematics 3 CP 633, 6336* CP 30 2 15.0 2 100%Mathematics 4 CP 634, ACP 624 CP,ACP 14 1 14.0 1 100%
~Math Concepts & Skills 661 # 14 2 7.0 2 100%~Math Peer Tutor/Math Center 697, 697F, 6971, 696 # 18 18 1.0 18 100%~Math Teach Assistant 698, 698F, 6981F # 19 19 1.0 19 100%~Ind Study Mathematics 699F # 1 1 1.0 1 100%~Connections Prog Mathematics 983 ^ # 11 1 11.0 1 100%~Intro Object Oriented Program 650 # 84 4 21.0 4 100%~Intro Program & Comp Sc H 652, ACP 651 H,ACP 76 3 25.3 1 33% 2 67%~Adv Comp Program w/Swift H 656 H 37 2 18.5 1 50% 1 50%~Intro iOS Programing H 658 H 14 1 14.0 1 100%TOTAL MATHEMATICS 2,194 135 16.3 41 30% 15 11% 44 33% 35 26% 0 0%MATHEMATICS WITHOUT MCAS SUPPORT, ASSISTANTS, PEER TUTORS, IND STUDY, ORSPECIAL EDUCATION 1,920 84 22.9 1 1% 12 14% 38 45% 33 39% 0 0%*Co-taught with a special education teacher^Taught by a special education teacher#Course not counted in weighted grade point average+Includes 8 students from middle schools

~Course not counted in average class
TABLE 19South High School Course
Enrollment 2018-2019(Enrollment as of November 1,
Course Cur. Total Enroll.
NSec- tions
Avg. Class Size
Number of ClassesBelow 11 N %
11-19N %
20-24N %
25-30N %
Above 30 N %
ART DEPARTMENT
Art Foundations 021 # 188 8 23.5 8 100%Art and Design 1 ACP 021 ACP 37 2 18.5 1 50% 1 50%Art and Design 2 ACP 022 ACP 43 2 21.5 2 100%Honors Art 025 H 23 1 23.0 1 100%AP Studio Art: Drawing 026, ACP Art 021 H,ACP 10 1 10.0 1 100%Mixed Media 1 041 ACP 85 4 21.3 1 25% 3 75%Honors 3D Art 043 H 22 1 22.0 1 100%Glass Techniques ACP 055 ACP 29 2 14.5 2 100%AP 3D Design 057 H 29 2 14.5 2 100%Ceramics 1 061 ACP 95 4 23.8 2 50% 2 50%Ceramics 2 ACP 062, Ceramics H 0672 ACP,H 48 2 24.0 1 50% 1 50%Wheel Throwing 1 ACP 065 ACP 16 1 16.0 1 100%Honors Ceramics 067 H 24 1 24.0 1 100%Photography 1 ACP 081, H 084 ACP,H 44 2 22.0 2 100%Photography 2 Digital & Film ACP 082 ACP 38 2 19.0 1 50% 1 50%Photography 3 Digital ACP 083 ACP 11 1 11.0 1 100%Honors Photography 084 H 38 2 19.0 1 50% 1 50%Foundations Media Arts 090 # 37 2 18.5 2 100%Digital Imaging 1 ACP 091 ACP 18 1 18.0 1 100%Game Design Studio ACP 092, Adv Project 092b, 093 ACP 34 2 17.0 2 100%3D Comp Animation ACP 094 ACP 19 1 19.0 1 100%Web Design ACP 096 ACP 15 1 15.0 1 100%Video Projects 097 ACP 17 1 17.0 1 100%Honors Media Studio H 0980, ACP 098, 093 H,ACP 38 2 19.0 1 50% 1 50%
~Art Teaching Assistant 028, 058F, 058 # 4 4 1.0 4 100%~Photography Teaching Assistant, # 4 3 1.3 3 100%~Ceramics Teaching Assistant, 068 # 3 3 1.0 3 100%~Media Assistant 099 # 1 1 1.0 1 100%~Work Study 2-D Art, 030 # 2 2 1.0 2 100%~Work Study Media Arts 099W # 2 2 1.0 2 100%~Independent Study Ceramics, 069 # 1 1 1.0 1 100%~Independent Study Media Arts, 099MA # 1 1 1.0 1 100%TOTAL ART DEPARTMENT 976 65 15.0 18 28% 19 29% 25 38% 3 5% 0 0%ART WITHOUT INDEPENDENT STUDY, WORK STUDY, OR ASSISTANTS 958 48 20.0 1 2% 19 40% 25 52% 3 6% 0 0%
MUSIC DEPARTMENT
AP Music Theory 701 H 29 2 14.5 2 100%Music Tech & Comp 1 711 ACP 32 2 16.0 2 100%Music Production, Adv. Music Prod ACP 713, 715 ACP 15 1 15.0 1 100%Ukelele 718 # 31 3 10.3 1 33% 2 67%Symphonic Band ACP 722, 7223, H 7220, 72230 ACP, H 60 1 60.0 1 100%Select Wind Ensemble H 728 H 31 1 31.0 1 100%Jazz Improv 1 & Jazz Improv 2 731, 732a #, ACP 12 1 12.0 1 100%Jazz Improv 2 ACP 732, 733a ACP 11 1 11.0 1 100%Jazz Improv 3 ACP 733 ACP 10 1 10.0 1 100%Jazz Improv 4 ACP 734 ACP 11 1 11.0 1 100%Honors Jazz Combo 735 H 9 1 9.0 1 100%Lab Jazz Ensemble ACP 736 ACP 29 1 29.0 1 100%Jazz Ensemble H 737 H 26 1 26.0 1 100%Vocal Ensemble 743,7450, 745,74520 #,H,ACP 17 1 17.0 1 100%Madrigals H 7470, 74730 ACP 747,7473 H, ACP 42 1 42.0 1 100%Voices of Inspiration 744 ACP 13 1 13.0 1 100%String Orchestra H 7240, 72430, ACP 725, String Ensemb 725 H, ACP 41 1 41.0 1 100%
~Music Assistant 758 # 7 4 1.8 4 100%~Work Study Music 757F # 2 1 2.0 1 100%~Independent Study Music 759 # 1 1 1.0 1 100%MUSIC DEPARTMENT TOTAL 429 27 15.9 9 33% 12 44% 0 0% 2 7% 4 15%MUSIC DEPARTMENT WITHOUT WORK STUDY, ASSISTANTS, OR INDEPENDENT STUDY
419 21 20.0 3 14% 12 57% 0 0% 2 10% 4 19%
#Course not counted in weighted grade point average - 59 -

- 60 ~Course not counted in average class
TABLE 19South High School Course
Enrollment 2018-2019(Enrollment as of November 1,
Course Cur. Total Enroll.
NSec- tions
Avg. Class Size
Number of ClassesBelow 11 N %
11-19N %
20-24N %
25-30N %
Above 30 N %
THEATRE DEPARTMENT
Introduction to Acting 270, 270F # 29 2 14.5 2 100%Actors' Workshop H 2720, 2720F, ACP 2721, 2721F H, ACP 22 2 11.0 1 50% 1 50%Acting and Directing H 2730, ACP 2731, 2731F H, ACP 15 1 15.0 1 100%Technical Theatre 275, 275F # 19 2 9.5 2 100%Public Speak & Pres. N 2761, H 2760 #,H 15 1 15.0 1 100%ELL Drama & Speech 280 280F # 8 1 8.0 1 100%
~Theatre Assistant 279 # 3 1 3.0 1 100%~Work-Study in Theatre 278 278F # 5 3 1.7 3 100%TOTAL THEATRE 116 13 8.9 8 62% 5 38% 0 0% 0 0% 0 0%THEATRE WITHOUT WORK STUDY OR TEACH ASSISTANT 108 9 12.0 4 44% 5 56% 0 0% 0 0% 0 0%
BUSINESS DEPARTMENT
Intro to Business 111 Personal Finance 112Entrepreneurship ACP 113Fashion Mkt & Merchandising ACP 114
# #
ACP ACP
541224817
2521
27.024.424.017.0 1 100%
21
40%50%
231
100%60%50%
~Business Teaching Assistant 128F # 1 1 1.0 1 100%TOTAL BUSINESS 242 11 22.0 1 9% 1 9% 3 27% 6 55% 0 0%BUSINESS WITHOUT TEACHING ASSISTANT 241 10 24.1 0 0% 1 10% 3 30% 6 60% 0 0%
FAMILY & CONSUMER SCIENCE
Healthy Cooking, Eating 501 # 59 3 19.7 2 67% 1 33%Int'l Cuisine AAAE F 503 # 142 7 20.3 1 14% 6 86%Intermediate Int'l Cuisine ACP 505 ACP 48 3 16.0 2 67% 1 33%Culinary Arts Exploratory ACP 507 ACP 17 1 17.0 1 100%Fashion & Clothing 1 ACP 511 # 19 1 19.0 1 100%Child Development ACP 521 ACP 21 1 21.0 1 100%Early Childhood Ed ACP 532, 533, 534 ACP 45 4 11.3 4 100%Adv Study Early Childhood ACP 539 5393 ACP 28 1 28.0 1 100%
~Early Child Ed Major ACP 540 ACP 3 4 0.8 4 100%TOTAL FAMILY & CONSUMER SCIENCE 382 25 15.3 8 32% 7 28% 10 40% 0 0% 0 0%F & CS WITHOUT MAJOR 379 21 18.0 4 19% 7 33% 10 48% 0 0% 0 0%
TECHNICAL EDUCATION
Architecture 1 551 # 36 2 18.0 1 50% 1 50%Engineering Grade 9 561 # 19 1 19.0 1 100%Engineering 1 ACP 5621, 5641 H 5640 ACP,H 26 1 26.0 1 100%Robotics 1 565 # 23 1 23.0 1 100%daVinci Inventing, 567 ACP 38 2 19.0 1 50% 1 50%Graphic Design 1 ACP 578, 2 ACP 579 #, ACP 42 2 21.0 2 100%Woodworking 1 581 # 35 2 17.5 2 100%
~Ind Study Technical Ed 599, 5994 # 3 1 3.0 1 100%TOTAL TECHNICAL EDUCATION 222 12 18.5 1 8% 5 42% 5 42% 1 8% 0 0%TECHNICAL EDUCATION WITHOUT IND STUDY 219 11 19.9 0 0% 5 45% 5 45% 1 9% 0 0%
WELLNESS DEPARTMENT
Ninth-Grade Wellness 771 # 234 10 23.4 5 50% 5 50%Ninth-Grade Health 772 # 233 10 23.3 2 20% 3 30% 5 50%Sophomore Wellness 773 # 260 10 26.0 3 30% 7 70%Lifetime Pursuits F 783 # 50 2 25.0 1 50% 1 50%The Centered Self 785 # 96 4 24.0 3 75% 1 25%Global Games 786 # 54 2 27.0 1 50% 1 50%Yoga/Pilates 787 # 126 5 25.2 2 40% 3 60%Personal Fitness Stress Relief 788 # 44 2 22.0 2 100%Sports Nutrition, 502 # 85 4 21.3 4 100%
~Connect Prog Wellness 760, 764, Alt Well 766 # 5 2 2.5 2 100%~Health Education, 767, 7671 # 3 3 1.0 3 100%~Southside Wellness F 1701 # 14 1 14.0 1 100%~Connections Wellness Assistants 798, 7981 # 8 3 3 100%~Leadership Teach Assist 797 # 12 9 1.3 9 100%~Independent Study Athletic Trainer 799 3 1 1 1.0 1 100%TOTAL WELLNESS 1,225 68 18.0 18 26% 3 4% 24 35% 23 34% 0 0%WELLNESS WITHOUT SPECIAL PROGRAMS ORTEACH ASSISTANTS 1,182 49 24.1 0 0% 2 4% 24 49% 23 47% 0 0%#Course not counted in weighted grade point average

- 61
TABLE 19South High School Course
Enrollment 2018-2019(Enrollment as of November 1,
Course Cur. Total Enroll.
NSec- tions
Avg. ClassSize
Number of ClassesBelow 11N %
11-19N %
20-24N %
25-30N %
Above 30N %
SPECIAL EDUCATION CLASSES
ACADEMIC SUPPORTAcademic Support Grade 9 924, 922 # 58 8 7.3 8 100%Academic Support Grade 10 934, 932 # 59 11 5.4 11 100%Academic Support Grade 11/12 944, 942, 943, 954 # 86 11 7.8 11 100%Academic Support 9 9228, 9248 (RISE Program) # 16 7 2.3 7 100%Academic Support 10 9348 (RISE Program) # 3 1 3.0 1 100%Academic Support 11/12 9428, 9448 (RISE Program) # 10 2 5.0 2 100%Academic Support 967, 968 (COMPASS Program) # 22 6 3.7 6 100%Academic Support 976KA, 978KA (STRIDE) # 21 6 3.5 6 100%Academic Support 976K, 978K (STEP Program) # 36 8 4.5 8 100%TOTAL Academic Support 311 60 5.2 60 100% 0 0% 0 0% 0 0% 0 0%
SOUTHSIDE PROGRAM*
CP CP, ACP
CP CP # ##
6116721242
1111231
6.011.06.07.0
10.58.02.0
Southside 9th Grade English 1212, 10th Grade 1222Southside English 11th CP 1232, ACP 1231 12th CP 1242, 12th ACP Southside World History 1 CP 1412Southside U.S. History CP 1432 Southside Affective Ed 1500, 15001Southside Academic Support 1502, 1503, 1504SS Work Study 1509
1
11131
100%
100%100%50%100%100%
1
1
100%
50%
TOTAL Southside Program 77 10 7.7 8 80% 2 20% 0 0% 0 0% 0 0%CONNECTIONS PROGRAMConnections Vocational Skills # 9 1 9.0 1 100%Connections Prog Mathematics 983 # 12 1 12.0 1 100%Connection Daily Living Skills 984 # 8 1 8.0 1 100%Connections English 982 # 10 2 5.0 2 100%TOTAL Connections Programs 39 5 7.8 5 100% 0 0% 0 0% 0 0% 0 0%OTHER
# #
2518
1512
1.71.5
Communication Skills 945, 946Reading Strategies 290, 2901
1512
100%100%
TOTAL OTHER Programs 43 27 1.6 27 100% 0 0% 0 0% 0 0% 0 0%TOTAL SPECIAL EDUCATION 470 102 4.6 ## 98% 2 2% 0 0% 0 0% 0 0%*Cotaught with a special education teacher#Course not counted in weighted grade point average

TABLE 19South High School Course
Enrollment 2018-2019(Enrollment as of November 1,
- 62
Course Cur. Total Enroll.
NSec- tions
Avg. ClassSize
Number of ClassesBelow 11N %
11-19N %
20-24N %
25-30N %
Above 30N %
ELL
ELL English 1-2 ACP 151 ACP 3 1 3.0 1 100%ELL English 3 ACP 153 ACP 13 1 13.0 1 100%ELL English 4 ACP 154 ACP 12 1 12.0 1 100%ELL English 5 ACP 155 ACP 17 1 17.0 1 100%ELL World History to 1775 ACP 161, 160 ACP, CP 12 1 12.0 1 100%ELL U.S. History ACP 162 ACP 18 1 18.0 1 100%ELL Academic Support F 165 # 63 6 10.5 2 33% 4 67%Applying to College: A-Z 167 # 9 1 9.0 1 100%ELL Drama & Speech 280 # 8 1 8.0 1 100%Bilingual Peer Ed F 917 # 4 4 1.0 4 100%TOTAL ELL 159 18 8.8 9 50% 9 50% 0 0% 0 0% 0 0%CORE PROGRAM
ACP, CP ACP, CP ACP, CP ACP, CP
##
181618141913
111111
18.016.018.014.019.013.0
Sophomore English ACP 2291 2292º Junior English ACP 2391 2392º World/American History ACP 4291 4292ºU.S. History ACP 4391 4392º Academic Study 973, 975Academic Study 974, 975
111111
100%100%100%100%100%100%
TOTAL CORE Program 98 6 16.3 0 0% 6 100% 0 0% 0 0% 0 0%OTHER OFFERINGS
Advisory Leader 902 # 26 2 13.0 2 100%Big Brother Big Sister 904 # 26 4 6.5 4 100%METCO Advisory 906 # 15 4 3.8 4 100%Technology Exploration 908 # 1 1 1.0 1 100%Office Assistant 915 # 4 1 4.0 1 100%Bilingual Peer Ed F 917 # 4 1 4.0 1 100%Library Service 919 # 4 4 1.0 4 100%Peer Tutor 996, 9961, 996F # 5 5 1.0 5 100%TOTAL OTHER 85 22 3.9 20 91% 2 9% 0 0% 0 0% 0 0%#Course not counted in weighted grade point average° Taught by a regular education teacher

TABLE 20 DEPARTMENTAL ENROLLMENTS*
- 63
Newton North High School
Department
2018-2019
N
Enrollment Rate
(compared to total
enrollment)English 2,104 0.99World Languages 1,569 0.73Science 2,121 0.99History & Social Science 2,061 0.96Mathematics 2,244 1.05Art 553 0.26Music 319 0.15Business 238 0.11Career & Technical Education 582 0.27Theatre 105 0.05Technology/Engineering 218 0.10Physical Education/Wellness 1,348 0.63Total All
13,462DepartmentsTotal Enrollment
2,136As of October 1
*Total of all students enrolled in a subject course (includes ELL, special education, and special program courses marked with a ~; does not include subject electives or independent study)

TABLE 21 DEPARTMENTAL ENROLLMENTS*
- 64
Newton South High School
Department
2018-2019
N
Enrollment Rate
(compared to total
enrollment)English 1,890 0.99World Languages 1,484 0.78Science 1,977 1.03History & Social Science 1,937 1.01Mathematics 1,931 1.01Art 958 0.50Music 419 0.22Business 241 0.13Technical Education 219 0.11Theatre 108 0.06Family & Consumer Science 379 0.20Wellness 1,201 0.63Total All
12,744DepartmentsTotal Enrollment
1,911As of October 1
*Total of all students enrolled in a department course (includes ELL, special education, and special program courses marked with a ~; does not include departmental electives or independent study)

TABLE 22PROJECTED FUTURE CLASS SIZES FOR 5 ACADEMIC
*Includes special education, special program, ELL, MCAS, classroom aides, work study, and independent study courses.
**The table above assumes that future enrollment patterns in departmental courses will mirror enrollment patterns for 2018-2019 and that the future number of sections offered will be the same as 2018-2019. This information is intended for planning purposes only and does not reflect future staffing patterns.
- 65
Newton North High School
Curriculum Level N Sections (2018-19)
Current Avg. Class Size (2018-19)
2019-20Projected Average Class Size
Change in Average
Class Size
Change in Sections
Required to Maintain
Current Avg.Class Size
2020-21Projected Average Class Size
2021-22Projected Average Class Size
All 5 SubjectsH 134 23.9 23.6 -0.3 -2 24.1 24.5ACP 260 22.5 22.2 -0.3 -3 22.7 23.1CP 53 13.3 13.1 -0.2 -1 13.4 13.6Unleveled Courses 0 0.0 0.0 0.0 0 0.0 0.0Special Ed., etc.* 140 6.4 6.3 -0.1 -2 6.4 6.5Total 587 18.2 17.9 -0.2 -8 18.3 18.6Total Minus Special Ed., etc. 447 21.9 21.6 -0.3 -6 22.0 22.4
EnglishH 26 21.7 21.4 -0.3 0 21.9 22.3ACP 59 21.3 21.0 -0.3 -1 21.4 21.8CP 12 12.2 12.0 -0.2 0 12.3 12.5Unleveled Courses 0 0.0 0.0 0.0 0 0.0 0.0Special Ed., etc.* 34 8.2 8.1 -0.1 -1 8.3 8.4Total 131 17.2 16.9 -0.2 -2 17.3 17.6Total Minus Special Ed., etc. 97 20.3 20.0 -0.3 -1 20.4 20.8
World LanguagesH 21 18.1 17.9 -0.2 0 18.3 18.6ACP 51 21.4 21.1 -0.3 -1 21.5 21.9CP 8 12.3 12.1 -0.2 0 12.3 12.6Unleveled Courses 0 0.0 0.0 0.0 0 0.0 0.0Special Ed., etc.* 7 1.6 1.6 0.0 0 1.6 1.6Total 87 18.2 17.9 -0.2 -1 18.3 18.6Total Minus Special Ed., etc. 80 19.6 19.4 -0.3 -1 19.8 20.1
ScienceH 30 26.1 25.7 -0.3 0 26.3 26.7ACP 50 22.9 22.6 -0.3 -1 23.1 23.4CP 11 14.0 13.8 -0.2 0 14.1 14.3Unleveled Courses 0 0.0 0.0 0.0 0 0.0 0.0Special Ed., etc.* 51 2.0 1.9 0.0 -1 2.0 2.0Total 142 15.4 15.2 -0.2 -2 15.5 15.7Total Minus Special Ed., etc. 91 22.9 22.6 -0.3 -1 23.0 23.4
History & Social ScienceH 21 26.0 25.6 -0.3 0 26.1 26.6ACP 52 24.2 23.9 -0.3 -1 24.4 24.8CP 11 13.7 13.5 -0.2 0 13.8 14.1Unleveled Courses 0 0.0 0.0 0.0 0 0.0 0.0Special Ed., etc.* 14 9.6 9.4 -0.1 0 9.6 9.8Total 98 21.3 21.0 -0.3 -1 21.5 21.9Total Minus Special Ed., etc. 84 23.3 23.0 -0.3 -1 23.5 23.9
MathematicsH 36 26.0 25.7 -0.3 0 26.2 26.6ACP 48 23.1 22.8 -0.3 -1 23.3 23.7CP 11 14.2 14.0 -0.2 0 14.3 14.5Unleveled Courses 0 0.0 0.0 0.0 0 0.0 0.0Special Ed., etc.* 34 10.7 10.6 -0.1 -1 10.8 11.0Total 129 19.9 19.6 -0.3 -2 20.1 20.4Total Minus Special Ed., etc. 95 23.2 22.9 -0.3 -1 23.4 23.8

TABLE 23PROJECTED FUTURE CLASS SIZES FOR 5 ACADEMIC
*Includes special education, special program, ELL, MCAS, classroom aides, work study, and independent study courses.
**The table above assumes that future enrollment patterns in departmental courses will mirror enrollment patterns for 2018-2019 and that the future number of sections offered will be the same as 2018-2019. This information is intended for planning purposes only and does not reflect future staffing patterns.
- 66
Newton South High School
Curriculum Level N Sections (2018-19)
Current Avg. Class Size (2018-19)
2019-20Projected Average Class Size
Change in Average
Class Size
Change in Sections
Required to Maintain
Current Avg.Class Size
2020-21Projected Average Class Size
2021-22Projected Average Class Size
All 5 SubjectsH 122 23.7 24.3 0.6 3 23.7 23.7ACP 253 22.5 23.0 0.5 6 22.5 22.5CP 33 13.2 13.5 0.3 1 13.2 13.2Unleveled Courses 0 0.0 0.0 0.0 0 0.0 0.0Special Ed., etc.* 142 4.3 4.4 0.1 3 4.3 4.3Total 550 17.5 17.9 0.4 13 17.5 17.5Total Minus Special Ed., etc. 408 22.1 22.6 0.5 10 22.1 22.1
EnglishH 23 21.2 21.7 0.5 1 21.2 21.2ACP 55 22.0 22.6 0.5 1 22.0 22.0CP 6 13.0 13.3 0.3 0 13.0 13.0Unleveled Courses 0 0.0 0.0 0.0 0 0.0 0.0Special Ed., etc.* 33 5.5 5.7 0.1 1 5.5 5.5Total 117 16.8 17.2 0.4 3 16.8 16.7Total Minus Special Ed., etc. 84 21.2 21.7 0.5 2 21.2 21.1
World LanguagesH 21 21.8 22.3 0.5 1 21.8 21.8ACP 44 22.1 22.6 0.5 1 22.1 22.1CP 4 13.5 13.8 0.3 0 13.5 13.5Unleveled Courses 0 0.0 0.0 0.0 0 0.0 0.0Special Ed., etc.* 10 1.4 1.4 0.0 0 1.4 1.4Total 79 19.0 19.4 0.5 2 19.0 18.9Total Minus Special Ed., etc. 69 21.5 22.0 0.5 2 21.5 21.5
ScienceH 26 24.1 24.7 0.6 1 24.1 24.1ACP 54 22.7 23.2 0.5 1 22.7 22.6CP 10 12.7 13.0 0.3 0 12.7 12.7Unleveled Courses 0 0.0 0.0 0.0 0 0.0 0.0Special Ed., etc.* 29 1.6 1.6 0.0 1 1.6 1.6Total 119 17.0 17.4 0.4 3 17.0 17.0Total Minus Special Ed., etc. 90 22.0 22.5 0.5 2 22.0 21.9
History & Social ScienceH 24 25.0 25.6 0.6 1 25.0 24.9ACP 53 23.0 23.5 0.6 1 23.0 23.0CP 4 11.3 11.5 0.3 0 11.3 11.2Unleveled Courses 0 0.0 0.0 0.0 0 0.0 0.0Special Ed., etc.* 19 5.2 5.3 0.1 0 5.2 5.2Total 100 19.6 20.1 0.5 2 19.6 19.6Total Minus Special Ed., etc. 81 23.0 23.5 0.6 2 23.0 23.0
MathematicsH 28 25.9 26.5 0.6 1 25.9 25.8ACP 47 22.7 23.2 0.5 1 22.7 22.6CP 9 14.6 14.9 0.4 0 14.6 14.5Unleveled Courses 0 0.0 0.0 0.0 0 0.0 0.0Special Ed., etc.* 51 5.4 5.5 0.1 1 5.4 5.4Total 135 16.3 16.6 0.4 3 16.3 16.2Total Minus Special Ed., etc. 84 22.9 23.4 0.6 2 22.9 22.8