€¦ · web viewword count: 3860 abstract:
TRANSCRIPT

Urinary peptidomics in a rodent model of diabetic nephropathy highlights epidermal
growth factor as a biomarker for renal deterioration in patients with type 2 diabetes
1,2Boris B. Betz, 3Sara J. Jenks, 4Andrew D Cronshaw, 5Douglas J. Lamont, 6Carolynn Cairns, 7Jonathan
R. Manning, 8Jane Goddard, 9David Webb, 10John J. Mullins, 1,8Jeremy Hughes, 3Stella McLachlan,
10Mark W.J. Strachan, 3Jackie F. Price, 6,8Bryan R. Conway
1Centre for Inflammation Research, University of Edinburgh
2Institute of Clinical Chemistry and Laboratory Medicine, Jena University Hospital
3Centre for Population Health Sciences, University of Edinburgh
4Proteomics Facility, University of Edinburgh
5Proteomics Facility, College of Life Sciences, University of Dundee
6Centre for Cardiovascular Science, University of Edinburgh
7Centre for Regenerative Medicine, University of Edinburgh
8Department of Renal Medicine, Royal Infirmary, Edinburgh
9Clinical Pharmacology Unit, University of Edinburgh
10Metabolic Unit, Western General Hospital, Edinburgh
Corresponding author
Bryan Conway
Room W3.06,
Centre for Cardiovascular Science,
Queen’s Medical Research Institute,
University of Edinburgh
EH16 4TJ
E-mail: [email protected]
Tel: +44(0)131 2426691; FAX: +44(0)131 2426779
Word count: 3860 Abstract: 1385 characters

Abstract
Many diabetic patients suffer from declining renal function without developing albuminuria. To
identify alternative biomarkers for diabetic nephropathy (DN) we performed urinary peptidomic
analysis in a rodent model in which hyperglycaemia and hypertension synergise to promote renal
pathological changes consistent with human DN. We identified 297 increased and 15 decreased
peptides in the urine of DN rats compared with controls, including peptides derived from proteins
associated with DN and novel candidate biomarkers. We confirmed by ELISA that one of the parent
proteins, urinary epidermal growth factor (uEGF), was more than x2-fold reduced in DN rats in
comparison with controls. To assess the clinical utility of urinary EGF we examined renal outcomes in
642 participants from the Edinburgh Type 2 Diabetes Study (ET2DS) who were normoalbuminuric
and had preserved renal function at baseline. After adjustment for established renal risk factors, a
lower uEGF:creatinine ratio was associated with new-onset eGFR <60 ml/min/1.73m2 (OR 0.48;
95%CI [0.26-0.90]), rapid (>5% per annum) decline in renal function (OR 0.44; 95%CI [0.27-0.72]) or
the composite of both outcomes (OR 0.38; 95%CI [0.24-0.62]). The utility of low uEGF:creatinine
ratio as a biomarker of progressive decline in renal function in normoalbuminuric patients should be
assessed in additional populations.
Keywords: peptidomics; diabetic nephropathy; epidermal growth factor
Introduction
Diabetic Nephropathy (DN) remains the single-most common cause of end-stage renal disease
(ESRD) in the western world 1. Furthermore, the development of nephropathy in patients with
diabetes confers an increased risk of mortality 2. Albuminuria is an established biomarker in DN,
indicating increased risk for progressive renal failure and mortality 3, 4, however not all patients with
albuminuria develop renal impairment. Conversely, not all patients with impaired renal function
have concomitant albuminuria, particularly those with type 2 diabetes. For example, in the
Edinburgh Type 2 Diabetes Study (ET2DS), a representative cohort of patients with type 2 diabetes
aged 60-75 years in the Lothian region of Scotland, of the 24% of patients with estimated glomerular
filtration rate (eGFR) <60ml/min/1.73m2, 74% were normoalbuminuric 5. Considering these
shortcomings and the prevalence of DN world-wide, there is an urgent need for reliable markers that
can predict the risk of renal failure in patients with diabetes, thereby enabling individualisation of
therapy.
Rodent models can be a useful source of biomarkers for human disease. For example, kidney injury
molecule-1 (KIM-1) was first identified by non-biased screening of a rodent model of ischemia-
reperfusion injury and subsequently confirmed in human disease 6. However, classical rodent models
of DN display only the earliest stages of human disease 7and consequently have limited translational
potential for the detection of biomarkers 8. To overcome this limitation, our lab recently developed a
rodent model in which induction of hyperglycaemia and renin-dependent hypertension in
Cyp1a1mRen2 rats synergise to promote transcriptomic and pathological changes characteristic of
moderately advanced human DN 5.
In the current study, we firstly assessed whether profiling of the urinary peptidome in the
Cyp1a1mRen2 model could identify candidate biomarkers of DN. Secondly, we wished to assess
whether one of the candidates identified by this approach, urinary epidermal growth factor (uEGF)
that has been recently demonstrated to be a predictive marker for progression of CKD 9, could be

used to identify patients with type 2 diabetes and normoalbuminuria who were at risk of rapid loss
of renal function and incident stage III chronic kidney disease (CKD).
Results
Urinary peptidomics identifies potential markers of DN
To identify potential biomarkers of DN in a rodent model, we performed peptidomic analysis on
urine from control rats and from rats following induction of hyperglycaemia alone (DM),
hypertension alone (HTN) or a combination of both hyperglycaemia and hypertension (DM+HTN) for
28 weeks. The pathophysiological features of the model have been published previously 5. In brief,
renin-dependent hypertension and hyperglycaemia synergized to produce massive albuminuria
(Table 1) and marked glomerulosclerosis and tubulointerstitial fibrosis (Figure 1a and 1b)5.
Virtual principal components (PC) were calculated by the program Progensis QI from all detected
peptides to assess quality control and identify outliers. PC analysis of the urinary peptidomics
demonstrated clustering of samples within each group with urine from DM+HTN animals segregating
clearly from normal controls and from animals that were hypertensive or diabetic alone (Figure 2).
This was consistent with our previous study where a combination of hyperglycaemia and
hypertension was required to produce robust changes in renal gene expression that were
representative of those observed in the kidneys of patients with DN 5. Hence for further analysis, we
focused on the differences in the peptidome in the DM+HTN animals compared with controls.
Altogether 1165 urinary peptide sequences were identified with 1142 peptides detected in both the
control and DM+HTN animals. Volcano plot analysis demonstrated that the majority of peptides
exhibited increased abundance in the HTN+DM group compared with controls, of which 297
peptides were significantly increased (p<0.01, Figure 3). Only 15 peptides were of significantly lower
abundance in comparison to the control group. Table 2 lists key peptide sequences that were
increased (Table 2a) or decreased (Table 2b) including the corresponding protein of origin. The
complete list of peptide sequences detected can be found in the supplementary table 1. The list of
peptide sequences increased in the urine of DM+HTN animals included many serum proteins
(Apolipoprotein, albumin, Plasminogen, alpha-2-HS-glycoprotein, haptoglobin), indicating that many
of the peptides are likely to be derived from increased passage across a damaged glomerular
filtration barrier. However, other molecules detected in the peptidomic analysis were also found to
be similarly up-regulated (complement C3, osteopontin, collagen type 1 alpha-1 chain, and clusterin)
or down-regulated (epidermal growth factor) at a gene expression level by microarray analysis of the
kidneys of DM+HTN rats 5 or in patients with DN 10 11 (www.nephromine.org) compared with
respective controls (annotated in Table 2).
Reduced renal EGF expression and urinary EGF concentration in DM+HTN animals
We elected to focus on urinary epidermal growth factor (uEGF) for further investigation as it was
uniquely the only down-regulated peptide in the peptidomic analysis that exhibited corresponding
reductions in renal gene expression on microarray analysis in both the rodent model5 (confirmed by
real-time PCR, Figure 4A) and in human disease10. ELISA analysis determined that a significant
reduction in urinary EGF excretion was apparent by eight weeks after onset of diabetes and
hypertension (Figure 4B). Immunohistochemistry demonstrated a focal reduction in EGF protein
expression specifically in injured (kidney injury molecule-1+) and atrophic tubules in DM+HTN rats
(Figure 5).
uEGF correlates with baseline renal function
To determine whether urinary EGF could act as a biomarker in patients with type 2 diabetes who
have no clinical evidence of renal dysfunction, we used urine specimens from 642 (out of 1076, 60%)
participants from the Edinburgh Type 2 Diabetes Study who had preserved renal function (eGFR > 60
ml/min per 1.73m2) and were normoalbuminuric (albumin:creatinine ratio (ACR)<2.5 mg/mmol in
males and 3.5 mg/mmol in females) at baseline. The baseline characteristics of these subjects

stratified by uEGF tertiles are supplied in table 3. Renal function correlated significantly, but weakly
with uEGF:creatinine ratio (uEGF/Cr, r=0.11, p<0.01) while a greater proportion of patients in the
highest tertile of uEGF/Cr had ACR >0.5 mg/mmol. To assess whether these associations were also
observed in other renal diseases, we quantified uEGF/Cr in a separate cohort of non-diabetic
patients (n=95) who had a wide range of eGFR and albuminuria (patient characteristics summarised
in Suppl Table 2)12 and determined that uEGF/Cr ratio was positively correlated with eGFR (r=0.71,
p<0.001) and inversely correlated with albuminuria (r=-0.51, p<0.001, Suppl Figure 2).
uEGF is associated with incident eGFR<60ml/min/1.73m2 or rapid decline of renal function
During the follow-up period in the ET2DS, 133 patients (21%) exhibited a rapid decline in eGFR (>5%
per annum) and 91 of the 642 patients (14%) developed eGFR<60ml/min/1.73m2. Altogether 161
(25%) participants developed either outcome. When we stratified patients according to whether or
not they developed the composite endpoint, there were significant differences in the baseline
characteristics between the groups including renal function (GFR), age, sex, systolic blood pressure
duration of diabetes, HbA1c, ACR and uEGF. (Table 4). Results were similar when stratification was
performed for either endpoint alone (Supplement Tables 3 and 4).
Kaplan-Meier analysis demonstrated that patients in the tertile with lowest uEGF concentration at
baseline had a significantly higher risk (p=0.003) of developing an eGFR<60ml/min/1.73m 2 during
the follow-period while an ACR was not a useful prognostic indicator (Figure 6).
Logistic regression was used to investigate the association between Log(uEGF/Cr) ratio and
progression of renal disease. The unadjusted odds ratios of Log(uEGF/Cr) for incident
eGFR<60ml/min/1.73m2, rapid decline in renal function or a combination of either endpoint were
0.48 (95% confidence interval [CI], 0.30–0.80), 0.54 (95% CI, 0.35–0.84) and 0.45 (95% CI, 0.30–0.68)
respectively (Table 5). These associations remained significant following adjustment for baseline

characteristics (eGFR, age, gender, ACR(categorized), HbA1c, duration of diabetes, systolic and
diastolic blood pressure).
We analysed the area under the receiver operating curve (AUC-ROC) for the individual and combined
renal outcomes using a panel of established risk factors (reference panel) including: age, gender,
eGFR, ACR, duration of diabetes, HbA1c, systolic and diastolic blood pressure (Table 6). The addition
of uEGF/Cr ratio resulted in a small increase in AUC-ROC compared to the reference panel (Table 6),
which did not reach significance (p=0.07 for combined end-point).
Discussion
In the current study, we characterised the urinary peptidome in an innovative rodent model of
moderately advanced DN to identify candidate disease biomarkers. We determined that whilst the
urinary excretion of many peptides was greater in diabetic and hypertensive animals compared with
controls, amongst the few peptides at lower concentration were those derived from EGF. In a large
cohort of patients with type 2 diabetes but without albuminuria or a reduction in renal function, low
urinary EGF concentration was associated with increased risk for rapid loss of renal function or
incident stage 3 CKD independent from classical risk factors.
To the authors’ knowledge there is only one other study addressing urinary low-molecular weight
proteomics/peptidomics in an animal model of DN. 8 Although this study employed Zucker diabetic
rats, there was a significant overlap in the identity of most parent proteins between this study and
our own, including collagen alpha-1 and alpha-2 chains, osteopontin, apolipoproteins, complement
component C3 and albumin. Explanations for the incomplete overlap of peptides/proteins detected
may include: differences in sample processing, mode of detection (LC-MS/MS vs capillary
electrophoresis coupled MS) and biological variation between the DN models.

A major advantage of using the Cyp1a1mRen2 rat model is that we have access to archived
microarray analysis of the gene expression profile in the kidneys of these rats. Hence we can
compare the urinary excretion of peptides of interest with the corresponding renal gene expression.
When altered urinary excretion of these peptides is concordant with altered renal expression of the
corresponding genes, it may, at least in part, be that this reflects altered production from the injured
kidney per se and may be informative regarding the activity of intrinsic renal pathological pathways.
We focused on EGF for further investigation for a number of reasons. Firstly, we hypothesised that
biomarkers that are down-regulated may be more likely to reflect intrinsic renal pathophysiology, as
up-regulated peptides are more likely to be due to increased passage across a damaged glomerular
filtration barrier, and hence may not add significant prognostic value to albuminuria. In support of
this hypothesis, we observed a concordant reduction in EGF gene expression in the kidneys of
diabetic and hypertensive Cyp1a1mRen2 rats compared with controls, as has previously been
reported for diabetic mRen-2 rats 13. This is consistent with the focal reduction in EGF expression in
atrophic and injured (KIM-1+) tubules that we observed in the diabetic and hypertensive
Cyp1a1mRen2 rats. This suggests that uEGF may be a biomarker of healthy tubular mass and indeed
EGF may be important in maintaining tubular cell health10. Secondly, consistent with the results from
Cyp1a1mRen2 animal model and other DN models8 or rodent models of reduced renal mass14, a
reduction in renal gene and protein EGF expression has also been observed in the renal
tubulointerstitium in patients with DN 10 11 9
We found a weakly positive correlation of uEGF/Cr ratio and baseline eGFR in patients with
preserved renal function in the ET2DS, and a much stronger correlation in a separate cohort of
patients with non-diabetic CKD across a broader range of renal function, and these findings are in
keeping with the results of previous studies 9, 15-20. uEGF/Cr ratio has recently been demonstrated to
predict rapid decline of renal function and ESRD in three independent cohorts of patients with
moderately advanced CKD9, however these cohorts included only a minority of patients with DN. We
elected to study more than six hundred patients with type 2 diabetes from the EdT2DS who had

preserved renal function (eGFR>60 mL/min/1.73 m2) and were normoalbuminuric at baseline as it is
particularly difficult to predict renal outcomes in this subgroup. Indeed, it is known that
albuminuria and decline in renal function can be uncoupled phenotypes in T2D21, therefore
additional prognostic biomarkers are required.
We performed Kaplan Meier analysis and determined that those in the lowest tertile of uEGF/Cr
ratio were at higher risk of incident eGFR<60ml/min/1.73m2.Furthermore, in binary logistic
regression analysis we determined that the uEGF/Cr ratio was associated with the combined
outcome of incident CKD or rapid decline in renal function. However, the baseline characteristics of
those who progressed were significantly different to non-progressors. Indeed, the lower baseline
eGFR in progressors raises the possibility that the association between uEGF/Cr ratio and renal
outcome may be explained by the weak, but significant correlation between uEGF/Cr and baseline
eGFR. Therefore we performed multivariate analysis and determined that the association between
uEGF/Cr ratio and renal outcome remained significant even after adjustment for age, sex, HbA1c,
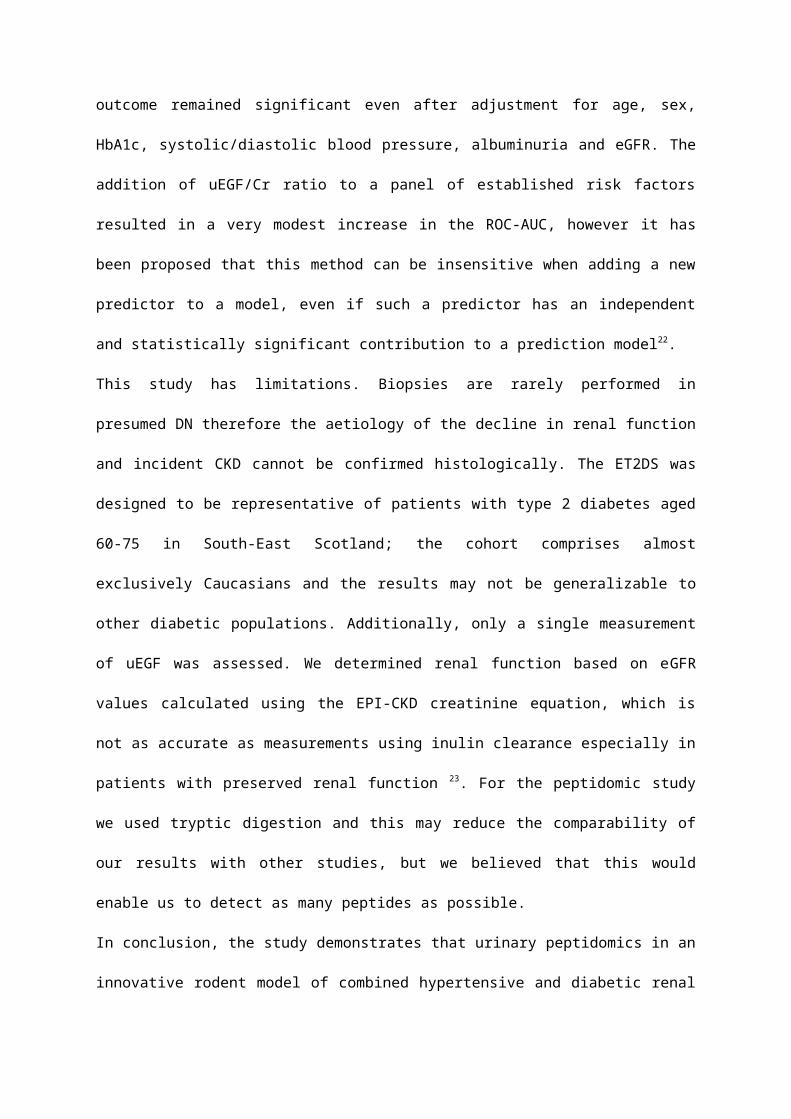
systolic/diastolic blood pressure, albuminuria and eGFR. The addition of uEGF/Cr ratio to a panel of
established risk factors resulted in a very modest increase in the ROC-AUC, however it has been
proposed that this method can be insensitive when adding a new predictor to a model, even if such
a predictor has an independent and statistically significant contribution to a prediction model22.
This study has limitations. Biopsies are rarely performed in presumed DN therefore the aetiology of
the decline in renal function and incident CKD cannot be confirmed histologically. The ET2DS was
designed to be representative of patients with type 2 diabetes aged 60-75 in South-East Scotland;
the cohort comprises almost exclusively Caucasians and the results may not be generalizable to
other diabetic populations. Additionally, only a single measurement of uEGF was assessed. We
determined renal function based on eGFR values calculated using the EPI-CKD creatinine equation,
which is not as accurate as measurements using inulin clearance especially in patients with
preserved renal function 23. For the peptidomic study we used tryptic digestion and this may reduce

the comparability of our results with other studies, but we believed that this would enable us to
detect as many peptides as possible.
In conclusion, the study demonstrates that urinary peptidomics in an innovative rodent model of
combined hypertensive and diabetic renal damage provides an attractive source for biomarker
discovery. A low uEGF:creatinine ratio is associated with rapid decline in renal function and incident
CKD independent of standard risk factors. The validity of using uEGF levels to risk stratify patients
with diabetes who have no evidence of kidney disease should be assessed in other populations
including those with type 1 diabetes.
Materials and methods
Experimental setting
The Cyp1a1mRen2 model has been described in detail recently5. In summary, hyperglycaemia and
hypertension were induced in isolation or combination in adult male Cyp1a1ren2 rats by intravenous
administration of 20mg/kg streptozotocin and/or activation of the murine renin2 transgene by
dietary supplementation with 0.125% indole-3-Carbinol (I-3-C) to bind to the Cyp1a1 promoter. After
28 weeks, 24hr urine was collected in metabolic cages, spun at 500g for 10min to remove debris and
the supernatant was frozen at -80C until analysis. All procedures were performed under a UK Home
Office license and approved by the Ethics Committee at the University of Edinburgh.
Urine Sample Preparation and Mass Spectrometry Analysis
5% of the total 24hr urinary volume was placed in Millipore Amicon Ultra-4 spin concentrators
(Millipore, Billerica, MA) with a 10kD cut-off cellulose membrane and spun at 3220g for 15 minutes
at 4C. Ultrafiltrate containing peptides and low-molecular weight (LMW) proteins was acidified with
5% trifluoroacetic acid (TFA), loaded onto a C8 StageTip 24 and centrifuged at low speed (500-2000g)
for 1-5min, until no residual sample remained upstream of the tip. Acetonitrile (80% in H2O) was
used to elute the peptides by centrifugation. The effluent was dried to remove acetonitrile,
resuspended in 50mM ammonium bicarbonate and reduced in 5mM dithiothreitol at 60°C for 15
min. After cooling to room temperature samples were alkylated with iodoacetamide (15 mM) for 15
minutes in the dark. Proteolytic digestion was performed by incubating with trypsin (2.5ng/l)
overnight at 32°C. The rationale of using trypsin was our goal to detect the broadest spectrum of
possible biomarker candidates. We were concerned that in the absence of trypsin high molecular
weight peptides and small proteins at approximately 10kD might not fly and fragment in the
instrument and be difficult to detect by LC-MS/MS25. Directly prior to MS-Analysis, digested material
was loaded on a C18 StageTip and the final volume eluted in Acetonitrile and reduced by vacuum
evaporation 26.
A volume of 5ul of the sample was loaded onto an Ultimate 3000 Series HPLC (Dionex) with a PicoTip
Emitter (FS 360-100-8-N-20-C12, New Objective) in series with an LTQorbitrap mass spectrometer
(ThermoScientific). The PicoTip Emitter was packed with Reprosil-Pur C18-AQ 3um (Dr Maisch
GmbH) to a length of 6.5-7.5cm. The PicoTip column was equilibrated with solvent A (0.5% acetic
acid in 5% acetonitrile) and eluted with a linear gradient, from 0%B for 9min; from 0 to 20%B over 9
to 40min; from 20 to 80%B over 40 to 48min; solvent B (0.5% acetic acid in 99.5% acetonitrile), over
65min at a flow rate of 0.7ul/min for the first 9min and 0.3ul/min thereafter. Data dependent
acquisition was controlled by Xcalibur software (ThermoScientific).
Data analysis
Data analysis was performed using Progenesis QI software (version 4.0, Nonlinear Dynamics Limited,
Newcastle upon Tyne, UK) and the MASCOT search engine (Matrix Science, London, UK) 27. The raw
LC-MS/MS data were imported into Progenesis software and visually checked for defects. One of the
DM+HTN samples was selected as a reference and all other ion intensity maps were aligned to it
using the ‘Automatic Alignment’ function in the software with manual corrections applied where
necessary. After all the runs were aligned with the reference, the peptide ions with charge states 2+
to 5+ were selected. The sample files were transferred to the MASCOT search engine
(www.matrixscience.com – in-house installation on the server of the Fingerprints Proteomics

Facility, University of Dundee) for peptide identification. The search was performed against the
Rattus norvegicus Uniprot database, version 2013, which contains 37202 sequences.
The search was not restricted by tryptic cleavage in order not to lose natural peptides. Further
search criteria were: peptide tolerance of 6ppm, and the allowed modifications were
Carbamidomethyl, Dioxidation, Gln>pyro-Glu and Oxidation. Data were also searched against a
decoy database. The false discovery rate for matches above the identity threshold was 0.84% and for
matches above the identity or the homology threshold was 4.12%. MS/MS spectra of the top five
‘ranks’ for each feature were exported to the MASCOT search engine. Using the peptide score
distribution from the MASCOT search results, peptides below an ion score threshold of 50
(corresponding to p-value 0.05) were discarded. The filtered MASCOT search results were re-
imported into the Progenesis QI software. Only the peptides with at least three hits were retained
for further analysis. The differences in peptide intensity between sample groups were calculated by
the ANOVA test in Progenesis QI software. The threshold for the p-value was set at 0.01 and q-value
was calculated to control for false positive p-values. We used a q-value threshold of <0.05 implying
that 5% of significant tests will result in false positives. (see Suppl Fig 1 for flow diagram of analytic
approach).
Immunohistochemistry
Staining was performed on 4M paraformaldehyde fixed, paraffin-embedded rat kidney sections.
Staining for periodic acid-Schiff and picrosirius red was performed according to standard protocols.
After antigen retrieval (boiling for 15min in sodium citrate buffer), goat-anti EGF (1:25, Santa Cruz,
Texas, USA) or goat anti-KIM-1 (1:50, R+D Systems, Minneapolis, MN) primary antibodies were
incubated overnight at 4C followed by an anti-goat, biotinylated secondary antibody (1:300, Vector
Labs, Peterborough, UK) and developed using the Vector ABC kit and DAB.
Gene expression
RNA was extracted from the renal cortex of each animal using Nucleospin RNA II kit (Macherey-
Nagel, Duren, Germany), reverse transcribed (Applied Biosystems High Capacity cDNA Reverse
Transcription Kit, Life Technologies, Paisley, UK) and relative expression of EGF determined by real-
time PCR using inventoried Taqman gene expression assay kits (Life Technologies) for EGF
(Rn00563336) and the housekeeping gene (TATA-binding protein: Rn01455648_m1).
ELISA
For rodent and human specimens, we used enzyme-linked immunosorbent EGF assay kits (DY3689
and DY1756, respectively, R&D systems). In rats, the urinary EGF was expressed as amount excreted
in 24h hours, while in humans the uEGF concentration was corrected by reference to the urinary
creatinine concentration.
Edinburgh Type 2 Diabetes Cohort
We used specimen from 642 patients from the EdT2DS who had no evidence of kidney disease at
baseline (eGFR > 60 ml/min/1.73m2 and ACR<2.5 mg/mmol in males and <3.5 mg/mmol in females).
The detailed study protocol has been published previously 28. Briefly, at the baseline clinic visit all
participants underwent venepuncture and provided an early morning urine sample. From the urine
samples albumin and creatinine concentrations were determined and from the venous blood
sample, HbA1c and isotope dilution mass spectrometry–traceable serum creatinine levels were
measured according to standard protocols in the Department of Biochemistry, Western General
Hospital, Edinburgh, UK. The CKD-EPI equation was employed for estimating GFR. Urine was frozen
at -20C. Subjects were invited to re-attend the research clinic 4 years after their initial visit. For
persons who did not attend the follow-up appointment, the Lothian laboratory database was
interrogated to estimate GFR by the CKD-EPI equation, based on the isotope dilution mass
spectrometry–traceable serum creatinine concentration at their last outpatient clinic visit. In this
way, we excluded rises in creatinine occurring as a result of an acute illness. The rate of change in
renal function was determined by subtracting the Year 4 eGFR (or last outpatient eGFR for those not
attending the Year 4 visit) from the baseline eGFR, and dividing by the time between
measurements5. To determine incident eGFR <60 ml/min/1.73m2 and new-onset albuminuria we
obtained all outpatient results during follow-up using the Lothian laboratory database. Only those
who had eGFR <60 ml/min/1.73m2 or ACR: >2.5mmol/l (>3.5mmol/l for females) on 2 out of 3
consecutive samples were recorded as meeting end-points. Primary outcomes were new onset
eGFR<60ml/min/1.73m2, rapid decline in renal function (>5% per year) or a combination of both
end-points.
All the study participants gave their informed consent and ethics permission was obtained from the
Lothian Medical Research Ethics Committee.
Non-diabetic CKD cohort
In addition, we determined uEGF/Cr ratios in archived urine samples from a cohort of patients
(n=95) with non-diabetic CKD from a study which has been described previously12. In brief, this study
was designed to assess factors influencing vascular dysfunction across a wide range of renal function
and the baseline patient characteristics are given in Suppl table 2.
Statistical analysis
Data are means (±standard deviation) and medians (interquartile range) for parametric and non-
parametric data, respectively. Differences between groups were assessed by 2-test for categorical
variables and for parametric data by t-test or ANOVA and non-parametric data by Mann-Whitney or
Kruskal-Wallis. For regression analysis uEGF:creatinine was log transformed. As most (73%)
measurements of ACR were <0.5mg/mmol we categorised ACR values as: <0.5mg/mmol and 0.5-
1mg/mmol, and 1-2.5mg/mmol (males) or 1-3.5mg/mmol (females). For logistic regression analysis
ACR was transformed in log(ACR)+1. Associations between baseline characteristics including
log(urinary EGF:creatinine) and outcomes were determined by univariable and multivariable binary
logistic regression models. The baseline characteristics for the multivariable model were age,
gender, systolic & diastolic blood pressure, HbA1c, duration of diabetes, log(ACR)+1 and eGFR.
Unless explicitly stated otherwise in the text, two-sided P-values < 0.05 were considered significant
for statistical procedures. AUC-ROC curves were calculated using Medcalc version 15.8 (MedCalc

Software, Mariakerke, Belgium). All other statistical analyses were performed with Progenesis QI for
proteomics Software, the SPSS package (SPSS Inc., Chicago, IL, USA) and GraphPad Prism software
(GraphPad Prism Software Inc., San Diego, CA, USA).
Acknowledgements
This research was supported by an Innovation Grant from Kidney Research UK, the Edinburgh and
Lothians Diabetes Research Foundation and the Chief Scientist Office of the Scottish Government.
The ET2DS is funded by the Medical Research Council UK.
Disclosure
None of the authors have any competing interests to disclose in relation to the manuscript
Legend
Tables
Table 1. End-point pathophysiological parameters in control animals (n=10) and in animals subjected
to 28 weeks of hyperglycaemia (n=6), hypertension (n=7) or a combination of diabetes and
hypertension (n=10). *p<0.05, **p<0.01, ***p<0.001 vs control, ###p<0.001 vs diabetes alone, $p<0.05
vs Hypertension alone.
Table 2. Peptides of interest that were either significantly (p<0.01) increased (2A) or decreased (2B)
in the DM+HTN animal group in comparison with controls. *,#Peptides for which the corresponding
genes exhibit similar expression changes in the kidney in the Cyp1a1mRen2 rodent model (*) or in
human renal biopsies (#) compared with respective controls.
Table 3. Baseline characteristics of the study population stratified by urinary EGF:creatinine tertiles.
Comparison by2 , Kruskal–Wallis test or ANOVA
Abbreviations: EGF, epidermal growth factor; eGFR, estimated glomerular filtration rate;
albumin:creatinine ratio (ACR).
Table 4. Baseline characteristics of the study population stratified by the combination of the
outcomes incident eGFR<60ml/min/1.73m2 or rapid decline of renal function. Comparison by2 , t-
test or Mann-Whitney test.
Table 5. Unadjusted and adjusted odds ratio (OR, 95% CI) from logistic regression models per 1SD
increase in the log urinary EGF:creatinine ratio in relation to the outcomes incident
eGFR<60ml/min/1.73m2, rapid decline of renal function or the combination of both outcomes. The
following baseline variables were entered into the adjusted model: age, gender, eGFR, logACR+1,

duration of diabetes, HbA1c, systolic and diastolic blood pressure, Abbreviations: OR, odds ratio; CI,
confidence interval; ACR albumin:creatinine ratio; eGFR, estimated glomerular filtration rate.
Table 6. Receiver operating characteristic area under the curves (ROC-AUC) for log(uEGF/Cr), a
reference model (REF) that includes age, gender, eGFR, logACR+1, duration of diabetes, HbA1c,
systolic and diastolic blood pressure. The third model includes in addition to the reference model
log(uEGF/Cr).
Figures
Figure 1. Diabetes and hypertension together promote glomerulosclerosis and tubulointerstitial
fibrosis. (A) Representative images of periodic acid-Schiff staining in the glomeruli from kidneys from
each group. Bars represent 20 M. (B) Representative images of picrosirius red staining of the renal
cortex from each group. Bars represent 100 M.
Figure 2. To visualise similarities and differences in the variation in the global urinary peptide profiles
between animals in each group we performed principal component analysis (PCA). In the plot the
combination of peptides that explains the most variation is denoted as principal component 1 (PC1)
on the x-axis with a second principal component (PC2) on the y-axis. It is important to emphasise
that the principal components are not actual physical variables and PCA is used here as a quality
control to visualise the degree of clustering and identify outliers rather than to analyse the degree of
changes between the groups. Urines from each animal are represented in blue (Control), violet (DM
alone), orange (HTN alone) or green (DM+HTN). It is apparent that urine samples from animals
within the same group cluster together, with samples from the DM+HTN animals clearly segregating
from those from animals with either DM or HTN alone

Figure 3. Volcano plot demonstrates the fold change (log2) in abundance (x-axis) plotted against the
P-value (–log100, y-axis) for urinary peptides from the DM+HTN animal group compared with control
untreated rats. Altogether 1165 peptides were compared. The dotted line represents p=0.01.
Figure 4. (A) Renal cortical EGF mRNA expression was significantly reduced in the DM+HTN animals
compared with control animals ***p<0.001. (B) Serial measurements of the mean (s.e.) excretion
(g/24hrs) of urinary epidermal growth factor (EGF) in DM+HTN rats. *p<0.01 v baseline.
Figure 5. EGF and kidney injury molecule-1 (KIM-1) expression in sequential sections of renal cortex
from control and DM+HTN animals (A) There was focal reduction in EGF protein expression in
tubules in DM+HTN animals (*) (B) The reduced EGF expression was observed principally in injured
(KIM-1+) tubules. Bars represent 100 M.
Figure 6. Kaplan Meier survival curves for incident eGFR<60ml/min/1.73m2 stratified according to (A)
tertiles of uEGF/Cr ratio or (B) baseline ACR categories: <0.5. 0.5-0.1, 1-2.5 (male) or 1-3.5mg/mmol
(female).
Supplementary data
Suppl table 1. List of all peptides identified by Mascott-Search, grouped according to
increase/decrease of intensity in DM+HTN group compared to control.
Suppl table 2. Baseline characteristics of a separate cohort of 95 patients with non-diabetic CKD.
Values are means (±SD) or median (IQR). APKD: adult polycystic kidney disease, FSGS: focal
segmental glomerulosclerosis; ACR: albumin:creatinine ratio; uEGF/Cr: urinary epidermal growth
factor:creatinine ratio. Other causes of CKD include: mesangial proliferative glomerulonephritis
(n=2), cysteinuria (n=2), medullary sponge kidney (n=2), congenitally absent kidney (n=2), Alport’s

syndrome (n=1); thin basement membrane disease (n=1). Unknown include those with microscopic
haematuria (n=12) or low grade proteinuria (n=3) who were not biopsied.
Suppl table 3. Baseline characteristics of the study population stratified by the outcome of rapid
decline of renal function. Comparison by2 , t-test or Mann-Whitney test. $ Number or patients (%)
in categories of ACR <0.5mg/mmol , 0.5-1mg/mmol , 1- 2.5mg/mmol (males) or 3.5mg/mmol
(females).
Suppl table 4. Baseline characteristics of the study population stratified by the by the outcome of
incident eGFR<60ml/min/1.73m2. Comparison by2 , t-test or Mann-Whitney test. $ Number or
patients (%) in categories of ACR <0.5mg/mmol , 0.5-1mg/mmol , 1- 2.5mg/mmol (males) or
3.5mg/mmol (females).
Suppl Figure 1. Flow-Chart of the analytical procedure to exclude non-relevant features/peptides
using Progenesis/Maxquant software including the numbers of features/peptides at each step.
Suppl Figure 2. Correlation between uEGF:creatinine ratio and (A) eGFR and (B)
albuminuria:creatinine ratio.

References
1. Eggers PW. Has the incidence of end-stage renal disease in the USA and other countries stabilized? Curr Opin Nephrol Hypertens 2011; 20: 241-245.
2. Lind M, Svensson AM, Kosiborod M, et al. Glycemic control and excess mortality in type 1 diabetes. N Engl J Med 2014; 371: 1972-1982.
3. Keane WF, Brenner BM, de Zeeuw D, et al. The risk of developing end-stage renal disease in patients with type 2 diabetes and nephropathy: the RENAAL study. Kidney Int 2003; 63: 1499-1507.
4. Gerstein HC. Diabetes and the HOPE study: implications for macrovascular and microvascular disease. International journal of clinical practice Supplement 2001: 8-12.
5. Conway BR, Rennie J, Bailey MA, et al. Hyperglycemia and renin-dependent hypertension synergize to model diabetic nephropathy. Journal of the American Society of Nephrology : JASN 2012; 23: 405-411.
6. Ichimura T, Bonventre JV, Bailly V, et al. Kidney injury molecule-1 (KIM-1), a putative epithelial cell adhesion molecule containing a novel immunoglobulin domain, is up-regulated in renal cells after injury. The Journal of biological chemistry 1998; 273: 4135-4142.
7. Brosius FC, 3rd, Alpers CE, Bottinger EP, et al. Mouse models of diabetic nephropathy. Journal of the American Society of Nephrology : JASN 2009; 20: 2503-2512.
8. Siwy J, Zoja C, Klein J, et al. Evaluation of the Zucker diabetic fatty (ZDF) rat as a model for human disease based on urinary peptidomic profiles. PLoS One 2012; 7: e51334.
9. Ju W, Nair V, Smith S, et al. Tissue transcriptome-driven identification of epidermal growth factor as a chronic kidney disease biomarker. Science translational medicine 2015; 7: 316ra193.
10. Lindenmeyer MT, Kretzler M, Boucherot A, et al. Interstitial vascular rarefaction and reduced VEGF-A expression in human diabetic nephropathy. J Am Soc Nephrol 2007; 18: 1765-1776.
11. Woroniecka KI, Park AS, Mohtat D, et al. Transcriptome analysis of human diabetic kidney disease. Diabetes 2011; 60: 2354-2369.
12. Lilitkarntakul P, Dhaun N, Melville V, et al. Blood pressure and not uraemia is the major determinant of arterial stiffness and endothelial dysfunction in patients with chronic kidney disease and minimal co-morbidity. Atherosclerosis 2011; 216: 217-225.
13. Kelly DJ, Cox AJ, Tolcos M, et al. Attenuation of tubular apoptosis by blockade of the renin-angiotensin system in diabetic Ren-2 rats. Kidney Int 2002; 61: 31-39.
14. Thulesen J, Jorgensen PE, Torffvit O, et al. Urinary excretion of epidermal growth factor and Tamm-Horsfall protein in three rat models with increased renal excretion of urine. Regul Pept 1997; 72: 179-186.
15. Torffvit O, Jorgensen PE, Kamper AL, et al. Urinary excretion of Tamm-Horsfall protein and epidermal growth factor in chronic nephropathy. Nephron 1998; 79: 167-172.
16. Lev-Ran A, Hwang DL, Miller JD, et al. Excretion of epidermal growth factor (EGF) in diabetes. Clin Chim Acta 1990; 192: 201-206.
17. ter Meulen CG, Bilo HJ, van Kamp GJ, et al. Urinary epidermal growth factor excretion is correlated to renal function loss per se and not to the degree of diabetic renal failure. Neth J Med 1994; 44: 12-17.
18. Kawaguchi M, Kamiya Y, Ito J, et al. Excretion of urinary epidermal growth factor in non-insulin dependent diabetes mellitus. Life Sci 1993; 52: 1181-1186.
19. Dagogo-Jack S, Marshall SM, Kendall-Taylor P, et al. Urinary excretion of human epidermal growth factor in the various stages of diabetic nephropathy. Clin Endocrinol (Oxf) 1989; 31: 167-173.
20. Mathiesen ER, Nexo E, Hommel E, et al. Reduced urinary excretion of epidermal growth factor in incipient and overt diabetic nephropathy. Diabet Med 1989; 6: 121-126.
21. Retnakaran R, Cull CA, Thorne KI, et al. Risk factors for renal dysfunction in type 2 diabetes: U.K. Prospective Diabetes Study 74. Diabetes 2006; 55: 1832-1839.
22. Cook NR. Statistical evaluation of prognostic versus diagnostic models: beyond the ROC curve. Clin Chem 2008; 54: 17-23.
23. Inker LA, Schmid CH, Tighiouart H, et al. Estimating glomerular filtration rate from serum creatinine and cystatin C. The New England journal of medicine 2012; 367: 20-29.
24. Rappsilber J, Ishihama Y, Mann M. Stop and go extraction tips for matrix-assisted laser desorption/ionization, nanoelectrospray, and LC/MS sample pretreatment in proteomics. Anal Chem 2003; 75: 663-670.

25. Fliser D, Novak J, Thongboonkerd V, et al. Advances in urinary proteome analysis and biomarker discovery. J Am Soc Nephrol 2007; 18: 1057-1071.
26. Ohta S, Bukowski-Wills JC, Sanchez-Pulido L, et al. The protein composition of mitotic chromosomes determined using multiclassifier combinatorial proteomics. Cell 2010; 142: 810-821.
27. Atrih A, Mudaliar MA, Zakikhani P, et al. Quantitative proteomics in resected renal cancer tissue for biomarker discovery and profiling. Br J Cancer 2014; 110: 1622-1633.
28. Price JF, Reynolds RM, Mitchell RJ, et al. The Edinburgh Type 2 Diabetes Study: study protocol. BMC Endocr Disord 2008; 8: 18.