• what is fatigue what is fatigue? - online registration …€¢ subjective and objective...
TRANSCRIPT

9/26/2014
1
Our greatest weariness comes from work not done – Eric Hoffer
John DeLuca, Ph.D.
Senior Vice President for ResearchKessler Foundation
ProfessorPhysical Medicine and Rehabilitation
Neurology and NeurosciencesRutgers-New Jersey Medical School
Recent Discoveries onFatigue: Implications
for Treatment
John DeLuca, Ph.D
No disclosures
Overview
• What is Fatigue– study with caution!
• Cognitive Fatigue• Neuroimaging and Fatigue
What is Fatigue?
Defining Fatigue
• Concept we all know, but difficult to define– Meaning often vague, elusive, difficult to
operationalize• After over 100 years of inquiry, its
definition remains elusive– Some have suggested the term be abandoned
• “The word fatigue has been defined so inconsistently and applied so loosely …that its meaning is now obscure” (Balkin & Wesensten, 2011)

9/26/2014
2
Synonyms of Fatigue
• Tired, worn out, or run down• Feelings of weakness• Exhaustion• Sleepiness• Lack of energy• Malaise• Effort – in relation to a task• Lack of motivation
Differing prevalence for synonyms of Fatigue
• In community surveys, Fatigue found to be:– Twice as common as exhaustion – 10 times more common than feeling
“generally run down”– Up to 10 times more common than
weakness
Wessely et al., 1998, p19
Measuring physical (motor) fatigue
• Schwid et al (1999) in MS examined:– Motor fatigue – loss of maximal capacity to
generate force during exercise– Muscle weakness (strength) – ability to
maintain motor output during• Sustained muscle contractions• Repetitive muscle contractions
Measuring physical (motor) fatigue
Results • MS group showed both motor fatigue and
motor weakness compared to controls• No significant correlation between Motor
fatigue and Weakness (strength) in any muscles tested
• Suggest that motor fatigue and weakness are distinct features of motor dysfunction
(Schwid et al 1999)
What is Fatigue?
“The awareness of a decreased capacityfor physical and/or mental activity due to an imbalance in the availability, utilization, and/or restoration of resources needed to perform activity.” (p46)
“fatigue is the decline in performance that occurs in any prolonged or repeated task…” (Fischler, 1999)
Aronson et al, (1999) Image J Nrs Sch
What is Fatigue?
• “Under fatiguing conditions, performance sometimes declines, sometimes remains unchanged, or sometimes even increases as time on task increases.”
• Decades or research have replicated this finding.
Ackerman, (2011), p.3

9/26/2014
3
Time on Task and Cognitive Fatigue
• 239 college students - 3 SAT’s duration– 3.5 hrs, 4.5hrs (standard), 5.5 hrs
• Subjective fatigue increased with TOT• Performance INCREASED with longer test
length• Personality/motivation/interest had greater
predictive power on subjective fatigue than TOT– Neuroticism, anxiety, worry correlated with
subjective fatigue
Ackerman & Kanfer, 2009
What is Fatigue?• “The conditions of experimentation with the purpose of
finding a fatigue test are two:– That we know what we mean by fatigue;– That we have some method [test] … that different degrees of
fatigue are present at certain different times.
• That the first of these conditions is necessary is self-evident
• It is obviously absurd to set about finding a test of an undefined entity.”
Muscio (1921), “Is a Fatigue Test Possible,”
What is Fatigue?
• “Before a concept can be measured, it must be defined, and before a definition can be agreed, there must exist an instrument for assessing phenomenology. There is unfortunately no ‘gold standard’ for fatigue, nor is there ever likely to be”
Dittner, Wessely, & Brown, 2004, p.166
Mosso’ s Ergograph
Mosso’s Findings (1904)
• Four components to Fatigue:– BEHAVIOR (decrement in performance)– FEELING STATE– MECHANISM– CONTEXT (e.g., stress in one’s life; cultural
issues)• 100 years ago we see the beginning of the
separation of the global fatigue concept into measurable components
What is Fatigue?• “Fatigue is so common as to be almost
normal” (Wessely et al., 1998, p25)
• Poor correlation between FEELING of fatigue and fatigue BEHAVIOR (Mosso 1904; DeLuca 2005)
• What is NOT fatigue?– Depression– Sleepiness– Cognitive fatigue is not equal to cognitive
impairment

9/26/2014
4
Definition of Fatigue in MS
• MS Council for Clinical Practice Guidelines (1998) defines fatigue as:– “A subjective lack of physical and/or mental
energy that is perceived by the individual or caregiver to interfere with usual and desired activities”
Questions• Why should subjective fatigue be the gold
standard?• Why should objective and subjective fatigue
correlate?– They don’t
• Must behavioral changes be a decrease?• Lets face it, subjective fatigue correlates with
other subjective ratings– Depression, pain, subjective sleep,
deconditioning, medication effects, hormonal changes, cognitive complaints, stress
02
46
810
Fat
igue
0 .5 1 1.5 2 2.5 3 3.5 4 4.5 5 5.5 6 6.5 7 7.5 8 8.5 9 9.5 10Pain scale
excludes outside values
Relationship between pain and fatigue
Wolfe, 2005: n=over12,000 with Rheumatic illness
Sleepiness and Fatigue
• Sleepiness and fatigue often used interchangeably
• Thus, sleep findings often extended to fatigue– e.g., disturbed sleep leads to cognitive dysfunction
• Increasing evidence that sleepiness and fatigue arise from distinct neural mechanisms
Sleepiness and Fatigue
• Excessive sleepiness is defined as:“drowsiness or sleep onset that occurs at
inappropriate or undesirable times”• Excessive sleepiness can lead to feelings of
fatigue, but are not synonymous– Excessive sleepiness usual restored with rest– Fatigue is not necessarily restored with rest
• This is important because sleepiness and fatigue may involve different treatments
(Duntley, 2005)

9/26/2014
5
Cognition and Fatigue?
Don’t be fooled!
• Claims of instruments to assess mental vs. physical fatigue (e.g., MFI)– I have been forgetful– I have been less alert– I have difficulty paying attention for long
periods of time– I have trouble concentrating– My thinking has been slowed down
• Typically asses fatigue without defining it• The questions included may have little of
nothing to do with fatigue at all • For example: not clear that patients can
truly differentiate fatigue from:– motor impairment– cognitive impairment– Sleepiness– depression
Self Report Instruments Chalder Fatigue Scale
• Physical symptoms– Do you have a problem with tiredness?– Do you need rest more?– Do you feel sleepy or drowsy?– Do you have problems starting things?– Do you start things without difficulty but get weak as
you go?– Are you lacking in energy?– Do you have less strength in your muscles?– Do you feel weak?
Chalder Fatigue Scale• Mental symptoms
– Do you have difficulty concentrating?– Do you have problems thinking clearly?– Do you make slips of the tongue when
speaking?– Do you find it more difficult to find the correct
word?– How is your memory?– Have you lost interest in things you used to do?
What Does Self-reported Fatigue Predict?
• Stroke– Predicts death at 1 year (Stulemeijer et al, 2005)
– reduced long-term survival (Mead et al, 2011).
– increased risk of “suicidality” (Tang et al, 2011)
– independently associated with pre-stroke• depression• white matter changes• diabetes mellitus• Pain• sleeping disturbances (Naess et al, 2012)

9/26/2014
6
What Does Self-reported Fatigue Predict?
• Coronary heart disease– Independently predict the development of:
• coronary heart disease• risk of future cardiac events• survival following myocardial infarction
– These relationships remain even after controlling for the traditional risk factors
• elevated cholesterol• Hypertension• Smoking• age, etc.
Siegel & Schneiderman, 2005
What Have We Learned About Fatigue in General?
• Systemic Fatigue may differ from factors which exacerbate or perpetuate it– Physical illness (e.g., TBI, MS) may cause initial
symptoms of fatigue• CNS involvement
– Secondary factors exacerbate the primary symptoms• De-conditioning• Sleep disturbance• Depression• etc
What Have We Learned About Fatigue in General?
• Its time to differentiate between– Primary mechanism of fatigue– Factors which mediate or moderate primary
mechanisms
Primary and Secondary Fatigue
• PRIMARY FATIGUE– Systemic mechanism(s) responsible for
fatigue• (i.e., primary neural mechanisms)
• SECONDARY FATIGUE– Factors which exacerbate its effects
• (e.g., Sleep disturbance, de-conditioning, depression, medication, etc)
Cognitive Fatigue

9/26/2014
7
Central or Cognitive fatigue
“the failure to initiate and/or sustain attentional tasks (‘mental fatigue’) and physical activities (‘physical fatigue’) requiring self motivation (as opposed to external stimulation)”
(Chaudhuri & Behan, 2000, p35)
Cognitive performance during high vslow fatigue in MS
• 30 fatigued MS patients• Cognitive testing during high and low
fatigue (within subjects design)
• Results:– No differences in objective performance– Subjectively rated performance as worse
during high fatigue
(Parmenter et al, 2000)
Objective measurement of cognitive fatigue
• Cognitive Fatigue over an extended time• Cognitive Fatigue DURING sustained
mental effort• Cognitive fatigue AFTER challenging
mental exertion• Cognitive fatigue AFTER challenging
physical exertion
1. Cognitive Fatigue over an extended time
• Cognitive testing over several hours• No difference in performance between MS or
TBI and controls– Jennekens-Schinkel et al., 1988 – Johnson et al., 1997– Paul et al., 1998– Riese et al, 1999– Beatty et al., 2003
• In all studies, MS and TBI worse in subjective fatigue
Johnson, Lange, DeLuca et al (1997)
• Examined effects of “induced” fatigue on cognitive performance (PASAT)
• Three fatiguing groups:– MS– CFS– Major Depression
• Also examined subjective fatigue
Johnson, Lange, DeLuca et al (1997)
• PASAT Administered 4 times over 3 hours• Hypothesized fatigue would “blunt”
practice effect• Examined subjective fatigue just prior to
each PASAT session – 0 (none) – 4 (severe) likert scale

9/26/2014
8
Mean PASAT Performance Across SessionsJohnson, Lange, DeLuca et al (1997)
100
120
140
160
180
200
1 2 3 4
HCCFSDEPMS
PASAT Sessions
# correct
Johnson, Lange, DeLuca et al (1997)
• Subjective fatigue higher in the 3 fatigue groups relative to controls
• All 4 groups increased subjective fatigue across 4 sessions
• No significant relationship between objective performance (PASAT) and subjective fatigue
Fatigue over the work day in MSBeatty et al (2003)
• Pre-post work day assessment of:– 4 NP tests of information processing– 25 ft timed walk– Subjective fatigue
• 17 MS• 12 healthy controls
Fatigue over the work day in MSBeatty et al (2003)
• Subjective fatigue did not differ at baseline but MS subjects reported significantly more fatigue at the end of the day
Subjective Fatigue Across the Workday (Beatty et al., 2003)
0
1
2
3
4
5
6
baseline end of day
MSHC
Mean fatigue
Group by time interaction: p<.01
NP Measures Across the Workday(Beatty et al., 2003)
• No group differences on any NP measure– List recall– Letter-number sequence– SDMT– PASAT (3 second trial)
• Subjective fatigue did not correlate with objective NP performance
9/26/2014
9
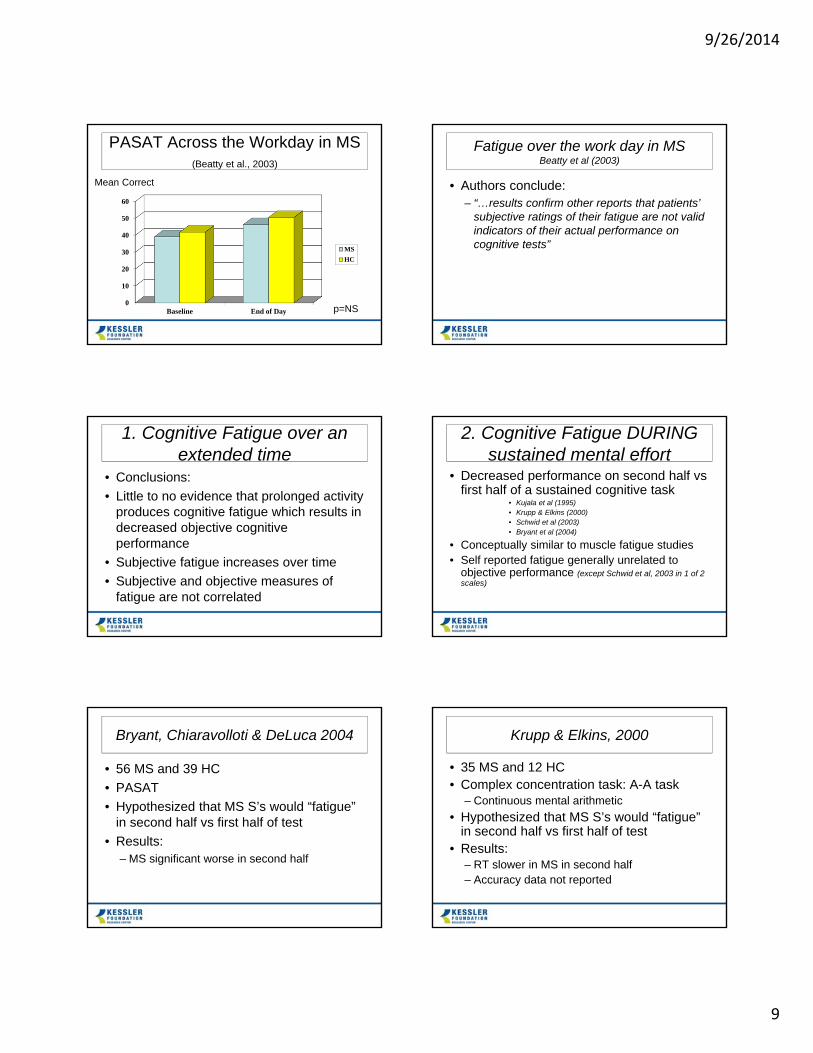
PASAT Across the Workday in MS(Beatty et al., 2003)
0
10
20
30
40
50
60
Baseline End of Day
MSHC
Mean Correct
p=NS
Fatigue over the work day in MSBeatty et al (2003)
• Authors conclude:– “…results confirm other reports that patients’
subjective ratings of their fatigue are not valid indicators of their actual performance on cognitive tests”
1. Cognitive Fatigue over an extended time
• Conclusions:• Little to no evidence that prolonged activity
produces cognitive fatigue which results in decreased objective cognitive performance
• Subjective fatigue increases over time• Subjective and objective measures of
fatigue are not correlated
2. Cognitive Fatigue DURING sustained mental effort
• Decreased performance on second half vs first half of a sustained cognitive task
• Kujala et al (1995)• Krupp & Elkins (2000)• Schwid et al (2003)• Bryant et al (2004)
• Conceptually similar to muscle fatigue studies• Self reported fatigue generally unrelated to
objective performance (except Schwid et al, 2003 in 1 of 2 scales)
Bryant, Chiaravolloti & DeLuca 2004
• 56 MS and 39 HC• PASAT• Hypothesized that MS S’s would “fatigue”
in second half vs first half of test• Results:
– MS significant worse in second half
Krupp & Elkins, 2000
• 35 MS and 12 HC• Complex concentration task: A-A task
– Continuous mental arithmetic• Hypothesized that MS S’s would “fatigue”
in second half vs first half of test• Results:
– RT slower in MS in second half– Accuracy data not reported

9/26/2014
10
2. Cognitive Fatigue DURING sustained mental effort
• Significant evidence for decreased performance during sustained mental effort
• Perhaps this is where we should focus our continued research efforts?
Conclusions on Cognitive Fatigue
• Cognitive fatigue is a complex construct• Simple subjective questionnaires are not
adequate• Best evidence is for fatigue DURING
sustained cognitive performance
Overview
• What is Fatigue– study with caution!
• Cognitive Fatigue
• Neuroimaging and Fatigue
Is there a relationship between fatigue and measures of brain functioning?
• Structural MRI• Electrophysiological (not discussed here)• Functional neuroimaging
Structural Imaging
9/26/2014
11
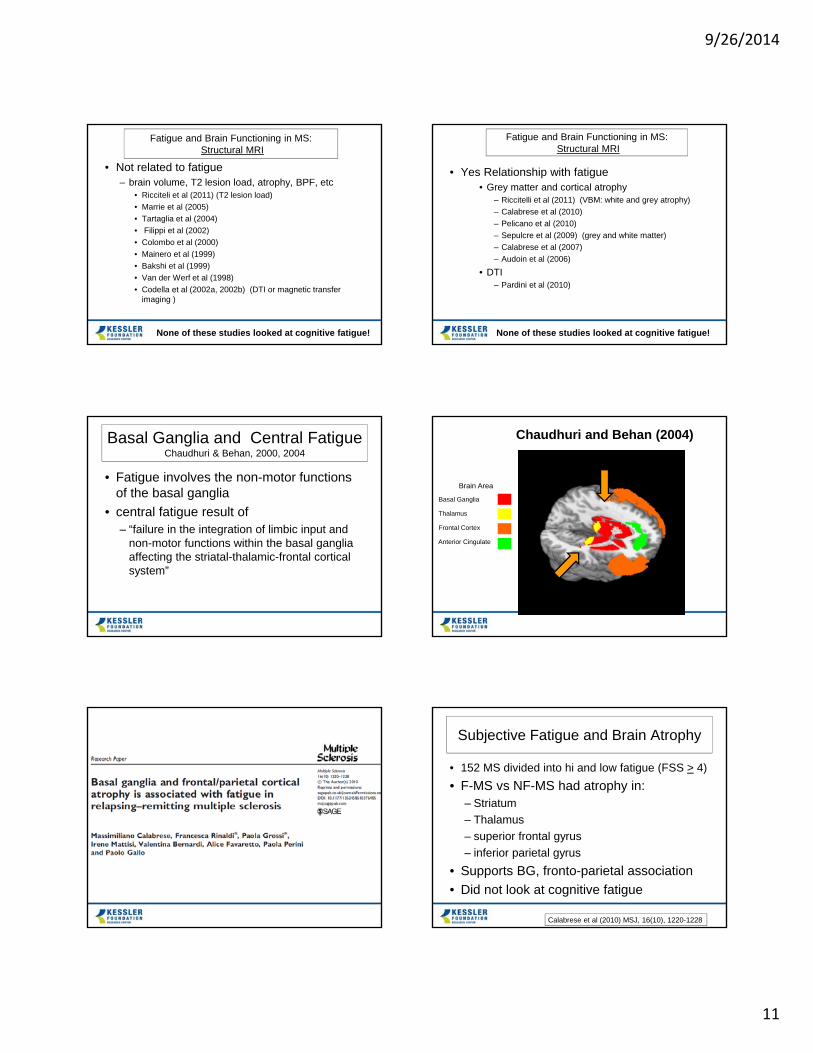
Fatigue and Brain Functioning in MS:Structural MRI
• Not related to fatigue – brain volume, T2 lesion load, atrophy, BPF, etc
• Ricciteli et al (2011) (T2 lesion load)• Marrie et al (2005)• Tartaglia et al (2004)• Filippi et al (2002)• Colombo et al (2000)• Mainero et al (1999)• Bakshi et al (1999)• Van der Werf et al (1998)• Codella et al (2002a, 2002b) (DTI or magnetic transfer
imaging )
None of these studies looked at cognitive fatigue!
Fatigue and Brain Functioning in MS:Structural MRI
• Yes Relationship with fatigue• Grey matter and cortical atrophy
– Riccitelli et al (2011) (VBM: white and grey atrophy)– Calabrese et al (2010)– Pelicano et al (2010)– Sepulcre et al (2009) (grey and white matter)– Calabrese et al (2007)– Audoin et al (2006)
• DTI– Pardini et al (2010)
None of these studies looked at cognitive fatigue!
Basal Ganglia and Central FatigueChaudhuri & Behan, 2000, 2004
• Fatigue involves the non-motor functions of the basal ganglia
• central fatigue result of– “failure in the integration of limbic input and
non-motor functions within the basal ganglia affecting the striatal-thalamic-frontal cortical system”
Basal Ganglia (Striatum)ThalamusFrontal Cortex
Brain Area
Basal Ganglia
Thalamus
Frontal Cortex
Anterior Cingulate
Anterior CingulateChaudhuri and Behan (2004)
Subjective Fatigue and Brain Atrophy
• 152 MS divided into hi and low fatigue (FSS > 4)• F-MS vs NF-MS had atrophy in:
– Striatum– Thalamus– superior frontal gyrus– inferior parietal gyrus
• Supports BG, fronto-parietal association• Did not look at cognitive fatigue
Calabrese et al (2010) MSJ, 16(10), 1220-1228
9/26/2014
12
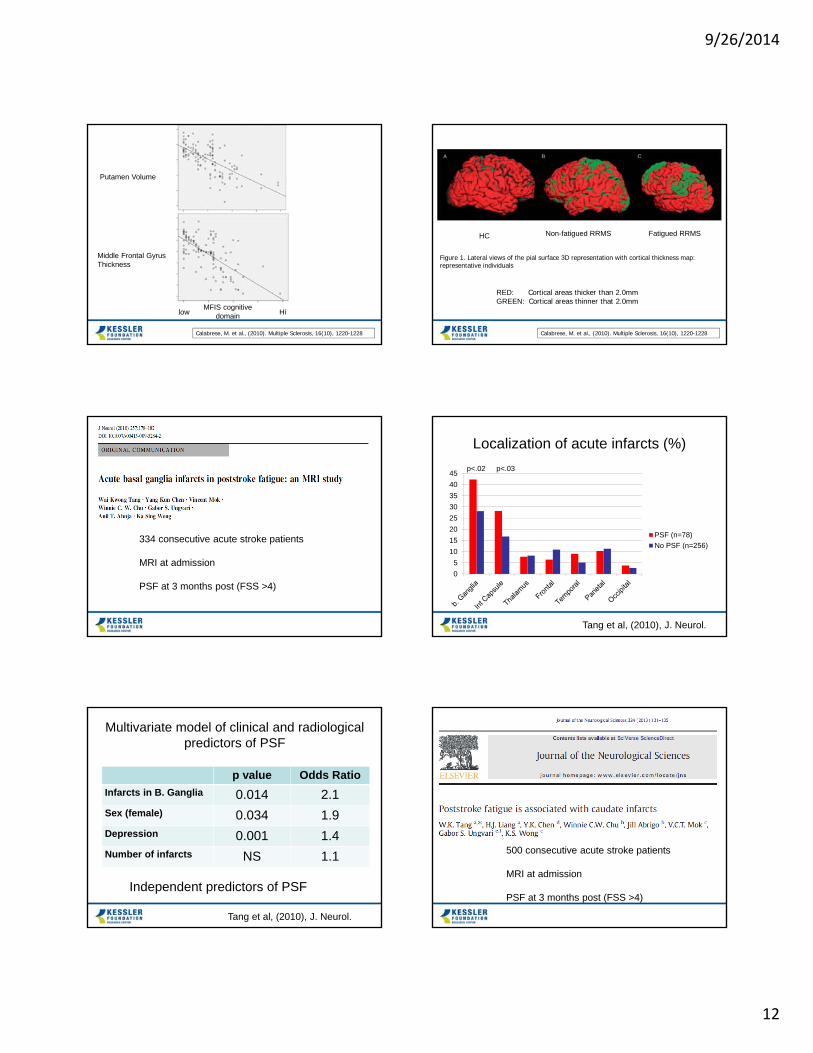
MFIS cognitivedomainlow Hi
Putamen Volume
Middle Frontal GyrusThickness
Calabrese, M. et al., (2010). Multiple Sclerosis, 16(10), 1220-1228
Figure 1. Lateral views of the pial surface 3D representation with cortical thickness map: representative individuals
Calabrese, M. et al., (2010). Multiple Sclerosis, 16(10), 1220-1228
RED: Cortical areas thicker than 2.0mm GREEN: Cortical areas thinner that 2.0mm
HC Non-fatigued RRMS Fatigued RRMS
334 consecutive acute stroke patients
MRI at admission
PSF at 3 months post (FSS >4)
Localization of acute infarcts (%)
05
1015202530354045
PSF (n=78)No PSF (n=256)
Tang et al, (2010), J. Neurol.
p<.02 p<.03
Multivariate model of clinical and radiological predictors of PSF
p value Odds RatioInfarcts in B. Ganglia 0.014 2.1Sex (female) 0.034 1.9Depression 0.001 1.4Number of infarcts NS 1.1
Independent predictors of PSF
Tang et al, (2010), J. Neurol.
500 consecutive acute stroke patients
MRI at admission
PSF at 3 months post (FSS >4)

9/26/2014
13
Localization of acute infarcts (%)
0
5
10
15
20
25
PSF (n=125)No PSF (n=375)
Tang et al, (2013), J. Neurol. Sci.
p<.001 p<.043
Multivariate model of clinical and radiological predictors of PSF
p value Odds RatioInfarcts in Caudate 0.001 6.4Sex (female) 0.002 2.0Depression 0.001 1.2Infarcts in Putamen NS
Independent predictors of PSF
Tang et al, (2013), J. Neurol. Sci
Functional Imaging
Fatigue and brain functioning in MS:Functional neuroimaging
• Positive Relationship– Rocca et al (2009) (fMRI)
• During coordinated hand and foot movements– Tartalglia et al (2004), (MRS)– Filippi et al (2002), (fMRI)
• During coordinated finger mvmts– Roelcke et al (1997), (PET)
None of these studies looked at cognitive fatigue!
Cognitive Fatigue using fMRI
• Purpose - objectively assess cognitive fatigue in MS using fMRI
• Hypothesis - persons with MS would show altered cerebral activation across trials of behavioral task compared to controls
• This was interpreted as cognitive fatigue.
DeLuca et al, 2008, J Neurol Sci

9/26/2014
14
Cognitive Fatigue using fMRI
• 15 HC and 15 MS• Induced cognitive fatigue during scanning
– 4 trials of mSDMT during fMRI scanning• Hypothesized interaction effect in BOLD
response across trials– Increased activation in MS– Decreased activation in HC
DeLuca et al, 2008, J Neurol Sci
Hypothesized Fatigue Effect
Run 1 Run 2 Run 3
Cer
ebra
l Act
ivat
ion
MS
HC
DeLuca et al, 2008, J Neurol Sci
Run 1
1st half 2nd half
RT
(mse
c)
1600
1800
2000
2200
2400
2600
2800
3000
e a o a ata
Run 2
1st half 2nd half
Run 3
1st half 2nd half
Run 4
1st half 2nd half
HC MS
Response time: within- and across- run fatigue
DeLuca et al, 2008, J Neurol Sci
No group differences in accuracyMS = 98%HC = 96%
Within-run fatigue [-4 31 -19]
Run/trial half
1st half 2nd half
Per
cent
sig
nal c
hang
e
-0.20
-0.15
-0.10
-0.05
0.00
0.05
0.10
Healthy controlMultiple sclerosis
Cerebral Activity in Orbital Frontal Gyrus
DeLuca et al, 2008, J Neurol Sci
Across-run Fatigue[24 -67 45]
Run/Trial
1 2 3 4
Per
cent
sig
nal c
hang
e
0.2
0.4
0.6
0.8
1.0
1.2
1.4
HCMS
Cerebral activity in parietal cortex
DeLuca et al, 2008, J Neurol Sci
Across-run Fatigue[-16 -7 19]
Run/Trial
1 2 3 4
Perc
ent s
igna
l cha
nge
-0.05
0.00
0.05
0.100.15
0.20
0.250.30
HCMS
Cerebral Activity in Caudate
DeLuca et al, 2008, J Neurol Sci

9/26/2014
15
Method (Kohl et al., 2009)
• 11 moderate-severe TBI and 11 HC• Induce fatigue in the scanner
– 3 trials of processing speed task (SDMT)• Hypothesized interaction effect BOLD
response across trials– Increased activation in MS– Decreased activation in HC
Behavioral Results
0
500
1000
1500
2000
2500
3000
Rea
ctio
n Ti
me
(mse
c)
TBI HC
Run 1 Run 2 Run 3
Accuracy was 95% in HC and 96% in TBI
Left Basal Ganglia (Caudate/Putamen)
-12
-7
-2
3
8
HC
TBI
Beta
Wei
ght
1st Half 2nd Half
Kohl et al., (2009), Brain Injury
Left Middle Frontal Gyrus
-20
-15
-10
-5
0
HC TBI
Beta
Wei
ght
1st Half 2nd Half
Kohl et al., (2009), Brain Injury
Left Anterior Cingulate
-1
0
1
2
3
4
5
6
7
TBI
HC
Beta
Wei
ght
Run 1 Run 2 Run 3
Kohl et al., (2009), Brain Injury

9/26/2014
16
Right Superior Parietal Lobule
-20
-15
-10
-5
0
5
HC TBI
Beta
Wei
ght
1st Half 2nd Half
Kohl et al., (2009), Brain Injury
Chauduri and Behan Model (2004)
Fatigue Network
Frontal Cortex (orange)
Basal Ganglia (red)
Anterior Cingulate (green)
Thalamus (yellow)
Superior Parietal Cortex
Cognitive Fatigue using fMRI
• Altered fMRI activation on mSDMT in MS and TBI interpreted as cognitive fatigue
• Found only in brain areas hypothesized to subserve cognitive fatigue (Chaudhuri & Behan,
2000)
• Suggests fatigue can be measured objectively using fMRI
• What about the relationship between:– self-reported fatigue– behaviorally induced fatigue– functional imaging?
Towards an operational definition of fatigue
• Two ways to relate subjective reports of fatigue to brain activation:– State: “Online” measure of fatigue
(during task performance)
– Trait: “Offline” measure of fatigue(e.g., over last 2 weeks)
9/26/2014
17
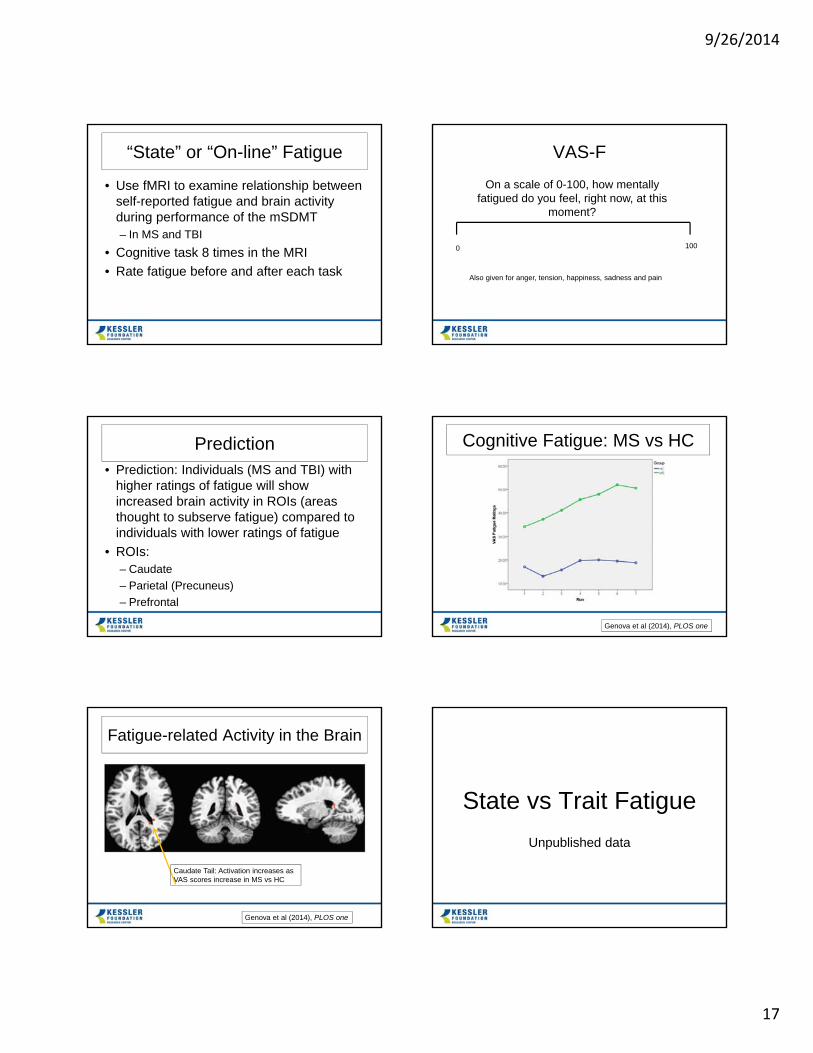
“State” or “On-line” Fatigue
• Use fMRI to examine relationship between self-reported fatigue and brain activity during performance of the mSDMT– In MS and TBI
• Cognitive task 8 times in the MRI• Rate fatigue before and after each task
VAS-F
0 100
On a scale of 0-100, how mentally fatigued do you feel, right now, at this
moment?
Also given for anger, tension, happiness, sadness and pain
Prediction• Prediction: Individuals (MS and TBI) with
higher ratings of fatigue will show increased brain activity in ROIs (areas thought to subserve fatigue) compared to individuals with lower ratings of fatigue
• ROIs: – Caudate– Parietal (Precuneus)– Prefrontal
Cognitive Fatigue: MS vs HC
Genova et al (2014), PLOS one
Fatigue-related Activity in the Brain
Caudate Tail: Activation increases as VAS scores increase in MS vs HC
Genova et al (2014), PLOS one
State vs Trait FatigueUnpublished data

9/26/2014
18
High vs. Low Fatigue
• High vs Low STATE Fatigue– Post hoc groupings
• Compared BOLD activation (associated with induced cognitive Fatigue) in– High Fatigue vs. Low Fatigue Group
fMRI, Cognitive Fatigue and self-reported Fatigue
• mSDMT was used to induce fatigue in– Administered 8 times during fMRI acquisition
• Subjective reports collected before and after each block– Cognitive fatigue– Happiness– Sadness– Anger– Pain– Tension
Wylie, Genova et al, unpublished data
High vs. Low Fatigue- TBILow Fatigue
(11)High Fatigue
(14)p
Age 34.67(10.6) 46.15(11.7) .09Education 14.77(2.3) 16.67(2.3) .14
FSS 28 (16.49) 29.67(8.3) .41
Groups did not differ on FSS – “trait” fatigue
TBI VAS-F Scores
0
10
20
30
40
50
60
70
pre-sdmt1 post-sdmt1 post-sdmt2 post-sdmt3 post-sdmt4 pre-sdmt5 post-sdmt5 post-sdmt6 post-sdmt7 post-sdmt8
Low-Fatiguers
High-Fatiguers
SDMT in TBI
p<0.05
• “High Fatiguers” greater activity in caudate than “Low-fatiguers” (orange)
• “Low-fatiguers” greater activity than “High-Fatiguers” in cerebellum (blue)
High vs Low Fatigue
• What if we compared when fatigue was Low vs High?
• Using n-back – Low fatigue: first half of the experiment– High fatigue: second half of the experiment

9/26/2014
19
Cognitive Fatigue in TBIfMRI Results : Caudate
• Comparison: Fatigue-related activation (AMR) during the second 2-back block minus the first 2-back block
• p < 0.05 (corrected)
Wylie et al., unpublished
Cognitive Fatigue in TBIfMRI results: PCC
• Comparison: Fatigue-related activation (AMR) during the second 2-back block minus the first 2-back block
• p < 0.05 (corrected)
Wylie et al., unpublished
General Findings: State Fatigue
• No correlation between cognitive performance and self-reported fatigue
• Consistent with our hypotheses, increased activation in subjects with higher fatigue– Caudate– Frontal regions– Cuneus
• Support for Chaudhuri and Behan Model of Central fatigue
New Treatments? Neuroscience approach to new
treatments
Neural Mechanism• Due to non-motor function of the basal
ganglia (Chaudhuri and Behan, 2000)
• The Basal Ganglia– Not only a motor region– Involved in
• Decision-making• Learning • Language
• Widespread projections to the prefrontal cortex
Motivational Loop in Animals & Healthy Adults
• Animal studies– VMPFC & striatal neurons fire to reward
delivery (Schultz, 1992; Schultz et al., 2011; Padoa-Schioppa & Cai, 2011)
• Human studies– Greater VMPFC & striatal activation to
reward presentation (Dobryakova & Tricomi, 2013; Delgado et al., 2000; Jessup & O’Doherty, 2011; Balleine et al., 2011)
9/26/2014
20
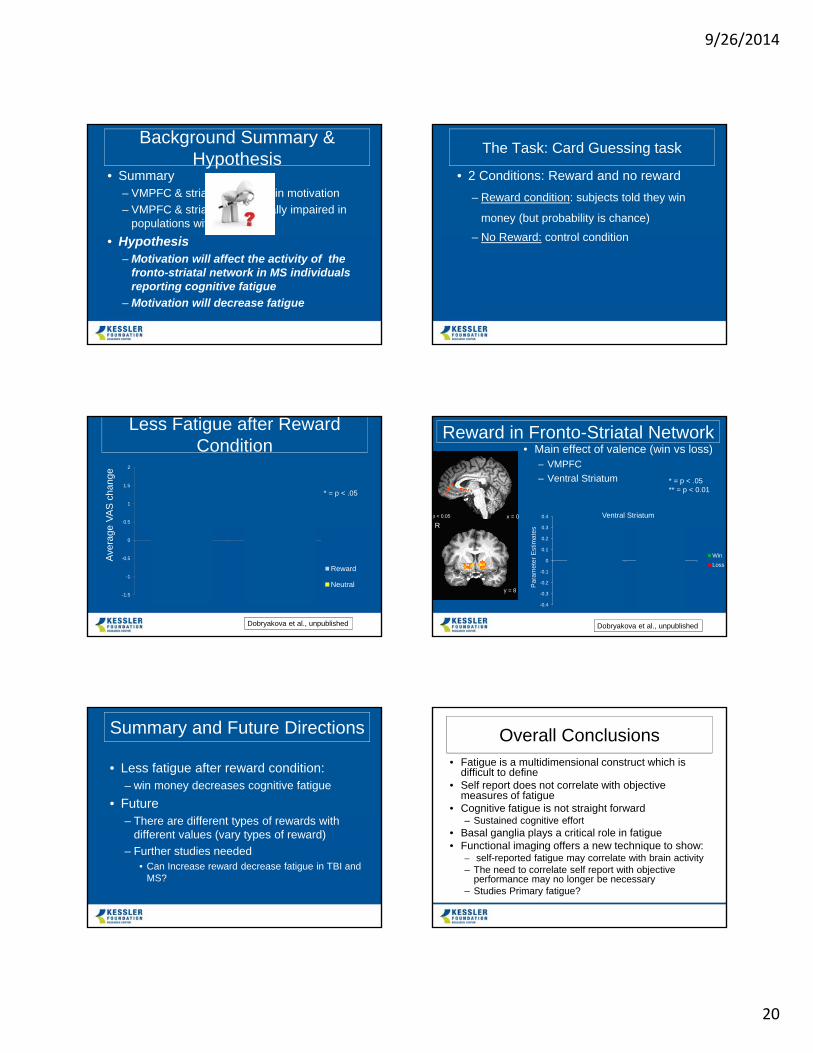
Background Summary & Hypothesis
• Summary – VMPFC & striatum involved in motivation– VMPFC & striatum functionally impaired in
populations with fatigue• Hypothesis
– Motivation will affect the activity of the fronto-striatal network in MS individuals reporting cognitive fatigue
– Motivation will decrease fatigue
The Task: Card Guessing task
• 2 Conditions: Reward and no reward– Reward condition: subjects told they win
money (but probability is chance)– No Reward: control condition
-1.5
-1
-0.5
0
0.5
1
1.5
2
MS HC
Reward
Neutral
Less Fatigue after Reward Condition
Aver
age
VAS
chan
ge
*
* = p < .05
Dobryakova et al., unpublished
Reward in Fronto-Striatal Network• Main effect of valence (win vs loss)
– VMPFC – Ventral Striatum
R
y = 8
p < 0.05 x = 0
-0.4
-0.3
-0.2
-0.1
0
0.1
0.2
0.3
0.4
WinLoss
Par
amet
er E
stim
ates
Ventral Striatum
MSHC
***
* = p < .05** = p < 0.01
Dobryakova et al., unpublished
Summary and Future Directions
• Less fatigue after reward condition:– win money decreases cognitive fatigue
• Future– There are different types of rewards with
different values (vary types of reward)– Further studies needed
• Can Increase reward decrease fatigue in TBI and MS?
Overall Conclusions• Fatigue is a multidimensional construct which is
difficult to define• Self report does not correlate with objective
measures of fatigue• Cognitive fatigue is not straight forward
– Sustained cognitive effort• Basal ganglia plays a critical role in fatigue• Functional imaging offers a new technique to show:
– self-reported fatigue may correlate with brain activity– The need to correlate self report with objective
performance may no longer be necessary– Studies Primary fatigue?

9/26/2014
21
Acknowledgments
Glenn Wylie, D.Phil.Frank Hillary, Ph.D.
Alex KohlHelen Genova, Ph.D.
Nancy Chiaravalloti, Ph.D.
View of NYC from West Orange, NJ
Thank You