shodhganga.inflibnet.ac.inshodhganga.inflibnet.ac.in/bitstream/10603/105600/10/19... · ... while...
TRANSCRIPT


VOLUME NO. 5 (2015), ISSUE NO. 01 (JANUARY) ISSN 2231-1009
INTERNATIONAL JOURNAL OF RESEARCH IN COMPUTER APPLICATION & MANAGEMENT A Monthly Double-Blind Peer Reviewed (Refereed/Juried) Open Access International e-Journal - Included in the International Serial Directories
http://ijrcm.org.in/
111
SERVICE QUALITY AND CUSTOMER SATISFACTION IN DTH SERVICES IN KANGRA, HIMACHAL PRADESH
LEKH RAJ
RESEARCH SCHOLAR
FACULTY OF MANAGEMENT SCIENCES & LIBERAL ARTS
SHOOLINI UNIVERSITY OF BIOTECHNOLOGY & MANAGEMENT SCIENCES
SOLAN
ABSTRACT The main purpose of this study is to examine the relationship between service quality and customer satisfaction in DTH (Direct To Home) service. Better service
quality and customer satisfaction both are the indicators of corporate competitiveness. For investigating the relation between service quality and customer
satisfaction, convenient random sampling was used to collect data from 180 customers of six paid DTH service providers in District Kangra of Himachal Pradesh.
The results of the research indicate that there exist significant relationship between service quality dimensions and customer satisfaction. Assurance, Empathy,
Network Quality, Convenience & Tangibles were found as the predictors of DTH service quality while Price, Other Factor & Assurance were found as the
significant predictors of customer satisfaction in DTH services.
KEYWORDS Customer satisfaction, DTH services, DTH service quality and service quality.
INTRODUCTION n recent years, service quality and customer satisfaction have become major areas of concern for research scholars, managers and practitioners. Both of
these aspects have not yet been thought off considerably by DTH service providers. Besides this, DTH sector has shown a remarkable growth in last
decade. It is because of the technological innovations and financial revolutions that have lead to the high pace in this sector. In order to retain this growth,
DTH sector really has to put its efforts to define service quality, forms and the impact of quality deficiencies.
DTH SERVICE PROVIDERS IN INDIA At present, there are total seven players providing DTH services to the Indian customers, i.e., DD Direct Plus, Airtel Digital TV, Dish TV, Reliance Digital TV, Sun
Direct, Tata Sky and Videocon d2h. Out of these, six are paid DTH service providers while one government owned DTH service provider (DD Direct Plus) provides
free services across the nation. The sector has shown significant growth in last five years and DTH subscriber base has reached to 54.52 million in the year 2012
in comparison to 11.10 million in 2008 (TRAI, Letter No. 1(516)/2013-RTI). Within a short span of five years, the DTH users have increased approximately five
times (Table no.1).
TABLE NO. 1: GROWTH OF PAY DTH SERVICE SECTOR IN INDIA
Sr. No. Year Subscriber Base (in Millions)
1. 2008 11.10
2. 2009 19.10
3. 2010 32.05
4. 2011 44.21
5. 2012 54.52
Source: - TRAI, Letter No. 1(516)/2013-RTI
So it can be said that Indian market is attractive both in terms of volume as well as growth rate and create great opportunities for DTH service providers to
expand their wings. But still both service quality and customer satisfaction need high attention and concern to retain this growth in near future.
LITERATURE REVIEW Gronroos
(1984) stated that perceived quality is the outcome of an evaluation process, where customer puts the perceived service against the expected service.
Parasuraman et al., (1985, 1988) proposed that service quality can be measure through functional quality dimension having five components (tangibility,
reliability, responsiveness, assurance, empathy). Gronroos (1993) defined three dimension service quality as functional quality, technical quality and image of
the service provider. Smith et al., (1999) stated network quality, performance of technical team, customer care department, billing system, and perceived
corporate image of the service provider as components of service quality. Woo and Fock (1999) founded that transmission quality and network coverage are the
important factors of customer satisfaction. Menezes and Carvalho (2009) examined the impact of new technology on free to air TV industry and found that the
amount of benefits gained from digitalization is conditioned by how the service was regulated and by socio-economic factors of the country. Hanif et al., (2010)
found that price fairness and customer services play an important role in customer satisfaction. Siew-Phaik Loke et al., (2011) found a significant and positive
relationship between service quality dimensions and customer satisfaction excluding in the area of tangibility. Rahman et al., (2012) proposed a model that
focused on the relationship between technical quality, functional quality, corporate image of service provider and service quality towards customer’s
satisfaction. Gulati et al., (2011) picture and sound quality played an important role in customer satisfaction. Dhinakaran (2012) recommended that better
network coverage and high picture clarity have significant role in DTH services. Madan et al., (2012)
found that DTH customer gives the maximum weightage to
tangibles dimension of service quality. Shakira Khan and Raj (2013) reported nine dimensions of DTH service quality namely assurance, reliability, tangibles,
empathy, responsiveness, network quality, convenience, price and other factors. In case of customer satisfaction, Sutha and Jayanthi (2013) found non-
significant difference between various attributes, while significant difference was found as far as customer preference is concerned. Jotheswari et al., (2014)
stated that DTH service providers are doing well in the field of customer awareness, customer perception, but choice of channels and charges, packages, to
provide prompt information, signal quality, and signal breakage in rainy season etc. are the areas that needs more concern.
SERVICE QUALITY DIMENSIONS FOR DTH SERVICES For the present study nine determinants (Assurance, Reliability, Tangibles, Empathy, Responsiveness, Network Quality, Convenience, Price and Other Factors)
were taken as the dimensions of DTH service quality. Khan and Raj (2013) explained all these nine with 29 statements as determinants of DTH service quality.
Customer satisfaction was operationalised by four statements which are related to service quality and product quality provided by Direct-To-Home (DTH) service
provider.
I

VOLUME NO. 5 (2015), ISSUE NO. 01 (JANUARY) ISSN 2231-1009
INTERNATIONAL JOURNAL OF RESEARCH IN COMPUTER APPLICATION & MANAGEMENT A Monthly Double-Blind Peer Reviewed (Refereed/Juried) Open Access International e-Journal - Included in the International Serial Directories
http://ijrcm.org.in/
112
NEED OF THE STUDY Service quality is the key for success in the future; however it will not be limited only to products. Therefore, successful DTH operators need to consider service
quality in every aspects of their functioning. Hence it can be said that quality is a critical issue for the DTH services. Further the study acquires importance
because of the high growth rate of DTH services in India and very few detailed studies have been carried out in the field.
OBJECTIVES AND HYPOTHESIS OF THE STUDY Following main objectives are framed for the present research work.
1. To explore the key dimensions of service quality for Direct-To-Home (DTH) services.
2. To ascertain which aspects of service quality has significant impact on customer satisfaction.
HYPOTHESIS H01: Dimensions associated with service quality are significant drivers of overall customer perceived service quality in the Direct-To-Home (DTH) sector.
H02: DTH service quality dimensions have significant positive influence on customer satisfaction.
RESEARCH METHODOLOGY The present study is empirical in nature and is based on both primary as well as secondary data. The relevant secondary data has been collected from existing
literature on service quality, various journal and websites of different national and international institutions. The Primary data was collected from the
respondents by using questionnaire to know their perception about dimensions of service quality and customer satisfaction. Price was taken as important
determinants of DTH service quality so the customer of only paid DTH service providers (Airtel digital TV, Dish TV, Reliance Digital TV, Sun Direct, Tata Sky, and
Videocon d2h) were selected.
STUDY AREA
The present research work was carried out in district Kangra of Himachal Pradesh. Kangra is most populated district of the Himachal Pradesh having the total
population of 1,510,075, with literacy rate of 85.67 percent.
DATA COLLECTION
For the present study purpose a total of 200 customers from six DTH operators in district Kangra were approached by using convenient random sampling.
Statistical calculations have been made, with the help of Microsoft excel and SPSS software. Appropriate tools for data analysis have been used as per the
requirement of the study.
RESULTS & DISCUSSION Total 184 questionnaires received but only 180 were found suitable for the study and remaining were rejected due to incomplete information.
DEMOGRAPHIC CHARACTERISTICS OF RESPONDENTS
In the following table no. 2 demographic characteristics of the respondents is presented.

VOLUME NO. 5 (2015), ISSUE NO. 01 (JANUARY) ISSN 2231-1009
INTERNATIONAL JOURNAL OF RESEARCH IN COMPUTER APPLICATION & MANAGEMENT A Monthly Double-Blind Peer Reviewed (Refereed/Juried) Open Access International e-Journal - Included in the International Serial Directories
http://ijrcm.org.in/
113
TABLE NO. 2: DEMOGRAPHIC CHARACTERISTICS OF RESPONDENTS
Parameter Airtel Digital TV Dish TV Reliance Digital TV Sun Direct Tata Sky Videocon d2h Total %age
Age
Less than 25 years 9 11 5 4 10 6 45 25
25-34 years 13 22 12 8 8 10 73 41
35-44 years 8 7 7 2 7 2 33 18
45-54 years 3 2 5 4 4 5 23 13
55 years and above 3 0 1 0 2 0 6 3
Total 36 42 30 18 31 23 180 100
Gender
Male 21 25 22 12 20 17 117 65
Female 15 17 8 6 11 6 63 35
Total 36 42 30 18 31 23 180 100
Qualification
Below secondary level 3 2 1 1 1 3 11 6
Secondary level 7 8 7 4 3 4 33 18
University bachelor degree 12 21 12 6 21 9 81 45
Masters/PG 13 9 9 7 3 6 47 26
others, specify 1 2 1 0 3 1 8 4
Total 36 42 30 18 31 23 180 100
Income
Upto 10,000 3 7 2 4 4 5 25 14
10,001 to 20,000 11 18 6 3 11 6 55 31
20,001 to 30,000 8 10 14 8 8 4 52 29
30,001 to 40,000 6 1 3 0 3 3 16 9
40,001 to 50,000 5 4 1 2 1 3 16 9
50,001 and above 3 2 4 1 4 2 16 9
Total 36 42 30 18 31 23 180 100
Marital Status
Married 26 31 20 12 23 19 131 73
Unmarried 10 11 10 6 8 4 49 27
Total 36 42 30 18 31 23 180 100
Profession
Service 16 19 13 10 12 7 77 43
Own business 14 9 8 6 6 12 55 31
Student 3 6 4 2 6 2 23 13
Others, (Specify) 3 8 5 0 7 2 25 14
Total 36 42 30 18 31 23 180 100
Duration of Dealing
Less than 1 year 0 6 7 0 7 6 26 14
1-2 years 10 7 7 1 9 7 41 23
2-3 years 14 12 8 7 3 6 50 28
3-4 years 5 11 3 5 4 4 32 18
4-5 years 1 3 3 2 4 0 13 7
5 years and above 6 3 2 3 4 0 18 10
Total 36 42 30 18 31 23 180 100
Monthly Expenditure
Less than 250 24 33 21 12 21 17 128 71
251 to 350 7 6 4 5 6 4 32 18
351 to 450 4 3 4 1 3 2 17 9
451 and above 1 0 1 0 1 0 3 2
Total 36 42 30 18 31 23 180 100
Source: - Data Collected through Questionnaire Method
Table 2 represents the demographic characteristics of the respondents used for the study. The results shows that about 41 percent of the respondents belong to
the age group 25-34 years followed by the age group less than 25 years about 25 percent. The results indicate that about 65 percent of the respondents are
male and 35 percent are female respondents. This section describes the education level of the respondents and states that 45 percent of the respondents have
university bachelor degree and about 26 percent having Master/PG qualification. Talking about the income of the respondents, the results enumerate that 31
percent of the respondents lies in the income group 10,001 to 20,000 per month followed by income group 20,001 to 30,000 per month accounts for about 29
percent. It was found that about 73 percent of the respondents were married and about 27 percent were unmarried. Present section also define the profession
of the respondents and states that about 43 percent of the respondents are in services and about 31 percent of the respondents have their own business. It was
found that about 28 percent of the subscribers using DTH services from 2-3 years and 23 percent from last 1-2 years. The results informed that most of the
subscribers about 71 percent spent less than 250 rupees on DTH services and about 18 percent spent rupees 251 to 350 on DTH services.
RELATIONSHIP BETWEEN SERVICE QUALITY AND ITS DIMENSIONS
The correlation analysis was used to find the strength of the relationship between service quality and its dimensions. The result of Pearson correlation (table
no.3) shows that all the dimensions of service quality are positively associated with it and strongest association was found between Service Quality and
Assurance.
TABLE NO. 3: CORRELATION: SERVICE QUALITY AND ITS DIMENSIONS
Assurance Reliability Tangibles Empathy Responsiveness Network Quality Convenience Price OtherFactor
Service Quality 0.635 0.328 0.463 0.535 0.548 0.471 0.399 0.193 .343
Source: - Data Collected through Questionnaire Method
To find out the best predictors of service quality and to identify which aspects of the service quality has significant influence on service quality; stepwise
regression was used with the dimensions of service quality as the predictors. In the model nine dimensions of service quality dimensions were taken as
independent variables and service quality as the dependent variable. The model summary Table 4 reports the strength of the relationship between the model

VOLUME NO. 5 (2015), ISSUE NO. 01 (JANUARY) ISSN 2231-1009
INTERNATIONAL JOURNAL OF RESEARCH IN COMPUTER APPLICATION & MANAGEMENT A Monthly Double-Blind Peer Reviewed (Refereed/Juried) Open Access International e-Journal - Included in the International Serial Directories
http://ijrcm.org.in/
114
and the dependent variable. The value of R2 indicates the variance of the model in the service quality construct in DTH sector. It can be seen that regression
model explained 88.1 percent of the variance in the DTH service quality construct. As shown in table 5 there are only five variables (Assurance, Empathy,
Network Quality, Convenience and Tangibles) added from the original nine and are significant predictors of service quality in DTH sector.
TABLE NO. 4: REGRESSION MODEL SUMMARY: SERVICE QUALITY AND DIMENSIONS OF SERVICE QUALITY
Model R R2
Adjusted R2
Std Error of Estimate
5 0.939 0.881 0.878 2.915
Source: - Data Collected through Questionnaire Method
1. Independent Variable:- Dimensions of Service quality
2. Dependent Variable:- Service Quality
TABLE NO.5: STEPWISE REGRESSION ANALYSIS: SERVICE QUALITY
Variable Beta t- Value Significance level Collinearity Statistics
(Constant) 16.906 6.770 0.000 Tolerance VIF
Assurance 1.215 13.862 0.000 0.877 1.140
Empathy 1.646 12.561 0.000 0.893 1.120
Network Quality 0.999 15.078 0.000 0.945 1.058
Convenience 1.291 11.270 0.000 0.975 1.025
Tangibles 1.021 10.662 0.000 0.848 1.179
Source: - Data Collected through Questionnaire Method
RELATIONSHIP BETWEEN SERVICE QUALITY AND CUSTOMER SATISFACTION
The correlation analysis was used to find out the strength of the relationship between service quality and customer satisfaction. The result of Pearson
correlation (table no.6) presents that dimensions of service quality are positively associated with customer satisfaction and strongest association was found
between Customer Satisfaction and Price.
TABLE NO. 6: CORRELATION: SERVICE QUALITY AND CUSTOMER SATISFACTION
Assurance Reliability Tangibles Empathy Responsiveness Network Quality Convenience Price Other Factor
Customer Satisfaction 0.470 0.380 0.388 0.436 0.406 0.396 0.378 0.529 0.419
Source: - Data Collected through Questionnaire Method
To find out the best predictors of customer satisfaction and to identify which aspects of the service quality has significant influence on customer satisfaction;
stepwise regression was used with the dimensions of service quality as the predictors. In the model nine dimensions of service quality dimensions were taken as
independent variables and customer satisfaction as the dependent variable. As shown in table 8 there are only three variables (Price, Other Factor and
Assurance) added from the original nine and are significant predictors of customer satisfaction in DTH sector.
TABLE NO. 7: REGRESSION MODEL SUMMARY: SERVICE QUALITY AND CUSTOMER SATISFACTION
Model R R2
Adjusted R2
Std Error of Estimate
3 0.585 0.448 0.434 2.387
Source: - Data Collected through Questionnaire Method
1. Independent Variable:- Dimensions of Service quality
2. Dependent Variable:- Customer satisfaction
TABLE NO. 8: STEPWISE REGRESSION ANALYSIS: CUSTOMER SATISFACTION
Variable Beta t- Value Significance level Collinearity Statistics
(Constant) 4.965 3.202 0.002 Tolerance Tolerance
Price 0.448 4.137 0.000 1.000 1.000
Other Factor 0.273 2.713 0.007 0.998 1.002
Assurance 0.154 2.297 0.023 0.998 1.002
Source: - Data Collected through Questionnaire Method
HYPOTHESIS TESTING
Assurance, Empathy, Network Quality, Convenience and Tangibles were found as the dimensions of DTH service quality. Thus the hypothesis H01: Dimensions
associated with service quality are significant drivers of overall customer perceived service quality in the Direct-To-Home (DTH) sector is partially accepted.
Price, Other Factor and Assurance were found as the significant predictors of customer satisfaction in DTH services. Same here the hypothesis H02: DTH service
quality dimensions have significant positive influence on customer satisfaction is partially accepted.
FINDINGS From the present study, major findings drawn are as under:
1. Most of the respondents were from the age group 25-34 years and male respondents in the present study were about 65 percent. It was found that
majority of the respondents were well qualified and total married respondents were 73 percent. About 31 percent were in the income group 10,001 to
20,000 rupees per month followed by income group 20,001to 30,000.
2. Results indicated that about 28 percent of respondents are using DTH services from last 2-3 years. Most of the respondents were paying less than 250
rupees per month on DTH services.
3. It was found that nine dimensions are positively associated with DTH service quality and the main predictors of the DTH service quality are Assurance,
Empathy, Network Quality, Convenience and Tangibles. Empathy was found as the best predictor of service quality in DTH services.
4. A positive association was found between the dimensions of DTH service quality and customer satisfaction. Price, Other factor and Assurance, were found
as the three predictors of customer satisfaction in DTH sector. Price appeared as best predictor of customer satisfaction in DTH services.
SUGGESTIONS In order to improve the DTH service quality, DTH operators should have to focus on the dimensions of Assurance, Empathy, Network Quality, Convenience and
Tangibles. It is very important to give individual attention to the subscribers and to know about their specific needs. Customer satisfaction can be enhanced by
paying proper attention towards Price, Other factors and Assurance. In order to satisfy the customers, service providers should provide the services at
reasonable price and consider the budget objectives of the DTH users while framing price policy for the services.

VOLUME NO. 5 (2015), ISSUE NO. 01 (JANUARY) ISSN 2231-1009
INTERNATIONAL JOURNAL OF RESEARCH IN COMPUTER APPLICATION & MANAGEMENT A Monthly Double-Blind Peer Reviewed (Refereed/Juried) Open Access International e-Journal - Included in the International Serial Directories
http://ijrcm.org.in/
115
CONCLUSIONS This research paper has outlined the dimensions of DTH service quality and its relationship with customer satisfaction. A significant positive relationship was
found between DTH service quality and its dimensions. Out of all the nine dimensions of service quality, Assurance, Empathy, Network Quality, Convenience &
Tangibles were found as the main governing dimensions of DTH service quality. Adding more to the significant relationship which exists between the dimensions
of service quality and customer satisfaction, Price, Other Factor and Assurance were found as the significant predictors of customer satisfaction in DTH services.
Therefore, in the light of above stated facts, it can be said that DTH service providers have to focus on Empathy, Convenience and Assurance to deliver high
quality services. In order to ensure high customer satisfaction level, DTH service providers have to put efforts to provide services at reasonable price and to meet
budget objectives of the subscribers.
REFERENCES 1. Dhinakaran, T. S. J., (2012), “A study on Customer Buying Behaviour of DTH Services in Palayamkottai”, International Journal of Research in Commerce and
Management, Vol. 3, No.4, 2012, pp. 96-98.
2. Gronroos, C., (1984), “A Service Quality Model and its Implications”, European Journal of Marketing, Vol. 18, No. 4, 1984, pp. 36-44.
3. Gronroos, C., (1993). “Toward a Third Phase in Service Quality Research: Challenges and Future Direction”, In Swartz, T. A., Bowen, S. W., & Brown, S. W.
(Eds) “Advances in Service Marketing and Management”, 2nd ed., Greenwich, JAI Press, 1993, pp. 49-64.
4. Gulati, K., P. Khatri, and S. Ggupta, (2011), “Dish TV – Marketing Mix and Growth”, Radix International Journal of Banking, Finance and Accounting, Vol. 1,
No. 1, 2011, pp. 1-20.
5. Hanif, M., S. Hafeez, and A., Riaz, (2010), “Factors Affecting Customer satisfaction”, International Research Journal of Finance and Economics, No. 60, 2010,
pp. 44-52.
6. Jotheswari et al., (2014), “Customer Awareness and Perception about DTH Services in Kanchipuram District Tamil Nadu, India”, Abhinav- National Monthly
Refereed Journal of Research in Commerce & Management, Vol. 3, 2014, pp. 66-72.
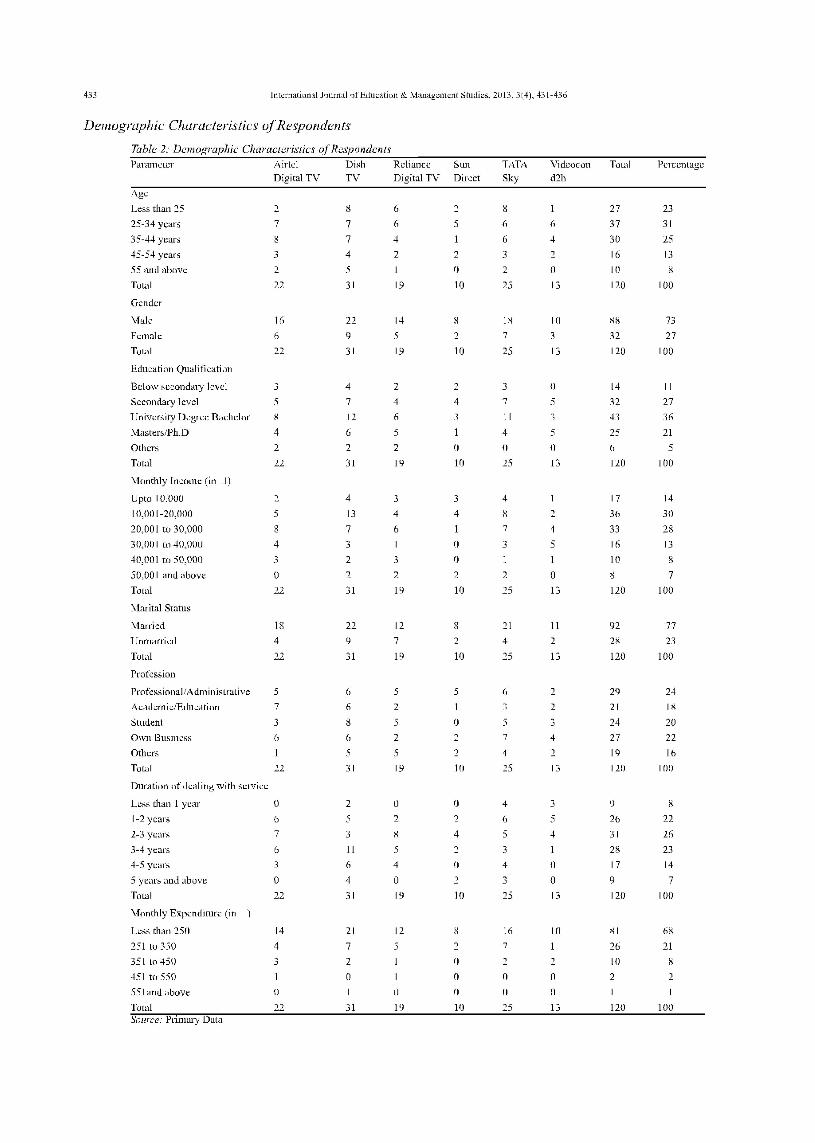
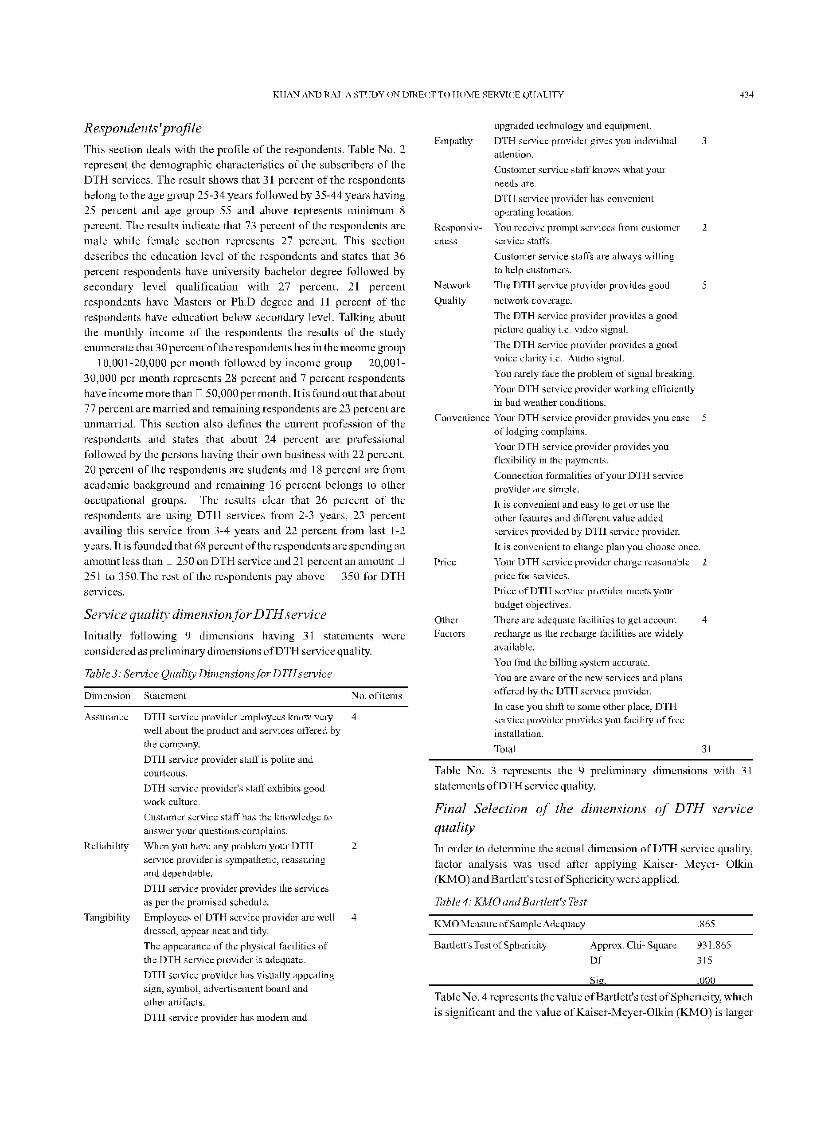
7. Khan, S., and L. Raj (2013), “A study on direct to home service quality with special reference to Mandi district of Himachal Pradesh”, International Journal
of Education & Management Studies, 2013, Vol.3, No.4, pp. 431-436.
8. Madan, M., F. Ahmad, and Dr. V.K. Singh, (2012), “ Gap analysis in DTH services quality: An empirical study for exploring customer satisfaction towards DTH
services using SERVQUAL”, Hermeneutics- A biannual international Journal for Business and Social Studies, Vol. 1, No. 2, 2012, pp. 54-66
9. Menezes, E. and R.D. Q. Carvalho, (2009), “Impact of New Technology on Free-to-Air TV Industry: Lessons From Selected Country Cases”, Journal of
Technology Management and Innovation, Vol. 4, No. 4, November, 2009, pp. 82-92.
10. Parasuraman et al (1985), “ A conceptual model of service quality and its implication for future research”,Journal of Marketing, Vol. 49, 1985, pp. 41-50.
11. Parasuraman, A., V. A. Zeithaml, and L. L. Berry, (1988) “SERVQUAL: A Multiple-Item Scale for Measuring Consumer Perceptions of Service Quality”, Journal
of Retailing, Vol. 64, No. 1,1988, pp. 12-40.
12. Rahman, M. S., A. H. Khan, and M. M. Haque (2012), “A Conceptual Study on the Relationship between Service Quality towards Customer Satisfaction:
Servqual and Gronroos’s Service Quality Model Perspective”, Asian Social Science, Vol. 8, No. 13, 2012, pp. 201-210.
13. Siew-Phaik Loke, A. A. Taiwo, H.M. Salim, and A. G. Downe (2011), “Service Quality and Customer Satisfaction in a Telecommunication Service Provider”,
International Conference on Financial Management and Economics IPEDR, Vol.11 (2011) © (2011) IACSIT Press, Singapore, 2011, pp 24-29.
14. Smith, A. M. (1999): Some Problems with Adopting Churchill's Paradigm for the Development of Service Quality Measurement Scales, in: Journal of
Business Research, Vol. 46, No. 2, October 1999, pp. 109-120.
15. Sutha, A. I. and L. Jayanthi (2013), “A comparative study on the various Direct-to-homes (DTH) Service providers in”, Indian Journal of Applied Research,
Vol. 3, No. 7, 2013, pp. 146-148.
16. TRAI, Letter No. 1(516)/2013-RTI
17. Woo, K., and H. Fock, (1999), “Customer Satisfaction in the Hong Kong Mobile Phone Industry”, the service Industry Journal, Vol. 19, No. 3, 1999, pp. 162-
174.
WEBSITES
18. www.census2011.co.in/census/district/230-kangra.html
19. www.trai.gov.in

International Journal of Advanced Research in ISSN: 2278-6236 Management and Social Sciences Impact Factor: 5.313
Vol. 4 | No. 7 | July 2015 www.garph.co.uk IJARMSS | 124
SERVICE QUALITY AND BEHAVIOUR INTENSIONS OF DTH USERS
Lekh Raj*
Dr. Rakesh K Shukla**
Abstract: The main purpose of the present research work is to study the impact of DTH
service quality on customers’ behaviour intensions. For conducting the research work,
convenient random sampling technique was used to collect data from 250 DTH subscribers
of district Solan of Himachal Pradesh. The results of the study revealed that there exists
significant relationship between DTH service quality and customers’ behaviour intensions.
The dimensions of Tangibles, Service Operations, Assurance and Price were found as the
predictors of recommending behaviour. In case of switching intensions, dimensions of Price
and Network Quality, and for complaining behaviour, dimensions of Service Operations and
Price were found as significant determinants.
Keywords: Service quality, DTH service, behaviour intensions, recommending behaviour,
switching intension.
*Ph.D. Research Scholar, Faculty of Management Sciences and Liberal Arts, Shoolini
University of Biotechnology and Management Sciences, Solan (H.P.), India
**Assistant Professor, Faculty of Basic Sciences, Shoolini University of Biotechnology and
Management Sciences, Solan (H.P.), India

International Journal of Advanced Research in ISSN: 2278-6236 Management and Social Sciences Impact Factor: 5.313
Vol. 4 | No. 7 | July 2015 www.garph.co.uk IJARMSS | 125
1 INTRODUCTION
The introduction of DTH services in last decade has changed the way people viewed and
make use of the contents on television. First of all, it is the DTH players who created the
competitive environment and, second is the DTH subscribers who are experiencing the
facility of channel selection and paying only for the channels they want to enjoy. The DTH
industry revenue is expected to reach USD 3.9 billion 2017 and USD 5.3 billion by 2020 (MPA
report). Further, the active DTH subscriber base is estimated to reach 76.6 million by 2020,
as compared to 32.4 million in 2012. However, Indian DTH market faces the several
challenges such as, to add new subscribers, to retain existing subscribers, to increase
average revenue per users, to incorporate the latest technology, enhance the service quality
and to increase the level of customer satisfaction to achieve the favourable behavioural
responses in terms of recommending behaviour, complaining behaviour and switching
intensions etc.
In the present competitive market, DTH service providers are not only focusing on the
service quality and on customer satisfaction but also to achieve the desirable behavioural
outcomes. It has been also seen that DTH companies are increasingly focusing on the
retention of their existing subscribers. Thus, to know about the relation between service
quality and behavioural responsive is substantively important for the growth and survival of
any DTH companies. When customers experienced the service quality, they may respond
differently. If one is satisfied with service quality, he may continue use that service and
recommend the service to other. But, if one is not satisfied, then either he switches or
makes a complaint regarding the services. So, it can we said that in order to know the
relationship between service quality and behavioural intensions, we have to identify the
service quality dimensions that influences the recommending behavioural switching
intension and complaining behavioural.
The present paper is an attempt to examine the various factors that influences the DTH
service quality in the selected districted. The study also identifies the service quality
dimensions that influence the customers’ recommending behaviour, switching intensions
and their complaining behaviour.

International Journal of Advanced Research in ISSN: 2278-6236 Management and Social Sciences Impact Factor: 5.313
Vol. 4 | No. 7 | July 2015 www.garph.co.uk IJARMSS | 126
2 LITERATURE REVIEW
Parasuraman et al., (1985) founded that superior service quality helps to acquir new
customers, reduce threat to lost customers. Peters (1987) found that it can cost five times
more to acquire a new consumer than to retain an old one. Accordingly, retaining the
existing customer is much more attractive and viable than searching for new one.
Parasuraman et al., (1988) identified five definite dimensions of service quality that are
Reliability, Responsiveness, Assurance, Empathy and Tangibles. Berry et al., (1994) providing
superior service quality is a profitable strategy and resulted to the addition of new
customers, fewer lost of customers and additional business from existing customers etc.
Keaveney (1995) found that customer switching behavior can damage market share and
profitability. They also said that customers may switch because of the better service, more
personable service or higher quality provided by the competitors. Further, customer
switches not only because of unsatisfactory service but some customers would switch
services even when they are satisfied with their service provider. Zeithaml et al., (1996)
found that superior service quality helps to get desirable behavioral intentions, which
further leads to retention and generate more referred customers. It was also found that
inferior quality resulted to unfavorable behavioral intentions, which consequence to
customer defection from the organization. Edvardsson (1998) found that dissatisfied and
complaining customers might not switch, and the customers - who are satisfied but do not
complain - might switch. Johnston (2001) said that “Mistakes are an unavoidable feature of
all human endeavor and thus also of service delivery” therefore complaints are a natural
consequence of any service activity. Liu et al., (2001) found that ineffective handling of
customers’ complaints increases dissatisfaction, which harms the reputation of a marketer.
Lee and Murphy (2005), investigates the determinants that cause mobile phone Customers
to switching their service provider. It was found that price, technical service quality,
functional quality, switching costs, etc. are the main factors which affect the Customers to
switch from loyalty to switching intentions. Further, price was found as main factor that
affects the customers to switch loyalties to another provider. Morton and Scott (2007)
develop and test an instrument for measuring service quality and use the instrument to
assess the influence of service quality perceptions on clients' intentions to purchase
additional services. The study resulted that superior service quality was associated with

International Journal of Advanced Research in ISSN: 2278-6236 Management and Social Sciences Impact Factor: 5.313
Vol. 4 | No. 7 | July 2015 www.garph.co.uk IJARMSS | 127
recommendations to potential clients and was weakly associated with retention of the audit
firm but was not associated with the provision of additional services. Aseambankers Report,
Press Trust of India (PTI), (2007), report illustrates service quality is the main differentiator
in DTH service. Any good or bad experience with service is directly related with behavioural
outcomes of customers. Sathish et al., (2011) identified the factors and their influence on
the consumers in switching the service provider. They grouped the factors into four
categories as customer service, service problems, usage cost and others. It was found that
call rates plays the most significant role in switching followed by network coverage, value
added services and customer care. Study also resulted that high call rates lead the
consumers to switch the service provider. Baksi and Parida (2011) investigate the
relationship between service quality and switching behavior of customers in the context of
State Bank of India. It was found that the dimensions of reliability, convenience and
responsiveness are significantly important to influence the switching decision of the
customers. The study further stated that a decrease in the perceived reliability, convenience
and responsiveness would increase customers’ switching intension. Reddy (2013) proved
that in case of DTH services, there exist a positive relationship between the advertisement
and customer attitude towards DTH services. Srivastava & Sharma (2013) proposed a
conceptual framework to examine the relationship between service quality, satisfaction,
repurchase intention, and switching behavior. Study indicated an indirect effect of service
quality and corporate brand image on switching behavior via customer satisfaction and
repurchase intention. Further, it confirms that delivering high quality service and a credible
corporate image leads to high customer satisfaction, which consecutively resulted to high
repurchase intension and less switching behavior. Khan and Raj (2013) identify the nine
dimensions of service quality as assurance, reliability, tangibles, empathy, responsiveness,
network quality, convenience, price and other factors. Raj (2015) found that nine
dimensions are positively associated with DTH service quality and the main predictors of the
DTH service quality are Assurance, Empathy, Network Quality, Convenience and Tangibles.
Empathy was found as the best predictor of service quality in DTH services.
3 OBJECTIVES AND HYPOTHESIS
Following main objectives are framed for the present research work.
1. To investigate the effects of service quality on propensity to recommend.

International Journal of Advanced Research in ISSN: 2278-6236 Management and Social Sciences Impact Factor: 5.313
Vol. 4 | No. 7 | July 2015 www.garph.co.uk IJARMSS | 128
2. To investigate the effects of service quality on switching intention.
3. To investigate the effects of service quality on customers’ complaining behaviour.
3.1 Hypothesis
H01; Service quality dimensions do not have significant influence on propensity to
recommend.
H02; Service quality dimensions do not have significant influence on switching intentions.
H03; Service quality dimensions do not have significant influence on customers’ complaining
behaviour.
4 RESEARCH METHODOLOGY
Present study is based on both primary as well as secondary data. The primary data was
collected from the DTH users by using questionnaire to measure their service quality
perception and behavioural intensions. Secondary data was collected through reviewing the
existing literature on service quality, reports of the government organizations and
companies, various journals, magazines and websites of various institutions.
4.1 Sample Size
This research was carried out in district Solan of Himachal Pradesh, which is most
industrialized district of the state, having population 5, 80,320 with literacy rate of 83.68
percent (census 2011). Sample size for present study was 250 which were selected
conveniently from Solan distt. Out of these 250 respondents, 82 were females and 168 were
males.
4.2 Data Collection
For the present study, questionnaire method was used to collect the primary data. The
questionnaire has been developed and designed to address the issues of Direct To Home
(DTH) sector and to investigate all the aspects of service quality and required dimensions of
behavioural intensions. For present survey questionnaire, service quality, propensity to
recommend, switching intensions and complaining behaviour were measured by using
multiple statements on a five point Likert scale. Service quality was measured with nine
dimensions, named as Assurance, Responsiveness, Network Quality, Reliability, Tangibles,
Empathy, Price, Convenience and Service Operations. Convenience sampling technique was
used to collect data from 250 DTH subscribers of various DTH operators. In this study, three
statements were used to measure recommending behaviour, four to switching intensions.

International Journal of Advanced Research in ISSN: 2278-6236 Management and Social Sciences Impact Factor: 5.313
Vol. 4 | No. 7 | July 2015 www.garph.co.uk IJARMSS | 129
These measurements have frequently been utilized in both academic and practitioners’
studies on satisfaction (Brown, et at., 1993). For the present research, customers’
complaining behaviour was operationalised by asking three questions relating to
complaints. SPSS software and Microsoft excel were used to made statistical calculations.
4.3 Statistical Tools
In the present study, the following statistical tools were employed to analysis of data to
make certain conclusions regarding the hypothesis framed.
Correlation Analysis: To analyze the relationship between the independent and the
dependent variables correlation analysis was used. Correlation coefficient exists between -1
to 1.
Correlation= 𝑟𝑠 = 1 − 6Σ𝑑𝑖
2
𝑛 𝑛2 −1
Multiple Regression: The multiple regression analysis was used to find out the relative
contribution of each of the nine dimension influencing overall service quality, propensity to
recommend, switching intentions, and complaining behaviour of the DTH users. In multiple
regression, Stepwise is one of the most sophisticated of these statistical methods. The
model summary reports the values of R, R Square (R2), adjusted R2 and standard error of the
estimate. Further, for each independent variable, tolerance value and variance inflation
factor (VIF) were used to measure the multicolinearity. If we select the option to diagnose
Multicolinearity (Collinearity), SPSS results the variance inflation factor (VIF) and tolerance
value. Statistical calculations have been made, with the help of Microsoft excel and SPSS
Version-16.0.
5 DATA ANALYSIS
In order to achieve the research objectives, we have divided the present section into three
sections. First deals with the demographic profile of the respondents, Second part provides
the information about the determinants of DTH service quality and third informs about the
various DTH service quality dimensions that affects behavioural intensions of DTH
subscribers.
5.1 Demographic Characteristics of Respondents
In order to construct and execute the effective marketing strategies successfully, the DTH
operators are required to maintain up-to-date profile information of the customers to build
International Journal of Advanced Research in ISSN: 2278-6236 Management and Social Sciences Impact Factor: 5.313
Vol. 4 | No. 7 | July 2015 www.garph.co.uk IJARMSS | 130
the customer-database. The questionnaire used for the study consists of a section of
customer’s profile that include age, gender, educational level, income, profession and other
socio-demographic information of the respondents.
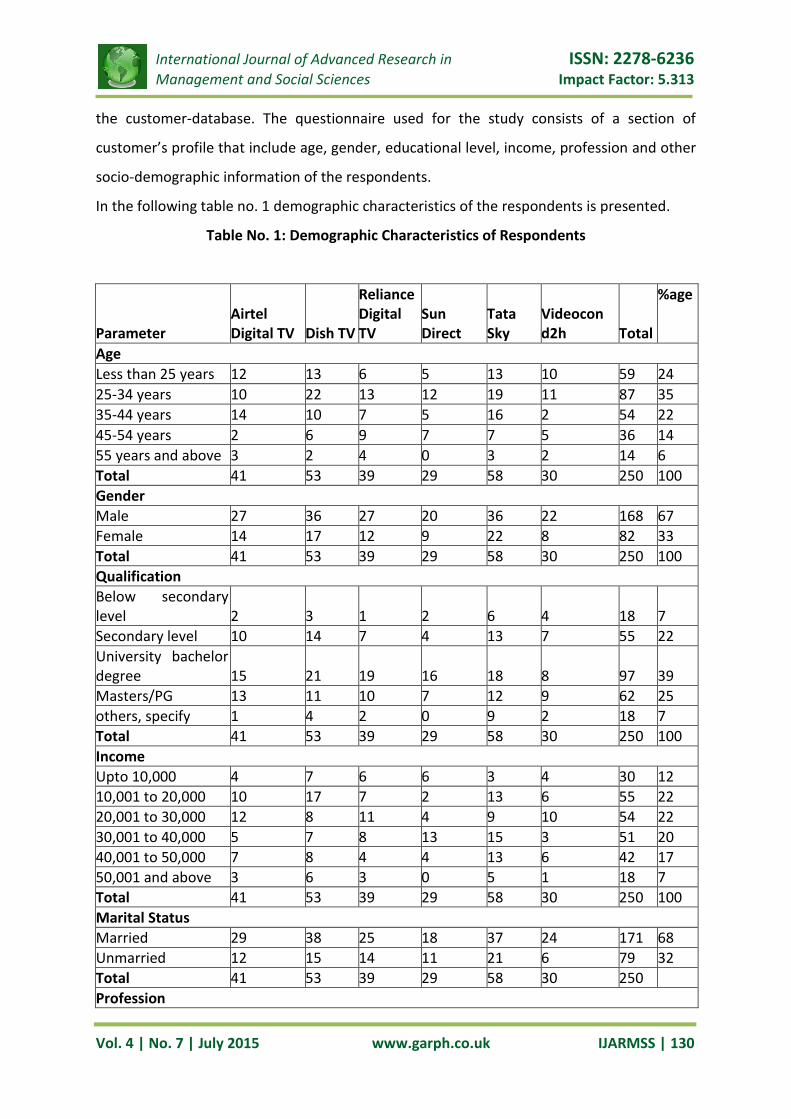
In the following table no. 1 demographic characteristics of the respondents is presented.
Table No. 1: Demographic Characteristics of Respondents
Parameter Airtel Digital TV Dish TV
Reliance Digital TV
Sun Direct
Tata Sky
Videocon d2h Total
%age
Age
Less than 25 years 12 13 6 5 13 10 59 24
25-34 years 10 22 13 12 19 11 87 35
35-44 years 14 10 7 5 16 2 54 22
45-54 years 2 6 9 7 7 5 36 14
55 years and above 3 2 4 0 3 2 14 6
Total 41 53 39 29 58 30 250 100
Gender
Male 27 36 27 20 36 22 168 67
Female 14 17 12 9 22 8 82 33
Total 41 53 39 29 58 30 250 100
Qualification
Below secondary level 2 3 1 2 6 4 18 7
Secondary level 10 14 7 4 13 7 55 22
University bachelor degree 15 21 19 16 18 8 97 39
Masters/PG 13 11 10 7 12 9 62 25
others, specify 1 4 2 0 9 2 18 7
Total 41 53 39 29 58 30 250 100
Income
Upto 10,000 4 7 6 6 3 4 30 12
10,001 to 20,000 10 17 7 2 13 6 55 22
20,001 to 30,000 12 8 11 4 9 10 54 22
30,001 to 40,000 5 7 8 13 15 3 51 20
40,001 to 50,000 7 8 4 4 13 6 42 17
50,001 and above 3 6 3 0 5 1 18 7
Total 41 53 39 29 58 30 250 100
Marital Status
Married 29 38 25 18 37 24 171 68
Unmarried 12 15 14 11 21 6 79 32
Total 41 53 39 29 58 30 250
Profession

International Journal of Advanced Research in ISSN: 2278-6236 Management and Social Sciences Impact Factor: 5.313
Vol. 4 | No. 7 | July 2015 www.garph.co.uk IJARMSS | 131
Service 16 19 17 16 22 9 99 40
Own business 17 22 12 10 19 12 92 37
Student 3 9 4 2 10 7 35 14
Others, (Specify) 5 3 6 1 7 2 24 10
Total 41 53 39 29 58 30 250 100
Duration of Dealing
Less than 1 year 3 5 6 2 14 4 34 14
1-2 years 10 12 9 1 9 8 49 20
2-3 years 14 15 12 9 9 7 66 26
3-4 years 5 11 3 10 12 11 52 21
4-5 years 3 7 7 4 9 0 30 12
5 years and above 6 3 2 3 5 0 19 8
Total 41 53 39 29 58 30 250 100
Monthly Expenditure
Less than 250 24 38 26 23 35 21 167 67
251 to 350 11 10 7 5 14 6 53 21
351 to 450 6 3 5 1 6 2 23 9
451 and above 0 2 1 0 3 1 7 3
Total 41 53 39 29 58 30 250 100
Source: - Data Collected through Questionnaire Method
Table 1 represents the demographic characteristics of the respondents used for the study.
The results shows that about 35 percent of the respondents belong to the age group 25-34
years followed by the age group less than 25 years about 24 percent, respondents having
age 55 years and above are only 6 percent. The results indicate that about 67 percent of the
respondents are male and 33 percent are female respondents. This section describes the
education level of the respondents and states that 39 percent of the respondents have
university bachelor degree and about 25 percent having Master/PG qualification while only
7 percent were having below secondary education. Talking about the income of the
respondents, the results enumerate that 22 percent of the respondents lies in the income
group 10,001 to 20,000 per month, only 7 percent respondents having income above 50,000
per month.
5.2 Relationship between Service Quality and Customers’ Behaviour Intensions
The result of Pearson correlation presents that dimensions of service quality are positively
associated with service quality, propensity to recommend, switching intentions and
customers’ complaining behaviour. Further, strongest association was found between
service quality and Network Quality, propensity to recommend and Tangibles, switching

International Journal of Advanced Research in ISSN: 2278-6236 Management and Social Sciences Impact Factor: 5.313
Vol. 4 | No. 7 | July 2015 www.garph.co.uk IJARMSS | 132
intentions and price and customers’ complaining behaviour and Service Operations (Table
2).
Table No. 2: Correlation Analysis
Assurance Reliability Tangibles Empathy
Respon-siveness
Network Quality
Conve-nience
Price Service
Operations
Service Quality 0.539 0.480 0.556 0.484 0.389 0.586 0.434 0.209 0.394
Recommending Behaviour
0.338 0.211 0.461 0.315 0.326 0.436 0.269 0.297 0.433
Switching Intension
0.134 0.215 0.241 0.152 0.186 0.337 0.237 0.352 0.210
Complaining Behaviour
0.149 0.183 0.225 0.195 0.179 0.213 0.212 0.326 0.330
To find out the best determinants and to identify which aspects of the service quality has
significant influence on service quality, propensity to recommend, switching intentions and
customers’ complaining behaviour, stepwise regression was used with the dimensions of
service quality as the predictors. The model summary reports the strength of the
relationship between the model and the dependent variable. Here, nine dimensions of
service quality were taken as independent variables and the overall perceived service
quality, propensity to recommend, switching intentions, and complaining behaviour of the
DTH users are used as a dependent variable.
The above relationship can defined mathematically as.
Y= α + β1x1 + β2x2 + β3x3+ β4x4 + β5x5 + β6x6 + β7x7 + β8x8 + β9x9
Where Y= dependent variable (overall perceived service quality, propensity to recommend,
switching intentions, and complaining behaviour)
α is constant.
x1, x2, x3, x4, x5, x6, x7, x8, x9 are dimensions of service quality.
β1, β2, β3, β4, β5, β6, β7, β8, β9 are coefficients of the dimensions of dependent variable
(overall perceived service quality, propensity to recommend, switching intentions, and
complaining behaviour)
5.3 Relationship between Service Quality and Its Dimensions
It can be seen (Table 3) that regression model explained 86.6 percent of the variance in the
DTH service quality construct. As shown in table 4, there are only five variables (Network
Quality, Tangibles, Assurance, Convenience and Price) added from the original nine and are
significant predictors of service quality in DTH sector.

International Journal of Advanced Research in ISSN: 2278-6236 Management and Social Sciences Impact Factor: 5.313
Vol. 4 | No. 7 | July 2015 www.garph.co.uk IJARMSS | 133
Table No. 3: Service Quality and Dimensions of Service Quality
Model R R2 Adjusted R2 Std Error of Estimate
5 0.932 0.869 0.866 3.048
Table No.4: Stepwise Regression Analysis: Service Quality
Variable Beta t- Value Significance level Collinearity Statistics
(Constant) 7.168 0.000 Tolerance VIF
Network Quality
0.395 16.333 0.000 0.919 1.088
Tangibles 0.425 17.913 0.000 0.958 1.044
Assurance 0.412 17.266 0.000 0.945 1.058
Convenience 0.288 12.115 0.000 0.950 1.052
Price 0.256 10.969 0.000 0.990 1.010
5.4 Relationship between Service Quality and Behaviour Intensions
As shown in table 6, there are only four variables (Tangibles, Service Operations, Assurance
and Price) added from the original nine and are significant predictors of Recommending
Behaviour of DTH users.
Table No. 5: Recommending Behaviour and Dimensions of Service Quality
Model R R2 Adjusted R2 Std Error of Estimate
3 0.451 0.373 0.368 2.079
Table No.6: Stepwise Regression Analysis: Recommending Behaviour
Variable Beta t- Value Significance level Collinearity Statistics
(Constant) 2.380 0.018 Tolerance VIF
Tangibles 0.314 3.502 0.000 0.959 1.043
Service Operations
0.286 3.093 0.001 0.970 1.031
Assurance 0.226 2.578 0.002 0.964 1.037
Price 0.145 2.056 0.022 0.953 1.000
As shown in table 8, there are only two variables (Price and Network Quality) added from
the original nine and are significant predictors of Switching Intension of DTH users.
Table No. 7: Switching Intension and Dimensions of Service Quality
Model R R2 Adjusted R2 Std Error of Estimate
2 0.295 0.223 0.219 1.760

International Journal of Advanced Research in ISSN: 2278-6236 Management and Social Sciences Impact Factor: 5.313
Vol. 4 | No. 7 | July 2015 www.garph.co.uk IJARMSS | 134
Table No.8: Stepwise Regression Analysis: Switching Intension
Variable Beta t- Value Significance level Collinearity Statistics
(Constant) 27.759 0.000 Tolerance VIF
Price 0.152 2.418 0.016 1.000 1.000
Network Quality
0.144 2.045 0.000 0.939 1.065
As shown in table 10, there are only two variables (Service Operations and Price) added
from the original nine and are significant predictors of Complaining Behaviour of DTH users.
Table No. 9: Complaining Behaviour and Dimensions of Service Quality
Model R R2 Adjusted R2 Std Error of Estimate
2 0.290 0.153 0.148 1.782
Table No.10: Stepwise Regression Analysis: Complaining Behaviour
Variable Beta t- Value Significance level Collinearity Statistics
(Constant) 21.673 0.000 Tolerance VIF
Service Operations
0.230 2.068 0.040 1.000 1.000
Price 0.185 2.195 0.028 1.000 1.000
5.5 Hypothesis Testing
The dimensions of Tangibles, Service Operations, Assurance and Price were found as the
dimensions of Recommending Behaviour of DTH users. Thus, the hypothesis H01; Service
quality dimensions do not have significant influence on propensity to recommend is partially
accepted.
It can be seen in table no. 8, Price and Network Quality were found as the significant
predictors of Switching Intension of DTH users. So, hypothesis H02; Service quality
dimensions do not have significant influence on switching intentions is partially accepted.
It was found that Service Operations and Price are the two main determinants of
complaining behaviour of DTH users, therefore, hypothesis H03; Service quality dimensions
do not have significant influence on customers’ complaining behaviour is partially accepted.
6 FINDINGS
From the present study, major findings drawn are as under:
1. Most of the respondents are from the age group 25-34 years and male respondents
in the present study were about 67 percent. It was found that majority of the

International Journal of Advanced Research in ISSN: 2278-6236 Management and Social Sciences Impact Factor: 5.313
Vol. 4 | No. 7 | July 2015 www.garph.co.uk IJARMSS | 135
respondents are well qualified and total married respondents are 68 percent. The
income groups 10,001 to 20,000 and 20,001to 30,000 rupees per month, each having
about 22 percent of the total customers.
2. Results informed that about 26 percent of respondents are using DTH services from
last 2-3 years. It was also found that about 67 percent of the total respondents are
paying less than 250 rupees per month on DTH services.
3. It was found that nine dimensions are positively associated with DTH service quality
and the main predictors of the DTH service quality are Network Quality, Tangibles,
Assurance, Convenience and Price. The dimension of Tangibles was found as the best
predictor of service quality in DTH services.
4. A positive association was found between the dimensions of DTH service quality and
propensity to recommend, switching intentions and customers’ complaining
behaviour.
5. For recommending behaviour, dimensions of Tangibles, Service Operations,
Assurance and Price, for switching intensions, dimensions of Price and Network
Quality, and for complaining behaviour, dimensions of Service Operations and Price
were found as significant determinants.
6. The dimensions of Price and Service operations are the dimensions that influence
the customers’ behavioural intensions most.
7 CONSTRUCTIVE SUGGESTIONS
In order to improve the DTH service quality, DTH operators should have to focus on the
dimensions of Network Quality, Tangibles, Assurance, Convenience and Price. DTH service
providers have to provide modern and upgraded technology, and also have to focus upon
the network quality. To increase the customers’ tendency to recommend the DTH services,
service providers have to put their efforts on Tangibles, Service Operations, Assurance and
Price. Service providers should make attempt to improve Price and Network Quality, as both
of these found significant drivers in switching intensions. The dimensions of Service
Operations and Price influence the complaining behaviour of the customers. Therefore, DTH
companies have tried to meet budget objectives, provide services at reasonable price,
ensure an accurate billing system and put efforts to aware the customers about their new
services and plans.

International Journal of Advanced Research in ISSN: 2278-6236 Management and Social Sciences Impact Factor: 5.313
Vol. 4 | No. 7 | July 2015 www.garph.co.uk IJARMSS | 136
8 CONCLUSION
This research paper has outlined the dimensions of DTH service quality and its relationship
with behaviour intensions. A significant positive relationship was found between DTH
service quality and its dimensions. Network Quality, Tangibles, Assurance, Convenience and
Price were found as the main governing dimensions of DTH service quality. A significant
relationship exists between the dimensions of service quality and behaviour intensions. For
recommending behaviour, dimensions of Tangibles, Service Operations, Assurance and
Price, for switching intensions, dimensions of Price and Network Quality, and for
complaining behaviour, dimensions of Service Operations and Price were found as
significant determinants. Therefore, in the light of above stated facts, it can be said that DTH
service providers have to focus on Price and Service operations to obtain desirable
behavioural responses.
9 REFERENCES
1. Baksi AK and Parida BB (2011), Service quality and switching behavior of customers,
Management Science Letters, Vol. 1, pp. 405–414.
2. Berry LL, Parasuraman A and Zeithaml VA (1994), Improving services quality in
America lessons learned. Academy of Management Excellence. Vol. 8, No. 2, pp. 32-
52.
3. Brown TJ, Churchill GA and Peter JP (1993), Improving the measurement of service
quality. Journal of Retailing, Vol. 69, No. 1, pp. 127-139.
4. Edvardsson Bo (1988), Service quality in customer relationships: A study of critical
incidents in mechanical engineering companies. The Service Industries Journal, Vol. 8,
No. 4, pp. 427- 445.
5. Johnston R (2001), Linking complaint management to profit, International Journal of
Service Industry Management, Vol. 12, No. 1, pp. 60-69.
6. Keaveney SM (1995), Customer switching behavior in service industries: an
exploratory study. Journal of Marketing, Vol. 59, pp. 71-82.
7. Khan S and Raj L (2013), A study on direct to home service quality with special
reference to Mandi district of Himachal Pradesh. International Journal of Education
& Management Studies, Vol.3, No.4, pp. 431-436.

International Journal of Advanced Research in ISSN: 2278-6236 Management and Social Sciences Impact Factor: 5.313
Vol. 4 | No. 7 | July 2015 www.garph.co.uk IJARMSS | 137
8. Lee R and Murphy J (2005), From loyalty to switching: Exploring determinants in the
transition, ANZMAC 2005, Perth, Australia, December. 2005.
9. Morton A and Scott D (2007), The association between perceived audit firm service
quality and behavioural intentions, The Journal of Contemporary Issues in Business
and Government, Vol. 13, No. 2, pp. 17-30.
10. Parasuraman A, Zeithaml VA and Berry LL (1985), A conceptual model of service
quality and its implications for future research. Journal of Marketing, Vol. 49, pp. 41-
50.
11. Parasuraman A, Zeithaml VA and Berry LL (1988), SERVQUAL: A multiple-item scale
for measuring consumer perceptions of service quality. Journal of Retailing. Vol. 64,
No. 1, pp. 12-40.
12. Peters T (1987), Thriving on Chaos, Alfred A. Knopf, New York, NY.1987.
13. Liu R, Raymond, McClure and Peter (2001), Recognizing cross-cultural differences in
consumer complaint behavior and intentions: An empirical examination, Journal of
Consumer Marketing, Vol. 18, No. 1, pp. 54-74.
14. Raj L (2015), Service quality and customer satisfaction in DTH Services in Kangra,
Himachal Pradesh. International Journal of Research in Computer Application &
Management. Vol. 5, No. 1, pp. 111-115.
15. Reddy SSK (2013), Factors motivating customers towards DTH services in Andhra
Pradesh. IJSR - International Journal of Scientific Research, Vol. 2, No. 7, pp. 256-257.
16. Sathish M, Kumar KS, Naveen KJ and Jeevanantham V (2011), A study on consumer
switching behaviour in cellular service provider: A study with reference to Chennai.
Far East Journal of Psychology and Business. Vol. 2, No. 2, pp. 71-81.
17. Srivastava K and Sharma NK (2013), Service quality, corporate brand image, and
switching behavior: The mediating role of customer satisfaction and repurchase
intention, Services Marketing Quarterly, Vol. 34, No. 4, pp. 274-291.
18. Zeithaml VA, Berry LL and Parasuramann A (1996). The behavioral consequences of
service quality. Journal of Marketing, Vol. 60, pp. 31-46.
19. India Set to Become Asia's Largest DTH Market. Aseambankers Report, Press Trust of
India, April, 2007. Available from:
http://www.financialexpress.com/old/latest_full_story.php?content_id=161738

International Journal of Advanced Research in ISSN: 2278-6236 Management and Social Sciences Impact Factor: 5.313
Vol. 4 | No. 7 | July 2015 www.garph.co.uk IJARMSS | 138
20. http://www.census2011.co.in/census/district/237-solan.html
21. http://www.cablequest.org/interviews/item/5652-trends-and-technologies-in-the-
dth-sector-indian-dth-companies-may-be-the-first-in-the-world-to-provide-
commercial-4k-broadcast-in-2015.html
22. http://gadgets.ndtv.com/tv/news/india-to-have-766-million-dth-subscribers-by-
2020-study-354870