0 3 5 $ - core · the study intends to find speed of convergence by estimating ... he considered...
TRANSCRIPT
MPRAMunich Personal RePEc Archive
Relative City Price Convergence inPakistan: Empirical Evidence fromSpatial GLS
Mohsin, Hasan M and Gilbert, Scott
Southern Illinois University Carbondale, USA, Pakistan
Institute of Development Economics Islamabad
10. December 2010
Online at http://mpra.ub.uni-muenchen.de/27901/
MPRA Paper No. 27901, posted 05. January 2011 / 17:58
26TH ANNUAL GNERAL MEETING OF PSDE
By
Hasan Muhammad Mohsin and Scott Gilbert 12/28/1930
The study estimates relative city price convergence using CPI data from July 2001 to June 2008 on 35 Pakistani cities. Two cities Lahore and Karachi are chosen to be the numeraire cities. The half life of relative city price shock has also been estimated. The study finds average half life of price shock to be less than 5 months but it varies from 1.3 to 68 months in the case of individual cities. The estimates of Spatial GLS are found to be lower than OLS which may imply that Spatial Correlations are important factor for the estimation of half life. Furthermore, the average half life of a price shock in Lahore is less than that of Karachi.
2
The Relative City Price Convergence in an emerging economy: Empirical Evidence from Spatial GLS
I. Introduction:
It is evident from general experience that price of same good may differ considerably among
countries, regions, cities in same country and even adjacent shopping malls and outlets. It is also
common knowledge that stronger competitive forces and information about market price tend to
ensure convergence of prices. In the presence of these forces price differentials cannot be
persistent and are hence short lived.
The recent literature on price convergence has focused on country studies using regional
commodity prices and Consumer Price Index (CPI) data.1 The analysis of relative prices or real
exchange rates between regions or cities in a country has certain advantages in estimating
Purchasing Power Parity (PPP) puzzle. There are no trade barriers and non tradable goods in a
single country. Krugman and Obstfeld (2007) consider transportation costs, trade barriers and
goods market segmentations as obstacles to hold international PPP. Furthermore they mention
that countries have different endowments, baskets of goods and consumption weights in their
inflation index. So PPP may not hold even if there are no non tradable goods and barriers. The
PPP theory is related to the law of one price through arbitrage of international goods. The
estimation of real exchange rates among countries shows that the convergence towards PPP is
1 Cecchetti et al (2002), Morshed (2005), Chmelarova and Nath (2010), Lan and Sylwester (2010)
3
very slow.2 This study attempts to use overall Consumer Price Index (CPI) data on 35 Pakistani
cities from July 2001 to June 2008 to estimate relative city price convergence with Karachi and
Lahore, two numeraire cities. The case of Pakistan is interesting primarily due to the following
reasons.
First interesting aspect is the geographical location and diversified regions in Pakistan. Pakistan
is in South Asian region consists of five provinces i.e. Punjab, Sindh, Baluchistan, Khyber
Pakhtunkhwa (KP) and Gilgit Baltistan (GB). Each province has its own regional language and
ethnicity but they communicate in national language with each other. Furthermore, each
province shares some international border e.g. Punjab and Sindh with India, KP with
Afghanistan, Baluchistan with Iran and Afghanistan and Gilgit Baltistan with China.3
Second, there is also evidence of illegal trade on these borders. 4
Similarly there are also reports of illegal trade on the eastern borders with India with its worth
ranging $ 0.5 to $3 billion. 5. There is a possibility that price levels in bordering cities do not
converge with the two major cities in Pakistan in the presence of illegal trade in the presence of
cheap smuggled goods.6
Third, there is evidence that some cities have persistently higher inflation than others. The State
Bank of Pakistan’s (SBP’s) Inflation Monitor January 2010 states that 19 cities recorded higher
2 “Consensus estimates suggest, however, that the speed of convergence to PPP is extremely slow” Rogoff (1996) 3 The data on inflation in GB province is not reported in Inflation Monitor of SBP, so not included in my study. 4 Sharif M et al (2000) mentioned smuggled commodities and identified major routes of smuggling on Pakistan-Iran and Pakistan-Afghanistan borders. 5 For details see Khan Shaheen R. (2005) “Can illegal trade between Pakistan and India be eliminated?” SDPI 6 The estimation of border effects is not the scope of this study due to data limitations.
4
than over all Year on Year (YOY) inflation in January 2010. The 16 cities recorded lower than
average inflation.
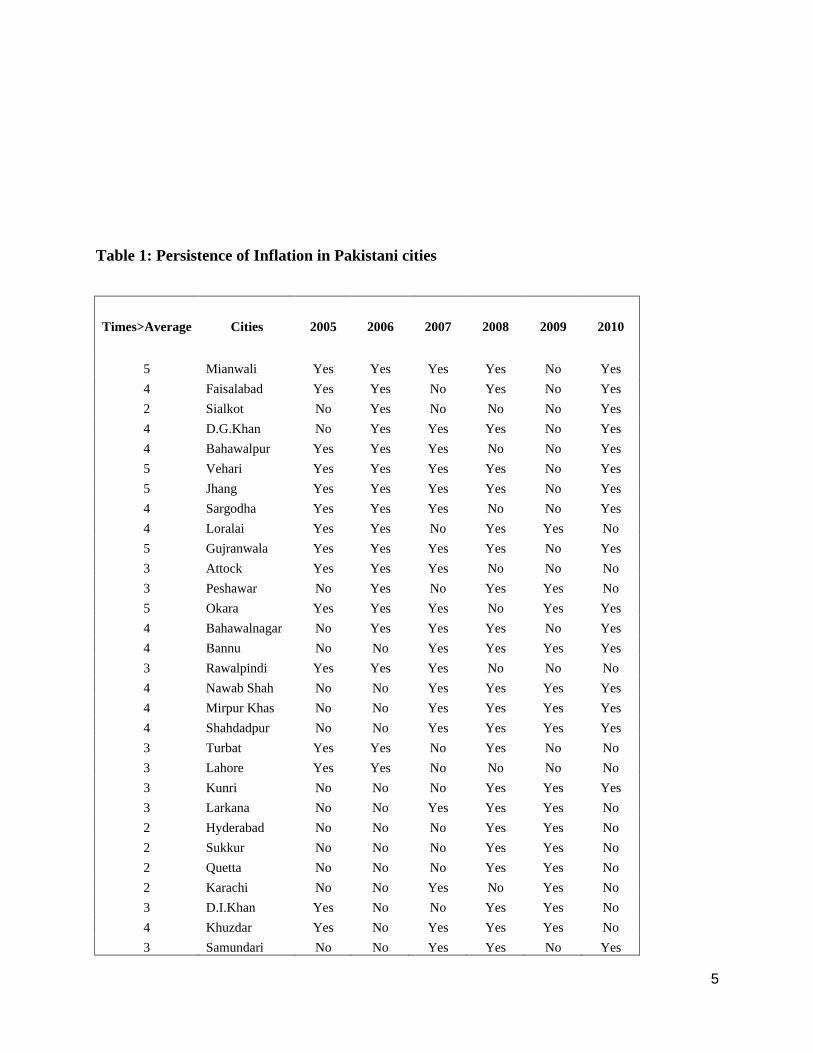
The Table 1a ranks cities with higher or lower than average inflation based on Inflation Monitor
of SBP various issues. Five cities in Punjab named Mianwali, Jhang, Okara, Vehari and
Gujranwala showed more than average inflation in 5 years out of 6 years 2005-2010. There are
11 cities in which the inflation has recorded 4 out of 6 years higher than average inflation in
Pakistan. These cities include Faisalabad, Sargodha, Dera Ghazi Khan, Loralai, Khuzdar,
Bahawalpur, Bahawalnagar, Bannu, Nawabshah, Mirpurkhas and Shadadpur. The persistence of
more than average inflation seems to higher in Punjab province since 7 out of 11 high inflation
cities are located in Punjab province.
A high and persistent variability of regional inflation with in a country has adverse effects on the
standard of living. 7 It can cause internal regional migration due to persistent lower real wage.
The study intends to find speed of convergence by estimating half life of price shock. Since the
idea is to estimate relative price convergence, the numeraire cities are chosen to be Karachi and
Lahore. They have highest population and they are urban commercial centers. Lahore is capital
of province Punjab and can be considered as a central market for agricultural produce.8 Karachi
is capital of province Sindh and center of industrial and economic activity. The highest
proportion of income tax is collected from Karachi.9
.
7 Das and Bhattacharya (2008) 8 Zahid M Sarwar et al. (2007) 9 Federal Bureau of Revenue (FBR) Year Book 2009
5
Table 1: Persistence of Inflation in Pakistani cities
Times>Average Cities 2005 2006 2007 2008 2009 2010
5 Mianwali Yes Yes Yes Yes No Yes
4 Faisalabad Yes Yes No Yes No Yes
2 Sialkot No Yes No No No Yes
4 D.G.Khan No Yes Yes Yes No Yes
4 Bahawalpur Yes Yes Yes No No Yes
5 Vehari Yes Yes Yes Yes No Yes
5 Jhang Yes Yes Yes Yes No Yes
4 Sargodha Yes Yes Yes No No Yes
4 Loralai Yes Yes No Yes Yes No
5 Gujranwala Yes Yes Yes Yes No Yes
3 Attock Yes Yes Yes No No No
3 Peshawar No Yes No Yes Yes No
5 Okara Yes Yes Yes No Yes Yes
4 Bahawalnagar No Yes Yes Yes No Yes
4 Bannu No No Yes Yes Yes Yes
3 Rawalpindi Yes Yes Yes No No No
4 Nawab Shah No No Yes Yes Yes Yes
4 Mirpur Khas No No Yes Yes Yes Yes
4 Shahdadpur No No Yes Yes Yes Yes
3 Turbat Yes Yes No Yes No No
3 Lahore Yes Yes No No No No
3 Kunri No No No Yes Yes Yes
3 Larkana No No Yes Yes Yes No
2 Hyderabad No No No Yes Yes No
2 Sukkur No No No Yes Yes No
2 Quetta No No No Yes Yes No
2 Karachi No No Yes No Yes No
3 D.I.Khan Yes No No Yes Yes No
4 Khuzdar Yes No Yes Yes Yes No
3 Samundari No No Yes Yes No Yes
6
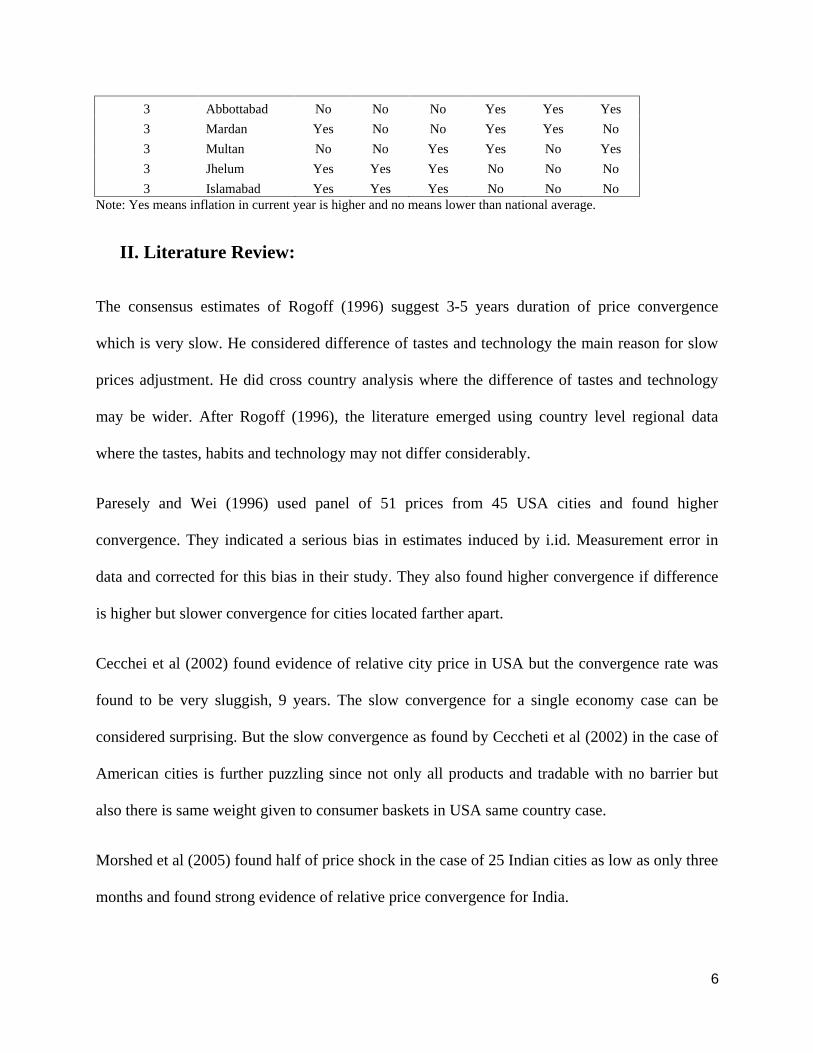
3 Abbottabad No No No Yes Yes Yes
3 Mardan Yes No No Yes Yes No
3 Multan No No Yes Yes No Yes
3 Jhelum Yes Yes Yes No No No
3 Islamabad Yes Yes Yes No No No Note: Yes means inflation in current year is higher and no means lower than national average.
II. Literature Review:
The consensus estimates of Rogoff (1996) suggest 3-5 years duration of price convergence
which is very slow. He considered difference of tastes and technology the main reason for slow
prices adjustment. He did cross country analysis where the difference of tastes and technology
may be wider. After Rogoff (1996), the literature emerged using country level regional data
where the tastes, habits and technology may not differ considerably.
Paresely and Wei (1996) used panel of 51 prices from 45 USA cities and found higher
convergence. They indicated a serious bias in estimates induced by i.id. Measurement error in
data and corrected for this bias in their study. They also found higher convergence if difference
is higher but slower convergence for cities located farther apart.
Cecchei et al (2002) found evidence of relative city price in USA but the convergence rate was
found to be very sluggish, 9 years. The slow convergence for a single economy case can be
considered surprising. But the slow convergence as found by Ceccheti et al (2002) in the case of
American cities is further puzzling since not only all products and tradable with no barrier but
also there is same weight given to consumer baskets in USA same country case.
Morshed et al (2005) found half of price shock in the case of 25 Indian cities as low as only three
months and found strong evidence of relative price convergence for India.
7
Imbs et al (2005) in their seminal paper showed importance of dynamic aggregation bias in
estimating PPP. They found higher rate of convergence among real exchange rates when
heterogeneity is taken in to account. The main argument is that all the goods which are part of
CPI do not converge at the same speed. They estimated half life to be less than a year, 11
months.
Das and Bhattacharya (2008) used monthly data on Indian regions from January 1995 to June
2004 and estimated price convergence across Indian regions using panel unit root tests robust to
cross sectional dependence. They found that relative price levels are mean reverting in Indian
regions. The estimated lowest half life is estimated to 6.7 months for Kerala and as highest as
25.80 months for Uttar Pradesh. The all states half life is 18.85 months and all centers is 19.83
months.
Sonara Robert (2009) addressed the issue of structural breaks using city price data from USA
over the period 1918- 1997. He used Zivot and Andrew (1992) and Perron-Vogesang (1992) unit
roots tests with structural breaks and found relative prices to be stationary. The structural breaks
are found significant and convergence rates found to be lower than panel unit root tests.
Chmelarova and Nath (2010) used annual CPI data of 17 USA cities from 1917-2007 and
constructed relative city price panels with each city as numeraire. They used Cross Sectional
Augmented Dickey Fuller Test (CADF, 2007) and found that choice of numeraire city matters
for relative city price convergence analysis. They also adjusted the estimates for bias and found a
smaller half life of a price shock. But the speed of convergence is estimated to be low. They
decomposed the relative price series in to common factor and idiosyncratic factor. The lack of
convergence in six cities is due to non stationarity of common factor.
8
Lan and Sylwester (2010) used commodity price data from 36 cities in China to examine rate of
convergence following idiosyncratic shock. The study used fixed effect model for individual
goods panels and mean group method for all goods. They found evidence of convergence at
faster rates and estimated half life few months, smaller than other studies.
Fan and Wei (2006) used 7 years monthly CPI data of 36 Chinese cities and applied panel unit root tests
to find price convergence. They found that price levels across Chinese cities are mean reverting and
duration of half life of price shock is as low as 3-4 months. They consider the use of high frequency time
series data in finding fast rate of convergence as suggested by Taylor (2001).
III. Methodology and Data:
My study attempts to use monthly Consumer Price Index (CPI) data of 35 Pakistani cities from
July 2001 to June 2008. The data has been compiled from Monthly Bulletin of Statistics various
issues by Federal Bureau of Statistics. The study intends to use panel data techniques of fixed
effect model with cross section slope dummies. Furthermore in the presence of spatial
dependence among cross section units it is also useful to use Spatial Generalized Least Square
(GLS) method and compare the results. The relative city prices or exchange rates have been
calculated as following:
(1)
9
i=1 …N cities and t=1 ….T time periods or months; b =1, 2 the base or numeraire cities
In log form Equation 1 can be written as
(2)
The objective is to estimate model with varying intercept and cross section slope dummies as
an AR (1) process to check the stationarity of relative price series:
(3)
The relative price is converging if individual cross section
where rho is
autoregressive coefficient. The following hypothesis will be tested:
The OLS assumes that error term is homoskedastic and not serially correlated that is
and . The OLS estimator is best linear unbiased, consistent and
asymptotically normally distributed.10 However if the variance covariance matrix from
Equation 3 is not homoskedastic, the least squares estimator is still unbiased and consistent.
But the sample variance is biased estimator of
when disturbances are hetroskedastic.
“When the covariance matrix of the disturbance vector is not scalar, multiple of identity
matrix, it is well known that GLS estimator provides best linear unbiased estimator in
contrast to OLS. 11
10 For details see Greene’s text book 11 Gotu Butte (2001)
10
In this case ; the estimation of GLS requires weighting of variables and the
weights can be taken from the variance covariance matrix of estimated residuals from
Equation 3.
(4)
After the transformation of Equation 4, it can be written as
= + (5)
Here
The autoregressive coefficient, rho in Equation 5 can be considered as the spatial
autoregressive coefficient since the covariance matrix from Equation usually contains spatial
unknown parameters like spatial correlations. The Equation 5 can be estimated by OLS.
The other objective is to estimate half life of a price shock. The convergence of price shock
may be slow or fast depending upon the half life of a price shock. The study uses following
formula to estimate half life of price shock;
(6)
My study applies OLS and GLS both the techniques and provides estimates for comparison.
IV: Discussion of Empirical Findings
11
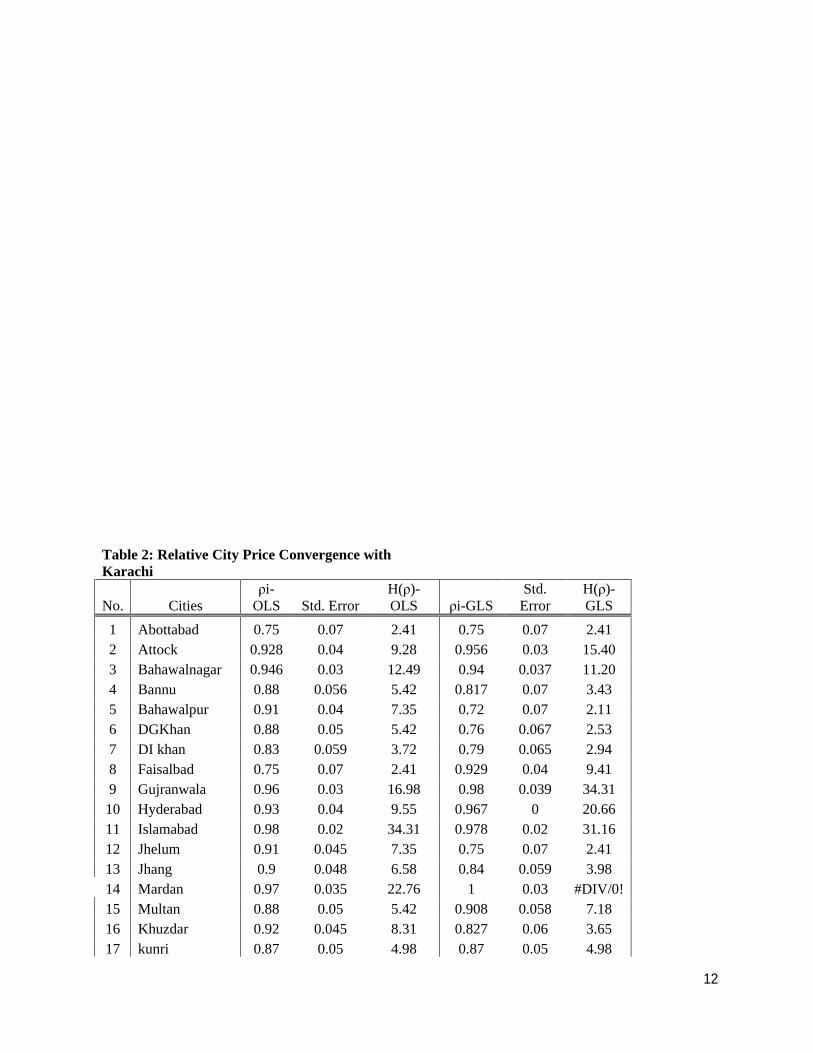
The relative city prices convergence with numeraire city Karachi are reported in Table 2. The rho
coefficient based on the average of 34 cities is 0.88 with OLS. The half life has been estimated to
be 5.4 months which is less than 6 months. The individual cities results are different. The highest
half life is estimated in the case of Islamabad, the capital territory at 34.3 months. It is almost 3
years. The city of Sialkot showed lowest half life of 1.4 months with Karachi. The other cities
who remained below average half life are Faisalabad, Abbotabad, Okara, Lahore, Dera Ghazi
Khan, Multan, Sukkur, Shadadpur, Larkana, Kunri and Dera Ismaeel Khan and Bannu. The
other 19 cities are above average in terms of half life when the results are estimated with OLS.
The average rho coefficient is estimated at 0.87 with GLS less than 0.88 with OLS. The half life
is estimated as 4.98 which are also less than 5.4 estimates with OLS. The highest half life is
estimated for Nawab Shah and Vehari as 68.97 months. It means that half life is almost 6 years
for these two cities. The lowest half life is estimated for city of Bahawalpur as 2.11 months.
Some cities have more than average half life of 4.98 months e.g. Attock, Bahawalnagar,
Gujranwala, Islamabad, Hyderabad, Multan, Lahore, Larkana, Loralai, Nawabshah, Rawalpindi,
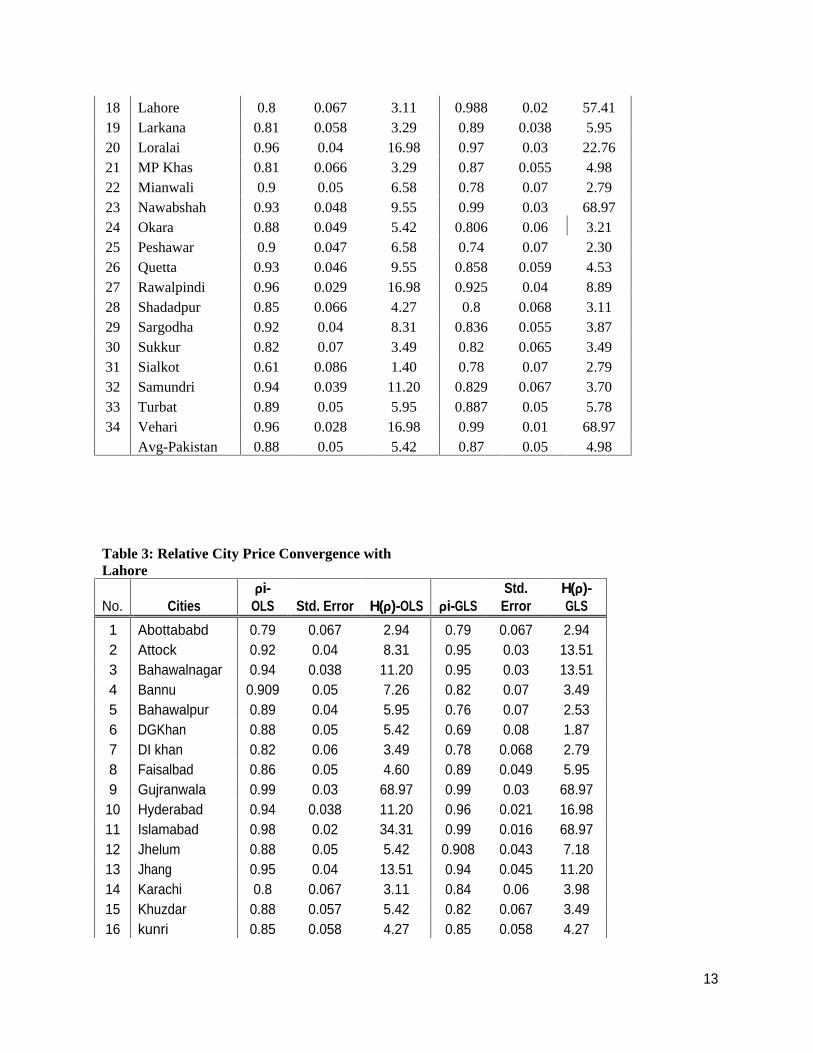
Turbat and Vehari. In the case of Mardan, the relative city price does not converge with Karachi.
Its rho coefficient is estimated to be unit root and hence not stationary.12 The distance of Mardan
from Karachi is almost 730 miles. Some other cities like Abottabad, and Sialkot have more miles
distance from Karachi but relative prices are converging there with Karachi. Similarly Islamabad
and Rawalpindi are also more than 700 miles but maybe it’s safer to travel there. The cities with
equal to and less than 3 months of half life are Sialkot, Shadadpur, Peshawar, Mianlwali, Jhelum,
Bahawalpur, Dera Ghazi Khan, Dera Ismaeel Khan, and Abboabad.
12 Mardan is in KP province and distance wise close to Swat and tribal areas where war against extremists is being fought
12
Table 2: Relative City Price Convergence with Karachi
No.
Cities i-
OLS Std. Error H( )-OLS i-GLS
Std. Error
H( )-GLS
1 Abottabad 0.75 0.07 2.41 0.75 0.07 2.41 2 Attock 0.928 0.04 9.28 0.956 0.03 15.40 3 Bahawalnagar 0.946 0.03 12.49 0.94 0.037 11.20 4 Bannu 0.88 0.056 5.42 0.817 0.07 3.43 5 Bahawalpur 0.91 0.04 7.35 0.72 0.07 2.11 6 DGKhan 0.88 0.05 5.42 0.76 0.067 2.53 7 DI khan 0.83 0.059 3.72 0.79 0.065 2.94 8 Faisalbad 0.75 0.07 2.41 0.929 0.04 9.41 9 Gujranwala 0.96 0.03 16.98 0.98 0.039 34.31
10 Hyderabad 0.93 0.04 9.55 0.967 0 20.66 11 Islamabad 0.98 0.02 34.31 0.978 0.02 31.16 12 Jhelum 0.91 0.045 7.35 0.75 0.07 2.41 13 Jhang 0.9 0.048 6.58 0.84 0.059 3.98 14 Mardan 0.97 0.035 22.76 1 0.03 #DIV/0!
15 Multan 0.88 0.05 5.42 0.908 0.058 7.18 16 Khuzdar 0.92 0.045 8.31 0.827 0.06 3.65 17 kunri 0.87 0.05 4.98 0.87 0.05 4.98
13
18 Lahore 0.8 0.067 3.11 0.988 0.02 57.41 19 Larkana 0.81 0.058 3.29 0.89 0.038 5.95 20 Loralai 0.96 0.04 16.98 0.97 0.03 22.76 21 MP Khas 0.81 0.066 3.29 0.87 0.055 4.98 22 Mianwali 0.9 0.05 6.58 0.78 0.07 2.79 23 Nawabshah 0.93 0.048 9.55 0.99 0.03 68.97 24 Okara 0.88 0.049 5.42 0.806 0.06 3.21 25 Peshawar 0.9 0.047 6.58 0.74 0.07 2.30 26 Quetta 0.93 0.046 9.55 0.858 0.059 4.53 27 Rawalpindi 0.96 0.029 16.98 0.925 0.04 8.89 28 Shadadpur 0.85 0.066 4.27 0.8 0.068 3.11 29 Sargodha 0.92 0.04 8.31 0.836 0.055 3.87 30 Sukkur 0.82 0.07 3.49 0.82 0.065 3.49 31 Sialkot 0.61 0.086 1.40 0.78 0.07 2.79 32 Samundri 0.94 0.039 11.20 0.829 0.067 3.70 33 Turbat 0.89 0.05 5.95 0.887 0.05 5.78 34 Vehari 0.96 0.028 16.98 0.99 0.01 68.97
Avg-Pakistan 0.88 0.05 5.42 0.87 0.05 4.98
Table 3: Relative City Price Convergence with Lahore
No. Cities i-
OLS Std. Error H( )-OLS i-GLS Std. Error
H( )-GLS
1 Abottababd 0.79 0.067 2.94 0.79 0.067 2.94 2 Attock 0.92 0.04 8.31 0.95 0.03 13.51 3 Bahawalnagar 0.94 0.038 11.20 0.95 0.03 13.51 4 Bannu 0.909 0.05 7.26 0.82 0.07 3.49 5 Bahawalpur 0.89 0.04 5.95 0.76 0.07 2.53 6 DGKhan 0.88 0.05 5.42 0.69 0.08 1.87 7 DI khan 0.82 0.06 3.49 0.78 0.068 2.79 8 Faisalbad 0.86 0.05 4.60 0.89 0.049 5.95 9 Gujranwala 0.99 0.03 68.97 0.99 0.03 68.97 10 Hyderabad 0.94 0.038 11.20 0.96 0.021 16.98 11 Islamabad 0.98 0.02 34.31 0.99 0.016 68.97 12 Jhelum 0.88 0.05 5.42 0.908 0.043 7.18 13 Jhang 0.95 0.04 13.51 0.94 0.045 11.20 14 Karachi 0.8 0.067 3.11 0.84 0.06 3.98 15 Khuzdar 0.88 0.057 5.42 0.82 0.067 3.49 16 kunri 0.85 0.058 4.27 0.85 0.058 4.27
14
17 Larkana 0.85 0.05 4.27 0.878 0.04 5.33 18 Loralai 0.94 0.05 11.20 0.97 0.036 22.76 19 Mardan 0.96 0.04 16.98 0.96 0.04 16.98 20 Multan 0.84 0.058 3.98 0.87 0.057 4.98 21 MP Khas 0.84 0.06 3.98 0.59 0.09 1.31 22 Mianwali 0.87 0.06 4.98 0.82 0.06 3.49 23 Nawabshah 0.93 0.048 9.55 0.96 0.045 16.98 24 Okara 0.87 0.05 4.98 0.92 0.04 8.31 25 Peshawar 0.87 0.06 4.98 0.74 0.07 2.30 26 Quetta 0.92 0.056 8.31 0.77 0.07 2.65 27 Rawalpindi 0.94 0.04 11.20 0.89 0.05 5.95 28 Shadadpur 0.87 0.065 4.98 0.77 0.07 2.65 29 Sargodha 0.93 0.04 9.55 0.88 0.047 5.42 30 Sukkur 0.91 0.05 7.35 0.87 0.06 4.98 31 Sialkot 0.68 0.08 1.80 0.8 0.06 3.11 32 Samundri 0.97 0.03 22.76 0.92 0.05 8.31 33 Turbat 0.82 0.07 3.49 0.79 0.06 2.94 34 Vehari 0.98 0.025 34.31 0.99 0.017 68.97
Avg-Pakistan 0.89 0.05 5.94 0.86 0.05 4.82
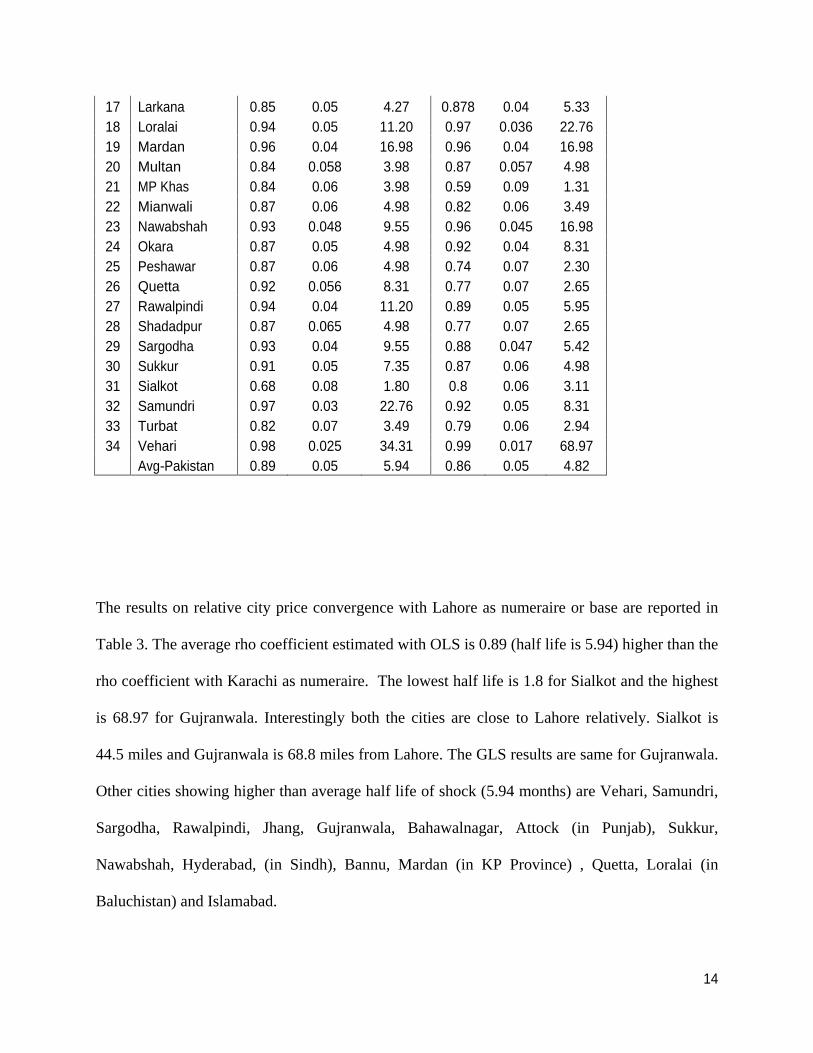
The results on relative city price convergence with Lahore as numeraire or base are reported in
Table 3. The average rho coefficient estimated with OLS is 0.89 (half life is 5.94) higher than the
rho coefficient with Karachi as numeraire. The lowest half life is 1.8 for Sialkot and the highest
is 68.97 for Gujranwala. Interestingly both the cities are close to Lahore relatively. Sialkot is
44.5 miles and Gujranwala is 68.8 miles from Lahore. The GLS results are same for Gujranwala.
Other cities showing higher than average half life of shock (5.94 months) are Vehari, Samundri,
Sargodha, Rawalpindi, Jhang, Gujranwala, Bahawalnagar, Attock (in Punjab), Sukkur,
Nawabshah, Hyderabad, (in Sindh), Bannu, Mardan (in KP Province) , Quetta, Loralai (in
Baluchistan) and Islamabad.
15
The estimates from GLS show a reduction in rho coefficient. It is estimated at 0.86 and the
average half life is 4.8 months, lower than Karachi. The lowest half life is 1.3 months for Mir Pur
Khas, almost 556 miles from Lahore. The highest half life is 68.97 months for Gujranwala (44.5
miles), Vehari (172 miles) and Islamabad (175 miles). The other cities where the half life of
price shock is more than the average are Attock, Bahawalnagar, Faisalabad, Gujranwala,
Hyderabad, Jhelum, Jhang, Larkana, Loralai, Mardan, Nawabshah, Okara, Rawalpindi,
Sargodha,, Sukkur, Samundri and Vehari.
The Pakistani cities where half life of price shock in Lahore is almost 3 months or less, are
Turbat, Sialkot, Shadadpur, Quetta, Peshawar, Mir pur Khas, Dera Ismaeel Khan, Dera Ghazi
Khan, Bahawalpur and Abbotabad.
The overall results show that GLS estimates of average rho and half life estimated to be lower
than OLS results. The overall results show that overall prices in individual Pakistani cities
converge to the numeraire cities of Lahore and Karachi. The overall half life based on the
average of city estimates is less than 6 months with OLS and 5 months with GLS. The individual
cities show different results and there is evidence of some heterogeneous behavior in terms of
city price convergence and half life of price shock. The price shock in Lahore dies out more
quickly than a shock in Karachi. These estimates are higher than Morshed (2005) in the case of
India (3 months) and Lan and Sylwester (2010) China (3 months). But the estimates of present
study are less than Imbs et al (2005) and Das and Bhatacharia (2008 who estimated half life at 11
months and 18 months respectively.
V Conclusion
16
This study provides empirical evidence in favor of relative city price convergence in 35 Pakistani
cities with two numeraire cities Lahore and Karachi using monthly CPI data from July 2001-June
2008. The empirical evidence supports that Purchasing Power parity holds in Pakistan with both
the techniques OLS and GLS. However the average half life of a price shock is estimated to be
less than 5 months with GLS and 6 months with OLS. There is a significant evidence of
differences in city behaviors in terms of the duration of half life shock. The individual cities’ half
life of shock varies from almost 1.3 months to 68 months which is huge. The half life of relative
price shock with Lahore is smaller than Karachi implying the fact that cities are spatially more
associated with Lahore than Karachi.
References
Baltagi and Griffin (1988) “A generalized error component model with hetroskedastic disturbances” International Economic Review, Vol. 31, issue 4, November 1988
Cecchetti, S., Mark, N., Sonora, R., (2002) “Price index convergence among United States cities” International Economic Review 43, 1081—1099
Chmelarova and Nath (2010) Does the choice of numeraire city matters in estimating relative city price convergence? Journal of Macroeconomics
Das and Bhatacharia (2008) “Price convergence across regions in India” Empirical Economics, Vol. 34, No. 2, March 2008
Foad Hisham (2007), “Europe with borders? The effect of Euro on price convergence” Department of Economics San Diego State University San Diego, CA
Engel, C., Rogers, J., (1996) “How wide is the border?” American Economic Review 86, 1112-1125.
17
Fan and Wei (2006) “Price Index Convergence in China”
Gotu Butte (2001)“The equality of OLS and GLS estimators in the linear regression model when the disturbances are spatially correlated” Statistical Papers 42, 253-263 (2001)
Imbs et al (2005) “PPP strikes back: Aggregation and the real exchange rates” The Quarterly Journal of Economics, Vol CXX, February 2005, issue 1.
Lan and Sylwester (2010) “Does the Law of One Price Hold in China? Testing Price Convergence Using Disaggregated Data” China Economic Review 2010
Morshed, A., Ahn, S., and Lee, M., (2005) “Price convergence among Indian cities: a cointegration approach” Working Paper, Southern Illinois University Carbondale
Parsley, D., Wei, S., (1996) “Convergence to the law of one price without trade barriers or currency fluctuations” Quarterly Journal of Economics 111, 1211--1236
Rogoff, K., (1996) “The purchasing power parity puzzle” Journal of Economic Literature 34, 647--668
Sonara Robert (2010) “City relative price convergence in USA with structural break(s)” Applied Economics Letters, 16: 9, 939 — 944
Sharif et al. (2000) “Illegal trade of Pakistan with Afghanistan and Iran through Baluchistan: Size, balance and loss to public exchequer” International Journal of Agriculture and Biology 1560-8530/2000/02-3-199-203