0 3 5 - core.ac.ukemail: @gmail.com key words: ... sakthivel,2004) ... a.p. 7.84 13.73 11.42 7.09...
TRANSCRIPT
MPRAMunich Personal RePEc Archive
Performance of manufacturing industryin Indian states: who loose and why?
Sarker, Debnarayan and Das, Debraj
Centre for Economic Studies, Presidency College, Kolkata
2011
Online at http://mpra.ub.uni-muenchen.de/33645/
MPRA Paper No. 33645, posted 23. September 2011 / 06:07
1
Performance of Manufacturing Industry in Indian States:
Who loose and why?
Debnarayan Sarker
Professor and Secretary, Centre for Economic Studies
Presidency University, Kolkata
Email:[email protected]
and
Debraj Das
Research Fellow, Centre for Economic Studies
Presidency University, Kolkata
Email:[email protected]
Key words: Profit efficiency, Major Indian States, Fiscal Reforms, Strikes and Lockouts, Foreign
Direct Investment, Electricity, Telephone.
JEL Classification: H30, H 72, H71, L51.
2
Performance of Manufacturing Industry in Indian States:
Who loose and why?
Abstract: [This paper is an attempt to present the disparities of state-level performance of
manufacturing industry on some key variables and tries to examine as to why the poorer states
loose in relation to the richer ones. The study suggests that Indian states which could contribute
to higher economic and administrative reforms during reform period by various fiscal measures
did gain the boon of industrial achievements. So, in order to gain industrial uplift, the fiscal
reforms of a state must help raising the income level of the particular state reflecting thereby to
develop her economy by receiving the fruits of industrial development.]
As is well known, the economic policy environment for industries in Indian states since 1991
has undergone unprecedented changes and has become much more competitive than past.
Such a change has been effective mainly due to removal of industrial licensing system, drastic
reduction in the number of industries reserved exclusively for public sector, treatment for FDI
on par with domestic private investment and removal of restrictions on monopolies. As a result
of such a change it is now well established that the inter-state disparities in the growth of gross
state domestic product (GSDP)have increased in the post economic reform period beginning
from the early nineties when compared to the eighties .In general, the richer states have grown
faster than the poorer ones(Ahluwalia 2000;Dev and Ravi,2003;Bhattacharya and
Sakthivel,2004).The GSDP from secondary sector during the post-reform period is one of the
important factors for higher variability of inter-state disparities .The richer states have higher
industrial growth during the post-reform period than the poorer ones due to, mainly, higher
performance of manufacturing industries at state-level. This paper is an attempt to present the
3
disparities of state-level performance of manufacturing industry on some key variables and tries
to examine as to why the poorer states loose in relation to the richer ones.
The paper is organized as follows. Section II presents discussions on Industrial performance in
major Indian states and the profit efficiency based on two important factors of Industrial
performance among those states. The underlying reason influencing such industrial
performance most among major Indian states during the period of economic reforms appears in
section III along with the theoretical underpinnings of such argument .The empirical implications
of such argument are contained in Section IV. Section V concludes.
Section II
Industrial performance of Indian States:
The performance of the industries can be assessed, among others, by some key variables viz.
employment, number of factories and value added. The percentage share of all these key
variables to all India level have significantly increased to some of the states during the phase of
economic reforms vis-à-vis other Indian states. The states which have experienced better
performance in net value added and employment have been afforded to take the advantages of
economic reforms through providing a series of reforms they made within their own states.
4
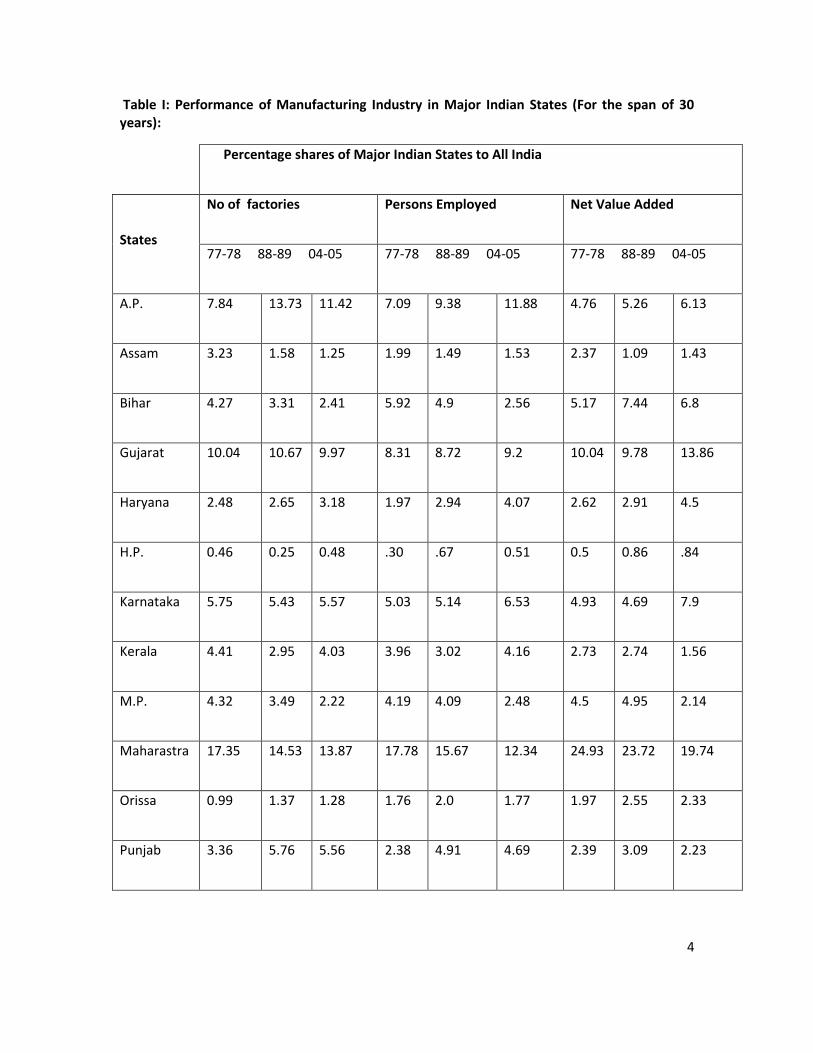
Table I: Performance of Manufacturing Industry in Major Indian States (For the span of 30 years):
Percentage shares of Major Indian States to All India
States
No of factories Persons Employed Net Value Added
77-78 88-89 04-05 77-78 88-89 04-05 77-78 88-89 04-05
A.P. 7.84 13.73 11.42 7.09 9.38 11.88 4.76 5.26 6.13
Assam 3.23 1.58 1.25 1.99 1.49 1.53 2.37 1.09 1.43
Bihar 4.27 3.31 2.41 5.92 4.9 2.56 5.17 7.44 6.8
Gujarat 10.04 10.67 9.97 8.31 8.72 9.2 10.04 9.78 13.86
Haryana 2.48 2.65 3.18 1.97 2.94 4.07 2.62 2.91 4.5
H.P. 0.46 0.25 0.48 .30 .67 0.51 0.5 0.86 .84
Karnataka 5.75 5.43 5.57 5.03 5.14 6.53 4.93 4.69 7.9
Kerala 4.41 2.95 4.03 3.96 3.02 4.16 2.73 2.74 1.56
M.P. 4.32 3.49 2.22 4.19 4.09 2.48 4.5 4.95 2.14
Maharastra 17.35 14.53 13.87 17.78 15.67 12.34 24.93 23.72 19.74
Orissa 0.99 1.37 1.28 1.76 2.0 1.77 1.97 2.55 2.33
Punjab 3.36 5.76 5.56 2.38 4.91 4.69 2.39 3.09 2.23
5
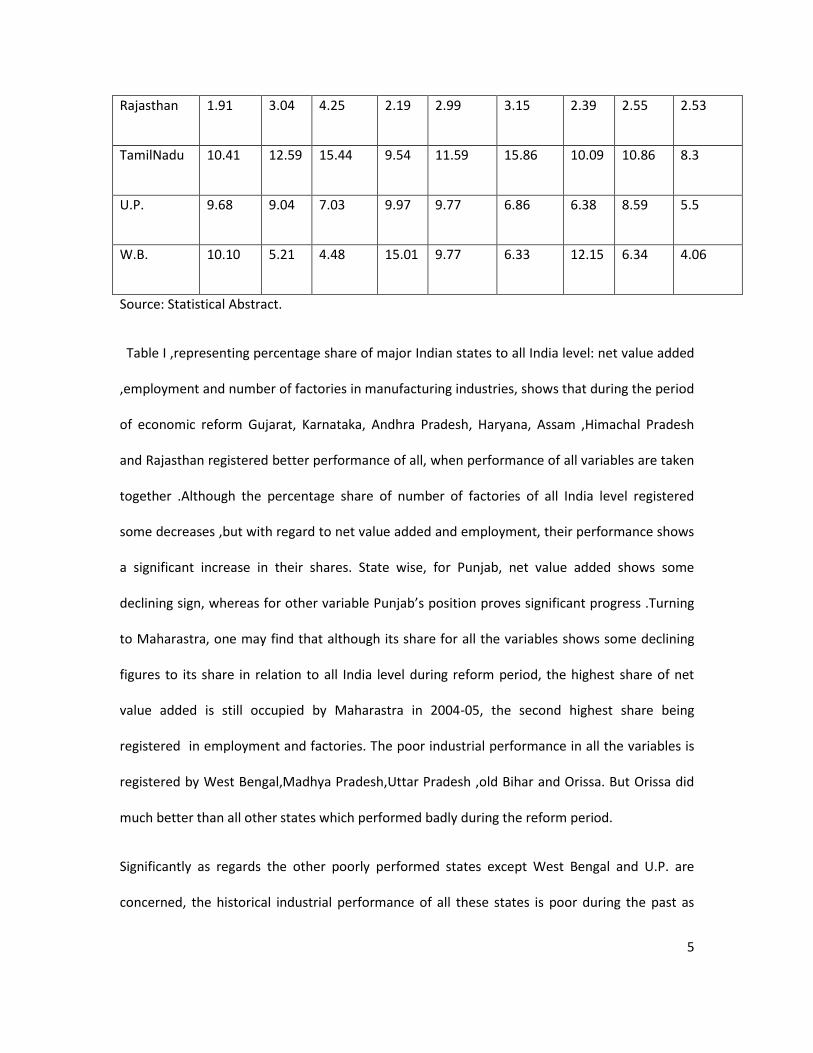
Rajasthan 1.91 3.04 4.25 2.19 2.99 3.15 2.39 2.55 2.53
TamilNadu 10.41 12.59 15.44 9.54 11.59 15.86 10.09 10.86 8.3
U.P. 9.68 9.04 7.03 9.97 9.77 6.86 6.38 8.59 5.5
W.B. 10.10 5.21 4.48 15.01 9.77 6.33 12.15 6.34 4.06
Source: Statistical Abstract.
Table I ,representing percentage share of major Indian states to all India level: net value added
,employment and number of factories in manufacturing industries, shows that during the period
of economic reform Gujarat, Karnataka, Andhra Pradesh, Haryana, Assam ,Himachal Pradesh
and Rajasthan registered better performance of all, when performance of all variables are taken
together .Although the percentage share of number of factories of all India level registered
some decreases ,but with regard to net value added and employment, their performance shows
a significant increase in their shares. State wise, for Punjab, net value added shows some
declining sign, whereas for other variable Punjab’s position proves significant progress .Turning
to Maharastra, one may find that although its share for all the variables shows some declining
figures to its share in relation to all India level during reform period, the highest share of net
value added is still occupied by Maharastra in 2004-05, the second highest share being
registered in employment and factories. The poor industrial performance in all the variables is
registered by West Bengal,Madhya Pradesh,Uttar Pradesh ,old Bihar and Orissa. But Orissa did
much better than all other states which performed badly during the reform period.
Significantly as regards the other poorly performed states except West Bengal and U.P. are
concerned, the historical industrial performance of all these states is poor during the past as
6
well as during the present. As regards the performance of West Bengal is concerned, the
tradition of industrial development in manufacturing sector that West Bengal registered during
the past has significantly deteriorated during the current years. Such a decline which started in
the late 70’s has been going on for this long time .It is worth mentioning that there is no other
Indian states which did register such a decline during over 3 decades. West Bengal was the
second major industrial states in terms of value added and number of employment, registering
third highest position in the case of number of factories during 1977-78.,when the present left
front government came into power. However during 28 years of their ruling starting from 1977-
78 to 2004-05, the West Bengal industrial performance has been steeped down to the 8th
position among major Indian states in the performance of all the variables namely number of
factories, net value added and employment. The declining trend of all these key variables not
only registered pre-reform period , but also worked out post economic reform.
The percentage share of West Bengal to all India with respect to number of factories, net
value added and employment in manufacturing industry decreased from 10.10 to 4.48 percent,
12.15 to 4.06 per cent and 15.01 to 6.33 percent respectively for 28 years from 1977-78 to
2004-05.Most importantly ,the rate of decline for all the performance variable during their 28
years period is the highest for West Bengal of all major Indian states. If one compares the
industrial performance during pre reform to post –reform period of existing left front regime
,one may find that the decline of all the variables is much higher during the pre-reform period
than the post-reform period.
But if one compares relative performance of manufacturing industry between U.P. and W.B,
the performance of all these variables for U.P.is not so poor as West Bengal. The relative
position of U.P. during 28 years starting from 1977-78 to 2004-05 has more or less unchanged
7
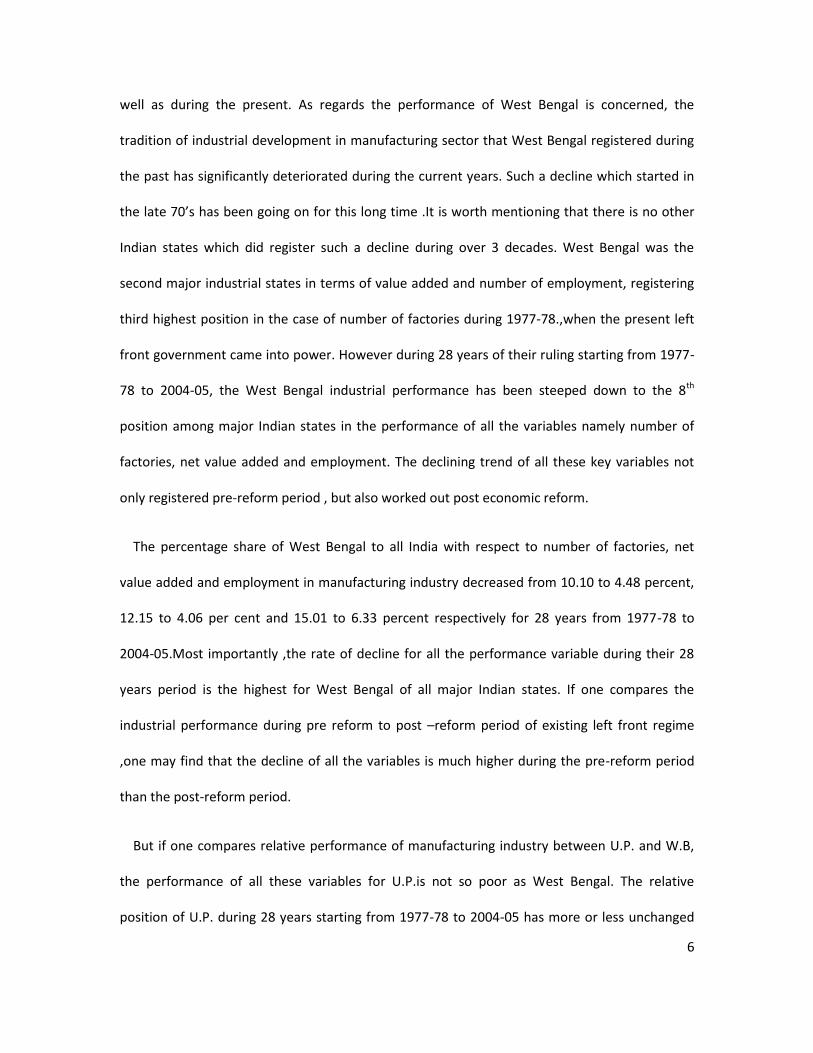
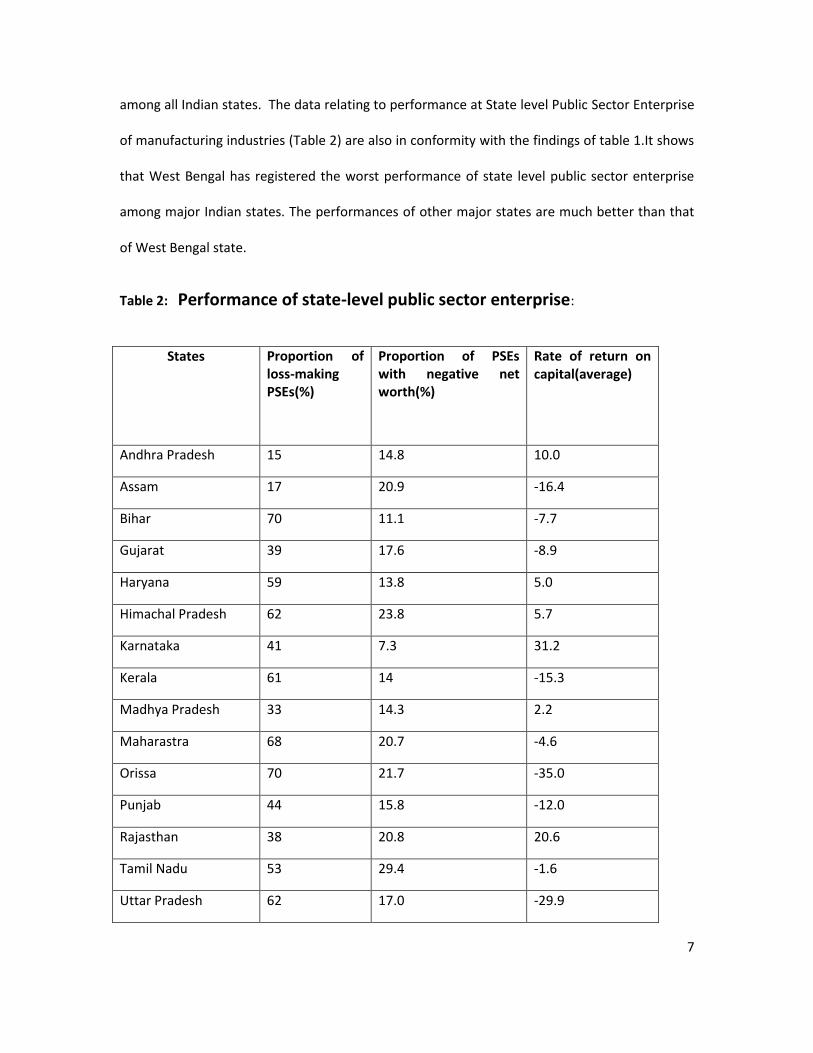
among all Indian states. The data relating to performance at State level Public Sector Enterprise
of manufacturing industries (Table 2) are also in conformity with the findings of table 1.It shows
that West Bengal has registered the worst performance of state level public sector enterprise
among major Indian states. The performances of other major states are much better than that
of West Bengal state.
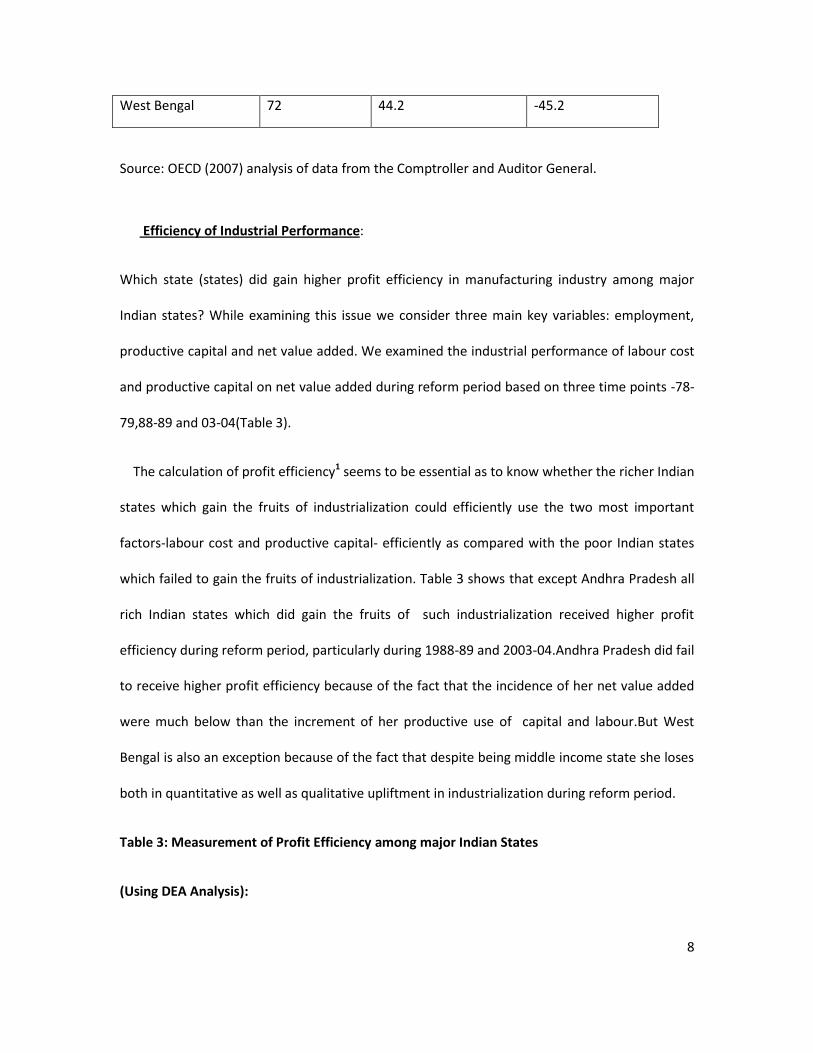
Table 2: Performance of state-level public sector enterprise:
States Proportion of loss-making PSEs(%)
Proportion of PSEs with negative net worth(%)
Rate of return on capital(average)
Andhra Pradesh 15 14.8 10.0
Assam 17 20.9 -16.4
Bihar 70 11.1 -7.7
Gujarat 39 17.6 -8.9
Haryana 59 13.8 5.0
Himachal Pradesh 62 23.8 5.7
Karnataka 41 7.3 31.2
Kerala 61 14 -15.3
Madhya Pradesh 33 14.3 2.2
Maharastra 68 20.7 -4.6
Orissa 70 21.7 -35.0
Punjab 44 15.8 -12.0
Rajasthan 38 20.8 20.6
Tamil Nadu 53 29.4 -1.6
Uttar Pradesh 62 17.0 -29.9
8
West Bengal 72 44.2 -45.2
Source: OECD (2007) analysis of data from the Comptroller and Auditor General.
Efficiency of Industrial Performance:
Which state (states) did gain higher profit efficiency in manufacturing industry among major
Indian states? While examining this issue we consider three main key variables: employment,
productive capital and net value added. We examined the industrial performance of labour cost
and productive capital on net value added during reform period based on three time points -78-
79,88-89 and 03-04(Table 3).
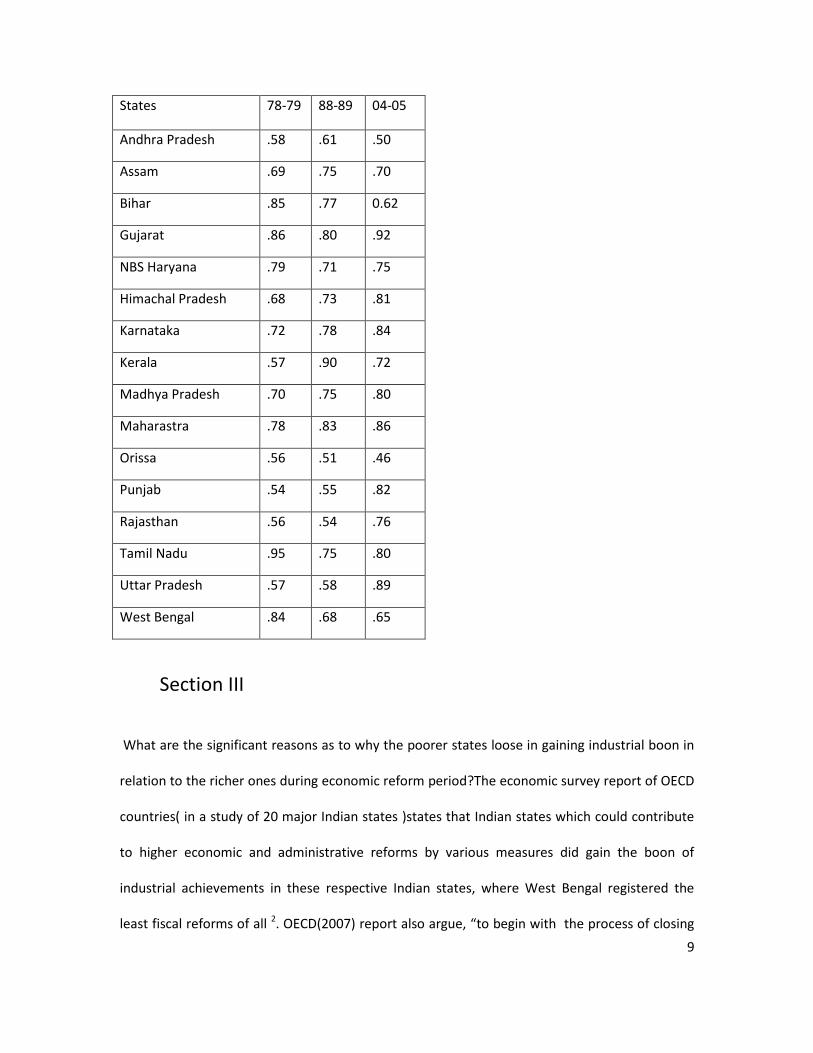
The calculation of profit efficiency1 seems to be essential as to know whether the richer Indian
states which gain the fruits of industrialization could efficiently use the two most important
factors-labour cost and productive capital- efficiently as compared with the poor Indian states
which failed to gain the fruits of industrialization. Table 3 shows that except Andhra Pradesh all
rich Indian states which did gain the fruits of such industrialization received higher profit
efficiency during reform period, particularly during 1988-89 and 2003-04.Andhra Pradesh did fail
to receive higher profit efficiency because of the fact that the incidence of her net value added
were much below than the increment of her productive use of capital and labour.But West
Bengal is also an exception because of the fact that despite being middle income state she loses
both in quantitative as well as qualitative upliftment in industrialization during reform period.
Table 3: Measurement of Profit Efficiency among major Indian States
(Using DEA Analysis):
9
States 78-79 88-89 04-05
Andhra Pradesh .58 .61 .50
Assam .69 .75 .70
Bihar .85 .77 0.62
Gujarat .86 .80 .92
NBS Haryana .79 .71 .75
Himachal Pradesh .68 .73 .81
Karnataka .72 .78 .84
Kerala .57 .90 .72
Madhya Pradesh .70 .75 .80
Maharastra .78 .83 .86
Orissa .56 .51 .46
Punjab .54 .55 .82
Rajasthan .56 .54 .76
Tamil Nadu .95 .75 .80
Uttar Pradesh .57 .58 .89
West Bengal .84 .68 .65
Section III
What are the significant reasons as to why the poorer states loose in gaining industrial boon in
relation to the richer ones during economic reform period?The economic survey report of OECD
countries( in a study of 20 major Indian states )states that Indian states which could contribute
to higher economic and administrative reforms by various measures did gain the boon of
industrial achievements in these respective Indian states, where West Bengal registered the
least fiscal reforms of all 2. OECD(2007) report also argue, “to begin with the process of closing
10
the gaps in economic performance across states , the relatively restrictive states need to
improve their regulatory environment so as to become more competitive and productive”(
p.94). One may argue that already existing better infrastructure that prevailed before reforms is
the most significant reasons for the industrial achievements of richer Indian states. As is well
known, West Bengal is one of the middle income states like TN, Kerala, Karnataka , but before
1980 for infrastructural development she tops almost all Indian states. West Bengal registered
second major industrial states in terms of net value added and number of workers employed
and third in terms of number of factories. But as mentioned earlier, the industrial performance
of West Bengal has been stepped down to the 8th position among Indian states during economic
reform period. The fact is that the states which registered better industrial performance during
reform period mainly due to higher fiscal reform did also register better infrastructural uplift
during reform period.
So, the most significant force behind industrial uplift for richer Indian states during reform
period is the higher economic and administrative reforms that they introduced by various fiscal
measures. The following theoretical framework is an attempt to explore this issue:
We first try to explain the issue in the basic macroeconomic framework as to how an Indian
state gain the fruit of industrial development and develop her economy when centre is the only
controlling authority of monetary policy ,direct tax structure and there exists perfect capital
mobility within Indian states. Then fiscal expansion must help raising the income level of the
particular state reflecting thereby to develop her economy which might gain the fruit of
industrial development (the theoretical framework appears in the appendix).In the
macroeconomic framework the exogenous variables are M (monetary policy), P (price level), r
11
(interest rate) and the tax (T).The endogenous variables are G and Y. Then short term
equilibrium condition in the goods market is determined by
y= C(y- ) + I ( ) + G … (1) *where y is income, G is government expenditure ,I is investment , is
rate of interest and is fixed tax ( they are executed by central government).
In linear equation (1) may be written as y = δy´ - λ +G…(1a) *y´ = disposable income+
The first step is to solve for income levels in terms of interest rate
y= kG - …(1b)
Similarly the money market equilibrium is
( ) = L ( … (2)
Where monetary policy: are constant.
In linear form (2) can be written as ( ) = y- ηr…..(2a)
The second step is to solve (2a) for income in terms of interest rate
y= 1/ (( )+ η )….(2b)
Then market equilibrium conditions are (equating 1b with 2b)
Kg - = 1/ (( )+ η )
Let us consider now a fiscal expansion by the state (increasing government purchases or by
cutting taxes) with money, price, rate of interest given in a state .Then equilibrium fiscal
expansion shifts the IS curve to the right, putting upward pressure on the market exchange rate.
12
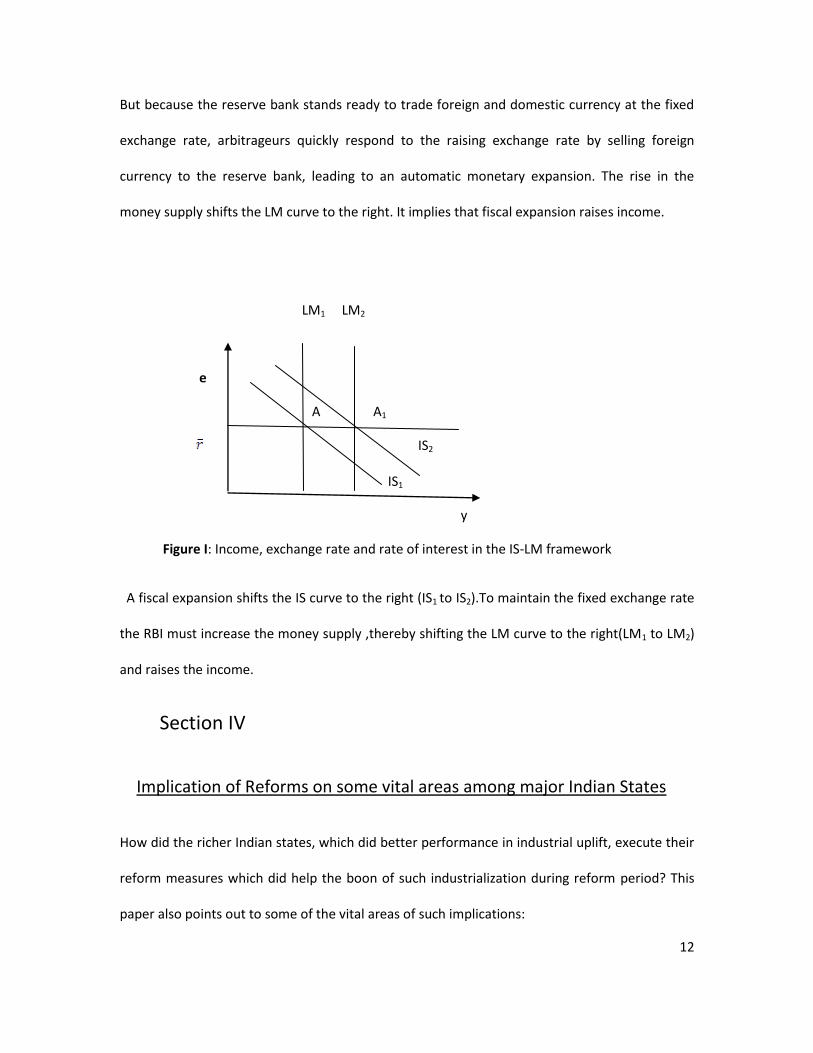
But because the reserve bank stands ready to trade foreign and domestic currency at the fixed
exchange rate, arbitrageurs quickly respond to the raising exchange rate by selling foreign
currency to the reserve bank, leading to an automatic monetary expansion. The rise in the
money supply shifts the LM curve to the right. It implies that fiscal expansion raises income.
LM1 LM2
e
A A1
IS2
IS1
y
Figure I: Income, exchange rate and rate of interest in the IS-LM framework
A fiscal expansion shifts the IS curve to the right (IS1 to IS2).To maintain the fixed exchange rate
the RBI must increase the money supply ,thereby shifting the LM curve to the right(LM1 to LM2)
and raises the income.
Section IV
Implication of Reforms on some vital areas among major Indian States
How did the richer Indian states, which did better performance in industrial uplift, execute their
reform measures which did help the boon of such industrialization during reform period? This
paper also points out to some of the vital areas of such implications:
13
1. Strikes and Lockouts:
One of the significant factors regarding the industrial setback for West Bengal state is
strike and lockouts which almost appear owing to the positive incentive of West Bengal left
front government. Table 4 shows the statement of man days lost due to industrial disputes (
strikes and lockouts) which did face the high incidence of man-days lost due to strikes and lock-
outs during 1979-2008 among major Indian states .As may be seen in table 4 ,for a single year in
2005,about 3 crores (2,74,65,318) man days were lost for strikes and lockouts. West Bengal
alone shares approximately 68.94 per cent man days lost out of all man days in India during
2005.If one compares the figure before economic reform and during economic reform period
during the regime of present left front government one may find that in 1979,West Bengal alone
shared 41.22 per cent of total man days lost in India due to strikes and lock outs. Interestingly,
the states having higher incidence of man days lost due to strikes and lock outs except West
Bengal account for 35.92 per cent approximately if the figures of 8 states are combined together
in 1979.Worthwhile to mention that in 1979,the industrial performance of all Indian states
except Maharastra and Tamil Nadu was much worse than that of West Bengal state. Also
important is that during ten years period(1979-1989) before economic reform the proportion of
man days lost for strikes and lock outs were more or less same in West Bengal state, the share
of West Bengal being 41.18 percent of total , where for the rest the combined figure works at to
48.7 per cent of total approximately. What it implies is that during pre-reform period from 1979
to 1989 the combined figure of man days lost for 8 major Indian states was more or less nearer
to the figure of West Bengal state alone. But interestingly, the data during 1989-2005 shows
that 8 major Indian states register two fundamental changes in industrial performance (1) all
these made higher industrial progress in relation to West Bengal.(Table 1).(2) The politics of man
days lost due to strikes and lockouts almost came to an end in all these states, because the
14
combined man days lost to all these states except West Bengal is approximately 10.45 per cent
of total man days lost of India in 2005, whereas in 1989,a period of 16years back , their
combined contribution was 35.92 per cent approximately. But in 2005 the man days lost in West
Bengal alone register 68.94 percent approximately of total man days lost in India (more than
two third man days lost in Indian states). Although the incidence of man days lost in West
Bengal due to strikes and lock outs has decreased to some extent during the current period , the
very recent figure(2008) shows that West Bengal still register about 42 per cent of total man
days lost(more than two fifth of total man days lost)in India, whereas the figures of man days
lost due to strikes and lock outs is negligible during the same year for those states which made
higher progress in industrial scene than West Bengal during reform period . These results
,however ,reveal that during the reform period the man days lost for lock outs and strikes
significantly increases in West Bengal ,whereas they decreases substantially in those states
which made higher progress in industrial scene than West Bengal during reform period. The
state of West Bengal ,among others, did fail to have the fruits of industrial progress because of
the fact that(one of the most significant reasons) the government of West Bengal did not
execute her reform policy in minimizing industrial dispute from strikes and lock-outs :rather she
did execute her positive role in augmenting the same .
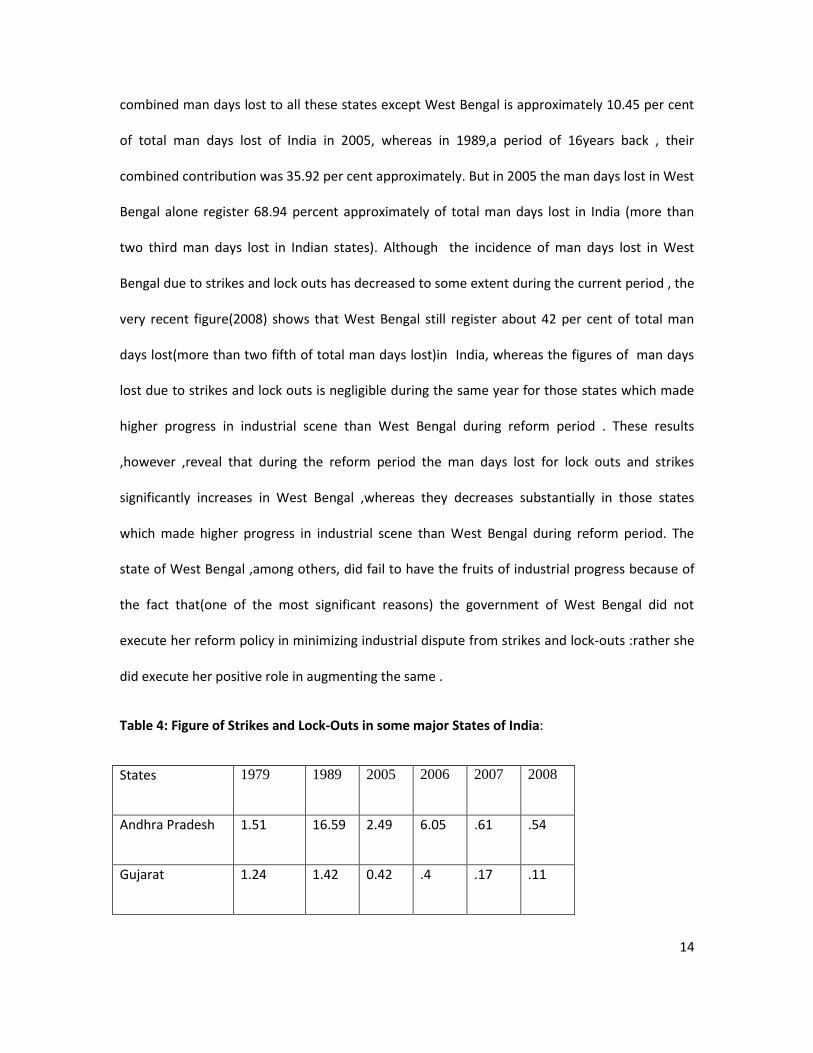
Table 4: Figure of Strikes and Lock-Outs in some major States of India:
States 1979 1989 2005 2006 2007 2008
Andhra Pradesh 1.51 16.59 2.49 6.05 .61 .54
Gujarat 1.24 1.42 0.42 .4 .17 .11
15
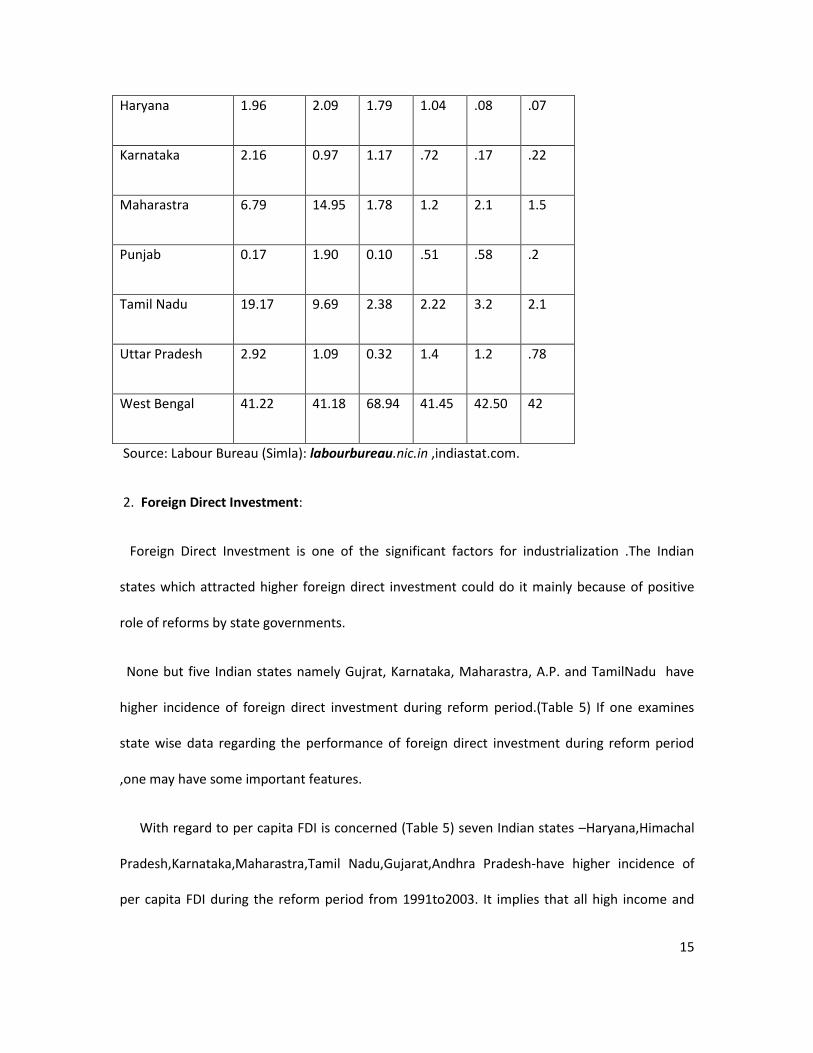
Haryana 1.96 2.09 1.79 1.04 .08 .07
Karnataka 2.16 0.97 1.17 .72 .17 .22
Maharastra 6.79 14.95 1.78 1.2 2.1 1.5
Punjab 0.17 1.90 0.10 .51 .58 .2
Tamil Nadu 19.17 9.69 2.38 2.22 3.2 2.1
Uttar Pradesh 2.92 1.09 0.32 1.4 1.2 .78
West Bengal 41.22 41.18 68.94 41.45 42.50 42
Source: Labour Bureau (Simla): labourbureau.nic.in ,indiastat.com.
2. Foreign Direct Investment:
Foreign Direct Investment is one of the significant factors for industrialization .The Indian
states which attracted higher foreign direct investment could do it mainly because of positive
role of reforms by state governments.
None but five Indian states namely Gujrat, Karnataka, Maharastra, A.P. and TamilNadu have
higher incidence of foreign direct investment during reform period.(Table 5) If one examines
state wise data regarding the performance of foreign direct investment during reform period
,one may have some important features.
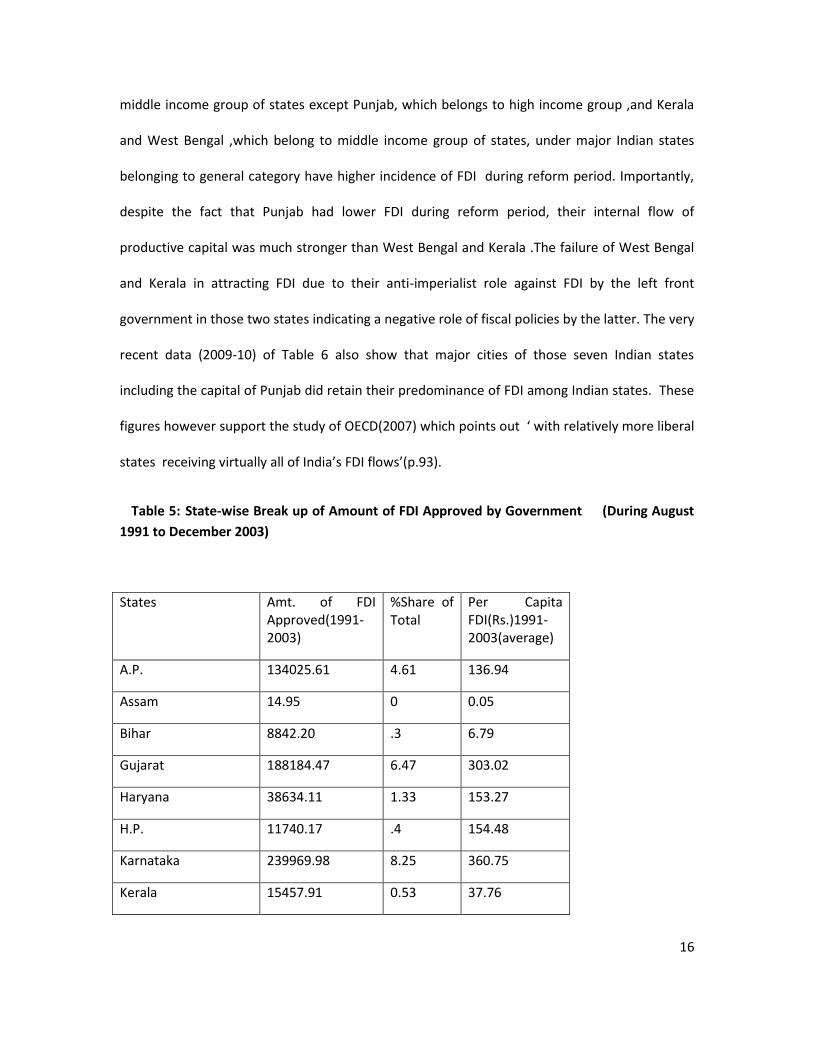
With regard to per capita FDI is concerned (Table 5) seven Indian states –Haryana,Himachal
Pradesh,Karnataka,Maharastra,Tamil Nadu,Gujarat,Andhra Pradesh-have higher incidence of
per capita FDI during the reform period from 1991to2003. It implies that all high income and
16
middle income group of states except Punjab, which belongs to high income group ,and Kerala
and West Bengal ,which belong to middle income group of states, under major Indian states
belonging to general category have higher incidence of FDI during reform period. Importantly,
despite the fact that Punjab had lower FDI during reform period, their internal flow of
productive capital was much stronger than West Bengal and Kerala .The failure of West Bengal
and Kerala in attracting FDI due to their anti-imperialist role against FDI by the left front
government in those two states indicating a negative role of fiscal policies by the latter. The very
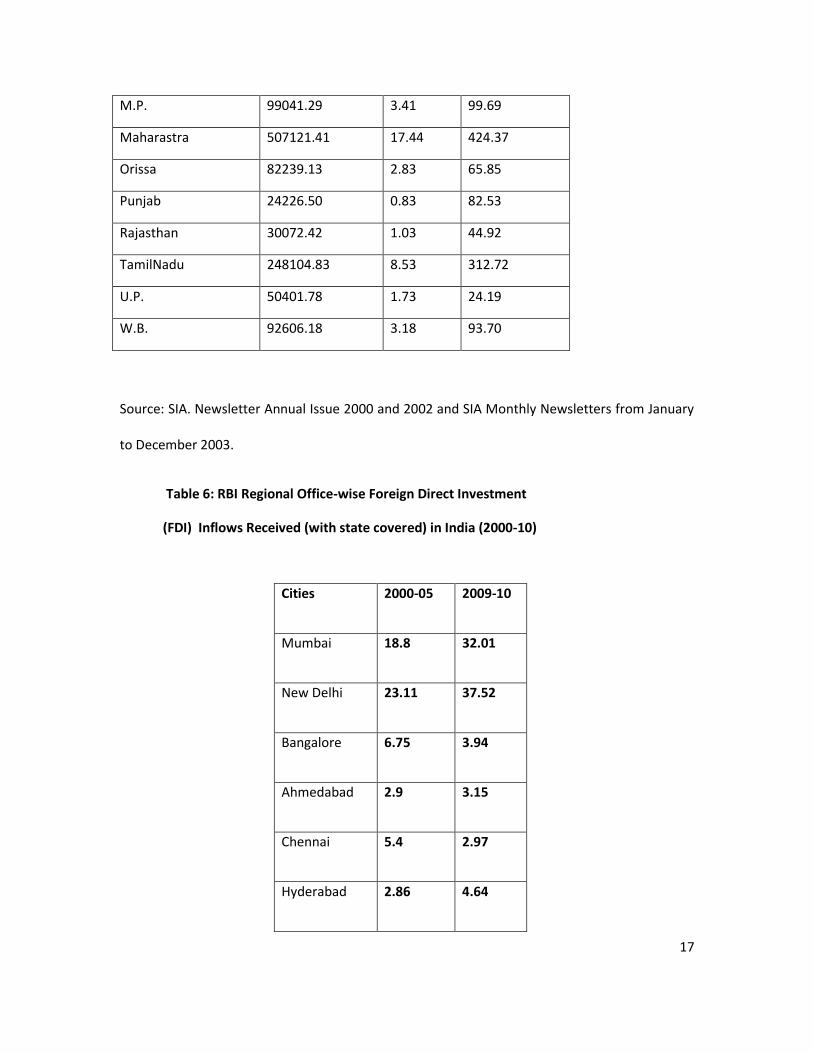
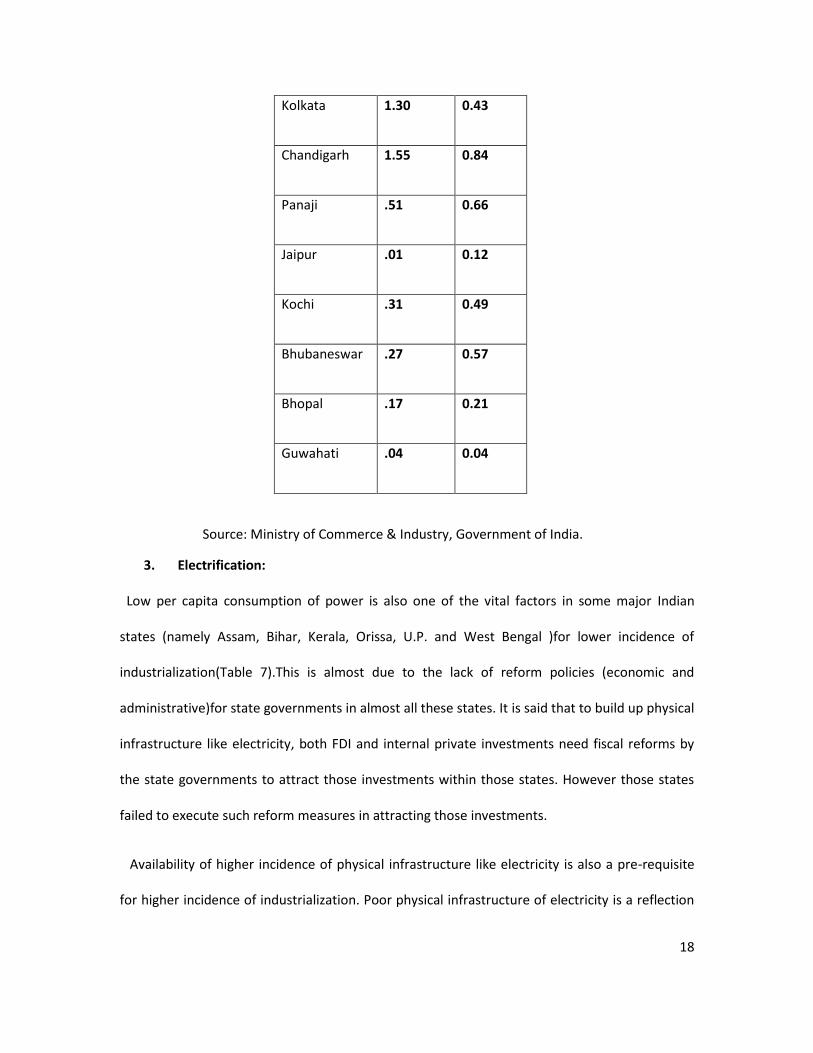
recent data (2009-10) of Table 6 also show that major cities of those seven Indian states
including the capital of Punjab did retain their predominance of FDI among Indian states. These
figures however support the study of OECD(2007) which points out ‘ with relatively more liberal
states receiving virtually all of India’s FDI flows’(p.93).
Table 5: State-wise Break up of Amount of FDI Approved by Government (During August
1991 to December 2003)
States Amt. of FDI Approved(1991-2003)
%Share of Total
Per Capita FDI(Rs.)1991-2003(average)
A.P. 134025.61 4.61 136.94
Assam 14.95 0 0.05
Bihar 8842.20 .3 6.79
Gujarat 188184.47 6.47 303.02
Haryana 38634.11 1.33 153.27
H.P. 11740.17 .4 154.48
Karnataka 239969.98 8.25 360.75
Kerala 15457.91 0.53 37.76
17
M.P. 99041.29 3.41 99.69
Maharastra 507121.41 17.44 424.37
Orissa 82239.13 2.83 65.85
Punjab 24226.50 0.83 82.53
Rajasthan 30072.42 1.03 44.92
TamilNadu 248104.83 8.53 312.72
U.P. 50401.78 1.73 24.19
W.B. 92606.18 3.18 93.70
Source: SIA. Newsletter Annual Issue 2000 and 2002 and SIA Monthly Newsletters from January
to December 2003.
Table 6: RBI Regional Office-wise Foreign Direct Investment
(FDI) Inflows Received (with state covered) in India (2000-10)
Cities 2000-05 2009-10
Mumbai 18.8 32.01
New Delhi 23.11 37.52
Bangalore 6.75 3.94
Ahmedabad 2.9 3.15
Chennai 5.4 2.97
Hyderabad 2.86 4.64
18
Kolkata 1.30 0.43
Chandigarh 1.55 0.84
Panaji .51 0.66
Jaipur .01 0.12
Kochi .31 0.49
Bhubaneswar .27 0.57
Bhopal .17 0.21
Guwahati .04 0.04
Source: Ministry of Commerce & Industry, Government of India.
3. Electrification:
Low per capita consumption of power is also one of the vital factors in some major Indian
states (namely Assam, Bihar, Kerala, Orissa, U.P. and West Bengal )for lower incidence of
industrialization(Table 7).This is almost due to the lack of reform policies (economic and
administrative)for state governments in almost all these states. It is said that to build up physical
infrastructure like electricity, both FDI and internal private investments need fiscal reforms by
the state governments to attract those investments within those states. However those states
failed to execute such reform measures in attracting those investments.
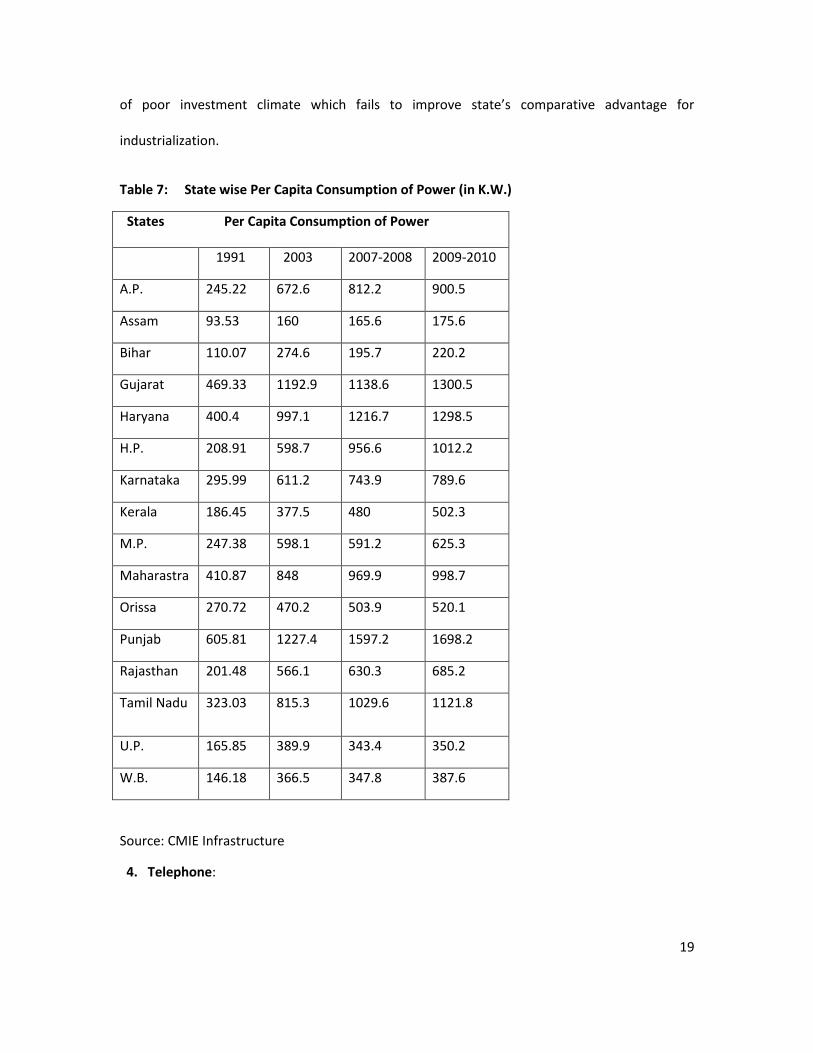
Availability of higher incidence of physical infrastructure like electricity is also a pre-requisite
for higher incidence of industrialization. Poor physical infrastructure of electricity is a reflection
19
of poor investment climate which fails to improve state’s comparative advantage for
industrialization.
Table 7: State wise Per Capita Consumption of Power (in K.W.)
States Per Capita Consumption of Power
1991 2003 2007-2008 2009-2010
A.P. 245.22 672.6 812.2 900.5
Assam 93.53 160 165.6 175.6
Bihar 110.07 274.6 195.7 220.2
Gujarat 469.33 1192.9 1138.6 1300.5
Haryana 400.4 997.1 1216.7 1298.5
H.P. 208.91 598.7 956.6 1012.2
Karnataka 295.99 611.2 743.9 789.6
Kerala 186.45 377.5 480 502.3
M.P. 247.38 598.1 591.2 625.3
Maharastra 410.87 848 969.9 998.7
Orissa 270.72 470.2 503.9 520.1
Punjab 605.81 1227.4 1597.2 1698.2
Rajasthan 201.48 566.1 630.3 685.2
Tamil Nadu 323.03 815.3 1029.6 1121.8
U.P. 165.85 389.9 343.4 350.2
W.B. 146.18 366.5 347.8 387.6
Source: CMIE Infrastructure
4. Telephone:
20
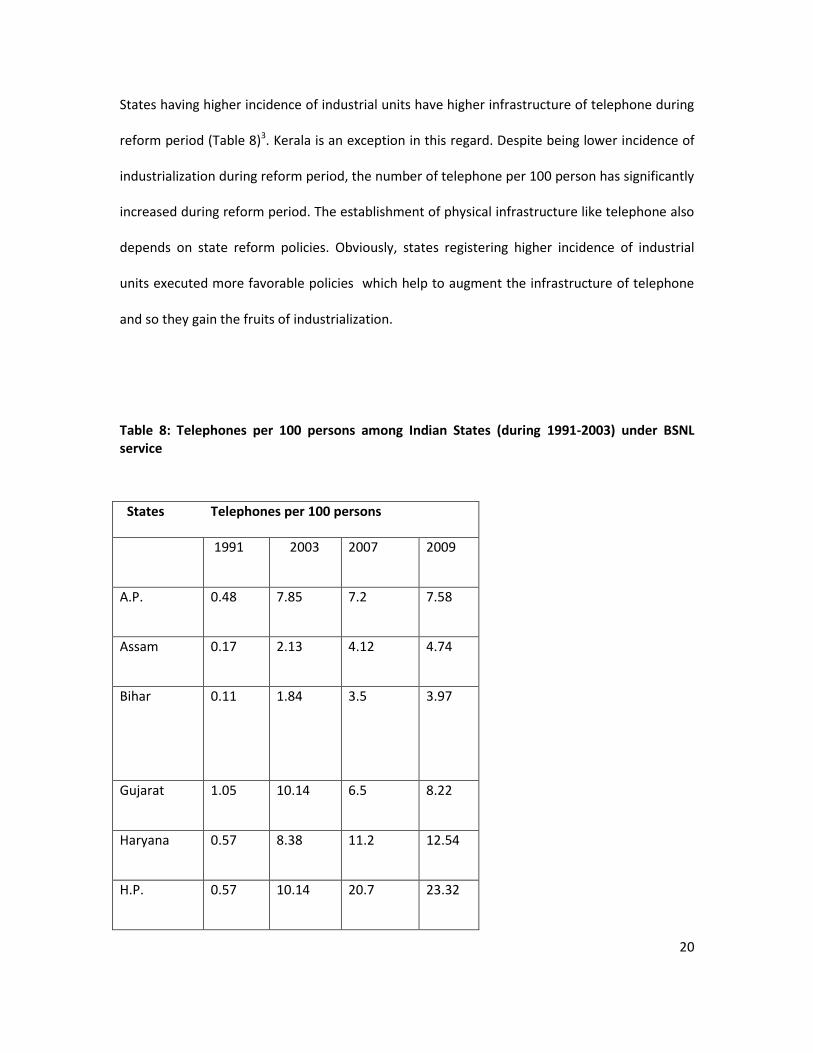
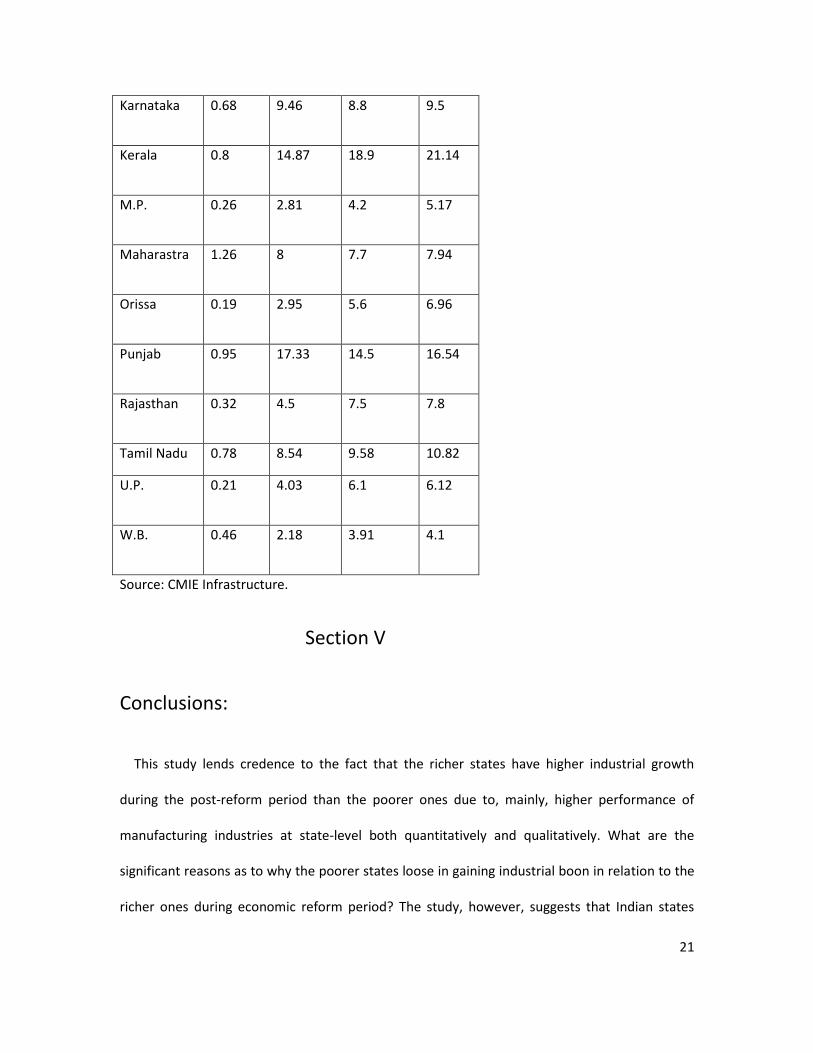
States having higher incidence of industrial units have higher infrastructure of telephone during
reform period (Table 8)3. Kerala is an exception in this regard. Despite being lower incidence of
industrialization during reform period, the number of telephone per 100 person has significantly
increased during reform period. The establishment of physical infrastructure like telephone also
depends on state reform policies. Obviously, states registering higher incidence of industrial
units executed more favorable policies which help to augment the infrastructure of telephone
and so they gain the fruits of industrialization.
Table 8: Telephones per 100 persons among Indian States (during 1991-2003) under BSNL service
States Telephones per 100 persons
1991 2003 2007 2009
A.P. 0.48 7.85 7.2 7.58
Assam 0.17 2.13 4.12 4.74
Bihar 0.11 1.84 3.5 3.97
Gujarat 1.05 10.14 6.5 8.22
Haryana 0.57 8.38 11.2 12.54
H.P. 0.57 10.14 20.7 23.32
21
Karnataka 0.68 9.46 8.8 9.5
Kerala 0.8 14.87 18.9 21.14
M.P. 0.26 2.81 4.2 5.17
Maharastra 1.26 8 7.7 7.94
Orissa 0.19 2.95 5.6 6.96
Punjab 0.95 17.33 14.5 16.54
Rajasthan 0.32 4.5 7.5 7.8
Tamil Nadu 0.78 8.54 9.58 10.82
U.P. 0.21 4.03 6.1 6.12
W.B. 0.46 2.18 3.91 4.1
Source: CMIE Infrastructure.
Section V
Conclusions:
This study lends credence to the fact that the richer states have higher industrial growth
during the post-reform period than the poorer ones due to, mainly, higher performance of
manufacturing industries at state-level both quantitatively and qualitatively. What are the
significant reasons as to why the poorer states loose in gaining industrial boon in relation to the
richer ones during economic reform period? The study, however, suggests that Indian states
22
which could contribute to higher economic and administrative reforms by various measures
during economic reform period did gain the boon of industrial achievements. One may argue
that already existing better infrastructure that prevailed before reforms is the most significant
reasons for the industrial achievements of richer Indian states. As is well known, West Bengal is
one of the middle income states like TN, Kerala, and Karnataka; but before 1980, for
infrastructural development she tops almost all Indian states. West Bengal registered second
major industrial states in terms of net value added and number of workers employed and third
in terms of number of factories. But the industrial performance of West Bengal has been
stepped down to the 8th position among Indian states during economic reform period. The fact
is that the states which registered better industrial performance during reform period mainly
due to higher fiscal reform did also register better infrastructural uplift during reform period.
OECD(2007) report also argue, “to begin with the process of closing the gaps in economic
performance across states , the relatively restrictive states need to improve their regulatory
environment so as to become more competitive and productive”( p.94). So, the fiscal reforms
of a state introduced by various economic and administrative reforms must help raising the
income level of the particular state reflecting thereby to develop her economy which might gain
the fruit of industrial development.
Notes
1. profit efficiency analysis: In econometric applications one specifies some explicit form of
the production, cost, or profit function to represent the benchmark technology for efficiency
measurement. The maximum profit is the profit function underlying what may be considered as
the best practice techniques utilized by a given group of firms. The interest of the sample firms
23
(here, major Indian States ) is focused on ascertaining the highest profit using the best practice
technique at the firm level given the level of technology and the feasibility of input-output
bundle chosen. We use the following method to analysis profit efficiency using DEA.
In econometric applications one specifies some explicit form of the production, cost, or profit function to
represent bench-mark technology for efficiency measurement. We also measure the profit efficiency of major
Indian states based on three financial performance indicators (labour cost and productive capital on net value
added). The procedure of its measure is as follow:
The method of data envelopment analysis introduced by Charnes et.al. (1978) and further extended to non-
constant returns technologies by Banker, Charnes and Cooper (BCC) (1984) and Charnes et.al.(1985)provides
a way to construct the production possibility set from an observed data set of input-output bundles.
Suppose that (Xj ,Yj ) is the input-output bundle observed for firm j ( j=1,2,…….,N). Clearly, these input-
output bundles are all feasible. Then the smallest production possibility set satisfying the assumption of
convexity and free disposability that includes these observed bundles is
S= {(X,Y):X ≥ ; Y≤ ; ≥ 0 ; ( j= 1,2,…….N)}
The set S is also known as the free disposal convex hull of the observed input-output bundles. One can obtain
various measures of efficiency of a firm using the set S as the reference technology.
For a commercial firm, both inputs and outputs will be choice variables and the only constraint would be the
feasibility of the input-output bundle chosen. For such a firm, criterion of efficiency is profit maximization. At
input and output prices w and p, respectively, the actual profit of the firm producing the output bundle Yº
from the input bundle Xº is ∏º = p/ Yº - w/ Xº. The maximum profit feasible for the firm is:
24
∏(w,p) = max p/ Y – w/ X : (X,Y) T.
In any empirical application, the maximum profit may be obtained as
∏ = max p/ Y – w/ X s.t.
0 ; ( j= 1,2,…….N)}
The profit efficiency of the firm is measured as = ∏º/ ∏ . This measure is also bounded between 0 and 1
except in case where the actual profit is negative, while the maximum profit is positive. In that case is less
than 0. If the maximum profit is negative as well, exceeds unity (Das et al, 2005).
2. The important findings of Economic Surveys by OECD (2007) on major Indian states are:
i) With relatively more liberal states receiving virtually all of India’s FDI flows (p.93).
ii) Excessive administrative burden are associated with lower share of private sector
employment in the formal sector: firms in the relatively restrictive states prefer to remain small
and informal so as to avoid government administrative requirements (p.93).
iii) States in which regulation of product is more conducive to competition have been far more
successful at infrastructure provision than the relatively restrictive states (p.197-98).
3) We have considered here the telephone service under BSNL, because the telecommunication
service other than BSNL is a very recent phenomenon (2002-03 onwards).
Bibliography:
Ahluwalia, Montek S.(2000). “Economic Performance of States in Post –Reform Period”,
Economic and Political Weekly, 6 May.
25
Banker, R.D., A. Charnes, and W.W.Coper (1984): ‘Some Models for Estimating Technical and Scale
Efficiencies in Data Envelopment Analysis’, Management Science ,30(9)(September),pp.1078-1092.
Bhattacharya, B.B. and S. Sakthivel (2004). “Regional Growth and Disparity in India: Comparison
of Pre- and Post-Reform Decades”, Economic and Political Weekly, 29(10), 6th March.
Charnes, A.,W.W. Copper, and E. Rhodes(1978): ‘Measuring the Efficiency of Decision Making Units’,
European Journal of Operation Research2(6),pp.429-444.
Charnes, A., T.C. Charles, W.W. Cooper and B.Golany (1985): “A Development Study of Data
Environment Analysis in Measuring the Efficiency of Maintenance Units in the U.S. Air Force, In: Russell,
G. and Robert Thrall, G. (Eds.)” , Analysis of Operation Research,2(1), 95-111.
Das, A., A. Nag and S.C. Ray (2005): “Liberalisation, Ownership and Efficiency in Indian Banking: A
Nonparametric Analysis”, Economic and Political Weekly, May 19.
OECD (2007): “Organization for Economic Co-operation and Development Surveys: India”,
Academic Foundations, New Delhi.
OECD (2002): “Productivity and Innovation: The Impact of Product and Labour Market Policies” ,
OECD Economic Outlook 71.Preliminary Edition: Paris.
Rao, H., “Growing Regional Disparities in Development in India”, Indian Economic
Journal,54(1),April-June,2006.