0 3 - htrg.comhtrg.com/wp-content/uploads/sites/2/hancock-timberland-investor... · note: ipca...
TRANSCRIPT

Hancock Timberland Investor Brazil October 2018
The combination of historically high prices for softwood lumber and panels in the U.S. this past summer and the rapid fall in the value of the BRL relative to the USD has boosted Brazilian shipments of softwood panels and softwood lumber to the U.S.
With the real dropping from a January’s 3.2 BRL / USD to July’s 3.8 BRL/USD, Brazil’s exports of softwood lumber and plywood trended higher, reaching a peak in May prior to losing ground in June following the trucker’s strike, and then regaining forward momentum in July.
Brazil’s share of total softwood panel imports into the U.S. increased to 6.4% between January 2018 to July 2018, which was two times greater than the historical average share of 3.2% during the period, 2013(January) to 2017(December). Brazil’s share of softwood lumber imports to the U.S. averaged 1.4% for the first seven months of 2018, compared to Brazil’s historical average monthly share of U.S. imports of 0.64% from 2013 (January) – 2017 (December).
Hancock Timberland Investor Brazil October 2018
2.5
2.7
2.9
3.1
3.3
3.5
3.7
3.90
20,000
40,000
60,000
80,000
100,000
120,000
140,000
160,000
180,000
Janu
ary
Febr
uary
Mar
ch
Apr
il
May
June July
Aug
ust
Sep
tem
ber
Oct
ober
Nov
embe
r
Dec
embe
r
Janu
ary
Febr
uary
Mar
ch
Apr
il
May
June July
2017 2018
USD
per
BR
L
U.S
. Im
ports
of S
oftw
ood
Lum
ber a
nd P
anel
s (m
3)
Softwood Plywood Softwood Lumber
Source:s Macrobond August 30 2018, USDA Foreign Agriculture Service September 20 2018
Brazilian Shipments of Softwood Lumber and Panels to the U.S. Rise as the BRL Falls Monthly Shipments of Softwood Plywood and Lumber from Brazil to the U.S (M3)

Hancock Timberland Investor Brazil October 2018 2
Second quarter economic growth dipped to a 1.0 percent growth rate year-on–year compared to first quarter’s 1.2
percent. May’s nationwide trucker strike affected Brazil’s economy, with estimates of total losses to Brazil’s
economy of US$25 - 30 billion1. In its June report, Brazil’s Central Bank cut projected annual growth in GDP
for 2018 to just 1.6 percent1. Despite the slowdown, the second quarter in 2018 marks the sixth consecutive quarter of positive economic growth in Brazil. With the national
presidential election scheduled for October, the unsettled and highly contentious political landscape may contribute
to heightened uncertainty and increased volatility in Brazil’s financial markets.
Slower Growth, Yet Still Positive Figure 1: Second Quarter Brazil Real GDP (Percent)
Inflation Ticks Upward While Borrowing Costs Remain Historically Low Figure 2: Quarterly Brazil Interest Rates and Inflation (Percent per year)
Sources: IBGE, Macrobond as of June 2018
Economic Indicators October 2018
Note: IPCA measures consumer price inflation. Selic rate is the benchmark overnight
bank rate calculated from daily rates for a quarterly average
Brazil inflation picked up modestly in the second quarter, averaging 3.3 percent, up from first quarter’s average of
2.8 percent, yet still below the average of 3.5 percent a year ago, and well below the five year average for the
period of 2013 – 2017 of 7 percent. Brazil’s Central Bank (RCB) referred to underlying inflation as now being at
“appropriate” rather than at “low” levels during a September 19 meeting2. The Selic benchmark interest rate was left unchanged at 6.5% at the BCB’s June 20 meeting,
resulting in an average of 6.4% for the second quarter. The BCB’s September 19 meeting further held rates
unchanged – the fourth meeting in a row where rates were untouched3. Given the recent movements in the foreign-
exchange market and the possible impacts of the weaker currency on inflation expectations, a possible tightening
cycle may be brought forward, and start earlier than proffered for 2019.
-8%
-6%
-4%
-2%
0%
2%
4%
6%
8%
10%
2005Q1
2006Q1
2007Q1
2008Q1
2009Q1
2010Q1
2011Q1
2012Q1
2013Q1
2014Q1
2015Q1
2016Q1
2017Q1
2018Q1
Current Quarter (Year over year) Lagging 4 Quarter Annualized
0%
5%
10%
15%
20%
25%
2005Q1
2006Q1
2007Q1
2008Q1
2009Q1
2010Q1
2011Q1
2012Q1
2013Q1
2014Q1
2015Q1
2016Q1
2017Q1
2018Q1
Selic IPCA
1. https://gain.fas.usda.gov/Recent%20GAIN%20Publications/Economic%20Impact%20of%20the%20Brazilian%20Trucker%20Strike_Brasilia_Brazil_7-3-2018.pdf
Sources: IBGE, Macrobond as of June 2018 2. Macrobond June 2018 3Capital Economics, Latin America Economics, September 20, 2018 3https://www.wsj.com/articles/brazil-central-bank-leaves-selic-rate-unchanged-at-6-5-1529530365

Hancock Timberland Investor Brazil October 2018 3
Foreign direct investment (FDI) into Brazil moved lower in the first quarter to $US 15.4 billion, down 12 percent
from the previous quarter, and now 30 percent below the cyclical peak of $US 21.8 billion reached in the fourth
quarter of 2015. Despite lingering economic and political uncertainty, the country’s sheer size makes it a persistent
destination for FDI.
Foreign Investment Slips Figure 4: Quarterly Foreign Direct Investment – Net Capital Flows (USD Millions)
The BRL weakened sharply in the second quarter against the USD (-11 percent) on sharpened strength in the USD
and tightening financial conditions in the U.S. The BRL weakened against most major currencies. The BRL fell
against the Chinese Yuan (-11) and the Euro (-8 percent). Given political and fiscal uncertainty over the outcome of
the October elections in Brazil, and recent strength in the USD, the BRL is expected to be volatile for the remainder of 2018.
BRL Weakens Figure 3: Quarterly Brazil FX
Economic Indicators October 2018
$0
$5,000
$10,000
$15,000
$20,000
$25,000
2013Q1
2014Q1
2015Q1
2016Q1
2017Q1
2018Q1
Brasil México
Source: OECD as of June 2018 Note: FDI reports lag one quarter
0.00
0.10
0.20
0.30
0.40
0.50
0.60
0.70
0.80
0.90
1.00
0.00
0.50
1.00
1.50
2.00
2.50
3.00
3.50
4.00
4.50
5.00
2005Q1
2006Q1
2007Q1
2008Q1
2009Q1
2010Q1
2011Q1
2012Q1
2013Q1
2014Q1
2015Q1
2016Q1
2017Q1
2018Q1
BR
L p
er
CN
Y,
AR
S
BR
L p
er
US
D,
EU
R
BRL per USD BRL per EUR BRL per CNY BRL per ARS
Source: Macrobond as of June 2018

Hancock Timberland Investor Brazil October 2018 4
Brazil exported 5.3 million metric tons of forest products in the second quarter of 2018, a 4 percent drop in total forest products exports from first quarter 2018, falling from last quarter’s record volumes. May’s nation-wide trucker’s strike limited production, forcing abbreviated production schedules by many pulp and paper producers in the country.6 Strong global demand and high prices for market pulp continued to support strong volumes of pulp exports - Brazil’s dominant forest product – in the second quarter. Wood panel and lumber exports from Brazil were also strong, with second quarter panel exports of 0.55 million metric tons, down 0.02 million tons from last quarter, while lumber exports were up .03 million metric tons, at 0.40 million metric tons, second quarter. The second half of 2018 looks promising for Brazil forest product demand and exports due to the depreciation of the BRL and the strength in global markets for market pulp and solid wood products.
Steel production fell to 8.22 million metric tons second quarter from 8.65 million metric tons first quarter, a slower start to 2018 after four consecutive quarters of steel production increases in 2017. Steel net exports second quarter fell 17 percent from first quarter, and steel consumption in Brazil moved sideways. The 11-day trucker strike in May disrupted steel exports. New trade tariffs on imported steel into the U.S. went into effect on June 1. Brazil was exempt from the broad based 25 percent tariff up to a defined quota, which varies by specific steel products4. Despite these new trade tariffs, the United States was the largest market for Brazil’s exports during the second quarter, followed by Turkey, and Germany5.
Sources: Brazil Ministry of Industry, Foreign Trade and Services, June 2018
Steel Production Falls With Lower Exports Figure 5: Quarterly Brazil Steel Production, Exports and Domestic Production (Million MT)
Pulp Export Volumes Remain Close to Record Levels Figure 6: Quarterly Brazil Forest Product Exports (Million MT)
Economic Indicators October 2018
6https://technology.risiinfo.com/logistics-35
2005Q1
2006Q1
2007Q1
2008Q1
2009Q1
2010Q1
2011Q1
2012Q1
2013Q1
2014Q1
2015Q1
2016Q1
2017Q1
2018Q1
0
1
2
3
4
5
6
7
8
9
10
Mill
ion
Me
tric
To
ns
Net Exports Steel Production Apparent Consumption
0
1
2
3
4
5
6
2005Q1
2006Q1
2007Q1
2008Q1
2009Q1
2010Q1
2011Q1
2012Q1
2013Q1
2014Q1
2015Q1
2016Q1
2017Q1
2018Q1
Celulose Paper Products Lumber Panels
Sources: Brazil Ministry of Industry, Foreign Trade and Services, June 2018
4http://agenciabrasil.ebc.com.br/en/economia/noticia/2018-07/brazil-steel-exports-us-rise-after-tariffs 5United States Dept. of Commerce, Global Steel Trade Monitor, September 2018
Hancock Timberland Investor Brazil October 2018 5
U.S. West Coast and Finnish Sawtimber Prices Climb Higher Figure 8: Quarterly Sawtimber Stumpage Prices for Timber (USD/m3)
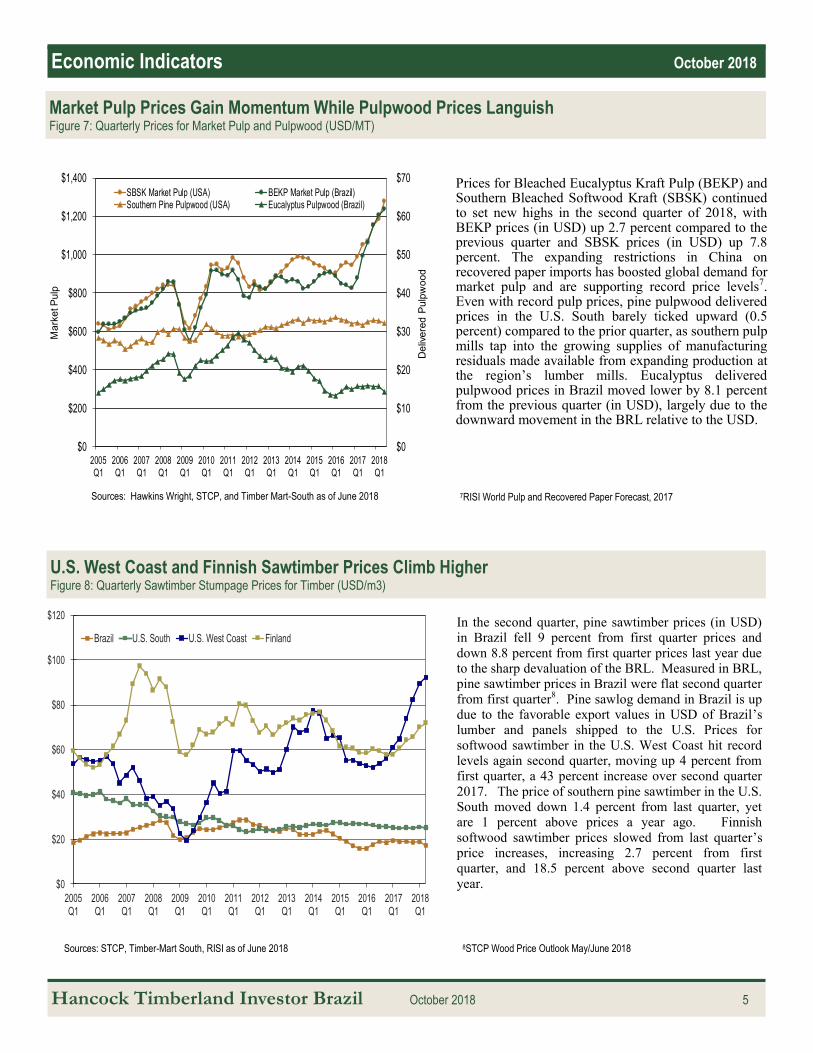
Prices for Bleached Eucalyptus Kraft Pulp (BEKP) and Southern Bleached Softwood Kraft (SBSK) continued to set new highs in the second quarter of 2018, with BEKP prices (in USD) up 2.7 percent compared to the previous quarter and SBSK prices (in USD) up 7.8 percent. The expanding restrictions in China on recovered paper imports has boosted global demand for market pulp and are supporting record price levels7. Even with record pulp prices, pine pulpwood delivered prices in the U.S. South barely ticked upward (0.5 percent) compared to the prior quarter, as southern pulp mills tap into the growing supplies of manufacturing residuals made available from expanding production at the region’s lumber mills. Eucalyptus delivered pulpwood prices in Brazil moved lower by 8.1 percent from the previous quarter (in USD), largely due to the downward movement in the BRL relative to the USD.
In the second quarter, pine sawtimber prices (in USD) in Brazil fell 9 percent from first quarter prices and
down 8.8 percent from first quarter prices last year due to the sharp devaluation of the BRL. Measured in BRL, pine sawtimber prices in Brazil were flat second quarter
from first quarter8. Pine sawlog demand in Brazil is up due to the favorable export values in USD of Brazil’s lumber and panels shipped to the U.S. Prices for
softwood sawtimber in the U.S. West Coast hit record levels again second quarter, moving up 4 percent from first quarter, a 43 percent increase over second quarter
2017. The price of southern pine sawtimber in the U.S. South moved down 1.4 percent from last quarter, yet are 1 percent above prices a year ago. Finnish
softwood sawtimber prices slowed from last quarter’s price increases, increasing 2.7 percent from first quarter, and 18.5 percent above second quarter last
year.
Sources: STCP, Timber-Mart South, RISI as of June 2018
Economic Indicators October 2018
$0
$10
$20
$30
$40
$50
$60
$70
$0
$200
$400
$600
$800
$1,000
$1,200
$1,400
2005Q1
2006Q1
2007Q1
2008Q1
2009Q1
2010Q1
2011Q1
2012Q1
2013Q1
2014Q1
2015Q1
2016Q1
2017Q1
2018Q1
Deliv
ere
d P
ulp
woo
d
Ma
rke
t P
ulp
SBSK Market Pulp (USA) BEKP Market Pulp (Brazil)Southern Pine Pulpwood (USA) Eucalyptus Pulpwood (Brazil)
Market Pulp Prices Gain Momentum While Pulpwood Prices Languish Figure 7: Quarterly Prices for Market Pulp and Pulpwood (USD/MT)
Sources: Hawkins Wright, STCP, and Timber Mart-South as of June 2018
$0
$20
$40
$60
$80
$100
$120
2005Q1
2006Q1
2007Q1
2008Q1
2009Q1
2010Q1
2011Q1
2012Q1
2013Q1
2014Q1
2015Q1
2016Q1
2017Q1
2018Q1
Brazil U.S. South U.S. West Coast Finland
8STCP Wood Price Outlook May/June 2018
7RISI World Pulp and Recovered Paper Forecast, 2017
Hancock Timberland Investor Brazil October 2018 6
Disclosures
Hancock Natural Resource Group Research Team
Court Washburn Managing Director and Chief Investment Officer [email protected] Keith Balter Director of Economic Research [email protected]
Mary Ellen Aronow Associate Director, Forest Economics [email protected] Daniel Serna Senior Agricultural Economist [email protected]
Elizabeth Shestakova Economic Research Analyst [email protected] Weiyi Zhang Natural Resource Economist [email protected]
Investing involves risks, including the loss of principal. Financial markets are volatile and can fluctuate significantly in response to company, industry, political, regulatory, market, or economic developments. These risks are magnified for investments made in emerging markets. Currency risk is the risk that fluctuations in exchange rates may adversely affect the value of a fund’s investments. The natural resources industry can be significantly affected by events relating to international political and economic developments, energy conservation, the success of exploration projects, commodity prices, and taxes and other governmental regulations. The information provided herein does not take into account the suitability, investment objectives, financial situation or particular needs of any specific person. You should consider the suitability of any type of investment for your circumstances and, if necessary, seek professional advice. This material, intended for the exclusive use by the recipients who are allowable to receive this document under the applicable laws and regulations of the relevant jurisdictions, was produced by and the opinions expressed are those of Manulife Asset Management as of the date of this publication, and are subject to change based on market and other conditions. The information and/or analysis contained in this material have been compiled or arrived at from sources believed to be reliable but Manulife Asset Management does not make any representation as to their accuracy, correctness, usefulness or completeness and does not accept liability for any loss arising from the use hereof or the information and/or analysis contained herein. The information in this material may contain projections or other forward-looking statements regarding future events, targets, management discipline or other expectations, and is only as current as of the date indicated. The information in this document including statements concerning financial market trends, are based on current market conditions, which will fluctuate and may be superseded by subsequent market events or for other reasons. Manulife Asset Management disclaims any responsibility to update such information. Neither Manulife Asset Management or its affiliates, nor any of their directors, officers or employees shall assume any liability or responsibility for any direct or indirect loss or damage or any other consequence of any person acting or not acting in reliance on the information contained herein. All overviews and commentary are intended to be general in nature and for current interest. While helpful, these overviews are no substitute for professional tax, investment or legal advice. Clients should seek professional advice for their particular situation. Neither Manulife, Manulife Asset Management™, nor any of their affiliates or representatives is providing tax, investment or legal advice. Past performance does not guarantee future results. This material was prepared solely for informational purposes, does not constitute a recommendation, professional advice, an offer or an invitation by or on behalf of Manulife Asset Management to any person to buy or sell any security or adopt any investment strategy, and is no indication of trading intent in any fund or account managed by Manulife Asset Management. No investment strategy or risk management technique can guarantee returns or eliminate risk in any market environment. Unless otherwise specified, all data is sourced from Manulife Asset Management. Hancock Timber Resource Group Hancock Timber Resource Group is a division of Hancock Natural Resource Group, Inc., a registered investment advisor and wholly owned subsidiary of Manulife Financial Corporation. © Hancock Natural Resource Group, Inc. Manulife Asset Management Manulife Asset Management is the global asset management arm of Manulife Financial Corporation (“Manulife”). Manulife Asset Management and its affiliates provide comprehensive asset management solutions for institutional investors and investment funds in key markets around the world. This investment expertise extends across a broad range of public and private asset classes, as well as asset allocation solutions. The material issued in the following countries by the respective Manulife entities - Canada: Manulife Asset Management Limited, Manulife Asset Management Investments Inc., Manulife Asset Management (North America) Limited and Manulife Asset Management Private Markets (Canada) Corp. Hong Kong: Manulife Asset Management (Hong Kong) Limited and has not been reviewed by the HK Securities and Futures Commission (SFC). Indonesia: PT Manulife Aset Manajmen Indonesia. Japan: Manulife Asset Management (Japan) Limited. Malaysia: Manulife Asset Management Services Berhad. Philippines: Manulife Asset Management and Trust Corporation. Singapore: Manulife Asset Management (Singapore) Pte. Ltd. (Company Registration Number: 200709952G). Switzerland: Manulife AM (Swiss) LLC Taiwan: Manulife Asset Management (Taiwan) Co. Ltd. Thailand: Manulife Asset Management (Thailand) Company Limited. United Kingdom and European Economic Area: Manulife Asset Management (Europe) Limited which is authorised and regulated by the Financial Conduct Authority. United States: Manulife Asset Management (US) LLC, Hancock Capital Investment Management, LLC and Hancock Natural Resource Group, Inc. Vietnam: Manulife Asset Management (Vietnam) Company Ltd. Manulife, Manulife Asset Management, the Block Design, the Four Cube Design, and Strong Reliable Trustworthy Forward-thinking are trademarks of The Manufacturers Life Insurance Company and are used by it, and by its affiliates under license.