0 report 2014 - БНБ · annual report • 2014 contents ... maintaining banking system stability...
TRANSCRIPT


ANNUAL REPORT • 2014
Bulgarian National Bank

Published by the Bulgarian National Bank1, Knyaz Alexander I Square, 1000 SofiaTel.: (+359 2) 9145 1351, 9145 1209, 9145 1231Fax: (+359 2) 980 2425, 980 6493Printed in the BNB Printing Centre
Website: www.bnb.bg
© Bulgarian National Bank, 2015
The BNB Annual Report for 2014 employs data published prior to 8 April 2015.
Materials and information in the BNB 2014 Annual Report may be quoted or reproduced without further permission.
ISSN 1313-1494 (print)ISSN 2367-492X (online)

Honourable Chairman of the National Assembly,
Honourable People’s Representatives,
Under the provisions of Article 1, paragraph 2 and Article 51 of the
Law on the Bulgarian National Bank, I have the honour of presenting
the Bank’s 2014 Annual Report.
Ivan Iskrov
Governor
of the Bulgarian National Bank

BN
B G
over
ning
Cou
ncil
Sitting from left to right: Lena Roussenova, Ivan Iskrov, Boryana Pencheva.Standing from left to right: Tsvetan Gunev, Kalin Hristov, Statty Stattev, Dimitar Kostov.

Governing Council
Ivan IskrovGovernor
Dimitar KostovDeputy GovernorBanking Department
Kalin HristovDeputy GovernorIssue Department
Tsvetan GunevDeputy GovernorBanking Supervision Department
Boryana Pencheva
Lena Roussenova*
Statty Stattev
* Lena Roussenova is a Member of the BNB Governing Council since 13 June 2014. Until 12 June 2014, Penka Kratunova was a Member of the BNB Governing Council.

Organisational Structure of the BNB
GOVERNING COUNCIL
GOVERNORIvan Iskrov
General Auditor
DEPUTY GOVERNORDimitar Kostov
Banking Fiscal Services Department Department
Bank Policy Directorate
Economic Research and Forecasting
Directorate
Supervisory Policy Directorate
Legal Services and Administration
Directorate
DEPUTY GOVERNORKalin Hristov
Issue Department
Treasury Directorate
Risk Analysis and Control
Directorate
Credit Institutions Supervision
Directorate
Macro-prudential Supervision and
Financial Stability Directorate
Special Supervision Directorate
DEPUTY GOVERNORTsvetan Gunev
Banking Supervision Department
Statistics Directorate
General Accounting Directorate
Government and Government
Guaranteed Debts Depository Directorate
Projections and Management of State Budget Cash Flows
Directorate
Issuing Policy and Control
Directorate
SECRETARY GENERALPetko Krastev
Administrative Directorate
Information Systems Directorate
Capital Investment, Maintenance and
Transport Directorate
Public ProcurementDirectorate
STRUCTURAL UNITS SUBORDINATED TO
THE GOVERNOR
Human Resource Management
Directorate
International Relations Directorate
Legal Directorate
Banking Security and Protection of Classi-
fied Information Directorate
Public Relations Directorate
Issue and Cash Directorate

7
In 2014 the Bulgarian National Bank marked the 135th anniversary of its establishment with a number of events and initiatives to acquaint the public in more detail with the Bank’s past role and functions, its current activities and duties, and its responsibilities as Bulgaria’s central bank and member of the European System of Central Banks.
The main jubilee celebrations were on 6 June.* They included an international confer-ence on Central Banks and the Overhaul of Banking Regulation and the 31st session of the Central Banks Governors’ Club of Central Asia, Black Sea Region and Balkan Countries.
Marking its jubilee, the Bank posted on its website more complete catalogues of com-memorative coin and banknote samples and published a new brochure of exhibits in its Museum Collection. The BNB website now also carries declassified BNB Reports for the 1980–1990 period which are a valuable source of information on Bulgaria’s economic history during that decade. The illustrated two volume work Mihail Tenev: Life and Works, including the memoirs of this eminent Bulgarian financier and Bank Governor at the close of the 19th Century, amplified the BNB publications series A History of Finance and Banking: the Heritage.
The joint hosting by the BNB and ECB of European Cultural Days, this year devoted to Bulgaria, formed part of the jubilee celebrations. The Frankfurt events included a series of events and performances by Bulgarians representing national history and culture. Evoking great interest in Bulgaria, these initiatives enjoyed great success.
* A Deed of Association established the Bulgarian National Bank on 25 January 1879. Appointment of the first Governor was on 4 April that year. The Bank formally opened its doors on 23 May. BNB anniversaries are tradition-ally marked on 6 June, the day of the first banking operation.
YEARS


9
Bulg
arian National B
ank. Annual R
eport • 2014
Contents
Summary _________________________________________________________ 11
I. Economic Development in 2014 __________________________________ 15
1. The External Environment ______________________________________ 15
2. The Bulgarian Economy ________________________________________ 17
II. Gross International Foreign Exchange Reserves ____________________ 31
1. The Amount and Structure of Gross International Reserves _____________ 31
2. Gross International Reserve Risk and Yield __________________________ 33
III. Payment Systems _____________________________________________ 40
IV. Banks’ Reserves at the BNB ____________________________________ 45
V. Currency in Circulation _________________________________________ 47
VI. Maintaining Banking System Stability and Protection of Depositor Interests 51
1. State of the Banking System ____________________________________ 51
2. Assessment of the Financial Performance of Financial Institutions Registered under Article 3a of the Law on Credit Institutions ___________ 59
3. Banking Supervision ___________________________________________ 61
VII. The Central Credit Register _____________________________________ 66
VIII. The Fiscal Agent and State Depository Function _____________________ 68
IX. Participation in the ESCB and in the Activities of EU Institutions _________ 73
X. International Relations _________________________________________ 76
XI. Statistics ____________________________________________________ 77
XII. Research ____________________________________________________ 79
XIII. Information Systems ___________________________________________ 80
XIV. Human Resources Management _________________________________ 82
XV. Facilities Management _________________________________________ 84
XVI. BNB Internal Audit ____________________________________________ 85
XVII. BNB Budget Implementation ____________________________________ 86
1. Operating Expenditure _________________________________________ 86
2. The Investment Programme _____________________________________ 87
XVIII. Bulgarian National Bank Consolidated Financial Statements as of 31 December 2014 _______________________________________ 89
Major Resolutions of the BNB Governing Council in 2014 __________________ 125
Appendix (CD)

Bul
gar
ian
Nat
iona
l Ban
k. A
nnua
l Rep
ort •
201
4
10
Abbreviations
BIR Base interest rate BIS Bank for International Settlements, Basle, Switzerland BISERA System for servicing customer payments initiated for execution at a designated time BNB Bulgarian National Bank BORICA Banking Organisation for Payments Initiated by Cards BSE Bulgarian Stock Exchange BTC Bulgarian Telecommunication Company CEFTA Central European Free Trade Association CIF Cost, Insurance, Freight CM Council of Ministers EBRD European Bank for Reconstruction and Development EC European Commission ECB European Central Bank ECOFIN Economic and Financial Affairs Council EFTA European Free Trade Association EMU Economic and Monetary Union ESCB European System of Central Banks EU European Union FLIRBs Front-loaded Interest Reduction Bonds FOB Free on Board GSAS Government Securities Auction System GDDS General Data Dissemination System GDP Gross Domestic Product HICP Harmonised Index of Consumer Prices IAS International Accounting Standards IFO Institute of Economic Research, Germany IFRIC International Financial Reporting Interpretations Committee IMF International Monetary Fund KTB Corporate Commercial Bank LBNB Law on the Bulgarian National Bank MF Ministry of Finance MFIs Monetary financial institutions NLO National labour office NSI National Statistical Institute OECD Organisation for Economic Cooperation and Development OPEC Organisation of Petroleum Exporting Countries RINGS Real-time Interbank Gross Settlement System SBL State Budget Law SDR Special Drawing Rights TFP Transitional and Final Provisions VAT Value Added Tax ZUNK Bulgarian abbreviation of the Law on Settlement of Non-performing Credits
Negotiated prior to 31 December 1990 (LSNC)

11
Sum
mary
Summary
The global economy growth rate in 2014 was 3.3 per cent, as in 2013. Diverse devel-opments were observed across regions. Economic activity accelerated in developed countries, while slowing in developing and emerging countries mainly due to the geopolitical tension in Russia and Ukraine and the slower growth of the larger econo-mies like China and Brazil. Euro area growth rate accelerated to 0.9 per cent from -0.5 per cent in 2013, with Malta, Slovenia, Slovakia, and Lithuania growing faster while Cyprus, Italy, and Finland contracted. Real GDP growth rate in the USA was 2.4 per cent from 2.3 per cent in 2013.
Global annual inflation fell to 1.7 per cent from 2.6 per cent at the end of 2013. This reflected continuing declines in major commodity and fuel prices on international markets. At the end of 2014 annual euro area inflation was running at -0.2 per cent from 0.8 per cent a year earlier, US inflation moderating to 0.8 per cent from 1.5 per cent in 2013.
In June and September the European Central Bank (ECB) cut main refinancing opera-tions and lending and deposit interest rates, setting negative deposit facility interest rate in June. The measures providing liquidity for euro area banks were expanded to target an encouraging lending. The Federal Reserve System did not change interest rate, ending the programme of additional monthly purchases of US government and mortgage backed bonds in October. The growing divergence in ECB and Federal Reserve monetary policy resulted in depreciation of the euro against the US dollar in the second half of the 2014. Government bond yields declined globally. German bonds declined sharply to historic lows across maturity sectors, securities under four years maturity trading at negative yields by the year’s end. Euro area periphery government securities yield spreads narrowed closer to German benchmarks, with Portugal, Ireland, and Spain leading.
Bulgarian economic activity livened as the external environment improved gradually. Final consumption boosted real GDP by 1.7 per cent from 1.1 per cent in 2013. In the second half year the Ukraine and Russia crisis, domestic political uncertainty, and a June banking liquidity crisis, had limited effect on economic activity. The labour market improved slightly, employees rising 0.4 per cent against -0.4 per cent in 2013. Average unemployment fell to 11.4 per cent from 13.0 per cent in 2013. Productivity growth moderated to 1.3 per cent from 1.6 per cent in 2013. Nominal average com-pensation per employee growth rate fell to 1.5 per cent from 8.8 per cent in 2013, or 3.2 per cent from 8.5 per cent in real terms.
Growing domestic demand boosted imports, resulting in -1.1 percentage point nega-tive net export contribution to growth. Though the balance of payments trade deficit widened, the current and capital account surplus rose greatly on 2013. The balance of payments financial account was in surplus by EUR 2120.1 million from a deficit in 2013.
Annual end of year inflation was -2.0 per cent from -0.9 per cent in 2013 because of lower international food, fuel, and commodity prices and the reduction in some administrative prices from late 2014. Euro depreciation on the US dollar in the second half year curbed manufactured goods and food deflation.
Monetary and credit aggregate dynamics reflected diverse factors. Persistent high household savings rate continued boosting banks’ attracted funds. Liquidity pres-sure on banks in mid-June had a temporary effect on monetary aggregates: part of time deposits left banks and boosted currency in circulation, another part going

Bul
gar
ian
Nat
iona
l Ban
k. A
nnua
l Rep
ort •
201
4
12
into over night deposits. Timely measures restored depositor confidence, deposits beginning to return to banks as early as July. Lending to the non-government sector tended to rise faster through the first half year, moderating slightly in the second half.
The consolidated fiscal programme had a BGN 3072.9 million (3.7 per cent to GDP) deficit, a deterioration of BGN 1632.0 million on 2013. The worsened budget position reflected sig nificantly lower tax revenue than projected in the 2014 State Budget Law, not offset by government spending cuts. A gross government securities issue on the domestic market, a ten-year Eurobonds issue on international capital markets in June, and an external bridge bank loan in December together worth BGN 6842 million financed budget deficit and government debt payments.
The Bulgarian National Bank closely monitors global developments and the national economy. The BNB pursues its primary objective of price stability through maintaining the stability of the national currency by adhering to the Law on the Bulgarian National Bank and applying its potential and capabilities effectively. The Bank performs its statutory duty of investing Bulgaria’s gross international reserves to the principles and practices of prudent investment. It regulates and supervises Bulgarian banks to main-tain bank ing stability and protect depositors’ interest. It assists the implementation, operation and oversight of efficient payment systems by regulating and supervising the payment system operators, payment institutions and electronic money institutions. As an issuing bank, it produces new and handles uncirculated or withdrawn currency. The Bank is fiscal agent and depository to the state. As a member of the European System of Central Banks (ESCB) and other European Union bodies, the BNB actively participates in the discussions.
The market value of gross international reserves rose EUR 2108 million to EUR 16,534 million. The BNB continued managing international reserve investment risk con-servatively. Net investment income was EUR 161.28 million (1.14 per cent yield). The positive net result of exchange rate movements and price revaluations on asset and liability open foreign currency positions in the Issue Department balance sheet was EUR 137.16 million, almost entirely due to a marked monetary gold price rise. Inter est expenses on Issue Department balance sheet liabilities were zero. As sum of the above components, net earnings from BNB international reserve management was EUR 298.44 million or 2.20 per cent net yield for 2014.
March 2014 amendments to the Law on Credit Institutions and amendments to BNB regulations brought bank supervision into line with the EU capital requirements direc-tive and regulation. The new framework changed the BNB supervisory approach by cutting the minimum capital adequacy ratio from 12 per cent to 8 per cent and remov-ing specific provisions. To preserve accumulated banking capital buffers, the BNB set domestic institutions’ capital conservation buffer at 2.5 per cent from May and the systemic risk capital buffer at 3 per cent from October.
Maintaining banking stability was challenged in the second half of 2014. The liquidity and capital buffers on which the BNB had traditionally insisted encountered a real life test. In the second half of June banks came under strong liquidity pressure ramped up by media reports and online rumour about set banks. A run on deposits of the Corporate Commercial Bank (KTB) and its subsidiary CB Victoria exhausted their liquidity and forced them to sus pend disbursements. At KTB and CB Victoria request the BNB imposed special supervision over them on 20 and 22 June 2014. In compli-ance with the Law on Credit Institutions the BNB appointed conservators, closed the two banks for three months, dismissed their boards, and revoked the voting rights of shareholders with over 10 per cent stakes. Three auditors (Deloitte Audit OOD, Ernst & Young OOD, and AFA OOD) which had not audited the two banks in recent years started a comprehensive assessment of their state and rescue capital needs. Along-side this, an on-site supervisory inspection between 7 July 2014 and 14 October 2014 examined the bank’s 30 June status.

13
Sum
mary
By the end of June 2014 state aid to support Bulgarian bank liquidity had been negotiated with the European Commission. Liquidity pressure abated and banking stability returned. Despite the convoluted crisis at KTB, macroeconomic and financial stability endured.
The BNB adopted the three audit reports on 21 October 2014. Under Article 107, paragraph 3 of the Law on Credit Institutions the BNB Governing Council asked the conservators for report on the KTB balance sheet and assets as of 30 September 2014 based on International Financial Reporting Standards, plus financial and super-visory reports to EU rules. After the conservators’ report presented on 4 November 2014 the Gov erning Council determined KTB’s own funds under Regulation (EU) No 575/2013 to be BGN -3,745,313,000, breaching Regulation (EU) No 575/2013 Article 92 capital requirements. As a result, on 6 November 2014 the BNB revoked KTB’s licence under Article 36, paragraph 2, item 2, Article 103, paragraph 1, item 1 and paragraph 2, item 25, and Article 151, paragraph 1, motion one of the Law on Credit Institutions, and Article 16, item 15 of the Law on the Bulgarian National Bank.
Financial and supervisory reports on CB Victoria as of 30 September 2014 showed it met capital regulations but had no liquidity to cover obligations to depositors. A set of measures including selling the bank’s credit portfolio provided funds to settle both guaranteed and non-guaranteed depositor obligations. CB Victoria reopened to trade as licensed on 12 December 2014.
The banking system continued providing financial intermediation services, its liquidity and capital buffers strengthened further. Additional BNB requirements and macro-pru dential measures brought its liquid assets to liabilities ratio to 30.12 per cent by end-December 2014. Total banking capital adequacy was 21.95 per cent at the year’s end, with tier one capital adequacy at 19.97 per cent. The share of net (balance sheet) loans past due over 90 days in net loans (excluding those to credit institutions) declined to 9.39 per cent. Banks’ audited profit was BGN 711 million, up BGN 207 mil lion on 2013. Return on assets (ROA) was 0.85 per cent and return on equity (ROE) 7.15 per cent.
Payment systems operated efficiently and provided due flow continuity. The BNB’s RINGS system processed 1,024,489 payments or 82.4 per cent of Bulgarian pay-ments, worth BGN 633.9 billion. The number of payments through the BNB’s Trans-European Automated Real-time Gross settlement Express Transfer system for the euro national system component, TARGET2-BNB, rose 19.7 per cent. Alongside operating the two major payment sys tems, the Bank supervises all Bulgarian payment systems’ risk profiles, reliability, and efficiency.
BNB issue and cash operations include banknote printing and coin minting; accept-ing, delivering, repaying, processing, authenticity and fitness checking of Bulgar ian banknotes and coins, and foreign currency; exchanging damaged cash; and destroy-ing unfit Bulgarian banknotes and coins. By the end of 2014, 396.7 million banknotes worth BGN 11,355 million circulated. The average circulating banknote was worth BGN 28.63. Coins in circulation numbered 1779.4 million worth BGN 225.5 million. The average coin in circulation was worth BGN 0.13. Retained non-genuine Bulgarian banknotes amounted to 0.000723 per cent of circulating banknotes, while retained non-genuine Bulgarian coins amounted to 0.000091 per cent of circulating coins. Ensuring cash circulation integrity and security, in 2014 the BNB performed six full and 29 spot on-site checks into credit institution and service provider adherence to statutory cash handling requirements.
Under contracts negotiated to market conditions and prices with the Ministry of Finance, the BNB collects, processes, keeps and submits information on budget entities’ domestic bank accounts to the Ministry of Finance and acts as government debt agent. The IOBFR budget and fiscal reserve information system despatched

Bul
gar
ian
Nat
iona
l Ban
k. A
nnua
l Rep
ort •
201
4
14
989 statistical reporting forms, including 313 on the fiscal reserve, up 8 per cent on 2013. There were 30 government bond auctions via the GSAS system. The ESROT Elec tronic System for Registering and Servicing Government Securities Trading reg-istered BGN 43,904.2 million worth of transactions, up 15 per cent on 2013.
The EU agreed important elements of banking union: the Single Supervisory Mecha-nism (SSM) and the operational framework for European Stability Mechanism direct bank recapitalisation. Legislation on credit institution and investment firm recovery and resolution, deposit guarantee schemes, and residential property credit enhanced financial security and transparency.
On ESCB, EC, EU Council, European Systemic Risk Board, European Banking Author-ity, and Council for European Affairs committees and working groups the BNB advo-cated Bulgarian economics and finance standpoints. Seeing macroeconomic and financial stability as of primary import across the EU, it supports in general EU and euro area regulatory and institutional amendments.
The BNB continued cooperating with Western Balkan central banks preparing for EU accession. The Central Bank Governors’ Club of Central Asia, Black Sea Region and Balkan Countries helps step up regional cooperation. In June the Bank hosted its 31st meeting which changed the Statute and welcomed new members Slovenia and Croatia.

15
Econom
ic Develop
ment in 20141. The External Environment
The global economy growth rate in 2014 was 3.3 per cent, as in 2013.1 Develop-ments continued to diverge by region. Real growth picked up in the USA, the euro area, and the developed world. Developing and emerging countries slowed, mainly due to geopolitical tension in Ukraine and Russia and slowing growth in the largest economies like China and Brazil.
Global industrial output grew significa ntly 2.9 per cent on 2.0 in 2013,2 developed economies contributing most. World goods and services trade growth slowed to 3.1 per cent from 3.4 in 2013 through sluggish rises in developing and emerging economies.3
Major Macroeconomic Indicators (per cent)
Average annual real GDP growth
Inflation(end of year)
Unemployment rate (average annual)
2012 2013 2014 2012 2013 2014 2012 2013 2014
EU -0.5 0.0 1.3 2.3 1.0 -0.1 10.5 10.9 10.2
Euro area -0.8 -0.5 0.9 2.2 0.8 -0.2 11.3 12.0 11.6
New EU Member States 0.8 1.4 2.8 2.9 0.7 -0.3 9.0 9.8 8.5
EU-3 0.4 1.4 2.5 2.5 1.7 0.5 7.9 7.6 6.4
United States 2.3 2.2 2.4 1.7 1.5 0.8 8.1 7.4 6.2
Japan 1.8 1.6 0.0 -0.1 1.6 2.4 4.4 4.0 3.6
China 7.7 7.7 7.3 2.5 2.5 1.5 4.1 4.1 4.1
Notes: For 2013 and 2014 the EU includes Croatia since 1 July 2013. The new ЕU Member States are those joining since 2004 less those now in the euro area. The EU-3 are the United Kingdom, Sweden, and Denmark. Indicators for new ЕU Member States outside the euro area and the ЕU-3 are calculated by weighing time series by country weights in group GDP for growth, in group labour force for unemployment, and the weights of the EU in HICP, calculated by Eurostat for inflation.
Sources: Eurostat, Bureau of Labor Statistics, Bureau of Economic Analysis, Statistics Bureau of Japan, the National Bu-reau of Statistics of China, BNB computations.
Euro area real GDP rose 0.9 per cent on an annual basis after two years’ declines. Private consumption contributed most, investment into fixed capital helping. Ireland (4.8 per cent), Malta (3.5 per cent), Slovenia (2.6 per cent), Slovakia (2.4 per cent), and Latvia (2.4 per cent) grew most.4 Cyprus (-2.3 per cent), Italy (-0.4 per cent), and Finland (-0.1 per cent) declined. Euro area growth cut unemployment to 11.6 per cent from 12.0 in 2013. Portugal, Ireland, and Spain improved most to 14.1 per cent from 16.5 in 2013, 11.3 from 13.1, and 24.5 from 26.1. Greece led unemployment at 26.5 per cent, Spain and Cyprus following at 24.5 and 16.2 per cent.
Real US growth accelerated on 2013, private consumption helping most followed by fixed capital investment. Oil price falls from the second half of 2014 further boosted private consumption. Net exports curbed growth. Unemployment continued falling to 6.2 per cent from 7.4 in 2013.
Global inflation dropped to 1.7 per cent from 2.6 in 2013.5 This reflected cheaper major commodities and raw materials. Brent crude fell 9.1 per cent in US dollars
1 IMF data: World Economic Outlook Update, January 2015. 2 CPB Netherlands Bureau for Economic Policy Analysis data as of 8 April 2015.3 IMF data: World Economic Outlook Update, January 2015. 4 There was no 2014 data on real GDP for Luxembourg.5 Based on World Bank data, Global Economic Monitor Database. The World Bank shows CPI changes in country
groups as weighted averages of CPI changes in group countries. Real GDP based on purchasing power parity is used to set country weights. Groups include only World Bank member countries.
I. Economic Development in 2014

Bul
gar
ian
Nat
iona
l Ban
k. A
nnua
l Rep
ort •
201
4
16
and 9.5 per cent in euro on 2013. In the second half of 2014 world oil prices fell greatly, Brent crude dollar prices falling almost 45 per cent on 2013. Weak demand and increased supply – mainly US shale oil development and OPEC moves to retain markets instead of prices – drove oil prices. Major world commodity prices also fell,6 food and cereals by 1.4 per cent in US dollars and 22.8 per cent on average, and metals by 12.1 per cent.
Developed world inflation moderated to 0.5 per cent from 1.3 in 2013, remaining unchanged in developing economies at 3.7 per cent.7 Euro area inflation8 was -0.2 per cent on an annual basis from 0.8 in December 2013, core inflation (excluding food, energy, alcohol, and tobacco) static at 0.7 per cent. Austria and Finland led euro area inflation at 0.8 and 0.6 per cent at the year’s end, Greece and Spain trailing at -2.5 and -1.1 per cent. US inflation9 moderated to 0.8 per cent from 1.5 in 2013, core inflation (excluding food and energy) falling from 1.7 to 1.6 per cent by end-2014. Measured by the private consumption expenditure deflator, fourth quarter inflation rose minutely to 1.1 per cent from 1.0 in the fourth quarter of 2013.
Divergent euro area and US trends prompted monetary policy differences between the ECB and the Federal Reserve System. Amid weak economic activity and falling inflation the ECB continued cutting interest rates in June and September and adopted non-standard measures like targeted longer-term refinancing operations and asset-backed bond purchases.10
The Federal Reserve System kept federal funds reference interest rate unchanged and continued reinvesting earnings from maturing US government bonds it held into new US government bonds and earnings from government debt and mortgage backed securities into new mortgage bonds. In September the FOMC updated the Federal Reserve strategy to normalise monetary policy. In October the FOMC shelved the 2012 third quantitative easing round or QE3 for buying additional US sovereign and mortgage backed bonds monthly. Divergent euro area and US economic and policy trends depressed the euro on the US dollar in the second half of 2014.
Federal Reserve System and ECB Interest Rates(per cent)
Sources: ECB, Federal Reserve System.
6 Based on ECB data. 7 Based on World Bank data, Global Economic Monitor Database.8 Measured by the Harmonised Index of Consumer Prices (HICP).9 Measured by the Consumer Price Index (CPI), seasonally adjusted data.10 For details on ECB and Federal Reserve monetary policy see Chapter II.

17
Econom
ic Develop
ment in 2014
Growth expectations boosted US stock market indices. European indices fluctuated amid geopolitical tension in Russia and Ukraine, relatively low euro area growth, and falling inflation and inflationary expectations. June and September ECB interest rate cuts and additional non-standard monetary measures boosted indices temporarily. In December the US Dow Jones and NASDAQ rose 10.3 and 16.1 per cent on a year earlier, the European EURO STOXX 50 rising slightly 4.8 and DJ STOXX EU Enlarged ТМ falling 3.8 per cent.11
Main Stock Exchange Indices in 2014
Note: US dollars, December 2013 = 100.
2. The Bulgarian Economy
Bulgarian economic activity rose, real GDP growth rate accelerating to 1.7 per cent from 1.1 in 2013.12 Uncertainty in Ukraine and Russia, domestic political instability, and a banking liquidity crisis in late June had a limited effect on economic activity. Domestic demand rose 2.5 percentage points, contributing most to growth through 2.4 per cent final consumption and 2.8 per cent gross fixed capital formation rises. Net exports detracted -1.1 percentage points from real GDP growth. Goods and ser-vices imports outstripped exports through greater domestic demand and transient hindrances to exports like renovated and new oil production capacities and lower animal and plant product exports.
11 For further information on government bond markets, see Chapter II.12 Data to the European system of national and regional accounts (ESA 2010).

Bul
gar
ian
Nat
iona
l Ban
k. A
nnua
l Rep
ort •
201
4
18
Real GDP Growth Rate and Contribution by Component of Final Consumption(on the corresponding period of 2013, non-seasonally adjusted data)
2013 2014
Change (per cent)
Contribution, percentage points
Change (per cent)
Contribution, percentage points
GDP 1.1 1.1 1.7 1.7
Final consumption -1.3 -1.1 2.4 1.9
Household consumption -2.3 -1.5 2.0 1.2
NPISH consumption -0.4 0.0 3.3 0.0
Final consumption expenditure of the general government sector 2.0 0.1 5.8 0.5
Collective consumption 3.6 0.3 1.9 0.2
Gross fixed capital formation -0.1 0.0 2.8 0.6
Physical changes in inventories - -0.5 - 0.3
Exports (goods and services), net - 2.6 - -1.1
Exports (goods and services) 9.2 5.9 2.2 1.5
Imports (goods and services) 4.9 -3.3 3.8 -2.6
Sources: NSI, BNB.
Real GDP Growth Rate and Contribution by Component of Final Consumption(per cent, percentage points on corresponding
quarter of prior year, non-seasonally adjusted data)
Sources: NSI, BNB.
Improved labour market conditions, reflecting lower overall unemployment and slight employment recoveries in some sectors, helped household consumption to rise 2.0 per cent after a 2.3 per cent drop in 2013. Government consumption also grew 3.8 per cent in real terms from 2.8 in 2013 through higher pay and public sector health insurance contributions.
Real fixed capital investment rose 2.8 per cent in 2014, public investment contributing most. Business continued investing cautiously. Preliminary NSI data show nominal expenditure on acquiring fixed asset falling 3.9 per cent from a 5.2 per cent fall in 2013. Investment declines hit almost all sectors, led by real estate operations, trade, car and motorcycle repairs, transport, storage and mail services, and hotels and restaurants. Public service fixed asset and manufacturing spend rose greatly.

19
Econom
ic Develop
ment in 2014
Fixed Asset Acquisition Spending by Economic Activity
Note: Preliminary data for 2014.
Sources: NSI, BNB.
Gross value added grew 1.6 per cent from 1.2 in 2013. Economic activity strengthened across the economy, as last year. Services (0.8 percentage points) and manufacturing contributed most. Among services subsectors, professional activities and scientific research, administrative and ancillary activities, and creation and dissemination of information and author products; telecommunications, grew most. Manufacturing value added rose 2.1 per cent in real terms, construction rising 1.4 per cent on an annual basis. The two contributed 0.6 percentage points to economic growth. Agri-culture, forestry, and fisheries grew 5.2 per cent from 3.3, contributing 0.3 percentage points to gross value added change in the economy.
Gross Value Added Change in Real Terms and Contribution by Sector(per cent, percentage points on corresponding
quarter prior year, non seasonally adjusted data)
Sources: NSI, BNB.

Bul
gar
ian
Nat
iona
l Ban
k. A
nnua
l Rep
ort •
201
4
20
Gross Value Added Change in Real Terms and Contribution by Sector
2013 2014
Change (per cent)
Contribution, percentage points
Change (per cent)
Contribution, percentage points
Gross value added 1.2 1.2 1.6 1.6
Agriculture and forestry 3.3 0.2 5.2 0.3
Industry* -0.1 0.0 2.0 0.6
Services 1.6 1.0 1.2 0.8
* Manufacturing and construction.
Sources: NSI, BNB
In the first half of 2014 the overall labour market improved slightly. Employment grew 0.4 per cent after falling by the same amount in 2013. It rose in sectors with rising added value. Agriculture forestry and fisheries, trade, car and motorcycle repairs, transport, storage and mail services, and hotels and restaurants, contributed most. Professional activities and scientific research, administrative and ancillary activities detracted most.
The NSI Labour Force Survey showed average unemployment dropping from 13.0 to 11.4 per cent. Employment Agency registrations put unemployment close to last year at 11.2 from 11.3 per cent. The economic activity rate of 15 to 64 year olds rose to 69.0 from 68.4 per cent on average in 2013. The number of discouraged persons continued falling from 210,000 on average in 2013 to 192,000 in 2014. The Survey showed long-term unemployment (over 12 months) declining more slowly to cover 60.6 per cent of jobless people (57.4 per cent in the last year).
Unit Labour Costs(moving average, 2010 = 100)
Sources: NSI, BNB
Nominal labour cost dynamics reflected business adjustment to falling consumer and producer prices. Overall nominal employee compensation rises moderated signifi-cantly to 1.3 from 7.6 per cent in 2013. Amid relatively stable employment, sectoral pay dynamics reflected mainly slower growth of employee compensation. As employ-ment grew, individual pay growth slowed from 8.8 per cent in 2013 to 1.5 in 2014, or 3.2 per cent from 8.5 in real terms.13 National accounts show lower individual pay in most services subsectors despite higher labour productivity in some. Compensa-tion per employee fell most in creation and dissemination of information and author products, real estate operations, and culture, sport and entertainment, other activity,
13 HICP deflated.

21
Econom
ic Develop
ment in 2014
activities of households as employers, non-identified activities of households produc-ing goods and services for own use; activities of extraterritorial organisations and bodies. Individual pay grew faster in industrial subsectors reporting higher labour productivity.14 Overall productivity grew 1.3 per cent from 1.5 in 2013, manufacturing (excluding construction) leading.
Matching pay and productivity growth meant nominal unit labour costs rose just 0.2 per cent from 7.2 in 2013. Manufacturing, professional activities and scientific research, and administrative and ancillary activities led, while most services sub-sectors, particularly creation and dissemination of information and author products, telecommunications and real estate operations, fell. Overall real unit labour costs fell 0.5 per cent. In export-oriented industry real pay growth fell to 1.9 per cent from 7.7 in 2013.
Significantly lower individual pay growth boosted overall gross operating surplus 0.2 per cent after a 3.5 per cent fall in 2013. Manufacturing (excluding construction) led, alongside trade, transport, hotels and restaurants, and financial and insurance activities. Agriculture forestry and fisheries, and to an extent construction, profes-sional activities and scientific research and public services, detracted most.
The GDP deflator rose 0.6 per cent on an annual basis. By component of final use, goods and service import and export, and household final consumption and fixed capital investment deflators were negative, government consumption remaining the sole positive deflator.
Deflationary factors depressed final consumer prices -2.0 per cent as of December from -0.9 in 2013, especially from mid-year as world oil prices fell.15 External factors like cheaper fuel, food, and major commodities drove this, energy (excluding regu-lated prices) contributing most. A rising euro in the first half year added to the growing world deflationary impact. The depreciation of the euro in the second half-year was a prerequisite for limiting deflation in some groups of goods, such as manufactured goods and food. Internal factors related mostly to a regulatory price decreases in particular services groups and slow recovery of household consumption and added to the increase in the negative contribution of core inflation in 2014. In 2014 the year-on-year decline in the administrative prices started in mid-2013 was reversed due to the price rises in electricity for households in July and October 2014. The group of goods and services with administratively controlled prices had a positive contribu-tion to overall annual inflation at the end of the year. The food group reported a low inflation rate consistent with the negative import deflators of food16 and lower farming costs in Bulgaria. This contributed to the decrease in producer food prices and was transmitted to the end prices of food products.
In 2014 core inflation (excluding the prices of food and energy products, goods and services with administratively controlled prices and tobacco prices) was negative and followed a downward trend accounting for -1.6 per cent by the end of the year (-0.7 per cent at the end of 2013). Comparatively high negative contribution of core inflation to overall inflation throughout the year was due to the deflation in the services group since early 2014 and to further depreciation of non-food goods. Factors hav-ing one-off effect on prices of telecommunication and medical services contributed most strongly to the reported deflation.17 Inflation of catering was positive tending to slightly moderate in the context of food depreciation. Prices in other sub-groups remained unchanged or slightly decreased as a result of slow household consumption recovery following the reported fall in 2013 and reduced corporate expenditure on
14 Real GDP measures labour productivity in the overall economy. Sectoral real terms added value measures sectoral productivity.
15 This analysis employs HICP data.16 Data on import deflators under the Standard International Trade Classification (SITC) as of the third quarter of 2014. 17 As of July 2015 the cut in the price caps for data downloads in all EU Member States became effective. From the
beginning of 2014 fees for visits to GPs, specialists and dentists were decreased by 28.6 per cent.

Bul
gar
ian
Nat
iona
l Ban
k. A
nnua
l Rep
ort •
201
4
22
salaries and raw materials. The downward dynamics of prices of non-foods (excluding fuels) observed in the last five years continued in 2014. Deflation in this group was driven mainly by the depreciation of automobiles and other durables. Negative import deflators18 and contracted consumer demand were the factors having a potential negative effect on the inflation of these groups of goods. Prices of non-durable goods remained at levels close to those in 2013.
HICP Inflation Accumulated since the Year’s Start and Contributions of Major Goods and Services Groups to It
2013 2014
Inflation (per cent) -0.9 -2.0
Rate of inflation by group (per cent)
Contribution, percentage points
Rate of inflation by group (per cent)
Contribution, percentage points
Food -0.3 -0.09 -0.7 -0.19
Processed food 0.1 0.01 -0.7 -0.12
Unprocessed food -1.1 -0.10 -0.8 -0.07
Services 0.4 0.09 -1.2 -0.30
Catering services 1.9 0.10 0.9 0.05
Transportation services 0.3 0.01 2.4 0.09
Telecommunication services -0.7 -0.03 -7.7 -0.37
Other services 0.1 0.01 -0.6 -0.07
Energy products 2.2 0.20 -13.9 -1.28
Transport fuels 2.8 0.24 -14.8 -1.27
Industrial goods -2.1 -0.39 -2.2 -0.43
Administratively controlled prices -3.9 -0.71 1.2 0.20
Tobacco products 0.9 0.03 1.0 0.04
Note: This structure corresponds to the Eurostat classification; tobacco products and goods and services with administratively controlled prices are presented separately. The index of goods and services with administratively controlled prices is calculated through the elementary aggregates level in the consumer basket.
Sources: NSI, BNB
Annual Inflation and Contributions by Major Goods and Services(per cent, percentage points)
Sources: NSI, BNB
In 2014 the overall current and capital account balance reported a surplus to the amount of EUR 1004.4 million compared to EUR 878.2 million in 2013. Lower deficit on the income account and higher capital account surplus had a major positive effect on the overall balance due to increased receipts to the government from EU funds. The increase in the surplus on the overall current and capital account balance was
18 See footnote 17.

23
Econom
ic Develop
ment in 2014
limited by the lower surplus on net current transfers and higher deficit on the total balance compared with 2013.
The increased trade deficit reflected the contracted nominal exports of Bulgarian goods against the background of positive nominal export growth. The decrease in international prices of major commodity groups continued to dampen the change in nominal exports and imports. Renovated and new oil production capacities and reduced volumes of animal and plant product exports were additional internal factors affecting adversely export dynamics, while increased internal demand contributed to the positive import dynamics.
The services balance was positive in 2014 posting an improvement from the previ-ous year, reflecting mostly higher receipts on the other services and transport sub-items, while inflows under the travel sub-item exhibited comparatively lower growth. Concurrently, based on preliminary data the income account deficit contracted due mostly to lower payments in the form of dividends and distributed profit to foreign investors in Bulgaria and, to lower extent, to the increased flows on the item’s credit side compared with 2013. Current transfers exhibited a decline in the surplus in 2014, with lower receipts to the general government (including the receipts from EU funds) being the main factor behind this.
In 2014 the rate of nominal export growth went down by 0.7 per cent on the prior year, lower international commodity and metal prices contributing significantly to this effect. The mineral products and fuels group, and animal and plant products, food, drinks and tobacco group had the strongest negative contributions to this dynamics. The decline in exports of base metals and related products had a weaker negative effect. Nominal imports (cif) reported annual growth of 1.4 per cent. By end use, imports of investment goods had the largest positive contribution followed by consumer goods. The energy resources and raw materials and supplies groups, affected by decreasing international prices, had a dampening effect on imports of goods.
Based on preliminary balance of payments data for 2014 the inflow of foreign direct investment in Bulgaria amounted to EUR 1289.1 million (3.1 per cent of GDP) against EUR 1446.3 million (3.5 per cent of GDP) in 2013. The sectoral composi-tion data shows that real estate operations, lessors’ activities and business services (EUR 501.0 million), financial intermediation (EUR 173.2 million) and production and distribution of electricity and heating, gaseous fuels and water (EUR 113.1 million) reported the strongest inflow of foreign direct investment.
The balance of payments financial account ended 2014 in a EUR 2120.1 million sur-plus against a negative balance of EUR 962.2 million in 2013. Financial account flow dynamics throughout the year was impacted mainly by the inflow of foreign direct investment in Bulgaria, the ten-year bonds issue sold in international capital markets in the middle of the year and the bridge loan19 undertaken by the general government sector in December.
Transactions intended to increase banks’ foreign assets (total portfolio and other investment) and to decrease banks’ foreign liabilities (total portfolio and other invest-ment) affected financial account flows in 2014, although this trend was weaker pro-nounced compared with 2013.
In 2014 gross external debt increased by EUR 2829.5 million compared with 2013 and amounted to EUR 39.8 billion (94.7 per cent of GDP). The increased debt of the general government (by EUR 2614.5 million) had the major contribution to growth. Attracted foreign direct investment (intercompany loans) had a weaker effect on gross external debt growth. Over the year public and publicly guaranteed debt rose by EUR 2492.7 million to EUR 6.55 billion and non-bank sector’s intercompany
19 Lenders are: HSBC Bank PLC., Société Générale, Citibank NA (London) and UniCredit Bank AG. UniCredit Bank AG (London) is an agent on the loan.

Bul
gar
ian
Nat
iona
l Ban
k. A
nnua
l Rep
ort •
201
4
24
loans reached EUR 16.2 billion, up EUR 734.2 million on end-2013. The increase in intercompany loans was mainly due to funds attracted from transport, storage and communications, and real estate operations, lessors’ activities and business services sectors.20 On the other hand, manufacturing reported the largest decline. Gross exter-nal debt in other sectors posted an increase21 mostly as a result of higher external liabilities of manufacturing. In 2014 principal obligations of EUR 5158.2 million were serviced and loans and deposits received amounted to EUR 7971.4 million.
As a result of all external current, capital, and financial transactions, between January and December 2014 BNB international reserves increased by EUR 1909.5 million according to the balance of payments data (valuation adjustments and price revalua-tions excluded). Taking into account the change in international reserves on the BNB Issue Department balance sheet, including valuation adjustments and price revalua-tions, the increase was EUR 2108.3 million.
Monetary Aggregates(annual change)
(per cent)
Source: BNB.
The Amount of Main M3 Components (annual change)
(BGN million)
Source: BNB.
20 Excluding trade and bond loan liabilities from the sectoral breakdown.21 Excluding trade and bond loan liabilities.

25
Econom
ic Develop
ment in 2014
In 2014 monetary and credit aggregate dynamics were affected by divergent fac-tors. The retained high household savings rate continued to boost attracted funds in the banking system. The liquidity pressure on the banking system had a temporary effect on monetary aggregate dynamics in mid-June22: part of time deposits was with-drawn from the banking system, boosting currency in circulation, and another part was transformed into overnight deposits. This was the reason behind the downward dynamics of quasi-money and the accelerating growth rate of overnight deposits and money outside MFIs at the end of the first half of 2014. As a result of initiated measures depositors’ confidence restored quickly and deposits began to return into the banking system yet in July.
Deposits of the Non-government Sector and Contributions of Individual Sectors (BGN million)
Source: BNB.
Household Deposits and Contribution of Individual Types of Deposits(BGN million)
Source: BNB.
Following the revocation of the KTB banking license and its exclusion from the scope of monetary statistics23 the main monetary aggregates went down in November. The
22 For further information on the banking system state, see Chapter VI of the Report. See Economic Review, 2, 3, 4/2014.
23 Reflecting revocation of the KTB banking license and the ECB requirements in the statistics area, the KTB has been excluded as a reporting agent from the Other monetary financial institutions sector (S.122 according to ESA’95) and reclassified into Other financial intermediaries, except insurance corporations and pension funds (S.123 according to ESA’95) since November 2014. See Economic Review, 4/2014.

Bul
gar
ian
Nat
iona
l Ban
k. A
nnua
l Rep
ort •
201
4
26
payout of guaranteed deposits at KTB started in December and economic agents’ preference to leave them in the banking system prompted an increase in monetary and deposit indicators to levels close to those prior November, and by the end of 2014 to a 1.1 per cent positive increase of broad money on an annual basis.
Between January and June 2014 annual growth of claims on the non-government sec-tor tended to accelerate to reach 2.4 per cent as of mid-year. This dynamics reflected mainly the favourable trend in lending to non-financial corporations, while loans to households exhibited low positive growth following the slight fall at the end of 2013. Between July and October the acceleration stopped but the positive growth rate was sustained. The exclusion of KTB as a reporting agent from the scope of monetary statistics since November 2014 prompted a decline in claims on non-financial corpo-rations and correspondingly a significant decrease (on an annual basis) in claims on the non-government sector until year-end.
Claims on Non-government Sector (annual change)
(per cent)
Source: BNB.
Amount of Claims on the Non-financial Corporations and Households (annual change)
(BGN million) (BGN million)
Source: BNB

27
Econom
ic Develop
ment in 2014
The BNB quarterly lending survey data show that first quarter’s fall in demand for loans was followed by a certain increase in the following three quarters which was more strongly pronounced in households than in corporations. Banks explained the increased demand for corporate loans by both the enhanced financing requirements for working capital and inventories, and for investment purposes. In the first three quarters of 2014 banks eased their credit standards primarily on loans to households and left them unchanged for corporate loans. In the fourth quarter banks tightened their standards for extending short and long-term loans to corporations. As regards household loans, credit policy tightening referred to consumer loans, while credit standards on loans for house purchase remained unchanged. Major factors behind the eased lending policy in 2014 were associated with the competition of other banks and lower cost of attracted funds. Concurrently, banks took into account that tighten-ing of credit standards affected mainly the macroeconomic environment, credit risk and collateral risk.
Banks continued to rely mostly on funds attracted from residents for financing their lending activity. At the end of 2014 household deposits increased by BGN 1563 million on the end of the prior year, and total growth of deposits from residents amounted to BGN 1025 million due to the reported decrease in deposits of other MFI, non-financial and financial corporations. Growth of attracted funds in the banking system contrib-uted to the increase in the banks’ liquid assets ratio to 30.1 per cent in December 2014 against 27.0 per cent at the end of 2013.
In 2014 banks used a significant portion of their liquidity to increase foreign assets, to invest in securities issued by the Bulgarian government and to continue repay their liabilities to foreign institutions (mostly to parent banks). As a result, net foreign assets of banks reached BGN 4.2 billion at the end of the year posting growth of BGN 2.7 billion on end-2013. Banks deposited a portion of their free liquid funds with the BNB in the form of excess reserves. A stronger increase in excess reserves was reported in the second half of the year due to external factors and particularly to the ECB monetary policy.24
Banks managed lev liquidity mainly through foreign currency trade with the BNB. Thus, the main function of the currency board is performed: buying and selling on demand national currency against euro at the fixed exchange rate under the Law on the Bulgarian National Bank.25 Total foreign currency market turnover in 2014 came to EUR 357.6 billion26, down 34.4 per cent on 2013. The decline was reported in trans-actions between the BNB and banks, the largest segment of the foreign exchange market, while interbank trading and the trade with final customers posted an increase on the prior year.
Changes occurred in the interbank currency trading structure (excluding the BNB) in 2014: the share of EUR-denominated transactions declined, while the share of USD-denominated transactions picked up. Correspondingly, 83 per cent of concluded interbank market transactions (excluding the BNB) was denominated in euro and 16.7 per cent in US dollars. In final customer trading, this structure remained broadly unchanged, with euro operations comprising 87 per cent of all foreign currency transactions.
In 2014 the ample banking system liquidity continued to affect interbank money mar-ket trade. As a result, the downward yield curve trend was sustained, especially in the long-term maturities. The average interbank deposit and repo interest rate rose by 2 basis points to 0.05 per cent compared with the prior year. LEONIA values moved within a narrow interval and by the end of the year reached 0.01 per cent. In 2014
24 For further information on the dynamics of banks' excess reserves, see Chapter IV of the Report.25 See Chapter II.26 The turnover comprises transactions by banks and the BNB in foreign currency against levs with a spot value
date of up to two business days and includes the double volume of trade between the BNB and banks, as well as interbank trading.

Bul
gar
ian
Nat
iona
l Ban
k. A
nnua
l Rep
ort •
201
4
28
the ECB cut in two steps interest rates on its main refinancing operations (in June and September) by 10 basis points each, affecting euro area’s short-term interbank market rates. Following the September cut the EONIA reference overnight rates even turned negative. The stronger decline of euro area overnight rates compared with LEONIA in the second half of 2014 reversed the trend of negative spreads observed since 2010 and as of August the spread between the LEONIA and EONIA became slightly positive, reaching 4 basis points at the end of the year.
Interbank Money Market Interest Rate(per cent)
Sources: BNB, ECB.
Interbank Money Market Yield Curve(per cent)
Note: Average SOFIBOR/SOFIBID Index.
Source: BNB
Ample banking system liquidity and low money market rates in Bulgaria and in the euro area, limiting market participants’ alternatives of selling their liquid funds, were the major reason for the subdued activity of the domestic interbank market. In 2014 the total volume of interbank money market transactions in Bulgaria came to BGN 47.1 billion: down 13.9 per cent on 2013. Deposits comprised 64.3 per cent of the turnover and repo operations in government securities 35.7 per cent. Overnight transactions dominated the structure of deposit operations at 87 per cent.

29
Econom
ic Develop
ment in 2014
In 2014 the deficit on the consolidated fiscal programme amounted to BGN 3072.9 million (3.7 per cent of GDP), up BGN 1632.0 million (1.9 per cent of GDP in 2014) compared with 2013. The worsened budget position reflected significantly weaker tax revenue performance as compared with projections in the 2014 State Budget Law of the Republic of Bulgaria, which was not offset by reduced government expenditure. Due to deepening problems with the implementation of the budget throughout the year the State Budget Law was amended twice27, with the last change in November revising the budget balance on the consolidated fiscal programme from 1.8 per cent of GDP to 3.7 per cent of GDP.
In 2014 total government revenue and grants reached BGN 29,409 million, tax rev-enue and grants contributing most (2.3 and 0.9 percentage points correspondingly) to their annual growth of 1.5 per cent. Revenues from social security and health insur-ance contributions and direct taxes, growth of which was partly due to the increase in minimum insurance thresholds by 2.6 per cent per cent on average in 2014, the rise of minimum wage (from BGN 310 to BGN 340) and the change in taxation of income from gambling as of 1 January 2014. Concurrently, deflation in 2014 had a negative effect on VAT receipts exhibiting a 1.4 per cent fall on 2013. Non-tax revenue reported a substantial decline on an annual basis (-12.4 per cent) as a result of the base effect of higher revenue from dividends and one-off arbitration award in favour of the government received in 2013.
In 2014 total government expenditure, including the EU budget contribution, grew 6.8 per cent to BGN 32,482 million. Social expenditure (3.2 percentage points) and capital expenses (2.7 percentage points) contributed most substantially to annual expenditure growth. Social payments dynamics was a result of increased pensions by 9.3 per cent in April 2013 and the July 2014 indexation by 2.7 per cent, on the one hand, and higher social security contributions, on the other hand. Capital expendi-ture28 picked up by 20.2 per cent on the prior year, reflecting mostly the accelerated utilisation of funds under EU programmes, with their implementation accounting for 97.4 per cent of the projections in the 2014 revised budgetary framework. Interest expenditure posted a decline by 15.8 per cent on 2013 and had a negative contribu-tion of 0.4 percentage points to total expenditure growth at the end of the year.
Budget deficit and government debt payments worth BGN 6842 million29 were financed by gross government securities issue on the domestic market to the amount of BGN 5445 million, the ten-year Eurobonds issued in June on international capital markets at a total nominal value of BGN 2920 million and the external bridge loan disbursed in December worth BGN 2934 million. A portion of the funds received in 2014 were used for a loan to the Deposit Insurance Fund and for the redemption of USD-denominated global bonds maturing on 15 January 2015.
In line with the Law on Public Finance entered into force in early 2014, the fiscal reserve scope was changed to include both funds on deposits and total receiva-bles from EU funds over certified expenses, advance payments, etc. By end of the year the total amount of fiscal reserves amounted to BGN 9170.4 million, of which BGN 8117.0 million on deposits, posting an increase by BGN 3436.4 million on the end of 2013.
In 2014 the Ministry of Finance issuing policy on the domestic market was focused on offering government securities in all segments of the maturity curve. Demand for Bulgarian government securities in the primary market remained high, bid-to-cover ratio reaching 1.99 (against 2.21 in 2013) despite the double increase of newly issued government debt instruments on 2013. The average annual yield attained in the pri-mary market fell on 2013 in all maturity segments except for one-year government
27 Amendments published in the Darjaven Vestnik, issue 67 of 12 August 2014 and issue 98 of 28 November 2014.28 Including growth in the state reserve.29 Based on data of the Budget Performance Monthly Bulletin of the Ministry of Finance.

Bul
gar
ian
Nat
iona
l Ban
k. A
nnua
l Rep
ort •
201
4
30
securities, whose yield rose slightly in 2014. Concurrently, in December Bulgaria’s long-term interest rate30 reached its lowest value: 2.96 per cent.31
USD-denominated global bonds maturing in 2015 were quoted at 100.3 (correspond-ing to a 0.2 per cent yield) at the end of the year.32. By end-December Bulgarian Eurobonds maturing in 2017 were traded at a premium and price of 107.5 (corre-sponding to an annual yield of 1.2 per cent) vis-à-vis an issue price of 99.2. At the end of the year Bulgarian Eurobonds issued in June 2014 and maturing in 2024 were traded at a premium and price of 100.4 (corresponding to an annual yield of 2.9 per cent) vis-à-vis an issue price of 99.1. As in 2013, the price of USD-denominated ZUNK bonds hovered around their nominal value.
Bulgarian Stock Exchange Indices in 2014(December 2012 = 100)
Sources: BNB, Bulgarian Stock Exchange.
The leading SOFIX and BGBX40 indices on the Bulgarian Stock Exchange showed upward dynamics in the first four months of 2014 which was followed by a period of decline and stabilisation. By the end of the year values of the two indices were higher than in the previous year: SOFIX rose by 5.8 per cent and BGBX40 by 4.2 per cent.
In 2014 the volume of secondary market shares fell by BGN 54.6 per cent to BGN 583.3 million, while the volume of bourse trade in bonds decreased by 29.5 per cent to BGN 148.9 million. Over-the-counter equity transactions accounted for BGN 601.7 million33 and over-the-counter bond transactions amounted to BGN 35.6 million. By the end of 2014 market capitalisation of the Bulgarian Stock Exchange, Sofia, was BGN 9.8 billion or 11.9 per cent of GDP, from 12.4 per cent of GDP at the end of 2013.
30 The long-term interest rate for assessing the degree of convergence is based on the secondary market yield to maturity of a long-term security (benchmark) issued by the Ministry of Finance (the central government sector) and denominated in national currency.
31 For more information on the government securities primary and secondary markets, see Chapter VIII.32 Reuters data.33 Major exchange-traded transactions involved Petrol AD (over BGN 140 million), Agro Finance REIT, BULSTRAD
Vienna Insurance Group – Sofia, Varna-Plod AD, Speedy AD, Sopharma Trading AD, Nov Vek Holding AD, Evrohold Bulgaria AD, etc. Major share transactions on the OTC market included Velgraf Asset Management AD, Galata Investment Company AD, Delta Credit REIT, Chimsnab Bulgaria AD, Synthetika AD, and Rodna Zemya Holding AD.

31
Gross International Foreig
n Exchang
e Reserves
II. Gross International Foreign Exchange Reserves
The BNB manages its gross international reserves to the provisions of the Law on the Bulgarian National Bank, investment constraints, business procedures and meth-odologies, and international financial market opportunities. The reserves comprise the Issue Department balance sheet assets, and have to provide complete cover for monetary liabilities at the lev euro fixed rate set by the LBNB.34 The excess of gross international reserves over monetary liabilities forms the Banking Department deposit item or Issue Department’s balance sheet net value.35
Gross International Reserves and Banking Department Deposit in 2014(EUR million) (EUR million)
Note: The chart shows daily movements of the Issue Department balance sheet and the Banking Department Deposit in the Issue Department balance sheet.
Source: BNB.
1. The Amount and Structure of Gross International ReservesIn 2014 the market value of gross international reserves rose EUR 2108 million to EUR 16,534 million.36 As a share of BNB assets, the 15 per cent growth is due to rel-atively high income from assets, reflecting mainly lower German government bond yields and sovereign spreads, higher gold prices in euro, and high net positive exter-nal cash flows on the Issue Department balance sheet. In 2014 external cash flows contributed EUR 2050 million net to the market value of international reserves.
34 The LBNB Article 28, paragraph 2 defines the BNB monetary obligations as all circulating banknotes and coins issued by the BNB, and all balances of other persons’ BNB accounts, except the IMF. LBNB Article 28, paragraph defines what assets may comprise gross international reserves: monetary gold; Special Drawing Rights; banknotes and coins in freely convertible foreign currency; funds in freely convertible foreign currency held by the BNB on accounts with foreign central banks or other financial institutions or international financial organisations with one of the two highest ratings by two internationally recognised credit rating agencies; securities issued by foreign countries, central banks, other foreign financial institutions, or international financial organisations assigned one of the two highest ratings by two internationally recognised credit rating agencies; the balance on accounts receivable and payable on BNB forward or repo agreements with (or guaranteed by) foreign central banks, public international financial organisations or other foreign financial institutions with one of the two highest ratings from two internationally recognised credit agencies; and BNB futures and options which bind non-residents and which are payable in freely convertible foreign currency. The LBNB stipulates that these assets be estimated at market value.
35 According to Article 28, paragraph 1 of the Law on the BNB, ‘the aggregate amount of monetary liabilities of the BNB shall not exceed the lev equivalent of gross international reserves,’ with the lev equivalent determined on the basis of the fixed exchange rate.
36 Banks’ account balances in the TARGET2-BNB national system component worth EUR 14 million as of the end of December 2014, and the two tranches of SDR 611 million received by the BNB in August and September 2009 upon general SDR allocation by the IMF are excluded from this analysis; see BNB Annual Report, 2009, p. 25.

Bul
gar
ian
Nat
iona
l Ban
k. A
nnua
l Rep
ort •
201
4
32
External Cash Flows in Foreign Currency (EUR million))
2013 2014
I. Purchases and sales of euro
at tills -21 -44
in banks -1 408 -2 926
bank purchases 35 169 38 337
bank sales -36 577 -41 263
Subtotal I -1 429 -2 970
II. Currency flows with banks, the MF, etc.
Minimum required reserves -92 -101
Government and other depositors (total) 1 091 5 122
Subtotal II 1 000 5 020
Total I+II -429 2 050
Source: BNB.
Banks sold EUR 2926 million net of reserve currency, on EUR 1408 million in 2013. They refunded EUR 101 million to maintain minimum reserves with the BNB, on EUR 92 million in 2013. Significant inflows of EUR 5122 million into government and other ac-counts (mostly the MF and the European Commission’s BNB accounts) boosted ex-ternal cash flows, on EUR 1091 million in 2013. The two largest receipts went to the MF (EUR 1479 million of debt issued on international financial markets as of 3 July 2014 and a EUR 1494 million budget finance bridge loan as of 17 December 2014).
Gold in the Issue Department balance sheet fell to an average of 8.84 per cent, from 10.61 in 2013. This was mainly due to EUR 2050.42 billion of inward external flows, boosting the share of euro assets to 90.51 per cent on average for the year.
Currency Structure of Gross International Reserves (per cent)
CurrencyIssue Department Balance Sheet Assets
2013 2014
EUR 89.04 90.51
USD 0.04 0.36
XAU 10.61 8.84
XDR 0.30 0.28
CHF 0.01 0.01
Note: Average data for the period.
Source: BNB.
Asset structure by financial instrument saw no essential change. Most assets (75.73 per cent) continued being invested in securities.
Gross International Reserves by Financial Instrument (per cent)
Financial instruments 2013 2014
Vault cash* 4.76 4.62
Deposits** 18.66 19.65
Securities** 76.58 75.73
Note: Average data for the period.* Account balances, payments, and monetary gold.** Including instruments in foreign currency and gold.
Source: BNB.
By residual term to maturity, 59.66 per cent on average of international reserve assets continued to be invested in the up to a year maturity sector (current accounts, short-term deposits in foreign currency and gold, and short-term securities).

33
Gross International Foreig
n Exchang
e Reserves
The one to three-year maturity sector share fell, those of the three to five and five to ten year sectors rising.
Gross International Reserves by Residual Term to Maturity(per cent)
Maturity sectors 2013 2014
Up to a year 59.85 59.66
One to three years 36.88 28.33
Three to five years 2.45 8.18
Five to ten years 0.81 3.84
Over ten years 0.01 0.00
Note: Average data for the period.
Source: BNB.
2. Gross International Reserve Risk and Return
In 2014 financial market developments mainly reflected divergent factors as euro area and US economic developments, leading central banks’ moves, and rising tension in Ukraine and the Middle East. Early in the year euro area and US government bond prices rose alongside global geopolitical risk. In the second and third quarters euro area and US long-term government bond prices continued rising, the former signifi-cantly faster. US economic activity improved strongly, while the euro area economy featured low growth and steady falls in actual and expected inflation. The latter fac-tors drove ECB standard and non-standard monetary policy measures in June and September. Continuing improvement in US economic activity deepened divergence between ECB and Federal Reserve policies, prompting a growing mismatch between German and US bond prices. Moderately improving euro area periphery economic and fiscal indicators boosted several countries’ credit ratings and bond spreads against benchmark German ones. By the end of the year markets expected further non-standard ECB measures, including government bond purchases, and growing political uncertainty in Greece.
ECB and Federal Reserve System Policy
In June and September the ECB cut the main refinancing rate 20 basis points to 0.05 per cent and the marginal lending and deposit facility rates 45 and 20 basis points to 0.3 and -0.2 per cent. June saw the deposit rate dip below zero for the first time. At its September meeting, the ECB Governing Council stated that no further cuts should be expected based on expectations of low inflation in the euro area for an extended period of time and economic activity recovery which could take longer than expected.
Unexpected non-standard monetary policy measures in June notably included tar-geted longer-term refinancing operations. Set to last some four years and to be conducted quarterly from September 2014 to June 2016, they aim to boost lend-ing through soft longer-term refinancing to banks. The September and December operations disbursed EUR 212.4 billion of the allocated 400 billion, providing some EUR 131 billion of net refinancing. At the June meeting, the ECB decided to continue its policy of unlimited liquidity allotment on main three-month refinancing operations at least until December 2016.
In September the ECB announced two additional asset purchase programmes to help monetary policy transmission mechanism. The covered bond purchase programme (CBPP3) and the asset-backed securities purchase programme (ABSPP) will last at least two years. The CBPP3 launched on 20 October and the ABSPP on 24 November, with primary and secondary market interventions. Securities subject to purchase are
The Market Environment

Bul
gar
ian
Nat
iona
l Ban
k. A
nnua
l Rep
ort •
201
4
34
eligible as collateral in refinancing operations (with specific requirements on Greece and Cyprus), denominated in euro, and issued by euro area institutions. By end-2014 the cumulative amount of purchased covered bonds was EUR 29.7 billion and that of asset-backed securities EUR 1.7 billion.
Excess euro area liquidity and the ECB balance sheet declined. As of the end of 2014 excess liquidity fell to EUR 235 billion from EUR 275 billion in 2013 and the ECB bal-ance sheet contracted 6 per cent to EUR 2150 billion. The major reason was early re-demption of the three-year refinancing operations to a cumulative amount of EUR 355 billion. In the fourth quarter excess liquidity and the ECB balance sheet rose after the June and September measures as the ECB strove to restore early 2012 balance sheet levels.
EONIA reference overnight interest rates fluctuated between -0.09 and 0.69 per cent, its average annual value reaching 0.1 per cent from 0.09 in 2013. EURIBOR, the av-erage interest rate at which euro area banks borrow from each other, fell with up to two-week rates remaining continuously negative. One and three-month interest rates fell some 20 basis points to 0.02 and 0.08 per cent from 2013, six and 12-month rates falling 22 and 23 basis points to 0.17 and 0.33 per cent. Credit and liquidity risk premia measured by the EURIBOR-OIS spread changed little, the three and six-month segments falling -3 and -2 basis points on 2013 to 9 and 21 basis points.
In 2014 the US Federal Reserve System kept its federal funds reference rate within the nil to 0.25 per cent band and continued reinvesting earnings from maturing US government securities on its balance sheet into new US government bonds, and earnings from government debt and mortgage backed securities into new mortgage bonds. The March FOMC meeting replaced the December 2012 non-conventional measure of a nominal threshold for US unemployment and inflation expectations with a broader FOMC estimate of progress to full employment and 2 per cent inflation. In October the FOMC formally ended the third round of quantitative easing or QE3 launched in 2012, which purchased additional US government bonds and mortgage backed bonds each month.
In September the FOMC updated the Federal Reserve strategy for US monetary pol-icy normalisation, providing for a control over federal funds rates through excess re-serve rates. Overnight reverse repo rates and other instruments should constrain the reference rate range further. Overnight reverse repo rates will play only in monetary policy normalisation. The volume of available assets in the Federal Reserve portfolio should fall gradually and principal reinvestment will end when monetary policy begins normalising and the reference rate rises.
The 16 and 17 December FOMC meeting changed its communications approach. The Committee was unlikely to begin normalising policy for at least two meetings. The US inflation rate below the 2 per cent target is assessed as a temporary phenomenon. Hence, the Federal Reserve System could decide to raise the rates even at these rates of inflation.
Euro Area and US Sovereign Bond Yields
German government bond yields fell sharply to historic lows in all maturity sectors: 31 basis points to -0.10 per cent in two-year bonds and 139 basis points to 0.54 per cent in ten-year bonds. By the year’s end all German government securities with less than four-year maturities traded at negative yields. The significant fall was mainly because of falling euro area inflation and related ECB measures, and market partici-pants’ demand for low risk assets.

35
Gross International Foreig
n Exchang
e Reserves
In the first months of the year global geopolitical tensions depressed German government bond yields. By September the euro area economic situation was again marked by decelerating inflation and low economic growth, forcing the ECB to take measures leading to a further decline in German government securities rates. Despite the June and September cuts in key ECB rates and the October and November launch of CBPP3 and ABSPP, inflation and medium-term inflation expectations continued declining until the end of the year as oil prices fell sharply. This, plus downward revisions of economic activity projections by several international institutions, made markets expect additional non-standard moves by the ECB, including government bond purchases. Continuing global geopolitical tension and Greek political uncertainty additionally depressed German bond yields.
Euro area periphery government bond spreads narrowed compared to German ones. In the two-year maturity sector, Portugal, Ireland, and Spain led declines at 260, 63, and 79 basis points to 52, 11, and 50 basis points. In the ten-year sector, spreads narrowed 206, 88, and 115 basis points to 215, 71, and 107.
A slow but continuing euro area periphery recovery and ECB monetary policy meas-ures were the main reasons for a narrowing of government bond yield spreads. Posi-tive changes in leading rating agencies’ outlook for some of these countries helped.
Spanish and Portuguese spread narrowing reflected improving economic and fiscal indicators and structural reform progress. Portugal’s EU/IMF bailout exit in May, the ESM-approved Spanish request for a voluntary early repayment in July, and Ireland’s request for early repayments of IMF bailout debt in late November also depressed these countries’ bond yields. While following the overall trend, Italy’s government bond yield declined less than those of other periphery states. This mostly reflected continuing recession, a worsened fiscal picture, and limited economic and adminis-trative reform and prompted Standard & Poor’s to downgrade Italy’s long-term rating in one step to ВВВ-.
In the last quarter, market expectations of an ECB asset purchase programme in early 2015 kept spreads narrowing moderately.
Core euro area countries’ two-year bond spreads widened slightly, except for Belgium where they stayed at 7 basis points and France where they narrowed 2 basis points to 7. Dutch, Finnish, and Austrian spreads widened 7, 9, and 2 basis points to 7, 7 and 6. Ten-year government bond spreads for these countries narrowed throughout 2014, Belgium and France posting the strongest falls at 34 basis points to 29.
In 2014 US bond yields moved within wide bands, their dynamics most pronounced in the over one-year maturities. Government securities yields in the two-year maturity sector fluctuated between 0.29 and 0.74 per cent, unlike the wider fluctuations of ten-year bonds at 2.06–3.03 per cent. The upward trend in short-term maturities persisted over the whole year. However, medium and long-term yields broadly declined. The key factor driving short-term yield rises stems from market expectations of pending fed-eral fund target rate increases in 2015. These expectations reflect economic activity acceleration, improving US labour market conditions and a major change in Federal Reserve System’s communication regarding monetary policy stance. Decreased me-dium and long-term US yields were due to several factors, as declines in market indi-cators of longer-term inflation expectations, the US dollar appreciation, investor flight to security due to escalation of global geopolitical tensions and expansionary policy measures of the ECB.

Bul
gar
ian
Nat
iona
l Ban
k. A
nnua
l Rep
ort •
201
4
36
Government Bond Yields in 2014(per cent)
Gold and Exchange Rates
In 2014 gold prices fell 1.4 per cent in US dollars and rose 12.4 per cent in euro. They moved between USD 1144 and USD 1383 per troy ounce. Tension in Ukraine and the Middle East boosted gold prices as investors fled to security. Strong US dollar appre-ciation and rising US exchange indices depressed gold later in the year, as did lower demand for it as a hedge against inflation.
In 2014 the US dollar appreciated 13.9 per cent on the euro, mostly in the second half of the year. The dollar euro rate moved between 0.72 and 0.83 with great fluctuations. Initially, a moderate euro area recovery broadly depressed the US dollar against the euro. Second quarter expectations of additional ECB measures to boost economic activity moved it up. In the third and fourth quarters US economic activity improved strongly, while euro area growth faltered and inflation and medium-term inflation ex-pectations fell steadily. Euro area and US monetary policy diverged, driving a signifi-cant US dollar appreciation on the euro in the second half of the year.

37
Gross International Foreig
n Exchang
e Reserves
The USD/EUR Exchange Rate in 2014(EUR)
Troy Ounce Gold Price in US Dollars in 2014(USD)
Troy Ounce Gold Price in Euro in 2014(EUR)

Bul
gar
ian
Nat
iona
l Ban
k. A
nnua
l Rep
ort •
201
4
38
Over 2014 net value risk in the Issue Department balance sheet measured by value-at-risk (VaR) came to 3.84 per cent.37
In 2014 international reserve interest rate risk measured by reserves’ average modi-fied duration was 1.27 years. Longer than the 0.93 years average duration in 2013, it rose in the last quarter from 1.20 to almost 2 years.
The Law on the Bulgarian National Bank provision that the sum of the absolute values of open foreign currency positions in currencies38 other than euro, SDR, and monetary gold should not exceed 2 per cent of the market value of monetary liabilities in these currencies constrained international reserve currency risk. The year saw minimal open positions in currencies, the open position in monetary gold in the Issue Department balance sheet posing the main currency risk to the BNB.
To utilise opportunities offered by historically low interest rates and increased geopo-litical uncertainty, the BNB changed credit risk management investment constraints significantly.
The BNB continued its conservative stance on credit risk in government and govern-ment guaranteed debt investment and retained constraints on sovereign issuers di-vided into three inherent risk groups. The minimum of 35 per cent for the least risky Group I changed to 30 per cent. To achieve its main objective of high international reserve security and liquidity, the BNB continued investing the main share of assets into German government bonds and government guaranteed debt, and short-term deposits with first class banks.
The BNB continued expanding investment into the secured debt of financial insti-tutions assigned the highest credit ratings, raising its maximum weight from 20 to 25 per cent.
From the beginning of the second half, a new investment constraint diversified risk by setting a minimum of 10 per cent market value to non-euro area issuers’ bonds in international reserves. Its main purpose is to achieve a better risk diversification re-garding non-euro area issuers.
To broaden investment options, the maximum term to maturity of Group II Countries’, Secured Debt, and Supranational Institutions’ asset class financial instruments rose to seven years.
As of the end of 2014 some 70 per cent of international reserves were invested into assets with the highest AAA long-term credit rating.
Strict monitoring and control of investment restrictions and business procedures for international reserve management constrained operational risk.
Net return from euro assets comprises: i. yield from investing gross international re-serves in original currency; ii. currency imbalance yield,39 and iii. expenditure on liabilities. Annual international reserve investment yield was EUR 161.28 million or 1.14 per cent. Currency imbalance yield of EUR 137.16 million resulted almost en-tirely from changes in the euro price of monetary gold. No interest was paid on Issue Department balance sheet liabilities.40 The three components brought net return from international reserve management to EUR 298.44 million or 2 .20 per cent total return on assets.41
37 VaR=-X% (X>0) at 95 per cent confidence level and allowing for normal yield allocation means that 95 per cent of the time maximum net value loss would not exceed X per cent.
38 An open foreign currency position is the difference between the value of assets and liabilities in any currency other than euro.
39 Currency imbalance yield is the result of the effects of exchange rate movements on assets’ and liabilities’ open foreign currency positions.
40 Data on the Issue Department liabilities are not entered directly into the information system of international reserve management; they enter the system via the accounting system interface.
41 The total return is obtained by multiplying the return of individual components (not as a simple sum).
Major Risk Types
Return and Efficiency

39
Gross International Foreig
n Exchang
e Reserves
International Reserves Income and Rate of Return in 2014
QuarterNet
income(1)+(2)+(3)
Investment income
(1)
Currency imbalance yield
(2)
Expenditure (interest) on liabilities
(3)
First quarter 102.59 27.71 74.88 0.00
Second quarter 82.09 34.43 47.66 0.00
Third quarter 23.07 38.21 -15.14 0.00
Fourth quarter 90.69 60.94 29.75 0.00
Total income, EUR million 298.44 161.28 137.16 0.00
Total rate of return, per cent 2.20 1.14 1.05 0.00
Source: BNB.
Operational management splits international reserves into currency and investment goal portfolios, each with a benchmark, investment goals, and investment limits. The table below shows major BNB portfolios and management outcomes.
Portfolio Return and Risk in 2014
Portfolio
Return Volatility (risk)Information
ratio3Absolute(per cent)
Relative1
(basis points)Absolute
(basis points)Relative2
(basis points)
Investment 1, EUR 1.29 10 37 10 1.03
Investment 2, EUR 1.34 16 36 11 1.50
Investment 3, EUR 5.02 - 156 - -
External manager А, EUR 1.59 8 60 11 0.75
External manager B, EUR 1.68 17 61 9 1.87
Liquidity, EUR 0.09 7 1 1 -
Liquidity, USD 0.11 11 3 3 -
1 Positive relative return to a given portfolio is profit against benchmark return. Negative relative return is interpreted as oppor-tunity cost. 2 Relative volatility (relative risk) against benchmark indicates the degree of deviation of portfolio risk characteristics from benchmark through active portfolio management. Risk is shown on an annual basis.3 Information coefficient, shown only for actively managed portfolios, is the ratio between relative annual portfolio return and relative annual portfolio risk.
Source: BNB.
To diversify management styles and cut operational risk, most euro-denominated as-sets continued being split into two investment portfolios with identical benchmarks and investment limits, managed by different BNB teams. There is a requirement for securities in Investment 3 Portfolio to be held to maturity. Hence, they are not man-aged actively and there is no benchmark in the Portfolio. As of the end of 2014 some 7 per cent of gross international reserves were managed by external managers at in-ternational financial institutions. Beside additional diversification, using external man-agers helped exchange expertise in international market investment management. Liquid portfolios mainly assist immediate BNB foreign currency payment needs.

Bul
gar
ian
Nat
iona
l Ban
k. A
nnua
l Rep
ort •
201
4
40
III. Payment Systems
Organising, supporting, and developing national payment systems by implementing and overseeing efficient payment mechanisms is a Bank duty under the Law on the Bulgarian National Bank. The Bank’s goals are to curb systemic risk and integrate Bul-garian payment systems into the European payment infrastructure.
Lev settlement systems are:
• The RINGS real-time gross settlement system, run by the BNB;
• Ancillary RINGS transaction settling systems:
– BISERA for designated time customer transfers settlement system, run by BORICA–Bankservice AD;
– BORICA for Bulgarian card payment servicing, run by BORICA–Bankservice AD;
Euro settlement systems are:
• The TARGET2-BNB TARGET2 national system component, run by the BNB;
• The ancillary TARGET2-BNB system BISERA7-EUR for servicing designated time customer transfers, run by BORICA–Bankservice AD;
Securities settlement systems are:
• The book-entry government securities settlement system, run by the BNB;
• The book-entry securities registration and servicing system, run by the Central Depository.
In 2014 the structure of lev payments by system did not change. RINGS processed 82.4 per cent of payment value. Values around 80 per cent are deemed optimal for real-time gross settlement systems. RINGS also processed 0.5 per cent of Bulgarian cashless lev payments.
Distribution of Lev Payments in Bulgaria by Payment System in 2014
Source: BNB.
Lev Settlement
Systems and Securities
Settlement Systems

41
Paym
ent System
sBORICA transaction value rose 10.9 per cent and number 6.2 per cent on 2013. ATM cash withdrawal value and number rose 8 and 2.1 per cent. BORICA-authorised POS terminal transaction value rose 2.9 per cent and fell 5.6 per cent in number. BISERA payments rose 8.7 per cent in value and 13.4 per cent in number. Central Depository transaction value fell 25.9 per cent, numbers rising 40.3 per cent.
In 2014 RINGS real-time gross settlement system processed most Bulgarian lev pay-ments by value. This cut payment system risks: a major central bank goal. RINGS pro-cessed 1,024,489 payme nts for BGN 633,860 million: down 20.5 per cent in value and 0.3 per cent in number on 2013. Customer payments numbered 921,115 (89.9 per cent of the total) for BGN 189,647 million (29.9 per cent of the total). There were 4082 payments for BGN 2525 million per average day.
Over the review period 61.7 per cent of payments went through by noon and 83.1 per cent by 2:30pm. In traffic terms, 82.3 per cent of RINGS payments went through by 2:30pm.
RINGS Payment Numbers in 2013 and 2014
Source: BNB.
As of 31 December 2014, 29 banks participated in RINGS.42
RINGS Payment Value in 2013 and 2014(BGN million) (BGN million)
Source: BNB.
42 The Corporate Commercial Bank, inactive participant as of the end of the reporting period, is not included.

Bul
gar
ian
Nat
iona
l Ban
k. A
nnua
l Rep
ort •
201
4
42
In the review period RINGS offered 99.98 per cent availability.43
The BNB runs the TARGET2-BNB national system component and is responsible for business relations between participants and coordination with the European Central Bank and participating central banks.44 As of 31 December 2014 TARGET2-BNB in-cluded the BNB, 22 direct participant banks, three addressable BIC holders, and two ancillary systems: BISERA7-EUR for customer euro designated time transfers and BNBGSSS for government securities settlement.45
TARGET2-BNB Payment Numbers in 2013 and 2014
Source: BNB.
TARGET2-BNB Payment Value in 2013 and 2014(EUR million) (EUR million)
Source: BNB.
43 The ratio of operational to scheduled operating time.44 TARGET2 settles gross euro payments in real time using central bank money. It is a Single Shared Platform (SSP)
system, each participating and connected central bank responsible for its system component. As of 31 December 2014 it connected the ECB and 23 EU central banks.
45 The current list of TARGET2 participants in TARGET2-BNB is at www.bnb.bg/PaymentSystem/PSTARGET2/PSTAR-GETList/index.htm. As of 31 December 2014 BISERA7-EUR included 13 of 22 TARGET2-BNB direct participant banks.
Euro Settlement
System

43
Paym
ent System
sIn 2014 TARGET2-BNB processed 216,530 payments for EUR 324,342 million, in-cluding 177,045 customer payments for EUR 6962 million. Transaction number rose 19.7 per cent and value fell 3.4 per cent on 2013. Payments by other system compo-nents to banks were 88.5 per cent of the number and 88.8 per cent of the value of all TARGET2-BNB payments. The daily average number of system payments was 849, value reaching EUR 1274 million. The daily number peak was 1755, with a daily value peak of EUR 2919 million.
The BISERA7-EUR ancillary system processes customer transfers in euro at a des-ignated time. The BISERA7-EUR ancillary system processed 28,925 payments for EUR 288 million, up 12.4 per cent in number and down 5.6 per cent in value on 2013.
By late 2014 almost all banks and foreign bank branches in Bulgaria handled SEPA credit transfers.46 Their share was 55.1 per cent of all customer euro payments un-der Regulation (ЕU) No 260/2012 of the European Parliament and of the Council of 14 March 2012 establishing technical and business requirements for credit transfers and direct debits in euro.
BISERA7-EUR operated by BORICA–Bankservice AD processes only SEPA credit transfers and direct debits. To ensure bank reachability in SEPA payments to and from banks in other countries, BISERA7-EUR connected with SEPA Clearer and Equens. This allows SEPA credit transfers between bank communities in Bulgaria and other EU countries, mainly Germany, Greece, Italy, the Netherlands, Poland, and Switzer-land. From January 2014, a link with Poland’s EuroELIXIR expanded Bulgarian banks’ SEPA reachability.
As of 31 December 2014, 88.7 per cent of Bulgarian cards, including 87.2 per cent of debit and 99.4 per cent of credit cards, had migrated to the EMV standard.47 Card payments infrastructure EMV migration was practically complete, with 100 per cent of ATMs and 99.7 per cent of POS terminals compatible.
Payment systems overseers sought to limit system risk and improve payment sys-tems’ reliability and efficiency. They monitored adherence to standards and recom-mendations by the Bank for International Settlements, the International Organization of Securities Commissions, the European Central Bank, and the European System of Central Banks.
On 6 February the BNB Governing Council reviewed SEP Bulgaria AD’s notice of clos-ing its settlement finality payment system under Article 102, paragraph 1 in connec-tion with Article 101, paragraph 1, item 7 of the Law on Payment Services and Pay-ment Systems. Finding that Article 102 of the Law was satisfied, the BNB Governing Council revoked SEP Bulgaria AD’s licence under Article 101, paragraph 1, item 7.
In 2014 the BNB inspected three payment service providers to check compliance with the Law on Payment Services and Payment Systems and its statutory instruments.
Relevant BNB registers changed thus:
– 204 agents listed and 116 agents delisted onto/from public register of licensed payment institutions, branches and agents under the Article 17 of the Law;
– 24 agents listed on the public register of licensed electronic money institutions, branches and agents under Article 17 of the Law;
46 The Single Euro Payments Area (SEPA) is the most significant move to harmonise EU small payment practice and standards. SEPA credit transfers and card payments launched in early 2008, payment service end users enjoying SEPA direct debits since November 2009.
47 EMV is a global smart or chip credit and debit card standard developed by Europay, MasterCard, and Visa to boost card payment security and limit abuse and misuse.
Bulgarian Payment and
Settlement System
Development
Payment System
Oversight

Bul
gar
ian
Nat
iona
l Ban
k. A
nnua
l Rep
ort •
201
4
44
– 38 payment institutions from other EU countries operating in Bulgaria listed onto the public register under Article 7 of BNB Ordinance No 16 of 16 July 2009; 109 payment service providers’ agents from other EU countries also listed;
– 11 electronic money institutions licensed elsewhere in the EU and issuing, dis-tributing, and redeeming electronic money in Bulgaria listed onto the public register under Article 39 of BNB Ordinance No 16 of 16 July 2009.
The BNB enquired into 194 individual and corporate payment service user complaints.

45
Banks’ R
eserves at the BN
B
IV. Banks’ Reserves at the BNB
In 2014 the average daily value of bank funds designated as minimum required re-serves (excluding central and local government funds) rose 4.2 per cent on 2013. This reflected a 7.1 per cent lev and 1.4 per cent foreign currency liability rise. The av-erage daily value of residents’ funds (excluding central and local government funds) rose 7.0 per cent, those from non-residents rising 10.3 per cent. Bank central and lo-cal government liabilities grew 25.5 per cent. The change in the structure of attracted funds boosted the effective implicit ratio of minimum required reserves 0.05 percent-age points on 2013 to 8.9 per cent on average.48
Structure of Attracted Funds in the Banking System*(per cent)
* Average daily value for reserve calculation purposes.
Source: BNB.
Banks’ Reserves at the BNB(BGN million)
Note: Following the revocation of its banking license, from November 2014 KTB was exempt from maintaining minimum required reserves with the BNB.
Source: BNB.
48 BNB Ordinance No 21 sets banks’ minimum reserves at 10 per cent of their domestic and 5 per cent of their foreign deposit base. Central and local government funds are exempt.

Bul
gar
ian
Nat
iona
l Ban
k. A
nnua
l Rep
ort •
201
4
46
Reserve assets covering this ratio include funds in banks’ BNB accounts (7.8 per-centage points) and half of cash balances designated as reserves (1.1 percentage points). The average daily value of lev assets rose 8.3 per cent on 2013, euro assets rising 0.8 per cent. This changed the currency structure of banks’ reserve assets, the euro relative share falling to 34.2 per cent on average from 35.8 per cent in 2013.
After falls in the first half year, banks’ excess reserves rose significantly to 56.5 per cent excess over minima in the second half, mainly due to ECB monetary policy. Av-erage 2014 funds in banks’ BNB Ordinance No 21 accounts exceeded minima by 15.3 per cent from 7.2 per cent in 2013. In addition to funds in minimum required re-serve accounts and excess reserves, banks maintained funds in TARGET2-BNB na-tional system component accounts, sustaining a downward trend since March 2013.49
Following the ECB decision of June 2014 to introduce a negative interest rate on the deposit facility, including TARGET2 funds, banks’ funds in TARGET2-BNB national system component decreased significantly.
49 The Issue Department Balance Sheet lists banks’ funds in the TARGET2-BNB national system as liabilities to banks.

47
Currency in C
irculation
V. Currency in Circulation
The Bulgarian National Bank holds the Bulgarian currency monopoly.50 Its currency is unrestricted mandatory legal tender at face value. The BNB prints banknotes, mints coins, and keeps and scraps uncirculated or withdrawn currency.
At the end of 2014 circulating currency51 was worth BGN 11,586.9 million, up BGN 1333.2 million or 13 per cent on 2013. Banknotes represented 98.0 per cent of this, with circulating and commemorative coins at 1.9 and 0.1 per cent. The share of banknotes rose 0.1 percentage point at the expense of coins.
Banknotes and Coins in Circulation (Outside BNB Vaults)(BGN million)
Source: BNB.
By the end of 2014 396.7 million banknotes circulated, worth BGN 11,355.0 million. In a year their number and value rose 10.4 per cent or 37.4 million and 13.1 per cent or BGN 1313.4 million, against 4.7 and 7.3 per cent in 2013.
Share of Individual Denominations in the Total Number of Circulating Banknotes
Source: BNB.
50 The Law on the BNB Article 2, paragraph 5 and Article 25.51 Banknotes and circulating and commemorative coins issued after 5 July 1999.

Bul
gar
ian
Nat
iona
l Ban
k. A
nnua
l Rep
ort •
201
4
48
The number of BGN 100 and 50 banknotes continued rising faster than others at 5.0 million or 15.2 per cent and 9.9 million or 14.2 per cent. Their rises have contrib-uted most to annual circulating banknote value growth for four years now.
Rises in BGN 100 and 50 numbers were mainly at the expense of BGN 20s and 10s in the past three years. In 2014 BGN 20s led the numerical ranking of circulating banknotes at 32.2 per cent or 127.8 million bills, down 0.1 percentage point on 2013. BGN 10 and 5 shares fell. BGN 50s led the value ranking at 35.2 per cent, followed by BGN 100s and 20s at 33.3 and 22.5 per cent.
Share of Individual Denominations in the Total Value of Circulating Banknotes
Source: BNB.
The average banknote circulating at the end of 2014 was worth BGN 28.63: up BGN 0.67 or 2.4 per cent mainly due to BGN 50 and 100 growth.
As of 31 December 2014, 1779.4 million coins circulated, worth BGN 225.5 million or 1.9 per cent of the value of circulating currency. Numbers grew 152.7 million or 9.4 per cent and value BGN 19.5 million or 9.5 per cent. The BGN 0.02 coin saw the highest rise at 11 per cent. The number of BGN 1s and 0.01s rose 9.4 per cent or 46.3 million and 10.6 per cent or 9.7 million, BGN 0.10s and 0.50s growing 7.9 and 8.9 per cent. The BGN 0.01 coin occupied the largest 30.3 per cent share of circu-lating coins as in 2013, the shares of BGN 0.05s, 0.10s, 0.20s, and 0.50s falling. BGN 0.02 numbers rose 0.3 percentage points from 25.2 to 25.5 per cent, the BGN 1 growing 0.06 percentage points.
Share of Individual Nominal Values in the Total Number of Circulating Coins
Source: BNB.

49
Currency in C
irculationShare of Individual Nominal Values in the Total Value of Circulating Coins
Source: BNB.
In late 2014 BGN 1 coins had the largest share at 44.6 per cent of the value of circu-lating coins, followed by BGN 0.50s and 0.20s at 19.2 and 15.5 per cent.
The average circulating coin as of end-December 2014 matched its 2013 value at BGN 0.13.
Commemorative coins also held their share in the total value of circulating currency at 0.06 per cent.
In 2014 the BNB National Analysis Centre retained 2869 non-genuine Bulgarian bank-notes. Of them 2821 had entered circulation: 631 more than in 2013. The share of re-tained non-genuine banknotes remained very low at 0.000723 per cent of circulating banknotes, indicating high circulating currency security.
BGN 20 banknotes led at 44.4 per cent of all retained non-genuine banknotes, fol-lowed by BGN 10s and 50s at 39.7 and 12.8 per cent. The 89 non-genuine BGN 2, 5, and 100 banknotes comprised 3.1 per cent of non-genuine banknotes retained over the year.
There were 1623 non-genuine retained coins: 1027 BGN 1s, 594 BGN 0.50s and two BGN 0.20s. The share of retained non-genuine Bulgarian coins in circulating coins was also very low at 0.000091 per cent.
The National Analysis Centre also retained 2301 euro banknotes, 5511 US dollar banknotes, and 1724 sundry foreign banknotes.
BNB issue and cash operations include minting and printing cash; accepting, deliver-ing, repaying, processing, and checking of home and foreign currency; exchanging damaged cash; and scrapping unfit Bulgarian banknotes and coins.
In 2014 producers supplied 62.7 million new banknotes and 129.0 million new coins worth BGN 1375.2 million. The BNB launched the three commemorative coins planned in its 2014 minting programme under Article 25, paragraph 1 of the Law on the BNB.52
Banknote and coin deposits and withdrawals totalled BGN 32,593.7 million. Banks deposited BGN 15,631 million, up BGN 1090.2 million or 7.5 per cent on 2013, with-drawing BGN 16,962.7, up BGN 1719.9 million or 11.3 per cent on 2013.
52 See the BNB website for banknote and circulating and commemorative coin issues.
BNB Issue and Cash Activities
Non-genuine Banknotes and Coins

Bul
gar
ian
Nat
iona
l Ban
k. A
nnua
l Rep
ort •
201
4
50
Banknotes recirculated through BNB tills an average of 2.5 times a year. High-value banknotes returned less often, BGN 100s and 50s recirculating 0.5 and 1.0 times. BGN 10s and 20s, most used by commercial banks and dispensed by ATM terminals, returned 3.3 and 4.6 times.
In 2014 BNB and Cash Services Company53 processing machines tested 856.7 mil-lion banknotes and 162.5 million coins. Banknote numbers rose 4.7 per cent and coins fell 0.8 per cent on 2013. BGN 10 and 20 banknotes and BGN 0.20 and 1 coins led the value rankings .
The Bank monitors circulating currency quality and integrity through authenticity and fitness standards. Banknotes retained as unfit numbered 61.2 million, down 15.9 mil-lion or 20.6 per cent on 2013. Their share in total processed banknotes was 7.2 per cent. There were 1.2 million retained unfit coins, up 18.7 per cent on 2013. Their share in total processed coins was 0.7 per cent.
In 2014 the BNB bought EUR 0.5 million of reserve currency: EUR 0.4 million from budget organisations and EUR 0.1 million from individuals. The BNB sold EUR 46.7 million of reserve currency: EUR 6.7 million to budget organisations and EUR 40 mil-lion to individuals.
The BNB conducted six full and 29 spot site checks into credit institution and service provider compliance with Ordinance No 18 on the Control over Quality of Banknotes and Coins in Currency Circulation and instructions on its implementation. Inspections included reviewing the cash operations statutory framework, testing ATM banknote quality, and checking sorting and customer-operated machines.
53 The Cash Services Company AD is a BNB Ordinance No 18 cash handler and service supplier owned by the BNB and four commercial banks.

51
Maintaining
Banking
System
Stab
ility and P
rotection of Dep
ositor Interests
VI. Maintaining Banking System Stability and Protection of Depositor Interests
1. State of the Banking System
In 2014 economic and political challenges and ensuing uncertainty had a dampening effect on lending and kept economic agents’ propensity to save high. The ongoing repayment of obligations by Bulgarian banks to foreign credit institutions (mostly par-ent companies) was offset by increased household deposits. Additional requirements to credit institutions for higher coverage of attracted funds with liquid assets affected the structure of their balance sheet assets. Investment in Bulgarian government se-curities and in short-term placements increased (mostly with entities of the group).
Safeguarding banking stability was the the major challenge in the second quarter of 2014. The capacity of liquidity and capital buffers held by banks and deliberately re-quired by the BNB over years was tested in real situation of stress. In the second half of June the banking sector was under strong liquidity pressure, which escalated as a result of news reports in mass media, internet and electronic messages about the state of particular banks. The subsequent strong run on deposits of Corporate Com-mercial Bank and its subsidiary CB Victoria led to a liquidity depletion and suspension of payments by these banks. At the request of KTB and CB Victoria managements the two banks were placed under conservatorship on 20 and 22 June 2014.54 In compli-ance with the Law on Credit Institutions the BNB placing the bank under conserva-torship appointed conservators, discontinued the operations of the two banks for a period of three months, dismissed from office all members of the management bod-ies and revoked the voting rights of the shareholders holding more than 10 per cent of shares. Three audit firms (Deloitte Audit OOD, Ernst & Young OOD, and AFA OOD), which have not audited the two banks under conservatorship in recent years, were selected to start a comprehensive assessment of assets, intended to assess their actual state and possible capital requirements for rescuing the two banks. In parallel with the assignment of a review of KTB assets by the three audit firms, between 7 July 2014 and 14 October 2014 an on-site supervisory inspection was conducted at the bank based on data as of 30 June 2014.
By the end of June 2014 a framework of state aid measures to support liquidity of banks in Bulgaria was negotiated with the European Commission.55 The liquidity pres-sure was overcome and banking stability was preserved. Despite the complicated situation due to KTB crisis, macroeconomic and financial stability were preserved. The banking system continued to perform its role of a financial intermediary in the economy, with liquidity and capital buffers being further strengthened.
The reports of the three audit firms were approved on 21 October 2014. Pursuant to Article 107, paragraph 3 of the Law on Credit Institutions the BNB Governing Council instructed the conservators to undertake the required measures until 31 October 2014 under the International Financial Reporting Standards for reporting in the bank’s balance sheet the results of the assessment and analysis of KTB assets as of 30 September 2014, and to submit to the BNB financial and supervisory reports of KTB in compliance with the effective EU regulatory framework. Based on KTB financial and supervisory reports as of 30 September 2014 submitted to the BNB on
54 Developments of the KTB and CB Victoria issue were regularly made publicly available via press releases and statements published on the BNB website. A report on the events and actions undertaken in relation to the two banks was submitted to members of the Parliament of the 43rd National Assembly on behalf of the BNB Govern-ing Council. The report is published on the BNB website at: http://www.bnb.bg/PressOffice/POPressReleases/POPRDate/PR_20141027_EN.
55 The European Commission decision was announced on 30 June 2014 (http:/ /europa.eu/rapid/press-release_IP-14-754_en.htm).

Bul
gar
ian
Nat
iona
l Ban
k. A
nnua
l Rep
ort •
201
4
52
4 November 2014 the Governing Council of the BNB established a negative value of bank’s own funds (as determined by Regulation (EU) No 575/2013 in the amount of BGN -3,745,313,000, and non-compliance with the capital requirements under Article 92 of Regulation (EU) No 575/2013. As a result on 6 November 2014 the BNB Governing Council revoked the banking license of Corporate Commercial Bank AD due to insolvency nder Article 36, paragraph 2, item 2, Article 103, paragraph 1, item 1 and paragraph 2, item 25 and Article 151, paragraph 1, motion one of the Law on Credit Institutions and Article 16, item 15 of the Law on the Bulgarian National Bank.
Financial and supervisory reports on CB Victoria as of 30 September 2014 reiterated that the bank met capital regulatory requirements but it had no sufficient liquid funds to cover its obligations to depositors. As a result of the package of measures, includ-ing the sale of bank’s credit portfolios, liquidity was provided for full pay-out of CB Victoria’s obligations on deposits (both guaranteed and non-guaranteed). On 12 De-cember 2014 CB Victoria reopened to continue conducting all operations in accord-ance with the banking licence.
Credit risk management was another priority throughout the year. The share of loans past due over 90 days exhibited a favourable dynamics and the coverage by impair-ment improved. The quality assets other than loans remained good. The potency and quality of regulatory capital were adequate to risks to which they were exposed. The banking system capital base stayed at levels substantially above the minimal regula-tory requirements.
Banks’ earnings improved compared with 2013. Lower interest income was compen-sated by adjusting banks’ price strategies and a reduction of costs on attracted funds.
Market Shares of Domestic and Foreign Banks by Asset
Source: BNB.
By the end of 2014 banking system assets amounted to BGN 85.1 billion. They de-creased by BGN 0.5 billion (0.5 per cent) on end-2013 due to the exclusion of KTB assets (BGN 6.7 billion by the end of 2013)56. The market share of dominant Bulgar-ian banks decreased to 23.7 per cent by the end of 2014. The market position of EU bank subsidiaries and branches rose to 74.9 per cent and that on non-EU banks and branches decreased to 1.4 per cent.
56 The revocation of KTB licence to conduct bank operations is a key factor for the banks' balance sheet indicators dynamics and the qualitative indicators due to the exclusion of the bank (the fourth largest bank in terms of assets) from the scope of data.

53
Maintaining
Banking
System
Stab
ility and P
rotection of Dep
ositor InterestsDynamics of Selected Balance Sheet Indicators(annual change)
(per cent)
Note: Due to the revocation of the banking license of KTB for conducting bank operations the bank has been excluded from the banking system balance sheet indicators for December 2014 which resulted in a decline of credit indicators compared with 2013.
Source: BNB.
Diversification of assets continued. In 2014 securities portfolios increased by BGN 0.5 billion and claims on credit institutions by BGN 1.3 billion. The shares of the two as-set balance sheet items went up to reach 12.9 per cent each by the end of the year. Investment in Bulgarian government securities increased by BGN 1.5 billion and debt instruments of non-resident issuers decreased by BGN 0.6 billion. Over the review period cash rose by BGN 0.9 billion and by the end of 2014 their share accounted for 11.5 per cent of the banking system balance sheet.
In 2014 gross loans (excluding loans to credit institutions) went down by BGN 2.9 billion. (5.0 per cent) and by the end of the review period amounted to BGN 55.6 billion.57 Corporate loans contracted by BGN 4 billion, while retail exposures by BGN 214 billion. Comparison of data for the same scope of banks (KTB excluded) with data of end-2013 suggested that the credit portfolio of the 28 banks reported growth by BGN 1.9 billion (3.5 per cent) for a year. Corporate loans of these banks increased by BGN 656 million (1.9 per cent). Retail exposures of the same sample of banks posted a decrease by BGN 201 million (1.1 per cent). Concurrently, receivables of the 28 banks from the central governments increased by BGN 974 million, and re-ceivables from non-credit institutions by BGN 449 million.
Investment (advances) in credit institutions exhibited the strongest absolute growth (by approximately BGN 1.4 billion) due to tightened liquidity requirements.
By the end of 2014 the share of gross loans and advances in levs accounted for 38.2 per cent and that in euro 55. 5 per cent. Despite the fluctuations in international foreign exchange markets the currency risk in Bulgaria remained subdued due to the insignificant share of exposures in other currencies (6.2 per cent).
By the end of 2014 attracted funds in the banking system amounted to BGN 73.5 billion, i.е. down 0.5 per cent, or approximately BGN 0.4 billion on end-2013. Almost the full amount of KTB deposits paid out in December58 remained in the banking sector. Compared with end-2013 deposits of individuals and households
57 The decline reflected entirely the exclusion of data on KTB due to the revocation of the bank's licence for conducting bank operations.
58 The payout of deposits of BGN 3.7 billion with KTB, whose license for carrying out operations was revoked on 6 November, started on 4 December 2014. As of 12 December the restrictions imposed on CB Victoria to conduct bank operations were removed. The bank reopened to perform its obligations to depositors using own funds (in compliance with a decision of 19 November 2014 of the BNB Governing Council).

Bul
gar
ian
Nat
iona
l Ban
k. A
nnua
l Rep
ort •
201
4
54
rose by BGN 1.8 billion (4.5 per cent)59, and their share in the financing structure of the banking system rose by 2.6 percentage points to 55.8 per cent. Funds attracted from institutions other than credit decreased by BGN 420 million (1.8 per cent) on the end of 2013. The dynamics reflected the increase in the share of attracted funds denominated in levs accounting for 50.9 per cent in the banking system financing structure. Concurrently, the share of funds in euro went down by 1.6 percentage points to 42.0 per cent and the share of other currencies increased to 7.0 per cent due to higher exchange rates.
Structure of Attracted Funds (per cent)
Source: BNB.
The amount of banks’ balance sheet equity totalled BGN 10.8 billion by end-2014. Compared with end-2013 it declined by 1.7 per cent. The dynamics of the issued capital and premium reserves had a strong effect due to the takeover of Unionbank by the First Investment Bank and the exclusion of KTB from data after the licence revocation.
In 2014 risk parameters of the banking system, their dynamics and sharpness were impacted by factors related to the structure of credit institutions’ balance sheets, and by factors produced by the developments in the macro environment (economic, po-litical and international). Credit institutions proved able to manage the first group of factors and the related risks. In support of credit institutions the BNB pursued a con-sistent conservative policy to avoid easing of the regulatory regime irrespective of the changes resulting from the introduction of the single EU supervisory framework (Directive and Regulation on Capital Requirements, the so-called CDR IV/CRR pack-age) and removal of particular rights to national discretion.
Weak credit demand and the challenge faced by credit institutions in managing their balance sheets against the background of continuous inflow of attracted funds were among the second group of factors. Both the situation at KTB and the speculative pressure on the system’s liquidity had a strong effect on the behaviour of the sys-tem and all banks, mostly in the second half of June, challenging the potential of the banking system and the BNB in its capacity as a regulatory body to adequately react under emergency conditions. Monitoring of banks on a daily basis confirmed the as-sessment of a lack of prerequisites of systemic nature for worsening banking indica-tors. Concurrently, the BNB jointly with banks managed to cope with some problems in their business models, to improve capital and liquid resources and to set (in the new context) working parameters for banks’ operations.
59 Household deposits of the 28 banks (KTB excluded also by end-2013) reported growth by BGN 5.8 billion (16.3 per cent) for a year.

55
Maintaining
Banking
System
Stab
ility and P
rotection of Dep
ositor InterestsIn addition to credit risk and capital position management the banking system man-aged to preserve its profitability at an acceptable level against the background of de-creasing investment earnings and continuous loan impairment. Concurrently, growth of funds attracted from individuals and households was accompanied by a decrease in interest expenditure.
In 2014 gross loans past due over 90 days (including also those past due over 180 days) reported a decline by BGN 502 million (5.1 per cent) to BGN 9.4 billion. Their share in gross loans (excluding loans to credit institutions) slightly decreased to 16.75 per cent at the end of the review period. Due to the continuous impairment the net (balance sheet) value60 of loans past due over 90 days (including also those past due over 180 days) also declined (to BGN 4.7 billion at the end of 2014), and their share in net loans went down to 9.39 per cent.
Loans Past Due over 90 Days(BGN million) (per cent)
Source: BNB.
Coverage of Loans Past Due over 90 Days(BGN million) (per cent)
Source: BNB.
60 The amount of net loans past due over 90 days is calculated by subtracting impairment costs from their gross value.

Bul
gar
ian
Nat
iona
l Ban
k. A
nnua
l Rep
ort •
201
4
56
The upward trend in the coverage of loans past due over 90 days (including also loans past due over 180 days) by impairment was sustained in 2014. The coverage of these loans improved to 59.1 per cent (against 52.5 per cent a year earlier).
Investment in securities and in short-term placements underlaid the good quality of assets other than loans. Investment in banks remained low-risk. As a result of the in-crease in Bulgarian government bonds (by BGN 1.5 billion throughout the year) they reached 64.1 per cent of the securities portfolio by the end of 2014. The share of se-curities issued by foreign issuers went down to 31.1 per cent and that of capital in-struments to 2.5 per cent.
Return on Assets and Return on Equity(per cent) (per cent)
Note: Data based on audited annual income statements.
Source: BNB.
At the end of 2014 the banking system audited profit amounted to BGN 711 billion: up BGN 207 million on 2013. With the increase in the financial result return on assets (ROA) and return on equity (ROE) ratios improved. Return on assets was 0.85 per cent against 0.60 per cent as of December 2013 and return on equity was 7.15 per cent against 4.90 per cent as of December 2013. Net interest margin accounted for 3.38 per cent (against 3.34 per cent a year earlier). By the end of 2014 impairment charges came to BGN 1173 million exhibiting growth by 2.0 per cent compared with the previous year. Administrative expenditure61 decreased by BGN 46 million (2.6 per cent) due to the exclusion of KTB from the scope of data.
Financial and operating income increased by BGN 195 million (5.2 per cent) with all key components contributing to this effect. Compared with end-2013 net interest in-come increased by BGN 91 million (3.6 per cent) due to the faster rate of decrease in interest expenditure than that of revenue.
In 2014 the banking system capital adequacy ratio improved and accumulated capi-tal buffers were sustained. Several groups of factors impacted the capital position dy-namics in 2014: different risk weights and manner of treatment due to the implementa-tion of the new EU regulatory framework, removal of specific provisions for credit risk and exclusion of KTB from the scope of data at the end of 2014.
61 The sample of the 28 banks (KTB excluded also by end-2013) suggests that despite the staff reductions banks' administrative expenditure grew by BGN 17 million (1.0 per cent).

57
Maintaining
Banking
System
Stab
ility and P
rotection of Dep
ositor InterestsThe new EU regulatory framework on the capital adequacy and components entered into force on 1 January 201462. To preserve the accumulated banking capital reserves, requirements for a capital conservation buffer of 2.5 per cent and a capital buffer for systemic risk of 3 per cent of risk weighted exposures were introduced63. The capital conservation buffer became effective as of 13 May 2014 and the capital buffer for systemic risk from 1 October 2014. Banks had the required quality and amount of capital to meet the new requirements.
By the end of the year the surplus over the minimum required capital adequacy of 8 per cent amounted to BGN 6.9 billion. In 2014 the capital base increased reflecting lower deductions from tier one and tier two capital (due mostly to the removed spe-cific provisions for credit risk with the repeal of Ordinance No 9 of the BNB). Regu-latory changes associated with the shift to a new regime prompted the removal of particular rights to national discretion which involved more conservative treatment of credit risk and the required equity to address it. With the changes to the regulatory regime the BNB launched measures aimed at preventing the increase in credit insti-tutions’ risk appetite.
As of December 2014 tier one capital came to BGN 9.8 billion and tier two capital BGN 975 million. Common equity tier one capital accounted for 97.7 per cent in the structure of tier one capital. The total capital adequacy ratio and tier one capital ad-equacy ratio came to 21.95 per cent and 19.97 per cent respectively. The common equity tier one capital accounted for 19.51 per cent. The structure of risk exposures for different types of risks experienced no significant changes throughout the year. As of December 2014 the banks’ leverage ratio was 11.53 per cent64.
Selected Capital Indicators under Ordinance No 8 on the Capital Adequacy of Credit Institutions and Regulation (EU) No 575/2013 on Capital Requirements
(per cent)
Note: Data as of December 2013 are under Ordinance No 8 on the Capital Adequacy of Credit Institutions (in force at that time) and as of December 2014 under Regulation (EU) No 575/2013 on capital requirements. Data as of 31 December 2014 are based on ITS reports and are aggregated from the statements received at the BNB until 23 March 2015.
Source: BNB.
62 With the implementation of new EU legal framework on credit institutions' activity (directive and regulation on capital requirements, the so-called CDR IV/CRR package) the Governing Council repealed Ordinance No 8 and Ordinance No 9 of the BNB and other ordinances, and adopted new ones. In accordance with the new regulatory requirements banks shall meet minimum capital requirements for common equity tier one ratio (4.5 per cent), tier one capital ratio (6 per cent) and total capital adequacy ratio (8 per cent).
63 By resolution of the BNB Governing Council of 29 May 2014. 64 The leverage ratio is calculated by dividing the institution's capital measure (tier one capital) by the institution's
total exposure measure and expressed in percentage inclination. Institutions calculate the leverage ratio as arith-metic average of the leverage ratio monthly figures for a quarter. The total exposure measure is the sum total of the values of the exposures on all assets and off-balance-sheet positions which are not deducted in determining the capital measure (tier one capital).

Bul
gar
ian
Nat
iona
l Ban
k. A
nnua
l Rep
ort •
201
4
58
Credit institutions continued to maintain high levels of their liquid positions. In June 2014 after KTB and its subsidiary CB Victoria had been placed under conservatorship the banking system was exposed to a strong liquidity pressure as a result of a size-able run on deposits from the two banks. To overcome the uncertainty credit institu-tions’ liquidity was additionally strengthened. The stability of the banking sector and the entire financial system was preserved thanks both to the liquidity buffers consist-ently required by the BNB and built by banks and the additional measures launched since June. The banking system liquid assets picked up by BGN 2.2 billion on end-2013 with growth only in the second half of 2014 amounting to BGN 2 billion (10.1 per cent). By the end of 2014 they came to BGN 22.2 billion or 26.1 per cent of the bank-ing system assets.
Selected Capital Indicators(BGN million) (per cent)
Source: BNB.
Dynamics of Assets, Attracted Funds and Liquid Assets(million BGN)
Source: BNB.
Additional liquidity buffers required a higher share of immediate liquidity assets and correspondingly an increase in cash. At the end of 2014 the share of cash in the structure of liquid assets rose to 44.0 per cent. Cash on current accounts up to 7 days also exhibited growth (to 35.2 per cent). The total share of marketable securities

59
Maintaining
Banking
System
Stab
ility and P
rotection of Dep
ositor Interestsissued by central governments or central banks, and that of Bulgarian government securities (other than those for trading) accounted for 20.2 per cent.
As a result of further steps and the implementation of macro-prudential measures the banking system liquid assets ratio (the liquid assets to total liabilities ratio) continued to increase in the second half of 2014 and reached 30.12 per cent at the end of December. Banks adhered to the supervisory recommendation for not less than 20 per cent coverage of attracted funds from individuals and institutions other than credit institutions by liquid assets. The liquidity pressure was overcome and continuous growth of household and corporate deposits is indicative of the restored confidence.
2. Assessment of the Financial Performance of Financial Institutions Registered under Article 3a of the Law on Credit Institutions
In 2014 new statutory requirements for financial institutions were implemented related to the increased capital levels and greater transparency of the ownership structure. Monitoring focused on five main operation areas where their volumes exceeded the materiality threshold. The scope of financial institutions obliged to regularly provide information on their liabilities to customers was widened. With the adoption of the amendments to the regulatory framework, in the second half of 2014 a significant number of financial institutions were deleted (voluntarily and ex officio) resulting in decline of the sector’s balance sheet figure by 11 per cent compared with the end of 2013 (BGN 6.6 billion in 2013). By the end of 2014 the share assets in the monitored sector (7 per cent) went down insignificantly compared with banks’ assets. Assets of the 20 largest financial institutions (BGN 4.5 billion), mainly leasing companies, were not affected by the re-registration (BGN 4.5 billion in 2013) and their share reached 75.7 per cent (against 68.9 per cent by the end of 2013).
Structure of Assets by Group of Financial Institutions
Source: BNB.
Market shares of lending and acquisition of receivables from banks and other financial institutions, including factoring services exhibited an increase. Over the review period the structure of sector’s assets experienced no significant changes. Loans and receivables (including financial leasing) amounted to BGN 4.5 billion in 2014 and continued to decrease (by 6 per cent on 2013). The currency composition in 2014 included BGN 2.4 billion in euro (against BGN 2.5 billion in 2013) and

Bul
gar
ian
Nat
iona
l Ban
k. A
nnua
l Rep
ort •
201
4
60
BGN 2.2 billion in levs (against BGN 2.3 billion in 2013). The portfolio of loans and receivables of the 20 largest companies accounted for 77 per cent of the total financial institutions’ portfolio. The sector’s cash remained unchanged at BGN 733,000. The quality of loans and receivables on financial leasing worsened further and the amount of impairment charges also increased. The share of gross impaired loans reached 51 per cent against 48 per cent in 2013. By the end of 2014 loans (including receivables on leasing) past due over 90 days accounted for 22 per cent of the sector’s total gross portfolio (23 per cent in 2013) and 43 per cent of the volume of impaired loans and receivables (47 per cent in 2013).
Structure of Attracted Funds
Source: BNB.
The sector’s attracted funds in 2014 posted an 11 per cent decrease (BGN 4.7 bil-lion) following the annual pattern in assets. Financing by bank funds (BGN 3.5 billion) retained its leading position, reporting a decrease of resources used. The strong-est decrease was reported in the financial support from foreign banks which com-prised 81 per cent of bank resources. The share of short-term financing was sustained (42 per cent), while long-term financing of over three years contracted (26 per cent).
Distribution of Equity
Source: BNB.

61
Maintaining
Banking
System
Stab
ility and P
rotection of Dep
ositor InterestsBy the end of 2014 financial institutions’ equity amounted to BGN 1.2 billion, report-ing a decrease by 10 per cent on 2013. The negative trend was entirely driven by the huge amount of retained earnings (BGN 411 million) and current losses of leasing companies (BGN 53 million).
The 2014 the financial result amounted to BGN 96 million, down BGN 64 million on 2013. The decrease was due mainly to the loss incurred by leasing companies in the amount of BGN 53 million. The sector’s financial leverage indicator accounted for 25 per cent by the end of 2014 (against 19.2 per cent in 2013). The current liquid-ity ratio decreased from 15.6 per cent to 12.5 per cent. The ROA and ROE indicators posted a slight decrease as of December 2014.
3. Banking Supervision
In March 2014 amendments to the Law on Credit Institutions were adopted intended to align it with Directive 2013/36/ЕU of the European Parliament and of the Council on access to the activity of credit institutions and the prudential supervision of credit institutions and investment firms. These amendments and the enforcement of Regu-lation (EU) No 575/2013 on prudential requirements for credit institutions and invest-ment firms (the so-called CRD IV/CRR package), in substance, introduced the Euro-pean version of rules of the new Basel capital agreement, Basel III. The new frame-work also entailed changes to the BNB supervisory approach aimed at preserving the buffers accumulated in the banking system over years.
In April the BNB Governing Council at its meeting approved amendments to several major BNB ordinances on the banking supervision and adopted new ordinances on capital buffers and risk management in banks. Thus, ordinances were brought in line with the new EU legal framework on credit institutions’ activity established with the adoption of the CDR IV/CRR package, and with the amendments made to the Law on Credit Institutions published in the Darjaven Vestnik, issue 27 of 2014.
The new Ordinance No 7 of the BNB on Organisation and Risk Management of Banks provides for requirements on the organisation and risk management of banks, estab-lishment of a risk committee and expansion of the existing requirements and crite-ria concerning the treatment of different risk categories. The new Ordinance No 8 on Banks’ Capital Buffers provides for statutory requirements for establishing a method-ology of maintaining a capital conservation buffer, a bank-specific countercyclical capital buffer, a buffer for global systemically important institutions (G-SIIs), a buffer for other systemically important institutions (O-SIIs) and a systemic risk buffer. The BNB set the capital conservation buffer at 2.5 per cent (effective as of May 2014) and the capital buffer for systemic risk at 3 per cent for all credit institutions in Bulgaria (effective as of October 2014). In mid-November all EU partners concerned were in-formed of its activation, thereby the BNB and the Banking Supervision Department meeting the formal requirements and obligations.
As of 2014 a standardised supervisory reporting framework covering the entire re-porting of banks under the CRD IV/CRR package was launched in the EU. To facili-tate the implementation of the new requirements under Regulation (EU) No 575/2013 communication with banks was intensified and best efforts were made to provide unified practices in treatment of the key issues upon implementing the framework. In addition, in the second half of 2014 a number of issues associated with the practical implementation of the new reporting forms and samples were settled.
The major task of macro-prudential supervision and financial stability in 2014 was the analysis and assessment of risks in Bulgaria’s banking system. To this end, the appli-cability of various macro-prudential instruments used in the EU banking system were considered. A credit and liquidity risk sustainability test was carried out. The results

Bul
gar
ian
Nat
iona
l Ban
k. A
nnua
l Rep
ort •
201
4
62
were used in determining the recommended levels of liquidity buffers and maximum levels of the capital conservation buffer and systemic risk buffer in new BNB Ordi-nance No 8.
With the implementation of the macro-prudential framework in the EU in 2014, the BNB macro-prudential powers were strengthened further as part of the changes to the international regulatory environment. In the second quarter of 2014 a structural change was initiated: the financial stability analysis function was moved to the work of the Banking Supervision Department.
In 2014 the scope of macro-prudential analysis was widened by additional surveys on developments outside the banking sector which had an effect on it as a whole. Major highlights involve the effect of economic environment on the banking sector stabil-ity and the interdependence of non-bank financial sector companies with the bank-ing system. Analysis of international financial markets was further deepened in terms of risks to the environment in which the EU banks with subsidiaries and branches in Bulgaria operate.
Additional supervisory reporting was introduced in response to the liquidity pressure on the banking system and the follow-up placement of KTB and CB Victoria under conservatorship. The active monitoring involved preparing of macro-prudential rec-ommendations to credit institutions related to their business models and the potential of further strengthening capital and liquidity buffers. Additional expert reports were prepared to support some decisions on the Bulgarian banking system. These deci-sions are intended to avoid speculative trends to other credit institutions. Intensive communication with the ECB, the European Banking Authority (ЕBA) and the Euro-pean Systemic Risk Board (ЕSRB) was also an element of supervisory macro-pruden-tial analyses.
In the third quarter of 2014 a capital sustainability macro-prudential test was carried out. The test was conducted individually by applying unified methodology and shocks for all banks (the so-called bottom-up approach). Concurrently, the degree of correct-ness in performing the simulation was tested by a formal assessment of the quality of conducted stress-test (applying the top-down approach). The exercise encompassed credit, market, sovereign risk and the risk of increasing costs of financing, with ma-jor focus put on credit risk modelling. Findings based on test results confirmed the effectiveness of macro-prudential measures launched throughout the year and addi-tional measures were prescribed. The existing weaknesses in banks’ balance sheets were identified and removed. Requirements to credit institutions’ contingency situa-tions plans were tightened aiming to mobilise all potential sources where necessary.
Additional macro-prudential reporting was developed including comparable data and reporting forms with additional information. In parallel to the work on the Single Data Depository, a mechanism for accepting and verifying the new reports, and generating output information to the European Banking Authority was provided.
Supervisory reviews and assessments of individual credit institutions carried out through off-site monitoring and on-site inspections remained a priority in the bank-ing supervision activity in 2014. Special attention was paid to the dynamics of major bank operation risk and the effectiveness of the new supervisory and financial report-ing under Regulation (EU) No 575/2013. The current monitoring of banks’ financial performance continued over the review period. The results were reported in quar-terly supervisory analyses, reflecting the degree and developments of bank risks, and CAEL ratings which determined the risk profiles of individual banks. As a result of continuous monitoring of credit institutions and based on the results of the on-site inspections, the respective ratings under CAMELOS were prepared reflecting the risk degree and management of bank operations in 2013. In case of established viola-tions and malpractices at a credit institution, corrective measures were prepared and recommended to improve risk management and restore the institution’s stability and

63
Maintaining
Banking
System
Stab
ility and P
rotection of Dep
ositor Interestsreliability. In addition, a review of the quality of capital adequacy analysis was car-ried out for a one-year period in terms of capital sufficiency for covering current and future bank risks.
The on-site supervision programme entailed 11 supervisory inspections. Analysis and assessment of institutions’ risk profiles, adequacy of the systems of monitoring and control over risks, capital sufficiency, profitability, liquidity and compliance with the regulatory framework were the starting points of on-site inspections.
Inspectors found 36 formal violations to the banking statutory framework, 118 rec-ommendations were made to banks’ managements for improving operations and risk management. The bulk of found breaches reflected the incorrect identification and measurement of risk in individual risk exposures and their impairment, failure to pro-vide financial reports, plans and other information for supervisory purposes in due course, non-compliance with supervisory regulations. In parallel with the review of KTB assets by three audit firms (Deloitte Audit OOD, AFA OOD and Ernst & Young Audit OOD), between 7 July 2014 and 14 October 2014 an on-site supervisory in-spection based on data as of 30 June 2014 was conducted at the bank intended to give replies to particular BNB requests. The inspection, including 22 experts from the Banking Supervision Department, was intended to review (in particular complemen-tary stages) the credit transactions and completeness of credit files from the sam-ple; to trace cash flows in relation to utilisation of the funds extended on these credit transactions and over their service; the probable relatedness between the borrowers of the bank’s loan portfolio; origin of the funds for an increase of the shareholders’ eq-uity and other equity instruments included in the institution’s capital. For the purpose of performing this task, a review was made of the movements of funds on current and loan accounts of 91 borrowers having 208 loans with gross pre-impairment amount accounting for 67 per cent of the bank’s loan portfolio as of 30 June 2014. A signifi-cant share of the sample was comprised of investment loans, including for purchase of shares or units of third parties. The analysis of cash flows over the review period included tracing of flows of funds on credit and current accounts of borrowers (over 1000). This covered different periods of time (in particular cases the analysis covered periods of 7–10 years). A report on the purpose, scope and conclusions from the su-pervisory inspection at KTB was submitted for information to the Members of Parlia-ment of the 43rd National Assembly of the Republic of Bulgaria.65
Inspectors conducted five inspections in two banks aimed at assessing their pre-paredness to apply the Internal Ratings Based Approach for regulatory purposes. The assessments include one initial and four follow-up on-site inspections with 62 recommendations issued. The inspected credit institutions fulfilled the bulk of the recommendations and some of them are in progress. As a result, after a common de-cision between the BNB and the competent body in charge of the supervision over the bank group had been taken, one subsidiary was permitted to apply the Inter-nal Ratings Based Approach for capital requirements (including for three exposure classes not applying own estimates for LGD66 and CCF67; for one exposure class ap-plying own estimates for all parameters; for one exposure class applying the PD/LGD approach68).
Cooperation and information exchange among colleges of supervisors, in which the BNB took part as a competent authority responsible for supervision over subsidiaries representing parts of European bank groups, continued over the review period. To
65 The report is published on the BNB website at:(http://www.bnb.bg/PressOffice/POPressReleases/POPRDate/PR_20141027_EN).
66 Loss given default – a loss that occurs in the event of default, i.e. for potential risk of customer, is a summary indi-cator in risk valuation models and in computing the total required capital, expected loss or regulatory capital of a bank under Basel II requirements.
67 Credit conversion factor – a ratio used to translate off-balance sheet items to bank's balance sheet items with re-gard of risk valuation.
68 Probability of default/loss given default approach – a method of calculating the volume of risk-weighted exposures in capital instruments.

Bul
gar
ian
Nat
iona
l Ban
k. A
nnua
l Rep
ort •
201
4
64
this end, 11 risk assessments for 2013 were prepared, comprising a part of the summarised information required for making common decisions on liquidity and capital adequacy of a bank and a bank group.
To ensure operation of the banking sector as a reliable environment preventing the transfer of criminal funds through the financial system was among the important issues in which the BNB is involved both at a national and EU level. In the course of planned inspections of credit institutions the adequacy of prevention controls was reviewed. Inspectors paid special attention to extended due diligence measures in correspondent relations with third countries, high-risk customers and political persons. The results reported strong commitment of banks’ management bodies in building safeguard mechanisms. However, resources for operation of specialist services responsible for implementing statutory requirements remained insufficient. There were isolated breaches of the Law on the Measures against Money Laundering and the BNB took the measures provided for by law.
The methodology of periodic analysis of the legal structure and the financial state of banks’ shareholders was improved with the inclusion of additional criteria providing monitoring in wider time horizon.
Joint inspections with the Financial Supervision Commission established immaterial omissions in the applied trust procedures. In addition to the assistance provided by the BNB in developing instructions for conducting regular tests of the deposit insur-ance system, the Bank continued to check the compliance with the Law on Bank De-posit Guarantee provisions. The implementation of the recommended corrective ac-tions was also inspected and the Deposit Insurance Fund was informed of the results in due course.
Interaction with judicial authorities and investigation units remained as intensive as in the previous year. Joint inspections with the Financial Intelligence Directorate to the State Agency of National Security were carried out. Within the interministerial co-ordination mechanism meetings were held and opinions expressed on EU sanctions applied to particular states and the direct effect at a national level was considered. Communication on UN resolution-related issues continued.
Amendments to Ordinance No 26 on Financial Institutions provided for an increase in capital levels, requirements for disclosing the actual owners and additional criteria for the reputation of managing and qualified owners. The adopted changes aimed at improving market discipline and ensuring transparency of the ownership structure.
No new procedures for licensing credit institutions were opened in 2014.
The period under review saw significant changes in the shareholder structure of sev-eral banks. Shareholders with qualifying holdings in the First Investment Bank ac-quired in concerted action a common equity interest exceeding 50 per cent of voting shares, thereby exercising control over the bank. On the ground of a request depos-ited by KTB and a complete set of documents submitted under Ordinance No 2 of the BNB, the KTB was permitted to acquire all shares of Crédit Agricole, Bulgaria and to change its name to Commercial Bank Victoria EAD. Following a participation in the capital increase of D Commerce Bank, Fortera EAD Company acquired an equity in-terest exceeding 33 per cent of the capital of this bank. After the amendments to the statutory requirements for registration of financial institutions had been adopted, Pro-Credit Bank (Bulgaria) started transforming its subsidiary, ProLease (Bulgaria) EAD, through a takeover, which ceased its activities without liquidation.
Over the review period six banks, CIBANK, ProCredit Bank (Bulgaria), First Invest-ment Bank, UniCredit Bulbank, UBB and Eurobank Bulgaria redeemed in advance their obligations on tier two capital instruments. Corporate Commercial Bank included subordinated term debt in its tier two capital, with the permit thereof being subse-quently revoked by Resolution No 137 of the BNB Governing Council of 6 November

65
Maintaining
Banking
System
Stab
ility and P
rotection of Dep
ositor Interests2014 due to established non-compliance of the origin of funds used with the require-ments of Council Regulation No 575/2013 of the European Parliament.
The past 2014 saw serious changes in management bodies of some credit insti-tutions. Members of the management bodies of the Bulgarian Development Bank changed twice. First Investment Bank and Texim Bank made significant changes to their management boards and another 20 banks initiated minor changes to their man-agement bodies. After the term of conservatorship had expired CB Victoria opened for operations with a changed management structure (from two-tier to one-tier) with five new members in the Board of Directors.
Sixteen Member State credit institutions notified the BNB of their intent to provide cross-border services in Bulgaria. The number of these institutions reached 246. No new foreign bank branches from EU Member States were opened in Bulgaria.
The past 2014 saw the launch of serious supervisory measures: placement of Corpo-rate Commercial Bank and Crédit Agricole, Bulgaria under conservatorship, revoca-tion of the license of Corporate Commercial Bank to conduct bank operations due to insolvency. In addition, in 2014 a supervisory measure was imposed on one bank with an order containing instructions for actions removing the violations established by the supervisory inspection, and three other banks received prescriptions and recommen-dations for improving risk management and overall activity. Most often problems were associated with management of credit and concentration risk, market and operational risk, the ability to generate profit, state of the capital, the quality of institutions’ inter-nal control management.
In 2014 the BNB continued to receive claims from bank customers and financial in-stitutions. The resolution of claims concern the competence of the Commission on Consumer Protection. The BNB initiated the relevant actions to inform the Commis-sion and resolve the problems specified in the claims in due time. The crisis with KTB and its subsidiary Crédit Agricole, Bulgaria (later renamed to CB Victoria) caused problems to customers of these banks which became the major reason of complaints. Following the revocation of the license of KTB and the recovery of operations of CB Victoria, claims were gradually decreasing.
In September the BNB started work on a study of EBA intended to analyse the following issues: а) organisational structure, strategy and supervision at the BNB; b) supervisory approaches and methods used; c) supervision of banks, and d) international supervisory cooperation. Establishing the adequacy of supervision both over domestic banks and international banks conducting operations in Bulgaria via their branches and/or subsidiaries was the major objective of the study. The study finished in November and the BNB submitted to EBA a completed detailed questionnaire for analysis and evaluation on the basis of which EBA will probably prepare its recommendations.
As a result of the BNB request of August 2014 for organising a mission of the IMF and World Bank for Bulgaria under the Financial Sector Assessment Program (FSAP), in December the BNB received the required documents for the preparation of the mis-sion. The first stage of the work started at the end of the second half of 2014 and included a preliminary detailed analysis of the Basel principles of effective banking supervision applied by the BNB.

Bul
gar
ian
Nat
iona
l Ban
k. A
nnua
l Rep
ort •
201
4
66
VII. The Central Credit Register
The Bulgarian National Bank maintains an information system on customer debt to Bulgarian banks, other financial institutions, and payment and electronic money in-stitutions. BNB Ordinance No 22 on the Central Credit Register regulates CCR terms, procedures, and information flows. The CCR provides uniform centralised borrowing information to participants. It lists all bank, financial, payment, and electronic money institution loans, irrespective of amount. In 2014 amendments to the Law on Credit Institutions (Darjaven Vestnik, issue 27 of 25 March 2014) opened the Register to participation by companies who sell sureties, buy debt, and offer factor, forfait, and other finance.
The Central Credit Register lists all loans disbursed by its participants, consolidating information collected for BNB purposes. CCR statements cover loan status, arrears, repaid loans for five years back, and borrower histories.
At the end of 2014 the CCR had 204 participants: 29 banks, 174 financial institutions, and one payment institution. Ten financial institutions joined in 2014 and 19, plus a bank, left under Ordinance No 22 Articles 8 and 9 upon closure and deletion from the Banking Supervision Department public register. Changes continue as institutions fail-ing to reregister under the Law on Credit Institutions amendments, § 80, paragraph 4 leave the CCR, alongside those denied reregistration.
As of 31 December 2014 the CCR listed 4,053,000 loans with a balance sheet expo-sure of BGN 63,673 million. The 2,117,000 borrowers included 2,014,000 individuals, 92,000 legal entities, 4000 non-domiciled foreigners, and 7000 self-employed peo-ple. Individuals (66.06 per cent) tended to owe under BGN 5000, while legal entities (35.71 per cent) tended to owe BGN 5000 to 50,000. Men were 53 per cent of the in-dividuals and women 47 per cent, most borrowers aged 30 to 50.
Number of Loans to Individuals as of 31 December 2014 by Borrower Sex and Age
Source: BNB.
Information collected and provided by the CCR is an important indicator for assessing creditworthiness. The access to these data helps CCR participants analyse and allay credit risk. Credit history is crucial in mitigating the risk of bad loans in creditors’

67
The Central C
redit R
egister
portfolios and safeguarding asset quality in the Bulgarian financial system and financial stability.
In 2014 banks, financial, payment, and electronic money institutions con-ducted 5,775,000 searches on 4,567,000 individuals and 1,208,000 legal entities: 481,000 monthly searches on average.
Number of CCR Searches(number)
Source: BNB.
Ordinance 22 governs individual and legal entity debt disclosure. It grants individu-als one free access to CCR data a year. In 2014 there were 8756 access applications: 8517 by individuals and 239 by legal entities.
CCR Statement Applications(number)
Source: BNB.
The Law on Credit Institutions Chapter VIII Bank and Professional Confidentiality obliges the BNB to provide CCR data to judicial and government authorities.
The CCR has a modern information system. Exchanges with ESCB credit registers keep it abreast of technological and methodological developments in data collection and handling. The Register also works with the ECB, the World Bank, the IMF, and other international organisations.
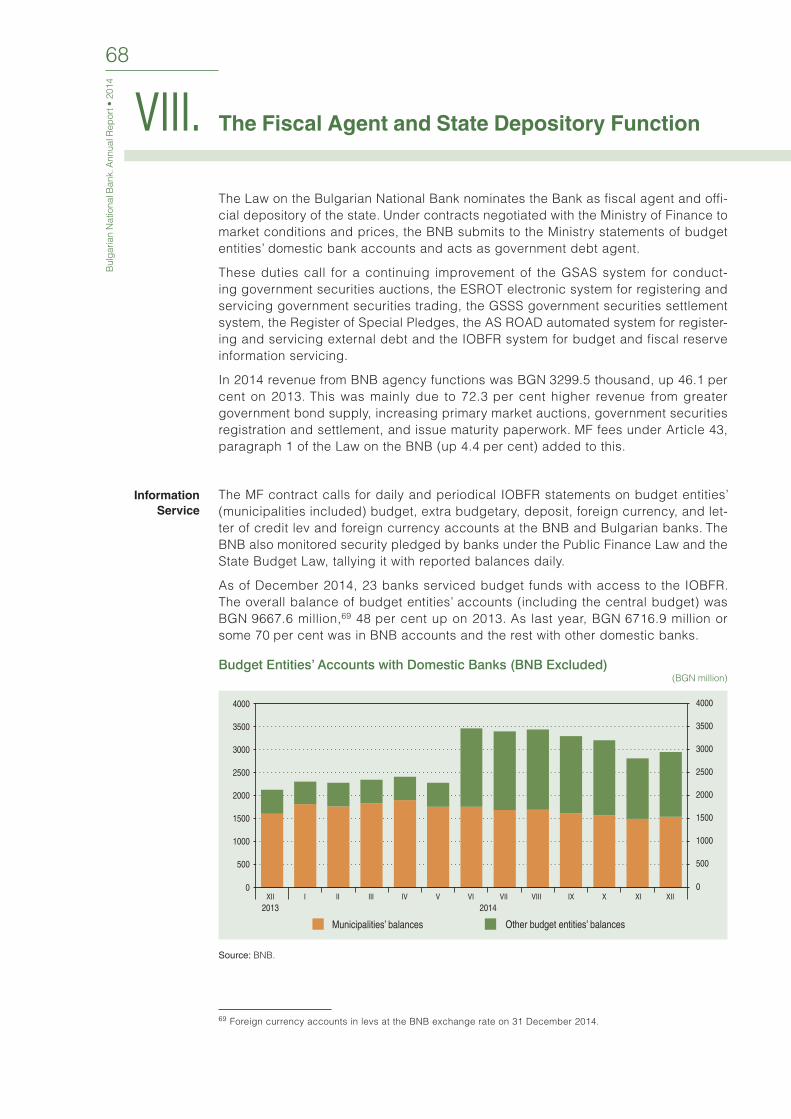
Bul
gar
ian
Nat
iona
l Ban
k. A
nnua
l Rep
ort •
201
4
68
VIII. The Fiscal Agent and State Depository Function
The Law on the Bulgarian National Bank nominates the Bank as fiscal agent and offi-cial depository of the state. Under contracts negotiated with the Ministry of Finance to market conditions and prices, the BNB submits to the Ministry statements of budget entities’ domestic bank accounts and acts as government debt agent.
These duties call for a continuing improvement of the GSAS system for conduct-ing government securities auctions, the ESROT electronic system for registering and servicing government securities trading, the GSSS government securities settlement system, the Register of Special Pledges, the AS ROAD automated system for register-ing and servicing external debt and the IOBFR system for budget and fiscal reserve information servicing.
In 2014 revenue from BNB agency functions was BGN 3299.5 thousand, up 46.1 per cent on 2013. This was mainly due to 72.3 per cent higher revenue from greater government bond supply, increasing primary market auctions, government securities registration and settlement, and issue maturity paperwork. MF fees under Article 43, paragraph 1 of the Law on the BNB (up 4.4 per cent) added to this.
The MF contract calls for daily and periodical IOBFR statements on budget entities’ (municipalities included) budget, extra budgetary, deposit, foreign currency, and let-ter of credit lev and foreign currency accounts at the BNB and Bulgarian banks. The BNB also monitored security pledged by banks under the Public Finance Law and the State Budget Law, tallying it with reported balances daily.
As of December 2014, 23 banks serviced budget funds with access to the IOBFR. The overall balance of budget entities’ accounts (including the central budget) was BGN 9667.6 million,69 48 per cent up on 2013. As last year, BGN 6716.9 million or some 70 per cent was in BNB accounts and the rest with other domestic banks.
Budget Entities’ Accounts with Domestic Banks (BNB Excluded)(BGN million)
Source: BNB.
69 Foreign currency accounts in levs at the BNB exchange rate on 31 December 2014.
Information Service

69
The Fiscal Ag
ent and S
tate Dep
ository FunctionAccount balances of budget entities70 outside the central bank rose 38.3 per cent on 2013. As in prior years, five banks held over 70 per cent of this.
Some 84 per cent of budget funds at the BNB and other domestic banks formed the fiscal reserve’s liquid part71: BGN 8117.0 million as of 31 December. Of this, BGN 3846.9 million was in dedicated funds: the State Fund for Guaranteeing the Sta-bility of the State Pension System or Silver Fund, the MF National Fund, the Agricul-tural State Fund Paying Agency, and the Teachers’ Pension Fund.
Fiscal Reserve Structure(BGN million)
Source: BNB.
In line with the commitments assumed and standing joint instructions by the Minister of Finance and the BNB Governor72, the BNB prepared 989 statistical budget report-ing forms, including 313 on fiscal reserve accounts, up 8 per cent on 2013. The rise reflected MF needs for additional daily statements of budget entities’ BNB accounts.
AS ROAD logs government foreign financial obligations which the BNB calculates and pays.73 Upon MF advice, the system registered a EUR 1493.0 million Eurobonds issue on international capital markets, the EUR 67.0 million sixth tranche of the gov-ernment’s credit agreement with the European Investment Bank, and a EUR 1494 million bridge loan. The MF cleared 38 regular payments of EUR 205.3 million,74 in-cluding EUR 62.0 million principal and EUR 143.3 million interest. As of 31 December AS ROAD listed EUR 6134.5 million of obligations,75 more than twice as much as the EUR 3031.3 million a year earlier. Euro-denominated debt again led at 85.2 per cent, followed by USD and JPY at 14.6 and 0.2 per cent.
As in 2013, the MF held 30 scheduled and one unscheduled government securities auctions.76 They offered 11 issues: seven short and two each medium and long-term. The average weighted residual term to maturity of sold issues was one year and ten months.
70 Including central budget accounts. 71 The Law on Public Finance Additional Provisions, § 1, item 41 defines the fiscal reserve as the sum of budget en-
tities’ bank accounts (excluding municipalities and their budget spending units), other assets, and claims on EU funds.
72 New joint instructions by the Minister of Finance and the BNB Governor under the 2014 State Budget Law Article 96 instruct banks to produce daily information on budget entity accounts and related security pledges.
73 Under the government debt agency agreement between the BNB and MF.74 Payments total in euro at the BNB rate for 31 December 2014.75 Debt total in euro at the BNB rate for 31 December 2014.76 In 2014 the MF amended schedules by holding an unscheduled five-month issue auction in June, shelving auc-
tions in July, moving two December auctions forward to November, and holding two unscheduled short-term euro issue auctions in December.
Servicing Government
Securities Trading

Bul
gar
ian
Nat
iona
l Ban
k. A
nnua
l Rep
ort •
201
4
70
The MF offered BGN 5793.3 million of government securities for sale. Almost 73 per cent of bids or BGN 8435.5 million were by banks, with BGN 3135.2 million by other institutions. Private pension funds were among the most active with 15.6 per cent of bids, followed by the Bulgarian Deposit Insurance Fund with 4.2 per cent, and insurance corporations with 2.6 per cent. Sold government securities came to BGN 5471.8 million, including the lev equivalent of EUR 945.0 million, or 94.5 per cent of the scheduled volume.77 Primary and non-primary dealer banks bought over two thirds of this.78 Average annual yields of lev-denominated three, five, six and nine-month, one, 2.5, five and 10.5-year issues were 0.5, 1.9, 0.6, 0.6, 0.8, 1.3, 2.2 and 3.4 per cent, euro-denominated nine-month, one and seven-year issues reaching 0.6, 0.8 and 2.4 per cent.
Average Annual Yield Attained at Domestic Government Securities Auctions in 2014(per cent)
Note: Yield for the 23 June 2014 2.5-year bond auction where the MF rejected all bids is shown at the offered value.
Source: BNB.
ESROT registered BGN 3760.5 million79 of due corporate payments on behalf and on the account of the issuer, up BGN 2517.4 million on last year. Reflecting BGN 1948.7 million of positive net government bond financing, ESROT registered BGN 8251.8 mil-lion of transactions, up 31.2 per cent on end-December 2013. In bond currency structure, BGN issues redeemable in levs continued occupying the largest share at 55.8 per cent, followed by EUR issues redeemable in euro at 42.3 per cent and EUR and USD issues redeemable in levs at 1.9 per cent. The maturity structure changed, medium and long-term issues falling from 95.2 per cent in 2013 to 77.4 per cent in favour of up to one-year issues.
Nominal ESROT transactions volume was BGN 43 904.2 million, up 15 per cent on 2013. Repos had the largest share at 78.5 per cent, overnights (largely lev-denomi-nated) dominating at 57.3 per cent. The overall average weighted yield of repos rose on 2013 to between 0.03 and 0.08 per cent. Eight to 30-day transaction yields fluctu-ated more significantly.
77 The MF rejected all bids at a June auction and decreased the initial volume at another auction.78 There were 12 primary dealers under Ordinance No 15 of the MF and BNB as of 31 December 2014. 79 Payments on foreign currency denominated government securities issues shown in levs at the BNB rate on the day
of payment.

71
The Fiscal Ag
ent and S
tate Dep
ository FunctionVolume of Transactions in Tradable Government Securities
(BGN million)
Source: BNB.
Bond sales and purchases were BGN 9421.6 million, up BGN 3743 million on 2013. Operations with bank participation were BGN 8004.3 million and between ESROT par-ticipants’ customers BGN 1417.3 million. The latter segment occupied 21.5 per cent of the market, rising 6.6 per cent on last year. Securities were traded across the yield curve, with BGN and EUR-denominated bonds with residual terms of about five years most liquid. Average annual yield of the long-term benchmark issue (10.5 years) fell gradually from 3.56 in January to 2.96 per cent in December, unlike the previous year when it rose from 3.27 to 3.43 per cent. Secondary government securities market li-quidity ratio was 5.29 from 6.08 in 2013.80
Holders of Government Securities Issued in the Domestic Market
Source: BNB.
Blocking and unblocking operations in domestic government securities registered in ESROT and related to securing funds in budget entities’ bank accounts and on regis-tered pledges under the Law on Special Pledges totalled BGN 20,858.8 million from BGN 23,001.7 million in 2013.
80 The ratio between the volume of secondary market government bond transactions concluded for a year and the volume of circulating government securities by the year’s end.

Bul
gar
ian
Nat
iona
l Ban
k. A
nnua
l Rep
ort •
201
4
72
Government securities in bank portfolios rose sharply by BGN 1786.4 million on 2013. Bond investment by insurance corporations and pension funds rose BGN 513 million, 84 per cent of that in long-term government bonds.
ESROT offered 99.8 per cent availability,81 invoking no contingency rules for interac-tion between BNB systems. The number of system participants (banks, an interna-tional central securities depository, the Reserve Collateral Pool, and the MF) remained unchanged.
As of 31 December 2014 there were 1326 accounts under BNB Ordinance No 31. Of them, 29 were for government securities of the issuer (the MF), 889 for participants’ government securities portfolios, including 349 in encumbered bonds, and 408 for participants’ clients. Account nominals tallied with the amount of outstanding issues at BGN 8251.8 million.
Joint on-site inspections under the MF and BNB Ordinance No 15 checked ESROT participants performing sub-depository functions for clients. There were no breaches of relevant statutory instruments.
At the end of 2014 consultations on the domestic sovereign debt market develop-ment, including trading and settlement systems, began with the issuer and market participants under Regulation (EU) No 909/2014 of the European Parliament and the Council of 23 July 2014 on improving securities settlement in the European Union and on central securities depositories (CSDR) and regulatory and implementing techni-cal standards.
81 See footnote 43.
System Development

73
Particip
ation in the ES
CB
and in the A
ctivities of EU
Institutions
IX. Participation in the ESCB and in the Activities
of EU Institutions
In 2014 the EU focused on economic growth recovery and rebuilding confidence in the financial system. Following the late 2013 conferral of set credit institution pru-dential supervision tasks on the European Central Bank, there was agreement on the other elements of the banking union: the Single Resolution Mechanism (SRM) and the European Stability Mechanism’s operational framework for direct bank recapitali-sation. Legislation on credit institution and investment firm recovery and resolution, deposit guarantee, and consumer protection in residential property credit improved financial security and transparency.
The BNB Governor sits on the ECB General Council with EU central bank governors and the ECB President and Vice President. The five 2014 ECB General Council sessions focused on the ECB Convergence Report, economic developments and the EU financial sector, the ESCB supervisory macroeconomic research network final report, and the ECB report on EU members outside the euro area.
BNB representatives sit on 12 ESCB committees82, 36 committee working groups, and the Human Resources Conference (HRC). Through them, the Bank helps elabo-rate ECB legal instruments on monetary and banking policy, payment and settlement, statistics and research, and other central banking issues. The Bank helped formulate ECB opinions for written consultations with Member States on relevant bills. Consul-tations between the Bank and the ECB involved a bill on non-bank institutions lend-ing to consumers, and draft amendments to the Law on Credit Institutions to increase transparency and public awareness in bank resolution and license revocation. The BNB also consulted the ECB on draft amendments to the Law on Bank Deposit Guar-antee which would breach the Treaty on the Functioning of the European Union by obliging the BNB to finance the Bulgarian Deposit Insurance Fund, impair BNB insti-tutional and financial independence, and prejudice its functional autonomy.
Given the increasing significance of ESCB credit register information, the ECB Analyt-ical Credit Datasets Project (AnaCredit) aims to collect and centralise granular credit data. This involves harmonising databases and legislations. The central bank credit register working group, whose member the BNB Central Credit Register is, helps the Financial Stability Committee develop the AnaCredit legislative framework.
The BNB Governor is a member of the European Systemic Risk Board (ESRB) General Council. The Board continued to analyse potential risks to EU financial stability stemming from an unven economic recovery in the context of low interest rates, high non-bank sector’s indebtedness and search for higher returns by financial agents. The General Council focused on procedures for ESRB opinions and recommendations under CRD IV/CRR83, European Banking Authority and European Insurance and Occupational Pensions Authority stress test scenarios for banks and insurance corporations, and the impact of the Ukraine crisis on Europe’s financial sector.
82 The Accounting and Monetary Income Committee (AMICO), the Financial Stability Committee (FSC), the Banknotes Committee (BANCO), the Eurosystem/ESCB Communications Committee (ECCO), the Information Technology Com-mittee (ITC), the Internal Auditors’ Committee (IAC), the International Relations Committee (IRC), the Legal Commit-tee (LEGCO), the Market Operations Committee (MOC), the Monetary Policy Committee (MPC), the Payment and Settlement Systems Committee (PSSC), the Statistics Committee (STC).
83 Directive 2013/36/EU of the European Parliament and of the Council of 26 June 2013 on access to the activity of credit institutions and the prudential supervision of credit institutions and investment firms, amending Directive 2002/87/EC and repealing Directives 2006/48/EC and 2006/49/EC and Regulation (EU) No 575/2013 of the Euro-pean Parliament and of the Council of 26 June 2013 on prudential requirements for credit institutions and invest-ment firms and amending Regulation (EU) No 648/2012.
European System
of Central Banks
European Systemic
Risk Board, European
Banking Authority,
Colleges of Supervisors

Bul
gar
ian
Nat
iona
l Ban
k. A
nnua
l Rep
ort •
201
4
74
BNB representatives on the General Council and sub-structures84 promoted Bank positions. The ESRB recommended guidelines on countercyclical capital buffers to bolster banks against stressful episode losses. Consistent with Directive 2013/36/ЕU, the recommendation is for a common supervisory approach to setting countercyclical buffer levels. The BNB shares the opinion that the leeway the recommendation gives national authorities in setting buffers aligned with domestic financial systems is most welcome.
In line with the 2012 recommendation, the BNB reported to the ESRB on improve-ments in credit institution liquidity and financing risk management in cases of encum-bered assets. The BNB also coordinated a report on response to 2013 ESRB recom-mendation on intermediate macro-prudential policy objectives and instruments with the Financial Supervision Commission and the MF.
BNB experts on all EBA committees and most working groups helped develop in-structions and technical standards supplementing and defining the directive and reg-ulation on taking up and pursuit of the business of credit institutions and minimum capital requirements. A major EBA thrust on the Single Supervisory Mechanism (SSM) enjoyed active help from supervisors outside the euro area. The BNB joined in the EU coordinated SSM asset quality review by assessing local subsidiaries of euro area banks. The BNB is an observer on the new EBA Resolution Committee under the new directive on credit institution and investment firm recovery and resolution, pending transposition into Bulgarian legislation.
The BNB took active positions on all proposed euro area banking union instruments. Established in 2013, the SSM launched operations across the euro area on 4 Novem-ber 2014, the ECB assuming direct supervision over the largest euro area banks. De-bate on the SRM and SRF legal instrument (the second banking union pillar) ended in the first half year. Euro area countries agreed on a single resolution fund with national contributions. BNB and government representatives negotiated on non-euro area mat-ters. Provisions for countries joining the SSM and SRM later are most important to Bulgaria. The focus was on clear and adequate banking union mechanisms allow-ing appropriate participation by both euro area countries and those outside it. All EU members save Sweden and the UK signed the agreement in May, adopting the SRM regulation in July. Mandatory for euro area members, SSM and SRM membership is open to non-members. SRM provisions on resolution plans, information, and coopera-tion with national authorities apply from 2015. Those on planning, early intervention, actions and instruments, and loss bearing by shareholders and creditors apply from 2016, given contribution to the fund. The agreement enters into force upon ratification by 90 per cent of the weighted vote of SSM and SRM participants.
The year saw adoption of other essential acts relevant for all EU Member States: Directive 2014/59/EU of the European Parliament and of the Council of 15 May 2014 establishing a framework for the recovery and resolution of credit institutions and investment firms and Directive 2014/49/EU of the European Parliament and of the Council of 16 April 2014 on deposit-guarantee schemes. The former directive creates a framework for dealing effectively with unsound or failing institutions so that they could be restructured to avoid a significant adverse effect on the rest of the financial system. It introduces possible resolution tools used in individual stages of this process: preparatory work and precautionary measures, an early intervention phase and a resolution process. With a view to effectively apply the resolution tools, Member States should establish a resolution financing arrangement on the basis of advance bank contributions. The latter directive harmonises the EU rules to improve depositor protection, shortens payment time frames, makes depositor information more
84 Bank representatives work in the ESRB General Council, Advisory Technical Committee, three working groups, and target groups.
European Council,
Ecofin Council and
Economic and Financial
Committee

75
Particip
ation in the ES
CB
and in the A
ctivities of EU
Institutionscomprehensive, and tightens financing requirements, including through contributions, reflecting the risk profile of credit institutions. At a national level, the BNB and the Bulgarian Deposit Insurance Fund prepared draft amendments transposing new requirements into Bulgarian law.
In early 2014 Ecofin approved European Parliament amendments to the residential property credit agreement directive, clearing the way to adoption. The instrument harmonises mortgage lending, makes the European credit market more transparent and reliable, boosts consumer protection, and encourages responsible lending and borrowing. The BNB helped debate it and draft legislation to transpose it into Bulgar-ian law.
Debate on payment service legislation continued. The package includes a new direc-tive on internal market payments and a regulation on card payment interchange fees. It incorporates online payments and boosts consumer protection in transfers outside the EU and in currencies other than euro. In December Ecofin adopted a general approach on the directive. Given BNB payment systems experience, Bank experts helped debate the package in the Council’s Financial Services working group. Sub-stantial progress was made on the Regulation on interchange fees for card-based payment transactions to overcome barriers to national payment markets by introduc-ing a maximum amount of interchange fees and a ban on additional charges for con-sumer debit and credit card payments.
The BNB continued contributing to the work of the Economic and Financial Committee. Major topics included banking union elements, progress towards SSM and SRM operational structuring, and long-term financing for the European economy. The Committee addressed the pan European stress test, the bank asset quality review, and national fiscal and macroeconomic policy surveillance. It assessed EU financial system stability, discussed the EC review of the European System of Financial Supervision, and European Commission and ECB regular convergence reports on the past two years’ progress by EU members outside the euro area.

Bul
gar
ian
Nat
iona
l Ban
k. A
nnua
l Rep
ort •
201
4
76
The Law of the Bulgarian National Bank entitles the Bank to participate in international organisations furthering currency, monetary, and credit policy cooperation. Where Bulgaria participates in international financial institutions, the BNB is government fis-cal agent and depository.
The Bulgarian National Bank holds equity in the Bank for International Settlements (BIS). The BNB Governor sat on BIS central bank governors’ bimonthly meetings: a major forum for cooperation and debate on world economic development and pros-pects, and international financial markets. At the Annual General Shareholder Meeting in late June 2014, the BIS Governors allocated net profit, the BNB receiving a EUR 1.9 million dividend.
The Governor represents Bulgaria as member on the IMF Board of Governors. BNB representatives attended the regular meeting of the IMF group and the World Bank’s Netherlands Constituency at The Hague in May 2014. Discussions focused on chal-lenges to monetary policy, economic growth, employment, and the energy sector. Bulgaria announced its invitation to host the meeting in 2015. The BNB Governor sat on the 10 to 12 October 2014 International Monetary Fund and World Bank Annual Meetings. There were meetings with senior management teams from the two institu-tions and international bank representatives.
In January 2014 the BNB paid its annual contribution of USD 8500 to the International Accounting Standards Committee Foundation and USD 10,000 to the Group of Thirty.
The BNB continued stepping up cooperation with Western Balkan central banks and backing their EU accession preparations. September saw the end of BNB partici-pation in an EU financed ECB managed technical cooperation programme with the Western Balkan central banks under which it assisted the Bank of Albania on financial stability. In May representatives of the Kosovo Central Bank and Ministry of Finance studied Association Agreement experience at the BNB. The visit enjoyed United Na-tions Development Programme help through the Ministry of Finance.
Helping step up regional cooperation, the BNB also participates in the Central Asia, Black Sea Region, and Balkan Countries’ Central Bank Governors’ Club. In June it hosted the Club’s 31st meeting which changed the Statute and welcomed new mem-bers Slovenia and Croatia.
Upon a BNB technical assistance request, World Bank representatives shared their experience on supervisory treatment of non-performing and restructured loans. Bank supervision experts received training on the practical application of the World Bank Financial Projection Model.
X. International Relations
International Financial
Institutions
Cooperation and Technical
Assistance with Central
Banks

77
Statistics XI. Statistics
The BNB collects, compiles and publishes statistics under Article 42 of the Law on the Bulgarian National Bank and Article 5 of the Statute of the ESCB and the ECB. The Bank also provides statistics to the European Systemic Risk Board (ESRB) under 2009 amendments to Regulation (EC) No 2533/98. The BNB continued to ensure reli-able and sound statistical information.
In 2014 the BNB continued preparing for the new European System of Accounts (ESA 2010)85 and other international statistical standards.
In monetary and interest rate statistics, the Bank continued collecting and disseminat-ing MFI balance sheet data and household and corporate deposit/loan and long-term interest rate for assessing convergence.
In line with additional statistical information user requirements and ESA 2010 imple-mentation, preparations for extended methodological guidelines and reporting forms in monetary and interest rate statistics, and statistics of investment funds and finan-cial vehicle corporations engaged in securitisation transactions continued over the review year.
The guidelines are governed by Regulation (EU) No 1071/2013 concerning the bal-ance sheet of the monetary financial institutions sector, Regulation (EU) No 1072/2013 concerning statistics on interest rates applied by monetary financial institutions and Regulation (EU) 1075/2013 concerning the assets and liabilities of financial vehicle corporations engaged in securitisation transactions.
The BNB also gathers and publishes statistics on non-bank financial institutions. Regulation (EU) No 1374/2014 of the European Central Bank on statistical reporting requirements for insurance, adopted at the end of the year, is due for transposing into Bulgarian law.
The BNB continued providing data and working on the additional structural and con-tents requirements of the ECB project to expand the Register of Institutions and Affili-ates Database (RIAD).
In September the BNB began sending the ECB and Eurostat information revised to the Sixth Balance of Payments and International Investment Position Manual (IMF, 2008) and the Fourth OECD Benchmark Definition of Foreign Direct Investment (2008). The Sixth Balance of Payments Manual significantly changed definitions and presenta-tions of balance sheet and international investment items.
Governing Council adoption of Ordinance No 27 on 13 March 2014 aligned external sector statistics with latest international and EU regulations. The Ordinance also cov-ers securities information scope, type, and reporting deadlines. It cuts the report-ing burden on corporates and sole proprietors. From 1 April 2014 only loans over BGN 500,000 are subject to quarterly reporting; there was no such threshold before. Loans of BGN 50,000 to 500,000 are reported annually. Receivables and obligations on trade credit and other transactions over BGN 200,000 are reported quarterly, up from BGN 50,000. The Ordinance allows electronic reporting.
Work continued on the ESCB Centralised Securities Database project and a Bulgarian securities database. As ESCB member, the BNB continued participating in the Securi-ties Holdings Statistics project, important for other statistics and financial stability analyses.
85 Regulation (EU) No 549/2013 of the European Parliament and of the Council on the European System of National and Regional Accounts in the European Union (ESA 2010).

Bul
gar
ian
Nat
iona
l Ban
k. A
nnua
l Rep
ort •
201
4
78
In quarterly financial accounts, the BNB began providing the ECB with information to ESA 2010 requirements. The Bank compiles and disseminates quarterly General Government financial accounts under Regulation (EC) No 501/2004 of the European Parliament and of the Council of 10 March 2004 on quarterly financial accounts for general government, as well as data for government finance statistics to ECB requirements86.
Work on ESA 2010 and other projects continued with the National Statistical Institute (NSI). Joint working groups finished analysing and listing holding corporations and head offices for reclassification in line with ESA 2014 methodological requirements.
The BNB and NSI launched a quarterly statistical survey of non-financial corporation financial indicators. The Bank needs the information for quarterly economic sector financial accounts, financial stability analyses, and European Systemic Risk Board commitments.
IMF requirements and the dissemination schedule called for updates and meta-data certification under the Special Data Dissemination Standard with NSI and MF participation.
The IMF, Eurostat, and the Bank for International Settlements also received relevant statistics.
Work on the Integrated Automated Statistical Information System (IASI) continued. In June a portal launched for electronic submission of statistical information. Over 5000 external consumers registered in the first six months of its operation, cutting their reporting burden. The system allows for automated control, processing, and dissemination of statistical information for greater reliability and quality.
The BNB started transmitting data in the SDMX-ML format to ECB and Eurostat requirements.
86 ECB Guideline of 25 July 2013 on government finance statistics (ECB/2013/23).

79
Research XII. Research
Economic research, Bulgari an economic analyses, and macroeconomic forecasting by BNB experts support the Bank’s management in making decisions and formulating economic policy.
Specialised research under the 2013–2014 BNB Research Plan supported the BNB operations by analysing set economic processes and issues and improving forecast-ing and modelling tools. Research results featured in technical reports and seminars held by the Bank for experts from relevant bodies, academia, and non-governmental organisations. In 2014 particularly, work addressed the effects of the global crisis on Bulgarian output, prices, housing market, foreign trade, fiscal policy, labour market, banking system, and debt. Research also focused on the link between inflation and potential output and the use of bank lending survey data in forecasting. Testing and honing the basic BNB macroeconometric forecasting model continued.
The Guest Researcher Programme supports BNB research and helps establish fruitful cooperation with Bulgarian and foreign experts on subjects of interest to the BNB. In 2014 a guest researcher working on non-stationary data analysis and panel cointe-gration analysis participated in the Programme.
Through its Discussion Papers research series, the BNB continued encouraging the research potential of Bulgarian economic science and practice in macroeconomics and finance. In 2014 the Discussion Papers Editorial Board reviewed six submissions, approving five for publication. They examine interest rates and lending, as well as issues related to the analysis of external trade and modelling of yield curves.
The BNB quarterly Economic Review presents short-term Bulgarian economic fore-casts, analyses of the balance of payments flows dynamics, monetary aggregates, and their effect on price stability in the real economy. External developments directly affecting the Bulgarian economy were also analysed. The Review runs quantitative assessments of short-run developments in major macroeconomic indicators like infla-tion, economic growth, exports, imports, trade balance, and the balance of payments current account. The results of BNB analyses of particular economic issues feature briefly in sidebars and research topics. Major 2014 highlights included: the effect of ECB monetary policy measures in 2014 on the euro area financial market and Bulgaria’s banking system; inflation dynamics in Bulgaria and EU Member States between August 2013 and September 2014; unemployment dynamics in Bulgaria and the EU-28 between 2009 and 2014; the economic and financial effects of oil price declines.

Bul
gar
ian
Nat
iona
l Ban
k. A
nnua
l Rep
ort •
201
4
80
XIII. Information Systems
BNB information system work involved:
• maintaining stability of information systems integrity and prevention of downtime in users’ work caused by suspension or problems in the systems; implementing hardware and software solutions for providing business processes’ continuity and data protection;
• developing, updating and maintaining the Bank’s communication and informa-tion infrastructure; optimising system architecture and links between them; de-veloping BNB application systems by expanding their scope and functionality in line with legislative changes and users’ requirements;
• implementing ECB/ESCB projects;
• developing and updating information security policy and procedures.
In 2014 the BNB continued maintaining stability of information systems integrity and prevention of downtime in users’ work caused by suspension or problems in the sys-tems both at the BNB and systems for servicing financial system in Bulgaria and under the ECB/ESCB projects. Specialised software and hardware products were delivered. 310 new workstations opened, of them 286 with new computers, and 249 closed. Financial information and legal information systems were kept up to date and available. BNB communication and information infrastructure development and obsolete equipment decommissioning continued. The voice communication internal infrastructure also upgraded.
RINGS operation improved with new statements and a system update. Control of the smooth RINGS operation also improved. New versions of the SWIFTAlliance Access software were tested and installed, reflecting the new SWIFT Standard 2014. A new technical support contract for TurboSwift will help BNB electronic international settle-ments through SWIFT in levs and foreign currency.
TARGET2-BNB national component and related services functioned smoothly. TAR-GET2-BNB statements and statistical reports application updated for the new version.
Preparations began for new SOFI hardware (Accounting and Financial Reporting Sys-tem), with new versions of its operating system and database. Tests show optimum connectedness and communications with main related systems. An additional func-tionality to SOFI now services first class systems in SEBRA payments. New SOFI and Budget Entity Internet Banking System functionality allows first level and subordinate budget spending entities to report account balances.
The Central Credit Register upgraded its information system.
Integrated Automated Statistical Information (IASI) system development continued. Reporting agents now enjoy easier online data submission. The balance of payments and international investment position, portfolio investment and related income data processing, securities statistics, external trade, direct services reporting, and other investment and related income subsystems will improve shortly.
Changes in EU and Bulgarian legislation meant upgrading the Single Data Depository for Banking Supervision Information System.
Public Procurement Law tenders preceded developing and servicing maintenance subscriptions to the BNB information system for monetary and interest rate statistics
81
Information S
ystemsand designing, developing, and implementing integrated financial markets, minimum required reserves, and Reserve Collateral Pool systems.
End users helped work on expanding the functionality of the Core Banking Information System, with particular emphasis on the security of all systems and their individual elements. The project on BNB hardware and software SAP migration was renewed, updating the software and improving the infrastructure and system operation security within the framework of the Core Banking Information System. The project will con-tinue in 2015.
The Check Point Cluster allowing the virtualisation of BNB online services to external users ended successfully.
ESCB information system users were phased into the Single User Authentication and Access Control System. Their number exceeded 150 at the end of 2014.
Over the year the BNB IT Security Committee’s Group drafted papers on developing and updating information security policy and procedures.

Bul
gar
ian
Nat
iona
l Ban
k. A
nnua
l Rep
ort •
201
4
82
XIV. Human Resources Management
In 2014 BNB human resource management boosted staff performance through training and career development, maintained analytical and administrative capacity, applied performance related pay, provided a sociable environment, and promoted health and safety at work.
At the end of 2014 there were 861 employees from 869 a year earlier. Forty eight joined in 2014, from 36 in 2013. Sixty one (7.08 per cent) left from 44 (5.06 per cent in 2013), of whom 24 retired, from 11 in 2013. More employees left in 2014 mainly because more retired.
Staff Structure as of 31 December 2014 (per cent, number)
Source: BNB.
The BNB continued attracting candidates with relevant degrees as required by its policy to recruit highly qualified staff. Graduates made up 72 per cent of staff, of them 503 with masters’ and 100 with bachelors’ degrees. 19 staff members have PhD.
Staff categories did not change much. The specialists’ group held the largest share at 50.9 per cent, followed by support staff at 24.8 per cent and management at 15.1 per cent. There were no major changes to BNB classifications on staff age structure. Women made up 65 per cent of staff and men 35 per cent in 2014.
The Bank promoted staff mobility to boost professional knowledge and skills and exchange experience across business areas. The number of employees moving between units doubled to 25 from 13 in 2013. Interest in short-term contracts and other staff mobility at the ECB and ESCB central banks continued in 2014, eight employees taking on appointments.
Pay continued to reflect performance and employee contribution to Bank objectives.

83
Hum
an Resources M
anagem
entThe annual training and qualification programme offered employees plentiful oppor-tunities to boost professional qualifications. Induction training developed further appropriate means for familiarising new employees with the Bank’s corporate culture, topical tasks, internal rules, and general administrative procedures.
Seventeen employees, of whom six reading for PhD, five for masters’, and six for bachelors’ degrees, boosted their educational attainments without stopping work. Seventeen took part in five distant training programmes. Thirty nine went on special-ised courses and seminars in the country.
The BNB continued cooperating with central banks in several European countries and with international financial institutions offering specialised banking training. Employees attended courses on banking supervision and financial stability, financial markets, asset management and market operations, monetary policy and financial programming, and payment and settlement systems.
Bank employees studied English, French, and German, improving the proficiency of BNB representatives on EU bodies, committees, and working groups.
IT training for 50 participants helped staff operate Oracle innovations and improve finance management skills in the IT area, data security, and storage skills. There was also operator train ing in equipment requiring competence certificates under legisla-tive and internal statutory acts.
Work on health and safety at work focused on limiting professional risks, awareness, and motivating staff to function in safety and good health. A number of internal rules changed, including the programme to manage and monitor work related risks which is the major means of managing and planning health and safety at work.
As a body with a positive attitude to youth education and professional develop-ment, the BNB continued providing career opportunities and encouraging research and sound academic knowledge. The annual scholarship programme enjoyed great interest. In early 2014 the BNB awarded two masters’ and one doctors’ degree schol-arships. Interest in the BNB traineeships programme remained high, candidates exceeding 110, of whom 32 were approved. The Bank participated in career fora to encourage student and graduate professional development.

Bul
gar
ian
Nat
iona
l Ban
k. A
nnua
l Rep
ort •
201
4
84
XV. Facilities Management
The BNB operates from owned premises, providing the degree of independence and security required of a body of national importance. Property management expenditure was in line with the BNB budget. It covered new construction and refurbishment, modernisation, equipment and furniture, and repairs and maintenance (transformers, distribution boards, automated generators, AVR controllers, mechanical rooms, pres-sure boilers, lifts, and HVAC). Facilities managers sought to optimise power, heating, and water use at BNB premises and supplied assets and consumables.
In 2014 the Bank bought two minibuses and four cars with police liaison equipment for escorting special freight and valuables.
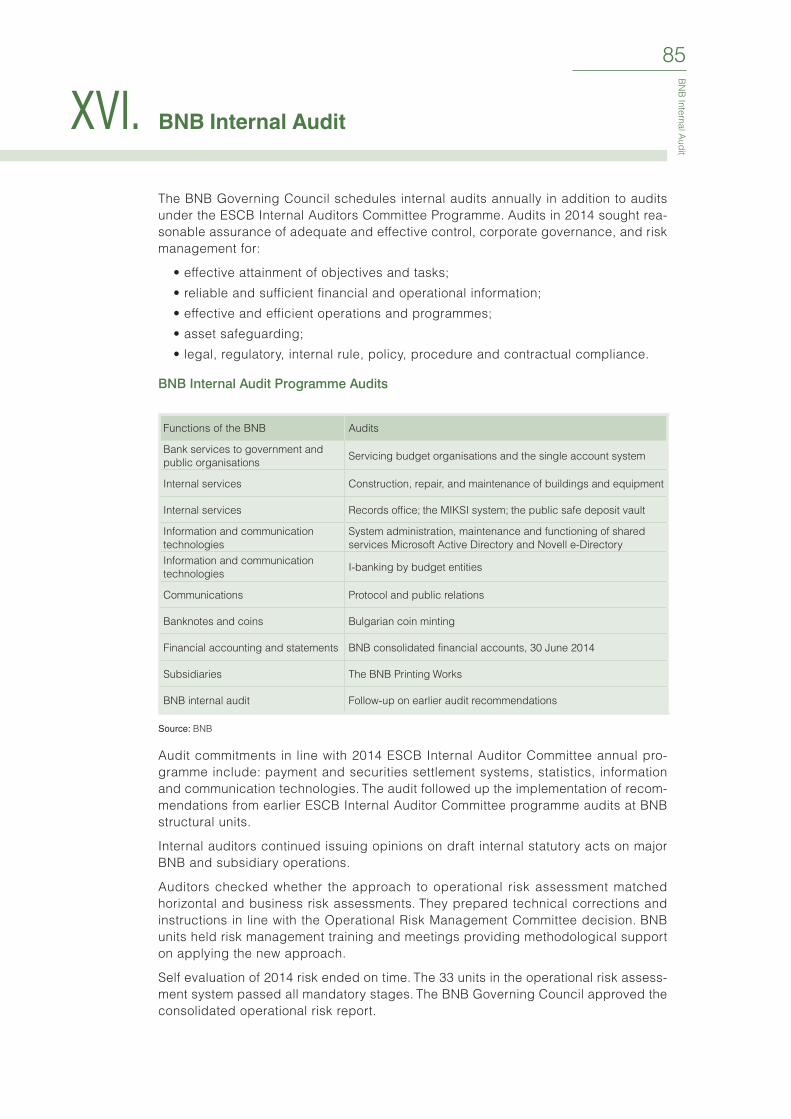
85
BN
B Internal A
udit
XVI. BNB Internal Audit
The BNB Governing Council schedules internal audits annually in addition to audits under the ESCB Internal Auditors Committee Programme. Audits in 2014 sought rea-sonable assurance of adequate and effective control, corporate governance, and risk management for:
• effective attainment of objectives and tasks;• reliable and sufficient financial and operational information;• effective and efficient operations and programmes;• asset safeguarding;• legal, regulatory, internal rule, policy, procedure and contractual compliance.
BNB Internal Audit Programme Audits
Functions of the BNB Audits
Bank services to government and public organisations
Servicing budget organisations and the single account system
Internal services Construction, repair, and maintenance of buildings and equipment
Internal services Records office; the MIKSI system; the public safe deposit vault
Information and communication technologies
System administration, maintenance and functioning of shared services Microsoft Active Directory and Novell e-Directory
Information and communication technologies
I-banking by budget entities
Communications Protocol and public relations
Banknotes and coins Bulgarian coin minting
Financial accounting and statements BNB consolidated financial accounts, 30 June 2014
Subsidiaries The BNB Printing Works
BNB internal audit Follow-up on earlier audit recommendations
Source: BNB
Audit commitments in line with 2014 ESCB Internal Auditor Committee annual pro-gramme include: payment and securities settlement systems, statistics, information and communication technologies. The audit followed up the implementation of recom-mendations from earlier ESCB Internal Auditor Committee programme audits at BNB structural units.
Internal auditors continued issuing opinions on draft internal statutory acts on major BNB and subsidiary operations.
Auditors checked whether the approach to operational risk assessment matched horizontal and business risk assessments. They prepared technical corrections and instructions in line with the Operational Risk Management Committee decision. BNB units held risk management training and meetings providing methodological support on applying the new approach.
Self evaluation of 2014 risk ended on time. The 33 units in the operational risk assess-ment system passed all mandatory stages. The BNB Governing Council approved the consolidated operational risk report.

Bul
gar
ian
Nat
iona
l Ban
k. A
nnua
l Rep
ort •
201
4
86
XVII. BNB Budget Implementation
The Governing Council adopted the BNB budget by Resolution No 96 of 14 November 2013. This report distinguishes spending and investment as required by the Internal Rules on Drafting, Implementing, and Reporting the BNB Budget.
I. Operating Expenditure
In 2014 the BNB spent BGN 73,518,000 or 85.7 per cent of its annual budget.
Currency circulation cost BGN 12,836,000 or 84.5 per cent of budget under this item and 17.4 per cent of operating expenditure. New banknotes and coins cost BGN 12,405,000, of which BGN 6,196,000 for banknotes and BGN 6,209,000 for coins, including BGN 5,742,000 for circulating coins. Minting cost BGN 467,000, in line with the BNB Governing Council’s coin programme. New banknote and coin design cost BGN 41,000, including three design competitions for 2015 commemora-tive coins. Cash servicing machines cost BGN 90,000 and consumables for banknote and coin processing BGN 138,000. Premise rentals at the Cash Services Company AD and the State Mint cost BGN 162,000. There was no banknote and coin scrapping and converting the scrap from silver to silver-exchange standard.
Materials, services, and depreciation cost BGN 31,584,000 or 79.4 per cent of annual budget and 43.0 per cent of operating expenditure.
Materials cost BGN 1,004,000 or 1.4 per cent of operating spend. Vehicle fleet fuel and spares (BGN 443,000) and office consumables (BGN 209,000) occupied the larg-est share in this group. The Bank spent BGN 150,000 on inventories.
External services cost BGN 15,393,000 or 20.9 per cent of operating spend. Signifi-cant items were software maintenance subscriptions at BGN 3,035,000, mandatory TARGET2-BNB modules at BGN 944,000, Bloomberg, Reuters, internet, and sun-dry systems at BGN 1,016,000, and Bankservice subscriptions at BGN 552,000 or 36 per cent of external service spend. Equipment maintenance subscriptions cost BGN 1,132,000. Property and refuse collection levies cost BGN 1,276,000. Mail, telephone, and telex cost BGN 595,000, in line with the trend to optimising and updating BNB voice services. Electric bills were BGN 949,000, heating, and water BGN 243,000. Property insurance cost BGN 118,000. The Bank spent BGN 2,294,000 on security and fire protection. Major buildings maintenance cost BGN 2,144,000. Consultancy services (BGN 291,000) included legal counsel, advice on personal security and multiple premise protection, analysis of IT training needs, a sample public opinion poll on Bulgarian socioeconomic developments and confidence in financial institutions, and running the Banking and Financial History Research and Publications Programme Council.
Depreciation cost BGN 15,187,000 or 20.7 per cent of operating spend.
Payroll, social, and healthcare spending was BGN 22,880,000 or 99.1 per cent of budget under this item and 31.1 per cent of operating spend. The Bank reported BGN 461,000 of current retirement obligations and unused paid leave under IAS 19, Income of Hired Persons.
Social spending was BGN 2,179,000 or 96.7 per cent of annual budget and 3.0 per cent of operating spend. Sundry administrative costs were BGN 1,301,000 or 57.0 per cent of budget and 1.8 per cent of operating spend. Inland travel worth BGN 68,000

87
BN
B B
udg
et Imp
lementation
involved mainly regional cash centre logistics and checks. Foreign travel unrelated to ESCB and EU bodies cost BGN 245,000.
The annual BNB Staff Education and Professional Training Programme sent staff on specialised courses at the ESCB, the European Commission, EU bodies, banks, and international financial institutions. It cost BGN 505,000.
ESCB membership cost BGN 2,738,000 or 85.0 per cent of annual budget under this item and 3.7 per cent of operating spend. Staff travel on ESCB committee and work-ing group business and other EU bodies cost BGN 711,000. Telecommunications lines cost BGN 589,000 and staff training BGN 48,000. The European Banking Authority annual membership fee was BGN 1,053,000.
II. The Investment Programme
The BNB budgeted BGN 19,385,000 for the investment programme and invested BGN 5,062,000 or 26.1 per cent of that.
In construction, refurbishment, and modernisation, BGN 47,000 or 6.4 per cent of the annual budget went on drafting technical specifications and conducting engineering geology and microseismic studies of the future BNB Plovdiv Cash Centre. Further spending under this item awaits changes to design parameters and submission of a Law on Spatial Development Article 150 c ompound development project.
Machine and equipment, vehicle, and sundry equipment investment was BGN 1,174,000 or 37.7 per cent of programme funds. Contract delays deferred plans for BGN 864,000 worth of currency circulation vehicles to 2015.
Currency circulation machines cost BGN 208,000, including BGN 88,000 for delivery and commissioning of protection sensors for two cash handling machines, BGN 80,000 for coin storage containers, BGN 23,000 for electronic scales, BGN 12,000 for three banding machines, and BGN 5000 for sundry cash handlers.
The Bank spent BGN 670,000 on two minibuses and four cars with police liaison equipment for escorting special freight. BGN 149,000 went into special equipment related to security systems and BGN 147,000 into office and sundry equipment.
Information systems took BGN 3,841,000 or 25 per cent of projected funds and 75.9 per cent of all annual investment. Funds went mostly into keeping the information and communication technology infrastructure modern. In 2014 the Bank continued optimising investment funds by changing priorities and reordering projects. Hardware cost BGN 2,782,000 of which BGN 1,539,000 for computers and BGN 1,243,000 for communications equipment. Software cost BGN 1,059,000 of which BGN 365,000 for licences and BGN 694,000 for improving functionality.
In 2014 there was no investment into BNB membership in the ESCB.

Bul
gar
ian
Nat
iona
l Ban
k. A
nnua
l Rep
ort •
201
4
88
BNB Budget Implementation as of 31 December 2014
IndicatorReport
31 December 2014 (BGN’000)
Budget 2014 (BGN’000)
Implementation (per cent)
Section I. Operating Expenditure 73 518 85 811 85.7
Currency circulation 12 836 15 185 84.5
Materials, services, and depreciation expenditure 31 584 39 788 79.4
Staff expenditure 22 880 23 078 99.1
Social expenditure 2 179 2 254 96.7
Other administrative expenditure 1 301 2 283 57.0
ESCB membership 2 738 3 223 85.0
Section II. Investment Programme 5 062 19 385 26.1
Construction, refurbishment, and modernisation 47 730 6.4
Machines and equipment, vehicles, and sundry equipment 1 174 3 115 37.7
Information technology 3 841 15 344 25.0
ESCB membership 0 196 0
Source: BNB.

Bulgarian National Bank Consolidated Financial Statements as of 31 December 2014XVIII.Independent Auditors’ Report to the Governing Council
of the Bulgarian National Bank ___________________________________ 90
Statement of Responsibilities of the Governing Council
of the Bulgarian National Bank __________________________________ 92
Consolidated Statement of Comprehensive Income
for the Year Ended 31 December 2014 _____________________________ 93
Consolidated Statement of Financial Position
as of 31 December 2014 ________________________________________ 94
Consolidated Statement of Cash Flows
for the Year Ended 31 December 2014 _____________________________ 95
Consolidated Statement of Changes in Equity
for the Year Ended 31 December 2014 _____________________________ 96
Notes to the Consolidated Financial Statements _____________________ 97

Bul
gar
ian
Nat
iona
l Ban
k. A
nnua
l Rep
ort •
201
4
90

91
Bulg
arian National B
ank Consolid
ated Financial S
tatements as of 31 D
ecemb
er 2014

Bul
gar
ian
Nat
iona
l Ban
k. A
nnua
l Rep
ort •
201
4
92
Statement of Responsibilities of the Governing Councilof the Bulgarian National Bank
The Law on the Bulgarian National Bank requires the Governing Council
to prepare financial statements to present the Bank’s financial position and
performance for the period.
The financial statements of the Bulgarian National Bank approved by
the Governing Council are prepared in accordance with the International
Financial Reporting Standards adopted by the European Commission.
The Governing Council of the Bulgarian National Bank is responsible for
maintaining proper accounting records, which disclose with reasonable
accuracy at any time the financial position of the Bulgarian National Bank.
It has overall responsibility for taking such steps so as to safeguard the
assets of the Bulgarian National Bank and to prevent or detect fraud and
other irregularities.
Ivan Iskrov
Governor of the BNB

93
Bulg
arian National B
ank Consolid
ated Financial S
tatements as of 31 D
ecemb
er 2014Consolidated Statement of Comprehensive Income for the Year Ended 31 December 2014
(BGN’000)
Note 2014 2013
Interest income 7 397,412 435,316Interest expense 7 (1,498) (1,201)Net interest income 395,914 434,115
Fee and commission income 10,333 9,052Fee and commission expense (4,250) (4,144)Net fee and commission income 6,083 4,908
Net gains/(losses) from financial assets and liabilities at fair value through profit or loss 8 189,180 (1,362,089)Other operating income 9 40,286 45,064
Total income from banking operations 631,463 (878,002)
Administrative expenses 10 (101,470) (99,169)
Profit/(loss) for the period 529,993 (977,171)
Other comprehensive incomeOther comprehensive income 1,384 (4,854)Other comprehensive income, total 1,384 (4,854)Total comprehensive income for the period 531,377 (982,025)
Profit attributable to:Equity holder of the Bank 529,813 (977,214)Non-controlling interest 180 43Profit/(loss) for the period 529,993 (977,171)
Total comprehensive income attributable to:Equity holder of the Bank 531,197 (982,068)Non-controlling interest 180 43Total comprehensive income for the period 531,377 (982,025)
The accompanying notes on pages 97 to 124 form an integral part of the Consolidated Financial Statements.

Bul
gar
ian
Nat
iona
l Ban
k. A
nnua
l Rep
ort •
201
4
94
Consolidated Statement of Financial Position as of 31 December 2014
(BGN’000)
Note31 December
201431 December
2013
ASSETS
Cash and deposits in foreign currencies 11 6,537,102 6,318,854
Gold, instruments in gold and other precious metals 12 2,495,289 2,228,481
Financial assets at fair value through profit or loss 13 23,260,551 19,623,926
Financial assets available for sale 14 1,546,949 1,454,171
Tangible assets 15 179,588 190,068
Intangible assets 16 3,491 4,729
Other assets 17 91,775 87,048
Total assets 34,114,745 29,907,277
LIABILITIES
Banknotes and coins in circulation 18 11,586,943 10,253,722
Due to banks and other financial institutions 19 8,125,056 7,063,410
Liabilities to government institutions and other liabilities 20 7,027,509 5,905,707
Borrowings against Bulgaria’s participation in international financial institutions 21 2,835,018 2,659,865
Other liabilities 22 189,839 143,270
Total liabilities 29,764,365 26,025,974
EQUITY
Capital 23 20,000 20,000
Reserves 23 4,325,960 3,857,063
Non-controlling interest 24 4,420 4,240
Total equity 4,350,380 3,881,303
Total liabilities and equity 34,114,745 29,907,277
The accompanying notes on pages 97 to 124 form an integral part of the Consolidated Financial Statements.

95
Bulg
arian National B
ank Consolid
ated Financial S
tatements as of 31 D
ecemb
er 2014Consolidated Statement of Cash Flows for the Year Ended 31 December 2014
(BGN’000)
Note 2014 2013
OPERATING ACTIVITIES
Net profit/(loss) 529,993 (977,171)
Adjustments:
Dividend income (6,994) (8,796)
Depreciation and amortisation 15, 16 19,047 22,828
Loss on disposal of tangible assets 44 28,614
(Profit)/Loss on financial assets and liabilities arising from market movements (374,520) 1,004,115
Loss/(Profit) of associates 1,003 (145)
Other adjustments (20) 81
Net cash flow from operating activities before changes in operating assets and liabilities 168,553 69,526
Change in operating assets
(Increase) in gold, instruments in gold and other precious metals (5,094) (4,039)
(Increase) in financial assets at fair value through profit or loss (3,441,047) (1,898,494)
Decrease/(Increase) in other assets 14,766 (16,622)
Change in operating liabilities
Increase in currency in circulation 1,333,221 703,801
Increase/(Decrease) in due to banks and other financial institutions 1,061,646 (781,750)
Increase/(Decrease) in due to government institutions and other liabilities 1,121,802 (1,046,490)
Increase in other liabilities 46,569 42,522
Net cash flow from/(used in) operating activities 300,416 (2,931,546)
INVESTING ACTIVITIES
Acquisition of tangible and intangible assets (7,412) (20,299)
Dividends received 6,994 8,796
Other investments 43 (8)
Net cash flow (used in) investing activities (375) (11,511)
FINANCING ACTIVITIES
Payments to the Government (62,300) (105,834)
Net cash flow (used in) financing activities (62,300) (105,834)
Net increase/(decrease) in cash and cash equivalents 237,741 (3,048,891)
Cash and cash equivalents at beginning of period 6,368,240 9,417,131
Cash and cash equivalents at end of period 11, 17 6,605,981 6,368,240
The accompanying notes on pages 97 to 124 form an integral part of the Consolidated Financial Statements.

Bul
gar
ian
Nat
iona
l Ban
k. A
nnua
l Rep
ort •
201
4
96
Consolidated Statement of Changes in Equity for the Year Ended 31 December 2014
(BGN’000)
Source of changes in equity Capital
Revaluation of non-
monetary assets
Special and other reserves
Total capital and reserves
Non-controlling
interest
Total equity
Balance as of 1 January 2013 20,000 138,538 4,806,427 4,964,965 4,197 4,969,162
Profit/(Loss) for the period - - (977,214) (977,214) 43 (977,171)Other comprehensive income: - other income - (4,929) 75 (4,854) - (4,854)Other comprehensive income, total - (4,929) 75 (4,854) - (4,854)Total comprehensive income for the period - (4,929) (977,139) (982,068) 43 (982,025)
Contributions by and distributions to owners:- contribution to the budget of the Republic of Bulgaria - - (105,834) (105,834) - (105,834)Transactions with owners, total - - (105,834) (105,834) - (105,834)
Balance as of 31 December 2013 20,000 133,609 3,723,454 3,877,063 4,240 3,881,303
Balance as of 1 January 2014 20,000 133,609 3,723,454 3,877,063 4,240 3,881,303
Profit for the period - - 529,813 529,813 180 529,993Other comprehensive income:- other income - 1,370 14 1,384 - 1,384Other comprehensive income, total - 1,370 14 1,384 - 1,384Total comprehensive income for the period - 1,370 529,827 531,197 180 531,377
Contributions by and distributions to owners:- contribution to the budget of the Republic of Bulgaria - - (62,300) (62,300) - (62,300)Transactions with owners, total - - (62,300) (62,300) - (62,300)
Balance as of 31 December 2014 20,000 134,979 4,190,981 4,345,960 4,420 4,350,380
The accompanying notes on pages 97 to 124 form an integral part of the Consolidated Financial Statements.

97
Bulg
arian National B
ank Consolid
ated Financial S
tatements as of 31 D
ecemb
er 2014Notes to the Consolidated Financial Statements
1. Statute and Principal Activities
The Bulgarian National Bank (the ‘Bank’) is 100 per cent owned by the Bulgarian state and is the central bank of the Republic of Bulgaria. The operation of the Bank is gov-erned by the Law on the Bulgarian National Bank (LBNB), which has been effective since 10 June 1997.
Under this Law, the principal activities of the Bank may be summarised as:
• Maintaining price stability through ensuring national currency stability;
• Exclusive right to issue banknotes and coins;
• Regulation and supervision of other banks’ activities in the country with a view to banking system stability maintenance;
• Establishment and operation of efficient payment systems;
• Regulation and supervision the activity of payment system operators, payment institutions and electronic money institutions in the country;
• The Bank shall not extend credit and guarantees in any form whatsoever, including thought purchase of debt instruments, to the Council of Ministers, municipalities, as well as to other government and municipal institutions, organisations and enterprises;
• The Bank may not provide credit to banks except in the case of liquidity risk threaten-ing to affect the stability of the banking system;
• The Bank may not deal in Bulgarian government securities;
• The Bank may not issue Bulgarian levs in excess of the Bulgarian lev equivalent of the gross international reserves;
• The Bank shall act as the fiscal agent and depository for the State.
The Governing Council of the BNB approved the Consolidated Financial Statements, set out on pages 89 to 124, on 23 April 2015.
2. Applicable Standards
These Consolidated Financial Statements have been prepared in accordance with International Financial Reporting Standards (IFRS) as adopted by the European Commission.
3. Basis of Preparation
The Consolidated Financial Statements are presented in Bulgarian lev rounded to the nearest thousand (BGN’000), which is the functional currency of the Bank. They are prepared on a historical cost basis, except for the following items, which are measured on an alternative basis as at each reporting date:
Items Measurement basis
Derivative financial instruments Fair value
Non-derivative financial instruments at fair value through profit or loss
Fair value
Available-for-sale financial assets Fair value
Tangible non-current assetsRevalued amount, which is the asset’s fair value at the revaluation date less subsequent depreciation and impairment loss
Defined benefit liability Present value of the defined benefit liability
Use of estimates and judgements
In preparing these Consolidated Financial Statements, the Bank has made judgements, estimates and assumptions that affect the reported amounts of assets and liabilities, incomes and expenses, and the disclosure of contingent receivables and payables as at the Financial Statements date. These estimates, judgements and assumptions are based on data available as at the date of the Consolidated Financial Statements; therefore actual future results may differ from these estimates.

Bul
gar
ian
Nat
iona
l Ban
k. A
nnua
l Rep
ort •
201
4
98
The estimates and main assumptions are revised on an ongoing basis and are recog-nised prospectively.
Judgements
The Bank has estimated and classified cash in circulation as a financial liability (see note 18).
Assumptions and estimation uncertainties
Measurements of the present value of long-term obligations to retiring staff (follow-ing a defined benefit plan) use certified actuarial calculations based on mortality assumptions, rate of staff turnover, future level of salaries and discount factor, which assumptions may lead to adjustments in the next financial year; management however considers them to be reasonable and appropriate for the Bank (note 10).
Some of the Bank’s accounting policies and disclosures require fair value measure-ments of financial and non-financial assets and liabilities. For information on fair value measurements, see note 6(e) and note 15.
The Bank has adopted the following new standards and amendments to standards, including all resulting amendments to other standards, with a date of initial application 1 January 2014:
• IFRS 10 ‘Consolidated Financial Statements’, IFRS 11 ‘Joint Arrangements’, IFRS 12 ‘Disclosure of Interests in Other Entities’;
• Amendments to IAS 32 ‘Offsetting Financial Assets and Financial Liabilities’;
• Amendments to IAS 36 ‘Recoverable Amount Disclosures for Non-Financial Assets’;
• Amendments to IAS 39 ‘Financial Instruments: Recognition and Measurement’, called ‘Novation of Derivatives and Continuation of Hedge Accounting’:
• IFRIC Interpretation 21 ‘Levies’
1) Amendments to IFRS 10, IFRS 11 and IAS 12
The Bank has changed its accounting policy for determining whether it has control over the entities in which it has invested and their consolidation respectively. The changes introduce a new model of control, which focuses on whether the Bank has rights over an entity, exposure or the right to variable return from its participation, and whether it is able to use these rights to influence return. These changes have no material effect on the Bank’s Financial Statements.
2) Amendments to IAS 32
These amendments have no effect on the Financial Statements since the Bank does not apply offsetting to its financial assets and financial liabilities, and has no global offsetting agreements.
3) Amendments to IAS 36
These amendments have no effect on the level of disclosure in the Financial Statements.
4) Amendments to IAS 39
These amendments have no effect on the level of disclosure in the Financial Statements.
5) IFRIC Interpretation 21 ‘Levies’.
These amendments have no effect on the level of disclosure in the Financial Statements.
4. Basis of Consolidation
Subsidiaries
Subsidiaries are the entities controlled by the Bank. Control over an entity exists when the Bank is exposed to or has rights over the variable return from its participation in that entity, and is able to influence that return through its powers. The financial statements of the subsidiaries are included in the consolidated financial statements from the date that control commences until the date that control ceases. The share in the net assets of the Bank’s subsidiaries, which corresponds to the minority shareholders’ proportionate

99
Bulg
arian National B
ank Consolid
ated Financial S
tatements as of 31 D
ecemb
er 2014share, is disclosed separately from Capital and Reserves under the Non-controlling Interest item.
Associated companies
Associates are those entities in which the Bank has significant influence, but which are neither subsidiary enterprise, nor joint venture. Investments in associates are accounted for in the Bank’s Consolidated Financial Statements using the equity method as an amount corresponding to the Bank’s share in the associates’ own funds as of the end of the reporting period. The Bank’s share of associates’ net results subsequent to acquisition is disclosed in ‘profit or loss’ as investment income/expenses and is added to/subtracted from the carrying value of the investment.
Transactions eliminated on consolidation
All receivables and payables, incomes and expenses, as well as intragroup profits, resulting from transactions between Group companies, are eliminated unless they are immaterial.
5. Significant Accounting Policies
(a) Income recognition
Income recognition
Interest income and expense are recognised in the ‘profit or loss’ using the effective interest rate method. The effective interest rate is the rate which precisely discounts the estimated future cash payments and income over the term of the financial asset or liability to the carrying amount of the asset or liability. The effective interest rate is determined on the initial recognition of the financial asset or liability and does not change thereafter.
The calculation of the effective interest rate includes all transaction costs and fees and points that are integral part of the effective interest rate. Transaction costs include incremental costs directly attributable to the acquisition, issue or derecognition of a financial asset or liability.
Interest income and expense presented in the profit or loss include:
• interest on financial assets and financial liabilities measured at amortised cost calcu-lated on an effective interest rate method;
• interest on available-for-sale investment securities calculated on an effective interest rate method;
Dividend income is recognised in the profit or loss when the Bank establishes the right to receive income. Foreign currency differences arising from available-for-sale investments are recognised in profit or loss
Net gains/losses from financial assets and liabilities at fair value through profit or loss include net gains from operations in securities, net gains from operations in foreign currency, net revaluation gains on securities, net gains from gold revaluation, net gains from revaluation of futures, and net gains from revaluation of assets and liabilities denominated in foreign currencies.
(b) Financial instruments
(i) Classification
For the purposes of measuring financial instruments subsequent to initial recognition, the Bank classifies the financial instruments into four categories:
Financial instruments at fair value through profit or loss are those that the Bank holds primarily for the purpose of short-term profit. These include investments that are not designated for any particular purpose and effective hedging instruments and liabilities from short-term sales of financial instruments. Net receivables under derivatives held for trading (positive fair value), as well as options purchased, if any, are reported as trading assets. All net liabilities under derivatives for trading (negative fair value), as well as options written, if any, are reported as trading liabilities.

Bul
gar
ian
Nat
iona
l Ban
k. A
nnua
l Rep
ort •
201
4
100
Loans and receivables are instruments issued by the Bank through providing money to a debtor other than those created with the intention of short-term profit taking.
Held-to-maturity financial assets are assets with fixed or determinable payments and fixed maturity that the Bank has the intent and ability to hold to maturity.
Available-for-sale financial assets are all assets that cannot be classified in any other category and are classified as available for sale, as well as those financial assets designated as available for sale at initial recognition.
(ii) Recognition
The Bank recognises trading financial assets and investments, the Bank’s loans and receivables, and financial liabilities at amortised cost on the date at which they are originated. All other financial assets and financial liabilities are initially recognised on the trade date at which the Bank becomes a party to the contractual provisions of the instrument. From that moment on, any changes in their fair value are recognised by the Bank as income or expense.
Financial instruments are initially measured at fair value, and for those financial instru-ments which are not recognised at fair value through profit or loss the amount recog-nised includes directly attributable acquisition costs.
(iii) Amortised cost measurement
The amortised cost of a financial asset or liability is the amount at which the financial asset or liability is measured upon the initial recognition, minus principal repayments, plus or minus cumulative amortisation using an effective interest rate for the difference between the initial amount recognised and the maturity amount, minus any reduction for impairment.
(iv) Fair value measurement and disclosure principles
Fair value is the price that would be received to sell an asset or paid to transfer a liability in an orderly transaction between market participants in the principal market and, if no such market is available, then in the most advantageous and accessible market on the measurement date. The fair value of a liability reflects the effect of non-performance risk.
Whenever possible, the Bank measures the fair value of an instrument using quoted prices in an active market of that instrument. A market is considered as active if asset or liability transactions occur with sufficient frequency and volume to provide pricing information on an ongoing basis.
If no quoted price in an active market is available, the Bank uses the most relevant observable inputs and makes minimum use of unobservable data. The aim of using a valuation technique is to estimate the price that would be obtained in an orderly trans-action between market participants. The chosen valuation technique makes maximum use of market inputs, relies as little as possible on estimates specific to the Bank, incorporates all factors that market participants would consider in determining a price, and is consistent with accepted economic methods of financial instruments pricing.
Inputs to valuation techniques reasonably represent market expectations and measures of the risk-return factors inherent in the financial instrument. The Bank calibrates valua-tion techniques and tests them for validity using prices from observable current market transactions in the same instrument or based on other available observable market data.
The best evidence of the fair value of a financial instrument at initial recognition is the transaction price, i.e., the fair value of the consideration given or received. When the Bank finds a difference between the fair value at initial recognition and the transaction price, and the fair value is neither evidenced by quoted price in an active market for identical assets or liabilities nor based on a valuation technique based only on data from observable markets, then the financial instrument is initially recognised at fair value adjusted with the difference between the fair value at initial recognition and the transaction price. This difference is subsequently recognised in profit or loss on an appropriate basis over the life of the instrument but not later than when the valuation is supported wholly by observable market data or the transaction is closed out.

101
Bulg
arian National B
ank Consolid
ated Financial S
tatements as of 31 D
ecemb
er 2014The Bank recognises assets and long positions at a bid price and liabilities and short positions at an ask price when assets or liabilities measured at fair value have a bid and an ask price.
Portfolios of financial assets and financial liabilities that are exposed to market risk and credit risk that are managed by the Bank on the basis of the net exposure to either market or credit risk are measured on the basis of a price that would be received to sell a net long position (or paid to transfer a net short position) for a particular risk exposure. Those portfolio-level adjustments are allocated to the individual assets and liabilities on the basis of the relative risk adjustment of each of the individual instru-ments in the portfolio.
Where the Bank has positions with offsetting risks, mid-market prices are used to measure them and a bid or asking price adjustment is applied only to the net open position as appropriate. Fair values reflect the credit risk of the instrument and include adjustments to take account of the credit risk of the Bank entity and the counterparty where appropriate. Fair value estimates obtained from models are adjusted for any other factors, such as liquidity risk or model uncertainties, to the extent that the Bank believes a third-party market participant would take them into account in pricing a transaction.
The Bank recognises transfers between levels of the fair value hierarchy as of the end of the reporting period during which the change has occurred.
(v) Derecognition
The Bank derecognises a financial asset when the contractual rights to the cash flows from the financial asset expire, or when it transfers the rights to the receipt of the contractual cash flows from the financial asset in the transaction in which substantially all risks and rewards of ownership of the financial asset are transferred. Any hold-ing in transferred financial assets, which has been originated or kept by the Bank, is recognised as a separate asset or liability.
The Bank derecognises a financial liability when its contractual obligations are dis-charged or cancelled or expired.
The Bank enters into transactions whereby it transfers assets recognised in its state-ment of financial position, but retains either all or the substantial risks and rewards of the transferred assets or part of them. If part of or all substantial risks and rewards are retained, then the transferred assets are not derecognised from the statement of financial position. Transfers of assets with retention of part of or all substantial risks and rewards are, for instance, securities lending or repurchase agreements.
In transactions where the Bank neither retains, nor transfers all substantial risks and rewards of ownership of a financial asset, it derecognises the asset if it does not retain the control of that asset. The rights and obligations retained in the transfer are recognised separately as assets and as liabilities, respectively. In transactions where control of the asset is retained, the Bank continues to recognise the asset to the extent of its continuing involvement, determined by the extent to which the Bank is exposed to changes in the value of the transferred asset.
In certain transactions, the Bank retains the obligation to service the transferred finan-cial asset for a fee. The transferred asset is derecognised if it meets the derecogni-tion criteria. An asset or liability is recognised for the servicing contract, depending on whether the servicing fee is more than adequate (asset) or is less than adequate (liability) for performing the servicing.
(vi) Offsetting
Financial assets and liabilities are offset and the net amount presented in the statement of financial position when the Bank has a legal right to offset the recognised amounts and intends to settle the asset or the liability on a net basis.
Income and expenses are presented on a net basis only when permitted under IFRSs, or for gains and losses arising from a group of similar transactions such as in the Bank’s trading operations.

Bul
gar
ian
Nat
iona
l Ban
k. A
nnua
l Rep
ort •
201
4
102
(vii) Impairment of assets
Financial assets which are not carried at fair value through profit or loss are reviewed at each reporting date to determine whether there is evidence of impairment. Financial assets are impaired if there is objective evidence of impairment as a result of a loss event that occurred after the initial recognition of the asset and that the loss event had an impact on the future cash flows which can be reliably estimated.
Objective evidence of an impairment loss from financial assets, including equity instru-ments, is a default or a borrower’s inability to repay his obligations, restructuring of loans under unfavourable financial conditions for the Bank, indications that a borrower or the issuer of a financial instrument would go out of business, the disappearance of an active security market, or other public information. Furthermore, in case of a continuous or significant fall in the market value of an investment in equity instruments, there is objective evidence of impairment of these equity instruments.
The Bank considers the need of impairment of loans or investments held to maturity at both individual and group level. All individually significant loans and investments held to maturity are evaluated for specific impairment. All individually significant loans and investments held to maturity on which no specific impairment losses have been charged are evaluated on a portfolio basis. Loans and held-to-maturity investments that are not individually significant are collectively assessed for impairment by grouping together loans and held-to-maturity investment securities with similar risk characteris-tics. In assessing collective impairment, the Bank uses statistical modelling of historical trends of the probability of default, timing of recoveries and the amount of the loss incurred, adjusted for management’s judgement as to whether current economic and credit conditions are such that the actual losses are likely to be greater or less than suggested by historical modelling. Default rates, loss rates and the expected timing of future recoveries are regularly benchmarked against actual outcomes to ensure that they remain appropriate.
Impairment losses from assets carried at amortised cost are measured as the differ-ence between the carrying amount of the financial asset and the present value of the estimated future cash flows discounted by the original effective interest rate of the asset. Impairment losses are recognised in profit or loss and reflected in an allowance account against loans and receivables. Interest on the impaired asset continues to be recognised through unwinding of the discount. When a subsequent event reduces the impairment loss, the reduction in the impairment loss is reversed through profit and loss.
Impairment losses from available-for-sale investment securities are recognised by transferring the cumulative loss that has been recognised in other comprehensive income to profit or loss as a reclassification adjustment. The cumulative loss that is reclassified from other comprehensive income to profit or loss is the difference between the acquisition cost, net of any principal repayment and amortisation, and the current fair value, less any impairment loss previously recognised in profit or loss.
If, in a subsequent period, the fair value of an impaired debt security available for sale increases and the increase can be objectively linked to an event that occurred after the impairment loss had been recognised in profit and loss, then the impairment loss is reversed and the reversed amount is recognised in profit and loss. However, any subsequent recovery in the fair value of an impaired equity instrument available for sale is directly recognised in other comprehensive income.
(viii) Financial assets/liabilities held for trading
Financial assets at fair value through profit or loss include instruments which the Bank acquires or incurs principally for the purpose of selling or repurchasing in the near term, or holds as part of a portfolio that is managed as a whole with the purpose of short-term profit.
Initially, financial assets and liabilities for trading are recognised at fair value in the statement of financial position and transaction costs recognised in profit or loss. All changes in the fair value are recognised as net income from trading operations in profit or loss.

103
Bulg
arian National B
ank Consolid
ated Financial S
tatements as of 31 D
ecemb
er 2014 (ix) Investments
(1) Held-to-maturity investments
Held-to-maturity financial assets are non-derivative assets with fixed or determinable payments and fixed maturity that the Bank has the intent and ability to hold to maturity are not designated at fair value through profit or loss, and are not available-for-sale financial assets.
Held-to-maturity investments are carried at amortised cost on the basis of an effective interest rate method. In case of sale or reclassification of more than an insignificant part of the assets held to maturity that are not falling due in the immediate future, there should be a reclassification of the entire portfolio of investments held to maturity in the group of available-for-sale investments. As a result of this reclassification, the Bank may not classify investments as held to maturity in the current year and the following two years.
(2) Financial assets available for sale
Available-for-sale investments are non-derivative assets that cannot be classified in any other category of financial assets. Equity investments not quoted in the market and whose fair value cannot be reliably measured are carried at cost. All other available-for-sale assets are carried at fair value.
Differences in the fair value are recognised directly in equity until the investment is sold or fully impaired when the cumulative gains and losses recognised in equity are recognised in profit or loss.
(c) Gold and other precious metals
The BNB as a central bank maintains particular volumes of gold as part of Bulgaria’s international reserves. In compliance with the requirements of the Law on the BNB, the Bank may take any necessary action in connection with the acquisition, posses-sion and sale of gross international reserves, including monetary gold. Consequently, monetary gold as part of international reserves may be immediately used by the BNB without further constraints which determines it as a monetary asset. Pursuant to the requirements of the ‘General Provisions for Defining the Valuation Basis in the Financial Statements’ to the IFRS, the Bank defines the recognition and valuation of the monetary gold as an asset reported at fair value through profit or loss as the most reliable and appropriate base for a subsequent valuation of this financial asset.
Gold and other precious metals are measured at market value based on the London Bullion Market fixing in euro at the reporting date.
(d) Equity investments
For the purposes of measuring the equity investments subsequent to initial recognition, they are classified as available-for-sale financial assets and are measured at fair value.
Details of investments held by the Bank are set out in note 14.
(e) Property, plant, equipment and intangible assets
The Bank presents land, buildings and other groups of fixed tangible assets in the statements of financial position at revalued amount as per the alternative approach allowed in IAS 16 ‘Property, Plant and Equipment’. The intangible assets are measured in the statement of the financial position at cost, less accumulated depreciation, and impairment losses.
Land and buildings are measured at fair value which is regularly assessed by profes-sionally qualified valuers. The revaluation of property is done asset by asset, and any accumulated depreciation at the revaluation date is derecognised against the gross carrying amount of the asset, and the net amount restated to the revalued amount of the asset. When the value of assets increases as a result of revaluation, the increase is reflected directly in other comprehensive income. When the value of assets decreases as a result of revaluation, the decrease is recognised by decreasing the revaluation reserve in equity, and in case of a shortage, the difference is recognised as an expense in profit or loss.
1) Subsequent costs
The separately accounted for costs incurred to replace a component of an item of prop-erty, plant and equipment are capitalised. All other subsequent costs are capitalised

Bul
gar
ian
Nat
iona
l Ban
k. A
nnua
l Rep
ort •
201
4
104
only when future economic benefits embodied in the item of property, plant and equip-ment will flow to the Bank. All other costs are recognised in profit or loss as incurred.
2) Depreciation
Depreciation is provided on a straight-line basis at prescribed rates designed to write down the cost of revalued amount of property, plant, equipment and intangible assets over their estimated useful lives. Land is not depreciated. The annual depreciation rates used are as follows:
(per cent)
Buildings 2–4
Plant & equipment 3–15
Computers 30–33.3
Fixtures and fittings 15–20
Motor vehicles 8–25
Intangible fixed assets 20–25
Expenditures incurred for the acquisition of property, plant, equipment and intangible assets are not depreciated until they are brought into use.
3) Calculation of recoverable amount of assets
The recoverable amount of the Bank’s fixed assets is the higher of the net selling price and value in use. In assessing value in use, the estimated future cash flows are discounted to their present value using the Bank’s incremental borrowing rate that reflects current market assessments of the time value of money and the risks specific to the asset. For an asset that does not generate largely independent cash inflows, the recoverable amount is determined for the cash-generating unit to which the asset belongs.
4) Reversals of impairment
Impairment losses of tangible fixed assets are reversed when a change occurs in the estimates used to determine the recoverable amount and may be reversed only up to that carrying amount of the asset before recognising impairment losses.
(f) Foreign exchange
Gains and losses arising in foreign currencies are translated to BGN at the official rates of exchange on the transaction date. Monetary assets and liabilities denominated in foreign currencies at the reporting date are translated at the official exchange rate of the Bank on that day. Foreign currency gains and losses resulting from the revaluation of monetary assets and liabilities are recognised in profit or loss. Non-monetary assets and liabilities denominated in foreign currency are retranslated to the functional cur-rency at the exchange rate at the date that the fair value was determined.
Outstanding forward contracts in foreign currency are marked to market. The gains and losses on revaluation of outstanding forward contacts are recognised in profit or loss.
The exchange rates of the major foreign currencies as of 31 December 2014 and 31 December 2013 are as follows:
Currency 31 December 2014 31 December 2013
US dollars 1 : BGN 1.60841 1 : BGN 1.41902
Euro 1 : BGN 1.95583 1 : BGN 1.95583
Special Drawing Rights 1 : BGN 2. 32959 1 : BGN 2. 18529
Gold 1 troy ounce: BGN 1909.95 1 troy ounce: BGN 1708.92
(g) Taxation
The Bank is not subject to income tax from its core activities. Income tax from subsidiar-ies for the period comprises current tax and deferred tax. Current tax comprises tax payable calculated on the basis of the expected taxable income for the period, using the effective tax rate or the current one at the reporting date. Deferred tax is derived using the balance sheet liability method on all temporary differences between the amounts used for taxation purposes and the carrying amounts of assets and liabilities.

105
Bulg
arian National B
ank Consolid
ated Financial S
tatements as of 31 D
ecemb
er 2014The deferred tax is calculated using tax rates which are expected to be applied for the period of asset realisation or liability settlement. The effect on the deferred tax from changes in the tax rates is recorded in the statement of comprehensive income up to the amount already charged or reported directly as other comprehensive income.
A deferred tax asset is recognised to the extent that is probable that future taxable prof-its will be available against which the unused tax losses or tax credit can be utilised. The deferred tax assets are reduced to the extent that it is no longer probable that the related tax benefit will be realised.
(h) Profit distribution policy of the Bank
The Bank’s policy of distribution of profit from banking operations is defined in the Law on the BNB. Internal rules for preparation of financial statements and accounting poli-cies were adopted upon a decision of the Governing Council effective from 1 January 2007, which are in compliance with Article 36, paragraphs 1 and 2 of the Law on the BNB. According to these rules, the Bank allocates to special reserves unrealised net gains and losses arising from revaluation of assets and liabilities denominated in foreign currency or gold. According to the requirements of Article 8, paragraph 2 of the Law on the BNB, the Bank sets aside 25 per cent of the excess of its annual revenue over its annual expenditure into a Reserve Fund. According to Article 8, paragraph 3 of the Law on the BNB, after the allocation to the Reserve Fund, the Bank may allocate reserves to cover market risk losses and other reserves upon a decision of the Governing Council. Subsequent to the allocation of reserves as required by the Law on the BNB, the Bank stipulates the remainder to be paid into the State Budget. The distribution of excess of revenue over expenditure is set out in note 23.
(i) Cash in hand and deposits in foreign currency
Cash and cash equivalents consist of cash in hand, current accounts and time deposits with maturities of less than three months.
(j) Employee benefits
The Bank has the obligation to pay certain amounts to each employee who retires in accordance with the requirements of Article 222, § 3 of the Labour Code in Bulgaria. According to these Labour Code requirements, on termination of the employment con-tract of an employee who has become entitled to retirement, the employer is obliged to pay him/her compensation amounting to twice his/her gross monthly salary. If, at the date of retirement, the employee has been employed by the Bank for ten or more years, the amount of the compensation is six gross monthly salaries. As of the date of the statement of financial position, the Bank’s Management estimates the approximate amount of the potential expenditures for all employees based on an actuarial report using the projected unit credit method. The estimated amount of the obligation and the main assumptions, on the base of which the estimation of the obligation has been made, is disclosed to the Financial Statements in note 10.
Termination benefits
Termination benefits are recognised as an expense when the Bank is committed demon-strably, without realistic possibility of withdrawal, to a formal detailed plan to either ter-minate employment before the normal retirement date, or to provide termination benefits as a result of an offer made to encourage voluntary redundancy. Termination benefits for voluntary redundancies are recognised as an expense if the Bank has made an offer of voluntary redundancy, it is probable that the offer will be accepted, and the number of acceptances can be estimated reliably. If benefits are payable more than 12 months after the reporting period, then they are discounted to their present value.
Short-term employee benefits
Short-term employee benefit obligations are measured on an undiscounted basis and are expensed as the related service is provided. A liability is recognised for the amount expected to be paid under short-term cash bonus or profit-sharing plans if the Bank has a present constructive obligation to pay this amount as a result of past services provided by the employee, and the obligation can be estimated reliably. The Bank recognises as a liability the undiscounted amount of the estimated costs related to annual leave expected to be paid in exchange for the employee’s service for the period completed.

Bul
gar
ian
Nat
iona
l Ban
k. A
nnua
l Rep
ort •
201
4
106
(k) New IFRS and interpretations (IFRIC) not yet adopted as of the reporting date
A number of new standards, amendments to standards and interpretations endorsed for adoption by the European Commission may be adopted earlier – for the year ended 31 December 2014. These amendments to IFRS were not adopted when preparing these Consolidated Financial Statements and the Bank does not intend to apply them earlier.
Standards, interpretations and amendments to standards, endorsed by the EC, that are not yet in force and have not been early adopted:
• Annual improvements to IFRS 2010–2012 and 2011–2013 cycles. The improvements include eleven amendments to nine standards and subsequent amendments to other standards and interpretations. None of these amendments can be expected to have substantial effect on the Bank’s financial statements.
Standards, interpretations and amendments to standards, issued by the IAS Board and the IFRS Interpretations Committee which so far the European Commission has not endorsed for adoption
Management believes that it is appropriate to disclose that the following new or revised standards, new interpretations and amendments to existing standards, already issued by the International Accounting Standards Board (IASB) as of the reporting date, are not yet endorsed for adoption by the European Commission and therefore were not applied in preparing these Financial Statements. The actual effective dates for their adoption will depend on the endorsement decision by the EC.
• IFRS 9 ‘Financial Instruments’ (issued on 24 July 2014);
• IFRS 14 ‘Regulatory Deferral Accounts’ (issued on 30 January 2014);
• IFRS 15 ‘Revenue from Contracts with Customers’ (issued on 28 May 2014);
• Amendments to IFRS 10 ‘Consolidated Financial Statements’, IFRS 12 ‘Disclosure of Interests in Other Entities’ and IAS 28 ‘Investment Companies: Applying the Consolidation Exception’ (issued on 18 December 2014);
• Amendments to IAS 1 ‘Disclosure Initiative’ (issued on 24 July 2014);
• Annual improvements to IFRS 2012–2014 Cycle (issued on 25 September 2014);
• Amendments to IFRS 10 and IAS 28 ‘Sale or Contribution of Assets between an Investor and its Associate or Joint Venture’ (issued on 11 September 2014);
• Amendments to IAS 27 ‘Equity Method in Separate Financial Statements’ (issued on 12 August 2014);
• Amendments to IAS 16 and IAS 38 ‘Clarification of Acceptable Methods of Depreciation and Amortisation’ (issued on 12 May 2014);
• Amendments to IFRS 11 ‘Accounting for Acquisitions of Interests in Joint Operations’ (issued on 6 May 2014).
6. Financial Risk Management Policy Disclosure
(а) Introduction and overview
The Bank is exposed to the following types of risk in relation to the operations with financial instruments:
• credit risk;
• liquidity risk;
• market risk;
• operational risk.
This note provides information on the Bank’s goals, exposures to each of the above types of risk and the policies and processes for risk measurement and management.
General provisions of risk management
In the process of management of the gross international reserves the Bank aims to achieve high security and liquidity of the assets, first, and then to maximise returns in the situation of the current global financial markets. Its investment strategy depends

107
Bulg
arian National B
ank Consolid
ated Financial S
tatements as of 31 D
ecemb
er 2014mainly on the specific function of a central bank operating under a currency board arrangement and in full compliance with the requirements of the Law on the BNB.
The major portion of BNB’s international reserves is invested in assets of very low credit risk such as discount and coupon securities issued by highly rated issuers (govern-ments, government agencies or supranational financial institutions), and short-term foreign currency or gold deposits placed with first-rate foreign banks. The remaining portion is held in SDRs and in monetary gold kept in the Bank’s vaults.
The risks of international reserve management are handled by an independent risk management unit. It is directly responsible for strategic asset structuring and setting up a benchmark for the international reserves, preparing and submitting investment management limits for approval. On a quarterly basis, an overall review is made of the changes in the market conditions, the amount and structure of international reserves, and, if required, the investment limits and model portfolios (benchmarks) are updated. The monitoring of underlying limits, rules, and procedures is undertaken on a daily basis. Reports are regularly prepared for both the needs of international reserves oper-ating management, and for providing updated information to the Bank’s management.
All approved financial instruments and asset classes, in which the BNB may invest, are specified in internal documents. The documents define the main portfolios and the respective model portfolios (benchmarks), all limits for credit, interest rate, cur-rency and operational risk, and give a list of the foreign financial institutions which are counterparties of the Bank.
The international reserves management is governed by rules of behaviour and proce-dures regulating the performance of the functions and tasks of the main structural units involved in the process.
(b) Credit risk
The BNB is exposed to credit risk through its trading operations and investment activi-ties and in cases where it acts as an intermediary on behalf of the government or other public institutions. The Bank assumes credit risk also in operations of purchases and sales of foreign currency with banks. In general, this credit risk is associated with the probability of insolvency of a BNB’s counterparty or the insolvency of an issuer, in whose debt instruments the Bank has invested its own funds. The credit risk in managing BNB’s gross international reserves is assessed in line with the requirements in Article 28, paragraph 3 of the Law on the BNB. According to these requirements, the BNB may invest in debt instruments issued by foreign governments, central banks, other foreign financial institutions or international financial organisations whose debts are rated with one of the top two grades by two internationally recognised credit rating agencies and are payable in freely convertible currency in line with internally devel-oped methodology as per the requirements of Article 28 of the LBNB.
According to these requirements, the approved types of financial instruments for invest-ment of funds in managing the international reserves are as follows:
• Investment programmes with central banks;
• Automatic borrowings/lending of securities with the main depository;
• Deposits in foreign currency (time deposits and funds on current accounts) with BNB counterparties, including central banks or supranational financial institutions;
• Deposits in gold (time deposits and funds on current accounts) with BNB counterpar-ties, including central banks or supranational financial institutions;
• Commercial securities (of up to 1 year term to maturity), issued by governments or government guaranteed institutions, supranational financial institutions, specialised financial agencies, banks, and other financial institutions – issuers of European cov-ered bonds;
• Bonds issued by governments or government guaranteed institutions, supranational financial institutions, specialised financial agencies, banks and other financial institu-tions – issuers of covered bonds. All bonds must be with a one-off payment of their face value on the maturity date and without any embedded option;
• Purchases and sales of foreign currency with a value date of up to two business days.
Two basic types of limits are set which are calculated based on the market value of foreign currency reserves: 1) maximum or minimum limit on the weight of each

Bul
gar
ian
Nat
iona
l Ban
k. A
nnua
l Rep
ort •
201
4
108
asset class and 2) individual maximum acceptable exposure of the BNB to an issuer/counterparty (concentration limit).
(c) Liquidity risk
Liquidity risk arises in the funding of the Bank’s core activities and in the management of positions. It is primarily manifested in two aspects: the first aspect is risk for the Bank of being unable to meet its obligations when due and the second aspect comprises the risk of its being unable to sell an asset on international markets at a fair value within an appropriate timeframe in compliance with the respective market conventions.
The BNB is striving to maintain a balance between the maturity of attracted funds and that of assets by means of investments in financial instruments of a different maturity structure. The instruments for attracting funds, which are provided to customers on the liability side, are primarily deposit/investment accounts and settlement accounts. The Bank maintains a minimum level of liquidity by type of currency on a daily basis to ensure all BNB payments in foreign currency. To better manage the risk arising from liquidation of positions in financial instruments, the latter are grouped by liquidity rank subject to the level of difficulty (i.e. discount from the fair value), at which they could be sold on the market in a time of crisis. Limits are set for the different types of financial instruments based on the liquidity ranks.
As part of its overall liquidity risk management strategy, the Bank has defined require-ments for the management of a portfolio of liquid assets denominated in euro and for maintaining assets denominated in other currencies for the purposes of meeting its cash inflows and outflows.
The Bank’s financial assets and liabilities, analysed by residual term to maturity from the date of the statement of the financial position to the date of any subsequent agree-ment or contractual maturity, are as follows:
(BGN’000)
Up to 1 month
From 1 month to 3 months
From 3 months to
1 year
From 1 year to 5 years
Over 5 years
Undefined maturity
Total
As of 31 December 2014
Financial assets
Cash and deposits in foreign currencies 5,859,646 677,456 - - - - 6,537,102
Gold, instruments in gold, and other precious metals 1,326,862 154,126 - - - 1,014,301 2,495,289
Financial assets at fair value through profit or loss 343,600 1,085,789 6,785,520 10,821,858 4,223,784 - 23,260,551
Financial assets available for sale 79,442 - - - - 1,467,507 1,546,949
Other assets 17,479 7,020 44,347 - - - 68,846
Total financial assets 7,627,029 1,924,391 6,829,867 10,821,858 4,223,784 2,481,808 33,908,737
Financial liabilities
Banknotes and coins in circulation - - - - - 11,586,943 11,586,943
Due to banks and other financial institutions 8,125,056 - - - - - 8,125,056
Liabilities to government institutions and other borrowings 7,005,995 21,514 - - - - 7,027,509
Borrowings against Bulgaria’s participation in international financial institutions - - - - - 2,835,018 2,835,018
Total financial liabilities 15,131,051 21,514 - - - 14,421,961 29,574,526
Asset-liability maturity mismatch (7,504,022) 1,902,877 6,829,867 10,821,858 4,223,784 (11,940,153) 4,334,211

109
Bulg
arian National B
ank Consolid
ated Financial S
tatements as of 31 D
ecemb
er 2014Up to
1 month
From 1 month to 3 months
From 3 months to
1 year
From 1 year to 5 years
Over 5 years
Undefined maturity
Total
As of 31 December 2013
Financial assets
Cash and deposits in foreign currencies 5,985,684 185,958 147,212 - - - 6,318,854
Gold, instruments in gold, and other precious metals 1,320,493 - - - - 907,988 2,228,481
Financial assets at fair value through profit or loss 1,611,734 2,081,718 5,612,763 10,092,365 225,346 - 19,623,926
Financial assets available for sale 74,521 - - - - 1,379,650 1,454,171
Other assets 17,902 9,000 22,484 - - - 49,386
Total financial assets 9,010,334 2,276,676 5,782,459 10,092,365 225,346 2,287,638 29,674,818
Financial liabilities
Banknotes and coins in circulation - - - - - 10,253,722 10,253,722
Due to banks and other financial institutions 7,063,410 - - - - - 7,063,410
Liabilities to government institutions and other borrowings 5,884,193 21,514 - - - - 5,905,707
Borrowings against Bulgaria’s participa-tion in international financial institutions - - - - - 2,659,865 2,659,865
Total financial liabilities 12,947,603 21,514 - - - 12,913,587 25,882,704
Asset-liability maturity mismatch (3,937,269) 2,255,162 5,782,459 10,092,365 225,346 (10,625,949) 3,792,114
The outstanding contractual maturities of the Bank’s financial liabilities are as follows:(BGN’000)
Book valueGross nominal outgoing cash
flow
Up to 1 month
From 1 month to 3 months
From 3 months to 1 year
From 1 year to 5 years
Over 5 years
As of 31 December 2014
Banknotes and coins in circulation 11,586,943 11,586,943 - - - - 11,586,943
Due to banks and other financial institutions 8,125,056 8,125,056 8,125,056 - - - -
Liabilities to government institutions and other borrowings 7,027,509 7,027,509 7,005,995 21,514 - - -
Borrowings against Bulgaria’s participation in international financial institutions 2,835,018 2,835,018 - - - - 2,835,018
29,574,526 29,574,526 15,131,051 21,514 - - 14,421,961
As of 31 December 2013
Banknotes and coins in circulation 10,253,722 10,253,722 - - - - 10,253,722
Due to banks and other financial institutions 7,063,410 7,063,410 7,063,410 - - - -
Liabilities to government institutions and other borrowings 5,905,707 5,905,707 5,884,193 21,514 - - -
Borrowings against Bulgaria’s participation in international financial institutions 2,659,865 2,659,865 - - - - 2,659,865
25,882,704 25,882,704 12,947,603 21,514 - - 12,913,587
(d) Market risk
Market risk
All financial instruments are subject to market risk, i.e. the risk of impairment as a result of changes in the market conditions. The instruments are evaluated on a daily basis at fair market value which best reflects current market conditions for the respective type of financial instrument. The Bank manages its portfolios in response to changing market conditions and to changes in the liability structure of Issue Department balance sheet. Market risk exposure is managed in accordance with the risk limits specified in the document ‘Investment Limits for the Management of the Gross International Reserves’.

Bul
gar
ian
Nat
iona
l Ban
k. A
nnua
l Rep
ort •
201
4
110
The table below presents an important measure of market risk, i.e. Value at Risk (VaR). VaR is an indicator of the maximum loss over a certain period of time (holding period) and with a certain probability (called confidence level or confidence interval). The VaR used in this report is based on a 95 per cent confidence level and a one-day holding period.
On the calculation of the total risk, the currency risk and the interest rate risk, the empiric distributions have been used, derived from time series of 30 daily observations of total income, currency income and interest income of assets, respectively. The cor-relation between the currency and interest rate risk is also presented. For each of the parameters, the value as of the last date for the period, average for the whole period, as well as minimum and maximum values have been calculated.
(BGN’000)
As of 31 December 2014 Average Maximum Minimum
Currency risk (32,964) (23,933) (41,506) (7,465)
Interest rate risk (7,720) (4,003) (9,196) (1,400)
Correlation (per cent) 0.07 0.24 0.65 (0.29)
Overall risk (35,797) (25,542) (46,563) (10,154)
As of 31 December 2013 Average Maximum Minimum Currency risk (50,188) (48,700) (107,536) (11,312)
Interest rate risk (5,723) (5,351) (11,587) (702)
Correlation (per cent) 0.19 0.14 0.60 (0.41) Overall risk (52,305) (50,104) (105,977) (9,121)
Interest rate risk
The Bank’s operations are subject to the risk of interest rate fluctuations, which impacts the prices of interest-earning assets (including investments) and interest-bearing liabilities. The Bank uses modified duration as a key measurement for interest rate risk. Modified duration measures the effect of the change in the market value of an asset (liability) in percentage points in response to a 1 basis point (1/100th of 1 per cent) change in the interest rate levels. In addition, portfolios’ technical parameters such as protuberance (convexity), duration in a fixed point of the yield curve, etc. are monitored on a daily basis. For each portfolio held by the BNB, the interest rate is limited by a model portfolio (benchmark) and by the investment limits for a maximum deviation of the modified duration of the portfolio from that of the respective benchmark.
Assets and liabilities with floating interest rates involve the risk of changes in the base which serves to determine the interest rates.
(BGN’000)
TotalFloating rate instruments
Fixed rate instruments
Up to 1 month
From 1 month to 3 months
Over 3 months
As of 31 December 2014
Interest-earning assets
Cash and deposits in foreign currencies 6,249,030 1,460,338 4,111,449 677,243 -
Gold, instruments in gold and other precious metals 1,480,491 - 1,326,414 154,077 -
Financial assets at fair value through profit or loss 23,219,611 254,542 301,811 1,035,786 21,627,472
Financial assets available for sale 79,442 - 79,442 - -
Other interest-earning assets 68,846 7,585 9,894 7,020 44,347
Total 31,097,420 1,722,465 5,829,010 1,874,126 21,671,819
Interest-bearing liabilities
Due to banks and other financial institutions 8,125,056 - 8,125,056 - -
Liabilities to government institutions and other borrowings 2,465,514 - 2,444,000 21,514 -
Borrowings against Bulgaria’s participation in international financial institutions 1,423,090 1,423,090 - - -
Total 12,013,660 1,423,090 10,569,056 21,514 -
Interest-bearing assets/liability gap 19,083,760 299,375 (4,740,046) 1,852,612 21,671,819

111
Bulg
arian National B
ank Consolid
ated Financial S
tatements as of 31 D
ecemb
er 2014As of 31 December 2013
Interest-earning assets
Cash and deposits in foreign currencies 6,298,511 1,951,740 4,013,791 185,804 147,176
Gold, instruments in gold and other precious metals 1,320,448 - 1,320,448 - -
Financial assets at fair value through profit or loss 19,632,459 575,065 1,507,000 2,029,141 15,521,253
Financial assets available for sale 74,521 - 74,521 - -
Other interest-earning assets 49,368 8,423 9,461 9,000 22,484
Total 27,375,307 2,535,228 6,925,221 2,223,945 15,690,913
Interest-bearing liabilities
Due to banks and other financial institutions 7,063,410 - 7,063,410 - -
Liabilities to government institutions and other borrowings 3,401,011 - 3,379,497 21,514 -
Borrowings against Bulgaria’s participation in international financial institutions 1,334,940 1,334,940 - - -
Total 11,799,361 1,334,940 10,442,907 21,514 -
Interest-bearing assets/liability gap 15,575,946 1,200,288 (3,517,686) 2,202,431 15,690,913
For managing interest rate risk and the band of interest rate changes, the sensitivity of financial assets and liabilities to various standard and non-standard interest rate movement scenarios are monitored.
The standard scenarios include the following changes in yield curves: 1) a 100 basis points instant and parallel increase; 2) a 100 basis points instant and parallel decrease; 3) a 50 basis points parallel increase in the yield curves for a period of 12 months, and 4) a 50 basis points parallel decrease in the yield curves also for a period of 12 months. The second two scenarios assume that the change in yields takes place at the begin-ning of the period and over the one-year period the yield curve remains unchanged.
The analysis of the sensitivity of the Bank’s assets (to first approximation) to changes in interest rates, assuming a constant spread of assets and liabilities and parallel shifts in the yield curves of the relevant assets, is as follows:
(BGN’000)
100 basis points instant parallel
increase
100 basis points parallel decrease
50 basis points parallel increase in the beginning
of the period
50 basis points parallel decrease in the beginning
of the period
As of 31 December 2014 (617,726) 617,726 (137,085) 200,398
As of 31 December 2013 (228,912) 228,912 64,204 53,969
Currency risk
For the Bank, a currency risk exists where there is a mismatch between the currency structure of assets and that of liabilities. From an accounting point of view, the Bank is exposed to currency risk when entering into transactions with financial instruments denominated in foreign currencies other than the euro.
With the introduction of the currency board arrangement in Bulgaria and the pegging of the Bulgarian currency to the euro, the Bank’s financial statements, prepared in Bulgarian levs, are affected by movements in the exchange rate of the lev against the currencies other than the euro.
To minimise currency risk, there is a limit to the mismatches between the currency structure of assets and that of liabilities. According to Article 31, paragraph 3 of the Law on the BNB, the total market value of assets in a foreign currency other than the euro, SDR and monetary gold may not deviate by more than +/-2 per cent from the market value of the liabilities denominated in these currencies.

Bul
gar
ian
Nat
iona
l Ban
k. A
nnua
l Rep
ort •
201
4
112
(BGN’000)
31 December 2014 31 December 2013
Assets
Bulgarian lev and euro 26,780,917 24,941,471
US dollar 1,930,093 7,468
Japanese yen 36 36
Pound sterling 547 267
SDR 2,939,576 2,757,605
Gold 2,460,874 2,197,242
Other 2,702 3,188
34,114,745 29,907,277
Liabilities, capital and reserves
Bulgarian lev and euro 29,344,688 27,235,293
US dollar 1,929,707 7,671
Japanese yen - -
Pound sterling 320 16
SDR 2,836,639 2,661,050
Other 3,391 3,247
34,114,745 29,907,277
Net position
Bulgarian lev and euro (2,563,771) (2,293,822)
US dollar 386 (203)
Japanese yen 36 36
Pound sterling 227 251
SDR 102,937 96,555
Gold 2,460,874 2,197,242
Other (689) (59)
(e) Using accounting judgements and assumptions
The Governing Council discusses the development, selection and disclosure of critical accounting policies and assumptions, as well as their application.
These disclosures supplement the notes to the financial risk management.
The Bank is operating in a complicated global economic and financial environment which also affects the Bulgarian market and could have negative implications for the Bank’s performance and risk. Management has already taken measures, and its major priorities in the next few years will still be to keep the Bank’s stable liquidity position and the continuous improvement in its evaluation methods, international reserves quality control and management.
(i) Determination of fair values
The determination of fair values of financial assets and liabilities for which there is no observable market price requires the use of valuation techniques described in the accounting policy. For financial instruments that trade infrequently and whose price is not transparent, the fair value is less objective and requires an expert’s judgement depending on liquidity, concentration, market factors uncertainty, pricing assumptions, and other risks affecting the particular instrument.
(ii) Valuation of financial instruments
The Bank measures the fair value of financial instruments using the following hierarchy of methods:
• Level 1: A quoted market price or closing price for positions for which there is a reli-able market;
• Level 2: Valuation techniques based on observable market information about the yield curve. This category of methods is used to measure debt securities for which there is no reliable market.
• Level 3: Valuation techniques, where inputs on financial assets and liabilities are not based on observable market data.

113
Bulg
arian National B
ank Consolid
ated Financial S
tatements as of 31 D
ecemb
er 2014The fair values of financial assets and liabilities traded in international financial markets for which there is available market information are based on market quotations or closing market prices. The use of observable market prices and information reduces the need for management judgement and estimation and also reduces the uncertainty associated with determination of fair values. The availability of actual market prices and information varies depending on products and markets and changes because of spe-cific events and the general conditions of financial markets. The Bank determines the fair values of all other financial instruments for which there are no current market quotes by using a valuation technique based on a net present value. The net present value is computed by means of market yield curves and credit spreads, where necessary, for the relevant instrument. The purpose of the valuation techniques is to determine a fair value which reflects the price of the financial instrument on the reporting date.
The Bank has established a control framework with respect to the measurement of fair values. The fair values of financial instruments controls are set by an independent risk analysis and control unit. Specific controls include: checking the actual price infor-mation; regular reviews of current valuation models and, if necessary, development, approval and introduction of new valuation models; follow-up verification by means of analysis and comparison of data from various information sources, etc.
The table below analyses financial instruments reported at fair value using valuation models. The data does not include equity instruments reported at acquisition cost (note14). (BGN’000)
Level 1Market quotes
in active markets
Level 2Valuation techniques
using market dataTotal
31 December 2014
Cash and deposits in foreign currency 6,537,102 - 6,537,102
Gold, instruments in gold and other precious metals 2,495,289 - 2,495,289
Financial assets at fair value through profit or loss 20,928,166 2,332,385 23,260,551
Total 29,960,557 2,332,385 32,292,942
31 December 2013
Cash and deposits in foreign currency 6,318,854 - 6,318,854
Gold, instruments in gold and other precious metals 2,228,481 - 2,228,481
Financial assets at fair value through profit or loss 19,164,306 459,620 19,623,926
Total 27,711,641 459,620 28,171,261
Financial instruments not measured at fair value, but by applying a level of the fair value hierarchy where a fair value measurement is categorised, are analysed in the table on page 114:

Bul
gar
ian
Nat
iona
l Ban
k. A
nnua
l Rep
ort •
201
4
114
(BGN’000)
Level 1Quoted market prices on
active markets
Level 2Observable inputs other than
quoted pricesTotal
31 December 2014
Due to banks and other financial institutions - 8,125,056 8,125,056Liabilities to government institutions and other borrowings - 7,027,509 7,027,509
Borrowings against Bulgaria’s participation in international financial institutions - 2,835,018 2,835,018
Total - 17,987,583 17,987,583
31 December 2013
Due to banks and other financial institutions - 7,063,410 7,063,410
Liabilities to government institutions and other borrowings - 5,905,707 5,905,707
Borrowings against Bulgaria’s participation in international financial institutions - 2,659,865 2,659,865
Total - 15,628,982 15,628,982
The fair value of due to banks and other financial institutions and of liabilities to govern-ment institutions is approximately equal to the reporting value as they are short-term.
The fair value of the liabilities for participation in international financial institutions is approximately equal to their reporting value as they are interest-free and of no definite maturity.
7. Interest Income and Expense (BGN’000)
2014 2013
Interest income– securities 386,162 427,772– deposits 11,145 7,542– other 105 2
397,412 435,316
Interest expense– deposits 1,498 1,201– other - -
1,498 1,201
Interest paid on foreign currency government deposits as at 31 December 2013 is as at 31 December 2014, there are no interest expenses paid on deposits of the government or other organisations denominated in lev or foreign currency.
Interest expenses paid on deposits include interest paid of BGN 101 thousand on deposits with foreign correspondent banks as a result of using negative reference interest rates.
In addition BGN 244 thousand interest paid on the technical account of the national system component TARGET2-BNB at the ECB are included. During the year, the ECB Governing Council set a negative interest rate for the Eurosystem’s deposit facility changing its values twice. Initially, as of 11 June 2014, the interest rate was fixed at -0.10 per cent and from 10 September 2014 it was reduced to -0.20 per cent.
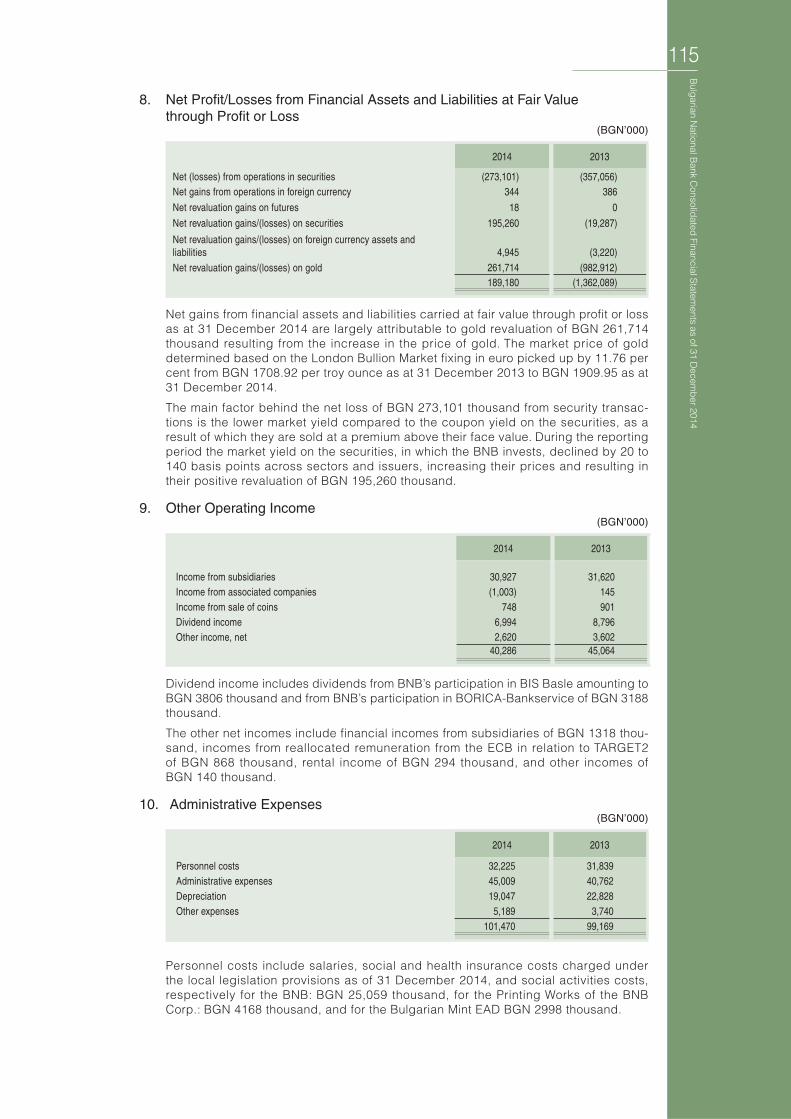
115
Bulg
arian National B
ank Consolid
ated Financial S
tatements as of 31 D
ecemb
er 20148. Net Profit/Losses from Financial Assets and Liabilities at Fair Value through Profit or Loss
(BGN’000)
2014 2013
Net (losses) from operations in securities (273,101) (357,056)Net gains from operations in foreign currency 344 386
Net revaluation gains on futures 18 0
Net revaluation gains/(losses) on securities 195,260 (19,287)
Net revaluation gains/(losses) on foreign currency assets and liabilities 4,945 (3,220)
Net revaluation gains/(losses) on gold 261,714 (982,912)189,180 (1,362,089)
Net gains from financial assets and liabilities carried at fair value through profit or loss as at 31 December 2014 are largely attributable to gold revaluation of BGN 261,714 thousand resulting from the increase in the price of gold. The market price of gold determined based on the London Bullion Market fixing in euro picked up by 11.76 per cent from BGN 1708.92 per troy ounce as at 31 December 2013 to BGN 1909.95 as at 31 December 2014.
The main factor behind the net loss of BGN 273,101 thousand from security transac-tions is the lower market yield compared to the coupon yield on the securities, as a result of which they are sold at a premium above their face value. During the reporting period the market yield on the securities, in which the BNB invests, declined by 20 to 140 basis points across sectors and issuers, increasing their prices and resulting in their positive revaluation of BGN 195,260 thousand.
9. Other Operating Income (BGN’000)
2014 2013
Income from subsidiaries 30,927 31,620Income from associated companies (1,003) 145Income from sale of coins 748 901Dividend income 6,994 8,796Other income, net 2,620 3,602
40,286 45,064
Dividend income includes dividends from BNB’s participation in BIS Basle amounting to BGN 3806 thousand and from BNB’s participation in BORICA-Bankservice of BGN 3188 thousand.
The other net incomes include financial incomes from subsidiaries of BGN 1318 thou-sand, incomes from reallocated remuneration from the ECB in relation to TARGET2 of BGN 868 thousand, rental income of BGN 294 thousand, and other incomes of BGN 140 thousand.
10. Administrative Expenses (BGN’000)
2014 2013
Personnel costs 32,225 31,839Administrative expenses 45,009 40,762Depreciation 19,047 22,828Other expenses 5,189 3,740
101,470 99,169
Personnel costs include salaries, social and health insurance costs charged under the local legislation provisions as of 31 December 2014, and social activities costs, respectively for the BNB: BGN 25,059 thousand, for the Printing Works of the BNB Corp.: BGN 4168 thousand, and for the Bulgarian Mint EAD BGN 2998 thousand.

Bul
gar
ian
Nat
iona
l Ban
k. A
nnua
l Rep
ort •
201
4
116
The number of employees of the Bank and its subsidiaries is 1155 as of 31 December 2014 (31 December 2013: 1170), including the BNB staff of 861 as of 31 December 2014 (31 December 2013: 869).
Based on actuarial calculations, the Bank has accrued compensation liabilities for personnel on retirement and for unused paid annual leave at BGN 461 thousand (31 December 2013: BGN 343 thousand). The retirement and unused paid annual leave compensation for the Bank’s subsidiaries as of 31 December 2014 are BGN 144 thousand (31 December 2013: BGN 122 thousand).
Staff retirement liabilities calculated based on actuarial valuation and pursuant to IAS 19 ‘Employee Benefits’ are given below:
(BGN’000)
2014
Defined benefit liabilities as at 1 January 2,136
Plan benefits paid (204)
Current service costs 214
Interest costs 66
Re-measurements -
Actuarial (gain) loss arising from experience adjustment -
Actuarial (gain) loss arising from change in demographic assumptions 109
Actuarial (gain) loss arising from change in financial assumptions (143)
Defined benefit liabilities as at 31 December 2,178
Costs carried through profit and loss (BGN’000)
2014
Current service costs 214
Interest costs 66
Actuarial (gains) losses (3)
Total 277
Actuarial assumptions
The key actuarial assumptions as at the Financial Statements date are the following (weighted average): (per cent)
2014
Discount interest rate as at 31 December 3.29
Future salary growth 3.5
Administrative expenses include the BNB’s currency circulation expenses of BGN 12,836 thousand as of 31 December 2014 (31 December 2013: BGN 9604 thousand).
11. Cash and Deposits in Foreign Currencies (BGN’000)
31 December 2014 31 December 2013
Cash in foreign currencies 287,495 19,363
Current accounts in other banks 1,456,067 1,945,825Deposits in foreign currencies 4,793,540 4,353,666
6,537,102 6,318,854

117
Bulg
arian National B
ank Consolid
ated Financial S
tatements as of 31 D
ecemb
er 2014Cash and deposits in foreign currencies with correspondents are disclosed as follows:
(BGN’000)
31 December 2014 31 December 2013
Euro area residents In EUR 683,840 2,717,094 In other currencies 691,640 1
1,375,480 2,717,095Non-euro area residents In EUR 2,500,019 2,254,172
In other currencies 2,661,603 1,347,5875,161,622 3,601,759
6,537,102 6,318,854
12. Gold, Instruments in Gold, and Other Precious Metals
31 December 2014 31 December 2013
’000 troy ounces BGN’000 ’000 troy ounces BGN’000
Gold bullion in standard form 513 979,886 513 876,749Gold deposits in standard form 775 1,480,988 773 1,320,493Gold in other form 16 30,787 16 27,563Other precious metals 3,628 3,676
2,495,289 2,228,481
Gold in standard form includes gold held for safekeeping with a depository and depos-its. Deposits in gold are held with banks whose liabilities are rated with one of the two highest ratings given by two internationally recognised rating agencies and bear interest between 0.13 per cent and 0.85 per cent annually.
Gold in other form includes commemorative gold coins of BGN 25,996 thousand.
Other precious metals include silver commemorative coins of BGN 510 thousand and platinum commemorative coins of BGN 3118 thousand.
13. Financial Assets at Fair Value through Profit or Loss (BGN’000)
Securities at fair value through profit or loss 31 December 2014 31 December 2013
Foreign treasury bills, notes and bonds 23,260,551 19,623,92623,260,551 19,623,926
Securities comprise both coupon and discount securities denominated in euro. The maximum coupon interest of the EUR-denominated securities was 2.01 per cent in 2014 (31 December 2013: 2.41 per cent).
As at 31 December 2014 there were no securities pledged as collateral on futures transactions
The securities issued by foreign governments and other issuers or relevant issuers with credit rating graded by at least two of the six internationally recognised credit rating agencies – Standard&Poor’s, Fitch Ratings, Moody’s, DBRS, R&I and JCR are disclosed as follows: (BGN’000)
Issuer’s credit rating 31 December 2014 31 December 2013Investment graded securities by the issue/issuer credit rating
ААА 13,629,360 14,491,901АА+ 2,576,563 1,506,276АА 48,924 229,419AA- 4,203,246 2,627,478А+ 2,495,317 587,776А 307,141 181,076
23,260,551 19,623,926

Bul
gar
ian
Nat
iona
l Ban
k. A
nnua
l Rep
ort •
201
4
118
14. Financial Assets Available for Sale (BGN’000)
31 December 2014 31 December 2013
Republic of Bulgaria’s quota in the IMF 1,491,404 1,399,023
Equity investments in international financial institutions 30,151 28,751
Investments in associates 25,394 26,397
1,546,949 1,454,171
The Republic of Bulgaria’s quota in the IMF is SDR 640,200 thousand. BGN 79,442 thousand of the Republic of Bulgaria’s quota in the IMF represents the reserve tranche held with the IMF. The IMF pays remuneration (interest) to those members who have a remunerated reserve tranche position, at an average rate of 0.08 per cent.
Equity investments in international financial institutions include the equity investment in the Bank for International Settlements (BIS), Basle, and 25 per cent of the equity investment in BIS Basle is paid up. As of 31 December 2014 the current value of 10,000 thousand shares in SDR amounts to BGN 23,296 thousand while as of 31 December 2013 it was BGN 21,853 thousand (ref. note 28). The capital subscribed, but not paid-in has an option to be paid in within three months upon a decision of the BIS Board of Governors.
Equity investments in international financial institutions do not exceed 10 per cent of the subscribed share capital of the respective institution.
Investments in international financial institutions also include BNB’s participation in the ECB. As of 1 January 2007 (when the Republic of Bulgaria joined the EU), the Bulgarian National Bank has a share in the ECB capital. As at 31 December 2014 the amount of the BNB paid-up share in the ECB capital is EUR 3487 thousand or BGN 6820 thousand.
Pursuant to Article 28 of the Statute of the ESCB and the ECB, only ESCB NCBs are entitled to participate in the ECB capital. Capital subscription follows the requirements and the key set forth in Article 29 of the Statute of the ESCB and ECB; i.e. the share of each NCB in the ECB capital is determined in percentage and corresponds to the share of the respective member-state in the EU’s total population and GDP (in equal propor-tions). The percentage is adjusted every five years and whenever a new member-state joins the EU. As at 31 December 2014, the BNB’s capital share in the ECB subscribed capital is 0.8590 per cent, which corresponds to EUR 92,986.8 thousand.
As a non-euro area NCB, the BNB is required to pay up the minimum percentage of its subscribed capital in the ECB, which is pursuant to Article 47 of the Statute of the ESCB and ECB (as set out by the ECB General Council) and represents the BNB contribution to the ECB operational costs. As of 29 December 2010 this percentage amounts to 3.75 per cent. Unlike euro area NCBs, the BNB is not entitled to the ECB’s distributable profit, nor is it required to fund any loss of the ECB. Upon joining the euro area, the BNB will be required to pay up the remaining 96.25 per cent of its capital subscription to the ECB, which is EUR 89,499.8 thousand.
Following the last five-yearly adjustment of the member-states’ capital key shares and with Latvia joining the euro area on 1 January 2014, the BNB’s capital key share was adjusted by reducing the BNB’s contribution to the ECB capital by EUR 22 thousand and as at 31 December 2014 it amounts to EUR 3487 thousand or BGN 6820 thousand (31 December 2013: EUR 3509 thousand or BGN 6863 thousand).
The Bank holds 100 per cent and 95.6 per cent, respectively, of the capital of Bulgarian Mint EAD and Printing Works of the BNB Corp.

119
Bulg
arian National B
ank Consolid
ated Financial S
tatements as of 31 D
ecemb
er 2014The Bank exercises significant influence on the financial and operational policies of the associated companies listed below, and its investments in domestic companies can be analysed as follows:
Associated companiesShare holding
per centPrincipal activity
BORICA–Bankservice AD 36.11 Interbank card payments
International Bank Institute OOD 44.23 Financial training and research
Cash Services Company AD 20.00 Handling of sealed parcels of Bulgarian coins and banknotes transferred from the BNB and the banks
15. Tangible Assets(BGN’000)
Land and buildings
Plant and equipment
IT equip-ment
Office equip-ment
Other equip-ment (includ-
ing motor vehicles)
Tangible assets in progress
Total
As of 1 January 2014 181,113 86,134 41,609 9,758 6,678 2,265 327,557
Additions 36 1,379 15 47 65 4,811 6,353
Disposals - (774) (828) (151) (16) (73) (1,842)
Transfers - 320 2,339 210 671 (3,540) -
As of 31 December 2014 181,149 87,059 43,135 9,864 7,398 3,463 332,068
Depreciation and impairment loss
As of 1 January 2014 (33,645) (57,994) (33,193) (6,843) (5,814) - (137,489)
Charge for the period (5,644) (5,464) (4,532) (835) (276) - (16,751)
On disposals - 771 827 146 16 - 1,760
As of 31 December 2014 (39,289) (62,687) (36,898) (7,532) (6,074) - (152,480)
Net book value as of 31 December 2014 141,860 24,372 6,237 2,332 1,324 3,463 179,588
Net book value as of 31 December 2013 147,468 28,140 8,416 2,915 864 2,265 190,068
As of 1 January 2013 184,256 113,635 37,397 9,538 6,695 13,059 364,580
Additions 1,375 11,835 19 29 8 5,517 18,783
Disposals (4,601) (39,801) (399) (49) (25) (10,931) (55,806)
Transfers 83 465 4,592 240 - (5,380) -
As of 31 December 2013 181,113 86,134 41,609 9,758 6,678 2,265 327,557
Depreciation and impairment loss
As of 1 January 2013 (28,677) (71,917) (28,901) (6,014) (5,513) - (141,022)
Charge for the period (5,729) (8,051) (4,691) (877) (325) - (19,673)
On disposals 761 21,974 399 48 24 - 23,206
As of 31 December 2013 (33,645) (57,994) (33,193) (6,843) (5,814) - (137,489)
Net book value as of 31 December 2013 147,468 28,140 8,416 2,915 864 2,265 190,068
Net book value as of 31 December 2012 155,579 41,718 8,496 3,524 1,182 13,059 223,558
In applying IAS 16 ‘Property, Plant and Equipment and BNB’s Internal Rules for Financial Statements and Accounting Policy’, as at December 2013 a review was made of the book value of tangible fixed assets stated in the Bank’s balance sheet. The fair value of land and buildings was determined by an external, independent and licensed assessor of recognised professional qualification and experience in assessing property of location and category similar to the assessed ones. As at 31 December 2014, the fair value of land and buildings did not differ materially from their book value as at the same date; therefore it is considered that the present book value of land and buildings on the Bank’s balance sheet fairly reflects their market value. The fair value of land and

Bul
gar
ian
Nat
iona
l Ban
k. A
nnua
l Rep
ort •
201
4
120
buildings is categorised as Level-3 fair value based on the input data for the given assessment technique.
For the remaining asset classes Plant and Machinery, Equipment, Vehicles, Fixtures and Fittings, the fair value is considered to be their present value on the Bank’s balance sheet as most of them were bought in the last four years and their book value is close to their fair value.
When revaluating tangible fixed assets the Bank derecognises the accrued depre-ciation at the expense of the gross book value of the assets and their net value is recalculated against the revalued amount.
16. Intangible Assets(BGN’000)
SoftwareOther intangible
assetsDevelopment
costsTotal
As of 1 January 2014 45,606 161 133 45,900
Additions - - 1,059 1,059
Disposals (139) - - (139)
Transfers 1,077 - (1,077) -
As of 31 December 2014 46,544 161 115 46,820
Depreciation and impairment loss
As of 1 January 2014 (41,043) (128) - (41,171)
Charge for the period (2,269) (27) - (2,296)
On disposals 138 - - 138
As of 31 December 2014 (43,174) (155) - (43,329)
Net book value as of 31 December 2014 3,370 6 115 3,491
Net book value as of 31 December 2013 4,563 33 133 4,729
Software includes, as of 31 December 2014, licenses purchased by the BNB to the total amount of BGN 365 thousand (31 December 2013: BGN 1017 thousand), and software products to the amount of BGN 694 thousand (31 December 2013: BGN 473 thousand).
(BGN’000)
SoftwareOther intangible
assetsDevelopment
costsTotal
As of 1 January 2013 44,265 152 - 44,417
Additions - 8 1,508 1,516
Disposals (33) - - (33)
Transfers 1,374 1 (1,375) -
As of 31 December 2013 45,606 161 133 45,900
Depreciation and impairment loss
As of 1 January 2013 (37,948) (101) - (38,049)
Charge for the period (3,128) (27) - (3,155)
On disposals 33 - - 33
As of 31 December 2013 (41,043) (128) - (41,171)
Net book value as of 31 December 2013 4,563 33 133 4,729
Net book value as of 31 December 2012 6,317 51 - 6,368
Software includes, as of 31 December 2013, licenses purchased by the BNB to the total amount of BGN 1017 thousand (31 December 2012: BGN 995 thousand), and software products to the amount of BGN 473 thousand (31 December 2012: BGN 1823 thousand).

121
Bulg
arian National B
ank Consolid
ated Financial S
tatements as of 31 D
ecemb
er 201417. Other Assets
(BGN’000)
31 December 2014 31 December 2013
Cash held by subsidiaries with local banks 68,879 49,386Investments of subsidiary undertakings in joint ventures and associates 6,091 19,034
Commemorative coins for sale 324 359
Inventories 11,973 14,143
Accounts receivable 1,808 2,091
Deferred charges 1,771 1,235
Other receivables 929 80091,775 87,048
Cash held by subsidiaries with local banks comprise BGN 61,286 thousand of Printing Works of the BNB Corp. and BGN 7593 thousand of Bulgarian Mint EAD.
Investments of subsidiary undertakings in joint ventures and associates include a non-monetary contribution in the form of banknote production equipment to the capital of François-Charles Oberthur Group with which BNB Printing Works AD has established a joint venture for banknote production. In 2014, a decision was taken to reduce the company’s capital and as a result of the reduction the BNB Printing Works AD received a payment of BGN 12,943 thousand.
18. Banknotes and Coins in Circulation (BGN’000)
31 December 2014 31 December 2013
Banknotes in circulation 11,354,769 10,041,360
Coins in circulation 232,174 212,362
11,586,943 10,253,722
19. Due to Banks and Other Financial Institutions (BGN’000)
31 December 2014 31 December 2013
Demand deposits from banks and other financial institutions
- in BGN 6,707,502 4,868,900
- in foreign currency 1,417,554 2,194,510
8,125,056 7,063,410
The Bank does not pay interest on demand deposits from banks and other financial institutions. Demand deposits include BGN 5,375,773 thousand representing the required reserves, which all local banks are required to maintain on accounts with the BNB (31 December 2013: BGN 5,329,979 thousand).
20. Liabilities to Government Institutions and Other Liabilities (BGN’000)
31 December 2014 31 December 2013
Current accounts:
- in BGN 1,217,327 1,043,314
- in foreign currency 3,344,668 1,461,382
Time deposit accounts:
- in BGN 2,444,000 2,983,000
- in foreign currency 21,514 418,011
7,027,509 5,905,707

Bul
gar
ian
Nat
iona
l Ban
k. A
nnua
l Rep
ort •
201
4
122
The government’s deposits and current accounts with the Bank comprise funds held on behalf of state budget and other government organisations. No interest is payable on the current accounts. The government deposits in euro and in BGN bear 0.00 per cent interest.
21. Borrowings against Bulgaria’s Participation in International Financial Institutions
The borrowings against Bulgaria’s participation in the IMF as of 31 December 2014 amount to BGN 1,408,233 thousand: SDR 604,475 thousand (as of 31 December 2013: BGN 1,321,004 thousand or SDR 604,475 thousand).
Borrowings from the IMF are denominated in SDRs. Borrowings related to Bulgaria’s quota in the IMF are non-interest bearing with no stated maturity. This note includes account No 1 and account No 2 of the IMF in levs amounting to BGN 3,576 thousand (as of 31 December 2013: BGN 3,689 thousand).
The Bank’s borrowings from the IMF of the general and special allocation of SDRs amount to SDR 474,586,534 and SDR 136,289,102, respectively. Repayment will take place on IMF’s demand. Under Article XX of IMF Statute, the Bank receives interest on the existing SDRs and pays a fee on its borrowings from the general and special allocation at the same interest rate.
22. Other Liabilities(BGN’000)
31 December 2014 31 December 2013
Funds of EU institutions and bodies 153,880 84,300
Salaries and social security payable 3,120 3,262
Deferred income 1,414 1,474
Other liabilities 31,425 54,234
189,839 143,270
‘Funds of EU institutions and bodies’ include European Commission’s funds and European Investment Bank’s funds. Pursuant to Article 9 of Council Regulation No 1150/2000 and Bulgaria’s participation in the funding of the EU budget, the Bank opened accounts of the European Commission. As at 31 December 2014 the funds on these accounts were BGN 153,876 thousand. The Bank opened accounts with the European Investment Bank (EIB) for the purposes of a financial arrangement between the Government of the Republic of Bulgarian and the EIB with the funds on these accounts amounting to BGN 4 thousand as at 31 December 2014.
23. Capital and Reserves
The capital of the Bank is determined by the Law on the BNB and amounts to BGN 20,000 thousand.
Non-monetary asset revaluation reserves comprises the net change in fair value of property, equity investments and other non-monetary assets.
Pursuant to Article 36 of the Law on the Bulgarian National Bank, unrealised gains/losses arising from the revaluation of assets and liabilities denominated in foreign cur-rencies or gold are transferred to a special reserve account and form special reserves.
Other reserves include the transfers to reserves of 25 per cent of the annual excess of revenue over expenditure after the allocation to special reserves, upon a decision of the BNB Governing Council.

123
Bulg
arian National B
ank Consolid
ated Financial S
tatements as of 31 D
ecemb
er 2014As of 31 December 2014 profit distribution in accordance with the profit distribution policy disclosed in note 5 (h) is as follows:
(BGN’000)
2014 2013
Profit/(Loss) for the period 529,993 (977,171)
Allocation to special reserve under Article 36 of the Law on the BNB:
Unrealised (gains)/loss from gold revaluation (261,714) 982,912Unrealised (gains)/loss from revaluation of financial assets at fair value through profit or loss (195,578) 75,761
Unrealised (gains)/loss from foreign currency valuation (4,945) 3,220
Other unrealised (gains) (18) -
Result after allocation to special reserve 67,738 84,722
incl.
Allocation to Reserve Fund under Article 8 of the LBNB 16,188 20,766
Result from consolidation and non-controlling interest 2,986 1,656
Allocation to a special-purpose fund under Article 8 of the LBNB - -
Planned contribution to the state budget 48,564 62,300
24. Non-controlling Interest
Printing Works of the BNB Corp is a joint-stock company with two shareholders: the BNB and the Government represented by the Ministry of Finance. The BNB holds 95.6 per cent of the company’s capital and the State holds the remaining 4.4 per cent of the company’s capital.
25. Monetary Liabilities and Gross International Reserves (BGN’000)
31 December 2014 31 December 2013
Gross international reserves
Cash and deposits in foreign currencies 6,537,102 6,318,854Monetary gold and other instruments in gold 2,460,874 2,197,242
Security investments 23,260,551 19,623,926
Equity investments and quota in the IMF 79,442 74,521
32,337,969 28,214,543
Monetary liabilities
Currency in circulation 11,586,943 10,253,722Due to banks and other financial institutions 7,999,377 7,063,308Liabilities to government institutions 6,716,855 4,418,743Other liabilities 590,212 1,571,366
26,893,387 23,307,139
Surplus of gross international reserves over monetary liabilities 5,444,582 4,907,404
Interest receivable and interest payable are carried to the relevant financial assets and liabilities.
Monetary gold and other instruments in gold are revalued on a daily basis based on the euro fixing of the London Bullion Market closing price.
26. Related Party Transactions
Bulgarian Government
International Monetary Fund
The Republic of Bulgaria’s quota in the IMF is secured by promissory notes jointly signed by the Bank and the Government (ref. note 21).

Bul
gar
ian
Nat
iona
l Ban
k. A
nnua
l Rep
ort •
201
4
124
Government bank accounts
Government budget organisations have current accounts and time deposits with the Bank (ref. note 20).
Fiduciary activities
In accordance with the Law on the BNB and under the terms agreed upon with the Minister of Finance, the BNB acts as an agent in government or government-guaranteed debts. With regard to this role, BNB performs agent and central depository services related to the administration and management of government securities issued by the Ministry of Finance. The Bank receives commission for providing these services. These government securities are not assets or liabilities of the BNB and are not recognised in its consolidated statement of financial position. The Bank is not exposed to any credit risk relating to government securities as it does not guarantee them. As of 31 December 2014, the par value of the government securities held in custody was BGN 8252 million (31 December 2013: BGN 6290 million).
27. Subsidiaries(per cent)
Ownership interest 31 December 2014 31 December 2013
Bulgarian Mint EAD 100 100
Printing Works of the BNB Corp (ref. note 24) 95.6 95.6
The net income from subsidiaries for the period comprises net profit of BGN 98 thousand from the Bulgarian Mint EAD (31 December 2013: BGN 540 thousand) and BGN 4087 thousand from the Printing Works of the BNB Corp (31 December 2013: BGN 971 thousand).
28. Commitments and Contingencies
(i) Participation in the Bank for International Settlements
The Bank holds 8000 shares of the capital of BIS, Basle, each amounting to SDR 5000. Twenty-five per cent of the equity investment in BIS, Baslе is paid up. The capital subscribed but not paid in is with an option to be paid in within three months following a decision of the BIS Board of Governors. The contingent amount as of 31 December 2014 is BGN 69,888 thousand (31 December 2013: BGN 65,559 thousand).
(ii) IMF quota and borrowings
The IMF quota is secured by promissory notes jointly signed by the Bank and the Government of the Republic of Bulgaria amounting to BGN 1,322,831 thousand.
(iii) Capital commitments
As of 31 December 2014 the Bank has committed to BGN 1359 thousand to purchase non-current assets (31 December 2013: BGN 465 thousand).
(iv) Other commitments and liabilities
There are no other outstanding guarantees, letters of credit or commitments to pur-chase or sell either gold, other precious metals or foreign currency.
29. Events Occurred after the Reporting Date
There are no events after the reporting date that require additional disclosure or adjust-ments to the Bank’s Financial Statements.

125
Major R
esolutions of the BN
B G
overning C
ouncil in 2014
6 February The BNB Governing Council considered the application from the ‘System for Electronic Payments’ AD, in which the company informed the BNB about its intention to terminate its activities as an operator of a payment system with settlement finality.
The Chairperson of the Conciliation Commission for Payment Disputes, Prof. Kamelia Kassabova, Ph.D., presented to the Governing Council of the Bulgarian National Bank the annual report on the Commission’s activities in 2013.
13 March Report on BNB Budget Implementation as of 31 December 2013 was approved.
The BNB Governing Council considered the application and refused to issue a payment institution license to Bulgarian Posts EAD, submitted to the BNB under Article 10, paragraph 1 of the Law on Payment Services and Payment Systems.
Ordinance on Amendment of BNB Ordinance No 16 of 2009 on Payment Institutions and Payment System Operators Licensing was adopted.
New BNB Ordinance No 27 on the Balance of Payments Statist ics, International Investment Position and Securities Statistics was adopted.
24 April The BNB Annual Report for 2013 was approved.
Ordinance No 7 of 2006 on Large Exposures of Banks was repealed.
Ordinance No 8 of 2006 on the Capital Adequacy of Credit Institutions was repealed.
Ordinance No 9 of 2008 on the Evaluation and Classification of Risk Exposures of Banks and the Allocation of Specific Provisions for Credit Risk was repealed.
Ordinance No 12 of 2007 on the Supervision on a Consolidated Basis was repealed.
Ordinance No 17 of 2001 on Establishing the Amount of Bank Investment under Article 47 of the Law on Credit Institutions was repealed.
Ordinance on Amendment of BNB Ordinance No 2 of 2006 on the Licenses, Approvals and Permissions Granted by the Bulgarian National Bank According to the Law on Credit Institutions was adopted.
Ordinance on Amendment of BNB Ordinance No 20 of 2009 on the Issuance of Approvals under Article 11, Paragraph 3 of the Law on Credit Institutions was adopted.
Ordinance on Amendment of BNB Ordinance No 11 of 2007 on Bank Liquidity Manage-ment and Supervision was adopted.
Ordinance on Amendment of BNB Ordinance No 4 of 2010 on the Requirements for Remunerations in Banks was adopted.
Ordinance No 7 on Organisation and Management of Risks in Banks was adopted.
Ordinance No 8 on Banks’ Capital Buffers was adopted.
As of 19 May 2014 the Bulgarian National Bank put into circulation a silver commemora-tive coin ‘Troyan Monastery’ of the ‘Bulgarian Churches and Monasteries’ series with a nominal value of BGN 10, issue 2014.
Major Resolutions of the BNB Governing Council in 2014

Bul
gar
ian
Nat
iona
l Ban
k. A
nnua
l Rep
ort •
201
4
126
13 May The BNB Governing Council approved the 2013 Budget Performance Report on the Administrative Expenses of the Bulgarian Deposit Insur-ance Fund.
Ordinance on Amendment of BNB Ordinance No 26 of 23 April 2009 on Financial Institutions was adopted.
29 May The BNB Governing Council decided to set a systemic risk buffer at 3 per cent of risk-weighted exposures formed by banks under § 8 of the Transitional and Final Provisions in connection with Article 12 of the BNB Ordinance No 8 on the Banks’ Capital Buffers, confirming the requirement for maintaining a capital conservation buffer of 2.5 per cent under Article 3, paragraph 1 of the BNB Ordinance No 8 of 24 April 2014 on Banks’ Capital Buffers.
The capital conservation buffer is applicable after the entry into force of this Ordinance as of 24 April 2014.
The systemic risk buffer is effective as of 1 October 2014 and is applied to all banks in Bulgaria.
19 June As of 14 July 2014 the Bulgarian National Bank put into circulation a gold commemorative coin ‘St. Prophet Elijah’ of the ‘Bulgarian Iconog-raphy’ series with a nominal value of BGN 100, issue 2014.
The BNB Governing Council accepts by its decision that ‘indicators published by the Bulgarian National Bank’ within the meaning of the Law on Consumer Credit shall be the interest rate statistics data com-piled by the Bulgarian National Bank under the Law on the BNB and the applicable European directives and regulations.
20 June Corporate Commercial Bank AD was placed under three-month conser-vatorship.
22 June CB Victoria EAD was placed under three-month conservatorship.
30 June The BNB made a decision to reduce the interest rates on deposits held with Corporate Commercial Bank AD and CB Victoria EAD down to the average market rate for the banking system by type, maturity and currency. In the cases where these rates are lower than the average market rate in May 2014, they remain unchanged.
Ordinance on Amendment of BNB Ordinance No 6 on Extending Col-lateralised Lev Loans to Banks was adopted.
22 July The BNB Governing Council instructed the conservators of Crédit Ag-ricole Bulgaria EAD to take the necessary actions for recording the relevant changes in the circumstances (changes in the company name and in the sole owner of the capital) into the Commercial Register.
(Accordingly, on 8 August 2014 these changes were entered in the Commercial Register. The new company name of the bank is Commer-cial Bank Victoria AD.)

127
Major R
esolutions of the BN
B G
overning C
ouncil in 201431 July The BNB Governing Council adopted Ordinance on Amendment of BNB
Ordinance No 26 of 2009 on Financial Institutions.
In relation to the Report on the Current Position of the bank and its un-audited financial report as of 30 June 2014 provided by the conserva-tors of Corporate Commercial Bank AD (KTB AD):
1. The BNB Governing Council adopted the Report on the Current Posi-tion of the Corporate Commercial Bank AD submitted by the conser-vators in compliance with the requirement of Article 121 of the Law on Credit Institutions.
2. Pursuant to Article 107, paragraph 3 of the Law on Credit Institutions the BNB Governing Council issued the following mandatory instruc-tions to the conservators of Corporate Commercial Bank AD:
2.1. To set up a special team which, by 15 September 2014, must organise the preparation of the credit files for the purpose of the audit assessment, and must assist the conservators in managing the relations with borrowers, including for implementation of the actions needed to be taken with regard to debtors who do not regularly service their obligations to the bank;
2.2. To sign a contract for legal advice on the collateral review as part of compiling and preparing the credit files;
2.3. To sign additional contracts with the auditing companies (Ernst and Young Audit OOD, Deloitte Audit OOD, and AFA OOD) for preparing a comprehensive assessment of the bank’s assets, to be completed by 20 October 2014, based on the results under items 2.1 and 2.2;
2.4. To propose to the BNB a draft invitation to the shareholders to declare their interest in, and possibility of, providing both capital and liquidity support to KTB;
2.5. By 20 August 2014 they must make changes to the internal rules and procedures for determining the impairments of credit exposures with a view to determining on an individual basis the impairments of exposures with significant defaults, thus ensur-ing full compliance with IFRS;
By 5 September 2014 the conservators must provide the BNB with information about the progress on the fulf i lment of the above prescriptions.
3. To assign to the acting Deputy Governor in charge of the Banking Supervision Department in accordance with the described above activities of the conservators to submit till 10 September 2014 to the BNB Governing Council a proposal for the necessary extension of the special supervision of KTB.
The conservators’ report on the current position of Corporate Com-mercial Bank AD – without information, representing bank and/or professional secrecy – is published on the BNB website.
15 August The BNB Governing Council adopted the following resolutions: 1. Pursuant to Article 116, paragraph 2, item 3 regarding Article 103,
paragraph 2, item 24 of the Law on Credit Institutions and Article 16, item 16 of the Law on the BNB, having regard to the interest of the debtors on loans and the institutions placed under conservatorship by Resolution No 73 of 20 June 2014 and Resolution No 76 of 22 June 2014 of the BNB Governing Council, KTB and CB Victoria were allowed to conduct the following bank operations for the purpose of loan repayment:

Bul
gar
ian
Nat
iona
l Ban
k. A
nnua
l Rep
ort •
201
4
128
– payment operations for repaying loans to a bank under conser-vatorship, from accounts with the same bank of the borrower, ofhis/her co-debtor or surety when the co-debt or suretyship wascreated before 1 June 2014;
– cashless foreign currency exchange transactions when these areneeded for repaying loans.
2. Pursuant to Article 107, paragraph 3 of the Law on Credit Institutionsand Article 16, item 17 of the Law on the BNB, the BNB GoverningCouncil instructed the conservators of the banks placed under spe-cial supervision to take the necessary actions for cancelling the loancollateral in case of full repayment of a loan receivable. In case ofpartial repayment of a loan receivable having more than one itemof collateral, the conservators of a bank under special supervisionshall take the necessary actions to release some of these items ofcollateral if the loan remains secured with liquid and quality collat-eral whose amount is established after carrying out its up-to-dateassessment and is not less than 130 per cent of the loan receivableamount.
3. Under Article 16, item 17 of the Law on the BNB, the BNB Govern-ing Council expressed the position that a transfer of a receivable on a deposit with a bank under special supervision from the deposit holder to another person who has an account with the same bank may be declared null and void because of circumventing the in-sured amount of deposits under Article 4, paragraph 1 of the Law on Bank Deposit Guarantee, or because that damages the interests of creditors.
16 September The BNB Governing Council made a decision to extend the term of special supervision of KTB and CB Victoria by another two months to 20 and 22 November 2014, respectively.
6 November The BNB Governing Council revoked the permit issued to Corporate Commercial Bank AD under Order No BNB – 43011 of 28 March 2014 of the BNB Deputy Governor in charge of the Banking Supervision Department. In accordance with this order KTB AD was permitted to include in its tier two capital an amount equal to the lev equivalent of EUR 35,000,000, attracted under a loan agreement for provision of funds in the form of a subordinated term debt, concluded on 24 March 2014 between the bank as a borrower and Technology Centre – Institute of Microelectronics (TC – IME) AD as a lender.
The BNB Governing Council revoked the banking license of Corporate Commercial Bank AD under Article 36, paragraph 2, item 2 regarding Article 103, paragraph 2, item 25 and Article 151, paragraph 1, motion one of the Law on Credit Institutions and Article 16, item 15 of the Law on the Bulgarian National Bank.
As of 15 December 2014 the BNB put into circulation a partially gold-plated si lver commemorative coin ‘Tsar Simeon the Great ’ of the ‘Medieval Bulgarian Rulers’ series with a nominal value of BGN 10, issue 2014.
13 November The BNB Governing Council approved a Draft Law Amending the Law on Bank Deposit Guarantee.

129
Major R
esolutions of the BN
B G
overning C
ouncil in 201419 November The BNB Governing Council gave mandatory instructions to the conser-
vators to make the necessary organisation of work so that unrestricted servicing of CB Victoria EAD depositors could start on 12 December 2014.
The BNB Governing Council approved the cover design of the 2015 issue coin with a nominal value of 2 levs.
27 November The BNB Governing Council approved the Report of the Bulgarian Na-tional Bank for the January – June 2014 period.
The BNB Governing Council approved the BNB budget for 2015.
16 December As of 12 January 2015 the Bulgarian National Bank put in circulation silver commemorative coin with an embedded medallion ‘100 Years of Bulgarian Cinema’ with a nominal value of BGN 10, issue 2015.
