00318 capital expenditure forecast unit cost methodologies … energy - 07.00... · capital...
TRANSCRIPT

Capital Expenditure Forecast Unit Cost Methodologies ii
Contents 1. About this summary document ................................................................................................. 3
1.1 Purpose ........................................................................................................................... 3
1.2 Structure ......................................................................................................................... 3
2. Methodology and approach ...................................................................................................... 5
2.1 Objective of unit cost estimation ...................................................................................... 5
2.2 Nature of unit cost estimation methodologies .................................................................. 6
2.3 Development of unit costs within the current regulatory period ........................................ 7
3. Specified investments methodology ......................................................................................... 9
3.1 Strategic estimates (Gate 1) .......................................................................................... 10
3.2 Concept estimates (Gate 2) ........................................................................................... 10
3.3 Detail design and construct estimates (Gate 3) ............................................................. 10
3.4 Application of uplift costs to specified investments ........................................................ 11
4. Program of work investments methodology ............................................................................ 12
4.1 Historic average cost program estimates ....................................................................... 12
4.2 Bottom-up program estimates ....................................................................................... 12
4.3 Application of uplift costs to program of work investments ............................................. 13
4.4 Detailed information ...................................................................................................... 15
5. Summary of network capital expenditure categories ............................................................... 16
6. Specified investments............................................................................................................. 19
6.1 Sub transmission and Distribution Augmentation .......................................................... 19
6.2 Operational Technology ................................................................................................ 23
6.3 Telecommunications ..................................................................................................... 28
6.4 Metering ........................................................................................................................ 29
7. Program estimates ................................................................................................................. 31
7.1 Distribution and Low Voltage Augmentation .................................................................. 31
7.2 Customer Initiated Capital Works .................................................................................. 35
7.2 Photovoltaic related augmentation ................................................................................ 37
7.3 Asset renewal and refurbishment .................................................................................. 39
7.4 Network Reliability and Power Quality ........................................................................... 52
7.5 Other Systems and Enabling Technology ...................................................................... 56
8. Appendices ............................................................................................................................ 61
Appendix A. Definitions, acronyms, and abbreviations ......................................................... 61
Appendix B. References ...................................................................................................... 64
Capital Expenditure Forecast Unit Cost Methodologies 3
1. About this summary document This section explains the purpose and structure of this summary document.
1.1 Purpose
The purpose of this summary document is to explain and justify the methodologies applied by Ergon Energy to develop unit cost estimates for its Standard Control Services (SCS) and Alternative Control Services (ACS) for the next regulatory control period, 1 July 2015 to 30 June 2020. The cost estimates provide the building blocks for the network capital expenditure forecast and specifically apply to the following capital expenditure categories:
• Customer Initiated Capital Works
• Augmentation Expenditure
• Renewal Expenditure
• Reliability and Power Quality Expenditure
• Other System and Enabling Technology Expenditure This document should be read in conjunction with the ‘Forecast Expenditure Summary’ documents for each capital category listed above. While this document aims to provide the reader with a full understanding of Ergon Energy’s unit costs, this is a summary document and therefore addresses some matters at a relatively high level. Further, the document references other documents and appendices in the provision of additional detail and clarification. All unit costs presented in this document are in real 2012-13 dollars. At the time of preparation, this ensures unit costs align with the most recent audited financial statements being the 2012-13 year. Escalation of the network capital expenditure forecasts, for Ergon Energy’s regulatory submission, is to real 2014-15 dollars.
Importantly, this summary document only explains and justifies Ergon Energy’s direct estimated costs. Ergon Energy applies real cost escalations and shared costs (overheads) to these direct costs to determine its total capital expenditure. Ergon Energy has prepared, and provided to the Australian Energy Regulator separate documents that explain and justify, for all of its capital expenditure categories, how it applies these real cost escalations and shared costs (overheads). Readers should take care in examining the (un-escalated) direct costs in this summary document to avoid confusion with:
• direct costs, inclusive of real cost escalations
• total costs, inclusive of direct costs, real cost escalations and shared costs (overheads).
1.2 Structure
The structure of this summary document is as follows: Section 2 details Ergon Energy’s general approach to developing the capital expenditure forecast. The aim is to provide the reader with a simple explanation of the conceptual approach taken in calculating the forecast and applying the estimated costs. Section 3 details Ergon Energy’s general approach to developing cost estimates for specified projects. The aim is to provide the reader with a simple explanation of the approach taken to estimate a project over the various phases of its lifecycle. In addition, it guides the reader to detailed

Capital Expenditure Forecast Unit Cost Methodologies 4
information on the Ergon Energy’s Estimating systems and the actual estimates used in development of its standard control services for the next regulatory control period. Section 4 details Ergon Energy’s general approach to developing cost estimates for programs of work. The aim is to provide the reader with a simple explanation of the approach taken to estimating each program. In addition it guides the reader to the actual estimates used in development of its standard control services for the next regulatory control period. Section 5 shows the relationship between the capital expenditure categories, Ergon Energy’s operational work streams responsible for the forecasts, and identifies whether the forecasts are specified investments or programs of work. Section 6 details the specified projects that comprise Ergon Energy’s regulatory submission. The aim is to provide the reader with an overview of the specified investments and the approach to developing the costs for these. Section 7 details the programs of work that comprise Ergon Energy’s regulatory submission. The aim is to provide the reader with an overview of the programs of work and the approach to developing the costs for these.

Capital Expenditure Forecast Unit Cost Methodologies 5
2. Methodology and approach
2.1 Objective of unit cost estimation
Investment cost estimation is part of a broader strategic approach to investment governance employed by Ergon Energy. It is a key component in the development and management of the overall network capital portfolio governance. The approach to network capital portfolio governance aims to ensure that all capital investments for Ergon Energy are governed, developed, approved and executed in a consistent, prudent and effective manner. The objective is to ensure the safe, sustainable and timely execution of the complete capital portfolio delivering customer satisfaction and corporate value in accordance with the regulatory determination. Cost estimating is one of three steps in cost management: 1. Cost estimating - Estimates provide the approximate cost of resources and materials to complete
the projects and program investments (forecast). 2. Cost budgeting – establish the project baseline from the estimated costs – an approved budget to
proceed. 3. Cost control – influence expenditure/vary costs against project budget – control
variances/changes to budget.
Cost estimating, the subject of this paper, specifically supports the forecast expenditure for the next regulatory period. These cost estimates are used to develop projects and programs that are subject to relevant endorsement and approvals via Ergon Energy’s governance processes. Two key aspects being:
• a review and endorsement by various committees inclusive of: o Network Investment Review Committee (NIRC) ($0.5m to $10m) o Investment Review Committee (IRC) (>$10m to $20m) o Board (>$20m)
• subsequent approval in accordance with the ‘Ergon Energy Financial Delegation of Authority’. Each of the investment committees, the NIRC and the IRC have charters that govern the process, the meeting and the delegation of approvals. Refer to the ‘Network Investment Review Committee (NIRC) Charter dated July 2014’ and the ‘Investment Review Committee Charter dated July 2014’. The introduction of a gated methodology linked with estimate confidence and management of uncertainty is applicable to all investment activity requiring a business case across all programs of work. For further details, refer to the ‘Network Portfolio Project and Program Investment Approval Governance’

Capital Expenditure Forecast Unit Cost Methodologies 6
Unit Cost Estimation Methodologies
Specified Investment
Bottom up
Market quotes
Program of Works
Bottom up
Historical costs
2.2 Nature of unit cost estimation methodologies
Ergon Energy uses the Ellipse Enterprise Resource Planning (ERP) (See Figure 1) system to develop, monitor, analyse and review capital investments over the investment lifecycle. Ergon Energy applies two different approaches to the development of its capital expenditure forecast:
• specified investment, or specified project
• unspecified investment, or program of works
Figure 1: Components of unit cost estimation methodologies employed by Ergon Energy
The decision as to which approach is taken depends on the level of certainty of critical planning aspects. These critical planning aspects include the location and timing of the expenditure driver to develop a solution and the subsequent detailed scope. For a specified investment, Ergon Energy develops a cost estimate for all projects in support of a business case, when there is certainty around the constraint, scope, location, and timing of the investment. The cost estimate is developed (within the Ellipse ERP) itemised via labour, materials, equipment and other resources required to deliver the project’s defined scope of work. In limited instances the cost estimate is developed outside of the Ellipse system based upon market quotations and vendor pricing. This will occur for projects such as the purchase of an IT system, or where the undertaking of a competitive tender process. Where there is some uncertainty in the scope, location or if the investment involves significant volumes of low cost recurrent work, Ergon Energy has developed an expenditure forecast that is based on a prediction of volumes multiplied by a unit cost or program estimate. The unit cost is based on a bottom up build of costs to perform the work, or in the alternative, the estimate is derived from the cost of similar historical works performed. This type of forecast is defined as a ‘program of works’. It is generally used to provide an expenditure forecast out to seven years. Annually the consolidation of these programs will result in the production of the annual baseline forecasts to facilitate resource planning and delivery. Over the investment lifecycle and because of the gated methodology greater certainty as to cost and delivery is achieved. As such, these programs may fund new specified investments that may impact the next regulatory period. Where a specified project or sub program becomes certain during the next regulatory period then as per all new investments, they are subject to the appropriate endorsement and approval process.

Capital Expenditure Forecast Unit Cost Methodologies 7
For both investment types the cost estimates:
• are based on scopes of work that are verified by subject matter experts in the field that they pertain
• exclude the cost of borrowings, unknown costs, and uncertainty allowances;
• are created by estimating specialists that update the Ellipse ERP estimates when the standard designs change
• are reviewed, refined and revised as each specified investment progresses through Ergon Energy’s gated governance methodology to obtain financial approval for investments
• are the most current estimate based on each project’s lifecycle of development, given that Ergon Energy’s specified projects may be at various lifecycle phases as at the time of this regulatory submission.
2.3 Development of unit costs within the current regulatory period
In 2011, Ergon Energy embarked on a process to improve the robustness of its network expenditure governance system. A key component of which is the estimating processes. The objective was to adopt a standardised approach to estimation across the organisation and consolidate the estimation approaches used by Ergon Energy’s predecessor companies. At the completion of project implementation, the result was a comprehensive database of several hundred standard and program estimates (in the Ellipse ERP) that form the basis for specified investment and programs of works expenditure forecasts. The estimating process in the Ellipse ERP allows the user to:
• create a job estimate from a standard estimate
• modify a job estimate to reflect refinements in design
• create a variation
• show how risk is dealt with
• stage a project phase
• package estimates
• schedule estimates
• create a major material procurement estimate (plan)
• create a requisition for major plant with long lead times The benefits of this approach are:
• improved management of financial risk in capital works delivery
• controlled management to the annual program budget
• consistency across the organisation
• streamline estimation processes that include regular review and validation. The costs estimates described in this document are applied to specified projects and unspecified programs to produce capital expenditure forecasts for each capital expenditure category. How this is performed is described in more detail in the ‘Network Capital Expenditure Forecast Model Summary’ and associated Excel model. For the regulatory control period 2015-20, Ergon Energy has prepared its network capital expenditure forecasts based on a robust set of current and transparent unit costs. Further, it has developed

Capital Expenditure Forecast Unit Cost Methodologies 8
business cases for each investment (specified project and program of work) to support its regulatory proposal.

Capital Expenditure Forecast Unit Cost Methodologies 9
3. Specified investments methodology These investments begin with a single or combination of multiple standard estimates. Standard estimates are ready-made estimates based on standard designs and drawings, e.g. the Z6-20 Substation. The repository for these estimates is the Ellipse system, Ergon Energy’s enterprise resource planning software package. A standard estimate provides a consistent and efficient basis for producing project cost estimates for works repeatedly undertaken. A standard estimate in Ellipse has an appropriate structure for estimating direct and known costs and on-costs dependent on its intended use. Standard estimates exclude the cost of borrowings, unknown costs, and uncertainty allowances. Estimating specialists create the standard estimates and update these when the standard designs change. Effectively these estimates are templates and are modified as required to accommodate the specific requirements of the investment. There are a limited number of specified investments in Ergon Energy’s regulatory submission that do not use a standard estimate. These exceptions occur when the proposed investment is unlikely to be repeatedly undertaken. An example would be a new specific project such as an IT software purchase. For these investments, the estimates are developed outside the Ellipse system and have regard for cost information including market quotations and estimates. As a specified project progresses, it moves through five different phases of Ergon Energy’s project management process. The gated governance methodology is designed to manage uncertainties and risks associated with the project at regular intervals by building in review of proposed expenditure for prudency and efficiency at each gate as the project moves through the investment lifecycle. Figure 2 shows the alignment of the five phases each project progresses through with Ergon Energy’s gated approach for obtaining financial approval.

Capital Expenditure Forecast Unit Cost Methodologies 10
Figure 2: Source document ‘About Ellipse Estimating’ Version 1.8
3.1 Strategic estimates (Gate 1)
The relevant planning groups are responsible for developing strategic estimates to assess and cost options to outwork identified needs, constraints, or opportunities. Strategic estimates exclude mobilisation costs that are normally included as the project progresses through to the concept development stage. However, preparation of Ergon Energy’s regulatory submission has included an estimated mobilisation cost in all strategic estimates. Strategic estimates are suitable to develop a forecast of expenditure for three to ten years in the future and have a ±30–50% certainty. It should be noted that in terms of approval at each gate, only the expenditure to outwork the next phase of the project is approved, to allow the scope and corresponding estimate to be re-estimated and reassessed at the next required gate.
3.2 Concept estimates (Gate 2)
The development of a concept design for the recommended option of the approved (Gate 1) business case occurs simultaneously with refinement of the estimate to align with the concept scope. These are prepared for the submission of the concept level (Gate 2) business case. Concept estimates provide sufficient business confidence for the project to further refine forecast expenditure and facilitate inclusion in resource planning and strategic logistics acquisitioning for the future two to three years. However, the exception is large projects with long-cycle times that require a longer planning period such as a new zone substation. The scope development is in sufficient detail to support an estimate that is within ±15-20% certainty.
3.3 Detail design and construct estimates (Gate 3)
If a Gate 2 business case is approved a detailed estimate is prepared to support the Gate 3 business case submission. When the business case is approved this will lead to the approval for funding to begin detailed design and construction of the project. Three avenues exist for producing detailed design estimates. 1. External detailed design and construct estimates – these are estimates with planning for external
parties to deliver portions of the project. Development of the project scope will be in sufficient detail for the market to provide a schedule of rates and an estimated design cost.
2. Internal detailed design and construct estimates – these are estimates where development of the scope of the project is in sufficient detail for the business to develop, with confidence, a detailed design and construct estimate. A scope of work supports the detailed design and construct estimate. This uses the Gate 2 estimate as a starting point, adding or refining items, and costs to account for the proposed investment’s specific risks, issues, and project delivery.
3. Market estimates – these are estimates where development of the scope of the project is in sufficient detail with the appropriate confidence for the market to provide a quoted lump sum design cost.
For all avenues above, the development of the scope is in sufficient detail to constitute a detailed design estimate to provide an estimate with ±10% certainty. Annual updating of estimates for variations in labour rates, and material costs upon renewal of material procurement contracts, further support the robustness of Ergon Energy’s gated governance estimating process.
Capital Expenditure Forecast Unit Cost Methodologies 11
3.4 Application of uplift costs to specified investments
Generally, specified project estimates do not have uplift costs applied as these projects are inclusive of all costs. For further detailed information on the estimating and investment governance process that Ergon Energy applies to its specified projects, see the following documentation:
• ‘About Ellipse Estimating’, V1.8, January 2014
• ‘Network Portfolio Project and Program Investment Approval Governance’,V2.0 (Gated methodology)
• ‘Network Investment Review Committee (NIRC) Charter’ dated July 2014
• ‘Investment Review Committee Charter’ dated July 2014
• ‘Ergon Energy’s Financial Delegation of Authority’ For a detailed list of the specified projects, inclusive of preparation details and corresponding estimated cost, for the regulatory control period 2015-20, please refer to Section 5. Given that Ergon Energy’s specified projects may be at various life-cycle phases, the estimates used in its regulatory submission are the most current estimates based on each project’s lifecycle of development.

Capital Expenditure Forecast Unit Cost Methodologies 12
4. Program of work investments methodology Ergon Energy adopts a program-of-works planning approach where a business problem or response is not clearly specified. Programs of work applies to high volume/low cost repeatable investments or where there is some uncertainty owing to a reliance of inspections not yet conducted, short notification times, unknown scope or unknown location of works into the future. The basis for the forecast expenditure for each program is a prediction of volumes (which may be based on, for example, historical volumes) multiplied by unit cost(s). This unit cost is an estimate of cost based on a combination of approaches and defined as a program (cost) estimate. The approach taken to develop each program estimate depends on the availability, comparability, and granularity of historical data and is either:
• Historic average cost program estimates
• Bottom up program estimates
Where there is correlation of the forecasted activity to historical activity, then an averaging of recorded costs provides the basis of Ergon Energy’s program estimates. Where there are no comparable historical costs to draw on, Ergon Energy has built its program estimates based on a typical scope of work reflective of the future activity and compared this to a sample of recorded cost data (such as a pilot program or a one-off event) or a comparable component of a standard estimate. This section aims to give the reader an understanding of how Ergon Energy developed its program estimates for its regulatory submission.
4.1 Historic average cost program estimates
Development of some program estimates uses an average of recorded historical costs. This is the case when the expectation is that future activities and costs will reflect the historical activities and associated costs, e.g. cost to connect a domestic customer. These costs include all direct costs related to the investment such as labour, materials, equipment, mobilisation and contractors’ costs. The average of these historical costs over multiple years provides a robust estimate of future costs for Ergon Energy’s program estimates and expenditure forecast.
4.2 Bottom-up program estimates
Development of bottom-up program (or product) estimates follows where historical data is unavailable or where data is not reflective of future activities or costs. This approach uses a planning scope of work that reflects future activity. Specialist estimators use the scopes to estimate an efficient unit cost that represents the cost to do the task only and is exclusive of mobilisation (travel time and accommodation costs), contractor uplift and contingency. Depending on the type of work planned for each program and historical cost information available, the assessment of unit costs against at least one of the following sources validates the robustness of each estimate:
• one-off project or program historic actual costs
• proven estimates
• market costs
• market estimates/quotations
• the expert knowledge of Ergon Energy’s subject matter experts. (SMEs) (peer review).
Capital Expenditure Forecast Unit Cost Methodologies 13
4.3 Application of uplift costs to program of work investments
Unlike historical average cost estimates, bottom-up program estimates are based on direct internal costs (typically labour and materials) required to perform only the intended activity that does not include:
• any cost allocation for mobilisation costs to site (for both labour and materials where applicable)
• the use of external contractors.
As such, Ergon Energy developed and applies two different cost-uplift factors, where required to reflect the entire direct cost of the work.
4.3.1 External contractor uplift
Ergon Energy’s use of a contractor uplift component, over and above the program estimates it is appropriate to account for:
• contractor profit margin
• differences in the costing mechanism for overhead costs attributable to the direct cost of work, e.g. training, safety equipment, non-chargeable time etc. Specifically: o external delivery – contract resourcing recovers overhead via inclusion in rates o internal delivery – Ergon Energy recovers overheads via the allocation process in the
Corporate Allocation Model, and therefore is excluded from the program estimates. To establish the percentage contractor uplift a review of a sample of completed projects over 4.5 years (from July 2008 to December 2012) provides a reasonable reflection of the contractor uplift. The analysis provides the direct actual cost extracted from Ellipse, for 6,299 completed projects that includes internally and externally delivered projects.
Step 1: Determine the magnitude of work outsourced
Simple analysis of the outsourced component of the work indicates that 12% of the works was delivered using external resources.
Step 2: Develop the cost uplift for work outsourced
To create an unbiased comparison of works delivered internally, versus externally, from the sample-required identification of the direct unit cost for labour, equipment, material, and other costs. The unit cost for the material component, for both internal and external, provides a suitable reference to identify the magnitude of the works delivered for each project. The outcome indicates that the average total cost of those projects delivered by external resources were approximately 3.53 times the cost of work delivered by internal resources. Additionally the projects delivered by external resources are 3.23 times larger than the work delivered by internal resources. This equates to a contractor cost uplift for external delivery of 9.2% (=3.53/3.23).
Step 3: Develop an external contractor uplift applicable to a program
Thus, the external contractor uplift Ergon Energy applies to its program estimates (bottom-up) is 1.1%, which is based on the estimation of the historical contractor cost uplift incurred (9.2%) multiplied by the percentage of work forecast to be outsourced (12%).
Capital Expenditure Forecast Unit Cost Methodologies 14
Table 1 shows the percentage contractor uplift applied to each of Ergon Energy’s network capital expenditure programs by work stream.
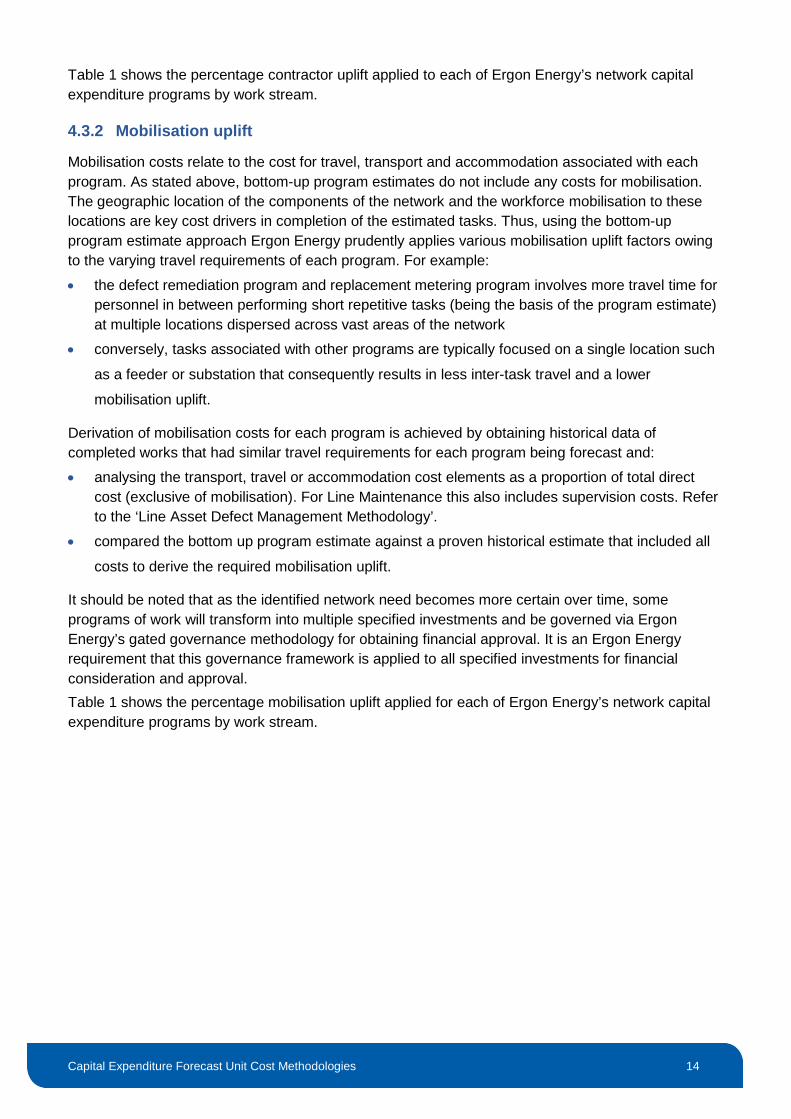
4.3.2 Mobilisation uplift
Mobilisation costs relate to the cost for travel, transport and accommodation associated with each program. As stated above, bottom-up program estimates do not include any costs for mobilisation. The geographic location of the components of the network and the workforce mobilisation to these locations are key cost drivers in completion of the estimated tasks. Thus, using the bottom-up program estimate approach Ergon Energy prudently applies various mobilisation uplift factors owing to the varying travel requirements of each program. For example:
• the defect remediation program and replacement metering program involves more travel time for personnel in between performing short repetitive tasks (being the basis of the program estimate) at multiple locations dispersed across vast areas of the network
• conversely, tasks associated with other programs are typically focused on a single location such
as a feeder or substation that consequently results in less inter-task travel and a lower
mobilisation uplift.
Derivation of mobilisation costs for each program is achieved by obtaining historical data of completed works that had similar travel requirements for each program being forecast and:
• analysing the transport, travel or accommodation cost elements as a proportion of total direct cost (exclusive of mobilisation). For Line Maintenance this also includes supervision costs. Refer to the ‘Line Asset Defect Management Methodology’.
• compared the bottom up program estimate against a proven historical estimate that included all
costs to derive the required mobilisation uplift.
It should be noted that as the identified network need becomes more certain over time, some programs of work will transform into multiple specified investments and be governed via Ergon Energy’s gated governance methodology for obtaining financial approval. It is an Ergon Energy requirement that this governance framework is applied to all specified investments for financial consideration and approval. Table 1 shows the percentage mobilisation uplift applied for each of Ergon Energy’s network capital expenditure programs by work stream.
Capital Expenditure Forecast Unit Cost Methodologies 15
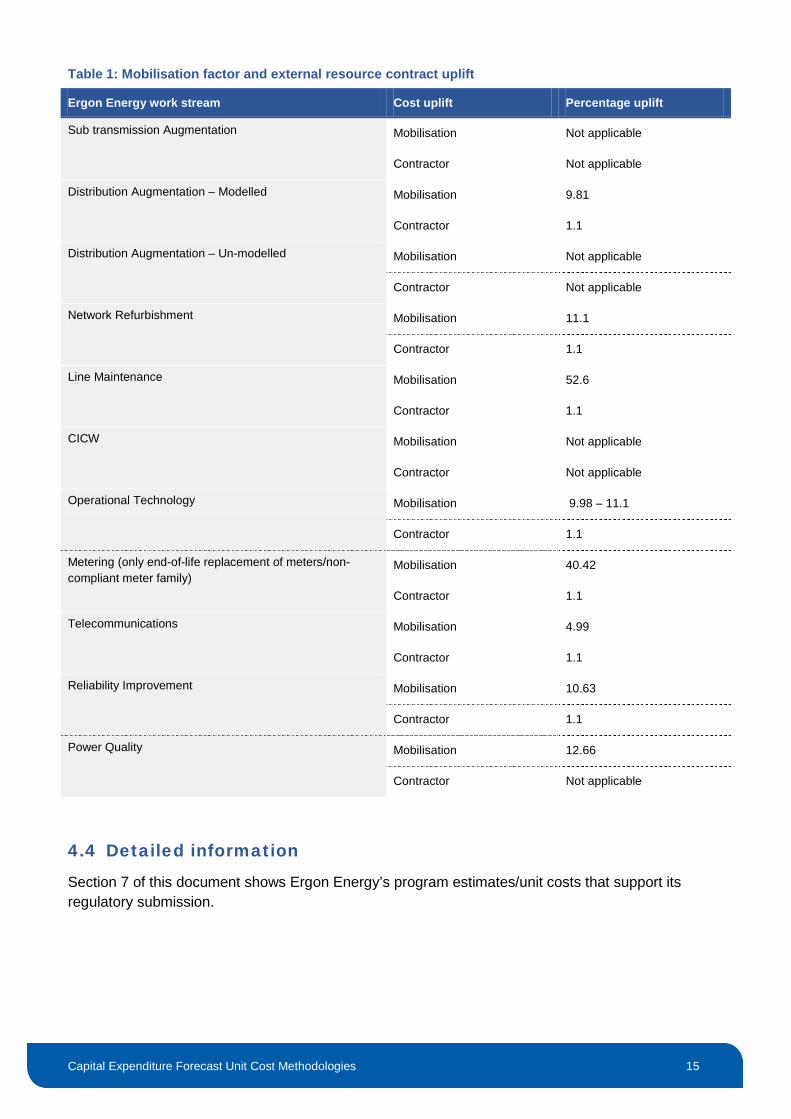
Table 1: Mobilisation factor and external resource contract uplift
Ergon Energy work stream Cost uplift Percentage uplift
Sub transmission Augmentation Mobilisation Not applicable
Contractor Not applicable
Distribution Augmentation – Modelled Mobilisation 9.81
Contractor 1.1
Distribution Augmentation – Un-modelled Mobilisation Not applicable
Contractor Not applicable
Network Refurbishment Mobilisation 11.1
Contractor 1.1
Line Maintenance Mobilisation 52.6
Contractor 1.1
CICW Mobilisation Not applicable
Contractor Not applicable
Operational Technology Mobilisation 9.98 – 11.1
Contractor 1.1
Metering (only end-of-life replacement of meters/non-compliant meter family)
Mobilisation 40.42
Contractor 1.1
Telecommunications Mobilisation 4.99
Contractor 1.1
Reliability Improvement Mobilisation 10.63
Contractor 1.1
Power Quality Mobilisation 12.66
Contractor Not applicable
4.4 Detailed information
Section 7 of this document shows Ergon Energy’s program estimates/unit costs that support its regulatory submission.

Capital Expenditure Forecast Unit Cost Methodologies 16
5. Summary of network capital expenditure categories As can be seen in Table 2, there is not a one-to-one relationship between the capital expenditure categories and Ergon Energy’s operational work streams, as some work streams’ forecasts relate to multiple categories. Similarly, as discussed in section 4.3.2, work streams forecasts can relate to both Programs and Specified investments.
Table 2: Ergon Energy’s network capital expenditure categories
Category Work stream Forecasting sub-category Forecast approach P=Program S=Specified
Customer Initiated Capital Works
Customer Initiated Capital Works
Commercial and Industrial P
Domestic and Rural P
Subdivisions P
Large Customers P
Street Lighting P
Metering P
Services P
Augmentation Sub-transmission Augmentation
Northern S
Central S
Southern S
Distribution Augmentation Northern Reactive (Un-modelled) P
Modelled P and S
Photovoltaic related augmentation
P
Central Reactive (Un-modelled) P
Modelled P and S
Photovoltaic related augmentation
P
Southern Reactive (Un-modelled) P
Modelled P and S
Photovoltaic related augmentation
P

Capital Expenditure Forecast Unit Cost Methodologies 17
Category Work stream Forecasting sub-category Forecast approach P=Program S=Specified
Asset Renewal Line Maintenance Defect Management P
Ring Main Unit (RMU) replacement P
Distribution Earthing remediation P
Connector splice replacement P
Figure 8 colour coded service replacement P
Overhead customer connections inspection and replacement
P
Neutral screened service cables P
Cast iron pot head replacement P
Laminated cross-arm replacement P
Non-ceramic customer end service fuse replacement
P
Expulsion Drop Out (EDO) fuse replacement in high risk areas
P
Site access repair P
Minor tasks P
Wood pole nail P
Wood pole repair P
Wood pole replace P
Steel pole replace P
Post Natural Disaster Defect Remediation P
Major Items Failed in Service (MIFIS) P
Asset Renewal Metering Replace metering end-of life P
Replace metering in-situ P
Replace metering obsolete P
Public Lighting Bulk Lamp Capital Replacement Program P
Network Replacement Sub transmission line refurbishment P
Substation power transformer replacement P
Distribution feeder re-conductoring P
Instrument transformer replacement P

Capital Expenditure Forecast Unit Cost Methodologies 18
Category Work stream Forecasting sub-category Forecast approach P=Program S=Specified
Substation (High Voltage) HV circuit breaker and switchboard replacement
P
Substation isolators replacement P
Substation DC system upgrade P
Substation Static VAR Compensator replacement
P
Substation Capacitor Bank replacement P
Protection relay replacement P
Operational Technology Audio Frequency Load Control (AFLC) equipment asset replacement
P
RTU replacement P
Telecommunications CoreNet, Site Infrastructure Replacement P
End-of-life Radio Refurbishment S
Reliability and Power Quality
Reliability Worst Performing Feeders P
Power Quality Power Quality Monitors P
Power Quality Analysers P
Other System and Enabling Technology
Network Replacement Substation power transformer bunds P and S
Low Voltage spreader and fuse P
Substation AC system upgrade P
Operational Technology Distribution Management System (DMS) system
S
Protection review P
Integrated Network Operations Centre - Intelligent Electronic Device Monitoring and Support
S
Master Station S
Regulator Remote Communications Strategy P
Operational network security S
Sensitive Earth Fault (SEF) protection P
Alternative Data Acquisition Service (ADAS) S
Metering Metering configuration management S
Capital Expenditure Forecast Unit Cost Methodologies 19
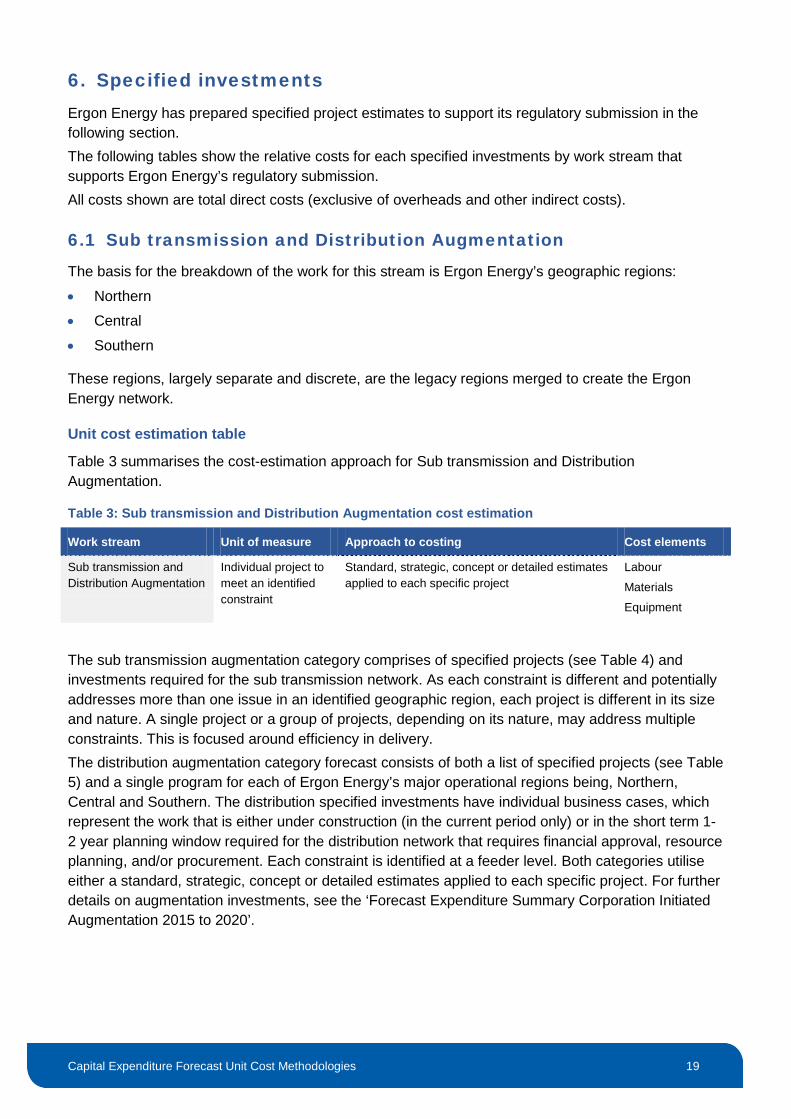
6. Specified investments Ergon Energy has prepared specified project estimates to support its regulatory submission in the following section. The following tables show the relative costs for each specified investments by work stream that supports Ergon Energy’s regulatory submission. All costs shown are total direct costs (exclusive of overheads and other indirect costs).
6.1 Sub transmission and Distribution Augmentation
The basis for the breakdown of the work for this stream is Ergon Energy’s geographic regions:
• Northern
• Central
• Southern
These regions, largely separate and discrete, are the legacy regions merged to create the Ergon Energy network.
Unit cost estimation table
Table 3 summarises the cost-estimation approach for Sub transmission and Distribution Augmentation.
Table 3: Sub transmission and Distribution Augmentation cost estimation
Work stream Unit of measure Approach to costing Cost elements
Sub transmission and Distribution Augmentation
Individual project to meet an identified constraint
Standard, strategic, concept or detailed estimates applied to each specific project
Labour
Materials
Equipment
The sub transmission augmentation category comprises of specified projects (see Table 4) and investments required for the sub transmission network. As each constraint is different and potentially addresses more than one issue in an identified geographic region, each project is different in its size and nature. A single project or a group of projects, depending on its nature, may address multiple constraints. This is focused around efficiency in delivery. The distribution augmentation category forecast consists of both a list of specified projects (see Table 5) and a single program for each of Ergon Energy’s major operational regions being, Northern, Central and Southern. The distribution specified investments have individual business cases, which represent the work that is either under construction (in the current period only) or in the short term 1-2 year planning window required for the distribution network that requires financial approval, resource planning, and/or procurement. Each constraint is identified at a feeder level. Both categories utilise either a standard, strategic, concept or detailed estimates applied to each specific project. For further details on augmentation investments, see the ‘Forecast Expenditure Summary Corporation Initiated Augmentation 2015 to 2020’.
Capital Expenditure Forecast Unit Cost Methodologies 20
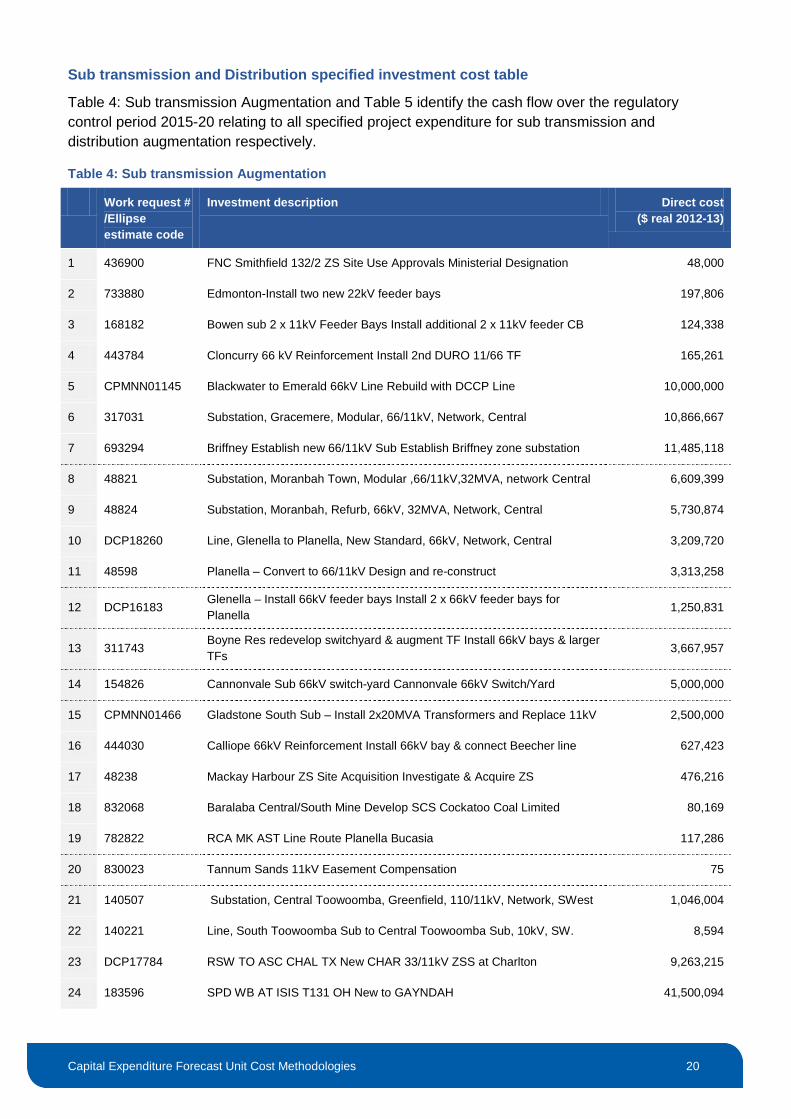
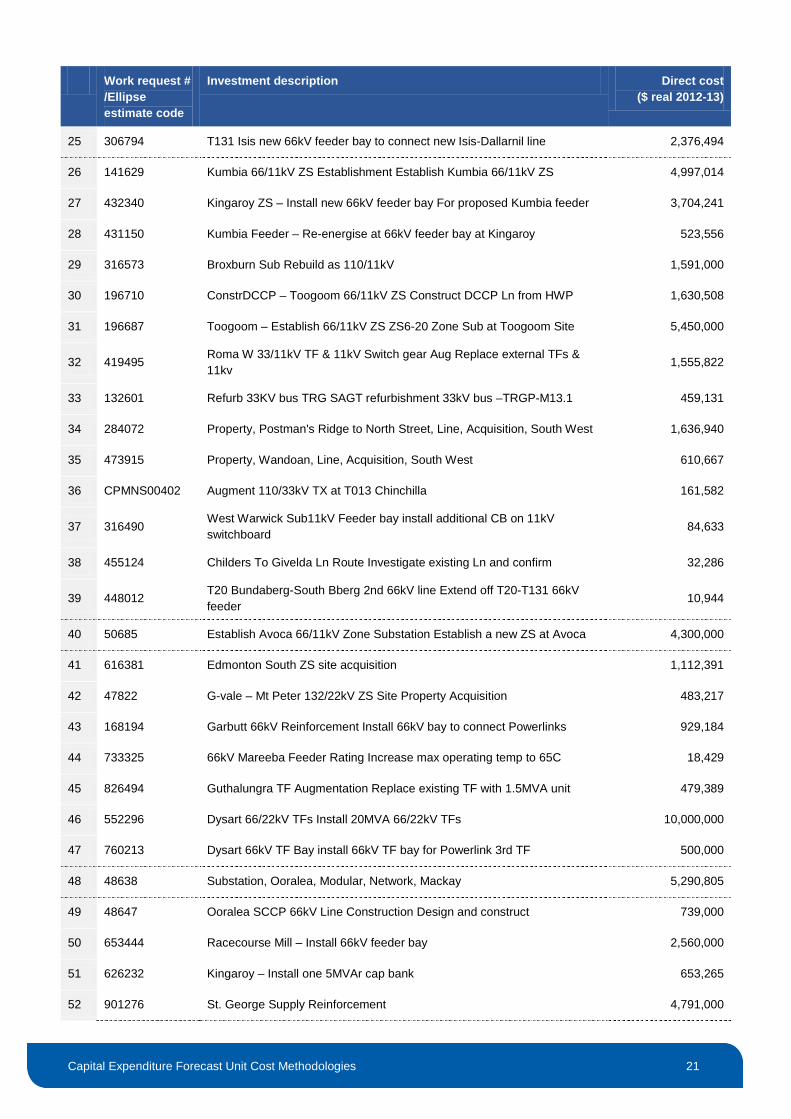
Sub transmission and Distribution specified investment cost table
Table 4: Sub transmission Augmentation and Table 5 identify the cash flow over the regulatory control period 2015-20 relating to all specified project expenditure for sub transmission and distribution augmentation respectively.
Table 4: Sub transmission Augmentation
Work request # /Ellipse estimate code
Investment description Direct cost ($ real 2012-13)
1 436900 FNC Smithfield 132/2 ZS Site Use Approvals Ministerial Designation 48,000
2 733880 Edmonton-Install two new 22kV feeder bays 197,806
3 168182 Bowen sub 2 x 11kV Feeder Bays Install additional 2 x 11kV feeder CB 124,338
4 443784 Cloncurry 66 kV Reinforcement Install 2nd DURO 11/66 TF 165,261
5 CPMNN01145 Blackwater to Emerald 66kV Line Rebuild with DCCP Line 10,000,000
6 317031 Substation, Gracemere, Modular, 66/11kV, Network, Central 10,866,667
7 693294 Briffney Establish new 66/11kV Sub Establish Briffney zone substation 11,485,118
8 48821 Substation, Moranbah Town, Modular ,66/11kV,32MVA, network Central 6,609,399
9 48824 Substation, Moranbah, Refurb, 66kV, 32MVA, Network, Central 5,730,874
10 DCP18260 Line, Glenella to Planella, New Standard, 66kV, Network, Central 3,209,720
11 48598 Planella – Convert to 66/11kV Design and re-construct 3,313,258
12 DCP16183 Glenella – Install 66kV feeder bays Install 2 x 66kV feeder bays for Planella
1,250,831
13 311743 Boyne Res redevelop switchyard & augment TF Install 66kV bays & larger TFs
3,667,957
14 154826 Cannonvale Sub 66kV switch-yard Cannonvale 66kV Switch/Yard 5,000,000
15 CPMNN01466 Gladstone South Sub – Install 2x20MVA Transformers and Replace 11kV 2,500,000
16 444030 Calliope 66kV Reinforcement Install 66kV bay & connect Beecher line 627,423
17 48238 Mackay Harbour ZS Site Acquisition Investigate & Acquire ZS 476,216
18 832068 Baralaba Central/South Mine Develop SCS Cockatoo Coal Limited 80,169
19 782822 RCA MK AST Line Route Planella Bucasia 117,286
20 830023 Tannum Sands 11kV Easement Compensation 75
21 140507 Substation, Central Toowoomba, Greenfield, 110/11kV, Network, SWest 1,046,004
22 140221 Line, South Toowoomba Sub to Central Toowoomba Sub, 10kV, SW. 8,594
23 DCP17784 RSW TO ASC CHAL TX New CHAR 33/11kV ZSS at Charlton 9,263,215
24 183596 SPD WB AT ISIS T131 OH New to GAYNDAH 41,500,094
Capital Expenditure Forecast Unit Cost Methodologies 21
Work request # /Ellipse estimate code
Investment description Direct cost ($ real 2012-13)
25 306794 T131 Isis new 66kV feeder bay to connect new Isis-Dallarnil line 2,376,494
26 141629 Kumbia 66/11kV ZS Establishment Establish Kumbia 66/11kV ZS 4,997,014
27 432340 Kingaroy ZS – Install new 66kV feeder bay For proposed Kumbia feeder 3,704,241
28 431150 Kumbia Feeder – Re-energise at 66kV feeder bay at Kingaroy 523,556
29 316573 Broxburn Sub Rebuild as 110/11kV 1,591,000
30 196710 ConstrDCCP – Toogoom 66/11kV ZS Construct DCCP Ln from HWP 1,630,508
31 196687 Toogoom – Establish 66/11kV ZS ZS6-20 Zone Sub at Toogoom Site 5,450,000
32 419495 Roma W 33/11kV TF & 11kV Switch gear Aug Replace external TFs & 11kv
1,555,822
33 132601 Refurb 33KV bus TRG SAGT refurbishment 33kV bus –TRGP-M13.1 459,131
34 284072 Property, Postman's Ridge to North Street, Line, Acquisition, South West 1,636,940
35 473915 Property, Wandoan, Line, Acquisition, South West 610,667
36 CPMNS00402 Augment 110/33kV TX at T013 Chinchilla 161,582
37 316490 West Warwick Sub11kV Feeder bay install additional CB on 11kV switchboard
84,633
38 455124 Childers To Givelda Ln Route Investigate existing Ln and confirm 32,286
39 448012 T20 Bundaberg-South Bberg 2nd 66kV line Extend off T20-T131 66kV feeder
10,944
40 50685 Establish Avoca 66/11kV Zone Substation Establish a new ZS at Avoca 4,300,000
41 616381 Edmonton South ZS site acquisition 1,112,391
42 47822 G-vale – Mt Peter 132/22kV ZS Site Property Acquisition 483,217
43 168194 Garbutt 66kV Reinforcement Install 66kV bay to connect Powerlinks 929,184
44 733325 66kV Mareeba Feeder Rating Increase max operating temp to 65C 18,429
45 826494 Guthalungra TF Augmentation Replace existing TF with 1.5MVA unit 479,389
46 552296 Dysart 66/22kV TFs Install 20MVA 66/22kV TFs 10,000,000
47 760213 Dysart 66kV TF Bay install 66kV TF bay for Powerlink 3rd TF 500,000
48 48638 Substation, Ooralea, Modular, Network, Mackay 5,290,805
49 48647 Ooralea SCCP 66kV Line Construction Design and construct 739,000
50 653444 Racecourse Mill – Install 66kV feeder bay 2,560,000
51 626232 Kingaroy – Install one 5MVAr cap bank 653,265
52 901276 St. George Supply Reinforcement 4,791,000
Capital Expenditure Forecast Unit Cost Methodologies 22
Work request # /Ellipse estimate code
Investment description Direct cost ($ real 2012-13)
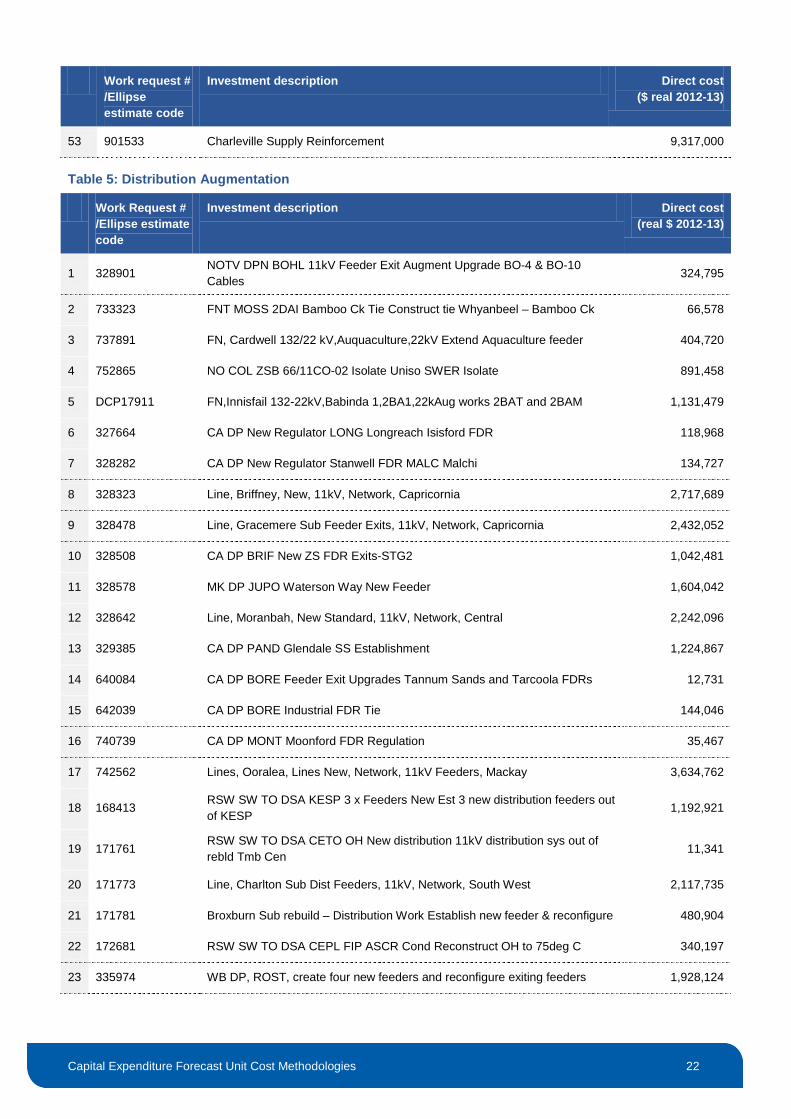
53 901533 Charleville Supply Reinforcement 9,317,000
Table 5: Distribution Augmentation
Work Request # /Ellipse estimate code
Investment description Direct cost (real $ 2012-13)
1 328901 NOTV DPN BOHL 11kV Feeder Exit Augment Upgrade BO-4 & BO-10 Cables
324,795
2 733323 FNT MOSS 2DAI Bamboo Ck Tie Construct tie Whyanbeel – Bamboo Ck 66,578
3 737891 FN, Cardwell 132/22 kV,Auquaculture,22kV Extend Aquaculture feeder 404,720
4 752865 NO COL ZSB 66/11CO-02 Isolate Uniso SWER Isolate 891,458
5 DCP17911 FN,Innisfail 132-22kV,Babinda 1,2BA1,22kAug works 2BAT and 2BAM 1,131,479
6 327664 CA DP New Regulator LONG Longreach Isisford FDR 118,968
7 328282 CA DP New Regulator Stanwell FDR MALC Malchi 134,727
8 328323 Line, Briffney, New, 11kV, Network, Capricornia 2,717,689
9 328478 Line, Gracemere Sub Feeder Exits, 11kV, Network, Capricornia 2,432,052
10 328508 CA DP BRIF New ZS FDR Exits-STG2 1,042,481
11 328578 MK DP JUPO Waterson Way New Feeder 1,604,042
12 328642 Line, Moranbah, New Standard, 11kV, Network, Central 2,242,096
13 329385 CA DP PAND Glendale SS Establishment 1,224,867
14 640084 CA DP BORE Feeder Exit Upgrades Tannum Sands and Tarcoola FDRs 12,731
15 642039 CA DP BORE Industrial FDR Tie 144,046
16 740739 CA DP MONT Moonford FDR Regulation 35,467
17 742562 Lines, Ooralea, Lines New, Network, 11kV Feeders, Mackay 3,634,762
18 168413 RSW SW TO DSA KESP 3 x Feeders New Est 3 new distribution feeders out of KESP
1,192,921
19 171761 RSW SW TO DSA CETO OH New distribution 11kV distribution sys out of rebld Tmb Cen
11,341
20 171773 Line, Charlton Sub Dist Feeders, 11kV, Network, South West 2,117,735
21 171781 Broxburn Sub rebuild – Distribution Work Establish new feeder & reconfigure 480,904
22 172681 RSW SW TO DSA CEPL FIP ASCR Cond Reconstruct OH to 75deg C 340,197
23 335974 WB DP, ROST, create four new feeders and reconfigure exiting feeders 1,928,124

Capital Expenditure Forecast Unit Cost Methodologies 23
Work Request # /Ellipse estimate code
Investment description Direct cost (real $ 2012-13)
24 336062 WB DP, BARG, create four new feeders 1,819,440
25 336399 WB DP, TOGM, create five new feeder from new ZS re-arrange network 3,753,440
26 336410 WB DP, AVOCA, establish new feeders from new ZS re-arrange network 4,913,399
27 336962 WB DP, YARR, Blackbutt, new reg 53,486
28 337087 WB DP, PIAL, Distribution Work Stage 1 2,287,126
29 337091 WB DP, PIAL, Distribution Works Stage 2 1,064,727
30 337213 WB DP, Kumbia, create four new feeders new ZS re-arrange existing network
1,487,796
31 337387 WB DP, WALL, Gin Gin upgrade UG cable Gin Gin 23,434
32 337408 WB DP, NANA, Brooklands feeder reconductor first 1.6km of 0.80 CU 189,316
33 552376 RSW TO CR WEET St11 Cu Cond Replace Grenwa & Tomkinson St 37,788
34 DCP15397 WB DP,OWAN,Bidwill,OY-B,11kV augment, Erect Voltage regulator 8,584
35 DCP15456 WB DP,NANA ,South Nanango,NN-E,11kV augment Reconductor Temp 153,533
36 DCP15486 WB DP,WALL ,Drinan,WV-D,11kV augment, Increase Design Temp of 3.7 km
211,226
37 DCP15673 SW,Allora (ME037),Hendon,F3085,11kV augment Voltage regulation and tie 209,512
38 DCP15703 SW, Charleville (MW007),Morven,F3605,22kVVoltage regulator 22kV 143,063
39 DCP15710 SW,Millmerran (ME151),Bringalily,F2295,1Erect a VR in PE4912 144,019
40 DCP15735 SW,St. George Town (MC053),Alfred St Ea. Reconductor approx. 1.5km 288,121
41 DCP15772 SW,Crows Nest (ME032),Creek St,F2645,11kReconductor initial feeder 399,018
42 DCP16904 WB DP,KING,Coolabunia,KR-D,11kV augment, Reconductor 5km of feeder 251,135
6.2 Operational Technology
This work stream consists of the following specified investments:
• Implement Distribution Management System (DMS)
• Operational Network (cyber) Security
• Alternative Data Acquisition Service
• Integrated Network Operations Centre
• Master Station SCADA Strategy
• Regulatory Remote Communications Strategy

Capital Expenditure Forecast Unit Cost Methodologies 24
Cost estimation summary table
Table 6 summarises the Operational Technology’s cost-estimation approach.
Table 6: Operational Technology’s cost estimation
Work stream Unit of measure Approach to costing Cost elements
Implement Distribution Management System
Individual project Bottom-up estimate of each component:
Hardware, software, implementation
Internal labour – standard labour rates
Labour
Materials
Operational Network (cyber) Security
Individual project based on vendor pricing tool and estimated labour hours
The estimate derived by summing the individual assets installation costs and labour hours, is inclusive of all costs except corporate overheads
Labour
Materials
Alternative Data Acquisition Service (ADAS)
Individual project based on vendor pricing and estimated labour hours
The estimates include asset-installation costs and labour hours, and are inclusive of all costs except corporate overheads
Labour
Materials
Integrated Network Operations Centre
Individual project Cost estimates for the software component were based on previous experience and costs obtained from recent related upgrade costs at the Communications Network Operations Centre. This included licenses and professional services for the NMS from the recent IBM and deploy partners proposals
Labour
Materials
Master Station – SCADA Strategy
Individual project Cost estimates for labour use standard labour rates applied to the estimate of hours required. Materials costs are based on the costs recorded in Ellipse for previous projects. Software costs are based on vendor quotes from a supplier. These costs are inclusive of transport and accommodation
Labour
Materials
Implement Distribution Management System (DMS)
The Distribution Management System is a decision-support system that assists the control room and field operating personnel to monitor and control the network in an optimal manner, while enhancing safety and asset protection.

Capital Expenditure Forecast Unit Cost Methodologies 25
Approach to costing the investment
As this is a one-off project and not a recurrent activity, the development of this project estimate is outside of the standard estimate framework. Developing the investment costs has the following phases:
• contract for the next regulatory control period completed in the current 2010-15 regulatory control period
• blueprint design for the next regulatory control period completed in the current 2010-15 regulatory control period
• installation of Distribution Management System, to commence in the 2010-15 regulatory control period and finalised in the 2015-20 regulatory control period
• integration with corporate systems to commence in the 2010-15 regulatory control period and
finalised in the 2015-20 regulatory control period.
The costs for installation of the Distribution Management System phase consist of three components:
• hardware, software and implementation
• internal labour
• travel.
The hardware, software, and implementation costs use a tender price from suppliers. The internal labour costs use standard labour rates applied to the estimate of hours based on the expert knowledge of Ergon Energy’s SMEs. The costs for the integration with corporate systems phase consist of two components:
• implementation
• internal labour.
The implementation costs are based on a tender price from the supplier/contractor. The labour costs use standard labour rates applied to the estimate of hours as based on the expert knowledge of Ergon Energy’s SMEs. The estimate developed to support Ergon Energy’s submission is a summation of the above costs. These costs are inclusive of travel and accommodation. Building the costs uses a bottom-up approach for a total cost-of-ownership model used in the tender evaluation. Energex’s recently completed Distribution Management System project has enabled the opportunity to benchmark components of the implementation where relevant.
Operational network (cyber) security
This project is driven by an external consultancy review conducted in 2010 that identified risks associated with Ergon Energy’s current practices in comparison with the United States industry best-practice model. Ergon Energy’s risk framework supports actions to control potential intrusions, which possibly result in serious consequences.
Approach to costing the investment
As this is a non-recurrent one-off project, development of the estimate for this project occurred outside of the standard estimate framework.
Capital Expenditure Forecast Unit Cost Methodologies 26
Costing of individual assets used a vendor-pricing tool provided by SPARQ solutions, using a mid-level cost from the market tender where an item was not available in this tool. SPARQ solutions and Ergon Energy’s SMEs estimated the labour hours for implementing each component applying standard labour rates. Summing the individual assets installation costs and labour hours produced the investment cost that is inclusive of all direct costs.
Alternative Data Acquisition Service
Ergon Energy, as part of its corporate strategy, needs to prepare for the 'network of the future'. This is a network where we expect multidirectional flows of information and power. To manage this network, the business will need to collect more information from zone substations as well as extending monitoring and control capability to the medium voltage to low voltage (LV) networks. Owing to its critical nature, using the existing SCADA system to manage this data will incur significant cost to the business to expand. It is also important that the business does not overload or clutter the system, placing the network at risk of performance issues that may compromise remote control of the HV network. Due to not having this centralised system, the business has started to use vendor web services or data collection software provided by device manufacturers. Additionally the business also manually collects and downloads data locally or remotely over Ergon Energy’s Operational Communications Network. Without an Alternative Data Acquisition Service (ADAS), the business will continue to implement these types of independent and inefficient solutions, which consequently makes it difficult for the wider business to access data, may place data at the risk of being lost, and will require individual maintenance at a higher cost to the business.
Approach to costing the investment
As this is a one-off project and not a recurrent activity, the development of this project estimates is outside of the standard estimate framework. The bottom-up estimate consists of two components:
• hardware and software
• implementation
The basis for hardware and software costs is indicative pricing provided by software vendors in the current trial. Standard labour rates and an estimate of hours required to undertake the work by Ergon Energy’s SMEs provide the implementation costs. The data-collection gateway and the historian database are the two main components of the estimate. Estimation of the gateway software for data collection is on a per-device basis, while estimating for the historian software was per data point (as per pricing structure of historian vendors). The point estimate per device used was 35 points per device. As this is a new system, validation against similar projects is difficult. Ergon Energy also found that costs are non-comparable with Ausgrid, who structured its ADAS trials with government funding. The system proposed is an off-the-shelf system for industrial applications, so the cost proposed by the vendors is the market price. There are no anticipated transport and accommodation costs associated with this project, therefore the estimate does not include these costs.

Capital Expenditure Forecast Unit Cost Methodologies 27
Integrated Network Operations Centre
This proposed investment seeks funding to extend the functionality of the Communications Network Operation Centre to manage the increase in intelligent electronic device implementation throughout the network as standard equipment or performing discrete functions. The monitoring of active-device assets will assist in bedding in and maintaining the efficiencies these devices have to offer and ensure that they are functioning correctly, and available to perform now and into the future.
Approach to costing the investment
As this is a one-off project and not a recurrent activity, the development of this project estimate is outside of the standard estimate framework. The scope of the investments over the regulatory control period provided the basis for estimating these costs. The Integrated Network Operations Centre costs consist of a software component, based on previous experience and costs obtained from recent related upgrade costs at the Communications Network Operations Centre. This included licenses and professional services for the network monitoring system as an outcome of the recent IBM and deploy partners proposals.
Master Station Supervisory Control and Data Acquisition System (SCADA) Strategy
This project outworks the, the Master Station SCADA strategy for hardware replacement/expansion, software and licence upgrades. It is necessary for the Operational Control Centre to perform its daily duties, as well as providing Ergon Energy with critical asset data.
Approach to costing the investment
As this is a one-off project and not a recurrent activity, the development of this project estimate is outside of the standard estimate framework. The costs consist of four components:
• labour hours
• materials
• software
• hardware
The labour costs use standard labour rates applied to the estimate of hours based on the expert knowledge of Ergon Energy’s SMEs and the labour required for previous upgrade projects. The materials costs are based on the costs recorded in Ellipse for previous projects. The software costs are based on vendor quotes from the supplier and SME’s experience in delivering previous upgrade projects since the implementation of the Master Station in 2008. These costs are inclusive of transport and accommodation.

Capital Expenditure Forecast Unit Cost Methodologies 28
Operational Technology specified investment cost table
Table 7 identifies the specified project expenditure forecast in direct cost.
Table 7: Operational Technology
Work request # /Ellipse estimate code
Investment description Direct cost ($ real 2012-13 )
1 578093 Distribution Management System (DMS) 13,041,865
2 MIP1095 Operational network cyber security 4,562,000
3 MIP1163 Alternative Data Acquisition Service (ADAS) 4,007,698
4 MIP1164 Integrated Network Operations Centre - Intelligent Electronic Device Monitoring and Support
1,681,360
5 MIP1263 to MIP1267
Master Station SCADA Strategy 13,148,147
Note: For all specified investments that have an estimate created outside the estimating framework, special unitised cost estimates were developed to reflect the labour, materials, equipment, contractors and other costs associated with each investment. These unitised cost estimates were then multiplied by the derived annual volumes such that the product of the two equated to the total direct annual cost requirements estimated by the work stream(s) in their source models and forecasts. Importantly, this was undertaken only as a mechanism to load the annual labour resource requirements associated with each specified investment into Ellipse, for inclusion in the development of the Network Deliverability Plan.
6.3 Telecommunications
This work stream consists of the following two specified investments:
• End-of-life radio refurbishment Mackay to Maryborough
• End-of-life radio refurbishment Western Queensland The radio communications systems are out of date and no maintenance support is available for this technology. To maintain field communications for staff, replacement systems are required.
Cost estimation summary table
Table 8 summarises telecommunications cost-estimation approach.
Table 8: Telecommunications cost estimation
Work stream Unit of measure
Approach to costing the program Cost elements
Telecommunications
End-of-life radio refurbishment Mackay to Maryborough and Western Queensland
Individual projects
Unit rates were determined from existing commercially obtained contractor rates for similar projects located in inner South-West Queensland and Far North Queensland areas
Labour
Materials
Approach to costing the investment
Capital Expenditure Forecast Unit Cost Methodologies 29
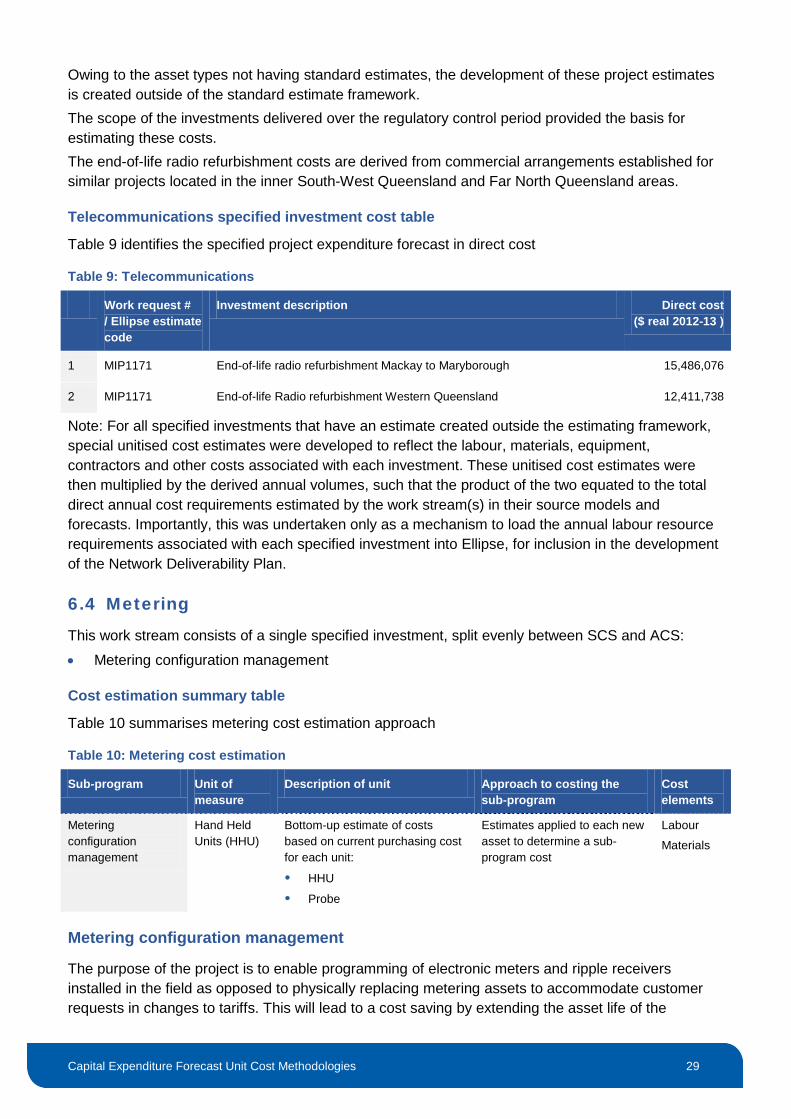
Owing to the asset types not having standard estimates, the development of these project estimates is created outside of the standard estimate framework. The scope of the investments delivered over the regulatory control period provided the basis for estimating these costs. The end-of-life radio refurbishment costs are derived from commercial arrangements established for similar projects located in the inner South-West Queensland and Far North Queensland areas.
Telecommunications specified investment cost table
Table 9 identifies the specified project expenditure forecast in direct cost
Table 9: Telecommunications
Work request # / Ellipse estimate code
Investment description Direct cost ($ real 2012-13 )
1 MIP1171 End-of-life radio refurbishment Mackay to Maryborough 15,486,076
2 MIP1171 End-of-life Radio refurbishment Western Queensland 12,411,738
Note: For all specified investments that have an estimate created outside the estimating framework, special unitised cost estimates were developed to reflect the labour, materials, equipment, contractors and other costs associated with each investment. These unitised cost estimates were then multiplied by the derived annual volumes, such that the product of the two equated to the total direct annual cost requirements estimated by the work stream(s) in their source models and forecasts. Importantly, this was undertaken only as a mechanism to load the annual labour resource requirements associated with each specified investment into Ellipse, for inclusion in the development of the Network Deliverability Plan.
6.4 Metering
This work stream consists of a single specified investment, split evenly between SCS and ACS:
• Metering configuration management
Cost estimation summary table
Table 10 summarises metering cost estimation approach
Table 10: Metering cost estimation
Sub-program Unit of measure
Description of unit Approach to costing the sub-program
Cost elements
Metering configuration management
Hand Held Units (HHU)
Bottom-up estimate of costs based on current purchasing cost for each unit:
HHU
Probe
Estimates applied to each new asset to determine a sub-program cost
Labour
Materials
Metering configuration management
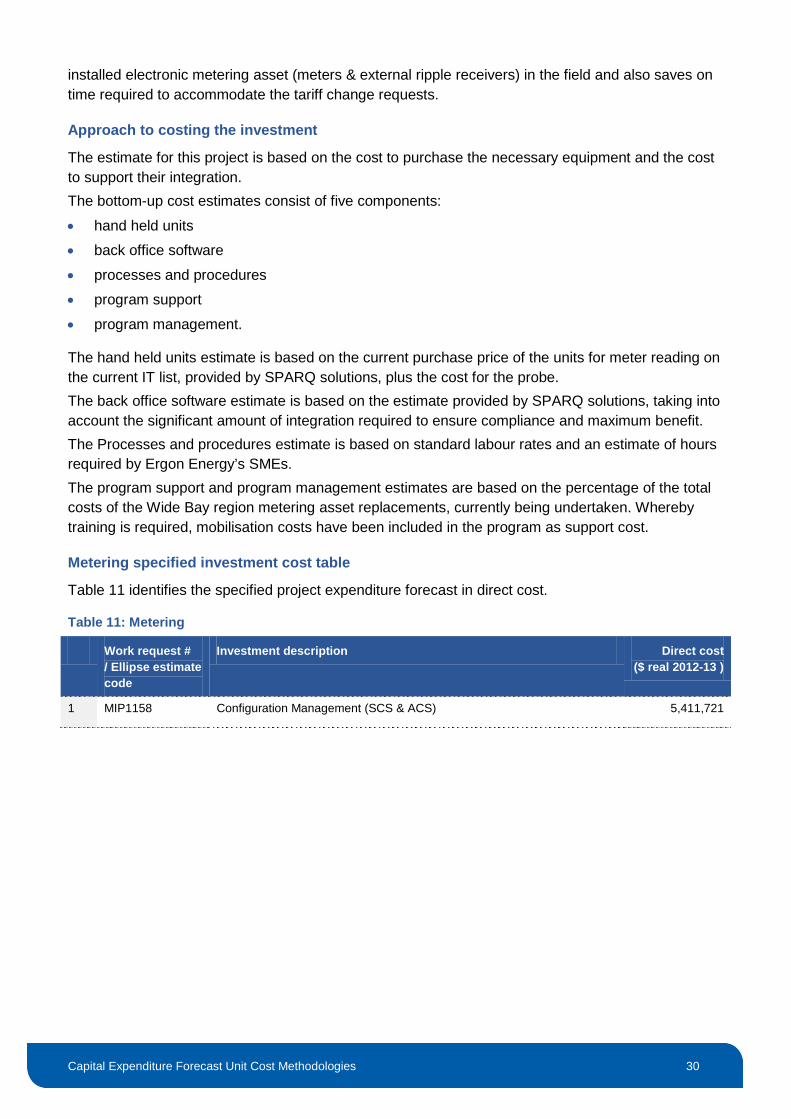
The purpose of the project is to enable programming of electronic meters and ripple receivers installed in the field as opposed to physically replacing metering assets to accommodate customer requests in changes to tariffs. This will lead to a cost saving by extending the asset life of the
Capital Expenditure Forecast Unit Cost Methodologies 30
installed electronic metering asset (meters & external ripple receivers) in the field and also saves on time required to accommodate the tariff change requests.
Approach to costing the investment
The estimate for this project is based on the cost to purchase the necessary equipment and the cost to support their integration. The bottom-up cost estimates consist of five components:
• hand held units
• back office software
• processes and procedures
• program support
• program management.
The hand held units estimate is based on the current purchase price of the units for meter reading on the current IT list, provided by SPARQ solutions, plus the cost for the probe. The back office software estimate is based on the estimate provided by SPARQ solutions, taking into account the significant amount of integration required to ensure compliance and maximum benefit. The Processes and procedures estimate is based on standard labour rates and an estimate of hours required by Ergon Energy’s SMEs. The program support and program management estimates are based on the percentage of the total costs of the Wide Bay region metering asset replacements, currently being undertaken. Whereby training is required, mobilisation costs have been included in the program as support cost.
Metering specified investment cost table
Table 11 identifies the specified project expenditure forecast in direct cost.
Table 11: Metering
Work request # / Ellipse estimate code
Investment description Direct cost ($ real 2012-13 )
1 MIP1158 Configuration Management (SCS & ACS) 5,411,721

Capital Expenditure Forecast Unit Cost Methodologies 31
7. Program estimates Ergon Energy has prepared program estimates to support its regulatory submission in the following works streams. The following tables show the relative costs for each program estimate that supports Ergon Energy’s regulatory submission. All costs shown are total direct costs (exclusive of overheads and other indirect costs). The product of these estimates and the corresponding forecast volumes produce the total expenditure in direct cost (2012-13 real dollars) for each program.
7.1 Distribution and Low Voltage Augmentation
This program has the following structure of sub-programs:
• Southern o Un-modelled o Modelled
• Central o Un-modelled o Modelled
• Northern o Un-modelled o Modelled
The geographical areas of operation formulate the program structure. These geographical areas represent the legacy regions that merged to create the Ergon Energy network, are largely separate and discrete. Each area is further broken down into sub categories modelled and un-modelled. Modelled works consist of identified as constraints at specific feeders and locations via load-flow modelling the growth of the network and un-modelled works is reactive work usually initiated by a network issue or customer complaint.
Cost estimate summary table
Table 12 summarises cost estimation for Distribution (Low Voltage Growth and Risk) Augmentation.
Table 12: Distribution (Low Voltage Growth and Risk) Augmentation cost estimation
Micro-program
Unit of measure
Description of unit
Approach to costing the micro-program
Cost elements
Un-modelled Micro-program N/A Historic average expenditure, reduced to account for potential overlaps
Average historic percentage applied to annual costs
Modelled Individual assets
Product Estimates exclusive of transport and accommodation
Product Estimates applied to each work type and applied to forecast volumes. Uplift factor of 9.81% applied to account for transport and accommodation costs and contractual uplift of 1.1%
Labour
Materials and Equipment

Capital Expenditure Forecast Unit Cost Methodologies 32
Un-modelled
Un-modelled augmentation predominantly addresses constraints and issues seen in Ergon Energy’s low voltage network. It addresses network constraints that individually are not possible to anticipate, forecast or plan, and is reactive work usually initiated by a network issue or customer complaint.
Approach to costing
Unit costs derived for the un-modelled works are based on a historic average cost.
Approach to costing the micro-program
The basis for the un-modelled augmentation cost is the historical expenditure, produced through analysis of data extracted from Ellipse for each region over a specified time:
• Northern 2008-09 to 2012-13
• Central 2008-09 to 2012-13
• Southern 2008-09 to 2012-13
The data includes expenditure against the following work types:
• Capacity
• Clearance
• Damage
• Inverter Energy Systems
• Isolator
• Other
• Overloaded Distribution Transformers
• Protection
• Power Quality
• Recover Assets
• Reliability
• Voltage
The program estimates are inclusive of mobilisation costs, being transport and accommodation, but excludes overheads. This historic expenditure has been reduced to account for potential overlaps with the Inverter Energy Systems program by the actual costs recorded against those work types.
Modelled
Units of measure
Establishing the forecast volumes requires lengthy load flow analysis across the whole network to identify all works required to address distribution network constraints. Ergon Energy modelled the HV distribution network in SINCAL (Siemens Network Calculation) (automated load flow), applying expected future growth, and uptake trends. This automated load flow produced a set of anticipated constraints, based on exceeding asset current ratings or network voltage requirements. For further details on the load flow modelling, see ‘Forecast Expenditure Summary Customer Initiated Augmentation’ and the ‘Network Planning Process’ document.

Capital Expenditure Forecast Unit Cost Methodologies 33
The output of this process is recorded in the Distribution Network Augmentation Plan (DNAP) list, which provides details of the program. However, it must be understood that the DNAP list comprises the current and future identified design constraints assessed against a demand forecast, as the timing of the constraint becomes closer it is validated by on-site inspections, testing and surveying of conditions. If confirmed, the constraint is progressed to a specified project or investment to secure resource planning, procurement or financial approval.
Approach to costing
The product estimates for the distribution augmentation programs (see Table 13) are contingent on the historical average costs, but exclude mobilisation and contractor uplift. Each work type uses a selected efficiently delivered project (no variation) with similar scope to the forecasted type of works with actual direct costs for this project extracted from Ellipse. In the case of those projects that have no comparable scope, an alternate base project with costs adjusted by Ergon Energy’s SMEs, is used. Verification of the product estimates is against prior standard estimates recorded in Ellipse for the period 2006-12. Correcting the estimates by adding/removing labour components ensures that the estimates closely reflect the expected scope and efficient estimate for each type of works.
Approach to costing the micro-program
Building the micro-program estimate involves applying the product estimates to the forecast volumes for each type of work with an uplift factor for mobilisation 9.81% and contractual uplift of 1.1%. The mobilisation factor based on historical cost data of completed distribution augmentation works for the period 2008-09 to 2012-13 and calculating the percentage that transport, travel and accommodation costs made of the total direct costs (exclusive of transport, travel and accommodation costs) The SINCAL model simulated a forward loaded works micro-program, and therefore, forward loaded expenditure. Ergon Energy has smoothed the delivery of these works over the regulatory control period to ensure deliverability of the micro-program and to assist in resourcing.
Distribution and Low Voltage Augmentation program estimates
See Table 13 for the program estimates (in direct cost) for the above program(s).
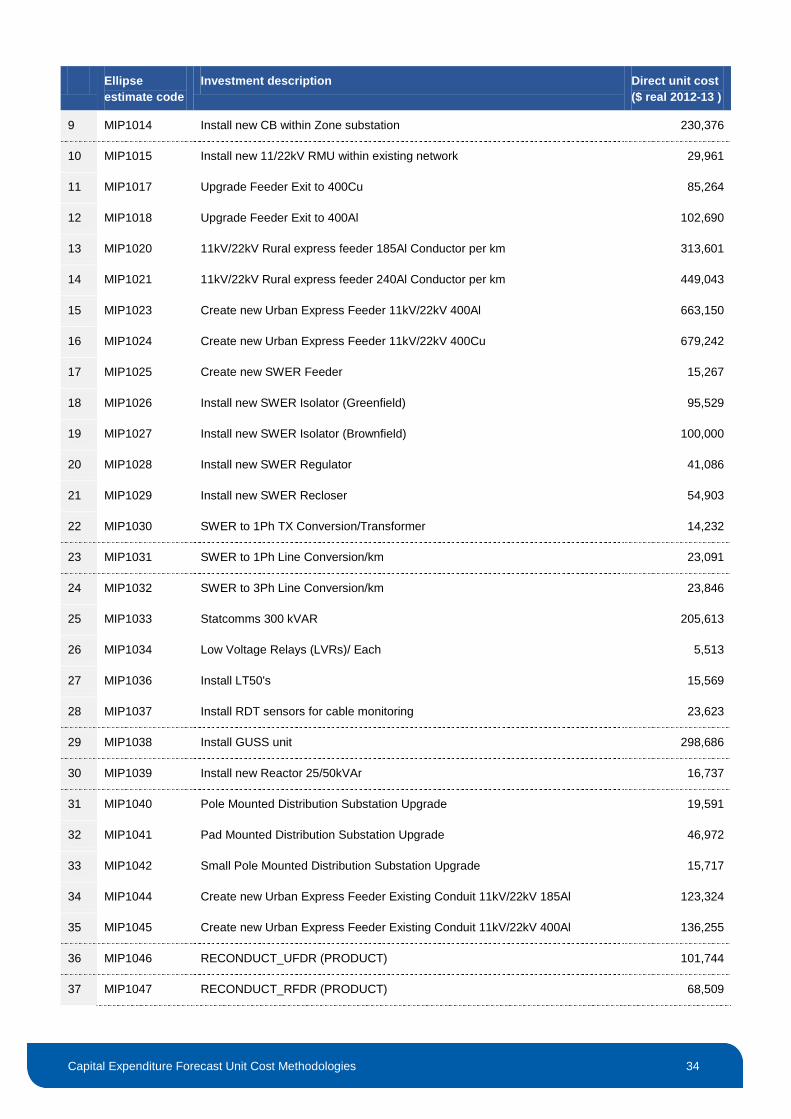
Table 13: Distribution Augmentation Program Estimates
Ellipse estimate code
Investment description Direct unit cost ($ real 2012-13 )
1 MIP1000 Install new Pole Top ABS 15,149
2 MIP1001 Install new Open Delta Regulator in existing network 122,965
3 MIP1002 Install new Closed Delta Regulator in existing network 252,729
4 MIP1003 Create new 11kV/22kV Heavy Conductor Urban OH Feeder 98,839
5 MIP1004 Create new 11kV/22kV Heavy Cond Urban OH Feeder w LV sub-circuit 165,062
6 MIP1006 Upgrade Temperature Rating of Urban 11kV/22kV/33kV feeder 98,325
7 MIP1008 Upgrade Temperature Rating of Rural 11kV/22kV/33kV feeder 54,522
8 MIP1013 Create new Embedded Generation Site 960,557
Capital Expenditure Forecast Unit Cost Methodologies 34
Ellipse estimate code
Investment description Direct unit cost ($ real 2012-13 )
9 MIP1014 Install new CB within Zone substation 230,376
10 MIP1015 Install new 11/22kV RMU within existing network 29,961
11 MIP1017 Upgrade Feeder Exit to 400Cu 85,264
12 MIP1018 Upgrade Feeder Exit to 400Al 102,690
13 MIP1020 11kV/22kV Rural express feeder 185Al Conductor per km 313,601
14 MIP1021 11kV/22kV Rural express feeder 240Al Conductor per km 449,043
15 MIP1023 Create new Urban Express Feeder 11kV/22kV 400Al 663,150
16 MIP1024 Create new Urban Express Feeder 11kV/22kV 400Cu 679,242
17 MIP1025 Create new SWER Feeder 15,267
18 MIP1026 Install new SWER Isolator (Greenfield) 95,529
19 MIP1027 Install new SWER Isolator (Brownfield) 100,000
20 MIP1028 Install new SWER Regulator 41,086
21 MIP1029 Install new SWER Recloser 54,903
22 MIP1030 SWER to 1Ph TX Conversion/Transformer 14,232
23 MIP1031 SWER to 1Ph Line Conversion/km 23,091
24 MIP1032 SWER to 3Ph Line Conversion/km 23,846
25 MIP1033 Statcomms 300 kVAR 205,613
26 MIP1034 Low Voltage Relays (LVRs)/ Each 5,513
27 MIP1036 Install LT50's 15,569
28 MIP1037 Install RDT sensors for cable monitoring 23,623
29 MIP1038 Install GUSS unit 298,686
30 MIP1039 Install new Reactor 25/50kVAr 16,737
31 MIP1040 Pole Mounted Distribution Substation Upgrade 19,591
32 MIP1041 Pad Mounted Distribution Substation Upgrade 46,972
33 MIP1042 Small Pole Mounted Distribution Substation Upgrade 15,717
34 MIP1044 Create new Urban Express Feeder Existing Conduit 11kV/22kV 185Al 123,324
35 MIP1045 Create new Urban Express Feeder Existing Conduit 11kV/22kV 400Al 136,255
36 MIP1046 RECONDUCT_UFDR (PRODUCT) 101,744
37 MIP1047 RECONDUCT_RFDR (PRODUCT) 68,509

Capital Expenditure Forecast Unit Cost Methodologies 35
Ellipse estimate code
Investment description Direct unit cost ($ real 2012-13 )
38 MIP1136 Install 1ph LV Statcomm (<15kVAr) 4,045
39 MIP1137 Install 3ph LV STATCOM (<50kVAr) 14,974
40 MIP1177 Reactive/Un-modelled 35,226
7.2 Customer Initiated Capital Works
Customer Initiated Capital Works (CICW) forecasts include works required to install ‘dedicated’ assets, both high voltage and low voltage, to connect an applicant’s electrical installation to the network. This program is broken down into the following categories, customer types and activity, and feeder categories:
• Commercial and Industrial o Rural Customer New o Urban Customer New
• Domestic and Rural o Rural Customer New o Urban Customer New
• Subdivision o Subdivision Overhead – New o Subdivision Underground – New
• Street Lighting o Public Lighting – New o Public Lighting – Upgrade/Replace
• Services
• Metering
The categories listed above provide the structure of these program levels. A further break down of these categories reflects the difference in the delivery costs between the type of customer (urban or rural). It is important to note that while the above categories include both ACS and SCS classified works, they have been apportioned appropriately for Ergon Energy’s regulatory submission. For further details, refer to the ‘Forecast Expenditure Summary Customer Initiated Capital Works’ document. Note there is no unit cost for large customer connects as this is an annualised average. For further details, refer to the ‘Forecast Expenditure Summary Customer Initiated Capital Work 2015 to 2020’ Cost estimate summary table (see Table 14) summarises cost estimation for Customer Initiated Capital Works.

Capital Expenditure Forecast Unit Cost Methodologies 36
Table 14: Customer Initiated Capital Works cost estimation
Sub-program Unit of measure
Description of unit Approach to costing the sub-program
Cost elements
Commercial & Industrial
Domestic & Rural
Street Lighting
Work requests
Top-down estimate of costs based on historical expenditures and quantities
These costs include mobilisation and contractor costs
Product estimates applied to each work type and applied to forecast volumes
Labour
Materials
Equipment
Other
Contractor
Subdivision Lot numbers
Services
Metering
Customer numbers
Top-down estimate of costs based on historical expenditures and quantities
These costs include mobilisation and contractor costs
Product estimates applied to each work type and applied to forecast volumes
Labour
Materials
Contractor
Equipment
Other
Large Customer Connections
Annual Expenditure
Top-down estimate of costs Historical annual cost based on identified projects
Units of measure
The volumes are based on total numbers of work requests, lot numbers, and customer numbers for the respective categories shown above in Table 14.
Approach to costing
Unit cost or program estimates for all categories, with the exception of services and metering, are based on historical direct costs recorded for units of work completed during financial periods 2010-11, 2011-12, and 2012-13. These costs include mobilisation and contractors use for the finalised tasks where actual data is available. The data source is the Ellipse Enterprise Resource Planning (ERP) System, using recorded historic costs of CICW works, and to determine an average unit cost, uses a three-year period from 2010-11 to 2012-13. This period provides a representative sample, which includes improvements and efficiencies implemented to current equipment standards and work practices, thereby reflecting an efficient cost of the forecasted activity. Unit costs or program estimates for services and metering are based on historical direct costs recorded for each customer service during the financial period 2008-09 to 2013-14 as the developed costs from the 2010-11 to 2012-13 period was considered to have a negative bias. To cater for this abnormality a sample size covering the historical period from 2008-09 to 2013-14 was used. It is assumed that the use of a larger sample size represents a unit cost that is comparable to the bottom up cost estimate. These costs include mobilisation and contractors used for the finalised tasks where actual data is available. It is assumed that the historical costs are indicative of future costs as:
• the nature of the works is not forecasted to change significantly during the 2015-20 regulatory control period
• the standards and specifications are not forecasted to change significantly during the 2015-20 regulatory control period
• the currency of the data reflects the cost of delivery of the works in the current market.

Capital Expenditure Forecast Unit Cost Methodologies 37
To ensure an efficient unit cost, the following manual checking for validity of the data was applied in establishment of the unit cost:
• removal of all projects marked ‘unsuccessful’
• removal of any project with a cost less than or equal to $0
• verification of the activity code; removal of five line items where the code did not match
• separation of contestable and non-contestable works.
Approach to costing the sub-program
Estimation of the forecast expenditure for CICW program (see Table 15) involves multiplying the econometrically derived volumes of works with the estimated unit cost for each category. For further details, refer to the ‘Forecast Expenditure Summary - Customer Initiated Capital Works 2015 to 2020.’
Customer Initiated Capital Works program estimates
See Table 15 for the program estimates (in direct cost) for the above program(s).
Table 15: Customer Initiated Capital Works Program Estimates
Ellipse estimate code
Investment description Direct unit cost ($ real 2012-13)
1 MIP1161 New Meters/Receivers – SCS 15
2 MIP1162 New Meter Services – SCS 339
3 MIP1271 New Meters/Receivers – ACS 158
4 MIP1272 New Meter Services – ACS 54
5 PCAASPLN Street Lighting: D-Public Lighting – New 54,045
6 PCAASPLU Street Lighting: D-P Lighting-Upgrade/Replace 10,757
7 PCCCCRCN Commercial & Industrial: D-Rural Customer New 51,642
8 PCCCCUCN Commercial & Industrial: D-Urban Customer New 70,968
9 PCCCDRCN Domestic & Rural: D-Rural Customer New 28,362
10 PCCCDUCN Domestic & Rural: D-Urban Customer New 21,159
11 PCCSDSON Subdivision: D-Subdivision Overhead – New 9,708
12 PCCSDSUN Subdivision: D-Subdivision Underground – New 6,392
7.2 Photovoltaic related augmentation
The has been a strong uptake of customer connected photovoltaics across the Ergon Energy supply area, predominantly as a consequence of government incentives. The adoption of photovoltaic systems by customers is expected to continue into the future as customers continue to look for expanded choice in supply options. The future growth rate of photovoltaic related augmentation is
Capital Expenditure Forecast Unit Cost Methodologies 38
uncertain, but the expectation is that growth, while less than historical, will continue steadily with photovoltaic size likely to decrease based on changes to the government feed in tariff. A range of photovoltaic attributed network issues have resulted from both the rapid take-up rate by customers and the fundamental change that bidirectional power-flow poses to network operation. For details of this program, refer to the document ‘Distribution Network Impacts of Photovoltaic Connections to 2020’. The different network types and the regions provide the structure for this sub-program. The different network types each have different thresholds for photovoltaic penetration and different types of solutions available to address network issues as they emerge. The uptake rates are different for each region and the geographic location of the constraints influences delivery of the solution and consequently the driver for expenditure.
Cost estimate summary table
Table 16 summarises cost estimation for photovoltaic related augmentation.
Table 16: Photovoltaic Augmentation cost estimation
Sub-program Unit of measure
Description of unit Approach to costing the sub-program Cost elements
Photovoltaic related Augmentation
Individual projects
Product Estimates Product estimates applied to each work type and applied to forecast volumes.
Labour
Materials
Units of measure
The solutions to the forecasted constraints caused by photovoltaic installations on the network provide the basis for the forecast volumes. These solutions are in the form of individual projects required to address a constraint. The exceptions are cases requiring re-conductoring where volume is in kilometres of line.
Approach to costing
The program estimates used for this sub-program are the same as those derived for the distribution augmentation modelled program (listed above see Table 13). No mobilisation costs applied because the expectation is that Ergon Energy staff at local depots would resource this work. The one exception is the installation of a Static Synchronous Compensator (STATCOM). This uses the existing Low Voltage Relay (LVR) product estimate, as the labour hours required are the same based on identical installation processes. Adjustments to the product estimate account for differences in equipment costs based on an invoice from a supplier and a budgetary quote from another supplier.
Approach to costing the sub-program
Developing the bottom-up cost estimate uses the expected number of various solutions multiplied by the associated program or product estimate cost. Based on the proposed program of works to address photovoltaic triggered works, this compared the average cost per network for cumulative costs forecast to 2020, with data captured for works flagged as triggered owing to photovoltaic for the period of February to May 2014. This comparison revealed that the estimate was within 4% of actual observed costs.
Capital Expenditure Forecast Unit Cost Methodologies 39
7.3 Asset renewal and refurbishment
Timely maintenance and renewal of assets on the network is critical to the long-term capability of the network to provide a safe, secure, and reliable electricity supply. The following are five types of renewal and refurbishment investments aimed at achieving the right balance between risk, operational and capital expenditures:
• Line Maintenance
• Metering
• Public Lighting
• Network Replacement
• Operational Technology
• Telecommunications.
Line Maintenance
This program is broken down into the following defect remediation sub-programs:
• Line defect remediation
• Distribution earthing remediation
• Connector splice replacement
• ‘Figure 8’ colour coded service replacement
• Overhead customer service cable inspection and replacement
• Neutral screened service cable inspection and replacement
• Cast iron pot head replacement
• Laminated cross-arm replacement
• Non-ceramic customer end service fuse replacement
• EDO fuse replacement in high risk areas
• Post natural disaster defect remediation
• RMU mechanism replacement
This section also includes an additional program for Major Items Failed in Service (MIFIS), which is forecast differently to the defect remediation sub-program. The methodology for estimating expenditure to support Line Maintenance and MIFIS is described in further detail in the ‘Line Asset Defect Management Methodology’.

Capital Expenditure Forecast Unit Cost Methodologies 40
Unit cost estimation table
Table 17 summarises cost estimation for Line Maintenance.
Table 17: Line Maintenance cost estimation
Sub-program Unit of measure
Description of unit Approach to costing the sub-program
Cost elements
Line Maintenance
Individual asset defects
Bottom-up estimate of costs for each task type
Estimates applied to quantities for each task type
Mobilisation uplift factor of 52.6% applied where transport, equipment and accommodation costs are not already included in the estimate
A contract uplift of 1.1% is applied
Labour
Materials
Equipment
MIFIS (Major Items Failed In Service)
Individual asset defects
Top-down estimate of costs based on historical expenditures and job quantities inclusive of transport, equipment and accommodation costs
Estimates applied to quantities based on history for each asset type
Labour
Materials
Equipment
Defect remediation
Units of measure
The volumes are based on total numbers of tasks forecasted to be completed.
Approach to costing
Different methods are used for estimating unit costs for defect management, post natural disaster defect remediation and the remaining line maintenance sub-programs. The defect remediation estimating products are based on the field experience and expected scope of typical defect remediation tasks of each type of works. The majority of defect remediation estimating products do not include travel, accommodation, equipment, project support or overhead costs. Distribution Earthing Remediation and Connector Splice Replacement unit costs include travel, accommodation, and equipment. The Post Natural Disaster Defect Remediation estimating product comprises a historical MIFIS component and estimated costs of remediation of defects following post-cyclone asset inspections.
Approach to costing the sub-programs
Deriving the sub-program costs uses the forecast number of tasks by type at the estimated unit cost estimates (product or program) (see Table 18). An uplift factor for mobilisation costs of 52.6% is used where unit cost estimates do not already include mobilisation costs. This factor is based on the sum of travel, equipment, and supervision costs divided by a standard estimate equivalent cost. Standard Estimate equivalent cost = (total labour + material cost + other cost) – (labour cost of travel + accommodation cost + cost of depot time + total equipment cost + supervision cost) Each estimate was linked to the feeder category classification (e.g. urban, long rural, short rural or isolated) and to a financial year. Weighted average mobilisation factors were calculated for each feeder category, based on the quantities of defects within each defect pack. Based on fractions of poles in each feeder category another weighted average was calculated to obtain a single

Capital Expenditure Forecast Unit Cost Methodologies 41
mobilisation factor of 52.56%. The ‘Line Asset Defect Management Methodology’ explains this further. A contract uplift of 1.1% is applied. Validation of the line defect remediation sub-program estimate is achieved by back casting the unit costs and uplift factor to defect data for 2010-11 to 2012-13, with an accuracy of -13%. That is, the back-cast costs were lower than historical costs, which reflect an expectation of reductions in average unit rate costs when compared to the previous three years. Mobilisation uplift factor is not applied to sub-programs such as Distribution Earth Remediation, Connector Splice Replacement, Major Items Failed in Service and Post Natural Disaster Defect Remediation. Unit costs of these sub-programs include travel, accommodation and equipment costs.
Major Items Failed In Service (MIFIS)
Units of measure
The volumes are based on total numbers of failures forecasted for each asset type.
Approach to costing
The estimates are based on historical costs and work order quantities, extracted from Ellipse over the period of 2009-10 to 2012-13, inclusive of travel, accommodation, and equipment costs.
Approach to costing the sub-program
The sub-program costs have been derived by applying the cost estimates (see Table 18) to the forecasted number of failures for each asset type.
Line Maintenance program estimates
See Table 18 for the program estimates (in direct cost) for the above program(s).
Table 18: Line Maintenance Program Estimates
Ellipse estimate code
Investment description Direct unit cost ($ real 2012-13)
1 MIP1055 Service Cable – Elevated Work Platform Inspection of 1 Service 105
2 MIP1056 Service Cable – Inspect 2 Services from Ground-line 32
3 MIP1060 Conductor Clearance – Rectify 2,163
4 MIP1061 Cross-arm – Complex – Replace 2,715
5 MIP1064 Cross-arm Kingbolt – Replace 1,057
6 MIP1065 Distribution Transformer – Replace 6,735
7 MIP1068 Operator Platform – Remove 530
8 MIP1069 Service Cable – Replace 1,408
9 MIP1070 Site Access – Repair 933
10 MIP1071 Stay – Install/Replace 659

Capital Expenditure Forecast Unit Cost Methodologies 42
Ellipse estimate code
Investment description Direct unit cost ($ real 2012-13)
11 MIP1072 Steel Pole – Replace 4,208
12 MIP1074 Wood Pole – Nail 1,323
13 MIP1075 Wood Pole – Repair 540
14 MIP1078 RMU Mechanism (4 Switch) – Replace 4,367
15 MIP1079 RMU Mechanism (3 Switch) – Replace 3,917
16 MIP1082 Cast Iron Cable Pot Head – Replace 12,256
17 MIP1084 Replacement of Connector (cost per connector) 309
18 MIP1087 EDO fuse – Replace with Current Limiting fuse 621
19 MIP1089 Non-Ceramic Service fuse on Facia – Replace service and fuse 510
20 MIP1146 Minor Task – Repair 380
21 MIP1147 Cross-arm – Moderate – Replace 2,406
22 MIP1148 Wood Pole – Replace 4,630
23 MIP1149 Cross-arm – Minor – Replace 756
24 MIP1150 Major Items Failed in Service – Switchgear 7,666
25 MIP1151 Major Items Failed in Service – Transformer 8,611
26 MIP1152 Major Items Failed in Service – Underground 11,024
27 MIP1165 Post Natural Disaster Defect Remediation 8,600,194
28 MIP1193 Non SWER Earthing Defect Remediation 2,320
29 MIP1194 SWER Earth Deft Remediation 3,052
Metering
This program is broken down into the following sub-programs:
• Replace metering end-of-life
• Replace metering in-situ
• Replace metering obsolete
The sub-program costs are derived in different ways for the following sub-programs:
• Replace metering end-of-life and in-situ
• Replace metering obsolete

Capital Expenditure Forecast Unit Cost Methodologies 43
Unit cost estimation table
Table 19 summarises Metering cost estimation
Table 19: Metering cost estimation
Sub-program Unit of measure
Description of unit Approach to costing the sub-program
Cost elements
Replace metering end-of-life
Meter Bottom-up estimates for each component:
Meter – historic average
Installation – standard labour rates
Estimates applied to each asset
Uplift factor of 40.42% applied to account for mobilisation and contract uplift of 1.1%
Labour
Materials
Replace metering in-situ
Meter Bottom-up estimates for each component:
Meter – historic average
Installation – standard labour rates
Estimates applied to each asset
Uplift factor of 40.42% applied to account for mobilisation and contract uplift of 1.1%
Labour
Materials
Replace metering obsolete
Meter Top down estimate of costs for average removal based on historic average costs
Estimates applied to each asset exclusive of transport and accommodation costs, which are included in the meter replacement cost.
Labour
Materials
Replace metering end-of-life and in-situ
These sub-programs replace populations of meter beyond twice their economic life and showing signs of failure (End of Life program) or families of meters with high rates of non-compliance as discovered via in-situ testing (in-situ program).
Units of measure
Measurement of the volume of meters forecast for replacement uses the number of meters identified as requiring replacement.
Approach to costing
The bottom-up cost estimates (see Table 21) are measured in the number of meters. The replacement meter costs are based on a current standard of meter suitable for existing configuration. The bottom-up estimates consists of the following components:
• meter cost
• installation cost.
The meter costs are based on a weighted average cost of the meters, including all components, purchased in the 2012-13 period under the current purchasing contract, extracted from Ellipse. The installation cost is based on the anticipated one-hour installation time and standard labour rates. The unit costs have been compared to the unit costs derived from the metering replacement program currently being undertaken in southwest Queensland and are within 5% accuracy. The validation used the top down figures from the CICW meter installation program and these were compared to the bottom-up forecast used. These figures were found to be similar.
Approach to costing the sub-program

Capital Expenditure Forecast Unit Cost Methodologies 44
The bottom-up sub-program cost estimate is based on the expected number of replacement meters multiplied by the bottom-up estimate, with an uplift of 40.42% applied to account for mobilisation and a contract uplift of 1.1%. This mobilisation factor is based on the percentage uplift required to the standard estimate to equate to the cost estimates used for the South West BAZ Meter Replacement Project. . The BAZ program is the planned BAZ (non-compliant meter family) meter replacement program for the southwest region scheduled for 2014-15. These figures derive from a trial replacement program in Dalby, and were used for validation against the sub-program cost estimate of the 2015-20 meter replacement programs.
Replace metering obsolete
This sub-program involves replacing obsolete meter related components, identified while already at site, required to replace a meter in the End-of-life or In-situ sub-program.
Units of measure
The volume of obsolete meter related components forecasted for replacement is measured in the number of meters identified as requiring replacement. These components can range from a complete new customers switchboard to minor electrical equipment located inside such as metering links. This has been estimated using historic surveys of the types of equipment that require removal and the frequency of these removals per meter replacement. The HMT Meter replacement project from 2009 was used to evaluate the number of obsolete replacements expected. Meters that are to be targeted in the proposed regulatory submission have been adjusted (i.e. rounded down) to allow for meters replaced through normal operational requirements (such as reconfiguration, Inverter Energy Systems, tariff reform) to estimate the number of replacements in the 2015-20 regulatory control period.
Approach to costing
There are no bottom-up estimates (see Table 21) derived for this sub-program, as the metering components requiring replacement will be unknown until onsite. As such, the approach was to develop a unit cost from the top down based on the number of forecasted replacement meters. The replacement of obsolete meter related components costs are based on removal of obsolete components, as required, while resources are on site installing replacement meters. The resulting product/program cost estimates labour element has been estimated using the data from the historic surveys, giving a weighted average of the time taken to remove obsolete equipment per meter replacement. The product cost estimate does not include mobilisation costs, as these are included in the cost of the meter replacement program.
Approach to costing the sub-program
The top-down cost estimate is based on the expected number of replacement meters multiplied by the program estimate/unit cost.
Public Lighting
This program is for bulk lamp capital replacement
Unit cost estimation table
Table 20 summarises public lighting estimation

Capital Expenditure Forecast Unit Cost Methodologies 45
Table 20: Public lighting estimation
Sub-program Unit of measure
Description of unit Approach to costing the sub-program
Cost elements
Bulk lamp capital replacement
Individual Asset
Bottom-up program estimate based for each asset
Estimates applied to each asset. A contract uplift of 1.1% applies
Labour
Materials
Equipment
Units of measure
The volume of luminaires forecast to be replaced is measured in the number of luminaires identified as requiring replacement.
Approach to costing
The bottom-up cost estimate (see Table 21) per unit is measured in the number of luminaires and consists of the following components:
• luminaire cost
• installation cost including labour and plant hire
• materials cost including the actual luminaire (lantern / light head)
The costs are based on labour, materials and equipment costs under current purchasing contracts, extracted from Ellipse.
Approach to costing the program
The sub-program is based on capital spend required to support the bulk lamp replacement program whereby Ergon Energy aims to replace all lamps every three years. The bulk lamp replacement program is covered under operating expenditure. However, when the asset is found to have deteriorated or is damaged a decision to replace the asset is required. This replacement activity, of the whole luminaire or other capital components, forms the basis of this capital program (see Table 21).
Metering and Public Lighting program Estimates
Table 21 shows the program estimates (in direct cost) for the above program(s).
Table 21: Metering and Public Light Program Estimates
Ellipse estimate code
Investment description Direct unit cost ($ real 2012-13)
1 MIP1100 & MIP1118
End-of-life for meters and In-situ testing driven non-compliant meter families and Obsolete Meter Technology – inclusive of support
300
2 MIP1100 & MIP1118
Obsolete Meter Technology – inclusive of support 228
3 MIP1273 Bulk Lamp Capital Replacement Program 797
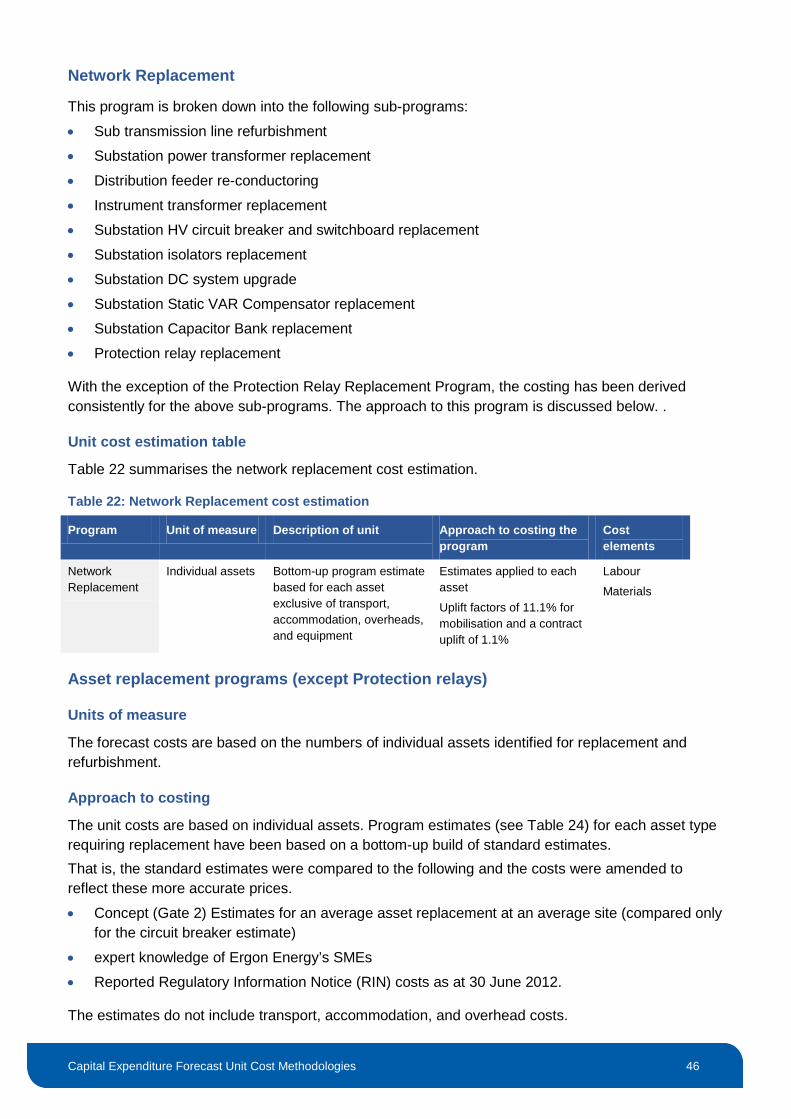
Capital Expenditure Forecast Unit Cost Methodologies 46
Network Replacement
This program is broken down into the following sub-programs:
• Sub transmission line refurbishment
• Substation power transformer replacement
• Distribution feeder re-conductoring
• Instrument transformer replacement
• Substation HV circuit breaker and switchboard replacement
• Substation isolators replacement
• Substation DC system upgrade
• Substation Static VAR Compensator replacement
• Substation Capacitor Bank replacement
• Protection relay replacement
With the exception of the Protection Relay Replacement Program, the costing has been derived consistently for the above sub-programs. The approach to this program is discussed below. .
Unit cost estimation table
Table 22 summarises the network replacement cost estimation.
Table 22: Network Replacement cost estimation
Program Unit of measure Description of unit Approach to costing the program
Cost elements
Network Replacement
Individual assets Bottom-up program estimate based for each asset exclusive of transport, accommodation, overheads, and equipment
Estimates applied to each asset
Uplift factors of 11.1% for mobilisation and a contract uplift of 1.1%
Labour
Materials
Asset replacement programs (except Protection relays)
Units of measure
The forecast costs are based on the numbers of individual assets identified for replacement and refurbishment.
Approach to costing
The unit costs are based on individual assets. Program estimates (see Table 24) for each asset type requiring replacement have been based on a bottom-up build of standard estimates. That is, the standard estimates were compared to the following and the costs were amended to reflect these more accurate prices.
• Concept (Gate 2) Estimates for an average asset replacement at an average site (compared only for the circuit breaker estimate)
• expert knowledge of Ergon Energy’s SMEs
• Reported Regulatory Information Notice (RIN) costs as at 30 June 2012.
The estimates do not include transport, accommodation, and overhead costs.

Capital Expenditure Forecast Unit Cost Methodologies 47
Approach to costing the program
The program cost has been derived by multiplying the program estimates (see Table 24) by the expected volume of replacement/refurbishment assets of each type, with an uplift of 11.1% applied to account for mobilisation and a contract uplift of 1.1%.
Protection relay replacement
Units of measure
Table 23 shows the units of measurement used to forecast volumes.
Table 23: Protection relay replacement units of measure
Sub-program Unit
Protection relay replacement
Individual relay
Half substation
Full substation
LV switchboard
The bottom-up unit costs have been developed based on the units outlined in Table 23. These sub-programs may be further broken down into the regions where the required works are identified.
Approach to costing each unit
The bottom-up estimates are based on the expected scope to replace and/or install each type of asset, exclusive of transport, accommodation, and overheads. The costs used to develop the program estimates are based on standard labour rates in Ellipse, and SME knowledge of the cost of materials and equipment.
Approach to costing the sub-program
The bottom-up cost estimate is based on the expected number of replacements of each type multiplied by the associated estimate cost, with a mobilisation uplift factor of 11.1% and a contract uplift of 1.1%.
Network Replacement program estimates
See Table 24 for the program estimates (in direct cost) for the above program(s).
Table 24: Network Replacement Program Estimates
Ellipse estimate code
Investment description Direct unit cost ($ real 2012-13)
1. MIP1005 Create new 11kV/22kV/33kV Medium Rating Rural feeder 66,377
2. MIP1145 Install Neutral CT (22KV or 11Kv) 49,302
3. MIP1153 Install set of 3 outdoor HV powder fuses in sub for transformer protection
65,094
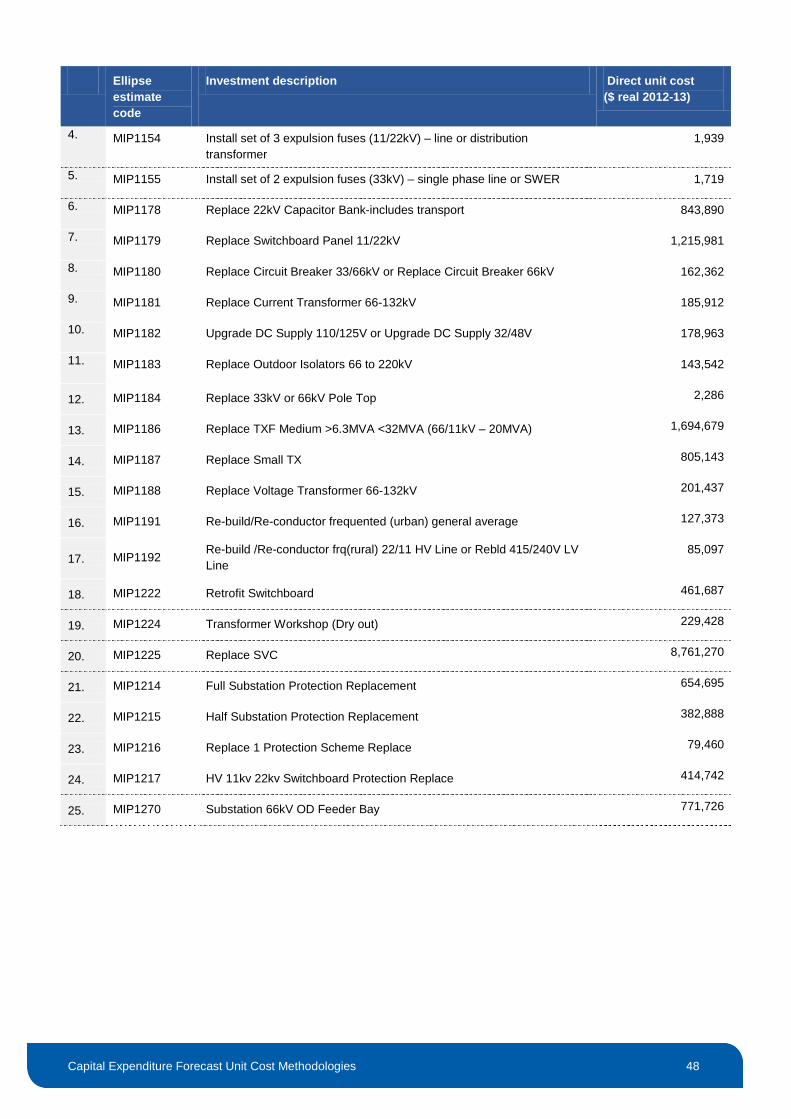
Capital Expenditure Forecast Unit Cost Methodologies 48
Ellipse estimate code
Investment description Direct unit cost ($ real 2012-13)
4. MIP1154 Install set of 3 expulsion fuses (11/22kV) – line or distribution transformer
1,939
5. MIP1155 Install set of 2 expulsion fuses (33kV) – single phase line or SWER 1,719
6. MIP1178 Replace 22kV Capacitor Bank-includes transport 843,890
7. MIP1179 Replace Switchboard Panel 11/22kV 1,215,981
8. MIP1180 Replace Circuit Breaker 33/66kV or Replace Circuit Breaker 66kV 162,362
9. MIP1181 Replace Current Transformer 66-132kV 185,912
10. MIP1182 Upgrade DC Supply 110/125V or Upgrade DC Supply 32/48V 178,963
11. MIP1183 Replace Outdoor Isolators 66 to 220kV 143,542
12. MIP1184 Replace 33kV or 66kV Pole Top 2,286
13. MIP1186 Replace TXF Medium >6.3MVA <32MVA (66/11kV – 20MVA) 1,694,679
14. MIP1187 Replace Small TX 805,143
15. MIP1188 Replace Voltage Transformer 66-132kV 201,437
16. MIP1191 Re-build/Re-conductor frequented (urban) general average 127,373
17. MIP1192 Re-build /Re-conductor frq(rural) 22/11 HV Line or Rebld 415/240V LV Line
85,097
18. MIP1222 Retrofit Switchboard 461,687
19. MIP1224 Transformer Workshop (Dry out) 229,428
20. MIP1225 Replace SVC 8,761,270
21. MIP1214 Full Substation Protection Replacement 654,695
22. MIP1215 Half Substation Protection Replacement 382,888
23. MIP1216 Replace 1 Protection Scheme Replace 79,460
24. MIP1217 HV 11kv 22kv Switchboard Protection Replace 414,742
25. MIP1270 Substation 66kV OD Feeder Bay 771,726

Capital Expenditure Forecast Unit Cost Methodologies 49
Operational Technology
This work stream consists of the following programs:
• Audio Frequency Load Control (AFLC) equipment asset replacement
• Remote Terminal Unit (RTU) replacement
Unit cost estimation table
Table 25 summarises operational technology cost estimation.
Table 25: Operational technology cost estimation
Sub-program Unit of measure Description of unit Approach to costing the sub-program
Cost elements
AFLC equipment asset replacement
Individual asset Bottom-up estimate based on expert knowledge of SMEs
Estimates applied exclusive of transport or accommodation costs or overheads
Uplift factor of 9.98% applied to account for transport and accommodation costs and contractors uplift of 1.1%
Labour
Materials
RTU replacement
Individual asset Bottom-up estimate based on expert knowledge of SMEs
Standard Estimates applied exclusive of transport or accommodation costs or overheads
Uplift factor of 9.98 applied to account for transport and accommodation costs and a contractors uplift of 1.1%
Labour
Materials
Audio Frequency Load Control (AFLC) replacement
Units of measure
The forecast volumes are measured in the number of individual components or whole assets are identified as requiring replacement.
Approach to costing each unit
The bottom-up estimates are based on the expected scope to replace and/or install each type of asset, exclusive of transport, accommodation, and overheads. The costs used to develop the program estimates are based on standard labour rates in Ellipse and SME knowledge of the cost of materials and equipment.
Approach to costing the sub-program
The bottom-up cost estimate is based on the expected number of installations of each type multiplied by the associated estimate cost, with a mobilisation uplift factor of 9.98% and a contract uplift of 1.1%.
Remote Terminal Unit (RTU) replacement
Units of measure
The forecast volumes are measured in the number of individual assets that are identified as requiring replacement.

Capital Expenditure Forecast Unit Cost Methodologies 50
Approach to costing each unit
The bottom-up estimates are based on the expected scope to replace/install each type of asset, exclusive of transport, accommodation, and overheads. The costs used to develop the program estimates are based on standard labour rates in Ellipse and SME knowledge of the cost of materials and equipment.
Approach to costing the sub-program
The bottom-up cost estimate is based on the expected number of installations of each type multiplied by the associated estimate cost, with a mobilisation uplift factor of 9.98% and a contract uplift of 1.1%.
Operational Technology program estimates
See Table 26 for the program estimates (in direct cost) for the above program(s).
Table 26: Operational Technology Program Estimates
Ellipse estimate code
Investment description Direct unit cost ($ real 2012-13)
1 MIP1202 Replace AFLC - SFU & Outdoor Unit transmitter and coupling cell. Includes new AFLC study - Medium - 33kv / 220
623,285
2 MIP1207 Replace AFLC - SFU & Outdoor Unit transmitter and coupling cell. Includes new AFLC study - Large - 66kv / 220
1,005,152
3 MIP1211 Replace AFLC - SFU transmitter. Includes new AFLC study 282,492
4 MIP1218 Replace RTUs in a small sub 152,114
5 MIP1219 Replace RTUs in a medium sub 220,057
6 MIP1220 Replace RTUs in a large sub 299,708
Telecommunications
This program is broken down into the following sub-programs:
• CoreNet, Active Network Replacement
• CoreNet, Site Infrastructure Replacement
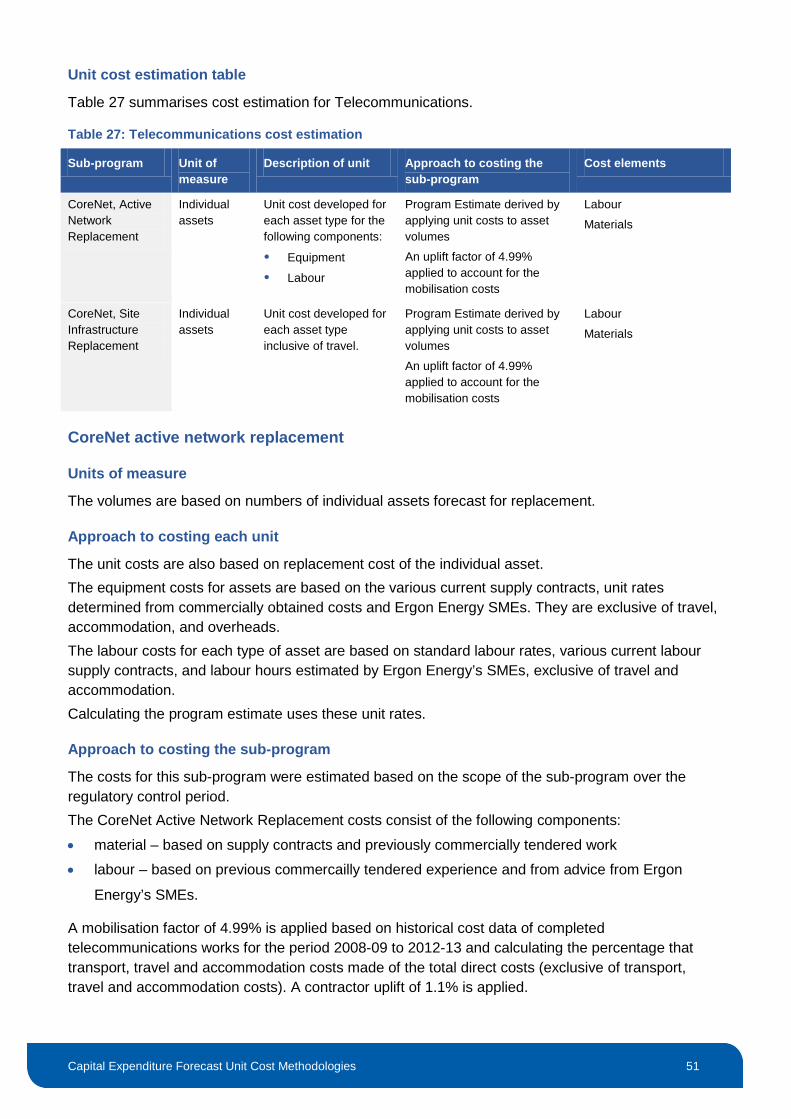
Capital Expenditure Forecast Unit Cost Methodologies 51
Unit cost estimation table
Table 27 summarises cost estimation for Telecommunications.
Table 27: Telecommunications cost estimation
Sub-program Unit of measure
Description of unit Approach to costing the sub-program
Cost elements
CoreNet, Active Network Replacement
Individual assets
Unit cost developed for each asset type for the following components:
Equipment
Labour
Program Estimate derived by applying unit costs to asset volumes
An uplift factor of 4.99% applied to account for the mobilisation costs
Labour
Materials
CoreNet, Site Infrastructure Replacement
Individual assets
Unit cost developed for each asset type inclusive of travel.
Program Estimate derived by applying unit costs to asset volumes
An uplift factor of 4.99% applied to account for the mobilisation costs
Labour
Materials
CoreNet active network replacement
Units of measure
The volumes are based on numbers of individual assets forecast for replacement.
Approach to costing each unit
The unit costs are also based on replacement cost of the individual asset. The equipment costs for assets are based on the various current supply contracts, unit rates determined from commercially obtained costs and Ergon Energy SMEs. They are exclusive of travel, accommodation, and overheads. The labour costs for each type of asset are based on standard labour rates, various current labour supply contracts, and labour hours estimated by Ergon Energy’s SMEs, exclusive of travel and accommodation. Calculating the program estimate uses these unit rates.
Approach to costing the sub-program
The costs for this sub-program were estimated based on the scope of the sub-program over the regulatory control period. The CoreNet Active Network Replacement costs consist of the following components:
• material – based on supply contracts and previously commercially tendered work
• labour – based on previous commercailly tendered experience and from advice from Ergon
Energy’s SMEs.
A mobilisation factor of 4.99% is applied based on historical cost data of completed telecommunications works for the period 2008-09 to 2012-13 and calculating the percentage that transport, travel and accommodation costs made of the total direct costs (exclusive of transport, travel and accommodation costs). A contractor uplift of 1.1% is applied.

Capital Expenditure Forecast Unit Cost Methodologies 52
CoreNet Site Infrastructure Replacement
Units of Measure
The volumes are based on the number of individual assets forecast for replacement.
Approach to costing each unit
The unit costs are also based on the estimated replacement costs of the individual asset. The equipment costs are based on the assets listed in Table 28
Table 28: CoreNet site infrastructure unit cost sources
Asset Source
Air conditioning Recent similar project with adjustments to account for difference of scope
Air conditioning Split Recent similar project with adjustments to account for difference of scope
DC Rack Power System Supplier provided
Generator Knowledge of Ergon Energy’s SMEs and recent similar projects with adjustments to account for difference of scope
Static Transfer Switch Supplier provided
Uninterruptable Power Supply Supplier provided
Approach to costing the sub-program
The costs for this sub-program were estimated based on the scope of the sub-program over the regulatory control period. The CoreNet Infrastructure Network Replacement costs where based upon individual asset condition based replacements, which are derived by applying unit costs to the forecast volume of replacements. An uplift factor of 4.99% applied to account for mobilisation costs with a contractor’s uplift of 1.1%.
Telecommunications program estimates
See Table 29 for the program estimates (in direct cost) for the above program(s).
Table 29: Telecommunications
Ellipse estimate code
Investment description Direct unit cost ($ real 2012-13)
1 MIP1166 CoreNet, Site Infrastructure Replacement 67,757
2 MIP1167 CoreNet, Active Network Replacement 149,733
7.4 Network Reliability and Power Quality
This expenditure category has the following programs:
• Reliability of Supply
• Power Quality.

Capital Expenditure Forecast Unit Cost Methodologies 53
Reliability of Supply
This program consists of the expenditure targeted to address worst performing feeders as they are identified during the next regulatory control period.
Unit cost estimation table
Table 30 summarises reliability of supply cost estimation.
Table 30: Reliability of supply cost estimation
Program Unit of measure
Description of unit Approach to costing the program Cost elements
Reliability Individual feeders
Top down estimates are created in Ellipse based on historic averages
Excludes transport or accommodation costs or overheads
Bottom-up cost estimate based on the expected number of feeders multiplied by the associated estimate cost
An uplift factor of 10.63% applied to account for the transport or accommodation costs and contractors uplift of 1.1%
Labour
Materials
Other
Units of measure
The projects that develop from continuing to monitor and measure Ergon Energy’s worst performing feeder will be determined annually and will be based on the feeders that demonstrate consistently poor performance. The estimated unit costs used to forecast the per feeder cost measures have been derived from historical feeder improvement projects. The forecast volumes are based on feeders that consistently demonstrate poor performance. This program may further be broken down into the feeder types approximated by region based on the percentage of feeders in each region.
Approach to costing each unit
The historic average program costs associated with this program are the historic average costs per feeder based on projects previously delivered under the worst performing feeder program. A review of the actual costs of 30 recently delivered distribution feeder, reliability improvement projects were reviewed to develop the average unit costs per feeder.
Approach to costing the program
The cost estimate is based on the forecasted number of feeders multiplied by the associated average estimate cost, with an uplift factor of 10.63% applied to account for mobilisation costs and a contractor’s uplift of 1.1%. The mobilisation factor is based on historical cost data of 30 completed reliability projects for the period 2011-12 to 2013-14 and calculating the percentage that transport, travel and accommodation costs made of the total direct costs (exclusive of capitalised interest, transport, travel and accommodation costs).
Reliability of Supply program estimates
See Table 31 for the program estimates (in direct cost) for the above program(s).
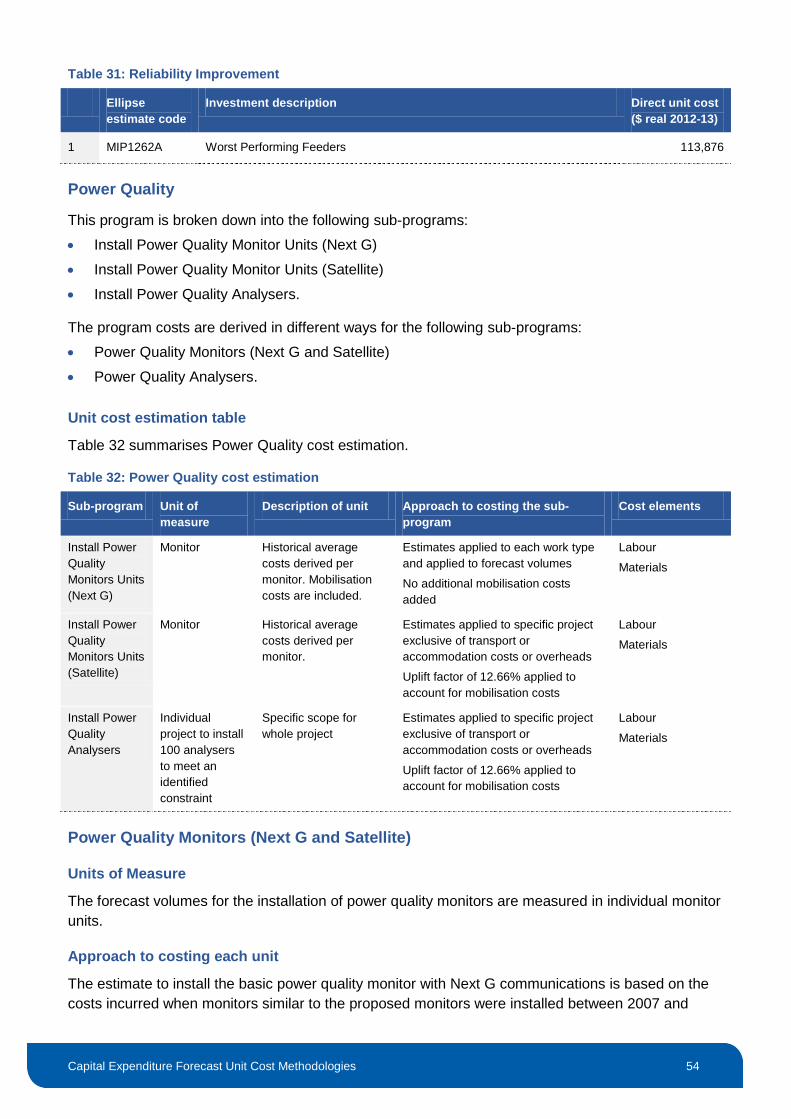
Capital Expenditure Forecast Unit Cost Methodologies 54
Table 31: Reliability Improvement
Ellipse estimate code
Investment description Direct unit cost ($ real 2012-13)
1 MIP1262A Worst Performing Feeders 113,876
Power Quality
This program is broken down into the following sub-programs:
• Install Power Quality Monitor Units (Next G)
• Install Power Quality Monitor Units (Satellite)
• Install Power Quality Analysers.
The program costs are derived in different ways for the following sub-programs:
• Power Quality Monitors (Next G and Satellite)
• Power Quality Analysers.
Unit cost estimation table
Table 32 summarises Power Quality cost estimation.
Table 32: Power Quality cost estimation
Sub-program Unit of measure
Description of unit Approach to costing the sub-program
Cost elements
Install Power Quality Monitors Units (Next G)
Monitor Historical average costs derived per monitor. Mobilisation costs are included.
Estimates applied to each work type and applied to forecast volumes
No additional mobilisation costs added
Labour
Materials
Install Power Quality Monitors Units (Satellite)
Monitor Historical average costs derived per monitor.
Estimates applied to specific project exclusive of transport or accommodation costs or overheads
Uplift factor of 12.66% applied to account for mobilisation costs
Labour
Materials
Install Power Quality Analysers
Individual project to install 100 analysers to meet an identified constraint
Specific scope for whole project
Estimates applied to specific project exclusive of transport or accommodation costs or overheads
Uplift factor of 12.66% applied to account for mobilisation costs
Labour
Materials
Power Quality Monitors (Next G and Satellite)
Units of Measure
The forecast volumes for the installation of power quality monitors are measured in individual monitor units.
Approach to costing each unit
The estimate to install the basic power quality monitor with Next G communications is based on the costs incurred when monitors similar to the proposed monitors were installed between 2007 and

Capital Expenditure Forecast Unit Cost Methodologies 55
2012 (project number CPMNP 11138). These were the project costs recorded in Ellipse for the installation of 1750 units, including travel and accommodation costs. Building up the estimate that provides the basis for installing the power quality monitor with satellite communications uses the power quality monitor with Next G communications estimate. The change in estimate reflects the additional cost for the satellite equipment in the monitor. To date there have been no satellite monitors installed. However, the Automatic Circuit Recloser strategy is installing equipment of the same nature. The costs for the satellite equipment are based on the costs in the Automatic Circuit Recloser strategy.
Approach to costing the sub-program
The sub-program cost estimate is based on the number of each type of monitor multiplied by the associated estimate. This is inclusive of travel and accommodation costs.
Power quality analysers
Units of Measure
The measurement of the forecast volume for the installation of power quality analysers uses a bulk installation of 100 analysers to provide data for the prioritised feeders that require data analysis.
Approach to costing each unit
There were no individual unit costs derived for the power quality analysers. The cost for all 100 analysers provides the basis for estimate cost for this sub-program.
Approach to costing the sub-program
Costing of the sub-program comprised of an estimate based on the scope to install 100 power quality analysers. Developing the costs used the expert knowledge of Ergon Energy’s SMEs. This estimate does not include travel, accommodation, or overheads. There is an uplift of 12.66% applied to account for mobilisation costs, based on the expected number of sites located at a distance from major centres and requiring crews to stay overnight. This mobilisation factor based on historical cost data of completed power quality projects for the period 2008-09 to 2012-13 and calculating the percentage that transport, travel and accommodation costs made of the total direct costs (exclusive of transport, travel and accommodation costs). The estimate, inclusive of the mobilisation uplift, when compared to the detailed (Gate 3) estimate and approved project, for the installation of 100 power quality analysers in the 2010-15 regulatory control period, was within ±10% accuracy.

Capital Expenditure Forecast Unit Cost Methodologies 56
Power Quality program estimates
See Table 33 for the program estimates (in direct cost) for the above program(s).
Table 33: Power Quality
Ellipse estimate code
Investment description Direct unit cost ($ real 2012-13)
1 MIP0226 New Power Quality Monitor (field) 1621
2 MIP0268 New Power Quality Monitor (field) – Satellite 3321
3 MIP1268 New Power Quality Analyser (substation) x 1 33,475
7.5 Other Systems and Enabling Technology
This expenditure category has the following programs:
• Network Replacement
• Operational Technology
Network Replacement
This program is broken down into the following sub-programs:
• Substation power transformer bunds
• LV spreader and fuse
• Substation AC system upgrade
Unit cost estimation table
Table 34 summarises Network Replacement cost estimation.
Table 34: Network Replacement cost estimation
Program Unit of measure
Description of unit Approach to costing the program Cost elements
Network Replacement
Individual assets
Estimate based for each asset exclusive of transport, accommodation, overheads and equipment
Estimates applied to each asset. Uplift factors of 11.1% applied to account for mobilisation
Also 1.1% uplift for a contractor’s uplift
Labour
Materials
Substation power transformer bunds, LV spreader and fuse replacement and Substation AC system upgrade programs
Units of measure
The volumes are based on the forecast number of individual assets identified for replacement.
Approach to costing each unit
Accordingly, the unit costs are based the replacement costs of individual assets. The program estimates are based on standard estimates for each asset type requiring replacement.

Capital Expenditure Forecast Unit Cost Methodologies 57
These estimates were compared to the following and the costs were amended to reflect these more accurate prices:
• The expert knowledge of Ergon Energy’s SMEs
• RIN costs as at 30 June 2012.
The standard estimates do not include transport, accommodation, and overhead costs.
Approach to costing the program
Derivation of the program cost estimate multiplied by the forecast volume of replacements assets of each type, with an uplift of 11.1% applied to account for mobilisation costs and a contractor’s uplift of 1.1%.
Network Replacement program estimates
See Table 35 for the program estimates (in direct cost) for the above program(s).
Table 35: Network Replacement Program Estimates
Ellipse estimate code
Investment description Direct unit cost ($ real 2012-13)
1 MIP1173 Install Bund – Large or Install Bund and Oil Containment 534,668
2 MIP1175 Install Bund – SMALL 271,893
3 MIP1113 Install LV Fuses 7,931
4 MIP1130 Install LV Spreaders (set of 10) 4,202
5 MIP1189 Relocate AC Supply into Switch Yard or Install AC Essential Supply System 219,768
Operational Technology
This program has the following sub-program:
• Protection review
• Sensitive Earth Fault (SEF) protection
• Regulator Remote Communications Strategy
Unit cost estimation table
Table 36 summarises operational technology cost estimation.
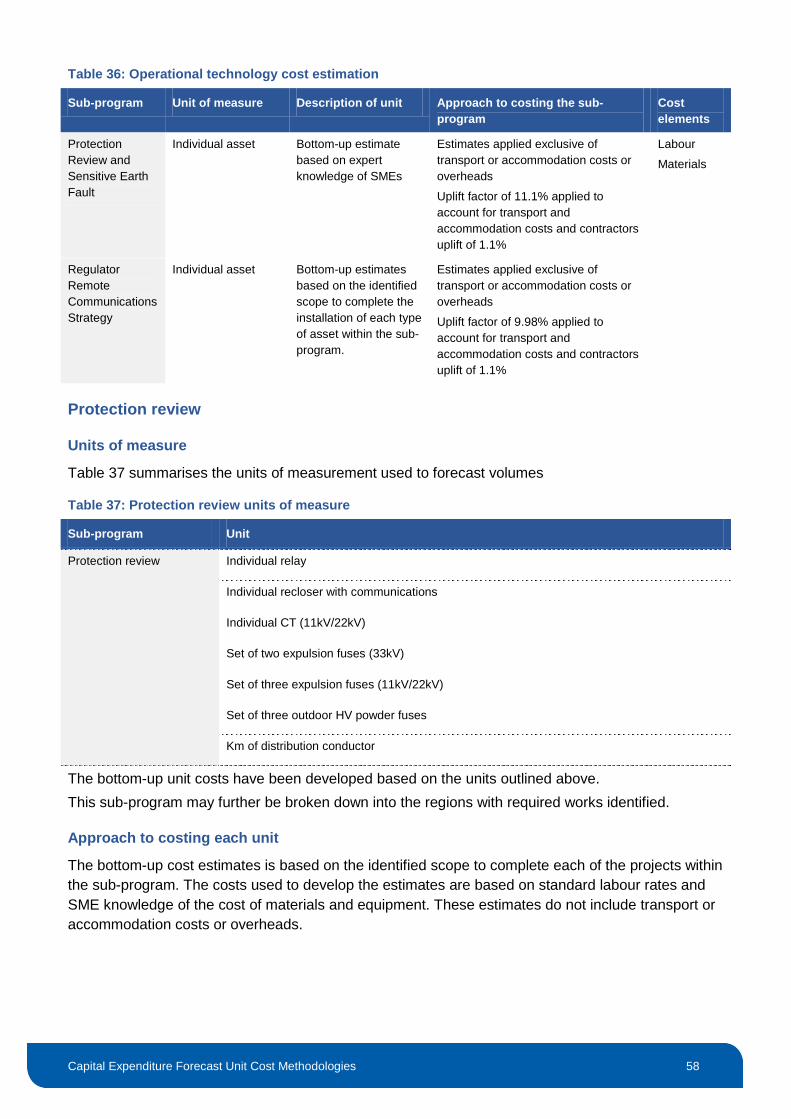
Capital Expenditure Forecast Unit Cost Methodologies 58
Table 36: Operational technology cost estimation
Sub-program Unit of measure Description of unit Approach to costing the sub-program
Cost elements
Protection Review and Sensitive Earth Fault
Individual asset Bottom-up estimate based on expert knowledge of SMEs
Estimates applied exclusive of transport or accommodation costs or overheads
Uplift factor of 11.1% applied to account for transport and accommodation costs and contractors uplift of 1.1%
Labour
Materials
Regulator Remote Communications Strategy
Individual asset Bottom-up estimates based on the identified scope to complete the installation of each type of asset within the sub-program.
Estimates applied exclusive of transport or accommodation costs or overheads
Uplift factor of 9.98% applied to account for transport and accommodation costs and contractors uplift of 1.1%
Protection review
Units of measure
Table 37 summarises the units of measurement used to forecast volumes
Table 37: Protection review units of measure
Sub-program Unit
Protection review Individual relay
Individual recloser with communications
Individual CT (11kV/22kV)
Set of two expulsion fuses (33kV)
Set of three expulsion fuses (11kV/22kV)
Set of three outdoor HV powder fuses
Km of distribution conductor
The bottom-up unit costs have been developed based on the units outlined above. This sub-program may further be broken down into the regions with required works identified.
Approach to costing each unit
The bottom-up cost estimates is based on the identified scope to complete each of the projects within the sub-program. The costs used to develop the estimates are based on standard labour rates and SME knowledge of the cost of materials and equipment. These estimates do not include transport or accommodation costs or overheads.

Capital Expenditure Forecast Unit Cost Methodologies 59
Approach to costing the sub-program
The bottom-up cost estimate is based on the expected number of installations of each type multiplied by the associated estimate cost, with an uplift factor of 11.1% applied to account for the transport or accommodation costs and a contractor’s uplift of 1.1%. Reviews of Ellipse reports for completed protection projects and recloser projects checked the reasonableness of project costs for similar projects for the last six years, and the scope of work completed for each project for alignment with scope of the estimates.
Sensitive Earth Fault (SEF) protection
Units of measure
Table 38 shows the units of measurement used to forecast volumes.
Table 38: Sensitive Earth Fault (SEF) protection units of measure
Sub-program Unit
Sensitive Earth Fault (SEF) protection Individual relay
LV switchboard
The bottom-up unit costs have been developed based on the units outlined above. This sub-program may further be broken down into the regions with identified required works.
Approach to costing each unit
The bottom-up cost estimates is based on the identified scope to complete a project within the sub-program. The costs used to develop the estimates are based on standard labour rates and SME knowledge of the cost of materials and equipment. These estimates do not include transport or accommodation costs or overheads.
Approach to costing the sub-program
The bottom-up cost estimate is based on the expected number of installations of each type multiplied by the associated estimate cost, with an uplift factor of 11.1% applied to account for mobilisation costs and a contractor’s uplift of 1.1%. Reviews of the Ellipse reports for completed protection projects and recloser projects check for reasonableness of project costs for similar projects for the last six years, further checking the scope of work completed for each project for alignment with scope of the estimates.
Regulator Remote Communications Strategy
Units of measure
Ergon Energy has approximately 584 high voltage (HV) regulator sites, none of which has remote communications. Ergon Energy’s goal by 2030 is for all HV regulators to have remote communications for engineering access and SCADA/DMS data. The measurement of forecast volumes is in number of individual assets, identified as requiring installation, and adhering to certain criteria.
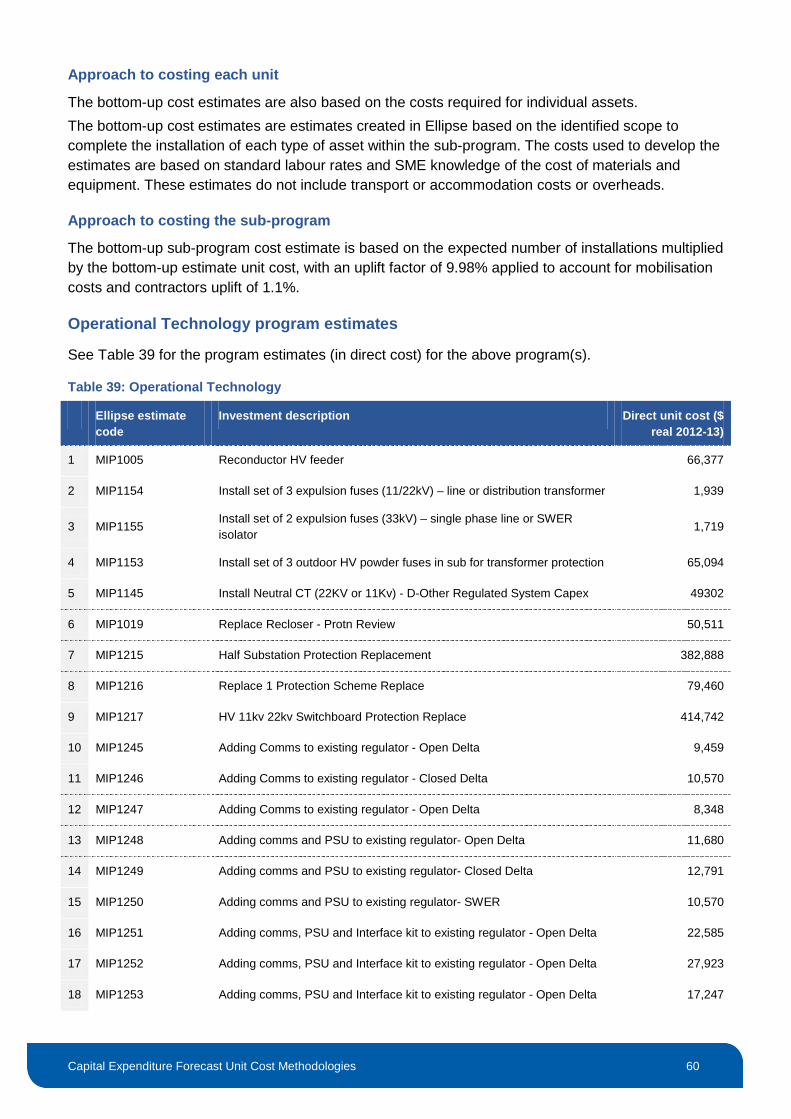
Capital Expenditure Forecast Unit Cost Methodologies 60
Approach to costing each unit
The bottom-up cost estimates are also based on the costs required for individual assets. The bottom-up cost estimates are estimates created in Ellipse based on the identified scope to complete the installation of each type of asset within the sub-program. The costs used to develop the estimates are based on standard labour rates and SME knowledge of the cost of materials and equipment. These estimates do not include transport or accommodation costs or overheads.
Approach to costing the sub-program
The bottom-up sub-program cost estimate is based on the expected number of installations multiplied by the bottom-up estimate unit cost, with an uplift factor of 9.98% applied to account for mobilisation costs and contractors uplift of 1.1%.
Operational Technology program estimates
See Table 39 for the program estimates (in direct cost) for the above program(s).
Table 39: Operational Technology
Ellipse estimate code
Investment description Direct unit cost ($ real 2012-13)
1 MIP1005 Reconductor HV feeder 66,377
2 MIP1154 Install set of 3 expulsion fuses (11/22kV) – line or distribution transformer 1,939
3 MIP1155 Install set of 2 expulsion fuses (33kV) – single phase line or SWER isolator
1,719
4 MIP1153 Install set of 3 outdoor HV powder fuses in sub for transformer protection 65,094
5 MIP1145 Install Neutral CT (22KV or 11Kv) - D-Other Regulated System Capex 49302
6 MIP1019 Replace Recloser - Protn Review 50,511
7 MIP1215 Half Substation Protection Replacement 382,888
8 MIP1216 Replace 1 Protection Scheme Replace 79,460
9 MIP1217 HV 11kv 22kv Switchboard Protection Replace 414,742
10 MIP1245 Adding Comms to existing regulator - Open Delta 9,459
11 MIP1246 Adding Comms to existing regulator - Closed Delta 10,570
12 MIP1247 Adding Comms to existing regulator - Open Delta 8,348
13 MIP1248 Adding comms and PSU to existing regulator- Open Delta 11,680
14 MIP1249 Adding comms and PSU to existing regulator- Closed Delta 12,791
15 MIP1250 Adding comms and PSU to existing regulator- SWER 10,570
16 MIP1251 Adding comms, PSU and Interface kit to existing regulator - Open Delta 22,585
17 MIP1252 Adding comms, PSU and Interface kit to existing regulator - Open Delta 27,923
18 MIP1253 Adding comms, PSU and Interface kit to existing regulator - Open Delta 17,247
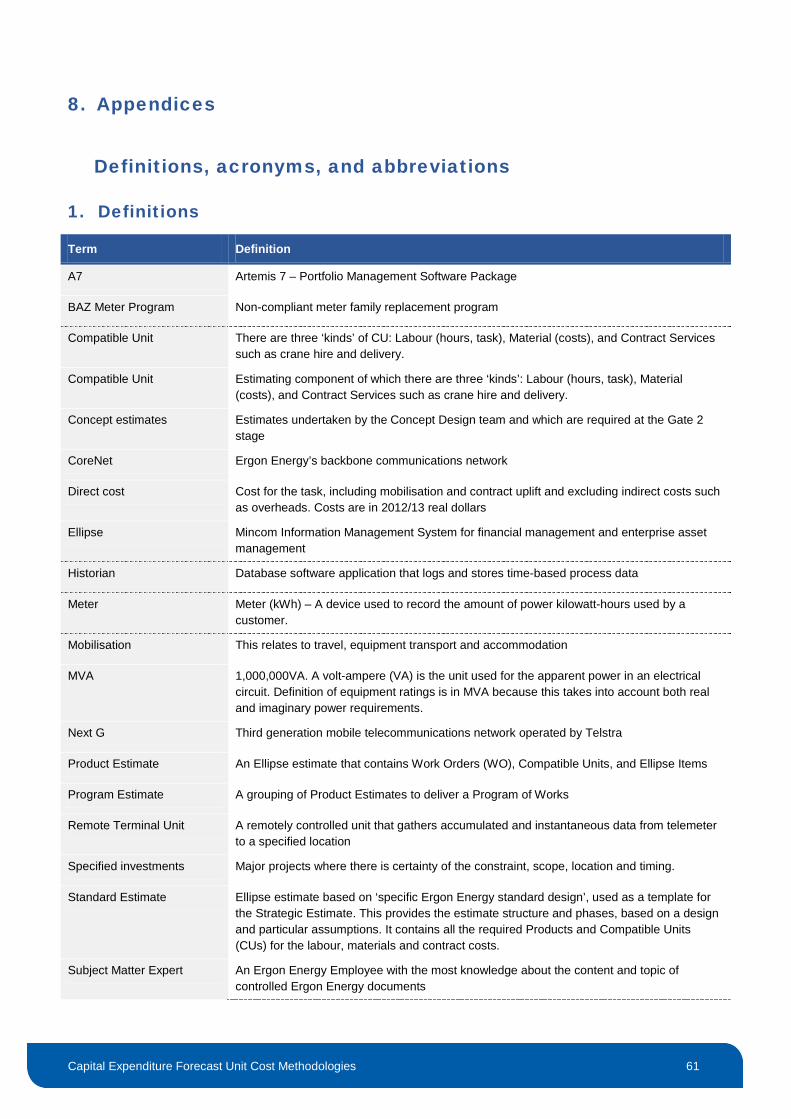
Capital Expenditure Forecast Unit Cost Methodologies 61
8. Appendices
Definitions, acronyms, and abbreviations
1. Definitions
Term Definition
A7 Artemis 7 – Portfolio Management Software Package
BAZ Meter Program Non-compliant meter family replacement program
Compatible Unit There are three ‘kinds’ of CU: Labour (hours, task), Material (costs), and Contract Services such as crane hire and delivery.
Compatible Unit Estimating component of which there are three ‘kinds’: Labour (hours, task), Material (costs), and Contract Services such as crane hire and delivery.
Concept estimates Estimates undertaken by the Concept Design team and which are required at the Gate 2 stage
CoreNet Ergon Energy’s backbone communications network
Direct cost Cost for the task, including mobilisation and contract uplift and excluding indirect costs such as overheads. Costs are in 2012/13 real dollars
Ellipse Mincom Information Management System for financial management and enterprise asset management
Historian Database software application that logs and stores time-based process data
Meter Meter (kWh) – A device used to record the amount of power kilowatt-hours used by a customer.
Mobilisation This relates to travel, equipment transport and accommodation
MVA 1,000,000VA. A volt-ampere (VA) is the unit used for the apparent power in an electrical circuit. Definition of equipment ratings is in MVA because this takes into account both real and imaginary power requirements.
Next G Third generation mobile telecommunications network operated by Telstra
Product Estimate An Ellipse estimate that contains Work Orders (WO), Compatible Units, and Ellipse Items
Program Estimate A grouping of Product Estimates to deliver a Program of Works
Remote Terminal Unit A remotely controlled unit that gathers accumulated and instantaneous data from telemeter to a specified location
Specified investments Major projects where there is certainty of the constraint, scope, location and timing.
Standard Estimate Ellipse estimate based on ‘specific Ergon Energy standard design’, used as a template for the Strategic Estimate. This provides the estimate structure and phases, based on a design and particular assumptions. It contains all the required Products and Compatible Units (CUs) for the labour, materials and contract costs.
Subject Matter Expert An Ergon Energy Employee with the most knowledge about the content and topic of controlled Ergon Energy documents

Capital Expenditure Forecast Unit Cost Methodologies 62
Term Definition
Sub transmission system Networks supplied at 33 or 66kV, which are inter-connectors or/and line supplying Zone-Substations.
Unit Cost The cost to undertake a single unit of work
Un-modelled Forecasts Works that are by nature not conducive to modelling, and based on historical expenditure
Uplift factors Percentage cost uplifts applied to estimates to account for mobilisation and external contract costs.
Supervisory Control and Data Acquisition (SCADA)
A system of remote control and telemetry used to monitor and control the transmission system.
SINCAL Siemens Network Calculation
2. Acronyms and abbreviations
The following abbreviations and acronyms appear in this summary document.
Abbreviation or acronym Definition
AC Alternating Current
ACS Alternative Control Service
ADAS Alternative Data Acquisition Service
AFLC Audio Frequency Load Control
CICW Customer Initiated Capital Works
CT Current Transformer
CU Compatible Unit
DC Direct Current
DMS Distribution Management System
DNAP Distribution Augmentation Plan
DSA Distribution System Automation
EDO Expulsion Drop Out fuse
HHU Hand Held Units
HV High Voltage – 132/110/33/11kV
IRC Investment Review Committee
Km Kilometre
kV A Kilo-volt is 1000 Volts
kVAR 1,000 volt amp reactive
LV Low voltage. Voltage greater than 50V AC RMS or 120V ripple-free DC but not more than 1000V AC RMS or 1500V ripple-free DC
LVR Low Voltage Relay
MIFIS Major Items Failed in Service
MVA 1,000,000VA
NIRC Network Investment Review Committee

Capital Expenditure Forecast Unit Cost Methodologies 63
Abbreviation or acronym Definition
OT Operational Technology
RIN Regulatory Information Notice
RMU Ring Main Unit
SCADA Supervisory Control and Data Acquisition (of the Power System)
SCS Standard Control Services
SME Subject Matter Expert
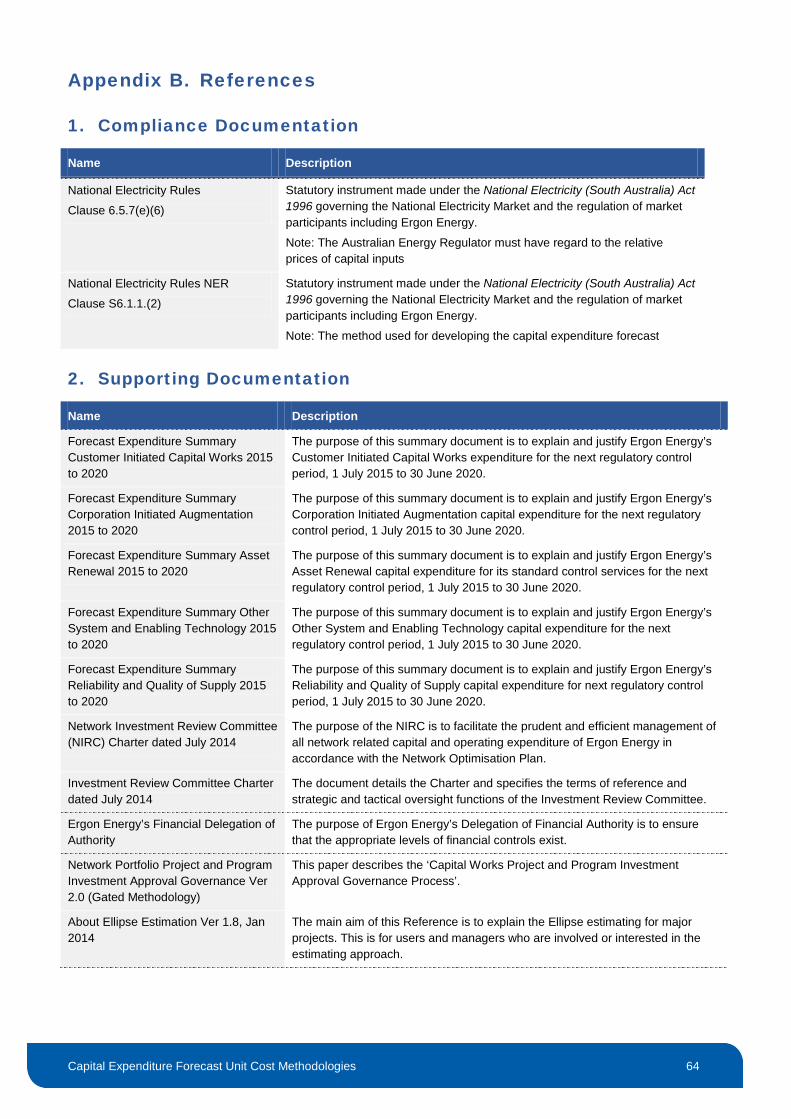
Capital Expenditure Forecast Unit Cost Methodologies 64
Appendix B. References
1. Compliance Documentation
Name Description
National Electricity Rules
Clause 6.5.7(e)(6)
Statutory instrument made under the National Electricity (South Australia) Act 1996 governing the National Electricity Market and the regulation of market participants including Ergon Energy.
Note: The Australian Energy Regulator must have regard to the relative prices of capital inputs
National Electricity Rules NER
Clause S6.1.1.(2)
Statutory instrument made under the National Electricity (South Australia) Act 1996 governing the National Electricity Market and the regulation of market participants including Ergon Energy.
Note: The method used for developing the capital expenditure forecast
2. Supporting Documentation
Name Description
Forecast Expenditure Summary Customer Initiated Capital Works 2015 to 2020
The purpose of this summary document is to explain and justify Ergon Energy’s Customer Initiated Capital Works expenditure for the next regulatory control period, 1 July 2015 to 30 June 2020.
Forecast Expenditure Summary Corporation Initiated Augmentation 2015 to 2020
The purpose of this summary document is to explain and justify Ergon Energy’s Corporation Initiated Augmentation capital expenditure for the next regulatory control period, 1 July 2015 to 30 June 2020.
Forecast Expenditure Summary Asset Renewal 2015 to 2020
The purpose of this summary document is to explain and justify Ergon Energy’s Asset Renewal capital expenditure for its standard control services for the next regulatory control period, 1 July 2015 to 30 June 2020.
Forecast Expenditure Summary Other System and Enabling Technology 2015 to 2020
The purpose of this summary document is to explain and justify Ergon Energy’s Other System and Enabling Technology capital expenditure for the next regulatory control period, 1 July 2015 to 30 June 2020.
Forecast Expenditure Summary Reliability and Quality of Supply 2015 to 2020
The purpose of this summary document is to explain and justify Ergon Energy’s Reliability and Quality of Supply capital expenditure for next regulatory control period, 1 July 2015 to 30 June 2020.
Network Investment Review Committee (NIRC) Charter dated July 2014
The purpose of the NIRC is to facilitate the prudent and efficient management of all network related capital and operating expenditure of Ergon Energy in accordance with the Network Optimisation Plan.
Investment Review Committee Charter dated July 2014
The document details the Charter and specifies the terms of reference and strategic and tactical oversight functions of the Investment Review Committee.
Ergon Energy’s Financial Delegation of Authority
The purpose of Ergon Energy’s Delegation of Financial Authority is to ensure that the appropriate levels of financial controls exist.
Network Portfolio Project and Program Investment Approval Governance Ver 2.0 (Gated Methodology)
This paper describes the ‘Capital Works Project and Program Investment Approval Governance Process’.
About Ellipse Estimation Ver 1.8, Jan 2014
The main aim of this Reference is to explain the Ellipse estimating for major projects. This is for users and managers who are involved or interested in the estimating approach.

Capital Expenditure Forecast Unit Cost Methodologies 65
Name Description
Distribution Network Impacts of Photovoltaic Connections to 2020
The aim of this document is to describe the work performed to assess the network impacts of inverter energy systems and to determine the required capital and operational expenditure to manage their integration on the Ergon Energy network.
Line Asset Defect Management Methodology
The purpose of this document is to describe Ergon Energy’s practices, plans and forecasts for the management of defects on the overhead and underground distribution and sub transmission network.
3. Models
Name Description
Network Capital Expenditure Forecast Model
The purpose of the Excel based spreadsheet is to provide a transparent view of the methodology taken in the development of its direct cost Standard Control Services (SCS) and Alternative Control Services (ACS) network capital expenditure forecasts for its next regulatory control period, 1 July 2015 to 30 June 2020.