005 chapter-3 nature n extent of unemp in indian...
TRANSCRIPT

Chapter-3
NATURE AND EXTENT OF
UNEMPLOYMENT IN INDIAN ECONOMY
3.1 Trends of Unemployment in India
The size of employment or unemployment in any country depends to a
great extent on the level of development. Therefore, when a country makes
progress and its production expands, the employment opportunities grow. In
India, during the past three decades or so production has expanded in all the
sectors of the economy. In response to these developments the absolute level
of employment has also grown. However, during the planning period,
unemployment in absolute terms has increased. This has happened because
during the first three decades of economic planning trend rate of growth was
considerably lower than the targeted rate. Therefore, jobs in adequate number
were not created.
Further, economic growth by itself does not solve the problem of
unemployment. Prabhat Patnaik has succinctly remarked, "A higher
arithmetical figure of growth rate is neither a necessary nor a sufficient
condition for alleviation of unemployment."1 In fact, there exists a real
conflict between the objectives of economic growth and employment in the
early phase of economic development. The possibility of an increase in
unemployment is not to be completely ruled out in a rapidly growing
economy. Examining this issue in the existing Indian context, Prabhat Patnaik
has very correctly argued that, "While growth per se means nothing for
1 Prabhat Patnaik, On Changing Course in India : An Agenda for 2004, New Delhi, Social Scientist - Sahmat, 2004.
- 70 -
unemployment, this growth fetishism can be exploited by finance capital to
wrest concessions to the detriment of employment objective ... "
Unemployment in India is characterised by chronic (disguised)
unemployment. Government schemes that target eradication of both poverty
and unemployment (which in recent decades has sent millions of poor and
unskilled people into urban areas in search of livelihoods) attempt to solve the
problem, by providing financial assistance for setting up businesses, skill
honing, setting up public sector enterprises, reservations in governments, etc.
The decline in organised employment due to the decreased role of the public
sector after liberalisation has further underlined the need for focusing on better
education and has also put political pressure on further reforms. India's labour
regulations are heavy even by developing country standards and analysts have
urged the government to abolish or modify them in order to make the
environment more conducive for employment generation.
The 11th five-year plan has also identified the need for a congenial
environment to be created for employment generation, by reducing the number
of permissions and other bureaucratic clearances required. Further, inequalities
and inadequacies in the education system have been identified as an obstacle
preventing the benefits of increased employment opportunities from reaching
all sectors of society.
B. Hazari and J. Krishnamurthy have brought out the conflict between
growth and employment inherent in the Mahalanobis strategy which guided
India's development efforts for about two decades.2 However, until the Five
Year Plan 1978-83 was formulated, this conflict was not recognised by the
government. The assumption of the Plans was that growth would automatically
solve the unemployment problem. However, this was not to be. Since the
2 B. Hazari and J. Krishnamurthy, Employment Implications of India's Industrialisation: Analysis on Input-Output Framework, Review of Economic and Statistics, Vol. 52, 1970.
- 71 -
adoption of neo-liberal economic policies in India over the past one and a half
decades, the government's obsession with the high rate of economic growth
has made it completely oblivious to possible conflict between economic
growth and employment. Hence, in recent years growth in India has been
mostly "job less" and sometimes even "job loss". This is substantiated by the
fact that during the 1990s and early years of the current decade, unemployment
has increased.
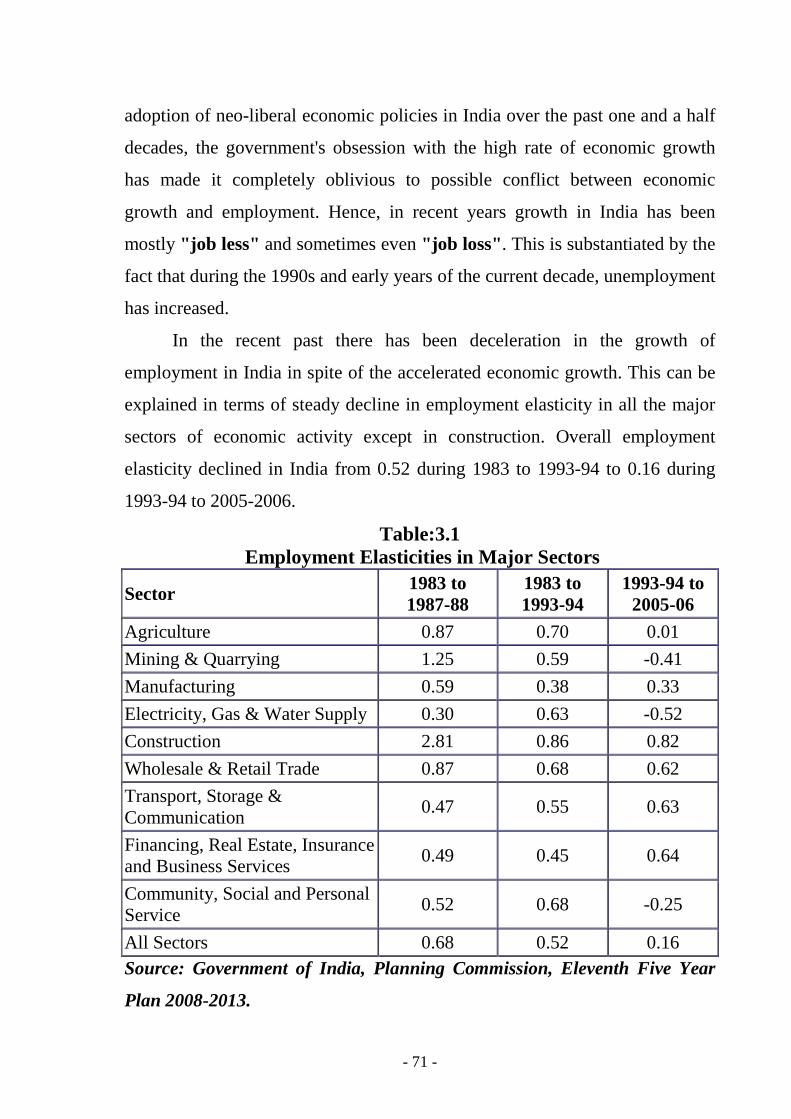
In the recent past there has been deceleration in the growth of
employment in India in spite of the accelerated economic growth. This can be
explained in terms of steady decline in employment elasticity in all the major
sectors of economic activity except in construction. Overall employment
elasticity declined in India from 0.52 during 1983 to 1993-94 to 0.16 during
1993-94 to 2005-2006.
Table:3.1 Employment Elasticities in Major Sectors
Sector 1983 to 1987-88
1983 to 1993-94
1993-94 to 2005-06
Agriculture 0.87 0.70 0.01
Mining & Quarrying 1.25 0.59 -0.41
Manufacturing 0.59 0.38 0.33
Electricity, Gas & Water Supply 0.30 0.63 -0.52
Construction 2.81 0.86 0.82
Wholesale & Retail Trade 0.87 0.68 0.62
Transport, Storage & Communication
0.47 0.55 0.63
Financing, Real Estate, Insurance and Business Services
0.49 0.45 0.64
Community, Social and Personal Service
0.52 0.68 -0.25
All Sectors 0.68 0.52 0.16 Source: Government of India, Planning Commission, Eleventh Five Year
Plan 2008-2013.
- 72 -
As would be clear from Table above, the decline was quite fast in
agriculture as it declined from 0.70 during 1983 to 1993-94 to 0.01 during
1993-94 to 2005-2006. According to T.S. Papola, the decline in employment
elasticity in the agriculture is found to be due, primarily, to the sharply
declining and even negative elasticities in a few regions - Punjab, Haryana and
Uttar Pradesh - where the green revolution has resulted in significant yield and
output growth.
C.P. Chandrasekhar has also argued that economic growth in India in
recent years has not led to much employment generation. He states, "India's
trajectory of growth is not matched by employment generation. This will lead
to social unrest unless the government rethinks its economic priorities.
For three years running, the rate of growth of the Indian economy has
been extraordinary. The growth rate of the gross domestic product (GDP) is
estimated at between 7.5 and 8.5% in the years 2003-04, 2004-05 and 2005-06.
While these figures conceal sectoral differences, such as extremely poor
performance of agriculture and the disproportionately high rate of growth of
services, they are indeed remarkable. But new evidence suggests that this may
not help resolve India's principal economic problem: its large and growing
reserve of unemployment.
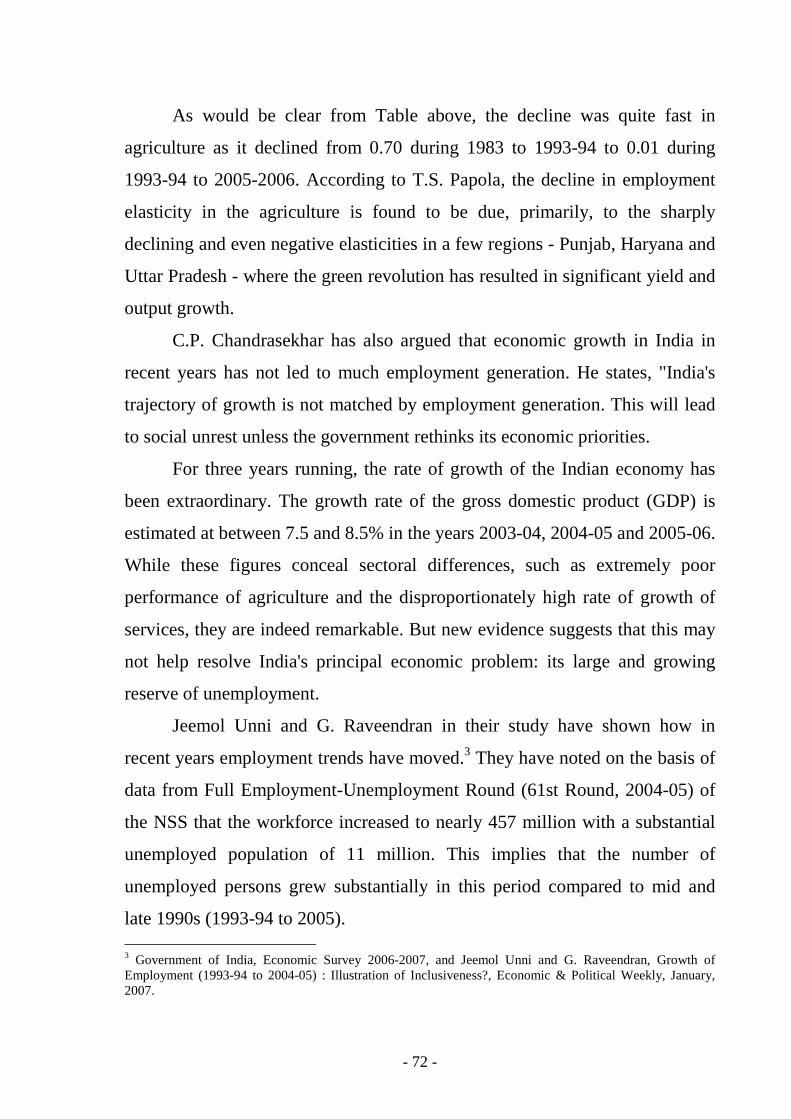
Jeemol Unni and G. Raveendran in their study have shown how in
recent years employment trends have moved.3 They have noted on the basis of
data from Full Employment-Unemployment Round (61st Round, 2004-05) of
the NSS that the workforce increased to nearly 457 million with a substantial
unemployed population of 11 million. This implies that the number of
unemployed persons grew substantially in this period compared to mid and
late 1990s (1993-94 to 2005). 3 Government of India, Economic Survey 2006-2007, and Jeemol Unni and G. Raveendran, Growth of Employment (1993-94 to 2004-05) : Illustration of Inclusiveness?, Economic & Political Weekly, January, 2007.
- 73 -
Growth Rates of Employment (% change per annum)
Period Rural Urban Combined
1983 to 1993-94 1.72 3.10 2.01
1993-94 to 2004-05 0.47 2.70 0.98
Source: Government of India, Economic Survey 2006-2007
Their study also reveals sharp decrease in the rate of employment
generation during the mid and late 1990s in both rural and urban areas. The
overall growth in employment declined from 2.01 per cent per annum during
1983 to 1993-94 to 0.98 per cent per annum during the period 1993-94 to
2004-05. As is clear from data contained in Table above, growth rate of
employment declined steeply in the rural sector during the period 1993-94 to
2004-05.
3.2 Nature and Estimates of Unemployment
Unemployment in underdeveloped countries is both open and disguised.
Like all other underdeveloped countries, India presently suffers mainly from
structural unemployment which exists in open and disguised forms.
Most of the unemployment in India is definitely structural. During the
1961-2001 period, population in this country had grown at an alarming rate of
around 2.15 per cent per annum and with it the number of people coming to
the labour market in search of jobs had also increased rapidly, whereas
employment opportunities did not increase most of the time correspondingly
due to slow economic growth. Hence there has been an increase in the volume
of unemployment from one plan period to another. This unemployment, on
account of its very nature, can be eliminated only by introducing certain
radical reforms in the structure of the economy. Apart from structural
unemployment there is Keynesian involuntary unemployment which can be
- 74 -
eliminated by increasing effective demand, as is done in developed countries.
Though presently it would be wrong to ignore the Keynesian involuntary
unemployment, yet the structural unemployment remains a greater cause of
anxiety.
Concepts of Unemployment
Keeping in view the recommendations of the Committee of Experts on
Unemployment, the National Sample Survey Organisation (NSSO) has
developed and standardised concepts and definitions of labour force,
employment and unemployment suitable to Indian conditions. These concepts
have not only been adopted by the NSSO for conducting surveys on
employment since 1972-73, but have also been accepted by the Planning
Commission for analysing the dimension of the unemployment problem. The
three concepts of unemployment developed by the NSSO are: (i) Usual Status
Unemployment, (ii) Current Weekly Status Unemployment and (iii) Current
Daily Status Unemployment.
(i) The Usual Status concept is meant to determine the Usual Activity
Status - employed, or unemployed or outside the labour force of those
covered by the survey. The activity status is determined with reference
to a longer period, say a year preceding to the time of survey. The
persons covered by the survey may be classified into those working
and/or available for work in their principal activity sector, and those
working and/or available for work in a subsidiary sector, that is, a sector
other than their principal activity sector. Hence, within the Usual Status
concept, the estimates are now derived on the Usual Principal Status as
well as Usual Principal and Subsidiary Status basis. The Usual Status
unemployment rate is a person rate and indicates chronic unemployment
because all those who are found "usually" unemployed in the reference

- 75 -
year are counted as unemployed.
(ii) The Current Weekly Status concept determines the activity status of a
person with reference to a period of preceding seven days. If in this
period a person seeking employment fails to get work for even one hour
on any day, he/she is deemed to be unemployed. A person having
worked for an hour or more on any one or more days during tile
reference period gets the employed status. The Current Weekly Status
unemployment rate, like the Usual Status unemployment rate, is also a
person rate.
(iii) The Current Daily Status concept considers the activity status of a
person for each day of the preceding seven days. A person who works
for one hour but less than four hours is considered having worked for
half a day. If he works for four hours or more during a day, he/she is
considered as employed for the whole day. The Current Daily Status
unemployment rate is a time rate.
Out of these concepts of unemployment, the Current Daily Status
concept provides the most appropriate measure of unemployment. Raj Krishna
states, "The daily status flow rate is evidently the most inclusive, covering
open as well as partial unemployment. It is therefore, the rate which is most
relevant for policy-making."4 In India, the problem of chronic unemployment
is far less serious as compared with the enormous problem of the
discontinuous underemployment of a section of the labour force whose
composition keeps on changing over time. This factor has important policy
implication and has thus to be kept in mind while employment programmes are
chalked out.
4 Raj Krishna, The Growth of Aggregate Unemployment in India - Trends, Sources and Macroeconomic Policy Options, World Bank Staff Working Papers, Number 638, Washington DC.

- 76 -
Estimates of Unemployment (1972-73 to 1993-94)
The unemployment rates by the three alternative concepts of the Usual
Status, the Current Weekly Status and the Current Daily (National Sample
Survey Organisation) surveys for the years 1972-73, 1977-78, 1983, 1987-88
and 1993-94.
The rates of unemployment do not indicate any clear trends over the 21
year period, that is, from 1972-73 to 1993-94. However, if we compare
unemployment position in 1993-94 with that in 1983 and 1972-73, we observe
that there has been marginal decline in unemployment rates.
For the purpose of realizing the goal of "employment for all" over a
period, an assessment of the backlog of unemployment in the base year and
likely additions to the labour force during the reference period has to be made.
Till recently the latest survey based estimates of unemployment were available
for 1987-88 only. Therefore, the Planning Commission had independently
estimated labour force and employment on April 1, 1992 to yield the
magnitude of unemployment. Total employment in terms of the Current
Weekly Status was estimated to be 301.7 million as against the labour force
estimate of 319 million. Thus backlog of unemployed in terms of the Current
Weekly Status on April 1, 1992 was 17 million. According to the N.S.S.O,
about 2 per cent of those recorded as employed by the Current Weekly Status
had work for half or less than half the time. They being severely
underemployed were included in the estimates of backlog for employment
planning. Thus, according to the Planning Commission, those of the people
who looked for full time new employment opportunities were around 23
million in April 1992.
The Ninth Plan document has also provided estimates of incidence of
unemployment and underemployment in 1993-94. These are based on data
available from 50th Round of NSS on Employment and Unemployment.
- 77 -
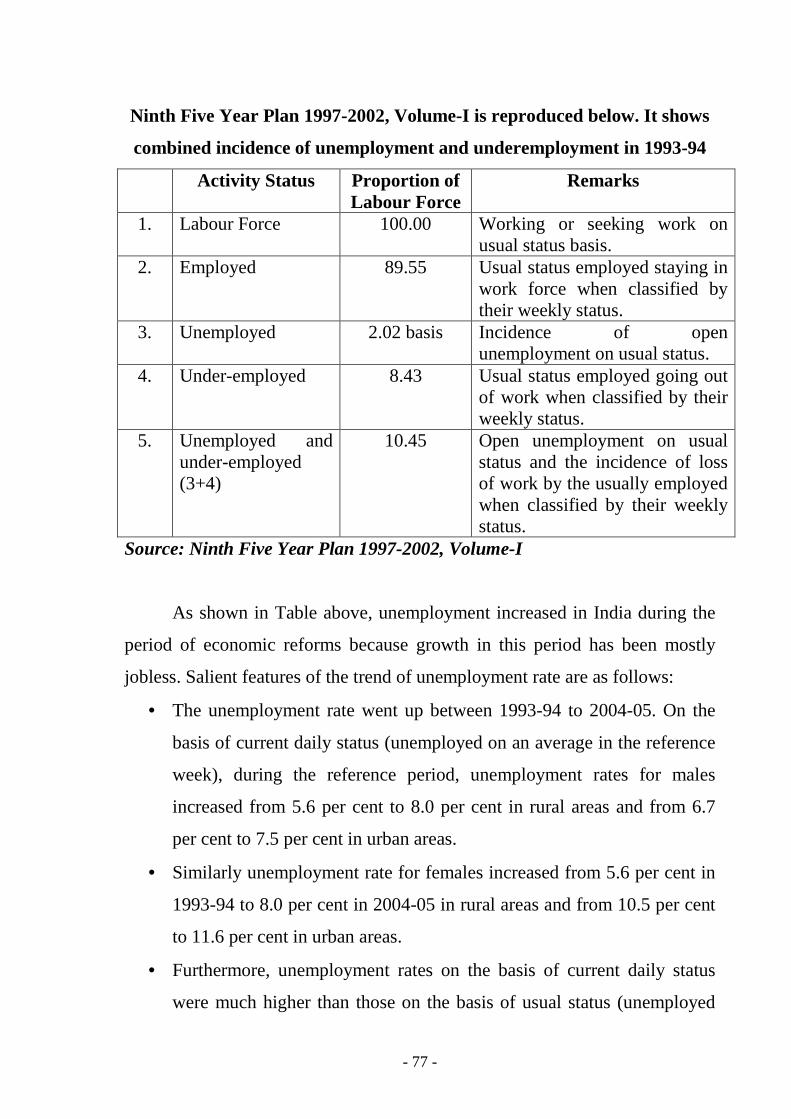
Ninth Five Year Plan 1997-2002, Volume-I is reproduced below. It shows
combined incidence of unemployment and underemployment in 1993-94
Activity Status Proportion of Labour Force
Remarks
1. Labour Force 100.00 Working or seeking work on usual status basis.
2. Employed 89.55 Usual status employed staying in work force when classified by their weekly status.
3. Unemployed 2.02 basis Incidence of open unemployment on usual status.
4. Under-employed 8.43 Usual status employed going out of work when classified by their weekly status.
5. Unemployed and under-employed (3+4)
10.45 Open unemployment on usual status and the incidence of loss of work by the usually employed when classified by their weekly status.
Source: Ninth Five Year Plan 1997-2002, Volume-I
As shown in Table above, unemployment increased in India during the
period of economic reforms because growth in this period has been mostly
jobless. Salient features of the trend of unemployment rate are as follows:
• The unemployment rate went up between 1993-94 to 2004-05. On the
basis of current daily status (unemployed on an average in the reference
week), during the reference period, unemployment rates for males
increased from 5.6 per cent to 8.0 per cent in rural areas and from 6.7
per cent to 7.5 per cent in urban areas.
• Similarly unemployment rate for females increased from 5.6 per cent in
1993-94 to 8.0 per cent in 2004-05 in rural areas and from 10.5 per cent
to 11.6 per cent in urban areas.
• Furthermore, unemployment rates on the basis of current daily status
were much higher than those on the basis of usual status (unemployed

- 78 -
on an average in the reference year) implying a high degree of
intermittent unemployment. This could be mainly because of the
absence of regular employment for many reasons.
• Urban unemployment rates (current daily status) were higher than rural
unemployment rates for both males and females in 1993-94. However,
in 2004-05, rural unemployment rates for males was higher than that of
urban males.
• Unemployment rates varied sharply across States. States where wages
are higher than in neighbouring ones because of strong bargains or
social security provisions, such as high minimum wage, had high
incidence of unemployment, in general.
For the first time ever – the Labour Bureau of the Government of India
has conducted a survey on employment – unemployment, and has come up
with an unemployment rate based on that. National Sample Survey
Organization (NSSO) also calculates unemployment rates, but these surveys
are done with a gap of 5 years, so there is a dire need to have unemployment
numbers in between.
The Labour Bureau has started these employment–unemployment
surveys which will now facilitate in availability of more frequent numbers on a
measure as important as employment. The report itself is quite detailed, and
this is a great first step. The report contains quality of the data that is only
going to improve going forward.
40 Million Unemployed with an Unemployment Rate of 9.4%
The survey was conducted in 28 States/UTs spread across the country in
which about 99 per cent of the country’s population resides. It estimates that
the population of the country is 1182 million with 63.5% in the working age of
15 – 59 years, however, not everyone who is in the working age is interested in
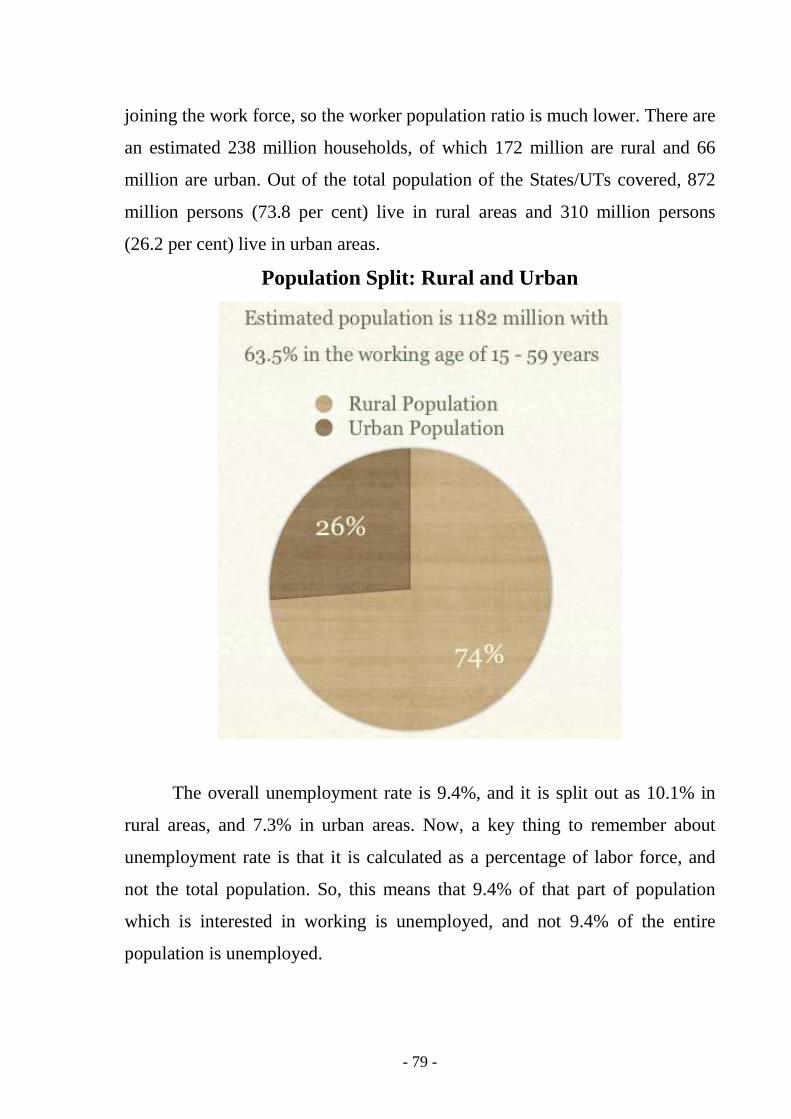
- 79 -
joining the work force, so the worker population ratio is much lower. There are
an estimated 238 million households, of which 172 million are rural and 66
million are urban. Out of the total population of the States/UTs covered, 872
million persons (73.8 per cent) live in rural areas and 310 million persons
(26.2 per cent) live in urban areas.
Population Split: Rural and Urban
The overall unemployment rate is 9.4%, and it is split out as 10.1% in
rural areas, and 7.3% in urban areas. Now, a key thing to remember about
unemployment rate is that it is calculated as a percentage of labor force, and
not the total population. So, this means that 9.4% of that part of population
which is interested in working is unemployed, and not 9.4% of the entire
population is unemployed.

- 80 -
In the Indian context, 359 persons per 1,000 are either working or
interested to work, and this is called the Labor Force Participation Rate. So,
out of an estimated population of 1,182 million, 424 million persons are either
employed or are interested in working. The unemployment rate of 9.4% means
that out of those 359 persons per thousand, or 424 million people – there are
9.4% or about 40 million who were unemployed. Here are the numbers in
millions.
India Unemployment Numbers
Source: Survey Report of Labour Bureau of Government of India, Ministry
of Labour and Employment, 2010.
For males, the unemployment rate is 8%, whereas for females the
unemployment rate is 14.6%. The rural unemployment rate is 10.1% and the
urban unemployment rate stands at 7.3%. One thing to be noted about this
unemployment rate is that the report states that compared to the NSSO survey
- 81 -
the unemployment rate is quite high probably due to under-estimation in the
agriculture sector employment.
Comparison of Labour Bureau’s present survey results for the year
2009-10 with NSSO’s Employment-Unemployment survey results for 2007-
08, reveals that the unemployment rate derived on the basis of the Bureau’s
survey is quite high. Higher unemployment rate may be parting attributed to as
much as 10 per cent difference in the contribution of agriculture sector to total
employment estimated in the present survey vis-à-vis the NSSO 2007-08
survey estimates. While the shift of workforce from agriculture to other sectors
is a positive trend for a fast growing economy, the steep reduction in lower
share of agriculture employment based on the Bureau’s survey could be
attributed to lack of adequate probing skills of the Contract Investigators.
There could be some underestimation in the agriculture sector
employment due to lesser-probing by the contract investigators especially in
case of women workers who tend to be employed more casually in the
agriculture and allied sectors such as forestry, livestock and fisheries. Getting
unemployment numbers is really important to assess how various employment
schemes work, impact of global recessions, and when we allow companies like
Walmart to operate in India, we will need data to see if they are creating rural
jobs or rendering people in urban retail unemployed. Surveys such as these
could then become key to get the right information on policy formulation.
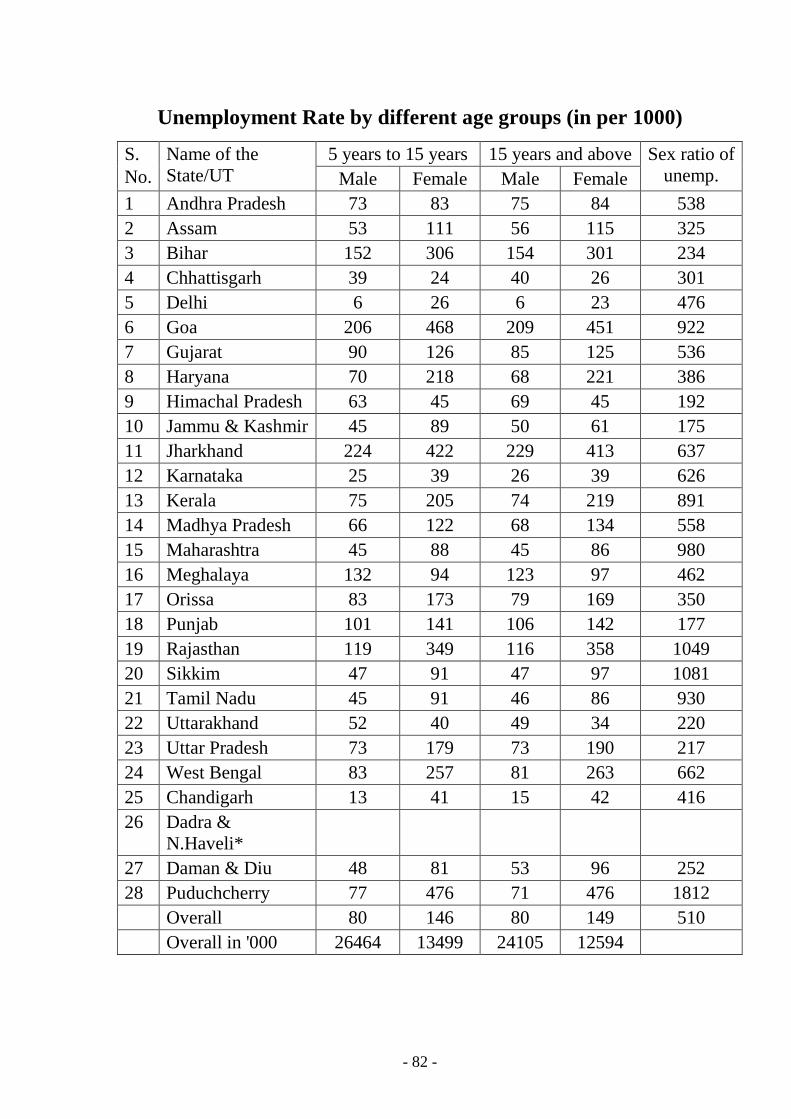
The number that really surprises, is the state with the highest
unemployment rate. According to this survey – Goa is the state with the
highest unemployment rate. Here is the table that shows the unemployment
rate for different states:
- 82 -
Unemployment Rate by different age groups (in per 1000)
5 years to 15 years 15 years and above S. No.
Name of the State/UT Male Female Male Female
Sex ratio of unemp.
1 Andhra Pradesh 73 83 75 84 538 2 Assam 53 111 56 115 325 3 Bihar 152 306 154 301 234 4 Chhattisgarh 39 24 40 26 301 5 Delhi 6 26 6 23 476 6 Goa 206 468 209 451 922 7 Gujarat 90 126 85 125 536 8 Haryana 70 218 68 221 386 9 Himachal Pradesh 63 45 69 45 192 10 Jammu & Kashmir 45 89 50 61 175 11 Jharkhand 224 422 229 413 637 12 Karnataka 25 39 26 39 626 13 Kerala 75 205 74 219 891 14 Madhya Pradesh 66 122 68 134 558 15 Maharashtra 45 88 45 86 980 16 Meghalaya 132 94 123 97 462 17 Orissa 83 173 79 169 350 18 Punjab 101 141 106 142 177 19 Rajasthan 119 349 116 358 1049 20 Sikkim 47 91 47 97 1081 21 Tamil Nadu 45 91 46 86 930 22 Uttarakhand 52 40 49 34 220 23 Uttar Pradesh 73 179 73 190 217 24 West Bengal 83 257 81 263 662 25 Chandigarh 13 41 15 42 416 26 Dadra &
N.Haveli*
27 Daman & Diu 48 81 53 96 252 28 Puduchcherry 77 476 71 476 1812 Overall 80 146 80 149 510 Overall in '000 26464 13499 24105 12594
- 83 -
3.3 Unemployment in Urban Areas
Most of the unemployment in urban areas is open and undisguised.
Unemployment of this kind is not only painful at a personal level, but is also a
source of social tensions, which often threatens the whole fabric of society.
Despite this problem of unemployment and its attendant dangers, the
government has not given adequate attention to it. Even the estimates of urban
unemployment have not been prepared on a regular basis. However, the
National Sample Survey Organisation (NSSO) has made estimates of un-em-
ployment in different years. These estimates are surely not comparable.
However, they suggest that unemployment in the urban sector has fluctuated
around 10 per cent of the labour force in recent decades. This, at least, shows
that there were no dramatic increases in perceived employment opportunities.
In urban areas, the rate of employment growth declined very sharply during
the 1990s.
Two relatively important forms of urban unemployment are (i) industrial
unemployment, and (ii) educated unemployment.
Industrial Unemployment
The exact size of the industrial unemployment in India is not known
because the necessary data for its estimation are not available. During the
planning period industrial sector has expanded and employment in it has
steadily increased. As against 34.03 million workers employed in
manufacturing sector in 1983, 42.5 million workers were employed in 1993-94
and 48.0 million workers in 1999-2000. This is surely a healthy development
and reflects the progressive growth of capitalism in India. A disquieting
phenomenon, however, is that over the past three decades unemployment in
the industrial sector has increased. This is the result of extremely low growth
rate of employment in the organised manufacturing industry. It is observed tit

- 84 -
at employment elasticity had significantly declined in manufacturing during
the 1980s and 1990s. It was 0.59 in the period 1983 to 1987-88, from where it
declined to 0.33 in the period 1993-94 to 1999-2000.
The other factors which have contributed to an increase in industrial
unemployment over the years are many. First, there has been a large
increase of the economically active population in the country, while the'
economy has failed to grow at a pace commensurate with the growth of
labour force. Secondly, population in urban areas has grown faster than in
rural areas, because of the migration on a big scale from villages to cities.
The industrial growth in India since Independence has been very modest.
Moreover, since early 1990s industrial growth has been job less and has
failed to absorb all those who migrated to cities with the hope of getting
some job or the other.
There is widespread disguised unemployment in agriculture. The
decay of cottage and small-scale rural industries in the countryside has
further contributed to the already bad employment situation in the
countryside. These factors are pushing lots of people out of villages; cities
have their own attractions as well. Thus migration from the countryside to
urban centres is a regular process. In normal times some of the migrants
get jobs in industries, some fortunate ones get absorbed in the unorganised
sector and the rest wait for their chance to get employment and thus swell
the number of unemployed.
It is often contended that industrial unemployment has increased in the
country specially because of the slow industrialisation process and
inappropriate technology. Near stagnation in the industrial sector from the
mid-1960s to the early-1980s rendered various remedial measures ineffective.
Concentration of industries in big cities is another major source of the malady.
Industrial concentration attracts labour force to cities in a big way - much more

- 85 -
than what the industries can absorb at any point of time. If the policy of
dispersal of industries is adopted and industries are set up in rural and semi-
urban areas, this problem can be tackled satisfactorily.
Educated Unemployment
Educated unemployment is, by and large, a part of urban
unemployment. It is a very serious and menacing problem, yet the size of
educated unemployment remains largely unmeasured. Not only are there
conceptual difficulties in estimating it, but the kind of statistical information
that is required for its estimation is also not available. Hence the quantitative
base for analysing the problem of educated unemployment is weak.
Nonetheless, on the basis of fragmentary information that is available, it is not
difficult to understand the basic issues involved in the problem.
The Planning Commission's estimates suggest that at the beginning of
1980, approximately 34.72 lakh educated persons were unemployed. Using the
same approach as in the Sixth Plan, unemployment among the educated people
works out to 47 lakh in 1985 and 68 lakh in 1992. No estimates of educated
unemployment are available for a recent year. However, there are no reasons
to believe that educated unemployment is now less than that was there on the
eve of the Eighth Plan.
National Sample Surveys show that over the period 1983 to 1993-94,
the proportion of those educated to a level of higher secondary school or
higher among the unemployed persons rose from 47 per cent to 64 per cent.
This clearly suggests not only non-utilisation of scarce resources put in for
educating the people but also shows "a mismatch between the kind of job
opportunities that are needed and that are available in the job market."
There are many causes of educated unemployment. The defective
educational system, with its theoretical bias, lack of aptitude and technical

- 86 -
qualifications for various types of work among job-seekers and
maladjustments between demand and supply of educated workers are some
well-known causes of educated unemployment. But the major cause of
unemployment in this sector is the same which explains the overall
unemployment in the country. Over the years, economic growth in India has
been very slow. It was inadequate in the past to absorb all the educated
persons. In fact, supply of educated workers has consistently moved ahead of
demand so that educated unemployment has not diminished. This happened
largely because of the wide gap between the private cost of education and the
expected return from it. In India, private cost of higher education is much less
than the expected gains from it.
Thus an unnecessarily large number of people pursue higher education.
They have one dimensional approach, that is, they simply wish to improve
their employment prospects, but in doing so they create conditions which
render lesser educated persons as unemployed. According to Blaug, Layard
and Woodhall, "the educated unemployment, in itself, is no proof of over
investment in education. Since it is caused by market imperfections, the
appropriate remedy might, therefore, involve an active manpower policy
designed to improve the functioning of labour markets rather than a
contraction of upper secondary and higher education."5
3.4 Unemployment in Rural Areas
According to the NSS, Current Daily Status rural unemployment rate for
male workers was 4.58 per cent in 1987-88. Since then unemployment among
rural male workers has increased.
5 M. Blaug, P.R.G. Layard and M. Woodhall, The Causes of Graduates in India, London, 1969.

- 87 -
Unemployment Rates (per 1000) for 1993-94 and 2004-05
Rural Males Rural Females NSSO Round US CWS CDS US CWS CDS
1993-94 (50th Round) 20 30 56 14 30 56 1999-2000 (55th Round) 21 39 72 72 15 37 2004-05 (61st Round) 21 38 80 31 42 87
US = Usual Status; CWS = Current Weekly Status;
CDS = Current Daily Status.
Source: NSSO's 61st Round Survey on Employment and Unemployment
conducted in 2004-05.
The Current Daily Status unemployment rate for the rural male workers
was 8.0 per cent ill 2004-05 as against 7.2 per cent in 1999-2000 and 5.6 per
cent in 1993-94. Most of this unemployment is agricultural unemployment
which may be classified into (i) seasonal unemployment, (ii) disguised
unemployment and (iii) chronic and usual status unemployment.
Seasonal Unemployment:
Seasonal unemployment in agriculture is a normal condition in India. In
1998-99, gross irrigated area as a percentage of gross cropped area was only
39.0 per cent. However; two or more crops are prepared on not more than 25
per cent cultivable land. This implies that farmers cultivating approximately 75
per cent of the land remain involuntarily unemployed for 3 to 4 months, unless
they find some temporary employment in this period. Since the percentage of
the lucky ones who manage to get some work in the off-season is quite low,
the incidence of seasonal unemployment in the agricultural sector is obviously
very high.
Agricultural labourers in India rarely have work throughout the year.
According to the Second Agricultural Labour Enquiry Committee, agricultural
labour in this country had 237 days employment in 1956-57. In other words,
- 88 -
on an average their unemployment was approximately for 3 to 4 months. The
Planning Commission in its Mid-Term Appraisal of the Fourth Plan had
pointed out that leaving aside the green revolution belt, in all other areas
seasonal unemployment during the early seventies was at least as much as
during the 1950s, if not more. However, considering the decline in
employment elasticity, measured as the ratio of employment growth to the
growth of value added, in the agricultural sector during the 1980s and 1990s,
there is every reason to believe that the seasonal unemployment should have
increased in recent years. The employment elasticity in agriculture was
estimated to be 0.87 during 1983 to 1987-88. It declined to 0.01 during 1993-
94 to 1999-2000.
Disguised Unemployment:
The Indian agriculture is characterised by the existence of considerable
amount of surplus labour. However, no firm estimates of its size are available.
From the fragmentary information that is presently available it appears that in
the green revolution belt there is no disguised unemployment. For the past
three decades the demand for wage labour has increased in these areas and
agricultural labourers have been brought from other parts of the country to
meet it. In all other regions pressure of growing population has been increasing
on land and when one notices too many people operating tiny agricultural
holdings, one feels inclined to believe that disguised unemployment still exists
in these areas on a considerable scale.
However, it would be wrong to jump to some hasty conclusion on the
basis of mere impressions. Let us, therefore, turn to the works of those who
have undertaken micro-level studies of surplus labourers, and see if they can
help us in arriving at some conclusion. The most well-known work in this area

- 89 -
is that of Shakuntala Mehra.6 Some other prominent experts who have
attempted to measure surplus labour in agriculture are J.P. Bhattacharjee and
Ashok Rudra. Shakuntala Mehra's study attempts to provide estimates of
disguised unemployment for the country as a whole. Making some highly
questionable assumptions, such as that there is no surplus labour on the largest
farms, she concluded that 17.1 per cent of the work force in agriculture was
surplus during the 1960s. Her study further revealed that the removable surplus
labour was considerably more in certain States than in some other States. J.P.
Bhattacharjee and Ashok Rudra had carried out their studies on parallel lines.
Both of them differ in their approach from Shakuntala Mehra as they do not
purport to extend beyond the sample observations (selected villages in West
Bengal and Bihar) on which the exercises were carried out. Notwithstanding
the differences in their approach, all the studies referred to above convincingly
refute the no-surplus-labour hypothesis.
Usual Status Unemployment:
Usual Status unemployment in rural areas cannot be clearly
distinguished from seasonal and disguised unemployment. It is this reason why
people remaining unemployed for long periods are sometimes counted as
seasonally or disguisedly unemployed. This error crops up particularly if the
survey is carried out in the off-season when most people in' villages do not
have any productive work with them. However, the Usual Status
unemployment in March 1994 has been estimated on the basis of 50th Round
of the NSS. According to -this estimate, the Usual Status rural unemployment
rate in March 1994 for males and females was 1.4 per cent and 0.9 per cent
respectively. Age-wise the Usual Status rural unemployment was the highest
in the age-group 15-29.
6 Shakuntala Mehra, Surplus Labour in Indian Agriculture, Indian Economic Review, April, 1966
- 90 -
3.5 Major Causes of Unemployment
The foregoing analysis of unemployment in India has made it evidently
clear that most of the unemployment in this country is structural. Its main
causes are discussed below:
1. Jobless Growth: Economic growth is usually expected to generate
employment. However, in India most of the time growth has been jobless. For
30 years from 195051 to 1980-81 GDP growth rate was as low as 3.6 per cent
per annum. At this rate of economic growth many jobs could not be created.
GDP growth accelerated to 5.6 per cent per annum in the 1980s and stayed at
this level in the 1990s. At this higher rate of GDP growth one would normally
expect that many new employment opportunities would be forthcoming. But
this was not to be. As stated earlier, during the last two decades there was a
steep decline in employment elasticity in almost all the major sectors. In the
manufacturing sector, over the past two decades employment elasticity
declined from 0.59 to 0.33. Considering all sectors together, employment
elasticity came down from 0.68 in 1983 to 1987-88 to 0.16 over the period
1993-94 to 1999-2000. Obviously under these circumstances unemployment
will not decrease. Since 2000-01 under the influence of neo-liberal approach,
the emphasis has continued to increase on efficiency. Thus more and more
labour displacing production techniques have been favoured and as a result
growth has been jobless.
2. Increase in labour force: Since Independence, death rate has rapidly
declined and the country has entered the second stage of demographic
transition. The rate of population growth rose to 2.2 per cent per annum during
the 1960s, and, as a consequence, rate of increase in labour force also rose to
1.9 per cent per annum. During the period 1983 to 1993-94 both demographic

- 91 -
and social factors have further raised the rate of growth of labour force.
Thereafter there has been a decline in the rate of growth of labour force. In
India, demographic factor has operated in a direct manner. Over the years
mortality rate has declined rapidly without a corresponding fall in birth rate
and the country has thus registered an unprecedented population growth. This
was naturally followed by an equally large expansion in labour force. In Indian
context, social factors affecting the labour supply are as much important as
demographic factors. Since Independence, education among women has
changed their attitude towards employment. Many of them now compete with
men for jobs in the labour market. The economy has, however, failed to
respond to these challenges and the net result is continuous increase in unem-
ployment backlog. In rural areas, whereas on account of growing labour force
unemployment has increased mainly in disguised form, in urban areas it is
open and visible.
3. Inappropriate technology: In India, while capital is a scarce factor,
labour is available in abundant quantity. Under these circumstances, if market
forces operate freely and efficiently, the country would have labour-intensive
techniques of production. However, not only in industries, but also in
agriculture, producers are increasingly substituting capital for labour. In the
western countries, where capital is in abundant supply, use of automatic
machines and other sophisticated equipment is both rational and justified while
in India, on account of abundance of labour, this policy results in large
unemployment.
According to W.A. Lewis, in all those countries where unskilled labour
is available in excess supply, great care is needed in exercising choice in
respect of techniques because monetary wage fails to reflect the real cost of
labour. When labour is in excess supply at prevailing monetary rates of return,
- 92 -
capital would not be considered productive, if it does the same work which
labour also does with an equal amount of efficiency. Lewis asserts that
investment in such a situation in capital equipment may be profitable to
individual capitalists, but it is certainly not beneficial to the society, because it
increases unemployment and not production.7
4. Inappropriate Educational System: The educational system in India is
defective. It is, in fact, the same educational system which Macaulay had
introduced in this country during the colonial period. According to Gunnar
Myrdal, India's educational policy does not aim at development of human
resources. It merely produces clerks and lower cadre executives for the
government and private concerns. With the expansion in the number of
institutions which impart this kind of education, increase in unemployment is
inevitable. It is so because education in arts, commerce and science will not
ensure employment on account of its limited utility for productive purposes.
Myrdal considers all those who receive merely this kind of education not only
as inadequately educated but also wrongly educated.8 Myrdal's criticism
ofIndia's educational system is valid. If the problem of unemployment is to be
solved in this country, radical changes will have to be made in the educational
system. Any educational system which fails to develop human resources
properly will not be able to provide employment to all those who have
received it and, accordingly, would need drastic changes.
5. Neo-liberal economic policy causing demand constraint: With the
introduction of neo-liberal structural reforms in India since the early 1990s,
income inequalities have increased. The estimates of consumption expenditure 7 W.A. Lewis, The Theory of Economic Growth, London 1955. 8 Gunnar Myrdyal, Asian Drama, Vol. II, New York

- 93 -
provided in World Development Report 1998/99 and 2006 show that Gini
index of distribution of consumption rose from 29.7 in 1994 to 33.0 in 1999-
2000. This implies that income inequalities increased during the decade of eco-
nomic reforms. Growing income inequalities generally lead to demand
constraint, recession and unemployment. In India, such a situation was,
however, averted during 1992-97 because GDP growth rate was fairly high at
6.68 per cent per annum. In this period, due to Iiberalisation policy measures,
all the consumer goods of elitist consumption were available and the rich eager
to buy these things raised their consumption expenditure and created
substantial effective demand. But once the rich satisfied their pent up demand
for elitist consumer goods and the government began pursuing the policy of
reducing its expenditure in order to cut down its fiscal deficit, the demand
constraint developed which in turn arrested growth of output cutting down
demand for labour. Hence, neo-liberal economic policy of the government
aggravated the unemployment situation.
Since the labour force grew at a faster rate of 2.84 per cent than the
workforce, unemployment also rose. The incidence of unemployment on CDS
basis increased from 7.31 per cent in 1999-2000 to 8.28 per cent in 2004-05.
The 66th NSS round of survey for estimating unemployment rates is
under way with fieldwork undertaken during 2009-10. The updated
information based on this round is awaited. However, an estimate of
unemployment rates based on the 64th round is shown in Table below. A
comparative study of different estimates of unemployment during 2007-08
indicates that the CDS estimate of unemployment rate being the broadest is the
highest. The higher unemployment rates according to the CDS approach vis-a-
vis weekly and usual status approaches indicate a high degree of intermittent
unemployment.

- 94 -
All-India Rural and Urban Unemployment Rates from the NSS
64th Round 2007-08: Different Estimates
S. No. Estimate Rural Urban 1 Usual Principal Status 2.2 4.5 2 Usually employed 1.6 4.1 3 Current weekly status 3.9 5.0 4 Current Daily Status 8.4 7.4
Source: NSS Report No. 531 (64/10.2/1)
The CDS captures the unemployed days of the chronically unemployed,
the unemployed days of the usually employed who become intermittently
unemployed during the reference week, and unemployed days of those
classified as employed according to the current weekly status criterion.
The growth rate of labour force rose to the level of 3.06 per cent during
2004-05. Hence, there is an urgent need to provide employment for these
increasing additions to the labour force. The growth of labour force was
expected to accelerate in the Tenth Plan period in comparison to the 1990s
which required a commensurate increase in the pace of creation of additional
work opportunities in this period. However, the Tenth Plan had no strategy for
employment creation. It wrongly hoped that the targeted 8.0 per cent per
annum increase in GDP during the Plan period would do the trick.
Jayashree Sengupta very aptly discussed the failure of the Government
Policy in India, in her thought providing article "Aam Aadmi Ko Kya Mila".9
The relevant portion of the article is reproduced below.
In India, the rise in unemployment has been a silent phenomenon.
Instead of shouting and screaming, the unemployed voted against the BJP-led
NDA government and quietly dismissed the 'India Shining' campaign. One
hundred plus days after being at the helm, the UPA government shoundn't
9 Source: Jayshree Sengupta, "Aam Aadmi Ko Kya Mila?" Tehalka, September 25, 2004.

- 95 -
forget this unique characteristic of the Indian landscape.
We have had disguised unemployment in the past, but unemployment
never reached more than 5 per cent of the population. According to the
National Sample Survey's 55th round, unemployment as a percentage of labour
force rose from 5.99 per cent in 1993-94 to 7.32 per cent in 1999-2000.
Perhaps we have been witnessing jobless growth in recent years because while
the GDP grew at an average rate of 6.4 per cent between 1992-93 to 2000-01,
employment growth declined from 2 per cent to 1 per cent.
In the recent past, thousands of workers in agriculture and the organised
sector have been laid off. The organised sector (establishments employing 10
or more workers) has faced declining growth because the public sector which
constitutes two-third of the organised sector, has been shrinking. The private
manufacturing units within the organised sector have been shedding labour in
response to higher wages and global competition.
Retrenchment of labour has been common in other countries, but in
India it is a new phenomenon and the voluntary retirement scheme (VRS) has
not been painless for most. Some workers have been laid off without any
severance pay from loss making enterprises. All this has led to widespread
human trauma especially because there are no social safety nets, nor facilities
for re-training and skills development.
The restructuring exercise may have led to more productivity, but the
retrenchment process has thrown several families off balance.
Employees lost their jobs and houses, children's schools, healthcare and
an 'address', so important in India. In the last decade, those accepting VRS
have witnessed a new phenomenon-even their children can't find a job. Most
among the younger generation who voted in the last election were jobless-60
per cent were the educated jobless. Acquiring higher education has not
guaranteed jobs. The rate at which white collar jobs have been growing is

- 96 -
lower than the turn-out of college graduates. Many are accepting low-paying,
manual jobs.
In the organised sector, labour laws have been blamed for keeping
millions of workers out of jobs while 'protecting' the jobs of 'permanent'
staffers. The fact is that most employers are successfully circumventing labour
laws through contractual labour whom they routinely hire and fire. Also, the
lack of skills and training among workers encourages industrialists to go for
higher technology rather than labour. The Indian labour force is among the
least skilled and literate as compared to the skill levels of workers in China or
South Korea, especially in the manufacturing sector.
The decline in productivity of the small-scale sector has led to sharp
increase in unemployment. If this sector had grown rapidly, more jobs could
have been created. But employment potential has not grown. Even labour
intensive, low technology exports have grown slowly - they rose from $2.5
billion in 1985 to $13 billion in 1995, while Chinese low technology exports
grew from $3 billion to $72 billion in 1995. The decline in employment has
been most striking in agriculture. Total employment in agriculture dropped.
Agricultural employment engaged 56 per cent of the population in 1999-2000.
Low agricultural productivity, frequent crop failures due to drought and lack of
adequate irrigation facilities have made agriculture less profitable; the number
of farm workers has been declining. In some areas, high agricultural growth
due to mechanisation has led to a permanent fall in demand for agricultural
labour. Indeed, low productivity and falling income has created a boom in
casual labour.
The government's response to stagnant agriculture has been poverty
alleviation programmes aimed at raising rural incomes. But the delivery of
these programmes has not been satisfactory as there have been numerous
'leakages' due to corruption. The jobless from rural areas have been entering
- 97 -
the 'informal' sector. It absorbs 92 per cent of the workforce and is
characterised by unprotected jobs without regular salaries and engulfs a vast
population of self-employed people and daily-wage workers. These workers
also migrate to big cities and end up in slums in sub-human conditions. In a
cyber city like Bangalore, 20 per cent of the population lives in slums. The
service sector has been growing at 5 per cent. It has limited job potential
though there has been a big increase in outsourcing centres and IT jobs.
Around 2.5 million people can be absorbed in the IT sector by 2008, but the
requirements of entry are tough. Only those with specialised, technical
education and knowledge of English can get in. It's strange paradox. Unless the
UPA government acts fast to give jobs to the 42 million unemployed, its own
pre-poll query might boomerang: aam aadmi ko kya mila?
============