00b--machinery sector dec 12 - home - nomura
TRANSCRIPT

16 December 2010 Nomura
N O M U R A I N T E R N A T I O N A L ( H K ) L I M I T E D
AN
CH
OR
R
EP
OR
T
Nomura Anchor Reports examine the key themes and value drivers that underpin our sector views and stock recommendations for the next 6 to 12 months.
Any authors named on this report are research analysts unless otherwise indicated. See the important disclosures and analyst certifications on pages 129 to 132.
Machinery | C H I N A
INDUSTRIALS
Yankun Hou +852 2252 6234 [email protected]
Roger Sher (Researcher) +852 2252 1550 [email protected]
No barriers We dispute the consensus view that the slowing in fixed asset investment (FAI) growth is negative for the Chinese machinery industry; we accept there has to be a natural slowdown after 60%-plus volume growth in 2010 (exaggerated by the general recovery from the credit crisis and policy-driven investment spending), but see no barriers to our healthy 12% growth forecast for 2011F. We also recognise that investor interest in the sector may be somewhat weak leading up to expected negative y-y growth in March 2011 (high base and seasonality), particularly given the background of tight monetary policy in 1Q. Still, we think rising labour costs in the industrial economy will refresh investor interest in Chinese machinery manufacturing from 2Q, and we see pockets of value for longer-term investors now. Our recommendations also cross the investability barrier; even though many Chinese players only have A-share listings, we see access to the story through the listed Japanese manufacturers. Our top BUYs are SANY Heavy, Zoomlion and Komatsu, with exposure to excavators and concrete machinery, the fastest-growing segments in 2011F on our estimates (both 20% vs 10% for cranes and flat for wheel loaders). We also recommend BUY on hydraulics suppliers Kawasaki Heavy, Toshiba Machine and Nabtesco, given strong demand and their technological competitiveness. Meanwhile, we think Hitachi Construction Machinery (NEUTRAL) will benefit from strong excavator growth.
Beyond the base effect
Secular growth drivers
Prefer excavators for investment; play China through Japan
Stocks for action Our top picks in the Asia-Pacific
construction machinery universe are
SANY Heavy, Zoomlion, and Komatsu,
all rated BUY. Stock Rating Price PT
Zoomlion (000157 CH) BUY 14.8 18*
SANY Heavy (600031 CH) BUY 21.5 26*
Lonking (3339 HK) NEUTRAL 4.87 5.3*
Kobe Steel (5406 JP) BUY 206 300
Toshiba Machine (6104 JP) BUY 390 470
Nabtesco (6268 JP) BUY 1,596 1,870
Komatsu (6301 JP) BUY 2,427 3,000*
Hitachi Construction (6305 JP) NEUTRAL 1,973 2,160*
Kawasaki Heavy (7012 JP) BUY 272 310
Volvo (VOLVB SS) NEUTRAL 109.3 96
Upgrading rating from Neutral; * lifting PT Prices as of 10 December, 2010; all prices in local currency
Analysts Yankun Hou (HK) +852 2252 6234 [email protected]
Katsushi Saito (Japan) +81 3 6703 1160 [email protected]
Roger Sher (Researcher, HK) +852 2252 1550 [email protected]
Wenjie Ge (Japan) +81 3 6703 1168 [email protected]
BULLISH
16 December 2010 Nomura 1
Machinery | C H I N A
INDUSTRIALS
Yankun Hou +852 2252 6234 [email protected]
Roger Sher (Researcher) +852 2252 1550 [email protected]
Action We believe rising labour costs, an improving product mix and gradually increasing
pricing power will bring the limelight back to strong growth in the machinery sector. We would advise investors to focus on excavators and concrete machinery: these should be 2011’s fastest growing segments. SANY, Zoomlion and Komatsu are our top BUYs on this basis. With listed China exposure still limited to HKSE, we also recommend Japanese suppliers Kawasaki Heavy Industries, Toshiba Machine and Nabtesco.
Catalysts Possible negative growth in March 2011 could hurt share prices, while strong
volume growth from 2Q and onwards should support share-price appreciation.
Anchor themes
We expect rising mechanisation in China as a consequence of labour cost increases. Chinese construction machinery makers will likely become more competitive due to strong growth of the domestic market, improving product quality and technology level.
No barriers Beyond the base effect
After 60%-plus volume growth in 2010, we forecast machinery will increase 12% y-y in 2011. The slowing growth rate is mainly due to: 1) a high base effect and 2) the peaking of new projects. We believe the industry might witness negative y-y growth in March 2011 owing to a high base effect and seasonality. Coupled with a tight monetary policy in 1Q, we think the share-price performance of Chinese machinery makers might face downward pressure during this period. However, we think increasing attention to labour cost/Lewis effect will refresh investor interest from 2Q, but we underscore that buying on dips is not a bad way into our BUYs here.
Secular growth drivers
Contrary to the consensus view that machinery companies have passed the golden investment period due to the slowing growth rate of FAI investment over the long term, we are still positive on the long-term growth potential of China’s machinery industry, thanks to: 1) improving mechanisation rate due to rising labour cost and safety/environmental requirements; 2) improving product mix; 3) increasing pricing trend due to better product quality and brand image, and 4) export growth potential. In the next five years, we believe Chinese machinery makers will likely become competitive in the global market, backed by continuous R&D investment.
Prefer excavators for investment; play China through Japan
Of the different types of machinery, we believe excavators will lead in 2011, with 20% y-y growth to 194,400 units, while concrete machinery will be up 20% y-y, cranes up 10% and wheel loaders should be flattish y-y. SANY, Zoomlion and Komatsu are our top BUYs on this basis. We believe SANY and Zoomlion could potentially emerge as global players due to their long-term commitment to product quality, aftermarket service and R&D investment. We believe Komatsu, HCM and Kobe Steel will benefit from strong excavator growth in China in both the short and long term. Given their strong demand and technological competitiveness on hydraulic equipment, we recommend accumulating hydraulic suppliers Kawasaki Heavy Industries, Toshiba Machine and Nabtesco.
BULLISH
N O M U R A I N T E R N A T I O N A L ( H K ) L I M I T E D
Stocks for action Our top picks in the Asia-Pacific construction machinery universe are SANY Heavy, Zoomlion, and Komatsu, all rated BUY.
Stock Rating Price PT
Zoomlion (000157 CH) BUY 14.8 18*
SANY Heavy (600031 CH) BUY 21.5 26*
Lonking (3339 HK) NEUTRAL 4.87 5.3*
Kobe Steel (5406 JP) BUY 206 300
Toshiba Machine (6104 JP) BUY 390 470
Nabtesco (6268 JP) BUY 1,596 1,870
Komatsu (6301 JP) BUY 2,427 3,000*
Hitachi Construction (6305 JP) NEUTRAL 1,973 2,160*
Kawasaki Heavy (7012 JP) BUY 272 310
Volvo (VOLVB SS) NEUTRAL 109.3 96
Upgrading rating from Neutral; * lifting PT
Prices as of 10 December, 2010; all prices in local currency
Analysts Yankun Hou (HK)
+852 2252 6234
Katsushi Saito (Japan)
+81 3 6703 1160
Roger Sher (Researcher, HK)
+852 2252 1550
Wenjie Ge (Japan)
+81 3 6703 1168
Yuji Matsumoto (Japan)
+81 3 6703 1220
Ryo Tazaki (Japan)
+81 3 6703 1117
Shigeki Okazaki (Japan)
+81 3 6703 1170
Alexis Albert (UK)
+44 20 710 21781
Machinery | China Yankun Hou
16 December 2010 Nomura 2
Contents
Executive summary 4 Valuation 6
Moderate growth expected in 2011F 14 Excavator to lead growth in 2011 15 Infrastructure construction: diminishing impact from railway and highway investment 16 Mining industry: recovering from consolidation 18 Properties development: public housing drives growth 18
Long term: not just an FAI story 20 Rising mechanisation rates 21 Upgrading product mix 23 Overseas expansion 24
Excavators: digging gold 25 China accounted for 50% of global excavator demand in 9M10 25 Competitive landscape in China 26 Industry growth forecasts 28 Hydraulic equipment: mainly reliant on Japanese suppliers 30
Concrete machinery: cementing a bright future 40 Growth drivers: property, infrastructure, and mechanisation rate 41 Industry growth forecasts 42 Upgrading product mix 43 Profitability analysis 43 Technical: Concrete machinery 45
Construction crane: lifting to new heights 46 Growth driver: industrials & energy capex, infrastructure and property investment 47 Industry growth forecasts 48 Shifting to upper-end 49 Profitability analysis 50 Technical: Construction cranes 51
Wheel loaders: glories in yesterday 52 Growth drivers: mining and replacement demand 53 Industry growth forecasts 54 Profitability analysis 55
Appendix: Lewisian turning point and China’s competitiveness 57 China heading toward the “middle-income trap”? 57 How to avoid the trap? 57 Productivity basket: Bullish for Chinese capital goods companies 58

Machinery | China Yankun Hou
16 December 2010 Nomura 3
Latest company views Zoomlion Heavy 59
Sany Heavy International 69
Lonking Holdings 75
Kobe Steel 81
Toshiba Machine 87
Nabtesco Corp 93
Komatsu 98
Hitachi Construction Machinery 108
Kawasaki Heavy Industries 116
Volvo B 124
Machinery | China Yankun Hou
16 December 2010 Nomura 4
Valuation
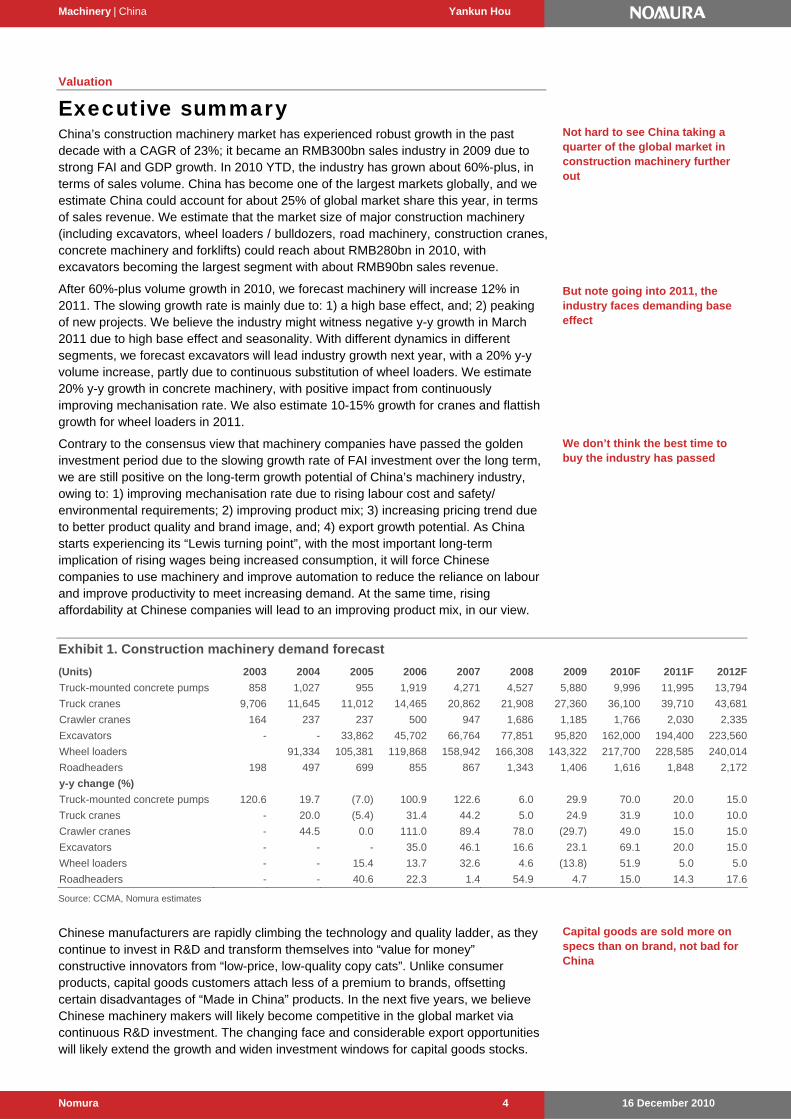
Executive summary China’s construction machinery market has experienced robust growth in the past decade with a CAGR of 23%; it became an RMB300bn sales industry in 2009 due to strong FAI and GDP growth. In 2010 YTD, the industry has grown about 60%-plus, in terms of sales volume. China has become one of the largest markets globally, and we estimate China could account for about 25% of global market share this year, in terms of sales revenue. We estimate that the market size of major construction machinery (including excavators, wheel loaders / bulldozers, road machinery, construction cranes, concrete machinery and forklifts) could reach about RMB280bn in 2010, with excavators becoming the largest segment with about RMB90bn sales revenue.
After 60%-plus volume growth in 2010, we forecast machinery will increase 12% in 2011. The slowing growth rate is mainly due to: 1) a high base effect, and; 2) peaking of new projects. We believe the industry might witness negative y-y growth in March 2011 due to high base effect and seasonality. With different dynamics in different segments, we forecast excavators will lead industry growth next year, with a 20% y-y volume increase, partly due to continuous substitution of wheel loaders. We estimate 20% y-y growth in concrete machinery, with positive impact from continuously improving mechanisation rate. We also estimate 10-15% growth for cranes and flattish growth for wheel loaders in 2011.
Contrary to the consensus view that machinery companies have passed the golden investment period due to the slowing growth rate of FAI investment over the long term, we are still positive on the long-term growth potential of China’s machinery industry, owing to: 1) improving mechanisation rate due to rising labour cost and safety/ environmental requirements; 2) improving product mix; 3) increasing pricing trend due to better product quality and brand image, and; 4) export growth potential. As China starts experiencing its “Lewis turning point”, with the most important long-term implication of rising wages being increased consumption, it will force Chinese companies to use machinery and improve automation to reduce the reliance on labour and improve productivity to meet increasing demand. At the same time, rising affordability at Chinese companies will lead to an improving product mix, in our view.
Exhibit 1. Construction machinery demand forecast
(Units) 2003 2004 2005 2006 2007 2008 2009 2010F 2011F 2012F
Truck-mounted concrete pumps 858 1,027 955 1,919 4,271 4,527 5,880 9,996 11,995 13,794
Truck cranes 9,706 11,645 11,012 14,465 20,862 21,908 27,360 36,100 39,710 43,681
Crawler cranes 164 237 237 500 947 1,686 1,185 1,766 2,030 2,335
Excavators - - 33,862 45,702 66,764 77,851 95,820 162,000 194,400 223,560
Wheel loaders 91,334 105,381 119,868 158,942 166,308 143,322 217,700 228,585 240,014
Roadheaders 198 497 699 855 867 1,343 1,406 1,616 1,848 2,172
y-y change (%)
Truck-mounted concrete pumps 120.6 19.7 (7.0) 100.9 122.6 6.0 29.9 70.0 20.0 15.0
Truck cranes - 20.0 (5.4) 31.4 44.2 5.0 24.9 31.9 10.0 10.0
Crawler cranes - 44.5 0.0 111.0 89.4 78.0 (29.7) 49.0 15.0 15.0
Excavators - - - 35.0 46.1 16.6 23.1 69.1 20.0 15.0
Wheel loaders - - 15.4 13.7 32.6 4.6 (13.8) 51.9 5.0 5.0
Roadheaders - - 40.6 22.3 1.4 54.9 4.7 15.0 14.3 17.6
Source: CCMA, Nomura estimates
Chinese manufacturers are rapidly climbing the technology and quality ladder, as they continue to invest in R&D and transform themselves into “value for money” constructive innovators from “low-price, low-quality copy cats”. Unlike consumer products, capital goods customers attach less of a premium to brands, offsetting certain disadvantages of “Made in China” products. In the next five years, we believe Chinese machinery makers will likely become competitive in the global market via continuous R&D investment. The changing face and considerable export opportunities will likely extend the growth and widen investment windows for capital goods stocks.
Not hard to see China taking a quarter of the global market in construction machinery further out
But note going into 2011, the industry faces demanding base effect
We don’t think the best time to buy the industry has passed
Capital goods are sold more on specs than on brand, not bad for China
Machinery | China Yankun Hou
16 December 2010 Nomura 5
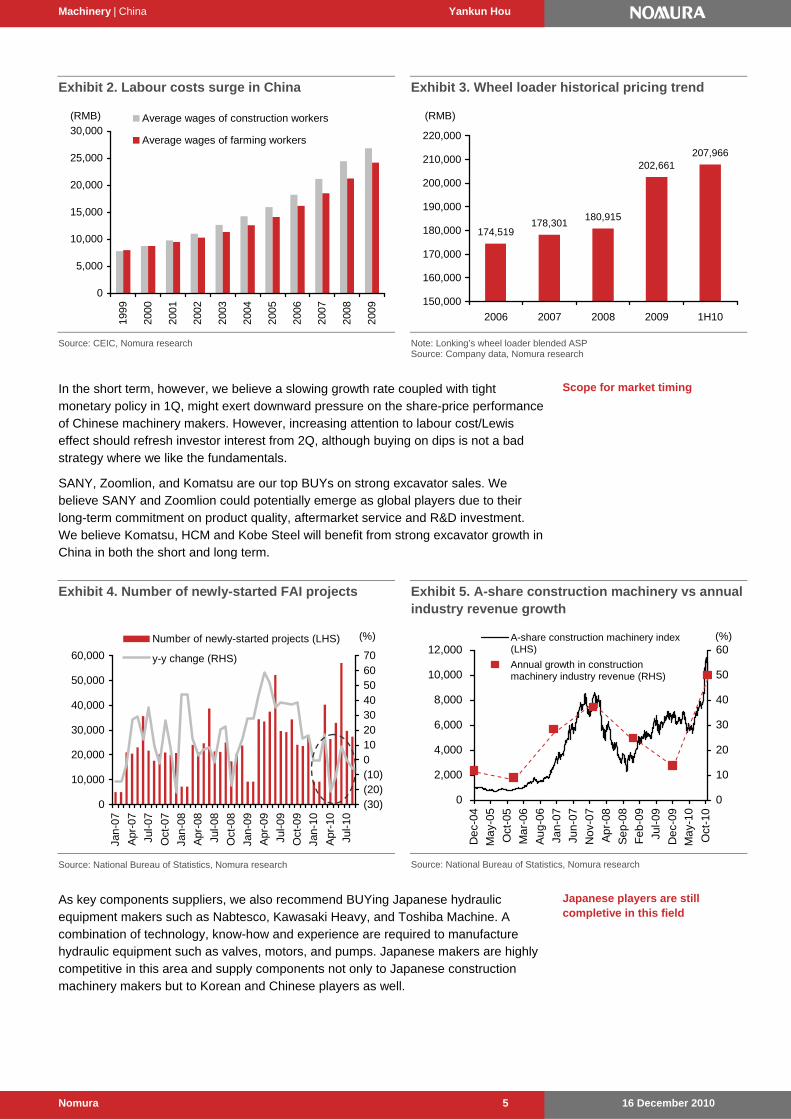
Exhibit 2. Labour costs surge in China
0
5,000
10,000
15,000
20,000
25,000
30,00019
99
2000
2001
2002
2003
2004
2005
2006
2007
2008
2009
(RMB) Average wages of construction workers
Average wages of farming workers
Source: CEIC, Nomura research
Exhibit 3. Wheel loader historical pricing trend
174,519178,301
180,915
202,661207,966
150,000
160,000
170,000
180,000
190,000
200,000
210,000
220,000
2006 2007 2008 2009 1H10
(RMB)
Note: Lonking’s wheel loader blended ASP Source: Company data, Nomura research
In the short term, however, we believe a slowing growth rate coupled with tight monetary policy in 1Q, might exert downward pressure on the share-price performance of Chinese machinery makers. However, increasing attention to labour cost/Lewis effect should refresh investor interest from 2Q, although buying on dips is not a bad strategy where we like the fundamentals.
SANY, Zoomlion, and Komatsu are our top BUYs on strong excavator sales. We believe SANY and Zoomlion could potentially emerge as global players due to their long-term commitment on product quality, aftermarket service and R&D investment. We believe Komatsu, HCM and Kobe Steel will benefit from strong excavator growth in China in both the short and long term.
Exhibit 4. Number of newly-started FAI projects
0
10,000
20,000
30,000
40,000
50,000
60,000
Jan-
07
Apr
-07
Jul-0
7
Oct
-07
Jan-
08
Apr
-08
Jul-0
8
Oct
-08
Jan-
09
Apr
-09
Jul-0
9
Oct
-09
Jan-
10
Apr
-10
Jul-1
0
(30)(20)(10)010203040506070
Number of newly-started projects (LHS)
y-y change (RHS)
(%)
Source: National Bureau of Statistics, Nomura research
Exhibit 5. A-share construction machinery vs annual industry revenue growth
0
2,000
4,000
6,000
8,000
10,000
12,000
De
c-0
4
Ma
y-0
5
Oct
-05
Ma
r-0
6
Au
g-0
6
Jan
-07
Jun
-07
No
v-0
7
Ap
r-0
8
Se
p-0
8
Fe
b-0
9
Jul-
09
De
c-0
9
Ma
y-1
0
Oct
-10
0 %
10
20
30
40
50
60 A-share construction machinery index(LHS)
Annual growth in constructionmachinery industry revenue (RHS)
(%)
Source: National Bureau of Statistics, Nomura research
As key components suppliers, we also recommend BUYing Japanese hydraulic equipment makers such as Nabtesco, Kawasaki Heavy, and Toshiba Machine. A combination of technology, know-how and experience are required to manufacture hydraulic equipment such as valves, motors, and pumps. Japanese makers are highly competitive in this area and supply components not only to Japanese construction machinery makers but to Korean and Chinese players as well.
Scope for market timing
Japanese players are still completive in this field
Machinery | China Yankun Hou
16 December 2010 Nomura 6
Valuation
From operational point of view, long-term positive
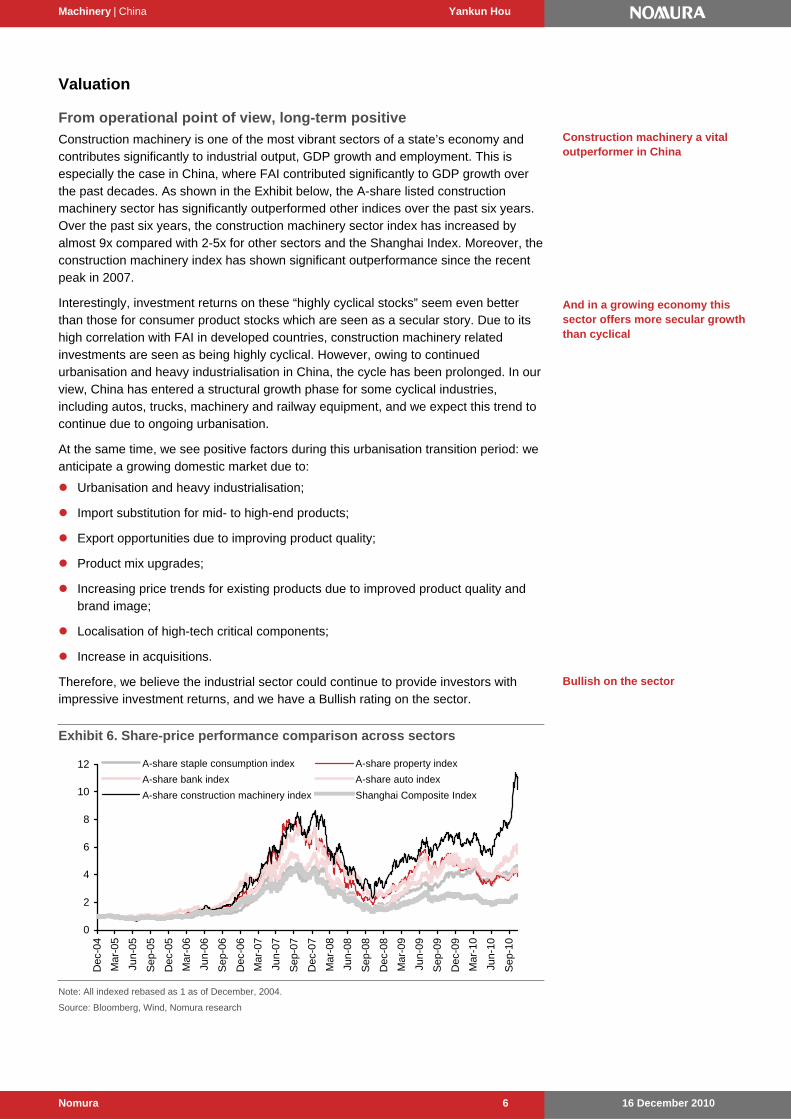
Construction machinery is one of the most vibrant sectors of a state’s economy and contributes significantly to industrial output, GDP growth and employment. This is especially the case in China, where FAI contributed significantly to GDP growth over the past decades. As shown in the Exhibit below, the A-share listed construction machinery sector has significantly outperformed other indices over the past six years. Over the past six years, the construction machinery sector index has increased by almost 9x compared with 2-5x for other sectors and the Shanghai Index. Moreover, the construction machinery index has shown significant outperformance since the recent peak in 2007.
Interestingly, investment returns on these “highly cyclical stocks” seem even better than those for consumer product stocks which are seen as a secular story. Due to its high correlation with FAI in developed countries, construction machinery related investments are seen as being highly cyclical. However, owing to continued urbanisation and heavy industrialisation in China, the cycle has been prolonged. In our view, China has entered a structural growth phase for some cyclical industries, including autos, trucks, machinery and railway equipment, and we expect this trend to continue due to ongoing urbanisation.
At the same time, we see positive factors during this urbanisation transition period: we anticipate a growing domestic market due to:
Urbanisation and heavy industrialisation;
Import substitution for mid- to high-end products;
Export opportunities due to improving product quality;
Product mix upgrades;
Increasing price trends for existing products due to improved product quality and brand image;
Localisation of high-tech critical components;
Increase in acquisitions.
Therefore, we believe the industrial sector could continue to provide investors with impressive investment returns, and we have a Bullish rating on the sector.
Exhibit 6. Share-price performance comparison across sectors
0
2
4
6
8
10
12
Dec
-04
Mar
-05
Jun-
05
Sep
-05
Dec
-05
Mar
-06
Jun-
06
Sep
-06
Dec
-06
Mar
-07
Jun-
07
Sep
-07
Dec
-07
Mar
-08
Jun-
08
Sep
-08
Dec
-08
Mar
-09
Jun-
09
Sep
-09
Dec
-09
Mar
-10
Jun-
10
Sep
-10
A-share staple consumption index A-share property index
A-share bank index A-share auto index
A-share construction machinery index Shanghai Composite Index
Note: All indexed rebased as 1 as of December, 2004.
Source: Bloomberg, Wind, Nomura research
Construction machinery a vital outperformer in China
And in a growing economy this sector offers more secular growth than cyclical
Bullish on the sector
Machinery | China Yankun Hou
16 December 2010 Nomura 7
However, capital market exaggerates cyclicality
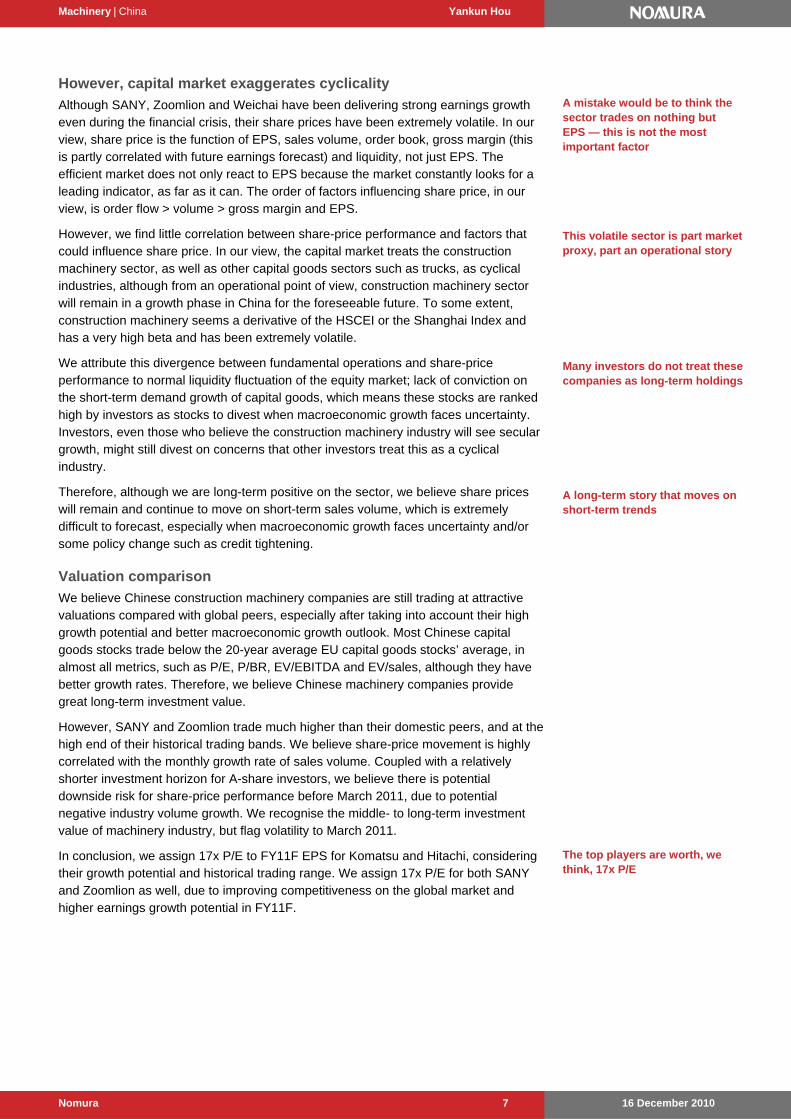
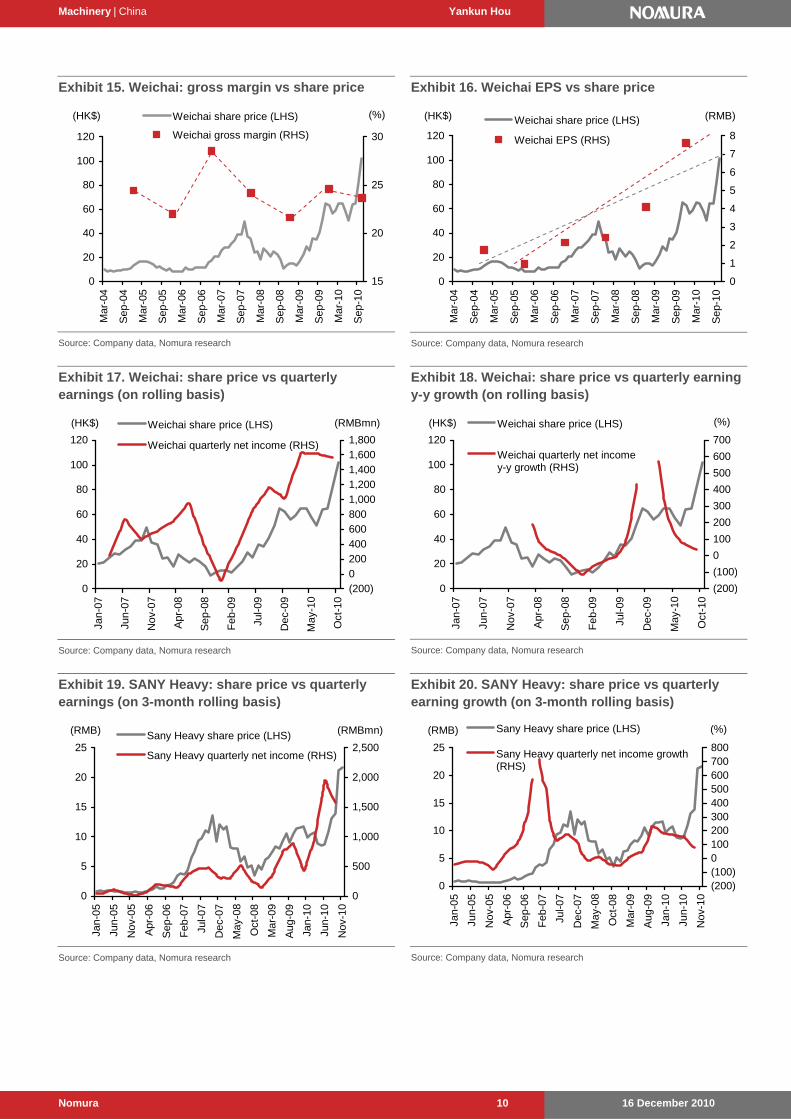
Although SANY, Zoomlion and Weichai have been delivering strong earnings growth even during the financial crisis, their share prices have been extremely volatile. In our view, share price is the function of EPS, sales volume, order book, gross margin (this is partly correlated with future earnings forecast) and liquidity, not just EPS. The efficient market does not only react to EPS because the market constantly looks for a leading indicator, as far as it can. The order of factors influencing share price, in our view, is order flow > volume > gross margin and EPS.
However, we find little correlation between share-price performance and factors that could influence share price. In our view, the capital market treats the construction machinery sector, as well as other capital goods sectors such as trucks, as cyclical industries, although from an operational point of view, construction machinery sector will remain in a growth phase in China for the foreseeable future. To some extent, construction machinery seems a derivative of the HSCEI or the Shanghai Index and has a very high beta and has been extremely volatile.
We attribute this divergence between fundamental operations and share-price performance to normal liquidity fluctuation of the equity market; lack of conviction on the short-term demand growth of capital goods, which means these stocks are ranked high by investors as stocks to divest when macroeconomic growth faces uncertainty. Investors, even those who believe the construction machinery industry will see secular growth, might still divest on concerns that other investors treat this as a cyclical industry.
Therefore, although we are long-term positive on the sector, we believe share prices will remain and continue to move on short-term sales volume, which is extremely difficult to forecast, especially when macroeconomic growth faces uncertainty and/or some policy change such as credit tightening.
Valuation comparison
We believe Chinese construction machinery companies are still trading at attractive valuations compared with global peers, especially after taking into account their high growth potential and better macroeconomic growth outlook. Most Chinese capital goods stocks trade below the 20-year average EU capital goods stocks’ average, in almost all metrics, such as P/E, P/BR, EV/EBITDA and EV/sales, although they have better growth rates. Therefore, we believe Chinese machinery companies provide great long-term investment value.
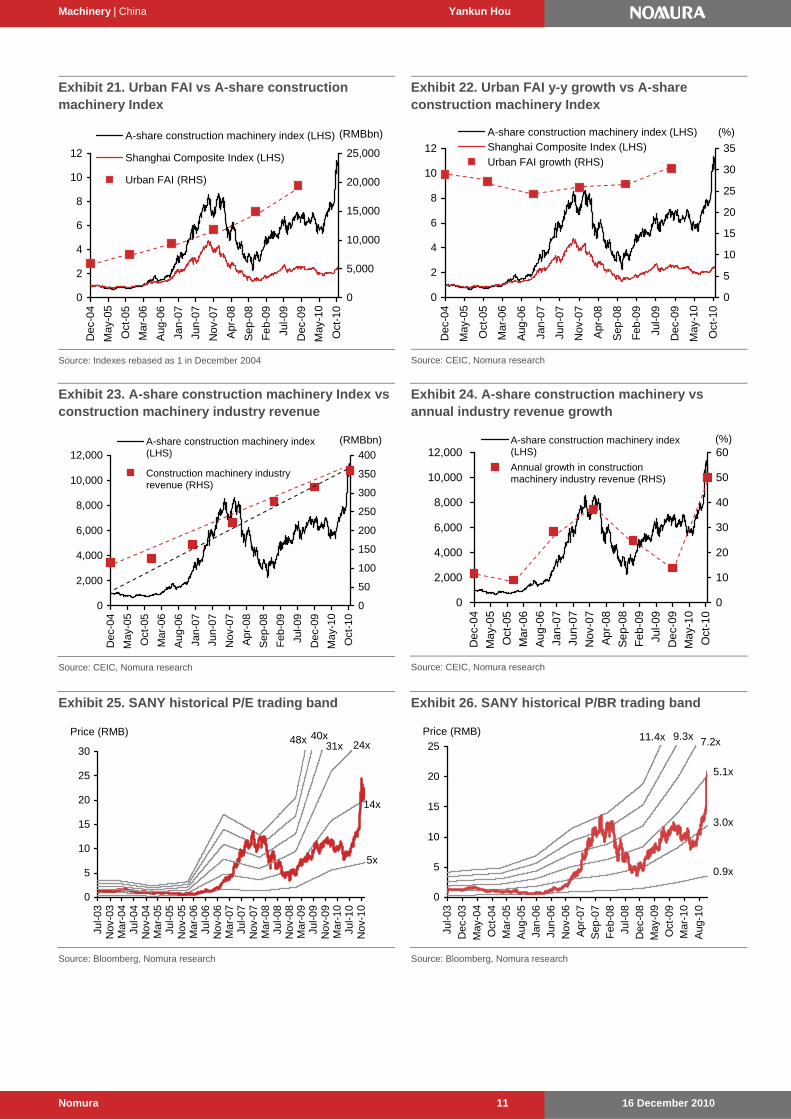
However, SANY and Zoomlion trade much higher than their domestic peers, and at the high end of their historical trading bands. We believe share-price movement is highly correlated with the monthly growth rate of sales volume. Coupled with a relatively shorter investment horizon for A-share investors, we believe there is potential downside risk for share-price performance before March 2011, due to potential negative industry volume growth. We recognise the middle- to long-term investment value of machinery industry, but flag volatility to March 2011.
In conclusion, we assign 17x P/E to FY11F EPS for Komatsu and Hitachi, considering their growth potential and historical trading range. We assign 17x P/E for both SANY and Zoomlion as well, due to improving competitiveness on the global market and higher earnings growth potential in FY11F.
A mistake would be to think the sector trades on nothing but EPS — this is not the most important factor
This volatile sector is part market proxy, part an operational story
Many investors do not treat these companies as long-term holdings
A long-term story that moves on short-term trends
The top players are worth, we think, 17x P/E

Machinery | China Yankun Hou
16 December 2010 Nomura 8
Exhibit 7. Global valuation comparison
Ticker Rating Price Mkt Cap EPS CAGR (US$mn) 09-12F 09 10F 11F 12F 09 10F 11F 12F 09 10F 11F 12F
Lonking 3339 HK Neutral 4.87 2,681 27% 11.1 11.9 10.9 9.7 2.3 3.5 2.8 2.3 9.3 4.9 4.2 3.5CSR 1766 HK Buy 10.20 14,541 53% 60.0 33.6 21.8 16.9 5.8 5.1 4.4 3.7 40.0 21.4 13.3 9.7Zhuzhou CSR 3898 HK Neutral 31.25 4,359 41% 53.2 32.1 24.6 19.1 7.5 6.4 5.4 4.5 46.2 26.2 19.6 15.0Midas Holdings 1021 HK Buy 5.48 858 35% 22.1 17.4 12.6 9.0 2.6 1.7 1.8 1.5 20.3 13.5 7.4 5.7Sany International 631 HK Neutral 12.14 3,241 35% 42.8 31.3 23.5 17.4 5.0 4.3 3.6 3.0 29.3 24.4 16.6 11.6IMM 1683 HK Not rated 6.95 1,162 24% 21.0 22.5 14.5 11.1 n.a. 3.3 2.8 2.4 n.a. 14.7 9.0 7.2H share average 36% 35.0 24.8 18.0 13.9 4.6 4.1 3.5 2.9 29.0 17.5 11.7 8.8Zoomlion Heavy 000157 CH Buy 14.83 10,977 24% 10.1 18.1 14.3 11.6 3.4 4.4 3.4 2.7 10.9 5.4 4.0 2.8Sany Heavy 600031 CH Buy 21.49 16,343 65% 16.3 18.5 14.4 11.4 4.2 8.6 5.6 3.9 16.7 6.6 5.1 4.0Zhenhua Heavy 600320 CH Not rated 6.91 4,204 30% 36.4 39.7 23.5 14.5 2.0 1.8 1.7 1.6 19.8 16.4 13.7 11.6CSR 601766 CH Not rated 8.06 14,541 53% 56.8 33.9 23.3 15.2 5.5 4.8 4.1 3.4 31.3 23.2 16.4 12.3China CNR 601299 CH Buy 6.97 8,690 29% 30.3 30.2 18.3 12.4 2.7 2.5 2.3 2.0 29.6 16.4 10.5 7.1Liugong Machinery 000528 CH Not rated 36.66 3,580 27% 26.0 16.7 14.7 11.1 4.6 4.5 3.6 2.9 20.9 12.7 11.1 9.5XCMG Construction Machinery 000425 CH Not rated 50.04 7,753 23% 24.9 18.6 15.8 11.8 4.6 4.6 3.6 2.7 21.2 12.6 10.4 9.9Xiamen XGMA 600815 CH Not rated 14.45 1,692 110% 96.3 16.5 14.2 9.2 3.8 3.9 2.8 2.1 57.5 14.1 10.3 8.2Tian Di Science and Technology 600582 CH Not rated 25.23 3,834 30% 36.0 23.5 19.1 14.3 8.5 6.4 5.0 4.0 19.6 n.a. n.a. n.a.Zhengzhou Coal Mining Machinery 601717 CH Not rated 42.96 4,517 22% 38.0 33.9 26.0 18.6 16.1 5.5 4.6 3.8 n.a. 26.5 21.4 17.9A share average 41% 37.1 25.0 18.4 13.0 5.5 4.7 3.7 2.9 25.3 14.9 11.4 9.3Caterpillar CAT US Not rated 89.94 57,085 72% 62.0 22.6 15.7 10.8 5.8 5.6 4.6 3.4 28.8 14.7 11.1 9.5Deere DE US Not rated 82.14 34,816 18% 18.7 15.1 12.9 10.1 5.5 4.4 3.5 2.9 15.2 13.3 12.2 11.0Joy Global JOYG US Not rated 79.08 8,167 9% 17.8 18.9 16.2 12.1 7.3 6.9 5.3 4.1 10.4 11.0 9.3 8.1Cummins Inc CMI US Not rated 105.03 20,776 55% 48.4 20.9 15.4 11.4 4.9 4.6 3.8 3.3 23.1 11.0 8.5 7.4North America average 32% 30.6 17.6 14.1 10.3 4.7 4.3 3.5 2.9 16.1 10.9 9.1 8.0Volvo VOLVB SS Neutral 109.00 33,887 n.a. n.a. 20.6 14.4 12.1 3.8 3.2 2.8 2.4 n.a. 8.6 6.7 5.6Sandvik SAND SS Not rated 126.00 22,356 n.a. n.a. 23.3 17.1 12.6 4.9 4.5 3.8 3.3 51.6 11.7 9.7 8.6Europe average n.a. n.a. 21.9 15.7 12.4 4.3 3.8 3.3 2.8 51.6 10.1 8.2 7.1Sumitomo Heavy 6302 JT Buy 517 3,785 26% 23.5 14.8 n.a. 10.0 1.3 1.2 1.1 1.0 7.3 6.0 5.3 5.0Komatsu 6301 JT Buy 2,427 28,875 73% 69.9 18.6 13.7 10.9 2.8 2.5 2.2 2.0 17.9 9.7 7.7 6.4Hitachi Construction Machinery 6305 JT Neutral 1,997 5,154 93% 102.0 39.0 19.0 14.2 1.4 1.3 1.3 1.2 17.3 10.4 4.2 3.7Kawasaki 7012 JT Buy 274 5,493 n.a. n.a. 19.3 12.5 11.5 1.6 1.5 1.4 1.3 16.9 10.1 8.7 8.0Nabtesco 6268 JT Buy 1,688 2,577 56% 50.3 16.1 13.6 12.2 2.5 2.1 1.9 1.7 13.9 7.5 6.2 5.4Toshiba Machine 6104 JT Buy 407 815 n.a. n.a. 34.8 21.2 14.1 0.9 0.9 0.9 0.8 76.1 10.5 7.9 6.2Kobe Steel 5406 JT Buy 210 7,851 117% 98.1 13.7 11.3 9.5 1.2 1.1 1.1 1.0 n.a. 5.8 5.6 5.3Japan average 67% 59.2 45.1 16.3 12.6 1.6 1.5 1.4 1.3 24.4 10.6 7.3 6.4Doosan Infracore 042670 KS Not rated 26,300 4,035 n.a. n.a. 64.0 12.6 8.6 3.6 3.9 3.0 2.4 23.0 8.6 7.3 9.6Hyundai Heavy 009540 KS Not rated 377,000 27,955 4% 11.9 8.3 9.9 9.2 2.6 2.0 1.7 1.5 13.0 8.0 8.2 10.0Korea average 78% n.a. 36.1 11.2 8.9 3.1 2.9 2.4 1.9 18.0 8.3 7.8 9.8
P/E (x) P/B (x) EV/EBITDA
Source: Priced as of 10 December, Nomura research
Exhibit 8. Product line-up of major construction machinery vendors
Sany Heavy Zoomlion XCMG Lonking Liugong XGMA Komatsu Caterpillar HCM Doosan
Bloomberg ticker 600031 CH 000157 CH 000425 CH 3339 HK 00528 CH 600815 CH 6301 JP CAT US 6501 JP 042670 KS
2009 revenue (US$ mn) 3,516 3,122 3,100 1,038 1,519 797 17,097 32,400 7,211 2,330
Concrete machinery
- Truck-mounted concrete pumps - Stationary concrete pumps - Concrete-mixing trucks - Concrete-mixing stations
Construction crane - Truck crane - Crawler crane - Tower crane
Earth-moving machinery
- Excavator
- Wheel loader
- Bull dozer
Road machinery
Road roller
Grader
Other machinery
- Dump trucks - Forklift Source: Company data, Nomura research

Machinery | China Yankun Hou
16 December 2010 Nomura 9
Exhibit 9. Lonking: wheel loader sales volume vs share price
0
1,000
2,000
3,000
4,000
5,000
6,000
7,000
Nov
-05
Mar
-06
Jul-0
6
Nov
-06
Mar
-07
Jul-0
7
Nov
-07
Mar
-08
Jul-0
8
Nov
-08
Mar
-09
Jul-0
9
Nov
-09
Mar
-10
Jul-1
0
(Unit)
0.00.51.01.52.02.53.03.54.04.55.0
(HK$)Lonking wheel loader volume (LHS)
Lonking share price (RHS)
Source: Company data, Nomura research
Exhibit 10. Lonking: wheel loader sales volume y-y growth vs share price
(60)(40)(20)
020406080
100120140
Nov
-05
May
-06
Nov
-06
May
-07
Nov
-07
May
-08
Nov
-08
May
-09
Nov
-09
May
-10
Nov
-10
(HK$)
0.00.51.01.52.02.53.03.54.04.55.0
Annual growth of Lonking wheel loadervolume (LHS)
Lonking share price (RHS)
(%)
Source: Company data, Nomura research
Exhibit 11. Lonking: EPS vs share price
0.00
0.05
0.10
0.15
0.20
0.25
0.30
0.35
0.40
Nov
-05
Mar
-06
Jul-0
6
Nov
-06
Mar
-07
Jul-0
7
Nov
-07
Mar
-08
Jul-0
8
Nov
-08
Mar
-09
Jul-0
9
Nov
-09
Mar
-10
Jul-1
0
2010
F
(RMB)
0.0
0.5
1.0
1.5
2.0
2.5
3.0
3.5
4.0
4.5
5.0
(HK$)Lonking EPS (LHS)
Lonking share price (RHS)
Source: Company data, Nomura research
Exhibit 12. Lonking: gross margin vs share price
15
17
19
21
23
25
27N
ov-0
5
Mar
-06
Jul-0
6
Nov
-06
Mar
-07
Jul-0
7
Nov
-07
Mar
-08
Jul-0
8
Nov
-08
Mar
-09
Jul-0
9
Nov
-09
Mar
-10
Jul-1
0
2010
F
0.0
0.5
1.0
1.5
2.0
2.5
3.0
3.5
4.0
4.5
5.0
(HK$)Lonking gross margin (LHS)
Lonking share price (RHS)
(%)
Source: Company data, Nomura research
Exhibit 13. Weichai: HDT sales volume vs share price
0
20,000
40,000
60,000
80,000
100,000
120,000
140,000
Mar
-04
Sep
-04
Mar
-05
Sep
-05
Mar
-06
Sep
-06
Mar
-07
Sep
-07
Mar
-08
Sep
-08
Mar
-09
Sep
-09
Mar
-10
Sep
-10
(Unit)
0
20
40
60
80
100
120
(HK$)HDT monthly sales (LHS)
Weichai share price (RHS)
Source: Company data, Nomura research
Exhibit 14. Weichai: HDT sales volume y-y growth rate vs share price
(100)
(50)
0
50
100
150
200
250
300
Mar
-05
Sep
-05
Mar
-06
Sep
-06
Mar
-07
Sep
-07
Mar
-08
Sep
-08
Mar
-09
Sep
-09
Mar
-10
Sep
-10
0
20
40
60
80
100
120
(HK$)HDT sales y-y growth (LHS)
Weichai share price (RHS)
(%)
Source: Company data, Nomura research
Machinery | China Yankun Hou
16 December 2010 Nomura 10
Exhibit 15. Weichai: gross margin vs share price
0
20
40
60
80
100
120
Mar
-04
Sep
-04
Mar
-05
Sep
-05
Mar
-06
Sep
-06
Mar
-07
Sep
-07
Mar
-08
Sep
-08
Mar
-09
Sep
-09
Mar
-10
Sep
-10
(HK$)
15
20
25
30
Weichai share price (LHS)
Weichai gross margin (RHS)
(%)
Source: Company data, Nomura research
Exhibit 16. Weichai EPS vs share price
0
20
40
60
80
100
120
Mar
-04
Sep
-04
Mar
-05
Sep
-05
Mar
-06
Sep
-06
Mar
-07
Sep
-07
Mar
-08
Sep
-08
Mar
-09
Sep
-09
Mar
-10
Sep
-10
(HK$)
0
1
2
3
4
5
6
7
8
(RMB)Weichai share price (LHS)
Weichai EPS (RHS)
Source: Company data, Nomura research
Exhibit 17. Weichai: share price vs quarterly earnings (on rolling basis)
0
20
40
60
80
100
120
Jan-
07
Jun-
07
Nov
-07
Apr
-08
Sep
-08
Feb
-09
Jul-0
9
Dec
-09
May
-10
Oct
-10
(HK$)
(200)0
200400
6008001,000
1,2001,400
1,6001,800
(RMBmn)Weichai share price (LHS)
Weichai quarterly net income (RHS)
Source: Company data, Nomura research
Exhibit 18. Weichai: share price vs quarterly earning y-y growth (on rolling basis)
0
20
40
60
80
100
120
Jan-
07
Jun-
07
Nov
-07
Apr
-08
Sep
-08
Feb
-09
Jul-0
9
Dec
-09
May
-10
Oct
-10
(HK$)
(200)
(100)
0 %
100
200
300
400
500
600
700
Weichai share price (LHS)
Weichai quarterly net incomey-y growth (RHS)
(%)
Source: Company data, Nomura research
Exhibit 19. SANY Heavy: share price vs quarterly earnings (on 3-month rolling basis)
0
5
10
15
20
25
Jan-
05
Jun-
05
Nov
-05
Apr
-06
Sep
-06
Feb
-07
Jul-0
7
Dec
-07
May
-08
Oct
-08
Mar
-09
Aug
-09
Jan-
10
Jun-
10
Nov
-10
(RMB)
0
500
1,000
1,500
2,000
2,500
(RMBmn)Sany Heavy share price (LHS)
Sany Heavy quarterly net income (RHS)
Source: Company data, Nomura research
Exhibit 20. SANY Heavy: share price vs quarterly earning growth (on 3-month rolling basis)
0
5
10
15
20
25
Jan-
05
Jun-
05
Nov
-05
Apr
-06
Sep
-06
Feb
-07
Jul-0
7
Dec
-07
May
-08
Oct
-08
Mar
-09
Aug
-09
Jan-
10
Jun-
10
Nov
-10
(RMB)
(200) (100) 0 %100 200 300 400 500 600 700 800
Sany Heavy share price (LHS)
Sany Heavy quarterly net income growth(RHS)
(%)
Source: Company data, Nomura research
Machinery | China Yankun Hou
16 December 2010 Nomura 11
Exhibit 21. Urban FAI vs A-share construction machinery Index
0
2
4
6
8
10
12
Dec
-04
May
-05
Oct
-05
Mar
-06
Aug
-06
Jan-
07
Jun-
07
Nov
-07
Apr
-08
Sep
-08
Feb
-09
Jul-0
9
Dec
-09
May
-10
Oct
-10
0
5,000
10,000
15,000
20,000
25,000
(RMBbn)A-share construction machinery index (LHS)
Shanghai Composite Index (LHS)
Urban FAI (RHS)
Source: Indexes rebased as 1 in December 2004
Exhibit 22. Urban FAI y-y growth vs A-share construction machinery Index
0
2
4
6
8
10
12
Dec
-04
May
-05
Oct
-05
Mar
-06
Aug
-06
Jan-
07
Jun-
07
Nov
-07
Apr
-08
Sep
-08
Feb
-09
Jul-0
9
Dec
-09
May
-10
Oct
-10
0
5
10
15
20
25
30
35
A-share construction machinery index (LHS)
Shanghai Composite Index (LHS)
Urban FAI growth (RHS)
(%)
Source: CEIC, Nomura research
Exhibit 23. A-share construction machinery Index vs construction machinery industry revenue
0
2,000
4,000
6,000
8,000
10,000
12,000
Dec
-04
May
-05
Oct
-05
Mar
-06
Aug
-06
Jan-
07
Jun-
07
Nov
-07
Apr
-08
Sep
-08
Feb
-09
Jul-0
9
Dec
-09
May
-10
Oct
-10
0
50
100
150
200
250
300
350
400
(RMBbn)A-share construction machinery index(LHS)
Construction machinery industryrevenue (RHS)
Source: CEIC, Nomura research
Exhibit 24. A-share construction machinery vs annual industry revenue growth
0
2,000
4,000
6,000
8,000
10,000
12,000
De
c-0
4
Ma
y-0
5
Oct
-05
Ma
r-0
6
Au
g-0
6
Jan
-07
Jun
-07
No
v-0
7
Ap
r-0
8
Se
p-0
8
Fe
b-0
9
Jul-
09
De
c-0
9
Ma
y-1
0
Oct
-10
0 %
10
20
30
40
50
60 A-share construction machinery index(LHS)
Annual growth in constructionmachinery industry revenue (RHS)
(%)
Source: CEIC, Nomura research
Exhibit 25. SANY historical P/E trading band
5x
14x
31x40x48x 24x
0
5
10
15
20
25
30
Jul-0
3N
ov-0
3M
ar-0
4Ju
l-04
Nov
-04
Mar
-05
Jul-0
5N
ov-0
5M
ar-0
6Ju
l-06
Nov
-06
Mar
-07
Jul-0
7N
ov-0
7M
ar-0
8Ju
l-08
Nov
-08
Mar
-09
Jul-0
9N
ov-0
9M
ar-1
0Ju
l-10
Nov
-10
Price (RMB)
Source: Bloomberg, Nomura research
Exhibit 26. SANY historical P/BR trading band
0.9x
3.0x
5.1x
7.2x11.4x
0
5
10
15
20
25
Jul-0
3
Dec
-03
May
-04
Oct
-04
Mar
-05
Aug
-05
Jan-
06Ju
n-06
Nov
-06
Apr
-07
Sep
-07
Feb
-08
Jul-0
8D
ec-0
8M
ay-0
9O
ct-0
9M
ar-1
0
Aug
-10
Price (RMB) 9.3x
Source: Bloomberg, Nomura research
Machinery | China Yankun Hou
16 December 2010 Nomura 12
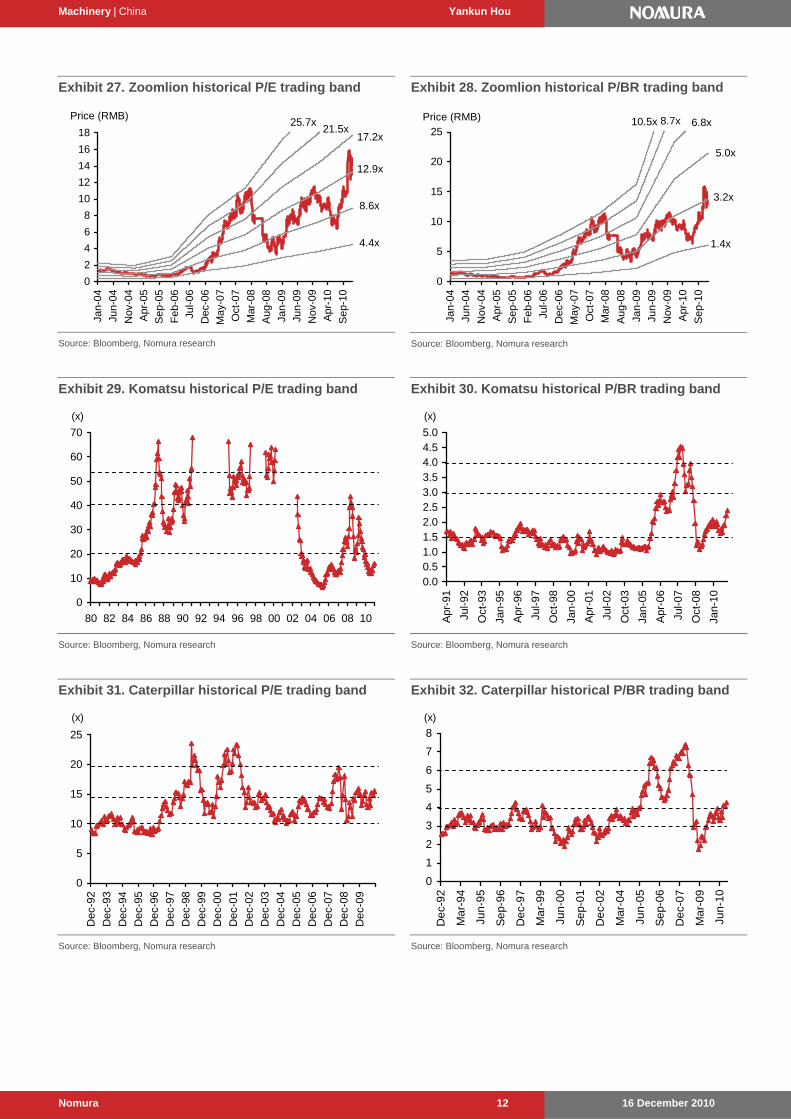
Exhibit 27. Zoomlion historical P/E trading band
4.4x
8.6x
12.9x
17.2x21.5x
25.7x
0
2
4
6
8
10
12
14
16
18
Jan-
04
Jun-
04
Nov
-04
Apr
-05
Sep
-05
Feb
-06
Jul-0
6
Dec
-06
May
-07
Oct
-07
Mar
-08
Aug
-08
Jan-
09
Jun-
09
Nov
-09
Apr
-10
Sep
-10
Price (RMB)
Source: Bloomberg, Nomura research
Exhibit 28. Zoomlion historical P/BR trading band
1.4x
3.2x
5.0x
8.7x 6.8x
0
5
10
15
20
25
Jan-
04
Jun-
04
Nov
-04
Apr
-05
Sep
-05
Feb
-06
Jul-0
6
Dec
-06
May
-07
Oct
-07
Mar
-08
Aug
-08
Jan-
09
Jun-
09
Nov
-09
Apr
-10
Sep
-10
Price (RMB) 10.5x
Source: Bloomberg, Nomura research
Exhibit 29. Komatsu historical P/E trading band
0
10
20
30
40
50
60
70
80 82 84 86 88 90 92 94 96 98 00 02 04 06 08 10
(x)
Source: Bloomberg, Nomura research
Exhibit 30. Komatsu historical P/BR trading band
0.00.51.01.52.02.53.03.54.04.55.0
Apr
-91
Jul-9
2
Oct
-93
Jan-
95
Apr
-96
Jul-9
7
Oct
-98
Jan-
00
Apr
-01
Jul-0
2
Oct
-03
Jan-
05
Apr
-06
Jul-0
7
Oct
-08
Jan-
10
(x)
Source: Bloomberg, Nomura research
Exhibit 31. Caterpillar historical P/E trading band
0
5
10
15
20
25
Dec
-92
Dec
-93
Dec
-94
Dec
-95
Dec
-96
Dec
-97
Dec
-98
Dec
-99
Dec
-00
Dec
-01
Dec
-02
Dec
-03
Dec
-04
Dec
-05
Dec
-06
Dec
-07
Dec
-08
Dec
-09
(x)
Source: Bloomberg, Nomura research
Exhibit 32. Caterpillar historical P/BR trading band
0
1
2
3
4
5
6
7
8
De
c-9
2
Ma
r-9
4
Jun
-95
Se
p-9
6
De
c-9
7
Ma
r-9
9
Jun
-00
Se
p-0
1
De
c-0
2
Ma
r-0
4
Jun
-05
Se
p-0
6
De
c-0
7
Ma
r-0
9
Jun
-10
(x)
Source: Bloomberg, Nomura research

Machinery | China Yankun Hou
16 December 2010 Nomura 13
Exhibit 33. Doosan historical P/E trading band
0
5
10
15
20
25
30
Feb
-01
Aug
-01
Feb
-02
Aug
-02
Feb
-03
Aug
-03
Feb
-04
Aug
-04
Feb
-05
Aug
-05
Feb
-06
Aug
-06
Feb
-07
Aug
-07
Feb
-08
Aug
-08
Feb
-09
Aug
-09
Feb
-10
Aug
-10
(x)
Source: Bloomberg, Nomura research
Exhibit 34. Doosan historical P/BR trading band
0.00.51.01.52.02.53.03.54.04.55.0
Fe
b-0
1A
ug
-01
Fe
b-0
2A
ug
-02
Fe
b-0
3A
ug
-03
Fe
b-0
4A
ug
-04
Fe
b-0
5A
ug
-05
Fe
b-0
6A
ug
-06
Fe
b-0
7A
ug
-07
Fe
b-0
8A
ug
-08
Fe
b-0
9A
ug
-09
Fe
b-1
0A
ug
-10
(x)
Source: Bloomberg, Nomura research
Machinery | China Yankun Hou
16 December 2010 Nomura 14
Drilling down
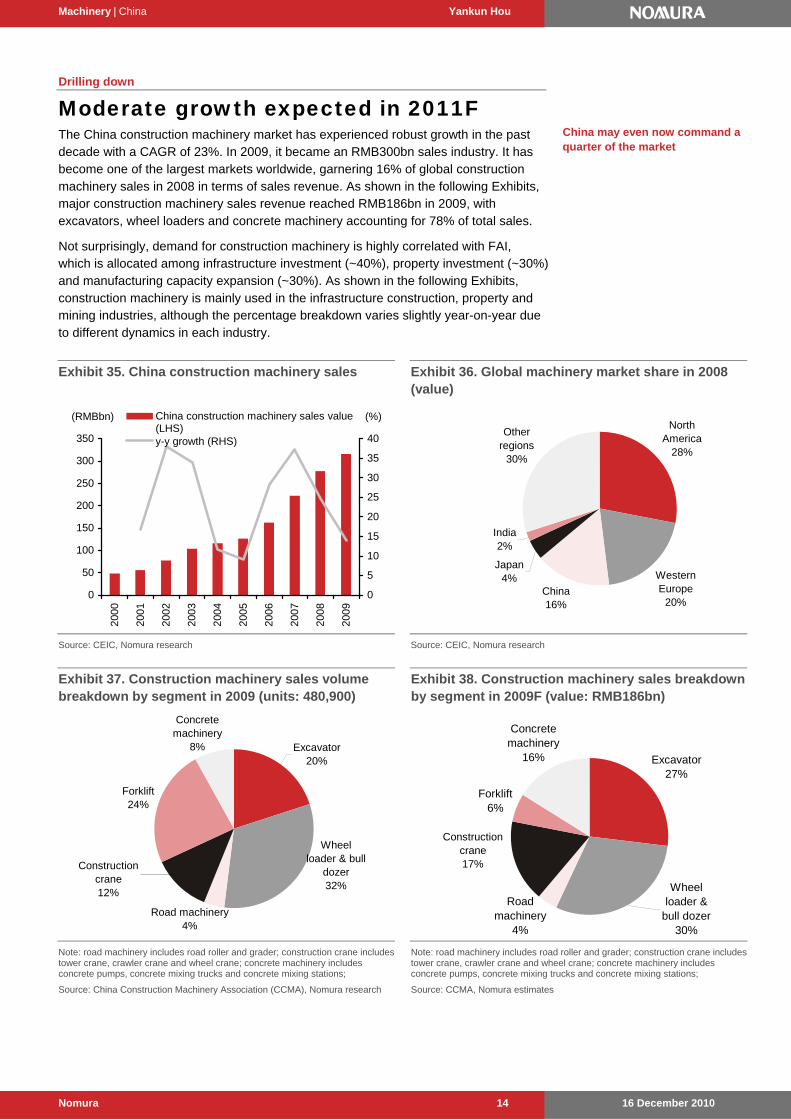
Moderate growth expected in 2011F The China construction machinery market has experienced robust growth in the past decade with a CAGR of 23%. In 2009, it became an RMB300bn sales industry. It has become one of the largest markets worldwide, garnering 16% of global construction machinery sales in 2008 in terms of sales revenue. As shown in the following Exhibits, major construction machinery sales revenue reached RMB186bn in 2009, with excavators, wheel loaders and concrete machinery accounting for 78% of total sales.
Not surprisingly, demand for construction machinery is highly correlated with FAI, which is allocated among infrastructure investment (~40%), property investment (~30%) and manufacturing capacity expansion (~30%). As shown in the following Exhibits, construction machinery is mainly used in the infrastructure construction, property and mining industries, although the percentage breakdown varies slightly year-on-year due to different dynamics in each industry.
Exhibit 35. China construction machinery sales
0
50
100
150
200
250
300
350
2000
2001
2002
2003
2004
2005
2006
2007
2008
2009
0
5
10
15
20
25
30
35
40
China construction machinery sales value(LHS)y-y growth (RHS)
(RMBbn) (%)
Source: CEIC, Nomura research
Exhibit 36. Global machinery market share in 2008 (value)
North America
28%
Western Europe
20%China16%
Japan4%
India2%
Other regions
30%
Source: CEIC, Nomura research
Exhibit 37. Construction machinery sales volume breakdown by segment in 2009 (units: 480,900)
Forklift24%
Wheel loader & bull
dozer32%
Excavator20%
Concrete machinery
8%
Road machinery4%
Construction crane12%
Note: road machinery includes road roller and grader; construction crane includes tower crane, crawler crane and wheel crane; concrete machinery includes concrete pumps, concrete mixing trucks and concrete mixing stations;
Source: China Construction Machinery Association (CCMA), Nomura research
Exhibit 38. Construction machinery sales breakdown by segment in 2009F (value: RMB186bn)
Excavator27%
Forklift6%
Concrete machinery
16%
Wheel loader &
bull dozer30%
Road machinery
4%
Construction crane17%
Note: road machinery includes road roller and grader; construction crane includes tower crane, crawler crane and wheel crane; concrete machinery includes concrete pumps, concrete mixing trucks and concrete mixing stations;
Source: CCMA, Nomura estimates
China may even now command a quarter of the market
Machinery | China Yankun Hou
16 December 2010 Nomura 15
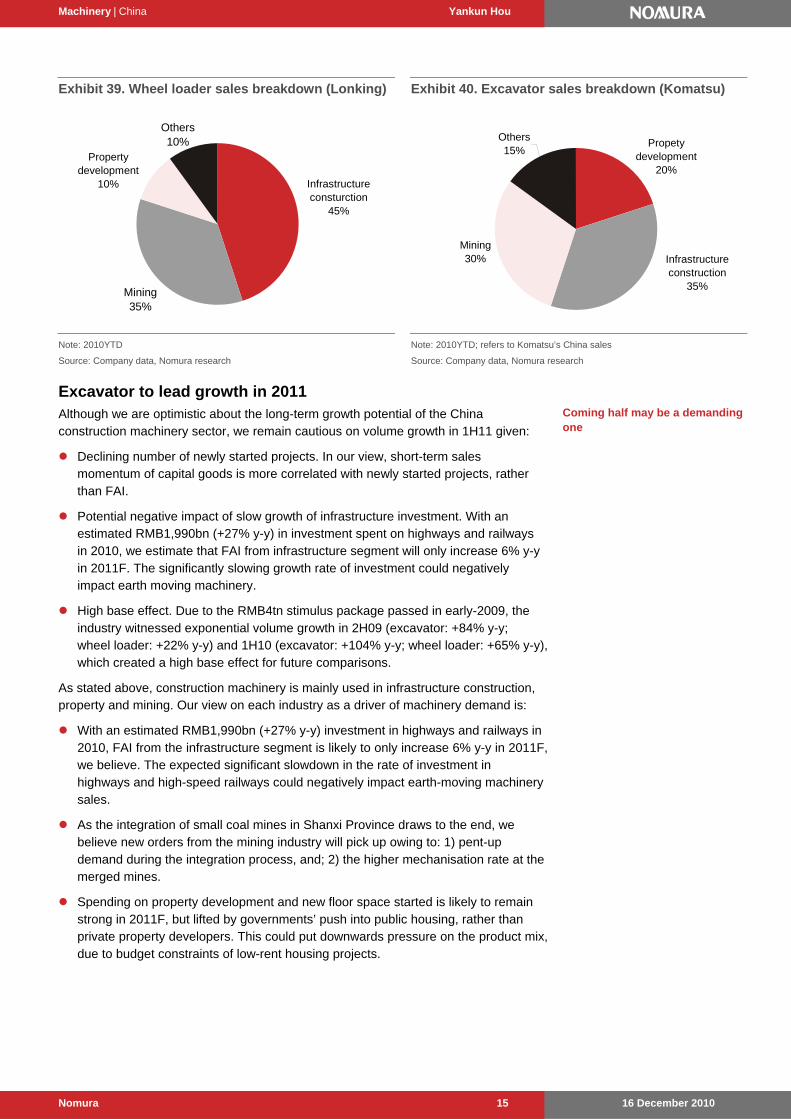
Exhibit 39. Wheel loader sales breakdown (Lonking)
Mining35%
Others 10%
Property development
10% Infrastructure consturction
45%
Note: 2010YTD
Source: Company data, Nomura research
Exhibit 40. Excavator sales breakdown (Komatsu)
Mining30%
Others15%
Propety development
20%
Infrastructure construction
35%
Note: 2010YTD; refers to Komatsu’s China sales
Source: Company data, Nomura research
Excavator to lead growth in 2011 Although we are optimistic about the long-term growth potential of the China construction machinery sector, we remain cautious on volume growth in 1H11 given:
Declining number of newly started projects. In our view, short-term sales momentum of capital goods is more correlated with newly started projects, rather than FAI.
Potential negative impact of slow growth of infrastructure investment. With an estimated RMB1,990bn (+27% y-y) in investment spent on highways and railways in 2010, we estimate that FAI from infrastructure segment will only increase 6% y-y in 2011F. The significantly slowing growth rate of investment could negatively impact earth moving machinery.
High base effect. Due to the RMB4tn stimulus package passed in early-2009, the industry witnessed exponential volume growth in 2H09 (excavator: +84% y-y; wheel loader: +22% y-y) and 1H10 (excavator: +104% y-y; wheel loader: +65% y-y), which created a high base effect for future comparisons.
As stated above, construction machinery is mainly used in infrastructure construction, property and mining. Our view on each industry as a driver of machinery demand is:
With an estimated RMB1,990bn (+27% y-y) investment in highways and railways in 2010, FAI from the infrastructure segment is likely to only increase 6% y-y in 2011F, we believe. The expected significant slowdown in the rate of investment in highways and high-speed railways could negatively impact earth-moving machinery sales.
As the integration of small coal mines in Shanxi Province draws to the end, we believe new orders from the mining industry will pick up owing to: 1) pent-up demand during the integration process, and; 2) the higher mechanisation rate at the merged mines.
Spending on property development and new floor space started is likely to remain strong in 2011F, but lifted by governments’ push into public housing, rather than private property developers. This could put downwards pressure on the product mix, due to budget constraints of low-rent housing projects.
Coming half may be a demanding one
Machinery | China Yankun Hou
16 December 2010 Nomura 16
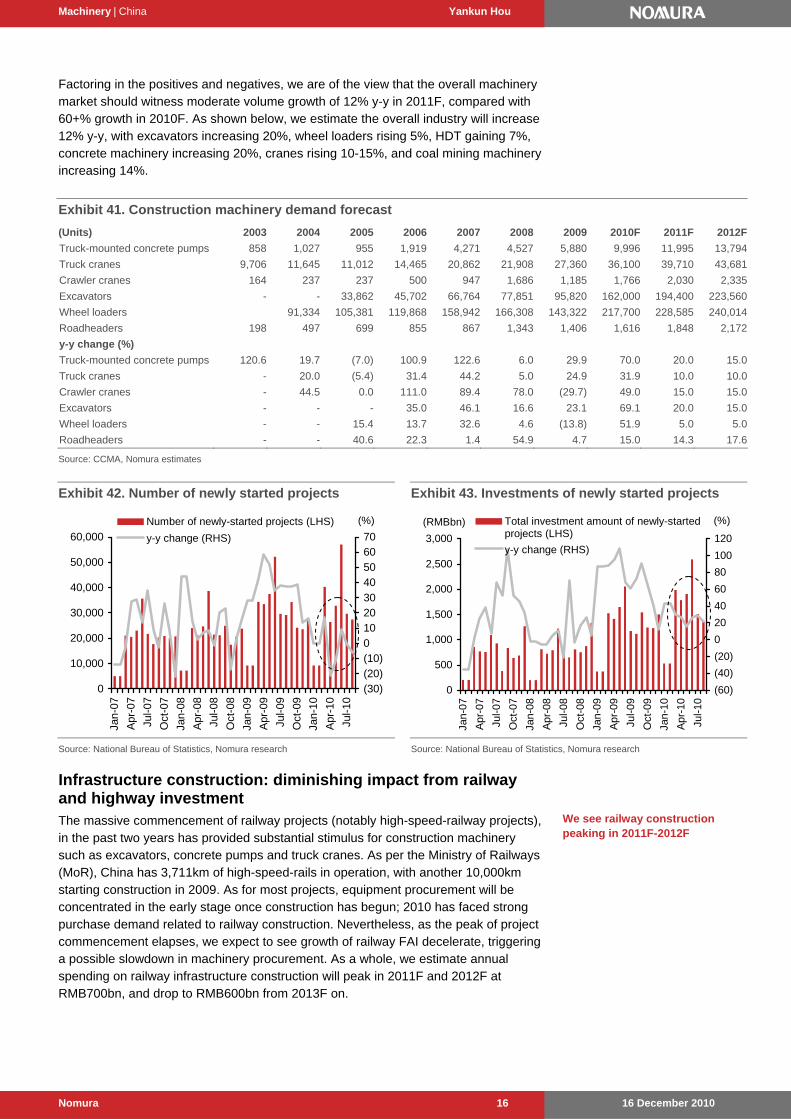
Factoring in the positives and negatives, we are of the view that the overall machinery market should witness moderate volume growth of 12% y-y in 2011F, compared with 60+% growth in 2010F. As shown below, we estimate the overall industry will increase 12% y-y, with excavators increasing 20%, wheel loaders rising 5%, HDT gaining 7%, concrete machinery increasing 20%, cranes rising 10-15%, and coal mining machinery increasing 14%.
Exhibit 41. Construction machinery demand forecast
(Units) 2003 2004 2005 2006 2007 2008 2009 2010F 2011F 2012F
Truck-mounted concrete pumps 858 1,027 955 1,919 4,271 4,527 5,880 9,996 11,995 13,794
Truck cranes 9,706 11,645 11,012 14,465 20,862 21,908 27,360 36,100 39,710 43,681
Crawler cranes 164 237 237 500 947 1,686 1,185 1,766 2,030 2,335
Excavators - - 33,862 45,702 66,764 77,851 95,820 162,000 194,400 223,560
Wheel loaders 91,334 105,381 119,868 158,942 166,308 143,322 217,700 228,585 240,014
Roadheaders 198 497 699 855 867 1,343 1,406 1,616 1,848 2,172
y-y change (%)
Truck-mounted concrete pumps 120.6 19.7 (7.0) 100.9 122.6 6.0 29.9 70.0 20.0 15.0
Truck cranes - 20.0 (5.4) 31.4 44.2 5.0 24.9 31.9 10.0 10.0
Crawler cranes - 44.5 0.0 111.0 89.4 78.0 (29.7) 49.0 15.0 15.0
Excavators - - - 35.0 46.1 16.6 23.1 69.1 20.0 15.0
Wheel loaders - - 15.4 13.7 32.6 4.6 (13.8) 51.9 5.0 5.0
Roadheaders - - 40.6 22.3 1.4 54.9 4.7 15.0 14.3 17.6
Source: CCMA, Nomura estimates
Exhibit 42. Number of newly started projects
0
10,000
20,000
30,000
40,000
50,000
60,000
Jan-
07
Apr
-07
Jul-0
7
Oct
-07
Jan-
08
Apr
-08
Jul-0
8
Oct
-08
Jan-
09
Apr
-09
Jul-0
9
Oct
-09
Jan-
10
Apr
-10
Jul-1
0
(30)(20)(10)010203040506070
Number of newly-started projects (LHS)
y-y change (RHS)
(%)
Source: National Bureau of Statistics, Nomura research
Exhibit 43. Investments of newly started projects
0
500
1,000
1,500
2,000
2,500
3,000
Jan-
07
Apr
-07
Jul-0
7
Oct
-07
Jan-
08
Apr
-08
Jul-0
8
Oct
-08
Jan-
09
Apr
-09
Jul-0
9
Oct
-09
Jan-
10
Apr
-10
Jul-1
0
(RMBbn)
(60)
(40)
(20)
0
20
40
60
80
100
120
Total investment amount of newly-startedprojects (LHS)
y-y change (RHS)
(%)
Source: National Bureau of Statistics, Nomura research
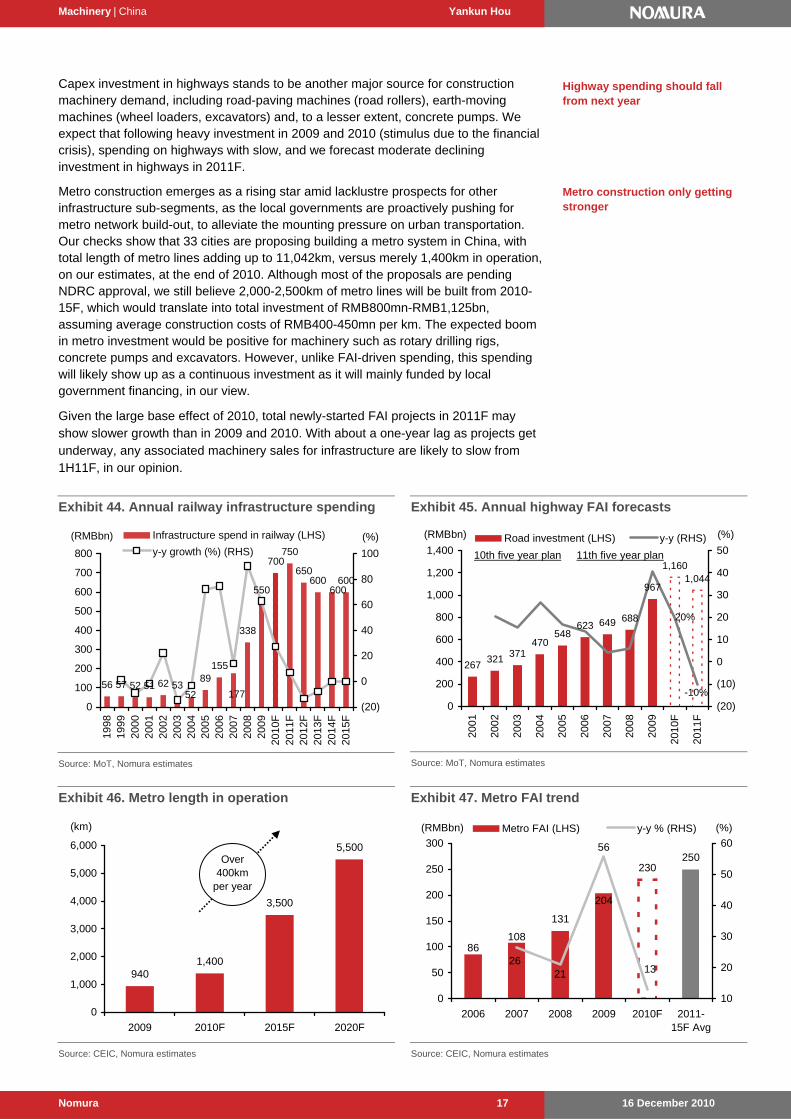
Infrastructure construction: diminishing impact from railway and highway investment The massive commencement of railway projects (notably high-speed-railway projects), in the past two years has provided substantial stimulus for construction machinery such as excavators, concrete pumps and truck cranes. As per the Ministry of Railways (MoR), China has 3,711km of high-speed-rails in operation, with another 10,000km starting construction in 2009. As for most projects, equipment procurement will be concentrated in the early stage once construction has begun; 2010 has faced strong purchase demand related to railway construction. Nevertheless, as the peak of project commencement elapses, we expect to see growth of railway FAI decelerate, triggering a possible slowdown in machinery procurement. As a whole, we estimate annual spending on railway infrastructure construction will peak in 2011F and 2012F at RMB700bn, and drop to RMB600bn from 2013F on.
We see railway construction peaking in 2011F-2012F
Machinery | China Yankun Hou
16 December 2010 Nomura 17
Capex investment in highways stands to be another major source for construction machinery demand, including road-paving machines (road rollers), earth-moving machines (wheel loaders, excavators) and, to a lesser extent, concrete pumps. We expect that following heavy investment in 2009 and 2010 (stimulus due to the financial crisis), spending on highways with slow, and we forecast moderate declining investment in highways in 2011F.
Metro construction emerges as a rising star amid lacklustre prospects for other infrastructure sub-segments, as the local governments are proactively pushing for metro network build-out, to alleviate the mounting pressure on urban transportation. Our checks show that 33 cities are proposing building a metro system in China, with total length of metro lines adding up to 11,042km, versus merely 1,400km in operation, on our estimates, at the end of 2010. Although most of the proposals are pending NDRC approval, we still believe 2,000-2,500km of metro lines will be built from 2010-15F, which would translate into total investment of RMB800mn-RMB1,125bn, assuming average construction costs of RMB400-450mn per km. The expected boom in metro investment would be positive for machinery such as rotary drilling rigs, concrete pumps and excavators. However, unlike FAI-driven spending, this spending will likely show up as a continuous investment as it will mainly funded by local government financing, in our view.
Given the large base effect of 2010, total newly-started FAI projects in 2011F may show slower growth than in 2009 and 2010. With about a one-year lag as projects get underway, any associated machinery sales for infrastructure are likely to slow from 1H11F, in our opinion.
Exhibit 44. Annual railway infrastructure spending
56 57 52 51 62 5389
155
338
550
700750
650600 600
52 177
600
0
100
200
300
400
500
600
700
800
1998
1999
2000
2001
2002
2003
2004
2005
2006
2007
2008
2009
201
0F20
11F
201
2F20
13F
201
4F20
15F
(RMBbn)
(20)
0
20
40
60
80
100
Infrastructure spend in railway (LHS)
y-y growth (%) (RHS)(%)
Source: MoT, Nomura estimates
Exhibit 45. Annual highway FAI forecasts
267321 371
470548
623 649 688
967
1,1601,044
20%
-10%0
200
400
600
800
1,000
1,200
1,400
2001
2002
2003
2004
2005
2006
2007
2008
2009
2010
F
2011
F(20)
(10)
0
10
20
30
40
50Road investment (LHS) y-y (RHS)(RMBbn) (%)
10th five year plan 11th five year plan
Source: MoT, Nomura estimates
Exhibit 46. Metro length in operation
9401,400
3,500
5,500
0
1,000
2,000
3,000
4,000
5,000
6,000
2009 2010F 2015F 2020F
(km)
Over 400km
per year
Source: CEIC, Nomura estimates
Exhibit 47. Metro FAI trend
131
230250
204
10886
13
56
2126
0
50
100
150
200
250
300
2006 2007 2008 2009 2010F 2011-15F Avg
10
20
30
40
50
60Metro FAI (LHS) y-y % (RHS) (%)(RMBbn)
Source: CEIC, Nomura estimates
Highway spending should fall from next year
Metro construction only getting stronger
Machinery | China Yankun Hou
16 December 2010 Nomura 18
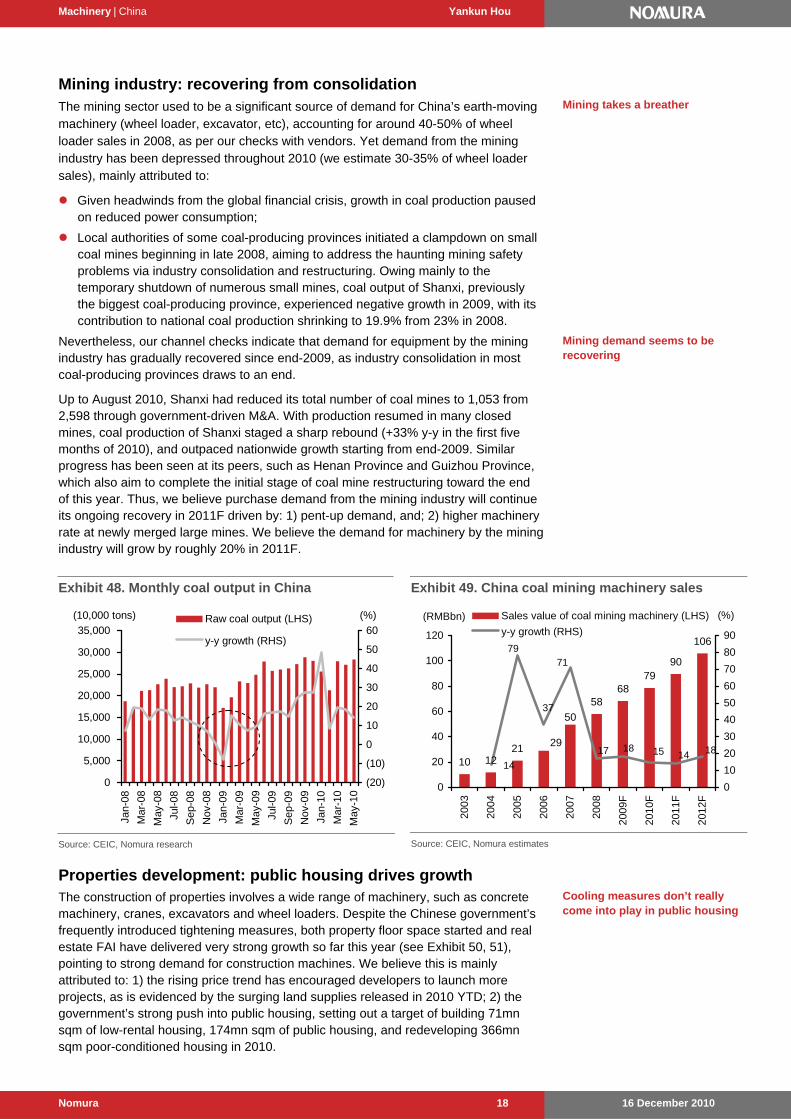
Mining industry: recovering from consolidation The mining sector used to be a significant source of demand for China’s earth-moving machinery (wheel loader, excavator, etc), accounting for around 40-50% of wheel loader sales in 2008, as per our checks with vendors. Yet demand from the mining industry has been depressed throughout 2010 (we estimate 30-35% of wheel loader sales), mainly attributed to:
Given headwinds from the global financial crisis, growth in coal production paused on reduced power consumption;
Local authorities of some coal-producing provinces initiated a clampdown on small coal mines beginning in late 2008, aiming to address the haunting mining safety problems via industry consolidation and restructuring. Owing mainly to the temporary shutdown of numerous small mines, coal output of Shanxi, previously the biggest coal-producing province, experienced negative growth in 2009, with its contribution to national coal production shrinking to 19.9% from 23% in 2008.
Nevertheless, our channel checks indicate that demand for equipment by the mining industry has gradually recovered since end-2009, as industry consolidation in most coal-producing provinces draws to an end.
Up to August 2010, Shanxi had reduced its total number of coal mines to 1,053 from 2,598 through government-driven M&A. With production resumed in many closed mines, coal production of Shanxi staged a sharp rebound (+33% y-y in the first five months of 2010), and outpaced nationwide growth starting from end-2009. Similar progress has been seen at its peers, such as Henan Province and Guizhou Province, which also aim to complete the initial stage of coal mine restructuring toward the end of this year. Thus, we believe purchase demand from the mining industry will continue its ongoing recovery in 2011F driven by: 1) pent-up demand, and; 2) higher machinery rate at newly merged large mines. We believe the demand for machinery by the mining industry will grow by roughly 20% in 2011F.
Exhibit 48. Monthly coal output in China
0
5,000
10,000
15,000
20,000
25,000
30,000
35,000
Jan-
08
Mar
-08
May
-08
Jul-0
8
Sep
-08
Nov
-08
Jan-
09
Mar
-09
May
-09
Jul-0
9
Sep
-09
Nov
-09
Jan-
10
Mar
-10
May
-10
(20)
(10)
0 %
10
20
30
40
50
60 Raw coal output (LHS)
y-y growth (RHS)
(10,000 tons) (%)
Source: CEIC, Nomura research
Exhibit 49. China coal mining machinery sales
10 1221
5868
7990
106
29
50
18141518
14
79
37
71
17
0
20
40
60
80
100
120
2003
2004
2005
2006
2007
2008
2009
F
2010
F
2011
F
2012
F
(RMBbn)
0
10
20
30
40
50
60
70
80
90
Sales value of coal mining machinery (LHS)
y-y growth (RHS)
(%)
Source: CEIC, Nomura estimates
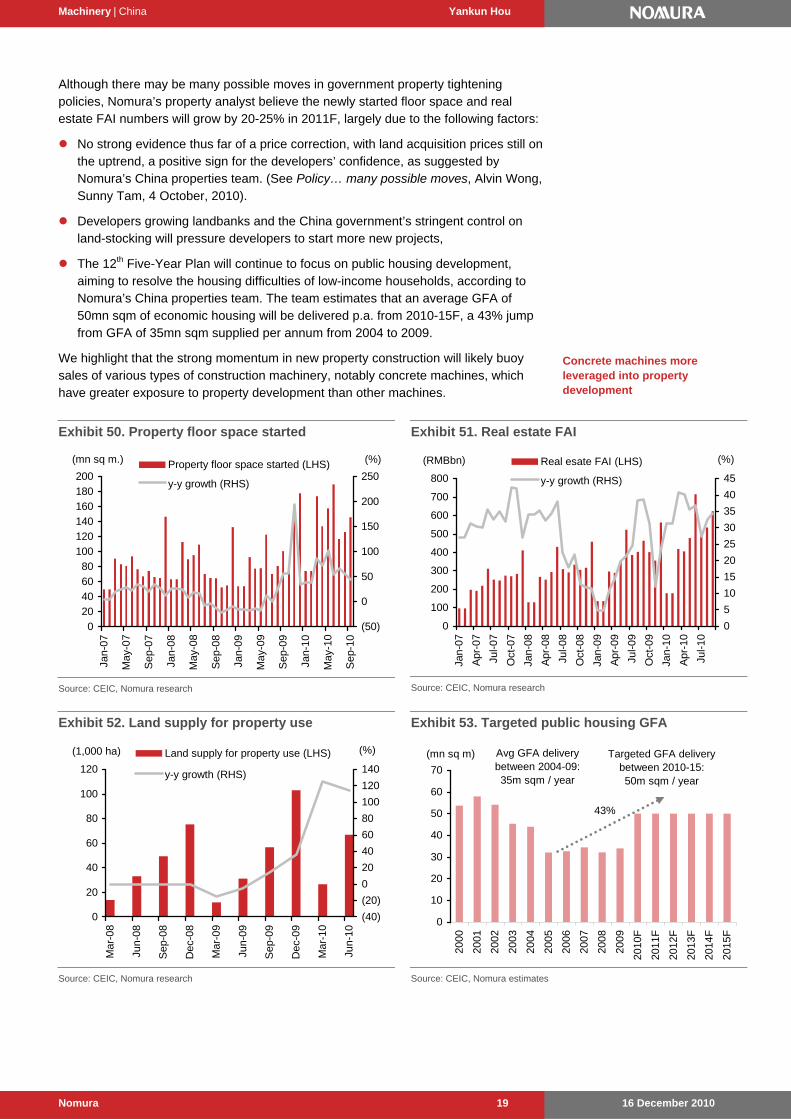
Properties development: public housing drives growth The construction of properties involves a wide range of machinery, such as concrete machinery, cranes, excavators and wheel loaders. Despite the Chinese government’s frequently introduced tightening measures, both property floor space started and real estate FAI have delivered very strong growth so far this year (see Exhibit 50, 51), pointing to strong demand for construction machines. We believe this is mainly attributed to: 1) the rising price trend has encouraged developers to launch more projects, as is evidenced by the surging land supplies released in 2010 YTD; 2) the government’s strong push into public housing, setting out a target of building 71mn sqm of low-rental housing, 174mn sqm of public housing, and redeveloping 366mn sqm poor-conditioned housing in 2010.
Mining takes a breather
Mining demand seems to be recovering
Cooling measures don’t really come into play in public housing
Machinery | China Yankun Hou
16 December 2010 Nomura 19
Although there may be many possible moves in government property tightening policies, Nomura’s property analyst believe the newly started floor space and real estate FAI numbers will grow by 20-25% in 2011F, largely due to the following factors:
No strong evidence thus far of a price correction, with land acquisition prices still on the uptrend, a positive sign for the developers’ confidence, as suggested by Nomura’s China properties team. (See Policy… many possible moves, Alvin Wong, Sunny Tam, 4 October, 2010).
Developers growing landbanks and the China government’s stringent control on land-stocking will pressure developers to start more new projects,
The 12th Five-Year Plan will continue to focus on public housing development, aiming to resolve the housing difficulties of low-income households, according to Nomura’s China properties team. The team estimates that an average GFA of 50mn sqm of economic housing will be delivered p.a. from 2010-15F, a 43% jump from GFA of 35mn sqm supplied per annum from 2004 to 2009.
We highlight that the strong momentum in new property construction will likely buoy sales of various types of construction machinery, notably concrete machines, which have greater exposure to property development than other machines.
Exhibit 50. Property floor space started
0
20
40
60
80
100
120
140
160
180
200
Jan-
07
May
-07
Sep
-07
Jan-
08
May
-08
Sep
-08
Jan-
09
May
-09
Sep
-09
Jan-
10
May
-10
Sep
-10
(50)
0
50
100
150
200
250Property floor space started (LHS)
y-y growth (RHS)
(mn sq m.) (%)
Source: CEIC, Nomura research
Exhibit 51. Real estate FAI
0
100
200
300
400
500
600
700
800
Jan-
07
Apr
-07
Jul-0
7
Oct
-07
Jan-
08
Apr
-08
Jul-0
8
Oct
-08
Jan-
09
Apr
-09
Jul-0
9
Oct
-09
Jan-
10
Apr
-10
Jul-1
0
(RMBbn)
0
5
10
15
20
25
30
35
40
45
Real esate FAI (LHS)
y-y growth (RHS)
(%)
Source: CEIC, Nomura research
Exhibit 52. Land supply for property use
0
20
40
60
80
100
120
Mar
-08
Jun-
08
Sep
-08
Dec
-08
Mar
-09
Jun-
09
Sep
-09
Dec
-09
Mar
-10
Jun-
10
(1,000 ha)
(40)
(20)
0
20
40
60
80
100
120
140
Land supply for property use (LHS)
y-y growth (RHS)
(%)
Source: CEIC, Nomura research
Exhibit 53. Targeted public housing GFA
0
10
20
30
40
50
60
70
2000
2001
2002
2003
2004
2005
2006
2007
2008
2009
2010
F
2011
F
2012
F
2013
F
2014
F
2015
F
Avg GFA delivery between 2004-09:35m sqm / year
Targeted GFA delivery between 2010-15: 50m sqm / year
(mn sq m)
43%
Source: CEIC, Nomura estimates
Concrete machines more leveraged into property development
Machinery | China Yankun Hou
16 December 2010 Nomura 20
Long-term drivers
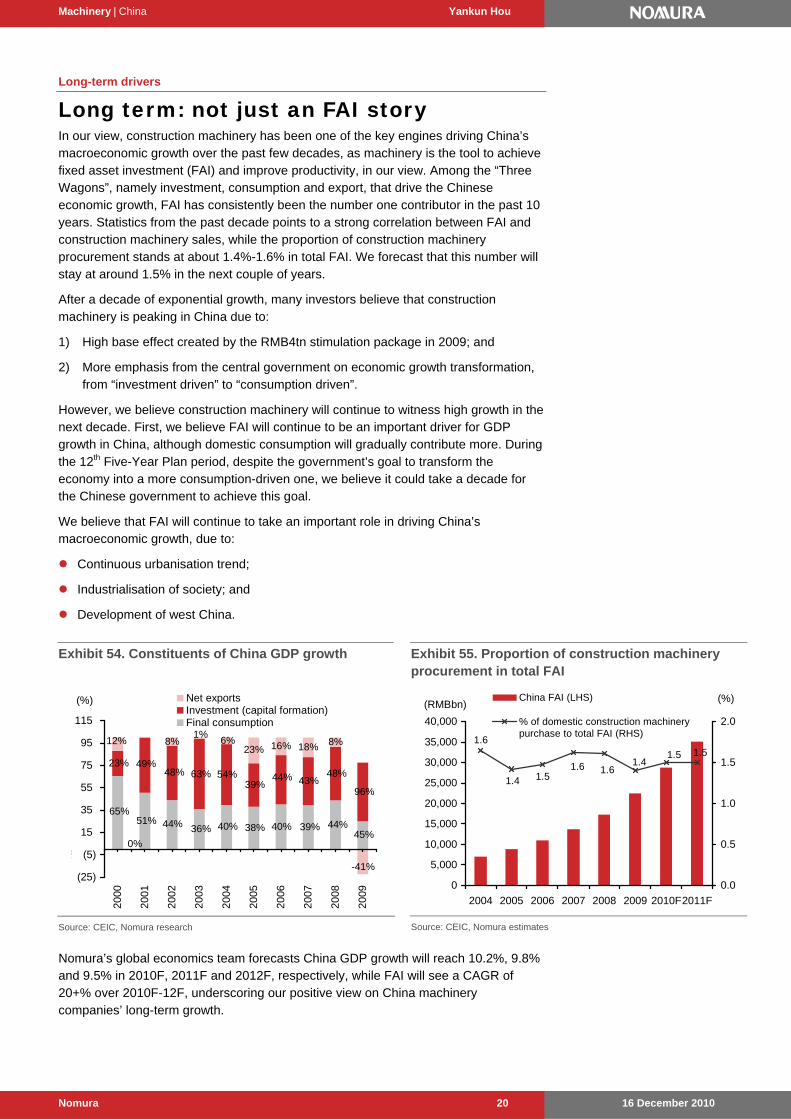
Long term: not just an FAI story In our view, construction machinery has been one of the key engines driving China’s macroeconomic growth over the past few decades, as machinery is the tool to achieve fixed asset investment (FAI) and improve productivity, in our view. Among the “Three Wagons”, namely investment, consumption and export, that drive the Chinese economic growth, FAI has consistently been the number one contributor in the past 10 years. Statistics from the past decade points to a strong correlation between FAI and construction machinery sales, while the proportion of construction machinery procurement stands at about 1.4%-1.6% in total FAI. We forecast that this number will stay at around 1.5% in the next couple of years.
After a decade of exponential growth, many investors believe that construction machinery is peaking in China due to:
1) High base effect created by the RMB4tn stimulation package in 2009; and
2) More emphasis from the central government on economic growth transformation, from “investment driven” to “consumption driven”.
However, we believe construction machinery will continue to witness high growth in the next decade. First, we believe FAI will continue to be an important driver for GDP growth in China, although domestic consumption will gradually contribute more. During the 12th Five-Year Plan period, despite the government’s goal to transform the economy into a more consumption-driven one, we believe it could take a decade for the Chinese government to achieve this goal.
We believe that FAI will continue to take an important role in driving China’s macroeconomic growth, due to:
Continuous urbanisation trend;
Industrialisation of society; and
Development of west China.
Exhibit 54. Constituents of China GDP growth
8% 16% 18% 8%
44%51%65%
36% 40% 38% 40% 39% 44%45%
54%39%
44% 43%48%
96%
63%48%49%23%
12%
-41%
0%
1%6%
23%
(25)
% (5)
15
35
55
75
95
115
2000
2001
2002
2003
2004
2005
2006
2007
2008
2009
Net exportsInvestment (capital formation)Final consumption
(%)
Source: CEIC, Nomura research
Exhibit 55. Proportion of construction machinery procurement in total FAI
1.6
1.4 1.51.6 1.6
1.41.5 1.5
0
5,000
10,000
15,000
20,000
25,000
30,000
35,000
40,000
2004 2005 2006 2007 2008 2009 2010F2011F
0.0
0.5
1.0
1.5
2.0
China FAI (LHS)
% of domestic construction machinerypurchase to total FAI (RHS)
(RMBbn)(%)
Source: CEIC, Nomura estimates
Nomura’s global economics team forecasts China GDP growth will reach 10.2%, 9.8% and 9.5% in 2010F, 2011F and 2012F, respectively, while FAI will see a CAGR of 20+% over 2010F-12F, underscoring our positive view on China machinery companies’ long-term growth.
Machinery | China Yankun Hou
16 December 2010 Nomura 21
Besides, we believe the following factors will continue to lift future demand:
Replacement demand. After a decade of exponential growth seen in construction machinery companies, total ownership has substantially increased to provide a strong base for future demand.
Improving mechanisation rates. With China continuing to pursue industrialisation, high productivity and efficiency, more machinery will be needed. Rising labour costs and stricter safety requirements will also push up the mechanisation rate.
Upgrading product mix. With increasingly stringent environmental and safety requirements, more and more new technologies are introduced into machinery, which will drive up revenue even if unit sales stay flat, in our view
Export growth potential.
In conclusion, we believe Chinese construction machinery companies have started to enter a “stable growth decade” after experiencing an “exponential growth decade”.
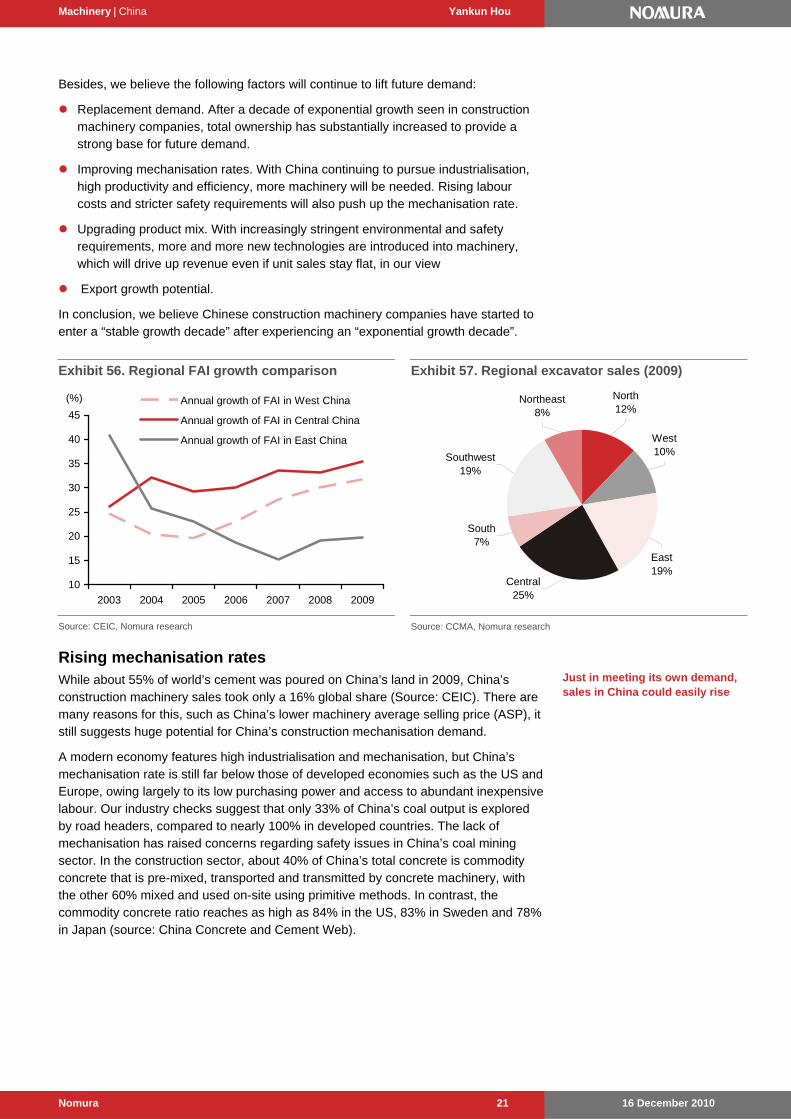
Exhibit 56. Regional FAI growth comparison
10
15
20
25
30
35
40
45
2003 2004 2005 2006 2007 2008 2009
Annual growth of FAI in West China
Annual growth of FAI in Central China
Annual growth of FAI in East China
(%)
Source: CEIC, Nomura research
Exhibit 57. Regional excavator sales (2009)
Southwest19%
South7%
Central25%
East19%
West10%
North12%
Northeast8%
Source: CCMA, Nomura research
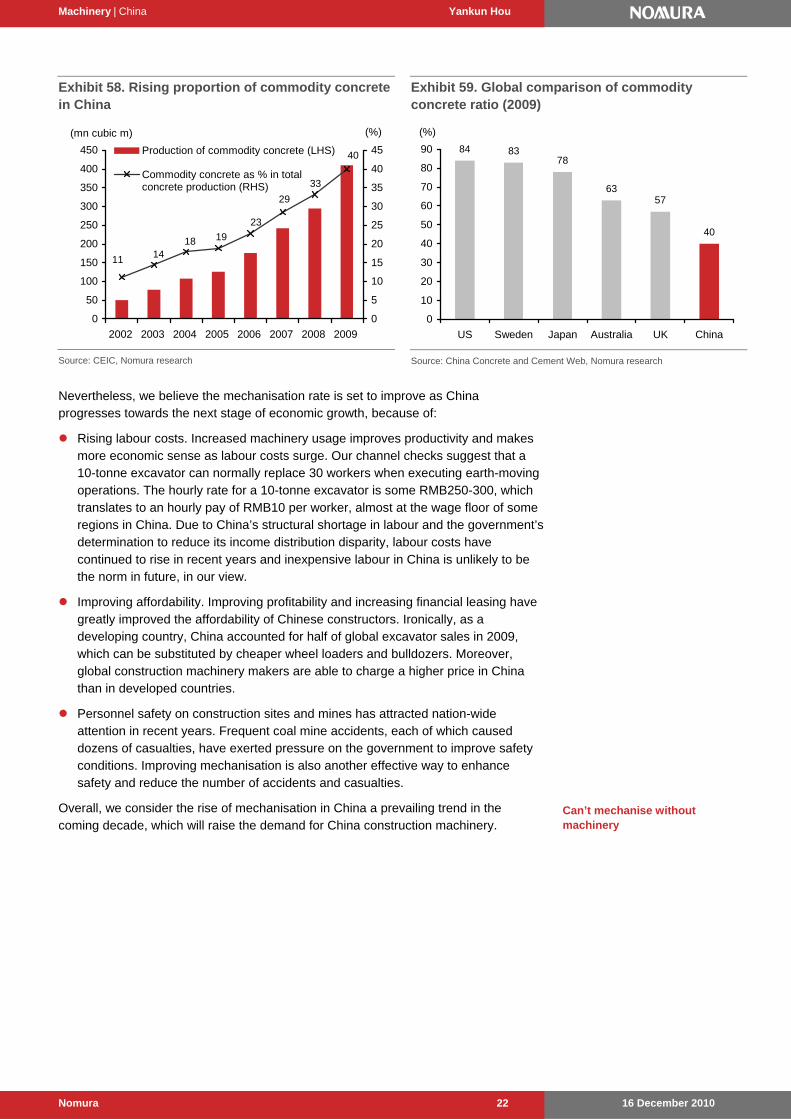
Rising mechanisation rates While about 55% of world’s cement was poured on China’s land in 2009, China’s construction machinery sales took only a 16% global share (Source: CEIC). There are many reasons for this, such as China’s lower machinery average selling price (ASP), it still suggests huge potential for China’s construction mechanisation demand.
A modern economy features high industrialisation and mechanisation, but China’s mechanisation rate is still far below those of developed economies such as the US and Europe, owing largely to its low purchasing power and access to abundant inexpensive labour. Our industry checks suggest that only 33% of China’s coal output is explored by road headers, compared to nearly 100% in developed countries. The lack of mechanisation has raised concerns regarding safety issues in China’s coal mining sector. In the construction sector, about 40% of China’s total concrete is commodity concrete that is pre-mixed, transported and transmitted by concrete machinery, with the other 60% mixed and used on-site using primitive methods. In contrast, the commodity concrete ratio reaches as high as 84% in the US, 83% in Sweden and 78% in Japan (source: China Concrete and Cement Web).
Just in meeting its own demand, sales in China could easily rise
Machinery | China Yankun Hou
16 December 2010 Nomura 22
Exhibit 58. Rising proportion of commodity concrete in China
40
33
29
23
19181411
0
50
100
150
200
250
300
350
400
450
2002 2003 2004 2005 2006 2007 2008 2009
(mn cubic m)
0
5
10
15
20
25
30
35
40
45Production of commodity concrete (LHS)
Commodity concrete as % in totalconcrete production (RHS)
(%)
Source: CEIC, Nomura research
Exhibit 59. Global comparison of commodity concrete ratio (2009)
40
5763
788384
0
10
20
30
40
50
60
70
80
90
US Sweden Japan Australia UK China
(%)
Source: China Concrete and Cement Web, Nomura research
Nevertheless, we believe the mechanisation rate is set to improve as China progresses towards the next stage of economic growth, because of:
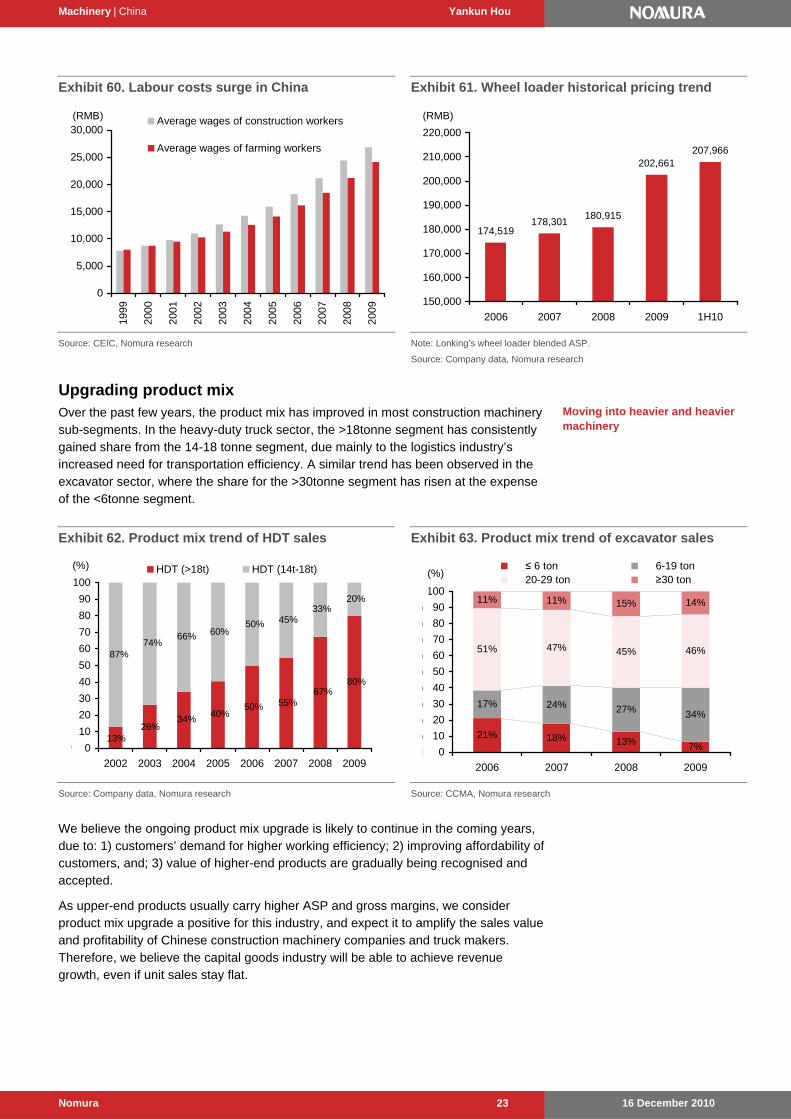
Rising labour costs. Increased machinery usage improves productivity and makes more economic sense as labour costs surge. Our channel checks suggest that a 10-tonne excavator can normally replace 30 workers when executing earth-moving operations. The hourly rate for a 10-tonne excavator is some RMB250-300, which translates to an hourly pay of RMB10 per worker, almost at the wage floor of some regions in China. Due to China’s structural shortage in labour and the government’s determination to reduce its income distribution disparity, labour costs have continued to rise in recent years and inexpensive labour in China is unlikely to be the norm in future, in our view.
Improving affordability. Improving profitability and increasing financial leasing have greatly improved the affordability of Chinese constructors. Ironically, as a developing country, China accounted for half of global excavator sales in 2009, which can be substituted by cheaper wheel loaders and bulldozers. Moreover, global construction machinery makers are able to charge a higher price in China than in developed countries.
Personnel safety on construction sites and mines has attracted nation-wide attention in recent years. Frequent coal mine accidents, each of which caused dozens of casualties, have exerted pressure on the government to improve safety conditions. Improving mechanisation is also another effective way to enhance safety and reduce the number of accidents and casualties.
Overall, we consider the rise of mechanisation in China a prevailing trend in the coming decade, which will raise the demand for China construction machinery.
Can’t mechanise without machinery
Machinery | China Yankun Hou
16 December 2010 Nomura 23
Exhibit 60. Labour costs surge in China
0
5,000
10,000
15,000
20,000
25,000
30,00019
99
2000
2001
2002
2003
2004
2005
2006
2007
2008
2009
(RMB) Average wages of construction workers
Average wages of farming workers
Source: CEIC, Nomura research
Exhibit 61. Wheel loader historical pricing trend
174,519178,301
180,915
202,661207,966
150,000
160,000
170,000
180,000
190,000
200,000
210,000
220,000
2006 2007 2008 2009 1H10
(RMB)
Note: Lonking’s wheel loader blended ASP.
Source: Company data, Nomura research
Upgrading product mix Over the past few years, the product mix has improved in most construction machinery sub-segments. In the heavy-duty truck sector, the >18tonne segment has consistently gained share from the 14-18 tonne segment, due mainly to the logistics industry’s increased need for transportation efficiency. A similar trend has been observed in the excavator sector, where the share for the >30tonne segment has risen at the expense of the <6tonne segment.
Exhibit 62. Product mix trend of HDT sales
80%67%
55%50%40%
34%26%
13%
20%33%
45%50%60%66%
74%87%
% 0
10
20
30
40
50
60
70
80
90
100
2002 2003 2004 2005 2006 2007 2008 2009
HDT (>18t) HDT (14t-18t)(%)
Source: Company data, Nomura research
Exhibit 63. Product mix trend of excavator sales
21% 18% 13% 7%
17% 24% 27% 34%
51% 47% 45% 46%
11% 11% 15% 14%
% 0
% 10
% 20
% 30
% 40
% 50
% 60
% 70
% 80
% 90
100
2006 2007 2008 2009
≤ 6 ton 6-19 ton 20-29 ton ≥30 ton
(%)
Source: CCMA, Nomura research
We believe the ongoing product mix upgrade is likely to continue in the coming years, due to: 1) customers’ demand for higher working efficiency; 2) improving affordability of customers, and; 3) value of higher-end products are gradually being recognised and accepted.
As upper-end products usually carry higher ASP and gross margins, we consider product mix upgrade a positive for this industry, and expect it to amplify the sales value and profitability of Chinese construction machinery companies and truck makers. Therefore, we believe the capital goods industry will be able to achieve revenue growth, even if unit sales stay flat.
Moving into heavier and heavier machinery
Machinery | China Yankun Hou
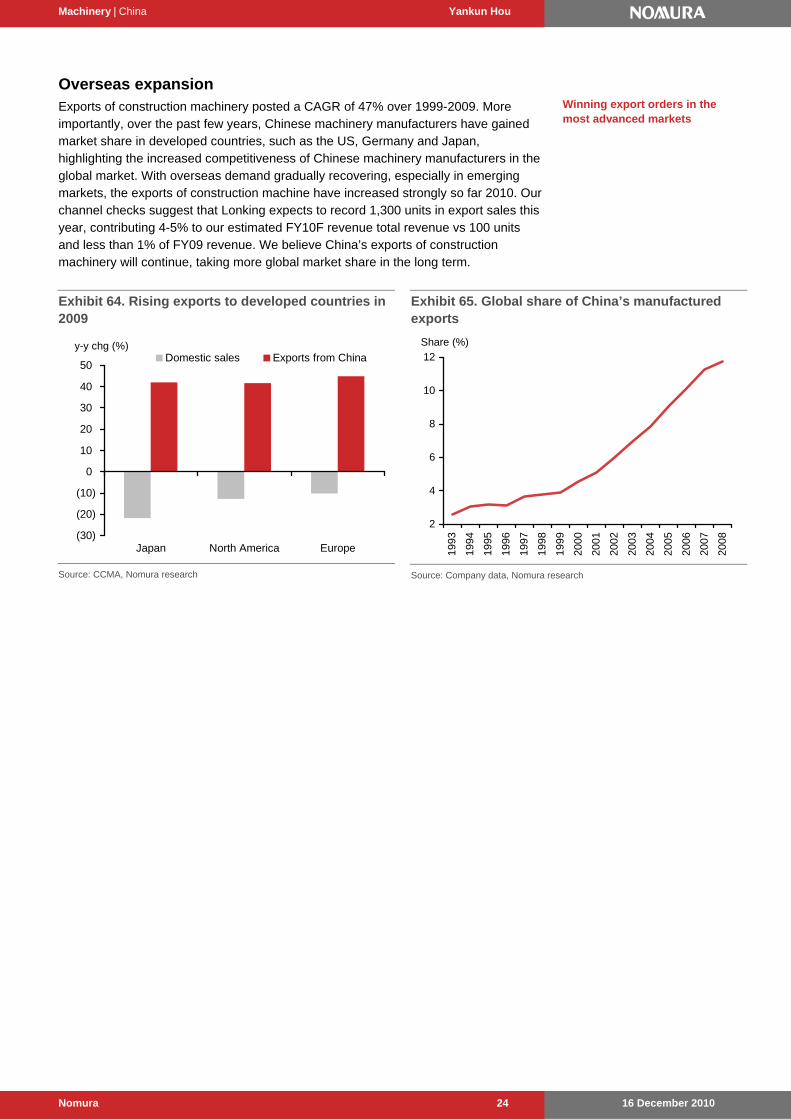
16 December 2010 Nomura 24
Overseas expansion Exports of construction machinery posted a CAGR of 47% over 1999-2009. More importantly, over the past few years, Chinese machinery manufacturers have gained market share in developed countries, such as the US, Germany and Japan, highlighting the increased competitiveness of Chinese machinery manufacturers in the global market. With overseas demand gradually recovering, especially in emerging markets, the exports of construction machine have increased strongly so far 2010. Our channel checks suggest that Lonking expects to record 1,300 units in export sales this year, contributing 4-5% to our estimated FY10F revenue total revenue vs 100 units and less than 1% of FY09 revenue. We believe China’s exports of construction machinery will continue, taking more global market share in the long term.
Exhibit 64. Rising exports to developed countries in 2009
(30)
(20)
(10)
0
10
20
30
40
50
Japan North America Europe
Domestic sales Exports from China y-y chg (%)
Source: CCMA, Nomura research
Exhibit 65. Global share of China’s manufactured exports
2
4
6
8
10
12
1993
1994
1995
1996
1997
1998
1999
2000
2001
2002
2003
2004
2005
2006
2007
2008
Share (%)
Source: Company data, Nomura research
Winning export orders in the most advanced markets
Machinery | China Yankun Hou
16 December 2010 Nomura 25
Segment insights
Excavators: digging gold China’s economic growth plays an important role in shaping the world’s economic recovery. Likewise, China is gaining importance in the global hydraulic excavator market, accounting for about 50% of global demand currently, according to Komatsu. The RMB4tn stimulus package from the Chinese central government, alongside public infrastructure expenses, has driven demand for hydraulic excavators since 2009. The excavator market grew 23% in 2009 and so far in 2010, has risen 69%, on our estimates. From the number of retained excavators for developed countries and China, and considering the shift of demand from wheel loaders to excavators, we think growth of 20% is possible in 2011F.
Excavators comprise the only field where foreign players still maintain a dominant position in the Chinese construction machinery segment, because of high technical barriers of key components and rigorous requirements for product reliability and durability. So far in 2010, Chinese excavator makers have commanded a combined market share of about 25%. At present, both global and local excavator manufacturers are rushing to increase their manufacturing capacity, but the procurement of hydraulic components could limit their growth potential in 2011F. Therefore, we believe components makers, with a high technology advantage, could be the major beneficiaries from the strong growth of China’s excavator market and rising number of Chinese excavator makers.
China accounted for 50% of global excavator demand in 9M10 The global excavator market bottomed in July-Sept 2009, but has since rebounded. Emerging markets saw a stronger and quicker recovery vs that in developing countries, driven by replacement demand.
In terms of quarterly demand for crawler hydraulic excavators, wheel hydraulic excavators, bulldozers, wheel loaders, dump trucks, articulated dump truck and motor grade — the seven major catagories of construction machinery — both the US and Europe saw a trough in July-Sept 2009, fetching only 6,200 units and 5,600 units, according to Komatsu. However, this has started to recover gradually in the US and Europe.
Meanwhile, China is taking an increased global share in the demand for construction machinery. In 2001, China’s demand for the seven construction machinery was less than 10% of worldwide demand. In 9M10, the proportion increased to about 40%. Europe and America saw their combined share drop from slightly less than 60% to 20% during the same period. For hydraulic excavators, China’s demand accounted for slightly more than 10% of global share in 2001, and rose to about 50% in 9M10.
Demand from Asia ex China and Latin America is also growing. Resource-related demand, such as mining and forestry, is rising, but interestingly China tends to be the final consumer. We expect emerging markets, such as China, Southeast Asia and Latin America, to be the driving force for world demand. We also expect developing countries to recover from significantly low levels on replacement demand.
See 20% growth in China excavator market next year …
… Foreign players dominate
Broad machinery demand recovering

Machinery | China Yankun Hou
16 December 2010 Nomura 26
Exhibit 66. Global market share trend of major 7 construction machinery
0
60
120
180
240
300
360
420
82 84 86 88 90 92 94 96 98 00 02 04 06 08 10F 12F
North America
Emerging countries (other than China)
Japan
Europe
China
Others
(k unit)
(FY)
World demand (major 7 construction machinery) F
0%
20%
40%
60%
80%
World Demand Composition
Emerging countries(other than China)
North America
China
150
200
250
300
350
400
450
CRB Index (LHS, US$ base)
(1967=100)
Note: Major 7 construction machinery includes crawler hydraulic excavators, wheel hydraulic excavators, Bulldozer, Wheel loader, Dump truck, Articulated dump truck, motor grader. Source: Komatsu, Nomura estimates
Competitive landscape in China Komatsu overtook Doosan as the number-one excavator player in China in 2010, despite seeing a slight decline in market share (a 14.3% market share in 2010 YTD; competitors Hyundai Heavy and Doosan lost market share slightly during the same period). Meanwhile, Kobelco and Volvo have emerged as the best performers among foreign vendors, gaining 0.9% and 1.2% market share, respectively (Source: CCMA). SANY Heavy has been significantly gaining market share over the past few years on extensive product launches, aggressive marketing strategy and improving product quality. So far in 2010, SANY has commanded a market share of about 7.5%; it targets a 10% market share in 2011.
Over the past four years, the product mix has improved in China with large tonnage excavators taking more market share. The market structure breakdown by segment suggests that the three groups of players (first-tier players, Korean players and major local players) have varying weights in different tonnage segments. The Chinese players tend to have a greater edge in small-mid tonnage segments, with a 32% share in the 0-6t segment and a 35% share in the 6-20t segment. Meanwhile, the first-tier players tend to be more focused on the mid-large tonnage segment, capturing a 47% share in 20-30t and a 68% share in the >30t segment. The Korean vendors, on the other hand, have larger presences in the smallest-tonnage segment (0-6t) and the middle-tonnage segment (20-30t).
SANY Heavy looking at a 10% market share at home by end-2011F
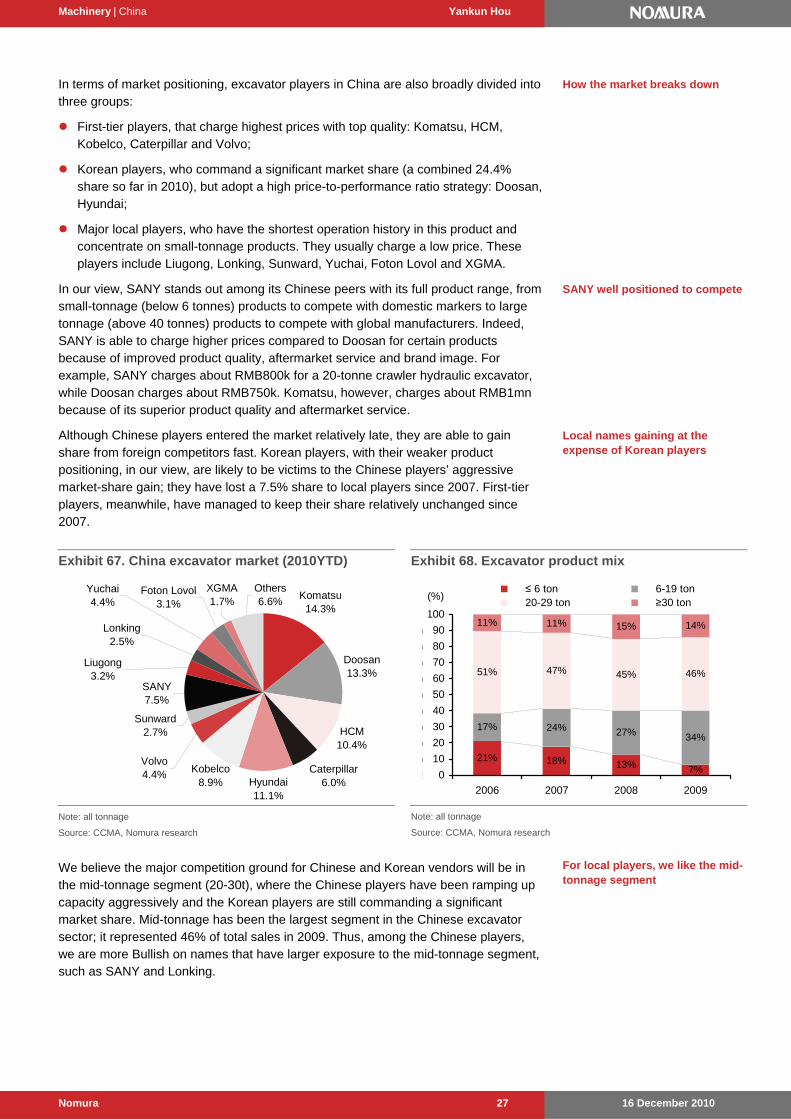
Machinery | China Yankun Hou
16 December 2010 Nomura 27
In terms of market positioning, excavator players in China are also broadly divided into three groups:
First-tier players, that charge highest prices with top quality: Komatsu, HCM, Kobelco, Caterpillar and Volvo;
Korean players, who command a significant market share (a combined 24.4% share so far in 2010), but adopt a high price-to-performance ratio strategy: Doosan, Hyundai;
Major local players, who have the shortest operation history in this product and concentrate on small-tonnage products. They usually charge a low price. These players include Liugong, Lonking, Sunward, Yuchai, Foton Lovol and XGMA.
In our view, SANY stands out among its Chinese peers with its full product range, from small-tonnage (below 6 tonnes) products to compete with domestic markers to large tonnage (above 40 tonnes) products to compete with global manufacturers. Indeed, SANY is able to charge higher prices compared to Doosan for certain products because of improved product quality, aftermarket service and brand image. For example, SANY charges about RMB800k for a 20-tonne crawler hydraulic excavator, while Doosan charges about RMB750k. Komatsu, however, charges about RMB1mn because of its superior product quality and aftermarket service.
Although Chinese players entered the market relatively late, they are able to gain share from foreign competitors fast. Korean players, with their weaker product positioning, in our view, are likely to be victims to the Chinese players’ aggressive market-share gain; they have lost a 7.5% share to local players since 2007. First-tier players, meanwhile, have managed to keep their share relatively unchanged since 2007.
Exhibit 67. China excavator market (2010YTD)
Komatsu14.3%
Doosan13.3%
HCM10.4%
Caterpillar6.0%Hyundai
11.1%
Sunward2.7%
SANY7.5%
Volvo4.4%
Foton Lovol3.1%
XGMA1.7%
Others6.6%
Yuchai4.4%
Lonking2.5%
Liugong3.2%
Kobelco8.9%
Note: all tonnage
Source: CCMA, Nomura research
Exhibit 68. Excavator product mix
21% 18% 13% 7%
17% 24% 27% 34%
51% 47% 45% 46%
11% 11% 15% 14%
% 0
% 10
% 20
% 30
% 40
% 50
% 60
% 70
% 80
% 90
100
2006 2007 2008 2009
≤ 6 ton 6-19 ton 20-29 ton ≥30 ton
(%)
Note: all tonnage
Source: CCMA, Nomura research
We believe the major competition ground for Chinese and Korean vendors will be in the mid-tonnage segment (20-30t), where the Chinese players have been ramping up capacity aggressively and the Korean players are still commanding a significant market share. Mid-tonnage has been the largest segment in the Chinese excavator sector; it represented 46% of total sales in 2009. Thus, among the Chinese players, we are more Bullish on names that have larger exposure to the mid-tonnage segment, such as SANY and Lonking.
How the market breaks down
SANY well positioned to compete
Local names gaining at the expense of Korean players
For local players, we like the mid-tonnage segment
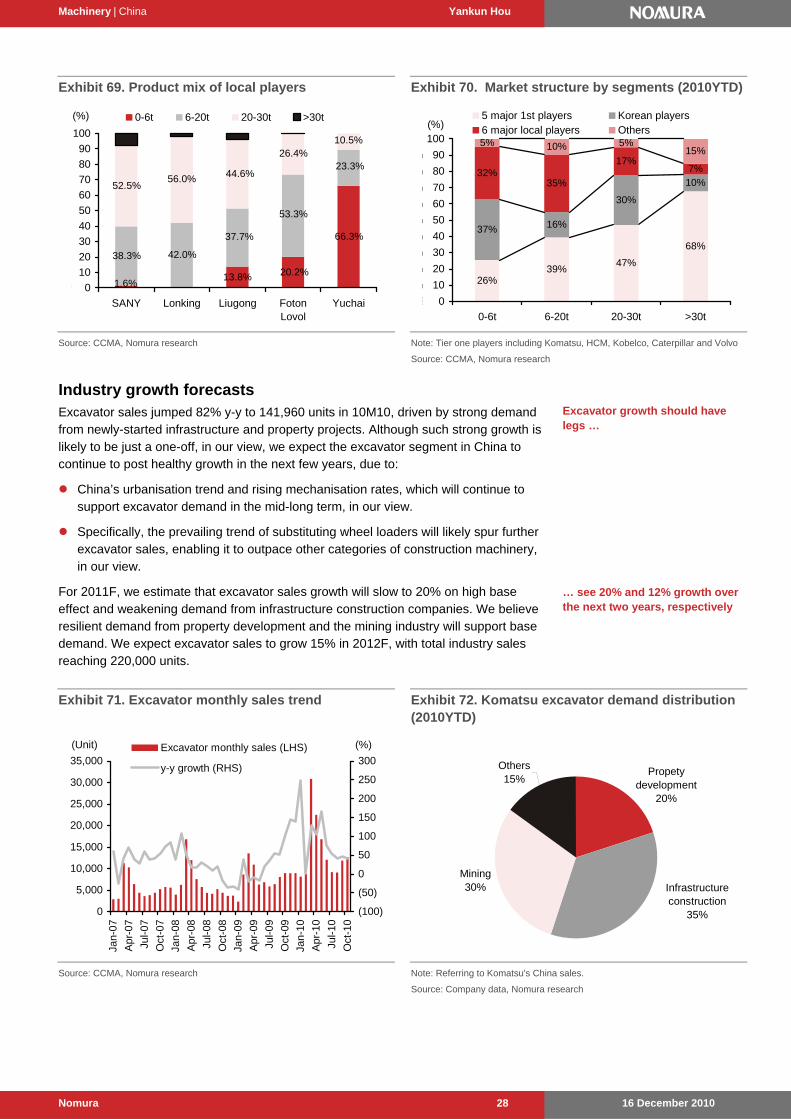
Machinery | China Yankun Hou
16 December 2010 Nomura 28
Exhibit 69. Product mix of local players
13.8% 20.2%
66.3%
1.6%
23.3%
53.3%
37.7%
42.0%38.3%
10.5%26.4%
44.6%56.0%52.5%
% 0
10
20
30
40
50
60
70
80
90
100
SANY Lonking Liugong FotonLovol
Yuchai
0-6t 6-20t 20-30t >30t(%)
Source: CCMA, Nomura research
Exhibit 70. Market structure by segments (2010YTD)
26%39%
47%
68%
37% 16%
30%
10%32%
35%
17%7%
5% 10% 5%15%
% 0
% 10
% 20
% 30
% 40
% 50
% 60
% 70
% 80
% 90
100
0-6t 6-20t 20-30t >30t
5 major 1st players Korean players6 major local players Others(%)
Note: Tier one players including Komatsu, HCM, Kobelco, Caterpillar and Volvo
Source: CCMA, Nomura research
Industry growth forecasts Excavator sales jumped 82% y-y to 141,960 units in 10M10, driven by strong demand from newly-started infrastructure and property projects. Although such strong growth is likely to be just a one-off, in our view, we expect the excavator segment in China to continue to post healthy growth in the next few years, due to:
China’s urbanisation trend and rising mechanisation rates, which will continue to support excavator demand in the mid-long term, in our view.
Specifically, the prevailing trend of substituting wheel loaders will likely spur further excavator sales, enabling it to outpace other categories of construction machinery, in our view.
For 2011F, we estimate that excavator sales growth will slow to 20% on high base effect and weakening demand from infrastructure construction companies. We believe resilient demand from property development and the mining industry will support base demand. We expect excavator sales to grow 15% in 2012F, with total industry sales reaching 220,000 units.
Exhibit 71. Excavator monthly sales trend
0
5,000
10,000
15,000
20,000
25,000
30,000
35,000
Jan-
07
Apr
-07
Jul-0
7
Oct
-07
Jan-
08
Apr
-08
Jul-0
8
Oct
-08
Jan-
09
Apr
-09
Jul-0
9
Oct
-09
Jan-
10
Apr
-10
Jul-1
0
Oct
-10
(100)
(50)
0
50
100
150
200
250
300Excavator monthly sales (LHS)
y-y growth (RHS)
(Unit) (%)
Source: CCMA, Nomura research
Exhibit 72. Komatsu excavator demand distribution (2010YTD)
Mining30%
Others15%
Propety development
20%
Infrastructure construction
35%
Note: Referring to Komatsu's China sales.
Source: Company data, Nomura research
Excavator growth should have legs …
… see 20% and 12% growth over the next two years, respectively
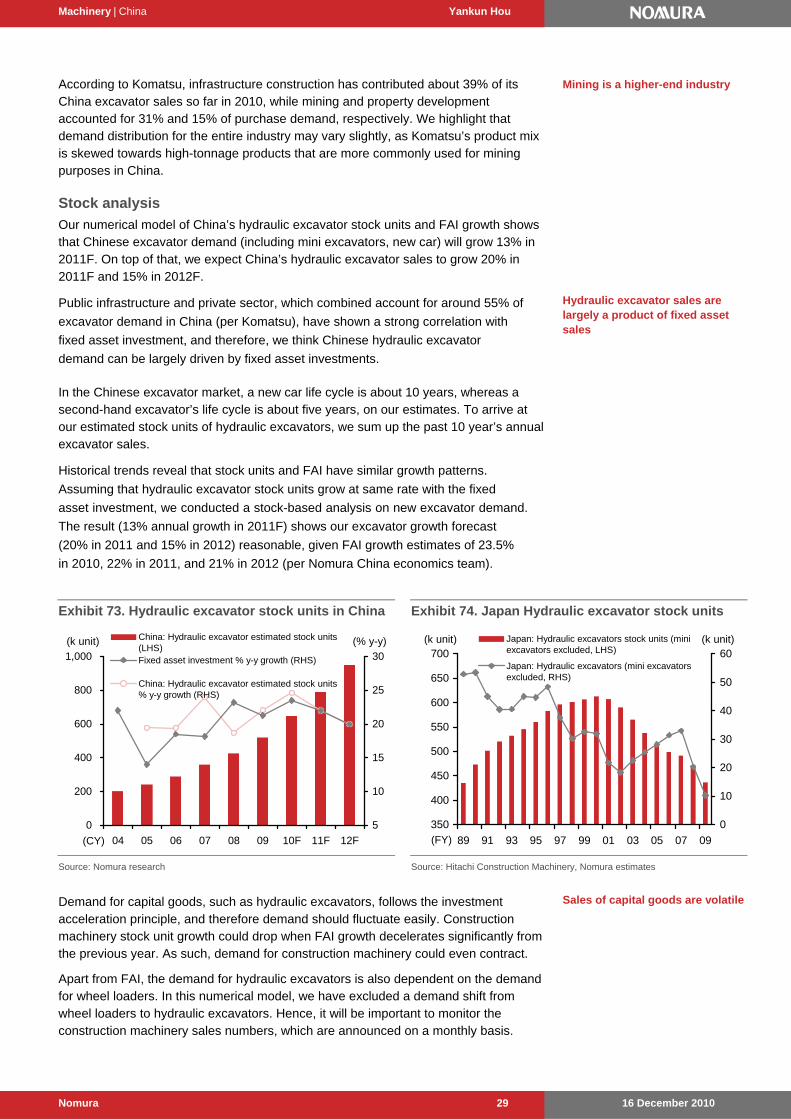
Machinery | China Yankun Hou
16 December 2010 Nomura 29
According to Komatsu, infrastructure construction has contributed about 39% of its China excavator sales so far in 2010, while mining and property development accounted for 31% and 15% of purchase demand, respectively. We highlight that demand distribution for the entire industry may vary slightly, as Komatsu’s product mix is skewed towards high-tonnage products that are more commonly used for mining purposes in China.
Stock analysis
Our numerical model of China’s hydraulic excavator stock units and FAI growth shows that Chinese excavator demand (including mini excavators, new car) will grow 13% in 2011F. On top of that, we expect China’s hydraulic excavator sales to grow 20% in 2011F and 15% in 2012F.
Public infrastructure and private sector, which combined account for around 55% of
excavator demand in China (per Komatsu), have shown a strong correlation with
fixed asset investment, and therefore, we think Chinese hydraulic excavator
demand can be largely driven by fixed asset investments.
In the Chinese excavator market, a new car life cycle is about 10 years, whereas a second-hand excavator’s life cycle is about five years, on our estimates. To arrive at our estimated stock units of hydraulic excavators, we sum up the past 10 year’s annual excavator sales.
Historical trends reveal that stock units and FAI have similar growth patterns.
Assuming that hydraulic excavator stock units grow at same rate with the fixed
asset investment, we conducted a stock-based analysis on new excavator demand.
The result (13% annual growth in 2011F) shows our excavator growth forecast
(20% in 2011 and 15% in 2012) reasonable, given FAI growth estimates of 23.5%
in 2010, 22% in 2011, and 21% in 2012 (per Nomura China economics team).
Exhibit 73. Hydraulic excavator stock units in China
0
200
400
600
800
1,000
04 05 06 07 08 09 10F 11F 12F
5
10
15
20
25
30
China: Hydraulic excavator estimated stock units(LHS)Fixed asset investment % y-y growth (RHS)
China: Hydraulic excavator estimated stock units% y-y growth (RHS)
(k unit)
(CY)
(% y-y)
Source: Nomura research
Exhibit 74. Japan Hydraulic excavator stock units
350
400
450
500
550
600
650
700
89 91 93 95 97 99 01 03 05 07 09
0
10
20
30
40
50
60
Japan: Hydraulic excavators stock units (miniexcavators excluded, LHS)
Japan: Hydraulic excavators (mini excavatorsexcluded, RHS)
(FY)
(k unit) (k unit)
Source: Hitachi Construction Machinery, Nomura estimates
Demand for capital goods, such as hydraulic excavators, follows the investment acceleration principle, and therefore demand should fluctuate easily. Construction machinery stock unit growth could drop when FAI growth decelerates significantly from the previous year. As such, demand for construction machinery could even contract.
Apart from FAI, the demand for hydraulic excavators is also dependent on the demand for wheel loaders. In this numerical model, we have excluded a demand shift from wheel loaders to hydraulic excavators. Hence, it will be important to monitor the construction machinery sales numbers, which are announced on a monthly basis.
Mining is a higher-end industry
Hydraulic excavator sales are largely a product of fixed asset sales
Sales of capital goods are volatile
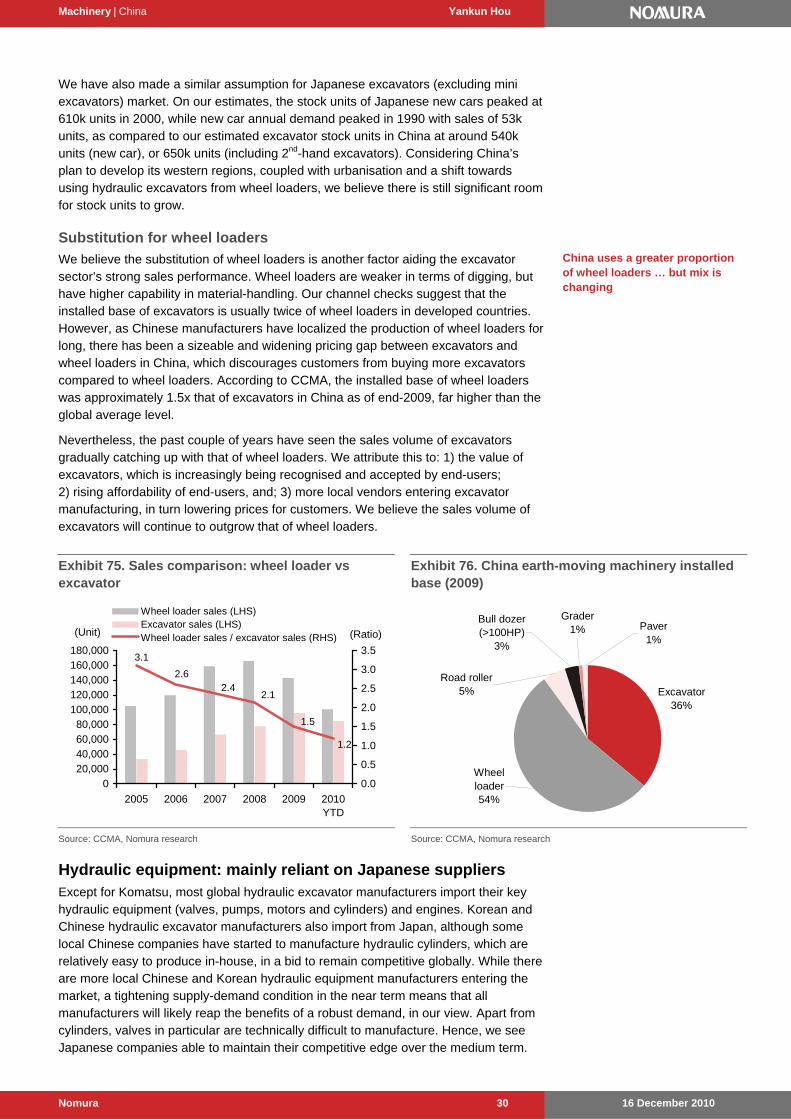
Machinery | China Yankun Hou
16 December 2010 Nomura 30
We have also made a similar assumption for Japanese excavators (excluding mini excavators) market. On our estimates, the stock units of Japanese new cars peaked at 610k units in 2000, while new car annual demand peaked in 1990 with sales of 53k units, as compared to our estimated excavator stock units in China at around 540k units (new car), or 650k units (including 2nd-hand excavators). Considering China’s plan to develop its western regions, coupled with urbanisation and a shift towards using hydraulic excavators from wheel loaders, we believe there is still significant room for stock units to grow.
Substitution for wheel loaders
We believe the substitution of wheel loaders is another factor aiding the excavator sector’s strong sales performance. Wheel loaders are weaker in terms of digging, but have higher capability in material-handling. Our channel checks suggest that the installed base of excavators is usually twice of wheel loaders in developed countries. However, as Chinese manufacturers have localized the production of wheel loaders for long, there has been a sizeable and widening pricing gap between excavators and wheel loaders in China, which discourages customers from buying more excavators compared to wheel loaders. According to CCMA, the installed base of wheel loaders was approximately 1.5x that of excavators in China as of end-2009, far higher than the global average level.
Nevertheless, the past couple of years have seen the sales volume of excavators gradually catching up with that of wheel loaders. We attribute this to: 1) the value of excavators, which is increasingly being recognised and accepted by end-users; 2) rising affordability of end-users, and; 3) more local vendors entering excavator manufacturing, in turn lowering prices for customers. We believe the sales volume of excavators will continue to outgrow that of wheel loaders.
Exhibit 75. Sales comparison: wheel loader vs excavator
1.2
1.5
2.12.4
2.6
3.1
020,00040,00060,00080,000
100,000120,000140,000160,000180,000
2005 2006 2007 2008 2009 2010YTD
0.0
0.5
1.0
1.5
2.0
2.5
3.0
3.5
Wheel loader sales (LHS)Excavator sales (LHS)Wheel loader sales / excavator sales (RHS)(Unit) (Ratio)
Source: CCMA, Nomura research
Exhibit 76. China earth-moving machinery installed base (2009)
Excavator36%
Grader1%
Wheel loader54%
Paver1%
Bull dozer (>100HP)
3%
Road roller5%
Source: CCMA, Nomura research
Hydraulic equipment: mainly reliant on Japanese suppliers Except for Komatsu, most global hydraulic excavator manufacturers import their key hydraulic equipment (valves, pumps, motors and cylinders) and engines. Korean and Chinese hydraulic excavator manufacturers also import from Japan, although some local Chinese companies have started to manufacture hydraulic cylinders, which are relatively easy to produce in-house, in a bid to remain competitive globally. While there are more local Chinese and Korean hydraulic equipment manufacturers entering the market, a tightening supply-demand condition in the near term means that all manufacturers will likely reap the benefits of a robust demand, in our view. Apart from cylinders, valves in particular are technically difficult to manufacture. Hence, we see Japanese companies able to maintain their competitive edge over the medium term.
China uses a greater proportion of wheel loaders … but mix is changing
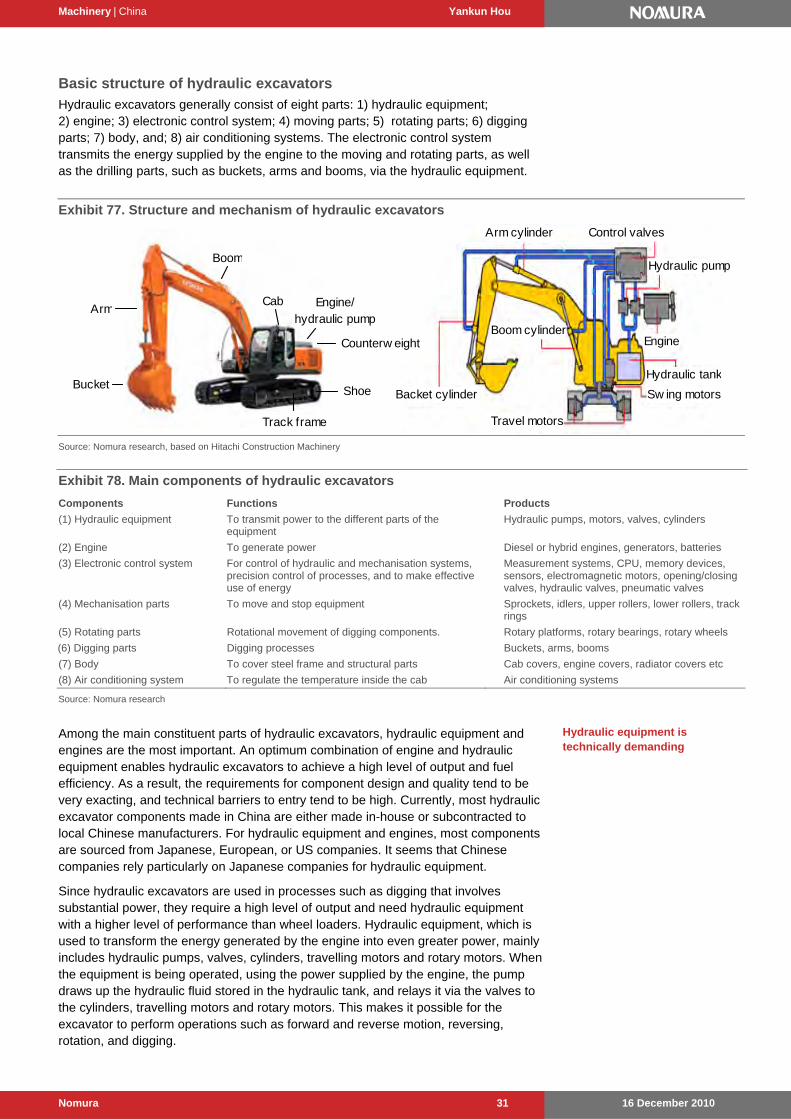
Machinery | China Yankun Hou
16 December 2010 Nomura 31
Basic structure of hydraulic excavators
Hydraulic excavators generally consist of eight parts: 1) hydraulic equipment; 2) engine; 3) electronic control system; 4) moving parts; 5) rotating parts; 6) digging parts; 7) body, and; 8) air conditioning systems. The electronic control system transmits the energy supplied by the engine to the moving and rotating parts, as well as the drilling parts, such as buckets, arms and booms, via the hydraulic equipment.
Exhibit 77. Structure and mechanism of hydraulic excavators
Backet cylinder
Travel motors
Sw ing motors
Hydraulic tank
Engine
Hydraulic pump
Control valvesArm cylinder
Boom cylinder
Arm
Bucket Shoe
Counterw eight
Cab
Boom
Engine/hydraulic pump
Track frame
Source: Nomura research, based on Hitachi Construction Machinery
Exhibit 78. Main components of hydraulic excavators
Components Functions Products
(1) Hydraulic equipment To transmit power to the different parts of the equipment
Hydraulic pumps, motors, valves, cylinders
(2) Engine To generate power Diesel or hybrid engines, generators, batteries
(3) Electronic control system For control of hydraulic and mechanisation systems, precision control of processes, and to make effective use of energy
Measurement systems, CPU, memory devices, sensors, electromagnetic motors, opening/closing valves, hydraulic valves, pneumatic valves
(4) Mechanisation parts To move and stop equipment Sprockets, idlers, upper rollers, lower rollers, track rings
(5) Rotating parts Rotational movement of digging components. Rotary platforms, rotary bearings, rotary wheels
(6) Digging parts Digging processes Buckets, arms, booms
(7) Body To cover steel frame and structural parts Cab covers, engine covers, radiator covers etc
(8) Air conditioning system To regulate the temperature inside the cab Air conditioning systems
Source: Nomura research
Among the main constituent parts of hydraulic excavators, hydraulic equipment and engines are the most important. An optimum combination of engine and hydraulic equipment enables hydraulic excavators to achieve a high level of output and fuel efficiency. As a result, the requirements for component design and quality tend to be very exacting, and technical barriers to entry tend to be high. Currently, most hydraulic excavator components made in China are either made in-house or subcontracted to local Chinese manufacturers. For hydraulic equipment and engines, most components are sourced from Japanese, European, or US companies. It seems that Chinese companies rely particularly on Japanese companies for hydraulic equipment.
Since hydraulic excavators are used in processes such as digging that involves substantial power, they require a high level of output and need hydraulic equipment with a higher level of performance than wheel loaders. Hydraulic equipment, which is used to transform the energy generated by the engine into even greater power, mainly includes hydraulic pumps, valves, cylinders, travelling motors and rotary motors. When the equipment is being operated, using the power supplied by the engine, the pump draws up the hydraulic fluid stored in the hydraulic tank, and relays it via the valves to the cylinders, travelling motors and rotary motors. This makes it possible for the excavator to perform operations such as forward and reverse motion, reversing, rotation, and digging.
Hydraulic equipment is technically demanding
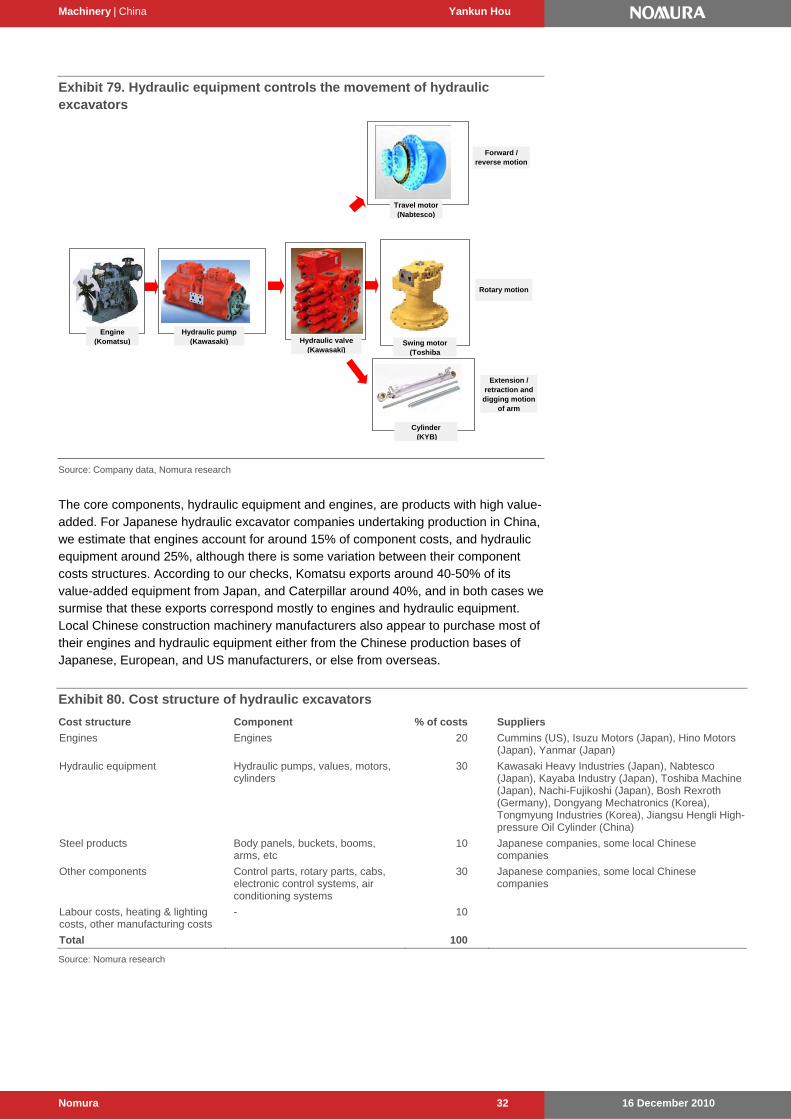
Machinery | China Yankun Hou
16 December 2010 Nomura 32
Exhibit 79. Hydraulic equipment controls the movement of hydraulic excavators
Engine(Komatsu)
Hydraulic pump(Kawasaki) Hydraulic valve
(Kawasaki)
Travel motor(Nabtesco)
Swing motor(Toshiba
Cylinder(KYB)
Forward /reverse motion
Rotary motion
Extension /retraction and
digging motionof arm
Source: Company data, Nomura research
The core components, hydraulic equipment and engines, are products with high value-added. For Japanese hydraulic excavator companies undertaking production in China, we estimate that engines account for around 15% of component costs, and hydraulic equipment around 25%, although there is some variation between their component costs structures. According to our checks, Komatsu exports around 40-50% of its value-added equipment from Japan, and Caterpillar around 40%, and in both cases we surmise that these exports correspond mostly to engines and hydraulic equipment. Local Chinese construction machinery manufacturers also appear to purchase most of their engines and hydraulic equipment either from the Chinese production bases of Japanese, European, and US manufacturers, or else from overseas.
Exhibit 80. Cost structure of hydraulic excavators
Cost structure Component % of costs Suppliers
Engines Engines 20 Cummins (US), Isuzu Motors (Japan), Hino Motors (Japan), Yanmar (Japan)
Hydraulic equipment Hydraulic pumps, values, motors, cylinders
30 Kawasaki Heavy Industries (Japan), Nabtesco (Japan), Kayaba Industry (Japan), Toshiba Machine (Japan), Nachi-Fujikoshi (Japan), Bosh Rexroth (Germany), Dongyang Mechatronics (Korea), Tongmyung Industries (Korea), Jiangsu Hengli High-pressure Oil Cylinder (China)
Steel products Body panels, buckets, booms, arms, etc
10 Japanese companies, some local Chinese companies
Other components Control parts, rotary parts, cabs, electronic control systems, air conditioning systems
30 Japanese companies, some local Chinese companies
Labour costs, heating & lighting costs, other manufacturing costs
- 10
Total 100
Source: Nomura research
Machinery | China Yankun Hou
16 December 2010 Nomura 33
Hydraulic equipment makers
We went to the Bauma China construction machinery exhibition in Shanghai in November 2010, and examined the engines and hydraulic equipment used by major companies in the Chinese hydraulic excavator market. We found that: 1) Komatsu is farther along than its competitors in terms of moving to in-house production of these parts, 2) non-Chinese companies, especially Japanese companies, are strong in this area with different companies specialising in different parts, and; 3) some local Chinese companies have started in-house manufacturing of relatively easy-to-produce hydraulic cylinders in a bid to remain competitive globally, and some local Chinese hydraulic equipment manufacturers have started to emerge.
Exhibit 81. Chinese hydraulic excavator market: parts procurement channels of major companies
Japanese companies
Komatsu
Hitachi Construction Machinery
Kobelco Construction Machinery
North American companies
Korean companies
Chinese companies
Engines In-house Isuzu Motors (Japan), Cummins (US)
Yanmar (Japan), Isuzu Motors (Japan), Hino Motors (Japan)
In-house Yanmar (Japan), Cummins (US), some in-house
Yanmar (Japan), Weichai (China), Yuchai (China), Isuzu Motors (Japan), Cummins (US)
Valves In-house KYB (Japan),Kawasaki Heavy Ind. (Japan), Toshiba Machine (Japan), some in-house
Kawasaki Heavy Industries (Japan)
Kawasaki Heavy Industries (Japan)
Pumps In-house KYB (Japan),some in-house
Kawasaki Heavy Ind. (Japan), Nabtesco (Japan)
Kawasaki Heavy Industries (Japan)
Kawasaki Heavy Industries (Japan), Bosch Rexroth (Germany), Tongmyung Industries (Korea), some in-house
Kawasaki Heavy Industries (Japan), KYB (Japan), Toshiba Machine (Japan)
Motors (travel/swing)
Nabtesco (Japan), some in-house
Nachi-Fujikoshi (Japan)
KYB (Japan),Nabtesco (Japan)
Nabtesco (Japan) Nabtesco (Japan), Tongmyung Industries (Korea), some in-house
Nabtesco (Japan), KYB (Japan)
Hydraulic equipment
Cylinders In-house KYB (Japan) KYB (Japan) KYB (Japan) Dongyang Mechatronics (Korea), some in-house
KYB (Japan), Jiangsu Hengli High-pressure Oil Cylinder (China), in-house
Source: Nomura research
We note that Komatsu now makes almost all of its engines and hydraulic equipment for hydraulic excavators in-house. Komatsu has been jointly developing diesel engines for hydraulic engines with Cummins of the US since 1998 and moving production in-house. Most of its engines for hydraulic excavators in China are manufactured at its Oyama plant in Japan, and most of its hydraulic equipment (except for travelling motors) is produced in Japan. Komatsu Hydraulics Manufacturing, a subsidiary in China, produces some of the cylinders in order to shorten delivery times and lower costs. Rotating and travelling motors are mainly procured from Nabtesco’s Shanghai plant (which is 15% owned by Komatsu), but product design is done by Komatsu, and motors for large excavators are exported from its Osaka plant.
Japanese, European and US companies are strong in hydraulic equipment and engines, while different companies specialise in different parts. Engines for small excavators are made by local Chinese companies such as Weichai and Yuchai, while Yanmar is also strong in this area. Isuzu Motors, Hino Motors and Cummins are strong in engines for medium size/large excavators. Japanese companies have a strong presence in hydraulic equipment, with very strong positions in valves and pumps at Kawasaki Heavy Industries, travelling motors at Nabtesco, and cylinders at Kayaba Industry. Supported by a firm demand, hydraulic equipment makers apparently plan to increase production.
Local makes starting to emerge
Komatsu is strong here

Machinery | China Yankun Hou
16 December 2010 Nomura 34
Exhibit 82. Characteristics of major hydraulic equipment makers
Business fields
Code Company Valves Pumps Motors Travel Swing Cylinders Comments
Japan
7012 Kawasaki Heavy Industries - - The top maker of hydraulic equipment, with an over-80% global
share in hydraulic pumps
6268 Nabtesco - - Estimated global share of around 30% (excluding mini excavators); strong in travelling motors
7242 Kayaba Industry Strong in hydraulic cylinders; Hitachi Construction Machinery accounts for almost 30% of sales
6104 Toshiba Machine - - - In June 2010, formed alliance with both Yuchai of China and Korean company
6474 Nachi-Fujikoshi - Strong in products for mini excavators
Europe
Unlisted Bosh Rexroth Like Japanese companies, able to supply virtually all types of hydraulic equipment
Korea
013570 KS Dongyang Mechatronics - - - - Manufactures mainly hydraulic cylinders; supplies Korean and
Chinese hydraulic excavator makers
Unlisted Tongmyung Industries - - Handles swiveling/travelling motors; supplies Korean hydraulic excavator makers
China
Unlisted Jiangsu Hengli Highpressure Oil Cylinder
- - - - Manufactures mainly hydraulic cylinders; supplies Chinese hydraulic excavator makers
Source: Nomura research
Kawasaki Precision Machinery, which runs the hydraulic equipment business at Kawasaki Heavy Industries, is one of the largest hydraulic equipment makers in Japan. Kawasaki Precision Machinery is particularly strong in valves and pumps, the heart of hydraulic excavators. We estimate that it has an almost 30% share of the global market for hydraulic valves, excluding in-house products. In China, the company’s product quality and performance is well established. We estimate that about 40% of its customers are Japanese companies, 35% local Chinese companies, 15% Korean companies, and 10% other companies.
In Japan, Kawasaki Precision Machinery manufactures hydraulic pumps, valves, and motors at its Nishi-Kobe plant. It has a three-company structure in China, comprising two manufacturing and one sales company. In December 2005, it began production at a plant in Suzhou (Jiangsu province), and in October 2009 it tied up with Zhejiang Chunhui Industrial Group in the launch of the Zhejiang plant (Zhejiang province), creating a local production structure for hydraulic pumps and rotating motors.
Order receipts have risen sharply lately, in response to which Kawasaki Precision Machinery plans to open a new plant in China in October 2011 and to boost production capacity at existing plants. Accordingly, we expect local production capacity for hydraulic pumps to increase by about 40% (60,000 units annually) and for hydraulic valves by about 120% (20,000). In Japan, demand has grown strongly at its Nishi-Kobe plant, so the company plans to increase production and fill orders by upgrading production equipment.
Kawasaki Precision does quite well in valves and pumps and it serves a broad client base in China
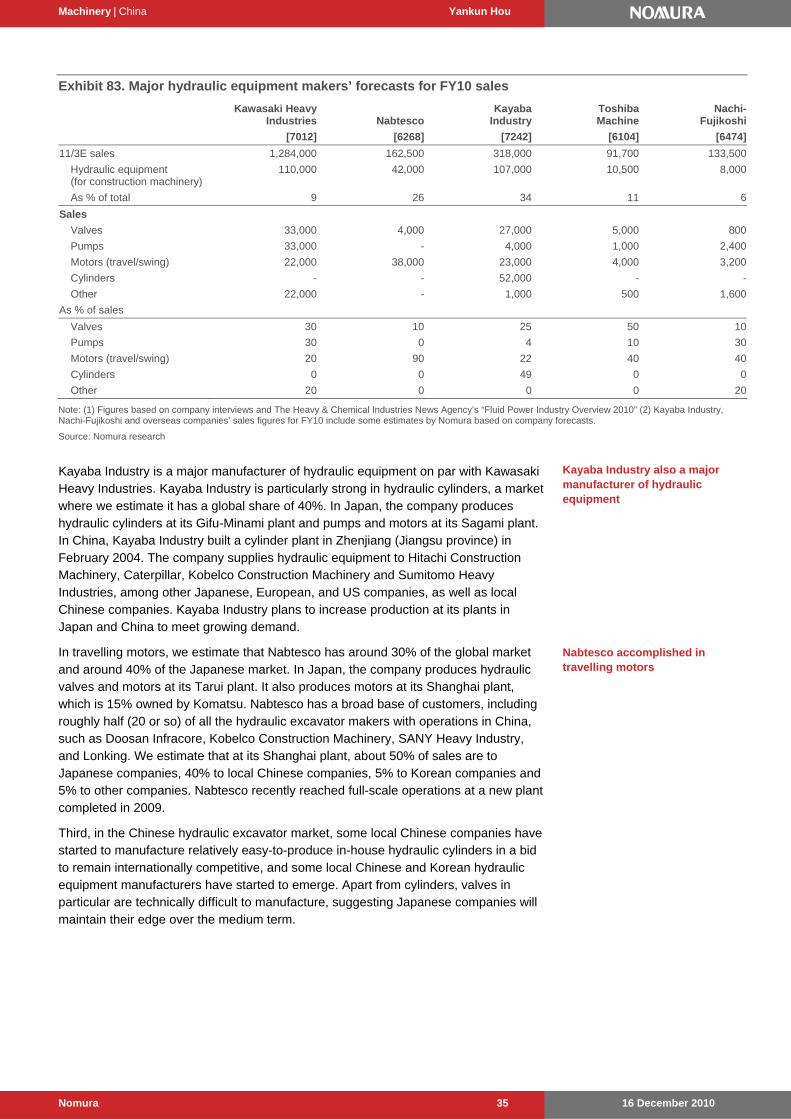
Machinery | China Yankun Hou
16 December 2010 Nomura 35
Exhibit 83. Major hydraulic equipment makers’ forecasts for FY10 sales
Kawasaki Heavy Industries Nabtesco
Kayaba Industry
Toshiba Machine
Nachi-Fujikoshi
[7012] [6268] [7242] [6104] [6474]
11/3E sales 1,284,000 162,500 318,000 91,700 133,500
Hydraulic equipment (for construction machinery)
110,000 42,000 107,000 10,500 8,000
As % of total 9 26 34 11 6
Sales
Valves 33,000 4,000 27,000 5,000 800
Pumps 33,000 - 4,000 1,000 2,400
Motors (travel/swing) 22,000 38,000 23,000 4,000 3,200
Cylinders - - 52,000 - -
Other 22,000 - 1,000 500 1,600
As % of sales
Valves 30 10 25 50 10
Pumps 30 0 4 10 30
Motors (travel/swing) 20 90 22 40 40
Cylinders 0 0 49 0 0
Other 20 0 0 0 20
Note: (1) Figures based on company interviews and The Heavy & Chemical Industries News Agency’s “Fluid Power Industry Overview 2010” (2) Kayaba Industry, Nachi-Fujikoshi and overseas companies’ sales figures for FY10 include some estimates by Nomura based on company forecasts.
Source: Nomura research
Kayaba Industry is a major manufacturer of hydraulic equipment on par with Kawasaki Heavy Industries. Kayaba Industry is particularly strong in hydraulic cylinders, a market where we estimate it has a global share of 40%. In Japan, the company produces hydraulic cylinders at its Gifu-Minami plant and pumps and motors at its Sagami plant. In China, Kayaba Industry built a cylinder plant in Zhenjiang (Jiangsu province) in February 2004. The company supplies hydraulic equipment to Hitachi Construction Machinery, Caterpillar, Kobelco Construction Machinery and Sumitomo Heavy Industries, among other Japanese, European, and US companies, as well as local Chinese companies. Kayaba Industry plans to increase production at its plants in Japan and China to meet growing demand.
In travelling motors, we estimate that Nabtesco has around 30% of the global market and around 40% of the Japanese market. In Japan, the company produces hydraulic valves and motors at its Tarui plant. It also produces motors at its Shanghai plant, which is 15% owned by Komatsu. Nabtesco has a broad base of customers, including roughly half (20 or so) of all the hydraulic excavator makers with operations in China, such as Doosan Infracore, Kobelco Construction Machinery, SANY Heavy Industry, and Lonking. We estimate that at its Shanghai plant, about 50% of sales are to Japanese companies, 40% to local Chinese companies, 5% to Korean companies and 5% to other companies. Nabtesco recently reached full-scale operations at a new plant completed in 2009.
Third, in the Chinese hydraulic excavator market, some local Chinese companies have started to manufacture relatively easy-to-produce in-house hydraulic cylinders in a bid to remain internationally competitive, and some local Chinese and Korean hydraulic equipment manufacturers have started to emerge. Apart from cylinders, valves in particular are technically difficult to manufacture, suggesting Japanese companies will maintain their edge over the medium term.
Kayaba Industry also a major manufacturer of hydraulic equipment
Nabtesco accomplished in travelling motors
Machinery | China Yankun Hou
16 December 2010 Nomura 36
SANY Heavy Industry is a major hydraulic excavator maker in China. It established ZTE Hydraulic Parts as a subsidiary in Loudi, Hunan Province in 2005, where it makes cylinders for its own products, such as concrete pumps and hydraulic excavators. About 60% of the cylinders in its hydraulic excavators are made in-house, and it also supplies them for hydraulic excavators up to 40t. We estimate that its sales in FY10F will be around RMB1bn. In 2011, the company plans to raise the ratio of in-house production of cylinders while also considering external sales. Lonking, a major Chinese construction machinery maker, has also begun to produce cylinders in-house.
Local Chinese hydraulic equipment makers that also offer cylinders have begun to emerge. Jiangsu Hengli Highpressure Oil Cylinder is a local Chinese maker of hydraulic equipment that was founded in 2005 and sells cylinders to hydraulic excavator makers in China. Its plant uses many machine tools produced by Doosan Infracore.
We estimate that Jiangsu Hengli Highpressure Oil Cylinder’s prices are about 10% lower than those of Japanese companies, and sales volume is around 200,000 cylinders for 6-80t hydraulic excavators. On this basis, we estimate that FY10F sales will be about RMB1.1bn (RMB820mn as of Jan-Sep 2010). The company has been building a new plant (annual capacity of 500,000) in Changzhou since June 2009, and plans to start operating it in May 2011.
Local Chinese companies are able to manufacture cylinders at an earlier stage than other hydraulic equipment because they are easier to manufacture than other kinds of hydraulic equipment. Hydraulic cylinders are made by machine tooling piston rods and cylinder tubes, and welding and assembling these parts together. The production process requires polishing, welding, and sealing technologies, but cylinders are relatively easy to produce with precision if the latest in production equipment is used.
On the other hand, valves are cast from moulds, so materials technology and know-how is a prerequisite. Their structures are complex, and greater precision is required than for cylinders, necessitating a higher degree of analog knowledge, such as in advanced moulding technology. When we visited SANY Heavy Industry, management commented that it would take at least two to three years before it could start to produce valves in-house.
In order of difficulty in manufacturing, we think valves are the most difficult, followed by pumps, motors, and cylinders. Hence, we think that Kawasaki Heavy Industries, Toshiba Machine, and Nabtesco, all of which have a high ratio of hydraulic valve, pump and motor sales, will be able to keep their competitiveness over the medium term. With cylinders, too, we do not expect competition to intensify in the near term bearing in mind the prospects of a robust demand. We, therefore, think the near-term earnings of hydraulic equipment makers will depend largely on their production capacity, or how much they can make to meet their demand.
After-market service and parts sales: the key to long-term sustainable success
For construction machinery companies, services such as parts and maintenance are not only critical for users, but also could be another cash cow for construction machinery manufacturers. In China, compared with wheel loaders, from the nature of longer life cycle and rapid increase in stock units, we see potential for parts and maintenance sales.
ZTE Hydraulic Parts a subsidiary of SANY Heavy’s
Valves require complicated machine tools
Maintenance contracts are longer-term sources of revenue
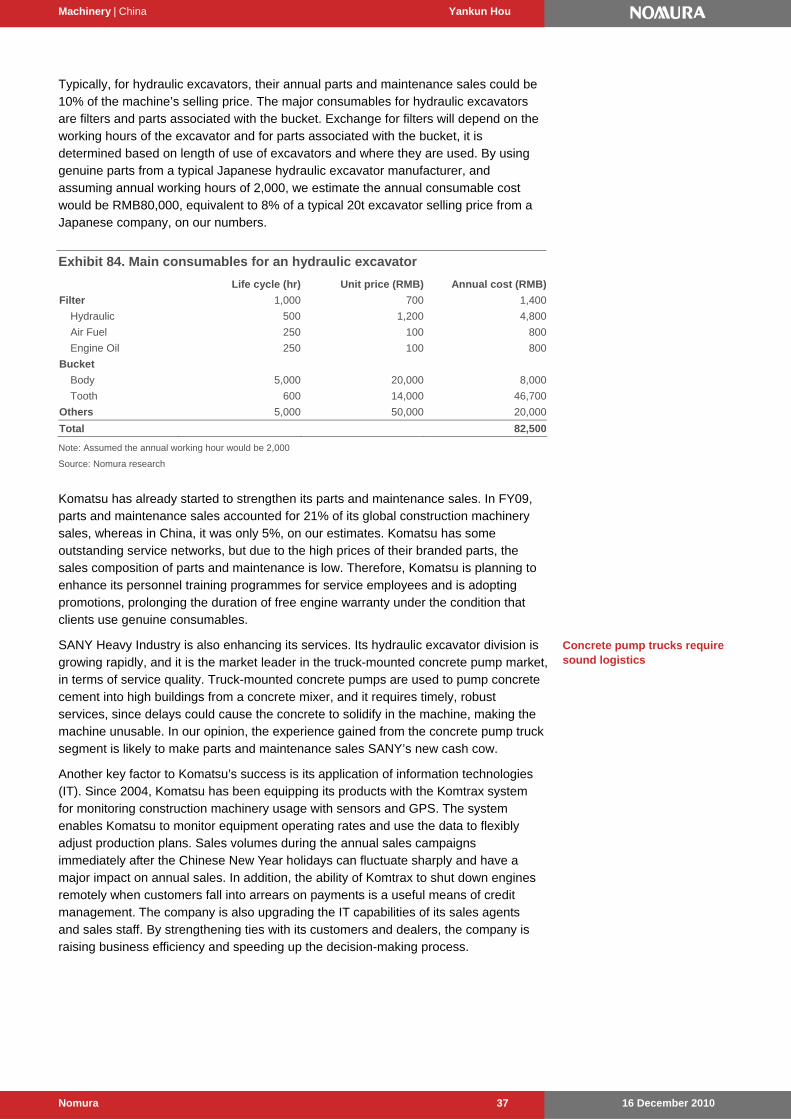
Machinery | China Yankun Hou
16 December 2010 Nomura 37
Typically, for hydraulic excavators, their annual parts and maintenance sales could be 10% of the machine’s selling price. The major consumables for hydraulic excavators are filters and parts associated with the bucket. Exchange for filters will depend on the working hours of the excavator and for parts associated with the bucket, it is determined based on length of use of excavators and where they are used. By using genuine parts from a typical Japanese hydraulic excavator manufacturer, and assuming annual working hours of 2,000, we estimate the annual consumable cost would be RMB80,000, equivalent to 8% of a typical 20t excavator selling price from a Japanese company, on our numbers.
Exhibit 84. Main consumables for an hydraulic excavator
Life cycle (hr) Unit price (RMB) Annual cost (RMB)
Filter 1,000 700 1,400
Hydraulic 500 1,200 4,800
Air Fuel 250 100 800
Engine Oil 250 100 800
Bucket
Body 5,000 20,000 8,000
Tooth 600 14,000 46,700
Others 5,000 50,000 20,000
Total 82,500
Note: Assumed the annual working hour would be 2,000
Source: Nomura research
Komatsu has already started to strengthen its parts and maintenance sales. In FY09, parts and maintenance sales accounted for 21% of its global construction machinery sales, whereas in China, it was only 5%, on our estimates. Komatsu has some outstanding service networks, but due to the high prices of their branded parts, the sales composition of parts and maintenance is low. Therefore, Komatsu is planning to enhance its personnel training programmes for service employees and is adopting promotions, prolonging the duration of free engine warranty under the condition that clients use genuine consumables.
SANY Heavy Industry is also enhancing its services. Its hydraulic excavator division is growing rapidly, and it is the market leader in the truck-mounted concrete pump market, in terms of service quality. Truck-mounted concrete pumps are used to pump concrete cement into high buildings from a concrete mixer, and it requires timely, robust services, since delays could cause the concrete to solidify in the machine, making the machine unusable. In our opinion, the experience gained from the concrete pump truck segment is likely to make parts and maintenance sales SANY’s new cash cow.
Another key factor to Komatsu’s success is its application of information technologies (IT). Since 2004, Komatsu has been equipping its products with the Komtrax system for monitoring construction machinery usage with sensors and GPS. The system enables Komatsu to monitor equipment operating rates and use the data to flexibly adjust production plans. Sales volumes during the annual sales campaigns immediately after the Chinese New Year holidays can fluctuate sharply and have a major impact on annual sales. In addition, the ability of Komtrax to shut down engines remotely when customers fall into arrears on payments is a useful means of credit management. The company is also upgrading the IT capabilities of its sales agents and sales staff. By strengthening ties with its customers and dealers, the company is raising business efficiency and speeding up the decision-making process.
Concrete pump trucks require sound logistics
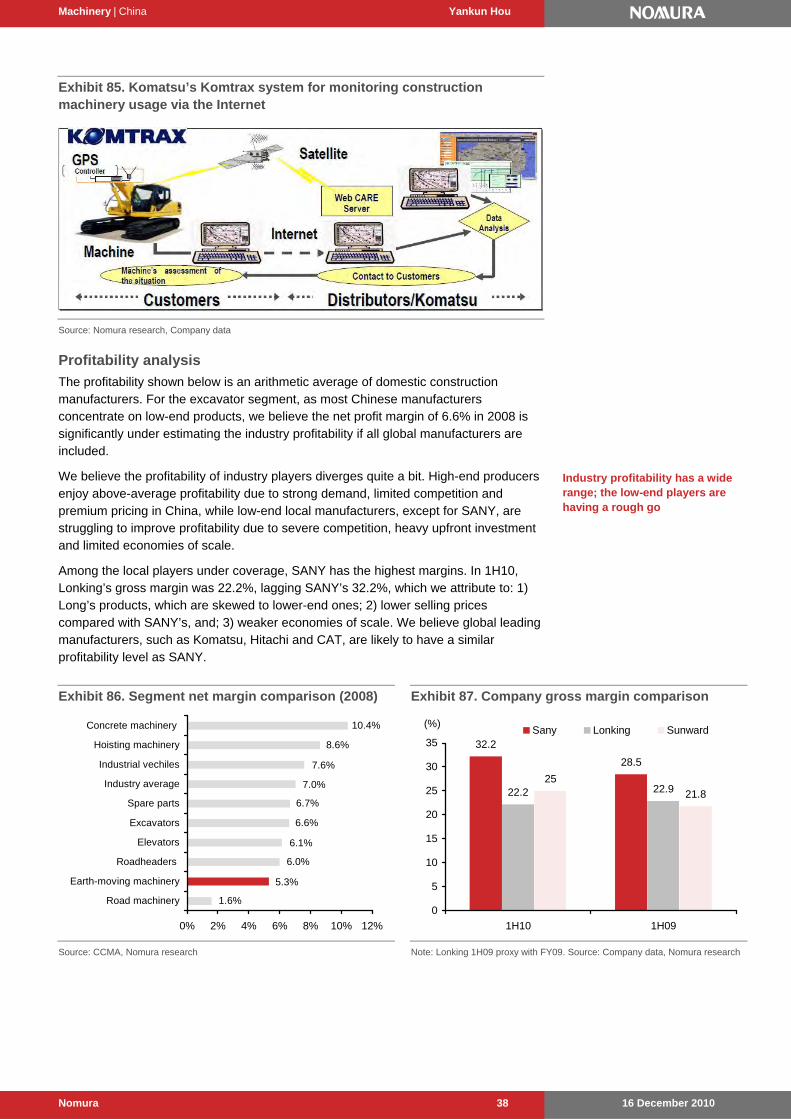
Machinery | China Yankun Hou
16 December 2010 Nomura 38
Exhibit 85. Komatsu’s Komtrax system for monitoring construction machinery usage via the Internet
Source: Nomura research, Company data
Profitability analysis
The profitability shown below is an arithmetic average of domestic construction manufacturers. For the excavator segment, as most Chinese manufacturers concentrate on low-end products, we believe the net profit margin of 6.6% in 2008 is significantly under estimating the industry profitability if all global manufacturers are included.
We believe the profitability of industry players diverges quite a bit. High-end producers enjoy above-average profitability due to strong demand, limited competition and premium pricing in China, while low-end local manufacturers, except for SANY, are struggling to improve profitability due to severe competition, heavy upfront investment and limited economies of scale.
Among the local players under coverage, SANY has the highest margins. In 1H10, Lonking’s gross margin was 22.2%, lagging SANY’s 32.2%, which we attribute to: 1) Long’s products, which are skewed to lower-end ones; 2) lower selling prices compared with SANY’s, and; 3) weaker economies of scale. We believe global leading manufacturers, such as Komatsu, Hitachi and CAT, are likely to have a similar profitability level as SANY.
Exhibit 86. Segment net margin comparison (2008)
10.4%
8.6%
7.6%
7.0%
1.6%
5.3%
6.0%
6.1%
6.6%
6.7%
0% 2% 4% 6% 8% 10% 12%
Road machinery
Earth-moving machinery
Roadheaders
Elevators
Excavators
Spare parts
Industry average
Industrial vechiles
Hoisting machinery
Concrete machinery
Source: CCMA, Nomura research
Exhibit 87. Company gross margin comparison
32.2
28.5
22.2 22.925
21.8
0
5
10
15
20
25
30
35
1H10 1H09
Sany Lonking Sunward(%)
Note: Lonking 1H09 proxy with FY09. Source: Company data, Nomura research
Industry profitability has a wide range; the low-end players are having a rough go
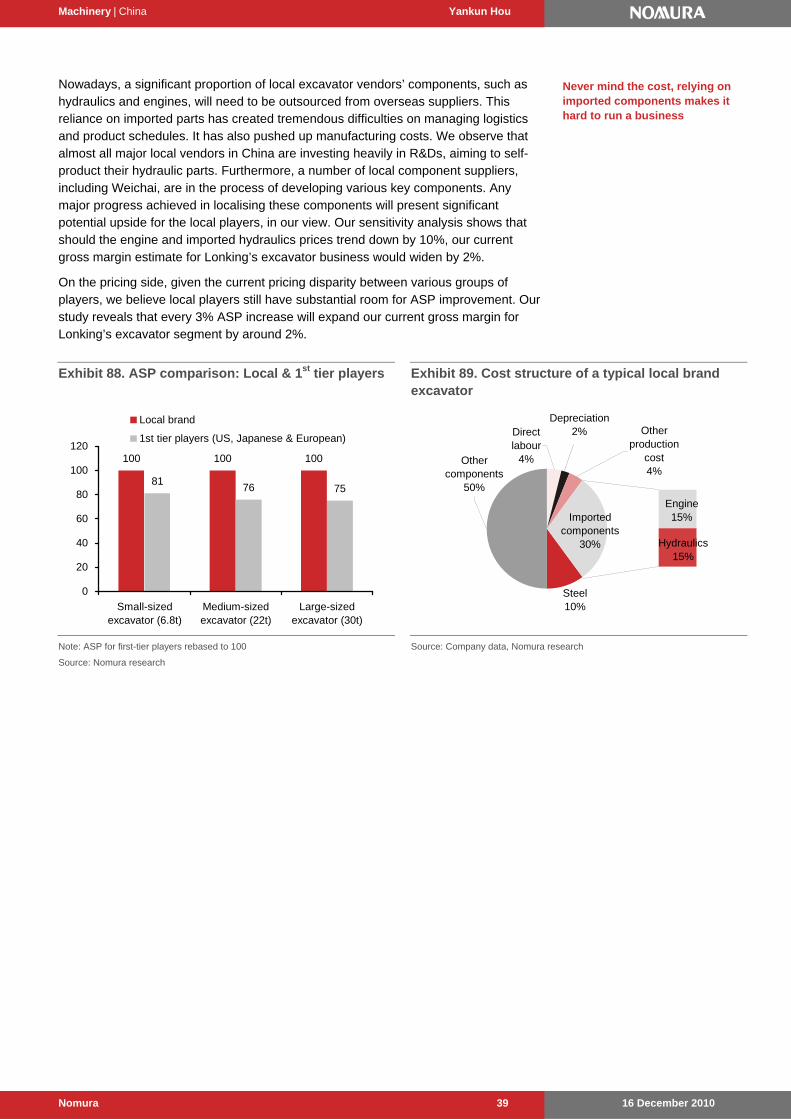
Machinery | China Yankun Hou
16 December 2010 Nomura 39
Nowadays, a significant proportion of local excavator vendors’ components, such as hydraulics and engines, will need to be outsourced from overseas suppliers. This reliance on imported parts has created tremendous difficulties on managing logistics and product schedules. It has also pushed up manufacturing costs. We observe that almost all major local vendors in China are investing heavily in R&Ds, aiming to self-product their hydraulic parts. Furthermore, a number of local component suppliers, including Weichai, are in the process of developing various key components. Any major progress achieved in localising these components will present significant potential upside for the local players, in our view. Our sensitivity analysis shows that should the engine and imported hydraulics prices trend down by 10%, our current gross margin estimate for Lonking’s excavator business would widen by 2%.
On the pricing side, given the current pricing disparity between various groups of players, we believe local players still have substantial room for ASP improvement. Our study reveals that every 3% ASP increase will expand our current gross margin for Lonking’s excavator segment by around 2%.
Exhibit 88. ASP comparison: Local & 1st tier players
100 100 100
8176 75
0
20
40
60
80
100
120
Small-sizedexcavator (6.8t)
Medium-sizedexcavator (22t)
Large-sizedexcavator (30t)
Local brand
1st tier players (US, Japanese & European)
Note: ASP for first-tier players rebased to 100
Source: Nomura research
Exhibit 89. Cost structure of a typical local brand excavator
Other production
cost4%
Engine15%
Direct labour
4%Other components
50%
Hydraulics15%
Imported components
30%
Depreciation2%
Steel 10%
Source: Company data, Nomura research
Never mind the cost, relying on imported components makes it hard to run a business
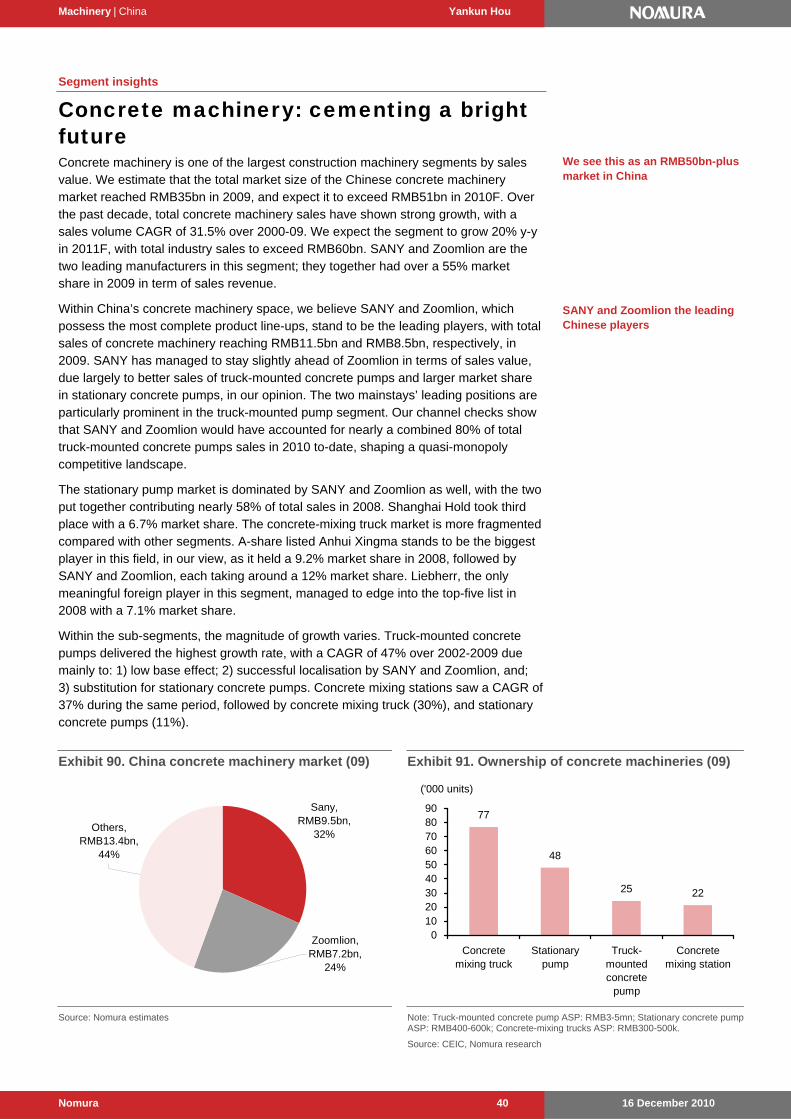
Machinery | China Yankun Hou
16 December 2010 Nomura 40
Segment insights
Concrete machinery: cementing a bright future Concrete machinery is one of the largest construction machinery segments by sales value. We estimate that the total market size of the Chinese concrete machinery market reached RMB35bn in 2009, and expect it to exceed RMB51bn in 2010F. Over the past decade, total concrete machinery sales have shown strong growth, with a sales volume CAGR of 31.5% over 2000-09. We expect the segment to grow 20% y-y in 2011F, with total industry sales to exceed RMB60bn. SANY and Zoomlion are the two leading manufacturers in this segment; they together had over a 55% market share in 2009 in term of sales revenue.
Within China’s concrete machinery space, we believe SANY and Zoomlion, which possess the most complete product line-ups, stand to be the leading players, with total sales of concrete machinery reaching RMB11.5bn and RMB8.5bn, respectively, in 2009. SANY has managed to stay slightly ahead of Zoomlion in terms of sales value, due largely to better sales of truck-mounted concrete pumps and larger market share in stationary concrete pumps, in our opinion. The two mainstays’ leading positions are particularly prominent in the truck-mounted pump segment. Our channel checks show that SANY and Zoomlion would have accounted for nearly a combined 80% of total truck-mounted concrete pumps sales in 2010 to-date, shaping a quasi-monopoly competitive landscape.
The stationary pump market is dominated by SANY and Zoomlion as well, with the two put together contributing nearly 58% of total sales in 2008. Shanghai Hold took third place with a 6.7% market share. The concrete-mixing truck market is more fragmented compared with other segments. A-share listed Anhui Xingma stands to be the biggest player in this field, in our view, as it held a 9.2% market share in 2008, followed by SANY and Zoomlion, each taking around a 12% market share. Liebherr, the only meaningful foreign player in this segment, managed to edge into the top-five list in 2008 with a 7.1% market share.
Within the sub-segments, the magnitude of growth varies. Truck-mounted concrete pumps delivered the highest growth rate, with a CAGR of 47% over 2002-2009 due mainly to: 1) low base effect; 2) successful localisation by SANY and Zoomlion, and; 3) substitution for stationary concrete pumps. Concrete mixing stations saw a CAGR of 37% during the same period, followed by concrete mixing truck (30%), and stationary concrete pumps (11%).
Exhibit 90. China concrete machinery market (09)
Zoomlion, RMB7.2bn,
24%
Sany, RMB9.5bn,
32%Others,
RMB13.4bn, 44%
Source: Nomura estimates
Exhibit 91. Ownership of concrete machineries (09)
77
48
25 22
0102030405060708090
Concretemixing truck
Stationarypump
Truck-mountedconcrete
pump
Concretemixing station
('000 units)
Note: Truck-mounted concrete pump ASP: RMB3-5mn; Stationary concrete pump ASP: RMB400-600k; Concrete-mixing trucks ASP: RMB300-500k.
Source: CEIC, Nomura research
We see this as an RMB50bn-plus market in China
SANY and Zoomlion the leading Chinese players
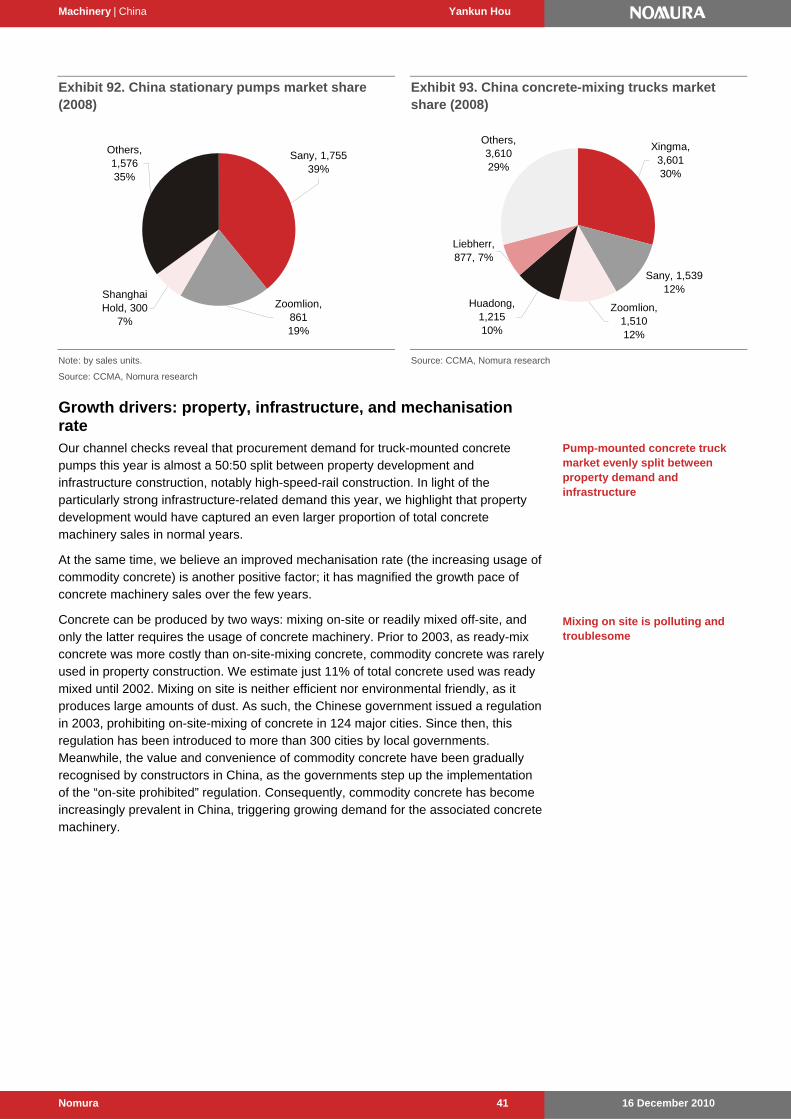
Machinery | China Yankun Hou
16 December 2010 Nomura 41
Exhibit 92. China stationary pumps market share (2008)
Sany, 1,75539%
Zoomlion, 86119%
Shanghai Hold, 300
7%
Others, 1,576 35%
Note: by sales units.
Source: CCMA, Nomura research
Exhibit 93. China concrete-mixing trucks market share (2008)
Huadong, 1,21510%
Zoomlion, 1,51012%
Sany, 1,53912%
Xingma, 3,60130%
Others, 3,61029%
Liebherr, 877, 7%
Source: CCMA, Nomura research
Growth drivers: property, infrastructure, and mechanisation rate Our channel checks reveal that procurement demand for truck-mounted concrete pumps this year is almost a 50:50 split between property development and infrastructure construction, notably high-speed-rail construction. In light of the particularly strong infrastructure-related demand this year, we highlight that property development would have captured an even larger proportion of total concrete machinery sales in normal years.
At the same time, we believe an improved mechanisation rate (the increasing usage of commodity concrete) is another positive factor; it has magnified the growth pace of concrete machinery sales over the few years.
Concrete can be produced by two ways: mixing on-site or readily mixed off-site, and only the latter requires the usage of concrete machinery. Prior to 2003, as ready-mix concrete was more costly than on-site-mixing concrete, commodity concrete was rarely used in property construction. We estimate just 11% of total concrete used was ready mixed until 2002. Mixing on site is neither efficient nor environmental friendly, as it produces large amounts of dust. As such, the Chinese government issued a regulation in 2003, prohibiting on-site-mixing of concrete in 124 major cities. Since then, this regulation has been introduced to more than 300 cities by local governments. Meanwhile, the value and convenience of commodity concrete have been gradually recognised by constructors in China, as the governments step up the implementation of the “on-site prohibited” regulation. Consequently, commodity concrete has become increasingly prevalent in China, triggering growing demand for the associated concrete machinery.
Pump-mounted concrete truck market evenly split between property demand and infrastructure
Mixing on site is polluting and troublesome

Machinery | China Yankun Hou
16 December 2010 Nomura 42
Exhibit 94. Commodity concrete production vs truck-mounted concrete pump sales
0
1,000
2,000
3,000
4,000
5,000
6,000
7,000
2002 2003 2004 2005 2006 2007 2008 2009
(Units)
0
50
100
150
200
250
300
350
400
450Truck-mounted concrete pump sales (LHS)
Commodity concrete production (RHS)
(mn cubic m)
Source: CCMA, CEIC, Nomura research
Exhibit 95. Increasing usage of commodity concrete
40
33
29
23
191814
11
0
50
100
150
200
250
300
350
400
450
2002 2003 2004 2005 2006 2007 2008 2009
(mn cubic m)
0
5
10
15
20
25
30
35
40
45
Production of commodityconcrete (LHS)
Commodity concrete as % in totalconcrete production (RHS)
(%)
Source: CEIC, Nomura research
Industry growth forecasts In our view, 2010 is likely to be a record year for concrete machinery sales, as SANY and Zoomlion achieved 100%-plus y-y growth in 1H10. We maintain our Bullish stance on concrete machinery companies for the medium to long term, due to:
Continued rise in the usage of commodity concrete. The average consumption of commodity concrete is 0.3 tonne / person in China, compared to 1.6 tonne / person in Japan and 0.7 tonne / person in the US, according to China Cement and Concrete Web. Moreover, although the “on-site-mixing prohibiting” policy has been implemented for years, it has not yet been introduced or strictly implemented in most third- and fourth-tier cities, notably in central and western China. These all imply significant potential upside for commodity concrete and concrete machinery companies in China.
Rapid urbanisation in China is creating huge demand for housing, and the accompanying demand for civic infrastructure works.
However, for 2011F, we estimate the annual growth of concrete machinery sales will slow to around 20%, against the high base this year and a slowdown in infrastructure construction projects. Yet, it will still outpace most of other sub-segments, as we estimate the commodity concrete ratio and exposure to property construction will remain high in 2011F.
Exhibit 96. Avg. annual consumption of commodity concrete
1.6
0.9
0.70.6
0.3
0.0
0.2
0.4
0.6
0.8
1.0
1.2
1.4
1.6
1.8
Japan Germany US Europeanaverage
China
(ton/person)
Source: China Cement and Concrete Web, Nomura research
Exhibit 97. Regional commodity concrete ratios
National average: 40%42% 39%
67%
23% 23%36% 33%
0
10
20
30
40
50
60
70
80
Nor
thC
hina
Wes
tC
hina
Eas
tC
hina
Cen
tral
Chi
na
Sou
thC
hina
Sou
thw
est
Nor
thea
st
(%)
Source: China Cement and Concrete Web, Nomura research
Bullish on concrete machinery

Machinery | China Yankun Hou
16 December 2010 Nomura 43
Upgrading product mix Stationary pumps and truck-mounted pumps are the two major types of concrete-pouring machinery, and could act as a substitute for each other. Sold at much higher prices, truck-mounted pumps feature twice-higher working efficiency, much greater mobility, and lower difficulty for set-up than stationary pumps, and thus have been regarded as an upgraded version for the traditional stationary pump. We note that the truck-mounted pump has been rapidly gaining share from the stationary pump over the past one decade, due mainly to: 1) rising affordability of Chinese machinery uses, and; 2) a downward pricing trend owing to local players’ remarkable success venturing into this segment. With relatively high ASP and strong purchase demand, the truck-mounted concrete pump has grown to be the largest sub-segment of concrete machinery in China in terms of annual sales value. We believe this upgrade is likely to continue on growing demand for working efficiency and rising purchasing power.
Exhibit 98. Truck-mounted concrete pump gains ground
0
1,000
2,000
3,000
4,000
5,000
6,000
7,000
2000
2001
2002
2003
2004
2005
2006
2007
2008
2009
(Units)
0
1
2
3
4
5
6
7
8
Annual sales of stationary pumps (LHS)
Annual sales of truck-mounted pumps (LHS)
Annual sales comparison: stationary pump v.s.truck-mounted pump (RHS)
Source: CCMA, Nomura research
Exhibit 99. Truck-mounted vs stationary concrete pump comparison
Source: CCMA, Nomura research
Truck-mounted
concrete pump
Stationary concrete
pump
Mobility High Low
Difficulty for set-up Low High
Pumping efficiency 80-170 (cubic m / h) 30-100 (cubic m / h)
Scope of reach 30-72m (depending
on arm length)
< 600m
ASP (RMB1,000) 3,000-5,000 400-600
Profitability analysis Due largely to relatively high industry concentration, the concrete machinery segment has enjoyed the highest profitability across all segments in China’s construction machinery industry, with segment net margin hitting 10.4% in 2008. Industry leaders, SANY and Zoomlion, have also managed to achieve impressive margin profiles, backed by their dominant positions. The gross margin of SANY’s concrete machinery business has been on an uptrend since FY04, owing to its improved product quality and successful marketing. On the other hand, after four years of expansion, Zoomlion’s gross margin for concrete machinery dropped to 28% in 2008, and stayed flat in 2009, which we believe could partially be explained by the sudden jump in its depreciation costs associated with new plant construction.
This is the most profitable part of the local construction machinery market
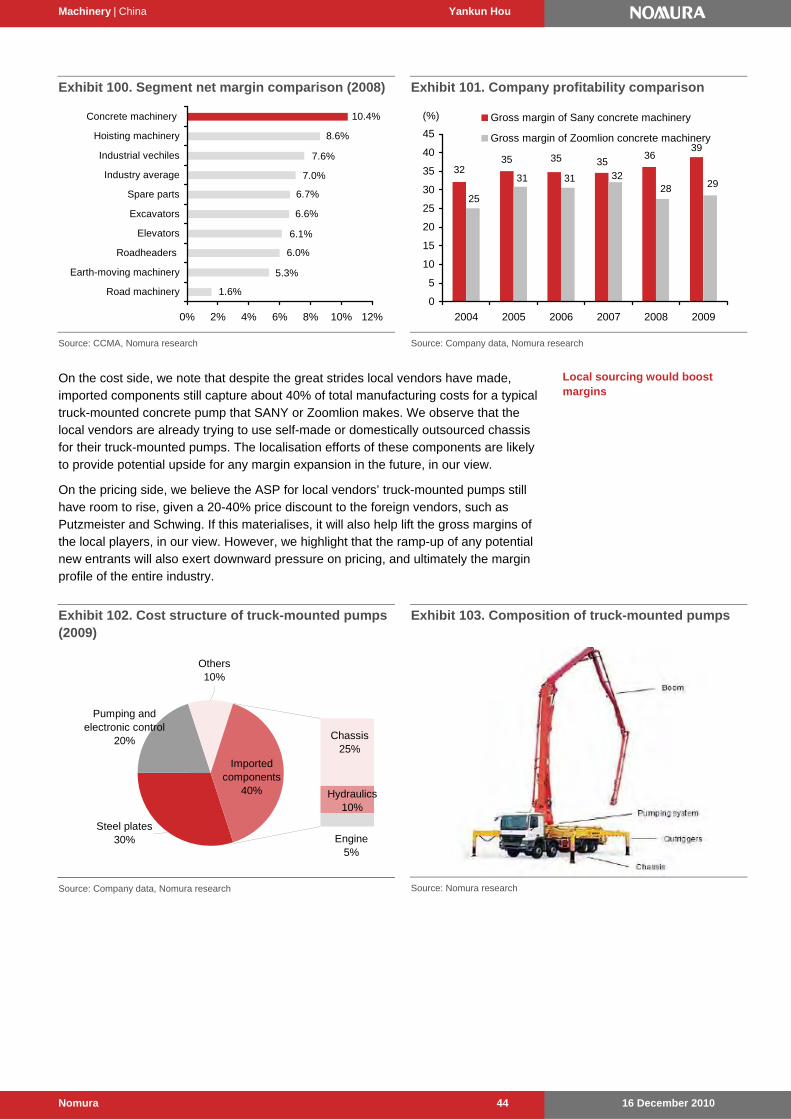
Machinery | China Yankun Hou
16 December 2010 Nomura 44
Exhibit 100. Segment net margin comparison (2008)
10.4%
8.6%
7.6%
7.0%
1.6%
5.3%
6.0%
6.1%
6.6%
6.7%
0% 2% 4% 6% 8% 10% 12%
Road machinery
Earth-moving machinery
Roadheaders
Elevators
Excavators
Spare parts
Industry average
Industrial vechiles
Hoisting machinery
Concrete machinery
Source: CCMA, Nomura research
Exhibit 101. Company profitability comparison
3936
35353532
28323131
25
29
0
5
10
15
20
25
30
35
40
45
2004 2005 2006 2007 2008 2009
(%) Gross margin of Sany concrete machinery
Gross margin of Zoomlion concrete machinery
Source: Company data, Nomura research
On the cost side, we note that despite the great strides local vendors have made, imported components still capture about 40% of total manufacturing costs for a typical truck-mounted concrete pump that SANY or Zoomlion makes. We observe that the local vendors are already trying to use self-made or domestically outsourced chassis for their truck-mounted pumps. The localisation efforts of these components are likely to provide potential upside for any margin expansion in the future, in our view.
On the pricing side, we believe the ASP for local vendors’ truck-mounted pumps still have room to rise, given a 20-40% price discount to the foreign vendors, such as Putzmeister and Schwing. If this materialises, it will also help lift the gross margins of the local players, in our view. However, we highlight that the ramp-up of any potential new entrants will also exert downward pressure on pricing, and ultimately the margin profile of the entire industry.
Exhibit 102. Cost structure of truck-mounted pumps (2009)
Hydraulics10%
Engine5%
Imported components
40%
Steel plates30%
Others10%
Chassis25%
Pumping and electronic control
20%
Source: Company data, Nomura research
Exhibit 103. Composition of truck-mounted pumps
Source: Nomura research
Local sourcing would boost margins
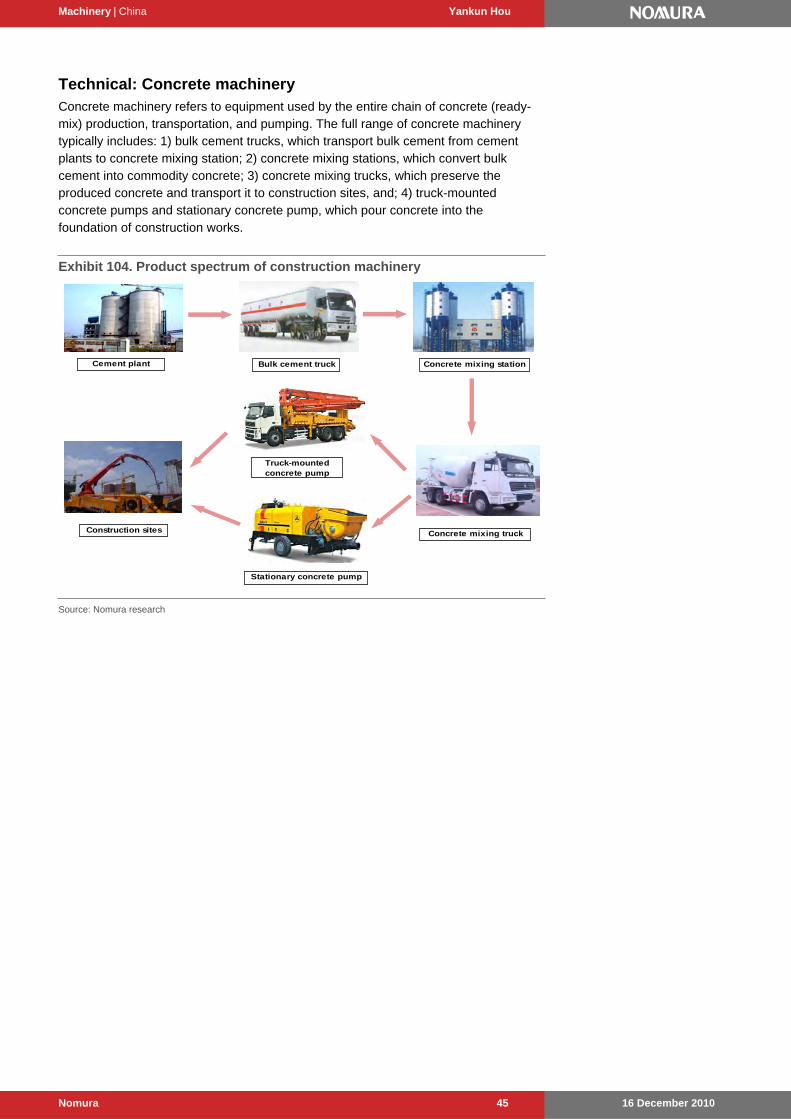
Machinery | China Yankun Hou
16 December 2010 Nomura 45
Technical: Concrete machinery Concrete machinery refers to equipment used by the entire chain of concrete (ready-mix) production, transportation, and pumping. The full range of concrete machinery typically includes: 1) bulk cement trucks, which transport bulk cement from cement plants to concrete mixing station; 2) concrete mixing stations, which convert bulk cement into commodity concrete; 3) concrete mixing trucks, which preserve the produced concrete and transport it to construction sites, and; 4) truck-mounted concrete pumps and stationary concrete pump, which pour concrete into the foundation of construction works.
Exhibit 104. Product spectrum of construction machinery
Cement plant Bulk cement truck Concrete mixing station
Concrete mixing truck
Truck-mountedconcrete pump
Stationary concrete pump
Construction sites
Source: Nomura research
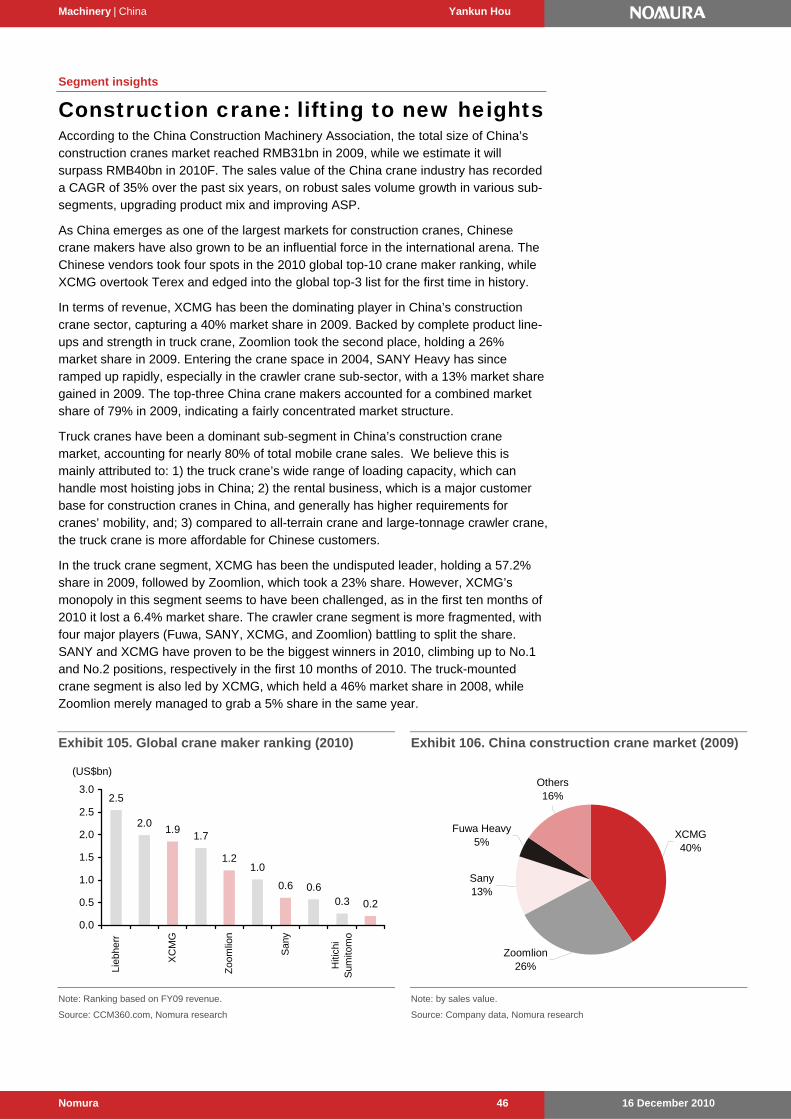
Machinery | China Yankun Hou
16 December 2010 Nomura 46
Segment insights
Construction crane: lifting to new heights According to the China Construction Machinery Association, the total size of China’s construction cranes market reached RMB31bn in 2009, while we estimate it will surpass RMB40bn in 2010F. The sales value of the China crane industry has recorded a CAGR of 35% over the past six years, on robust sales volume growth in various sub-segments, upgrading product mix and improving ASP.
As China emerges as one of the largest markets for construction cranes, Chinese crane makers have also grown to be an influential force in the international arena. The Chinese vendors took four spots in the 2010 global top-10 crane maker ranking, while XCMG overtook Terex and edged into the global top-3 list for the first time in history.
In terms of revenue, XCMG has been the dominating player in China’s construction crane sector, capturing a 40% market share in 2009. Backed by complete product line-ups and strength in truck crane, Zoomlion took the second place, holding a 26% market share in 2009. Entering the crane space in 2004, SANY Heavy has since ramped up rapidly, especially in the crawler crane sub-sector, with a 13% market share gained in 2009. The top-three China crane makers accounted for a combined market share of 79% in 2009, indicating a fairly concentrated market structure.
Truck cranes have been a dominant sub-segment in China’s construction crane market, accounting for nearly 80% of total mobile crane sales. We believe this is mainly attributed to: 1) the truck crane’s wide range of loading capacity, which can handle most hoisting jobs in China; 2) the rental business, which is a major customer base for construction cranes in China, and generally has higher requirements for cranes’ mobility, and; 3) compared to all-terrain crane and large-tonnage crawler crane, the truck crane is more affordable for Chinese customers.
In the truck crane segment, XCMG has been the undisputed leader, holding a 57.2% share in 2009, followed by Zoomlion, which took a 23% share. However, XCMG’s monopoly in this segment seems to have been challenged, as in the first ten months of 2010 it lost a 6.4% market share. The crawler crane segment is more fragmented, with four major players (Fuwa, SANY, XCMG, and Zoomlion) battling to split the share. SANY and XCMG have proven to be the biggest winners in 2010, climbing up to No.1 and No.2 positions, respectively in the first 10 months of 2010. The truck-mounted crane segment is also led by XCMG, which held a 46% market share in 2008, while Zoomlion merely managed to grab a 5% share in the same year.
Exhibit 105. Global crane maker ranking (2010)
2.5
2.01.9
1.7
1.21.0
0.6 0.60.3 0.2
0.0
0.5
1.0
1.5
2.0
2.5
3.0
Lieb
herr
XC
MG
Zoo
mlio
n
San
y
Hiti
chi
Sum
itom
o
(US$bn)
Note: Ranking based on FY09 revenue.
Source: CCM360.com, Nomura research
Exhibit 106. China construction crane market (2009)
Others16%
Fuwa Heavy5%
Sany13%
Zoomlion26%
XCMG40%
Note: by sales value.
Source: Company data, Nomura research
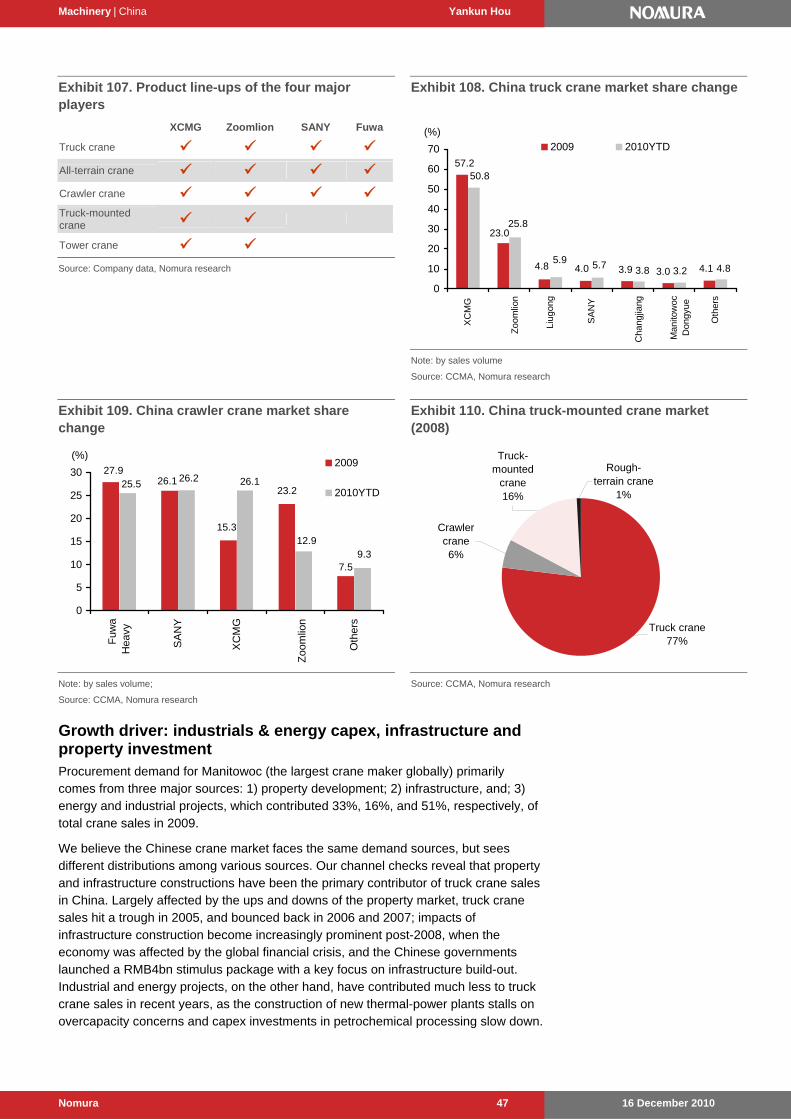
Machinery | China Yankun Hou
16 December 2010 Nomura 47
Exhibit 107. Product line-ups of the four major players
XCMG Zoomlion SANY Fuwa
Truck crane
All-terrain crane
Crawler crane
Truck-mounted crane
Tower crane
Source: Company data, Nomura research
Exhibit 108. China truck crane market share change
3.2
57.2
23.0
4.8 4.0 3.9 3.0 4.1
50.8
25.8
5.9 5.7 3.8 4.8
0
10
20
30
40
50
60
70
X
CM
G
Zoo
mlio
n
L
iugo
ng
S
AN
Y
Cha
ngjia
ng
Man
itow
ocD
ongy
ue
Oth
ers
2009 2010YTD(%)
Note: by sales volume
Source: CCMA, Nomura research
Exhibit 109. China crawler crane market share change
27.926.1
15.3
23.2
7.5
25.526.2 26.1
12.99.3
0
5
10
15
20
25
30
Fuw
aH
eavy
SA
NY
XC
MG
Zoo
mlio
n
Oth
ers
2009
2010YTD
(%)
Note: by sales volume;
Source: CCMA, Nomura research
Exhibit 110. China truck-mounted crane market (2008)
Truck crane77%
Crawler crane6%
Truck-mounted
crane16%
Rough-terrain crane
1%
Source: CCMA, Nomura research
Growth driver: industrials & energy capex, infrastructure and property investment Procurement demand for Manitowoc (the largest crane maker globally) primarily comes from three major sources: 1) property development; 2) infrastructure, and; 3) energy and industrial projects, which contributed 33%, 16%, and 51%, respectively, of total crane sales in 2009.
We believe the Chinese crane market faces the same demand sources, but sees different distributions among various sources. Our channel checks reveal that property and infrastructure constructions have been the primary contributor of truck crane sales in China. Largely affected by the ups and downs of the property market, truck crane sales hit a trough in 2005, and bounced back in 2006 and 2007; impacts of infrastructure construction become increasingly prominent post-2008, when the economy was affected by the global financial crisis, and the Chinese governments launched a RMB4bn stimulus package with a key focus on infrastructure build-out. Industrial and energy projects, on the other hand, have contributed much less to truck crane sales in recent years, as the construction of new thermal-power plants stalls on overcapacity concerns and capex investments in petrochemical processing slow down.
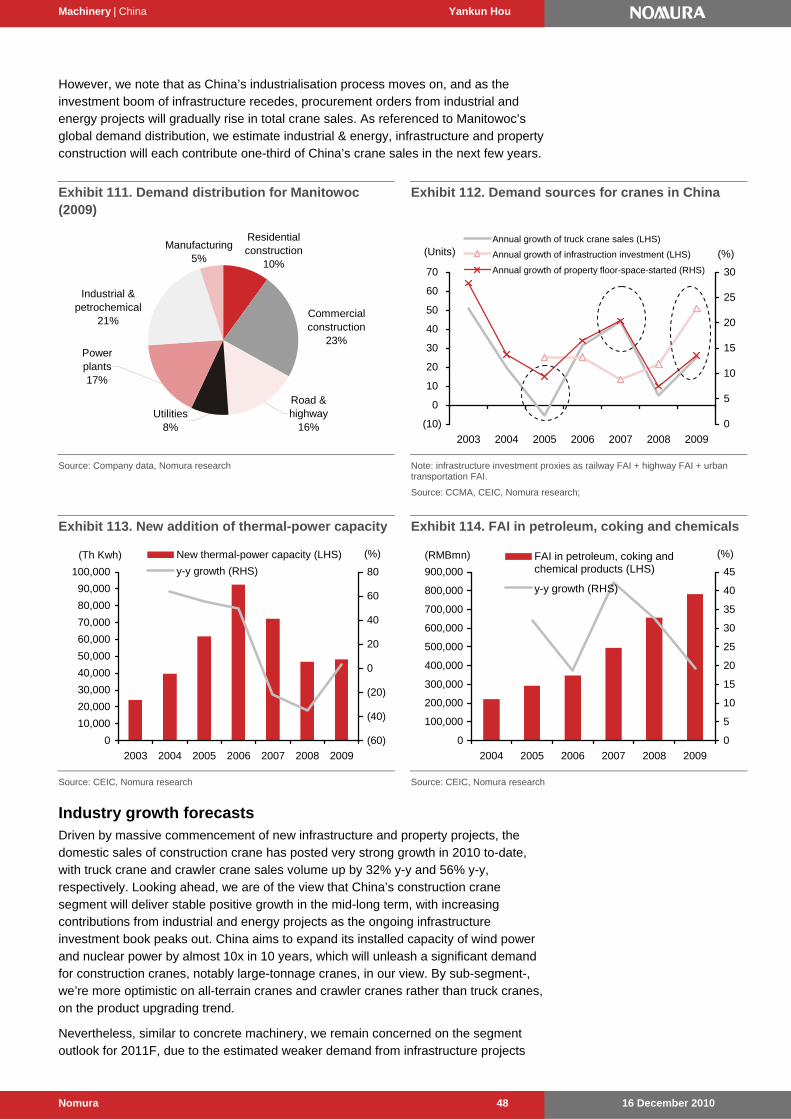
Machinery | China Yankun Hou
16 December 2010 Nomura 48
However, we note that as China’s industrialisation process moves on, and as the investment boom of infrastructure recedes, procurement orders from industrial and energy projects will gradually rise in total crane sales. As referenced to Manitowoc’s global demand distribution, we estimate industrial & energy, infrastructure and property construction will each contribute one-third of China’s crane sales in the next few years.
Exhibit 111. Demand distribution for Manitowoc (2009)
Utilities8%
Power plants17%
Road & highway
16%
Industrial & petrochemical
21%
Manufacturing5%
Commercial construction
23%
Residential construction
10%
Source: Company data, Nomura research
Exhibit 112. Demand sources for cranes in China
(10)
0
10
20
30
40
50
60
70
2003 2004 2005 2006 2007 2008 2009
(Units)
0
5
10
15
20
25
30
Annual growth of truck crane sales (LHS)
Annual growth of infrastruction investment (LHS)
Annual growth of property floor-space-started (RHS)
(%)
Note: infrastructure investment proxies as railway FAI + highway FAI + urban transportation FAI.
Source: CCMA, CEIC, Nomura research;
Exhibit 113. New addition of thermal-power capacity
0
10,000
20,000
30,000
40,000
50,000
60,000
70,000
80,000
90,000
100,000
2003 2004 2005 2006 2007 2008 2009
(Th Kwh)
(60)
(40)
(20)
0 %
20
40
60
80
New thermal-power capacity (LHS)
y-y growth (RHS)
(%)
Source: CEIC, Nomura research
Exhibit 114. FAI in petroleum, coking and chemicals
0
100,000
200,000
300,000
400,000
500,000
600,000
700,000
800,000
900,000
2004 2005 2006 2007 2008 2009
(RMBmn)
0
5
10
15
20
25
30
35
40
45
FAI in petroleum, coking andchemical products (LHS)
y-y growth (RHS)
(%)
Source: CEIC, Nomura research
Industry growth forecasts Driven by massive commencement of new infrastructure and property projects, the domestic sales of construction crane has posted very strong growth in 2010 to-date, with truck crane and crawler crane sales volume up by 32% y-y and 56% y-y, respectively. Looking ahead, we are of the view that China’s construction crane segment will deliver stable positive growth in the mid-long term, with increasing contributions from industrial and energy projects as the ongoing infrastructure investment book peaks out. China aims to expand its installed capacity of wind power and nuclear power by almost 10x in 10 years, which will unleash a significant demand for construction cranes, notably large-tonnage cranes, in our view. By sub-segment-, we’re more optimistic on all-terrain cranes and crawler cranes rather than truck cranes, on the product upgrading trend.
Nevertheless, similar to concrete machinery, we remain concerned on the segment outlook for 2011F, due to the estimated weaker demand from infrastructure projects
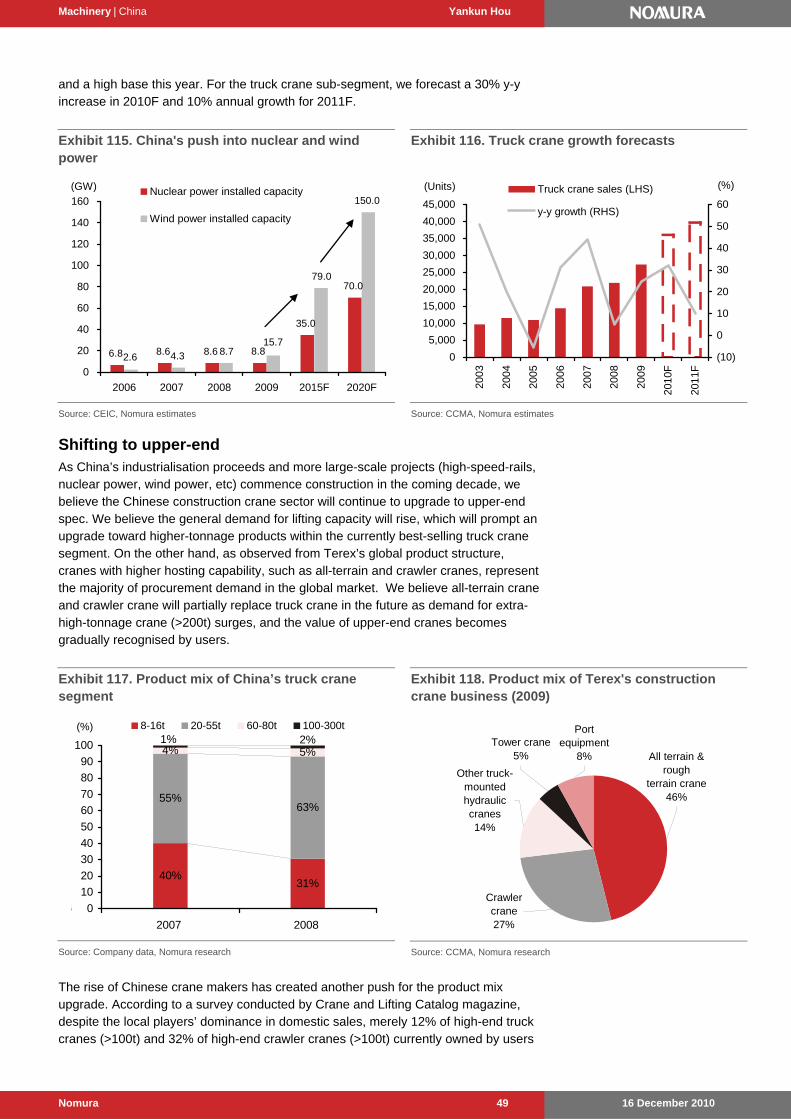
Machinery | China Yankun Hou
16 December 2010 Nomura 49
and a high base this year. For the truck crane sub-segment, we forecast a 30% y-y increase in 2010F and 10% annual growth for 2011F.
Exhibit 115. China's push into nuclear and wind power
6.8 8.6 8.6 8.8
35.0
70.0
150.0
79.0
15.78.74.32.6
0
20
40
60
80
100
120
140
160
2006 2007 2008 2009 2015F 2020F
(GW) Nuclear power installed capacity
Wind power installed capacity
Source: CEIC, Nomura estimates
Exhibit 116. Truck crane growth forecasts
0
5,000
10,000
15,000
20,000
25,000
30,000
35,000
40,000
45,000
2003
2004
2005
2006
2007
2008
2009
2010
F
2011
F
(Units)
(10)
0
10
20
30
40
50
60
Truck crane sales (LHS)
y-y growth (RHS)
(%)
Source: CCMA, Nomura estimates
Shifting to upper-end As China’s industrialisation proceeds and more large-scale projects (high-speed-rails, nuclear power, wind power, etc) commence construction in the coming decade, we believe the Chinese construction crane sector will continue to upgrade to upper-end spec. We believe the general demand for lifting capacity will rise, which will prompt an upgrade toward higher-tonnage products within the currently best-selling truck crane segment. On the other hand, as observed from Terex’s global product structure, cranes with higher hosting capability, such as all-terrain and crawler cranes, represent the majority of procurement demand in the global market. We believe all-terrain crane and crawler crane will partially replace truck crane in the future as demand for extra-high-tonnage crane (>200t) surges, and the value of upper-end cranes becomes gradually recognised by users.
Exhibit 117. Product mix of China’s truck crane segment
40%31%
55%63%
4% 5%1% 2%
% 0
10
20
30
40
50
60
70
80
90
100
2007 2008
8-16t 20-55t 60-80t 100-300t (%)
Source: Company data, Nomura research
Exhibit 118. Product mix of Terex's construction crane business (2009)
Port equipment
8%Tower crane
5%
Other truck-mounted hydraulic cranes14%
Crawler crane27%
All terrain & rough
terrain crane46%
Source: CCMA, Nomura research
The rise of Chinese crane makers has created another push for the product mix upgrade. According to a survey conducted by Crane and Lifting Catalog magazine, despite the local players’ dominance in domestic sales, merely 12% of high-end truck cranes (>100t) and 32% of high-end crawler cranes (>100t) currently owned by users
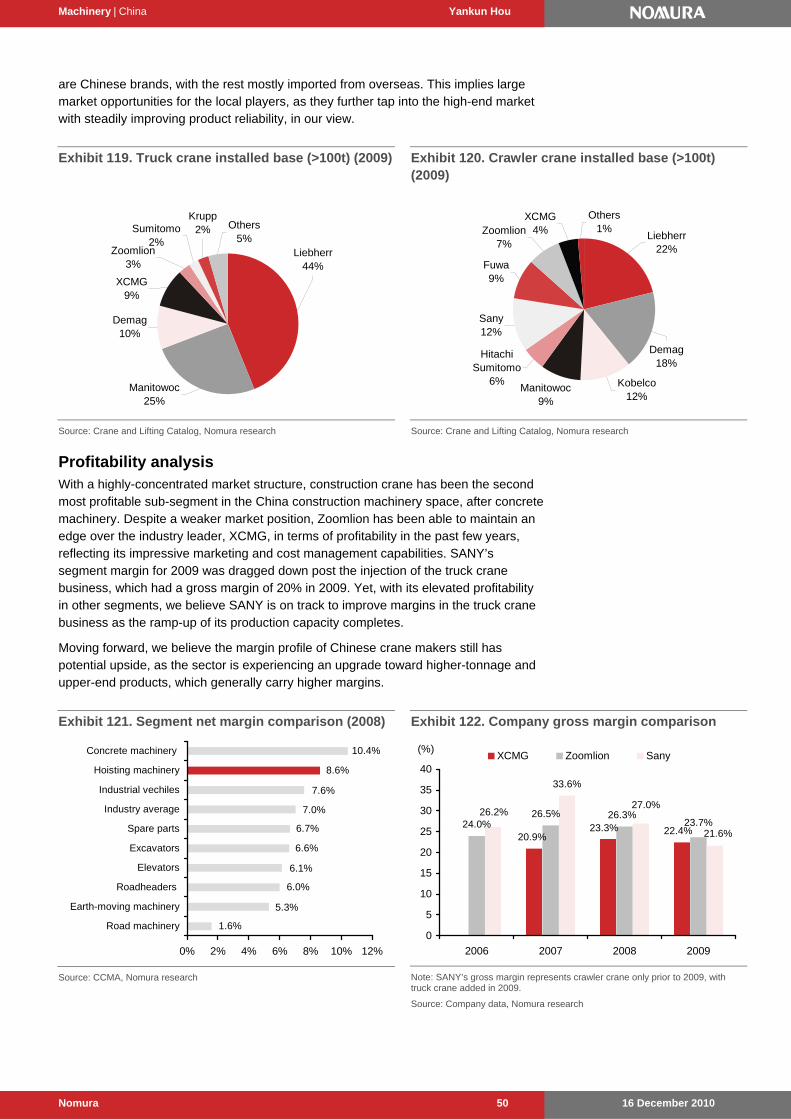
Machinery | China Yankun Hou
16 December 2010 Nomura 50
are Chinese brands, with the rest mostly imported from overseas. This implies large market opportunities for the local players, as they further tap into the high-end market with steadily improving product reliability, in our view.
Exhibit 119. Truck crane installed base (>100t) (2009)
Sumitomo2%
Krupp2% Others
5%Zoomlion
3%
XCMG9%
Demag10%
Manitowoc25%
Liebherr44%
Source: Crane and Lifting Catalog, Nomura research
Exhibit 120. Crawler crane installed base (>100t) (2009)
Liebherr22%
Demag18%
Kobelco12%
Manitowoc9%
Hitachi Sumitomo
6%
Others1%
XCMG4%Zoomlion
7%
Fuwa9%
Sany12%
Source: Crane and Lifting Catalog, Nomura research
Profitability analysis With a highly-concentrated market structure, construction crane has been the second most profitable sub-segment in the China construction machinery space, after concrete machinery. Despite a weaker market position, Zoomlion has been able to maintain an edge over the industry leader, XCMG, in terms of profitability in the past few years, reflecting its impressive marketing and cost management capabilities. SANY’s segment margin for 2009 was dragged down post the injection of the truck crane business, which had a gross margin of 20% in 2009. Yet, with its elevated profitability in other segments, we believe SANY is on track to improve margins in the truck crane business as the ramp-up of its production capacity completes.
Moving forward, we believe the margin profile of Chinese crane makers still has potential upside, as the sector is experiencing an upgrade toward higher-tonnage and upper-end products, which generally carry higher margins.
Exhibit 121. Segment net margin comparison (2008)
10.4%
8.6%
7.6%
7.0%
1.6%
5.3%
6.0%
6.1%
6.6%
6.7%
0% 2% 4% 6% 8% 10% 12%
Road machinery
Earth-moving machinery
Roadheaders
Elevators
Excavators
Spare parts
Industry average
Industrial vechiles
Hoisting machinery
Concrete machinery
Source: CCMA, Nomura research
Exhibit 122. Company gross margin comparison
24.0%
33.6%
22.4%23.3%20.9%
26.3%26.5%23.7%
21.6%
27.0%26.2%
0
5
10
15
20
25
30
35
40
2006 2007 2008 2009
XCMG Zoomlion Sany(%)
Note: SANY’s gross margin represents crawler crane only prior to 2009, with truck crane added in 2009.
Source: Company data, Nomura research
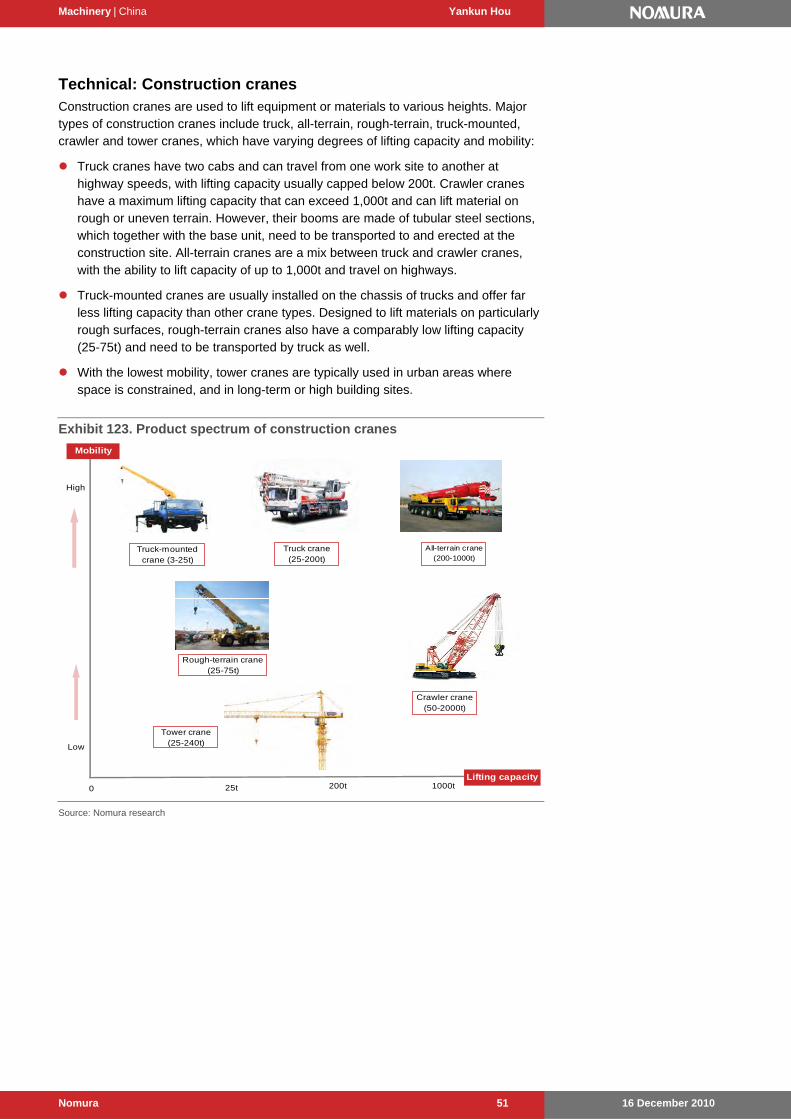
Machinery | China Yankun Hou
16 December 2010 Nomura 51
Technical: Construction cranes Construction cranes are used to lift equipment or materials to various heights. Major types of construction cranes include truck, all-terrain, rough-terrain, truck-mounted, crawler and tower cranes, which have varying degrees of lifting capacity and mobility:
Truck cranes have two cabs and can travel from one work site to another at highway speeds, with lifting capacity usually capped below 200t. Crawler cranes have a maximum lifting capacity that can exceed 1,000t and can lift material on rough or uneven terrain. However, their booms are made of tubular steel sections, which together with the base unit, need to be transported to and erected at the construction site. All-terrain cranes are a mix between truck and crawler cranes, with the ability to lift capacity of up to 1,000t and travel on highways.
Truck-mounted cranes are usually installed on the chassis of trucks and offer far less lifting capacity than other crane types. Designed to lift materials on particularly rough surfaces, rough-terrain cranes also have a comparably low lifting capacity (25-75t) and need to be transported by truck as well.
With the lowest mobility, tower cranes are typically used in urban areas where space is constrained, and in long-term or high building sites.
Exhibit 123. Product spectrum of construction cranes
Truck-mountedcrane (3-25t)
Truck crane(25-200t)
All-terrain crane(200-1000t)
Crawler crane(50-2000t)
Rough-terrain crane(25-75t)
Tower crane(25-240t)
Mobility
Lifting capacity
High
Low
0 25t 200t 1000t
Source: Nomura research

Machinery | China Yankun Hou
16 December 2010 Nomura 52
Segment insights
Wheel loaders: glories in yesterday Wheel loaders are another type of earth-moving machinery primarily used to load materials into various types of vehicles, such as dump trucks and trains. As touched on in the previous section, wheel loaders can also partially substitute excavators in some work environments, albeit with weaker capability and lower efficiency.
Based on sales volume, wheel loaders have been the most popular earth-moving machinery in China (over 140k units sold in 2009). We estimate that total wheel loader market size surpassed RMB30bn in 2009 and could reach RMB45bn in 2010F. Already in its mature stage, wheel loader sales volumes have grown much slower than in other segments over the past few years, at a five-year CAGR of 9.4%. Due to high base effect, substitution from excavators, and peaking newly started projects, we forecast volume growth of only 5% y-y for 2011F.
China’s wheel loader market has been dominated by local players, with the traditional mainstays Lonking, Liugong and XGMA commanding a combined 53.1% market share in the YTD. Lonking, the only private firm among the three, has steadily gained market share over the past few years, chased closely by Liugong for the lead. Liugong has seen its market share retreated by 1.8% so far this year, after a 3.1% gain in 2009. As a laggard, XGMA has managed to narrow its market-share gap from the top two to 2% in the YTD. As a whole, the top-three players’ dominance has become increasingly prominent, with their combined market share expanding by 8.1% since 2004.
China’s wheel loader product mix has also seen upgrades in the past couple of years, with the share of 5-tonne products growing to 70% in the YTD, from 56% in 2007, and the share of 3-tonne products shrinking to 21% in the YTD, from 29% in 2007. We believe that the improving product mix is at least partly attributable to the opening of large-scale construction projects in China, and to some extent has enhanced wheel loader vendors’ margin profiles, given that large-tonnage products usually carry higher profitability.
Exhibit 124. China: wheel loader market (2010 YTD)
Others12.9%
Shangong5.4%
Changlin3.0%
XCMG6.1%
Lingong13.5%
XGMA16.3%
Lonking18.3%
Liugong18.5%
Chengdu Kobelco (Chenggong)
6.0%
Source: CCMA, Nomura research
Exhibit 125. China: market share trend of the Big 3
12 13 14 15 16 17 18 19 20 21 22
2004
2005
2006
2007
2008
2009
2010
YT
D
Liugong Lonking XGMA(%)
Source: CCMA, Nomura research
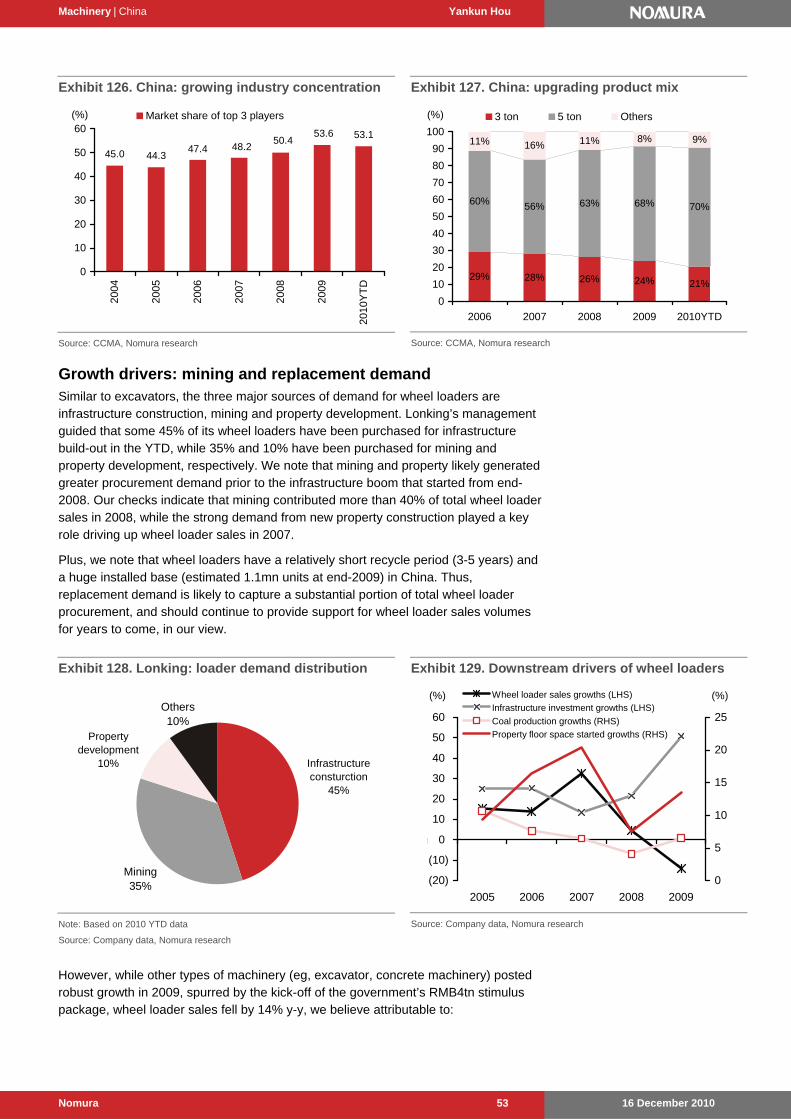
Machinery | China Yankun Hou
16 December 2010 Nomura 53
Exhibit 126. China: growing industry concentration
45.0 44.3
53.153.650.4
48.247.4
0
10
20
30
40
50
60
2004
2005
2006
2007
2008
2009
2010
YT
D
Market share of top 3 players(%)
Source: CCMA, Nomura research
Exhibit 127. China: upgrading product mix
29% 28% 26% 24% 21%
60% 56% 63% 68% 70%
11% 16% 11% 8% 9%
0
10
20
30
40
50
60
70
80
90
100
2006 2007 2008 2009 2010YTD
3 ton 5 ton Others(%)
Source: CCMA, Nomura research
Growth drivers: mining and replacement demand Similar to excavators, the three major sources of demand for wheel loaders are infrastructure construction, mining and property development. Lonking’s management guided that some 45% of its wheel loaders have been purchased for infrastructure build-out in the YTD, while 35% and 10% have been purchased for mining and property development, respectively. We note that mining and property likely generated greater procurement demand prior to the infrastructure boom that started from end-2008. Our checks indicate that mining contributed more than 40% of total wheel loader sales in 2008, while the strong demand from new property construction played a key role driving up wheel loader sales in 2007.
Plus, we note that wheel loaders have a relatively short recycle period (3-5 years) and a huge installed base (estimated 1.1mn units at end-2009) in China. Thus, replacement demand is likely to capture a substantial portion of total wheel loader procurement, and should continue to provide support for wheel loader sales volumes for years to come, in our view.
Exhibit 128. Lonking: loader demand distribution
Mining35%
Others 10%
Property development
10% Infrastructure consturction
45%
Note: Based on 2010 YTD data
Source: Company data, Nomura research
Exhibit 129. Downstream drivers of wheel loaders
(20)
(10)
% 0
10
20
30
40
50
60
2005 2006 2007 2008 2009
0
5
10
15
20
25
Wheel loader sales growths (LHS)
Infrastructure investment growths (LHS)
Coal production growths (RHS)
Property floor space started growths (RHS)
(%) (%)
Source: Company data, Nomura research
However, while other types of machinery (eg, excavator, concrete machinery) posted robust growth in 2009, spurred by the kick-off of the government’s RMB4tn stimulus package, wheel loader sales fell by 14% y-y, we believe attributable to:
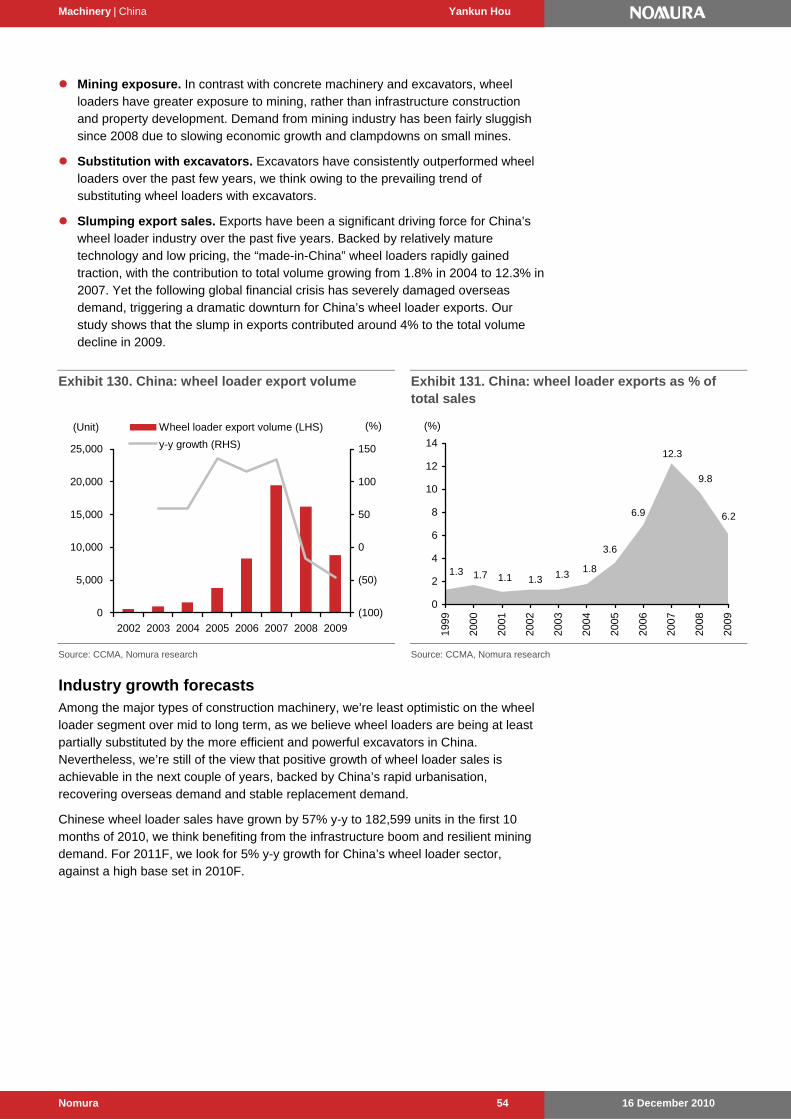
Machinery | China Yankun Hou
16 December 2010 Nomura 54
Mining exposure. In contrast with concrete machinery and excavators, wheel loaders have greater exposure to mining, rather than infrastructure construction and property development. Demand from mining industry has been fairly sluggish since 2008 due to slowing economic growth and clampdowns on small mines.
Substitution with excavators. Excavators have consistently outperformed wheel loaders over the past few years, we think owing to the prevailing trend of substituting wheel loaders with excavators.
Slumping export sales. Exports have been a significant driving force for China’s wheel loader industry over the past five years. Backed by relatively mature technology and low pricing, the “made-in-China” wheel loaders rapidly gained traction, with the contribution to total volume growing from 1.8% in 2004 to 12.3% in 2007. Yet the following global financial crisis has severely damaged overseas demand, triggering a dramatic downturn for China’s wheel loader exports. Our study shows that the slump in exports contributed around 4% to the total volume decline in 2009.
Exhibit 130. China: wheel loader export volume
0
5,000
10,000
15,000
20,000
25,000
2002 2003 2004 2005 2006 2007 2008 2009
(Unit)
(100)
(50)
0
50
100
150
Wheel loader export volume (LHS)
y-y growth (RHS)
(%)
Source: CCMA, Nomura research
Exhibit 131. China: wheel loader exports as % of total sales
6.9
3.6
1.81.31.31.11.71.3
12.3
9.8
6.2
0
2
4
6
8
10
12
1419
99
2000
2001
2002
2003
2004
2005
2006
2007
2008
2009
(%)
Source: CCMA, Nomura research
Industry growth forecasts Among the major types of construction machinery, we’re least optimistic on the wheel loader segment over mid to long term, as we believe wheel loaders are being at least partially substituted by the more efficient and powerful excavators in China. Nevertheless, we’re still of the view that positive growth of wheel loader sales is achievable in the next couple of years, backed by China’s rapid urbanisation, recovering overseas demand and stable replacement demand.
Chinese wheel loader sales have grown by 57% y-y to 182,599 units in the first 10 months of 2010, we think benefiting from the infrastructure boom and resilient mining demand. For 2011F, we look for 5% y-y growth for China’s wheel loader sector, against a high base set in 2010F.
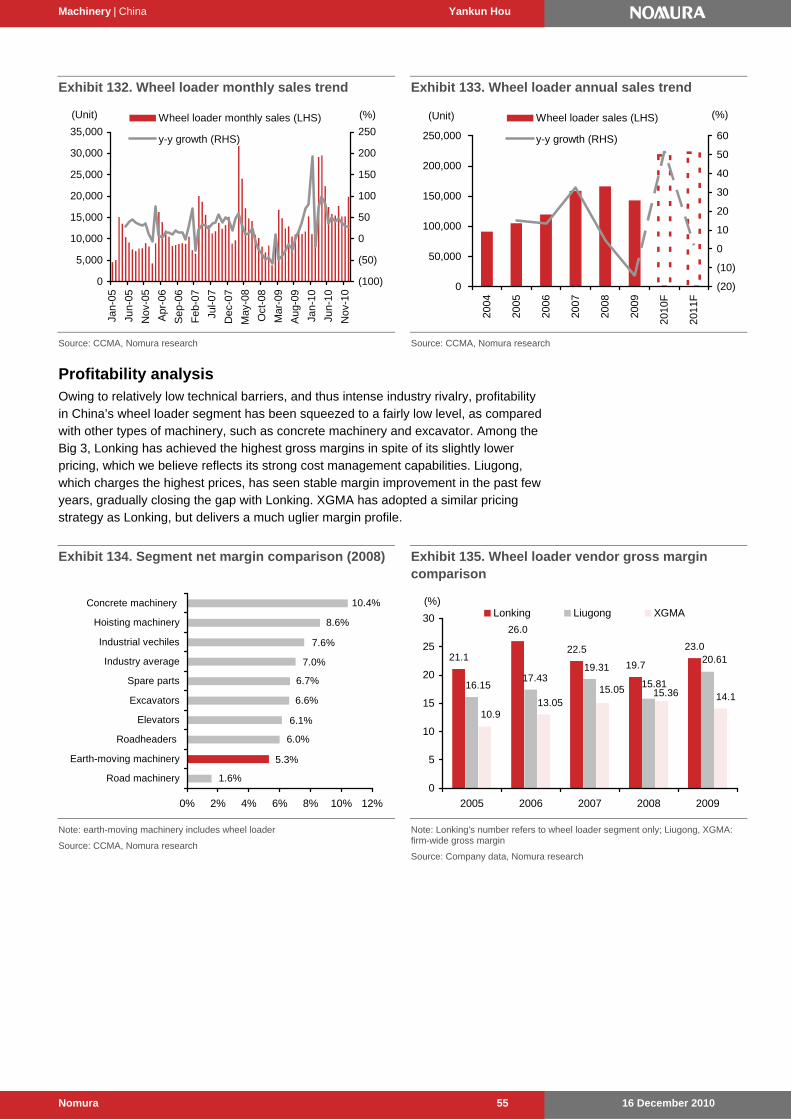
Machinery | China Yankun Hou
16 December 2010 Nomura 55
Exhibit 132. Wheel loader monthly sales trend
0
5,000
10,000
15,000
20,000
25,000
30,000
35,000
Jan-
05
Jun-
05
Nov
-05
Apr
-06
Sep
-06
Feb
-07
Jul-0
7
Dec
-07
May
-08
Oct
-08
Mar
-09
Aug
-09
Jan-
10
Jun-
10
Nov
-10
(100)
(50)
0
50
100
150
200
250Wheel loader monthly sales (LHS)
y-y growth (RHS)
(Unit) (%)
Source: CCMA, Nomura research
Exhibit 133. Wheel loader annual sales trend
0
50,000
100,000
150,000
200,000
250,000
2004
2005
2006
2007
2008
2009
2010
F
2011
F
(Unit)
(20)
(10)
0
10
20
30
40
50
60
Wheel loader sales (LHS)
y-y growth (RHS)
(%)
Source: CCMA, Nomura research
Profitability analysis Owing to relatively low technical barriers, and thus intense industry rivalry, profitability in China’s wheel loader segment has been squeezed to a fairly low level, as compared with other types of machinery, such as concrete machinery and excavator. Among the Big 3, Lonking has achieved the highest gross margins in spite of its slightly lower pricing, which we believe reflects its strong cost management capabilities. Liugong, which charges the highest prices, has seen stable margin improvement in the past few years, gradually closing the gap with Lonking. XGMA has adopted a similar pricing strategy as Lonking, but delivers a much uglier margin profile.
Exhibit 134. Segment net margin comparison (2008)
10.4%
6.7%
6.6%
6.1%
6.0%
5.3%
1.6%
7.0%
7.6%
8.6%
0% 2% 4% 6% 8% 10% 12%
Road machinery
Earth-moving machinery
Roadheaders
Elevators
Excavators
Spare parts
Industry average
Industrial vechiles
Hoisting machinery
Concrete machinery
Note: earth-moving machinery includes wheel loader
Source: CCMA, Nomura research
Exhibit 135. Wheel loader vendor gross margin comparison
21.1
26.0
22.5
19.7
23.020.61
15.81
19.3117.43
16.1514.115.3615.05
13.0510.9
0
5
10
15
20
25
30
2005 2006 2007 2008 2009
Lonking Liugong XGMA(%)
Note: Lonking's number refers to wheel loader segment only; Liugong, XGMA: firm-wide gross margin
Source: Company data, Nomura research
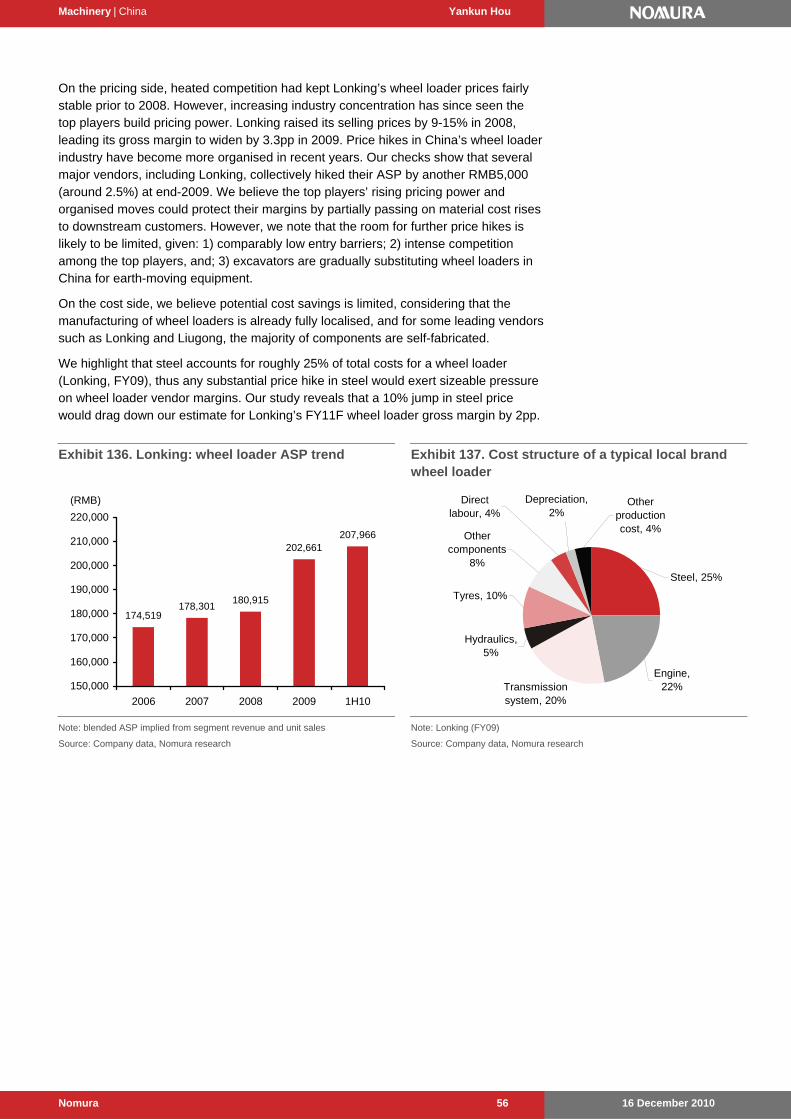
Machinery | China Yankun Hou
16 December 2010 Nomura 56
On the pricing side, heated competition had kept Lonking’s wheel loader prices fairly stable prior to 2008. However, increasing industry concentration has since seen the top players build pricing power. Lonking raised its selling prices by 9-15% in 2008, leading its gross margin to widen by 3.3pp in 2009. Price hikes in China’s wheel loader industry have become more organised in recent years. Our checks show that several major vendors, including Lonking, collectively hiked their ASP by another RMB5,000 (around 2.5%) at end-2009. We believe the top players’ rising pricing power and organised moves could protect their margins by partially passing on material cost rises to downstream customers. However, we note that the room for further price hikes is likely to be limited, given: 1) comparably low entry barriers; 2) intense competition among the top players, and; 3) excavators are gradually substituting wheel loaders in China for earth-moving equipment.
On the cost side, we believe potential cost savings is limited, considering that the manufacturing of wheel loaders is already fully localised, and for some leading vendors such as Lonking and Liugong, the majority of components are self-fabricated.
We highlight that steel accounts for roughly 25% of total costs for a wheel loader (Lonking, FY09), thus any substantial price hike in steel would exert sizeable pressure on wheel loader vendor margins. Our study reveals that a 10% jump in steel price would drag down our estimate for Lonking’s FY11F wheel loader gross margin by 2pp.
Exhibit 136. Lonking: wheel loader ASP trend
174,519178,301
180,915
202,661207,966
150,000
160,000
170,000
180,000
190,000
200,000
210,000
220,000
2006 2007 2008 2009 1H10
(RMB)
Note: blended ASP implied from segment revenue and unit sales
Source: Company data, Nomura research
Exhibit 137. Cost structure of a typical local brand wheel loader
Engine, 22%
Steel, 25%
Hydraulics, 5%
Tyres, 10%
Other production cost, 4%
Direct labour, 4%
Other components
8%
Transmission system, 20%
Depreciation, 2%
Note: Lonking (FY09)
Source: Company data, Nomura research
Machinery | China Yankun Hou
16 December 2010 Nomura 57
Appendix
Appendix: Lewisian turning point and China’s competitiveness
Sean Darby
According to Arthur Lewis, developing countries’ industrial wages begin to rise quickly at the point when the supply of surplus labour from the countryside tapers off, namely “The Lewisian turning point”. After analysing the micro-level data in six provinces of China, a paper issued by the IFPRI stated that the era of “unlimited labour supply” has already passed in China, and China’s labour-intensive and export-driven growth model will gradually lose its competitive advantage.
Over the course of the past 12 months, wages have risen in many Asian countries considered to be ‘cheap sources of labour’. Minimum monthly wages rose by 22% to US$61 in Cambodia, by 54% to US$43 in Bangladesh and by around 20% to US$88 in China. Despite that it is now the second-largest economy in the world (having overtaken Japan), China only produces 15% of the value-added in manufacturing, in contrast to the US, which contributes 24%, and the EU, which contributes 20%. Although Chinese wages have risen over the past few years, they have fallen as a percentage of output.
The most important long-term implication, we believe, is that while rising wages should help to boost consumption, they will also mean a loss of competitiveness for companies. China and many Asian companies may lose their export edge not just from an appreciating currency but also from a loss of competitiveness.
China heading toward the “middle-income trap”? If US monetary conditions remain loose and Asian authorities prioritise growth over inflation it will not be long before a combination of an appreciating local currency and rising costs squash the competitiveness of exporters. For many countries, the advance in employee costs and higher operating costs are the first sign that the economy is moving towards “the middle-income trap’. Essentially, many countries’ initial economic advantage is cheap labour, but once these labour-intensive jobs disappear, the spurt in growth peters out. Many economies find it difficult to move up the value-added product chain. To date, Korea appears to have made that leap. Malaysia hasn’t and neither have parts of Latin America and the Middle East.
The transition from a low income to a high income economy is conditional on a number of factors. A well grounded education system, high investment rates and open economies are important.
How to avoid the trap? Efficient capital deployment. During the post financial crisis period, a great deal
of discussion has centred around the quality of Asian growth and China’s deployment of capital within the economy. We have argued that the natural scapegoat would be property but the evidence is mixed. A glance at the Incremental Capital Output Ratio (ICOR) demonstrates a different picture. If the ratio of annualised investment to annual GDP is growing, it is considered an indication of poor investment returns. The higher the ratio, the worse the efficiency of capital. During the past two years the ICOR has risen sharply, but relative to trend there is less evidence of a deterioration. Measures such as the ICOR should be observed over years.
Machinery | China Yankun Hou
16 December 2010 Nomura 58
Innovation, R&D. High reinvestment rates by themselves may tell little about future success if companies are failing to move up the value-added curve. Unless there is an embedded culture of investment in new processes or technology, countries will experience diminishing returns on the investments being undertaken. If there is little protection for patents and the new technology being generated, countries will find themselves stagnating in their long-term returns on capital. Eventually, the comparative advantages will be eroded as companies elsewhere undercut through better productivity gains.
Outsourcing
One of the consequences of rising costs is that big companies will increasingly ship production abroad. For example, 30% of Japanese manufacturing is done abroad, twice that seen in the early 1990s, according to The Economist. According to the Japanese trade ministry, profit margins of overseas subsidiaries are one-third higher than those of domestic production. The proximity of the overseas plants allows efficiencies to be squeezed out. According to the Nomura research team in Tokyo, three-quarters of the Japanese plants overseas were at the same technical level of their domestic ones in 2008, up 50% from 1996.
M&A activities
One of the ways companies can grow is through acquisition or mergers. With companies able to borrow at historically low rates while generating unprecedented free cashflow, acquiring competitors makes commercial sense, particularly to gain market share as global growth recedes, in our view. Acquisitions allow earnings accretion faster than greenfield projects, while payback periods are shorter given the existing strong cash generation of target enterprises.
Although industry consolidation is a driving theme, companies appear willing to buy into growth rather than undertake organic investment as the risks are far more manageable and payback time periods have become shorter due to the high cashflow yields on offer in many sectors. From our analysis, the sectors that are likely to see M&A as a driver of consolidation are likely to be basic and capital goods industries.
Productivity basket: Bullish for Chinese capital goods companies Our main theme for 2011F is competitiveness. We expect macro investors to focus on Asia’s growing inflation problem and the ability of companies to either move up the value added curve and or to cut operating costs through productivity gains. With the world losing its 'demographic dividend’ while China is experiencing the loss of its ‘cheap labour dividend’, we believe the global economy is set to experience a profound change in wages within the developing world. Further, with urbanisation proceeding at an exponential pace, the pressure on resources remains acute despite the sluggish growth in the developed world.
In the short term, terms-of-trade should provide a helpful uplift to many companies in Asia, but longer-term literacy and R&D will drive productivity gains. To avoid the ‘middle income trap’ Asian companies will need to do a combination of high reinvestment in machinery and plant, outsource work to lower-cost countries, acquire companies to gain market share and develop economies of scale by utilising FTA and overseas production.
As for the capital goods sector, we highlight that the trend of high reinvestment looks set to boost the demand for capital goods, while the industry leaders will meet with more M&A opportunities to accelerate their expansion. Further, we reiterate our view that overseas operation will become the next chapter of the leading Chinese machinery companies’ growth story.
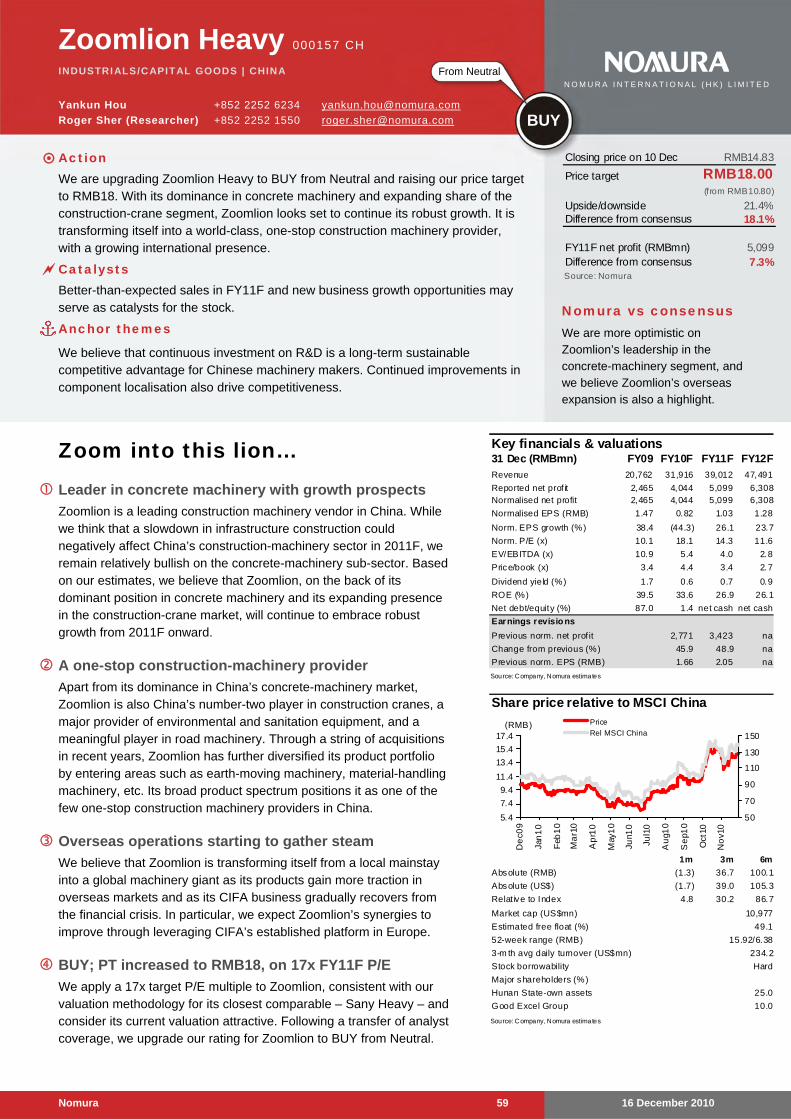
16 December 2010 Nomura 59
Zoomlion Heavy 000157 CH
INDUSTRIALS/CAPITAL GOODS | CHINA
Yankun Hou +852 2252 6234 [email protected]
Roger Sher (Researcher) +852 2252 1550 [email protected]
Zoom into this lion… Leader in concrete machinery with growth prospects
Zoomlion is a leading construction machinery vendor in China. While we think that a slowdown in infrastructure construction could negatively affect China’s construction-machinery sector in 2011F, we remain relatively bullish on the concrete-machinery sub-sector. Based on our estimates, we believe that Zoomlion, on the back of its dominant position in concrete machinery and its expanding presence in the construction-crane market, will continue to embrace robust growth from 2011F onward.
A one-stop construction-machinery provider
Apart from its dominance in China’s concrete-machinery market, Zoomlion is also China’s number-two player in construction cranes, a major provider of environmental and sanitation equipment, and a meaningful player in road machinery. Through a string of acquisitions in recent years, Zoomlion has further diversified its product portfolio by entering areas such as earth-moving machinery, material-handling machinery, etc. Its broad product spectrum positions it as one of the few one-stop construction machinery providers in China.
Overseas operations starting to gather steam
We believe that Zoomlion is transforming itself from a local mainstay into a global machinery giant as its products gain more traction in overseas markets and as its CIFA business gradually recovers from the financial crisis. In particular, we expect Zoomlion’s synergies to improve through leveraging CIFA’s established platform in Europe.
BUY; PT increased to RMB18, on 17x FY11F P/E
We apply a 17x target P/E multiple to Zoomlion, consistent with our valuation methodology for its closest comparable – Sany Heavy – and consider its current valuation attractive. Following a transfer of analyst coverage, we upgrade our rating for Zoomlion to BUY from Neutral.
Key financials & valuations31 Dec (RMBmn) FY09 FY10F FY11F FY12F
Revenue 20,762 31,916 39,012 47,491
Reported net prof it 2,465 4,044 5,099 6,308Normalised net profit 2,465 4,044 5,099 6,308
Normalised EPS (RMB) 1.47 0.82 1.03 1.28
Norm. EPS growth (%) 38.4 (44.3) 26.1 23.7
Norm. P/E (x) 10.1 18.1 14.3 11.6
EV/EBITDA (x) 10.9 5.4 4.0 2.8
Price/book (x) 3.4 4.4 3.4 2.7
Dividend yield (%) 1.7 0.6 0.7 0.9
ROE (%) 39.5 33.6 26.9 26.1
Net debt/equity (%) 87.0 1.4 net cash net cash
Earnings revisio ns
Previous norm. net prof it 2,771 3,423 na
Change from previous (%) 45.9 48.9 na
Previous norm. EPS (RMB) 1.66 2.05 na
Source: Company, Nomura estimates
Share price relative to MSCI China
1m 3m 6m
(1.3) 36.7 100.1
(1.7) 39.0 105.3
4.8 30.2 86.7
Hard
Source: Company, Nomura estimates
10,977
49.1
15.92/6.38
234.2
Absolute (RMB)
Absolute (US$)
Relat ive to Index
Estimated free float (%)
Market cap (US$mn)
10.0
Major shareholders (%)
Hunan State-own assets 25.0
52-week range (RMB)
3-m th avg daily turnover (US$mn)
Good Excel Group
Stock borrowability
5.4
7.4
9.4
11.4
13.4
15.4
17.4
De
c09
Jan
10
Feb
10
Ma
r10
Ap
r10
May
10
Jun1
0
Jul1
0
Au
g10
Se
p10
Oct
10
No
v10
50
70
90
110
130
150
Price
Rel MSCI China(RMB)
Closing price on 10 Dec RMB14.83
Price target RMB18.00(f rom RMB10.80)
Upside/downside 21.4%Difference from consensus 18.1%
FY11F net profit (RMBmn) 5,099Difference from consensus 7.3%Source: Nomura
Nomura vs consensus We are more optimistic on Zoomlion’s leadership in the concrete-machinery segment, and we believe Zoomlion’s overseas expansion is also a highlight.
From Neutral
BUY
N O M U R A I N T E R N A T I O N A L ( H K ) L I M I T E D
Action We are upgrading Zoomlion Heavy to BUY from Neutral and raising our price target
to RMB18. With its dominance in concrete machinery and expanding share of the construction-crane segment, Zoomlion looks set to continue its robust growth. It is transforming itself into a world-class, one-stop construction machinery provider, with a growing international presence.
Catalysts Better-than-expected sales in FY11F and new business growth opportunities may
serve as catalysts for the stock.
Anchor themes
We believe that continuous investment on R&D is a long-term sustainable competitive advantage for Chinese machinery makers. Continued improvements in component localisation also drive competitiveness.
Zoomlion Heavy Yankun Hou
16 December 2010 Nomura 60
Overview
Investment highlights Following a transfer of analyst coverage, we upgrade our rating for Zoomlion Heavy to BUY from Neutral and raising our price target to RMB18, based on 17x our FY11F EPS forecast of RMB1.03. We believe 20%-plus annual growth is achievable for Zoomlion’s concrete-machinery segment, as we believe this segment has considerable potential over the medium to long term. We believe that Zoomlion’s strong presence in the segment and its expanding market share in the construction-crane segment position it well to embrace healthy growth from 2011F onward. Zoomlion stock is trading at around 14x FY11F EPS, which we believe offers substantial upside potential.
Zoomlion is a leading construction-machinery player in China, and has a strong position in the concrete-machinery segment (together with Sany Heavy). Zoomlion is also the second-largest construction-crane maker in China, capturing around 26% market share by sales value in 2009. In addition, it plays a leading role in China’s environmental- and sanitation-machinery market, and has a meaningful presence in the road-machinery business. Zoomlion has, through a serial of acquisitions, diversified itself into areas such as earth-moving machinery, material-handling machinery, axles, and so on. With its expanding product spectrum, we are of the view that Zoomlion is on its way to becoming a world-class one-stop construction-machinery provider. This would grant it a competitive edge over other more-specialised machinery manufacturers, in our view, since machinery customers in China are often inclined to purchase various types of machinery in one go.
Across the machinery segments, we are particularly bullish on the concrete-machinery one as a result of the increasing penetration of commercial concrete (ready-mix concrete) in China. We also remain optimistic on construction cranes as we see surging demand from industrial and energy projects. We expect Zoomlion, while maintaining and gradually expanding its leading position, to see healthy revenue growth from these two segments. We think the company’s distinctive position in environmental and sanitation machinery should help it to achieve robust growth in this strongly growing business.
Zoomlion has considerable experience and excellent execution ability in mergers and acquisitions. We note that, as competition heats up in the China construction-machinery space, Zoomlion should have ample opportunity to make further acquisitions, to expand both the scale and scope of its operations. Besides, in a China machinery player’s first attempt at a foreign acquisition, Zoomlion has now run its CIFA business for two years and our checks show that CIFA is on track to return to profitability. We expect the acquisition of CIFA to spark more synergies for Zoomlion, further strengthening its leading position globally in the concrete-machinery space.
We believe that, over time, Zoomlion will be able to transform itself from being a local mainstay to being a leading player in the international arena. Before the financial crisis, Zoomlion was substantially exposed to exports, with 13.4% of its revenue being derived from export sales in FY07. Following the acquisition of CIFA, Zoomlion’s overseas revenue rebounded to 12.6% of its total revenue in FY09, from 4.0% in FY08. We are confident that, as Zoomlion continues to tap into the global market on the back both of improving product quality and CIFA’s established platform, its products will gain more traction worldwide, with its overseas operations contributing an increasing portion of its sales. The upcoming secondary IPO in Hong Kong underscores Zoomlion’s ambition to expand its international operations. Zoomlion plans to issue no more than 15% of its total shares (post IPO) in the H-share market, which would translate to IPO proceeds of around HK$11bn based on its current market capitalisation.
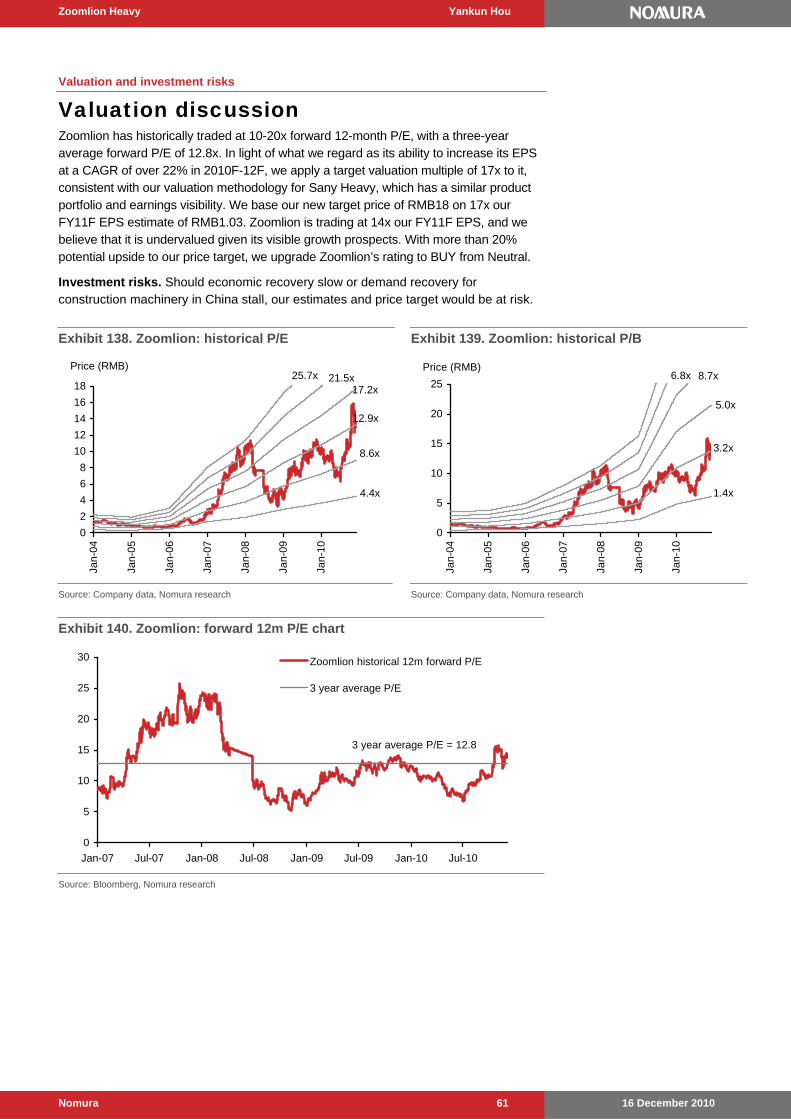
Zoomlion Heavy Yankun Hou
16 December 2010 Nomura 61
Valuation and investment risks
Valuation discussion Zoomlion has historically traded at 10-20x forward 12-month P/E, with a three-year average forward P/E of 12.8x. In light of what we regard as its ability to increase its EPS at a CAGR of over 22% in 2010F-12F, we apply a target valuation multiple of 17x to it, consistent with our valuation methodology for Sany Heavy, which has a similar product portfolio and earnings visibility. We base our new target price of RMB18 on 17x our FY11F EPS estimate of RMB1.03. Zoomlion is trading at 14x our FY11F EPS, and we believe that it is undervalued given its visible growth prospects. With more than 20% potential upside to our price target, we upgrade Zoomlion’s rating to BUY from Neutral.
Investment risks. Should economic recovery slow or demand recovery for construction machinery in China stall, our estimates and price target would be at risk.
Exhibit 138. Zoomlion: historical P/E
4.4x
8.6x
12.9x
17.2x21.5x25.7x
0
2
4
6
8
10
12
14
16
18
Jan-
04
Jan-
05
Jan-
06
Jan-
07
Jan-
08
Jan-
09
Jan-
10
Price (RMB)
Source: Company data, Nomura research
Exhibit 139. Zoomlion: historical P/B
1.4x
3.2x
8.7x
5.0x
6.8x
0
5
10
15
20
25
Jan-
04
Jan-
05
Jan-
06
Jan-
07
Jan-
08
Jan-
09
Jan-
10
Price (RMB)
Source: Company data, Nomura research
Exhibit 140. Zoomlion: forward 12m P/E chart
3 year average P/E = 12.8
0
5
10
15
20
25
30
Jan-07 Jul-07 Jan-08 Jul-08 Jan-09 Jul-09 Jan-10 Jul-10
Zoomlion historical 12m forward P/E
3 year average P/E
Source: Bloomberg, Nomura research
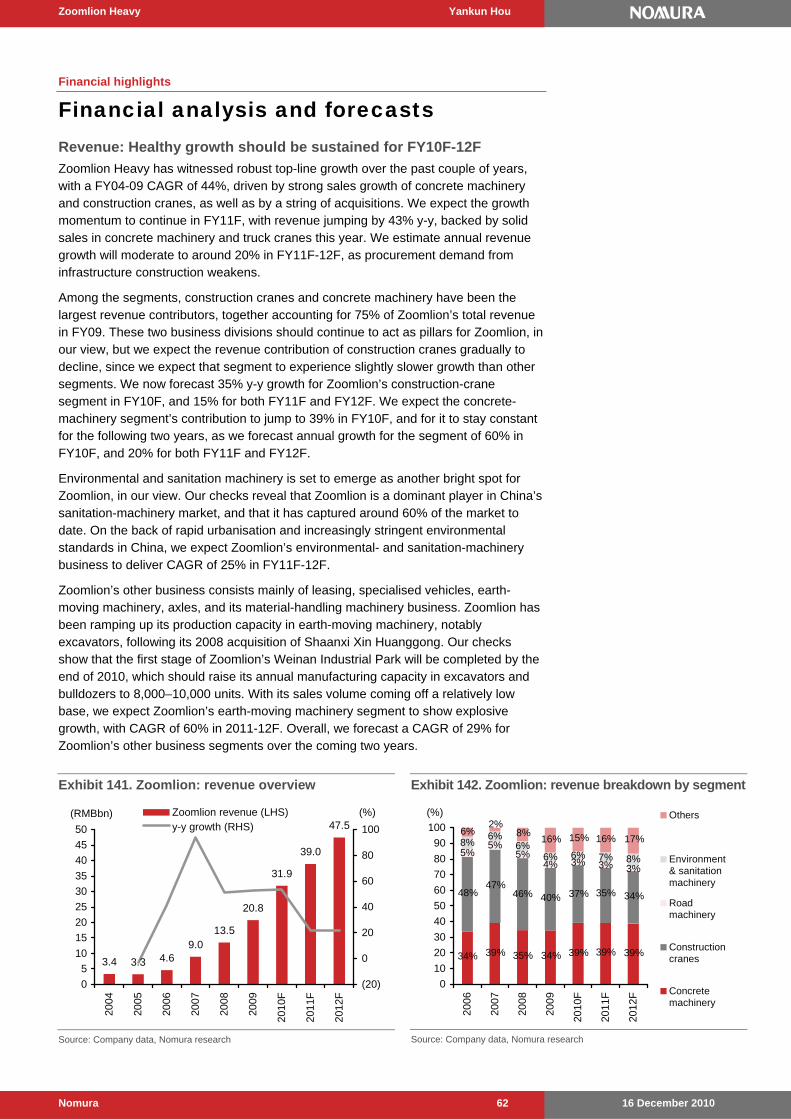
Zoomlion Heavy Yankun Hou
16 December 2010 Nomura 62
Financial highlights
Financial analysis and forecasts Revenue: Healthy growth should be sustained for FY10F-12F
Zoomlion Heavy has witnessed robust top-line growth over the past couple of years, with a FY04-09 CAGR of 44%, driven by strong sales growth of concrete machinery and construction cranes, as well as by a string of acquisitions. We expect the growth momentum to continue in FY11F, with revenue jumping by 43% y-y, backed by solid sales in concrete machinery and truck cranes this year. We estimate annual revenue growth will moderate to around 20% in FY11F-12F, as procurement demand from infrastructure construction weakens.
Among the segments, construction cranes and concrete machinery have been the largest revenue contributors, together accounting for 75% of Zoomlion’s total revenue in FY09. These two business divisions should continue to act as pillars for Zoomlion, in our view, but we expect the revenue contribution of construction cranes gradually to decline, since we expect that segment to experience slightly slower growth than other segments. We now forecast 35% y-y growth for Zoomlion’s construction-crane segment in FY10F, and 15% for both FY11F and FY12F. We expect the concrete-machinery segment’s contribution to jump to 39% in FY10F, and for it to stay constant for the following two years, as we forecast annual growth for the segment of 60% in FY10F, and 20% for both FY11F and FY12F.
Environmental and sanitation machinery is set to emerge as another bright spot for Zoomlion, in our view. Our checks reveal that Zoomlion is a dominant player in China’s sanitation-machinery market, and that it has captured around 60% of the market to date. On the back of rapid urbanisation and increasingly stringent environmental standards in China, we expect Zoomlion’s environmental- and sanitation-machinery business to deliver CAGR of 25% in FY11F-12F.
Zoomlion’s other business consists mainly of leasing, specialised vehicles, earth-moving machinery, axles, and its material-handling machinery business. Zoomlion has been ramping up its production capacity in earth-moving machinery, notably excavators, following its 2008 acquisition of Shaanxi Xin Huanggong. Our checks show that the first stage of Zoomlion’s Weinan Industrial Park will be completed by the end of 2010, which should raise its annual manufacturing capacity in excavators and bulldozers to 8,000–10,000 units. With its sales volume coming off a relatively low base, we expect Zoomlion’s earth-moving machinery segment to show explosive growth, with CAGR of 60% in 2011-12F. Overall, we forecast a CAGR of 29% for Zoomlion’s other business segments over the coming two years.
Exhibit 141. Zoomlion: revenue overview
3.4 3.3 4.69.0
13.5
20.8
31.9
39.0
47.5
0
5
10
15
20
25
30
35
40
45
50
2004
2005
2006
2007
2008
2009
2010
F
2011
F
2012
F
(RMBbn)
(20)
0
20
40
60
80
100
Zoomlion revenue (LHS)y-y growth (RHS)
(%)
Source: Company data, Nomura research
Exhibit 142. Zoomlion: revenue breakdown by segment
46%
5%5%
5%4% 3% 3% 3%
8%6%
6%6% 6% 7%
34% 39% 35% 34% 39% 39% 39%
48%47%
40% 37% 35% 34%
8%
6%2%
8%16% 15% 16% 17%
% 0
% 10
% 20
% 30
% 40
% 50
% 60
% 70
% 80
% 90
100
2006
2007
2008
2009
2010
F
2011
F
2012
F
Others
Environment& sanitationmachinery
Roadmachinery
Constructioncranes
Concretemachinery
(%)
Source: Company data, Nomura research
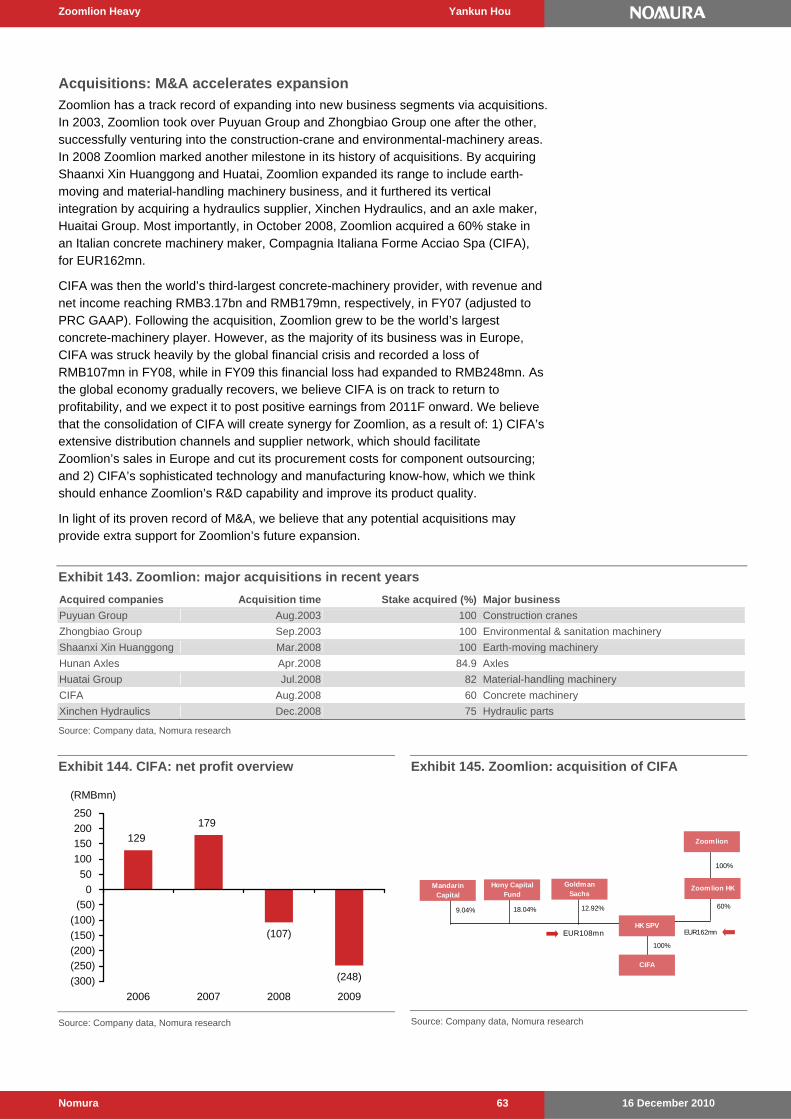
Zoomlion Heavy Yankun Hou
16 December 2010 Nomura 63
Acquisitions: M&A accelerates expansion
Zoomlion has a track record of expanding into new business segments via acquisitions. In 2003, Zoomlion took over Puyuan Group and Zhongbiao Group one after the other, successfully venturing into the construction-crane and environmental-machinery areas. In 2008 Zoomlion marked another milestone in its history of acquisitions. By acquiring Shaanxi Xin Huanggong and Huatai, Zoomlion expanded its range to include earth-moving and material-handling machinery business, and it furthered its vertical integration by acquiring a hydraulics supplier, Xinchen Hydraulics, and an axle maker, Huaitai Group. Most importantly, in October 2008, Zoomlion acquired a 60% stake in an Italian concrete machinery maker, Compagnia Italiana Forme Acciao Spa (CIFA), for EUR162mn.
CIFA was then the world’s third-largest concrete-machinery provider, with revenue and net income reaching RMB3.17bn and RMB179mn, respectively, in FY07 (adjusted to PRC GAAP). Following the acquisition, Zoomlion grew to be the world’s largest concrete-machinery player. However, as the majority of its business was in Europe, CIFA was struck heavily by the global financial crisis and recorded a loss of RMB107mn in FY08, while in FY09 this financial loss had expanded to RMB248mn. As the global economy gradually recovers, we believe CIFA is on track to return to profitability, and we expect it to post positive earnings from 2011F onward. We believe that the consolidation of CIFA will create synergy for Zoomlion, as a result of: 1) CIFA’s extensive distribution channels and supplier network, which should facilitate Zoomlion’s sales in Europe and cut its procurement costs for component outsourcing; and 2) CIFA’s sophisticated technology and manufacturing know-how, which we think should enhance Zoomlion’s R&D capability and improve its product quality.
In light of its proven record of M&A, we believe that any potential acquisitions may provide extra support for Zoomlion’s future expansion.
Exhibit 143. Zoomlion: major acquisitions in recent years
Acquired companies Acquisition time Stake acquired (%) Major business
Puyuan Group Aug.2003 100 Construction cranes
Zhongbiao Group Sep.2003 100 Environmental & sanitation machinery
Shaanxi Xin Huanggong Mar.2008 100 Earth-moving machinery
Hunan Axles Apr.2008 84.9 Axles
Huatai Group Jul.2008 82 Material-handling machinery
CIFA Aug.2008 60 Concrete machinery
Xinchen Hydraulics Dec.2008 75 Hydraulic parts
Source: Company data, Nomura research
Exhibit 144. CIFA: net profit overview
129
179
(107)
(248)(300)
(250)
(200)
(150)
(100)
(50)
0
50
100
150
200
250
2006 2007 2008 2009
(RMBmn)
Source: Company data, Nomura research
Exhibit 145. Zoomlion: acquisition of CIFA
Zoomlion
100%
Zoomlion HK
60%
Goldman Sachs
12.92%
Hony Capital Fund
18.04%
Mandarin Capital
9.04%
HK SPV
100%
CIFA
EUR108mn EUR162mn
Source: Company data, Nomura research
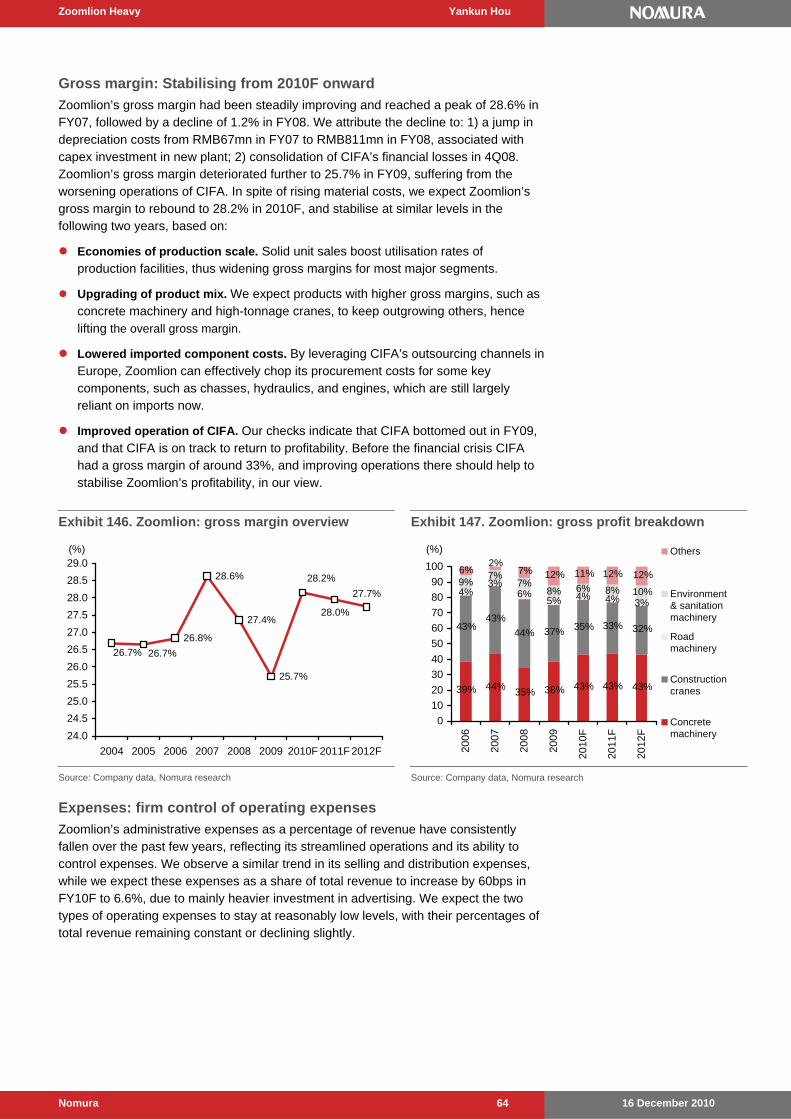
Zoomlion Heavy Yankun Hou
16 December 2010 Nomura 64
Gross margin: Stabilising from 2010F onward
Zoomlion’s gross margin had been steadily improving and reached a peak of 28.6% in FY07, followed by a decline of 1.2% in FY08. We attribute the decline to: 1) a jump in depreciation costs from RMB67mn in FY07 to RMB811mn in FY08, associated with capex investment in new plant; 2) consolidation of CIFA’s financial losses in 4Q08. Zoomlion’s gross margin deteriorated further to 25.7% in FY09, suffering from the worsening operations of CIFA. In spite of rising material costs, we expect Zoomlion’s gross margin to rebound to 28.2% in 2010F, and stabilise at similar levels in the following two years, based on:
Economies of production scale. Solid unit sales boost utilisation rates of production facilities, thus widening gross margins for most major segments.
Upgrading of product mix. We expect products with higher gross margins, such as concrete machinery and high-tonnage cranes, to keep outgrowing others, hence lifting the overall gross margin.
Lowered imported component costs. By leveraging CIFA’s outsourcing channels in Europe, Zoomlion can effectively chop its procurement costs for some key components, such as chasses, hydraulics, and engines, which are still largely reliant on imports now.
Improved operation of CIFA. Our checks indicate that CIFA bottomed out in FY09, and that CIFA is on track to return to profitability. Before the financial crisis CIFA had a gross margin of around 33%, and improving operations there should help to stabilise Zoomlion’s profitability, in our view.
Exhibit 146. Zoomlion: gross margin overview
26.8%
28.6%
27.4%
25.7%
26.7% 26.7%
28.2%
28.0%
27.7%
24.0
24.5
25.0
25.5
26.0
26.5
27.0
27.5
28.0
28.5
29.0
2004 2005 2006 2007 2008 2009 2010F 2011F 2012F
(%)
Source: Company data, Nomura research
Exhibit 147. Zoomlion: gross profit breakdown
44%
4%3%
6%5% 4% 4% 3%
9%7%
7%8% 6% 8%
39% 44%35% 38% 43% 43% 43%
43%43%
37% 35% 33% 32%
10%
6%2%
7% 12% 11% 12% 12%
% 0
10
20
30
40
50
60
70
80
90
100
2006
2007
2008
2009
2010
F
2011
F
2012
F
Others
Environment& sanitationmachinery
Roadmachinery
Constructioncranes
Concretemachinery
(%)
Source: Company data, Nomura research
Expenses: firm control of operating expenses
Zoomlion’s administrative expenses as a percentage of revenue have consistently fallen over the past few years, reflecting its streamlined operations and its ability to control expenses. We observe a similar trend in its selling and distribution expenses, while we expect these expenses as a share of total revenue to increase by 60bps in FY10F to 6.6%, due to mainly heavier investment in advertising. We expect the two types of operating expenses to stay at reasonably low levels, with their percentages of total revenue remaining constant or declining slightly.
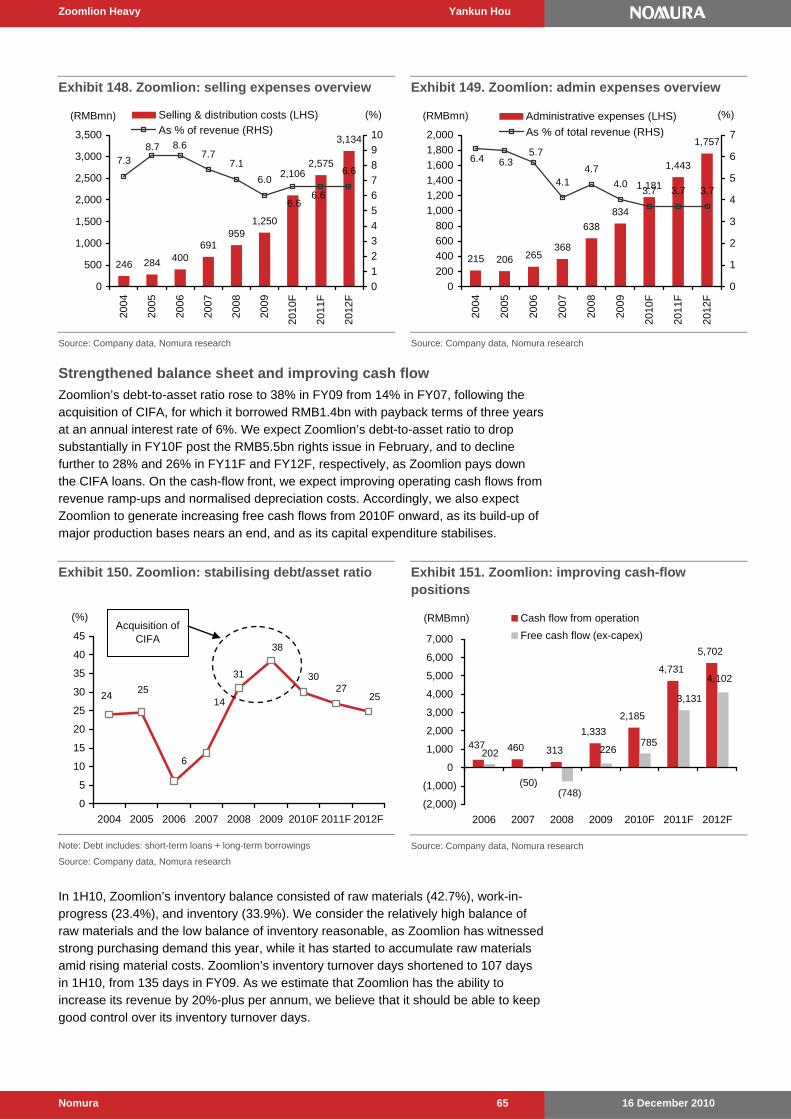
Zoomlion Heavy Yankun Hou
16 December 2010 Nomura 65
Exhibit 148. Zoomlion: selling expenses overview
246 284 400691
9591,250
2,575
3,134
2,1067.3
8.7 8.67.7
7.1
6.0
6.66.6
6.6
0
500
1,000
1,500
2,000
2,500
3,000
3,50020
04
2005
2006
2007
2008
2009
2010
F
2011
F
2012
F
(RMBmn)
0
1
2
3
4
5
6
7
8
9
10
Selling & distribution costs (LHS)As % of revenue (RHS)
(%)
Source: Company data, Nomura research
Exhibit 149. Zoomlion: admin expenses overview
215 206 265368
638
834
1,181
1,443
1,757
6.4 6.35.7
4.14.7
4.03.7 3.7 3.7
0
200
400
600
800
1,000
1,200
1,400
1,600
1,800
2,000
2004
2005
2006
2007
2008
2009
2010
F
2011
F
2012
F
(RMBmn)
0
1
2
3
4
5
6
7
Administrative expenses (LHS)
As % of total revenue (RHS)
(%)
Source: Company data, Nomura research
Strengthened balance sheet and improving cash flow
Zoomlion’s debt-to-asset ratio rose to 38% in FY09 from 14% in FY07, following the acquisition of CIFA, for which it borrowed RMB1.4bn with payback terms of three years at an annual interest rate of 6%. We expect Zoomlion’s debt-to-asset ratio to drop substantially in FY10F post the RMB5.5bn rights issue in February, and to decline further to 28% and 26% in FY11F and FY12F, respectively, as Zoomlion pays down the CIFA loans. On the cash-flow front, we expect improving operating cash flows from revenue ramp-ups and normalised depreciation costs. Accordingly, we also expect Zoomlion to generate increasing free cash flows from 2010F onward, as its build-up of major production bases nears an end, and as its capital expenditure stabilises.
Exhibit 150. Zoomlion: stabilising debt/asset ratio
2425
6
14
31
38
3027
25
0
5
10
15
20
25
30
35
40
45
2004 2005 2006 2007 2008 2009 2010F 2011F 2012F
(%)Acquisition of
CIFA
Note: Debt includes: short-term loans + long-term borrowings
Source: Company data, Nomura research
Exhibit 151. Zoomlion: improving cash-flow positions
460 313
1,333
2,185
4,731
5,702
437 785202
(50)(748)
226
3,131
4,102
(2,000)
(1,000)
0
1,000
2,000
3,000
4,000
5,000
6,000
7,000
2006 2007 2008 2009 2010F 2011F 2012F
(RMBmn) Cash flow from operation
Free cash flow (ex-capex)
Source: Company data, Nomura research
In 1H10, Zoomlion’s inventory balance consisted of raw materials (42.7%), work-in-progress (23.4%), and inventory (33.9%). We consider the relatively high balance of raw materials and the low balance of inventory reasonable, as Zoomlion has witnessed strong purchasing demand this year, while it has started to accumulate raw materials amid rising material costs. Zoomlion’s inventory turnover days shortened to 107 days in 1H10, from 135 days in FY09. As we estimate that Zoomlion has the ability to increase its revenue by 20%-plus per annum, we believe that it should be able to keep good control over its inventory turnover days.

Zoomlion Heavy Yankun Hou
16 December 2010 Nomura 66
Since Zoomlion has extensively leveraged financial leasing in recent years, the portion of its long-term receivables has increased significantly. As of end-June 2010, a mere 7.3% of Zoomlion’s accounts receivable were due within one year. To enhance its liquidity, since FY09 Zoomlion has entered into receivables factoring with several commercial banks. As of September 2010, Zoomlion’s factoring loans totalled RMB5.8bn, representing 69% of the total amount of its receivables.
Exhibit 152. Zoomlion: inventory breakdown (1H10)
Raw materials
42.7%
Inventory33.9%
Work-in-progress23.4%
Others0.1%
Source: Company data, Nomura research
Exhibit 153. Zoomlion: receivables breakdown (1H10)
Within one year7.3%
1-2 year57.0%
2-3 year16.7%
3-4 year10.7%
4-5 year3.3%
Above 5 year5.0%
Source: Company data, Nomura research
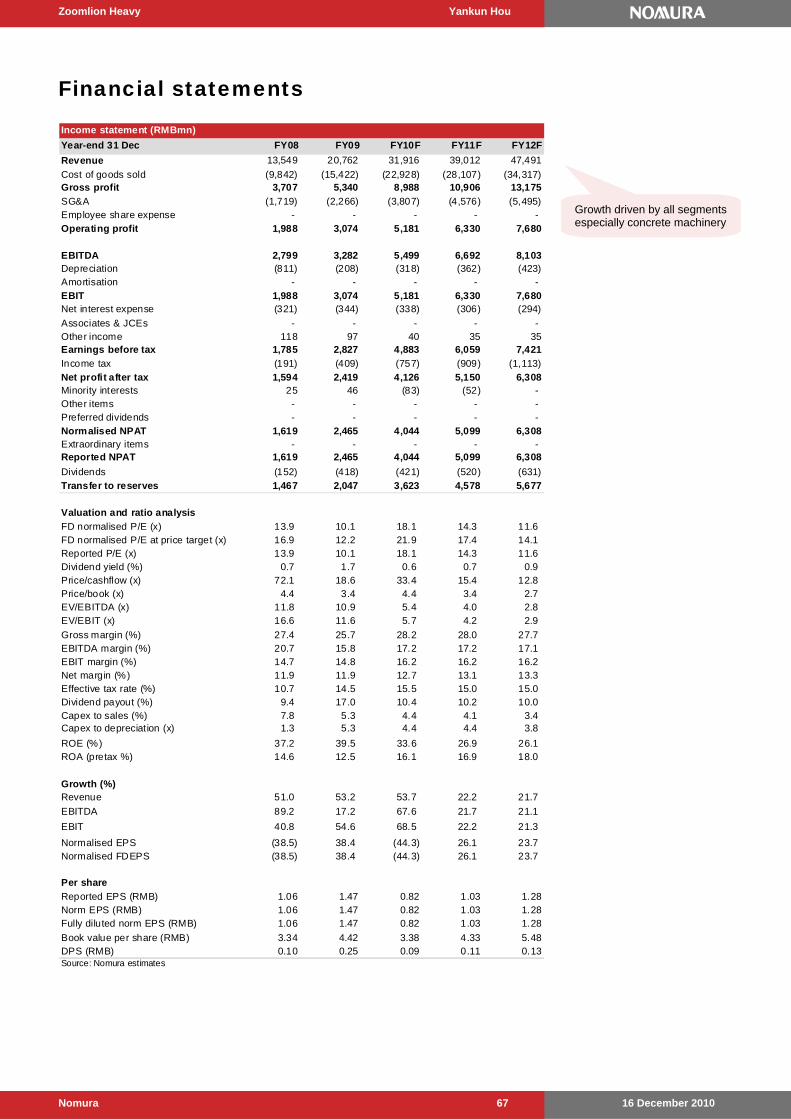
Zoomlion Heavy Yankun Hou
16 December 2010 Nomura 67
Financial statements
Income statement (RMBmn)
Year-end 31 Dec FY08 FY09 FY10F FY11F FY12F
Revenue 13,549 20,762 31,916 39,012 47,491
Cost of goods sold (9,842) (15,422) (22,928) (28,107) (34,317)Gross profit 3,707 5,340 8,988 10,906 13,175
SG&A (1,719) (2,266) (3,807) (4,576) (5,495)Employee share expense - - - - - Operating profit 1,988 3,074 5,181 6,330 7,680
EBITDA 2,799 3,282 5,499 6,692 8,103Depreciation (811) (208) (318) (362) (423)Amortisation - - - - - EBIT 1,988 3,074 5,181 6,330 7,680Net interest expense (321) (344) (338) (306) (294)
Associates & JCEs - - - - - Other income 118 97 40 35 35Earnings before tax 1,785 2,827 4,883 6,059 7,421
Income tax (191) (409) (757) (909) (1,113)
Net profit after tax 1,594 2,419 4,126 5,150 6,308Minority interests 25 46 (83) (52) - Other items - - - - - Preferred dividends - - - - - Normalised NPAT 1,619 2,465 4,044 5,099 6,308Extraordinary items - - - - - Reported NPAT 1,619 2,465 4,044 5,099 6,308
Dividends (152) (418) (421) (520) (631)
Transfer to reserves 1,467 2,047 3,623 4,578 5,677
Valuation and ratio analysis
FD normalised P/E (x) 13.9 10.1 18.1 14.3 11.6 FD normalised P/E at price target (x) 16.9 12.2 21.9 17.4 14.1 Reported P/E (x) 13.9 10.1 18.1 14.3 11.6 Dividend yield (%) 0.7 1.7 0.6 0.7 0.9 Price/cashflow (x) 72.1 18.6 33.4 15.4 12.8 Price/book (x) 4.4 3.4 4.4 3.4 2.7 EV/EBITDA (x) 11.8 10.9 5.4 4.0 2.8 EV/EBIT (x) 16.6 11.6 5.7 4.2 2.9
Gross margin (%) 27.4 25.7 28.2 28.0 27.7 EBITDA margin (%) 20.7 15.8 17.2 17.2 17.1 EBIT margin (%) 14.7 14.8 16.2 16.2 16.2 Net margin (%) 11.9 11.9 12.7 13.1 13.3 Effective tax rate (%) 10.7 14.5 15.5 15.0 15.0 Dividend payout (%) 9.4 17.0 10.4 10.2 10.0 Capex to sales (%) 7.8 5.3 4.4 4.1 3.4 Capex to depreciation (x) 1.3 5.3 4.4 4.4 3.8
ROE (%) 37.2 39.5 33.6 26.9 26.1 ROA (pretax %) 14.6 12.5 16.1 16.9 18.0
Growth (%)Revenue 51.0 53.2 53.7 22.2 21.7
EBITDA 89.2 17.2 67.6 21.7 21.1
EBIT 40.8 54.6 68.5 22.2 21.3
Normalised EPS (38.5) 38.4 (44.3) 26.1 23.7 Normalised FDEPS (38.5) 38.4 (44.3) 26.1 23.7
Per share
Reported EPS (RMB) 1.06 1.47 0.82 1.03 1.28Norm EPS (RMB) 1.06 1.47 0.82 1.03 1.28Fully diluted norm EPS (RMB) 1.06 1.47 0.82 1.03 1.28
Book value per share (RMB) 3.34 4.42 3.38 4.33 5.48DPS (RMB) 0.10 0.25 0.09 0.11 0.13Source: Nomura estimates
Growth driven by all segments especially concrete machinery

Zoomlion Heavy Yankun Hou
16 December 2010 Nomura 68
Cashflow (RMBmn)
Year-end 31 Dec FY08 FY09 FY10F FY11F FY12F
EBITDA 2,799 3,282 5,499 6,692 8,103
Change in working capital (587) (2,898) (2,745) (1,235) (1,473)Other operating cashflow (1,900) 949 (570) (725) (929)Cashflow from operations 313 1,333 2,185 4,731 5,702
Capital expenditure (1,061) (1,107) (1,400) (1,600) (1,600)
Free cashflow (748) 226 785 3,131 4,102Reduction in investments 6 7 (95) (48) (58)Net acquisitionsReduction in other LT assets (1,227) (3,656) - - - Addition in other LT liabilities 2,208 2,366 883 854 1,047Adjustments (5,022) 1,332 (983) (954) (1,147)Cashflow after investing acts (4,783) 276 590 2,983 3,944
Cash dividends (152) (418) (421) (520) (631)Equity issueDebt issueConvertible debt issueOthers 7,252 1,203 5,570 512 960Cashflow from financial acts 7,100 785 5,149 (9) 329Net cashflow 2,317 1,061 5,739 2,975 4,273Beginning cash 1,050 3,367 4,428 10,167 13,141Ending cash 3,367 4,428 10,167 13,141 17,414Ending net debt 3,818 6,427 233 (2,779) (6,845)Source: Nomura estimates
Balance sheet (RMBmn)
As at 31 Dec FY08 FY09 FY10F FY11F FY12F
Cash & equivalents 3,367 4,428 10,167 13,141 17,414Marketable securities - - - - -
Accounts receivable 4,254 5,916 7,871 9,621 11,712Inventories 5,171 6,272 8,166 10,011 12,222Other current assets 1,218 3,861 4,158 4,352 4,584Total current assets 14,010 20,476 30,361 37,125 45,932LT investments 86 79 174 221 280Fixed assets 3,007 3,684 4,665 5,803 6,880Goodwill 2,160 2,213 2,213 2,213 2,213Other intangible assets 2,300 2,339 2,391 2,443 2,494Other LT assets 1,559 5,215 5,215 5,215 5,215
Total assets 23,122 34,006 45,019 53,020 63,014
Short-term debt 4,618 8,553 6,257 6,634 7,213Accounts payable 6,730 10,249 11,650 14,204 17,266Other current liabilities 1,643 632 632 632 632Total current liabilities 12,991 19,434 18,539 21,470 25,111
Long-term debt 2,567 2,301 4,143 3,728 3,355Convertible debtOther LT liabilities 2,221 4,587 5,470 6,325 7,372
Total liabilities 17,779 26,323 28,152 31,523 35,839Minority interest 261 293 220 168 168Preferred stock - - - - - Common stock - - - - -
Retained earnings 5,082 7,390 16,648 21,329 27,006Proposed dividends - - - - -
Other equity and reserves - - - - - Total shareholders' equity 5,082 7,390 16,648 21,329 27,006
Total equity & liabilities 23,122 34,006 45,019 53,020 63,014
Liquidity (x)
Current ratio 1.08 1.05 1.64 1.73 1.83 Interest cover 6.2 8.9 15.3 20.7 26.1
Leverage
Net debt/EBITDA (x) 1.36 1.96 0.04 net cash net cash
Net debt/equity (%) 75.1 87.0 1.4 net cash net cash
Activity (days)Days receivable 84.9 89.4 78.8 81.8 82.2 Days inventory 145.1 135.4 114.9 118.0 118.6
Days payable 189.0 200.9 174.3 167.9 167.8 Cash cycle 40.9 23.9 19.4 32.0 32.9 Source: Nomura estimates
Free cashflow becomes significant

16 December 2010 Nomura 69
Sany Heavy Industry 600031 CH
INDUSTRIALS/CAPITAL GOODS | CHINA
Yankun Hou +852 2252 6234 [email protected]
Roger Sher (Researcher) +852 2252 1550 [email protected]
Staying in high gear Excavators – the crown jewel of Sany
We expect Sany’s excavator sales volumes to grow by around 100% y-y to 12,000 units in 2010F, driven by high growth of the excavator segment (+70% y-y) and continuous market-share gains. We forecast Sany will record overall 50% y-y volume growth to 18,000 units in 2011F (vs the industry’s 20%), on the back of its aggressive marketing strategy, improving brand image and improving product quality. We expect gross margins on excavators to increase slightly, as: 1) the company has entered into various cooperative contracts with its outsourcing suppliers to ensure effective cost control; 2) selling prices would be modestly hiked to partially absorb steel cost increases and 3) improved economies of scale. We forecast gross profit will increase 29% y-y to RMB7.6bn in 2011F.
Concrete machinery: robust growth on mechanisation
While maintaining its leading position in the concrete machinery segment, we also expect Sany will further extend its horizon in the newly injected divisions, on the back of its improving product durability and service standards, and marketing capabilities. We expect revenue of the concrete machinery division will rise 22% to RMB20.4bn in 2011F, with a flattish gross margin.
Reaffirm BUY; raising PT to RMB26
We are revising up our estimates for 2010F and 2011Fdue mainly to: 1) stronger than expected 2H10 sales volumes of most construction machinery in 2010F and 2) more optimistic growth assumptions for the excavator segment and concrete machinery in 2011F. We are raising our FY10F/11F/ 12F EPS estimates to RMB1.16/RMB1.50/ RMB1.88 (after a 21:10 stock split in October). We are revising upward our target multiple to 17x from 15x to reach our new price target of RMB26 (split adjusted), or 17x our FY11F EPS of RMB1.50.
Key financials & valuations31 Dec (RMBmn) FY09 FY10F FY11F FY12F
Revenue 16,496 34,636 44,703 55,716
Reported net profit 1,963 5,881 7,569 9,522
Normalised net profit 1,963 5,881 7,569 9,522
Normalised EPS (RMB) 1.32 1.16 1.50 1.88
Norm. EPS growth (%) 59.3 (11.9) 28.7 25.8
Norm. P/E (x) 16.3 18.5 14.4 11.4
EV/EBITDA (x) 16.7 6.6 5.1 4.0
Price/book (x ) 4.2 8.6 5.6 3.9
Dividend yield (%) 0.8 0.7 0.9 1.1
ROE (%) 29.4 58.1 47.2 40.4
Net debt/equity (%) net cash 6.4 1.4 net cash
Earnin gs revisions
Previous norm. net profit 4,526 4,972 5,930
Change f rom previous (%) 29.9 52.2 60.6
Previous norm. EPS (R MB) 1.88 2.06 2.46
Source: Com pany, Nomura estimates
Share price relative to MSCI China
1m 3m 6m
(4.7) 70.4 135.0
(5.0) 73.3 141.2
1.4 64.5 122.6
Hard
Source: Com pany, Nomura estimates
24.37/7.84
GF Fund Managem ent
Stock borrowability
1.3
Major shareholders (%)
Sany Group Co Ltd 60.7
229.9
Absolute (RMB)
Absolute (US$)
Relative to Index
Estimated f ree f loat (%)
Market cap (U S$mn) 16,343
39.0
52-week range (RMB)
3-mth avg daily turnover (US$m n)
6
11
16
21
26
De
c09
Jan
10
Fe
b10
Ma
r10
Ap
r10
Ma
y10
Jun
10
Jul1
0
Aug
10
Sep
10
Oc
t10
Nov
10
6080100120140160180200220
Price
Rel MSCI China(RMB)
Closing price on 10 Dec RMB21.49
Price target RMB26.00(f rom RMB14.29)
Upside/downside 21.0%Difference from consensus 36.6%
FY11F net profit (RMBmn) 7,569Difference from consensus 18.3%Source: Nomura
Nomura vs consensus We are more Bullish on Sany’s prospects in new product segments and overseas markets.
Maintained
BUY
N O M U R A I N T E R N A T I O N A L ( H K ) L I M I T E D
Action Despite slowing construction machinery growth in 2011F, we believe Sany will
continue to record-high growth led by robust excavator and concrete machinery sales growth. We expect its excavator sales to grow 60% in 2011F on continuous market-share gains in this fast-growing segment, and forecast gross profit will rise 29% y-y to RMB7.6bn in 2011F. We raise our earnings forecasts by 52% and 61% for FY11/12F to RMB1.50 and RMB1.88, respectively. We raise our target multiple to 17x from 15x to reach our new PT of RMB26 (share-split adjusted).
Catalysts Better-than-expected sales in 2011F, and new business growth opportunities.
Anchor themes
We believe continuous investment in R&D is a long-term sustainable competitive advantage for Chinese machinery makers. Continued improvements in component localisation also drive competitiveness.
Sany Heavy Industry Yankun Hou
16 December 2010 Nomura 70
Drilling down
Excavator powers the giant growth We visited Sany’s excavator production base at Kunshan, Jiangsu province, on 25 November, and were impressed by the company’s ambitious capacity expansion plans and visionary business strategy for its excavators business.
Financials: management guides for sales revenue of RMB7.4.0-7.5bn for the excavators division in 2010F, with total profit before tax reaching RMB1.2bn. The current gross margin stands at around 30%, which management does not expect to decline next year, as: 1) the company has entered into various cooperative contracts with its outsourcing suppliers to ensure effective cost control; 2) selling prices would be raised moderately, if required, to partially absorb any cost increases, and; 3) improved economies of scale.
Capacity ramp-up: Sany’s annual production capacity for excavators reached 30,000 units in October 2010. According to the company, its second excavator plant (located in Shanghai) is expected to commence partial operations by end-2011, with a total production capacity of 40,000 units per year. With another 10,000 units added via facilities upgrades, Sany’s annual production capacity for excavators is poised to exceed 50,000 units by 2011F, four-times its sales target for this year (12,000 units).
Service upgrades: according to management, Sany has made significant investments to improve its service quality this year, including shortening the response time, expanding its service network, and training service personnel. Management believes that its premium service will help strengthen Sany’s position given the intense competition, and will also enhance its brand equity over time.
Key components: management highlighted that Sany usually places key component (hydraulics, engines) orders one year in advance; hence, capacity bottlenecks being faced by some of its components suppliers, such as Kawasaki and KYB, would not have a significant impact on the company. Also, based on our channel checks, Sany is working on localising hydraulic components by forming partnerships with some foreign companies. Should the company make any key progress on the localisation process, Sany will see further upside to its profitability, in our view.
Purchase financing: according to management, currently above 80% of its excavator sales are financed by mortgage loans, while its dealers resume repurchase obligations for a substantial portion of the loans. Compared with its peers, financial lease merely accounts for 2-3% of Sany’s total sales, according to management estimates. We think little leveraging of financial lease provides better liquidity for the company, and dealers’ participation in mortgage loans exposes the company to relatively less default risks.
With regard to its growth prospects in 2011F, management guides for an annual sales target of 25,000-30,000 units, representing 100-150% y-y growth. Although this target sounds a bit aggressive to us, we believe 60-70% annual growth is achievable over the next year, based on the following assumptions: 1) we expect China’s excavator market size to grow by 20% in 2011F and 2) Sany will continue its strong momentum of market share gains from foreign competitors, as has been seen over the past few years.
We expect excavators to be the largest growth contributor for Sany over the next several years, accounting for an increasing portion of its total sales. We estimate contribution from excavators to total revenue will exceed 30% in 2012F from around 21% this year.
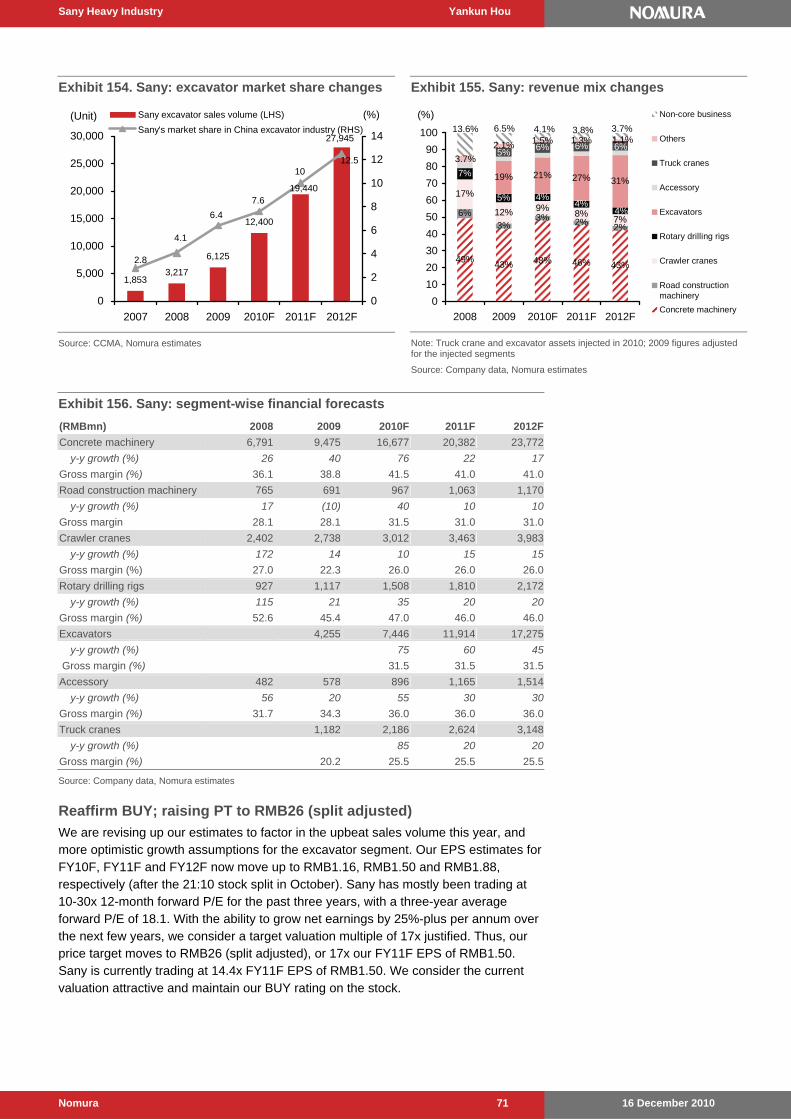
Sany Heavy Industry Yankun Hou
16 December 2010 Nomura 71
Exhibit 154. Sany: excavator market share changes
1,8533,217
6,125
12,400
27,945
19,440
12.510
7.6
6.4
4.1
2.8
0
5,000
10,000
15,000
20,000
25,000
30,000
2007 2008 2009 2010F 2011F 2012F
0
2
4
6
8
10
12
14
(Unit) Sany excavator sales volume (LHS)
Sany's market share in China excavator industry (RHS)
(%)
Source: CCMA, Nomura estimates
Exhibit 155. Sany: revenue mix changes
49%43% 48% 46% 43%
6%3%
3% 2% 2%
17%
12% 9%8%
7%
7%
5% 4%4%
19% 21% 27% 31%
6%
4%
6%6%5%
1.1%1.3%1.5%2.1%
3.7%
3.7%3.8%4.1%6.5%13.6%
0
10
20
30
40
50
60
70
80
90
100
2008 2009 2010F 2011F 2012F
Non-core business
Others
Truck cranes
Accessory
Excavators
Rotary drilling rigs
Crawler cranes
Road constructionmachinery
Concrete machinery
(%)
Note: Truck crane and excavator assets injected in 2010; 2009 figures adjusted for the injected segments
Source: Company data, Nomura estimates
Exhibit 156. Sany: segment-wise financial forecasts
(RMBmn) 2008 2009 2010F 2011F 2012F
Concrete machinery 6,791 9,475 16,677 20,382 23,772
y-y growth (%) 26 40 76 22 17
Gross margin (%) 36.1 38.8 41.5 41.0 41.0
Road construction machinery 765 691 967 1,063 1,170
y-y growth (%) 17 (10) 40 10 10
Gross margin 28.1 28.1 31.5 31.0 31.0
Crawler cranes 2,402 2,738 3,012 3,463 3,983
y-y growth (%) 172 14 10 15 15
Gross margin (%) 27.0 22.3 26.0 26.0 26.0
Rotary drilling rigs 927 1,117 1,508 1,810 2,172
y-y growth (%) 115 21 35 20 20
Gross margin (%) 52.6 45.4 47.0 46.0 46.0
Excavators 4,255 7,446 11,914 17,275
y-y growth (%) 75 60 45
Gross margin (%) 31.5 31.5 31.5
Accessory 482 578 896 1,165 1,514
y-y growth (%) 56 20 55 30 30
Gross margin (%) 31.7 34.3 36.0 36.0 36.0
Truck cranes 1,182 2,186 2,624 3,148
y-y growth (%) 85 20 20
Gross margin (%) 20.2 25.5 25.5 25.5 Source: Company data, Nomura estimates
Reaffirm BUY; raising PT to RMB26 (split adjusted)
We are revising up our estimates to factor in the upbeat sales volume this year, and more optimistic growth assumptions for the excavator segment. Our EPS estimates for FY10F, FY11F and FY12F now move up to RMB1.16, RMB1.50 and RMB1.88, respectively (after the 21:10 stock split in October). Sany has mostly been trading at 10-30x 12-month forward P/E for the past three years, with a three-year average forward P/E of 18.1. With the ability to grow net earnings by 25%-plus per annum over the next few years, we consider a target valuation multiple of 17x justified. Thus, our price target moves to RMB26 (split adjusted), or 17x our FY11F EPS of RMB1.50. Sany is currently trading at 14.4x FY11F EPS of RMB1.50. We consider the current valuation attractive and maintain our BUY rating on the stock.
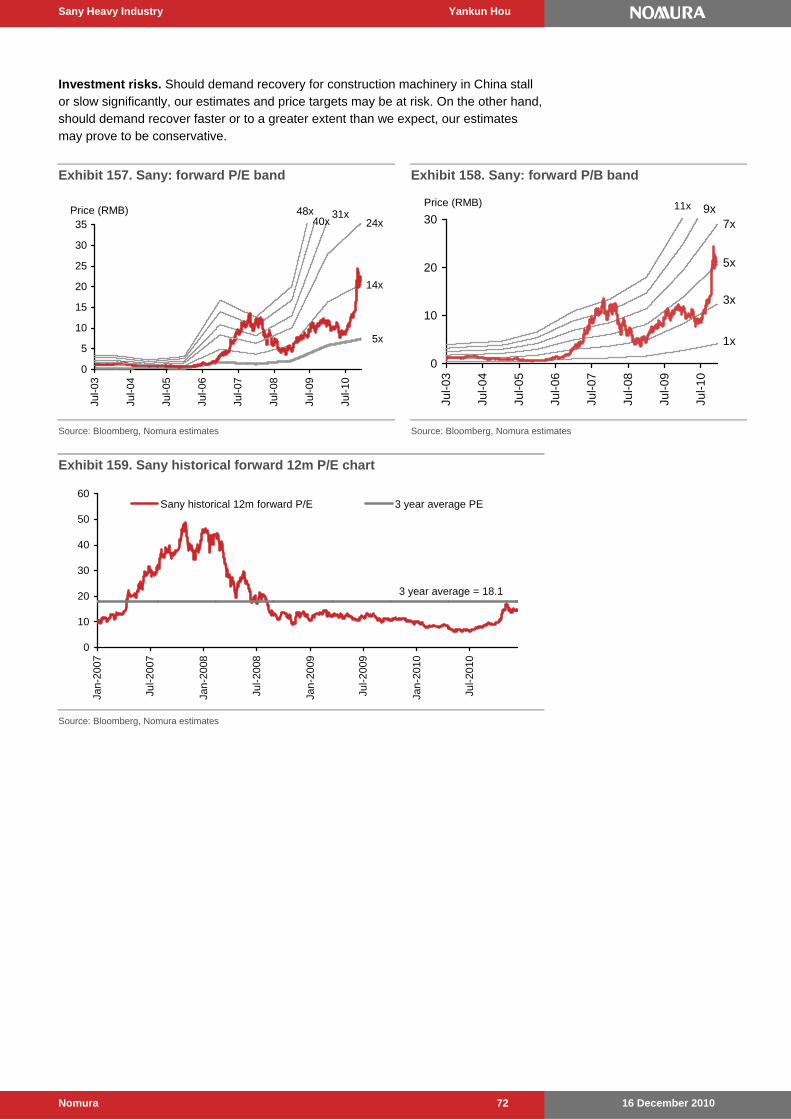
Sany Heavy Industry Yankun Hou
16 December 2010 Nomura 72
Investment risks. Should demand recovery for construction machinery in China stall or slow significantly, our estimates and price targets may be at risk. On the other hand, should demand recover faster or to a greater extent than we expect, our estimates may prove to be conservative.
Exhibit 157. Sany: forward P/E band
5x
14x
31x40x
48x24x
0
5
10
15
20
25
30
35
Jul-0
3
Jul-0
4
Jul-0
5
Jul-0
6
Jul-0
7
Jul-0
8
Jul-0
9
Jul-1
0
Price (RMB)
Source: Bloomberg, Nomura estimates
Exhibit 158. Sany: forward P/B band
1x
3x
5x
7x9x11x
0
10
20
30
Jul-
03
Jul-
04
Jul-
05
Jul-
06
Jul-
07
Jul-
08
Jul-
09
Jul-
10
Price (RMB)
Source: Bloomberg, Nomura estimates
Exhibit 159. Sany historical forward 12m P/E chart
3 year average = 18.1
0
10
20
30
40
50
60
Jan-
2007
Jul-2
007
Jan-
2008
Jul-2
008
Jan-
2009
Jul-2
009
Jan-
2010
Jul-2
010
Sany historical 12m forward P/E 3 year average PE
Source: Bloomberg, Nomura estimates

Sany Heavy Industry Yankun Hou
16 December 2010 Nomura 73
Financial statements
Income statement (RMBmn)
Year-end 31 Dec FY08 FY09 FY10F FY11F FY12F
Revenue 13,745 16,496 34,636 44,703 55,716Cost of goods sold (9,628) (11,161) (21,953) (28,495) (35,625)Gross profit 4,117 5,335 12,683 16,207 20,091SG&A (2,389) (2,550) (5,021) (6,347) (7,688)Employee share expense - - - - - Operating profit 1,728 2,785 7,662 9,861 12,403
EBITDA 1,931 3,071 7,994 10,247 12,839Depreciation (187) (268) (315) (369) (420)Amortisation (16) (18) (17) (17) (16)EBIT 1,728 2,785 7,662 9,861 12,403Net interest expense (133) (89) (139) (179) (223)Associates & JCEs 9 5 - - - Other income (64) (73) - - - Earnings before tax 1,540 2,629 7,523 9,682 12,180Income tax (66) (259) (1,053) (1,355) (1,705)Net profit after tax 1,474 2,370 6,470 8,326 10,475Minority interests (242) (407) (589) (758) (953)Other items - - - - - Preferred dividends - - - - - Normalised NPAT 1,232 1,963 5,881 7,569 9,522Extraordinary items - - - - - Reported NPAT 1,232 1,963 5,881 7,569 9,522
Dividends (268) (257) (771) (992) (1,248)Transfer to reserves 964 1,705 5,111 6,577 8,274
Valuation and ratio analysisFD normalised P/E (x) 26.0 16.3 18.5 14.4 11.4 FD normalised P/E at price target (x) 31.4 19.7 22.4 17.4 13.8 Reported P/E (x) 26.0 16.3 18.5 14.4 11.4 Dividend yield (%) 0.8 0.8 0.7 0.9 1.1 Price/cashflow (x) 50.0 12.9 34.0 26.6 21.4 Price/book (x) 5.5 4.2 8.6 5.6 3.9 EV/EBITDA (x) 27.3 16.7 6.6 5.1 4.0 EV/EBIT (x) 30.4 18.5 6.9 5.3 4.1 Gross margin (%) 30.0 32.3 36.6 36.3 36.1 EBITDA margin (%) 14.0 18.6 23.1 22.9 23.0 EBIT margin (%) 12.6 16.9 22.1 22.1 22.3 Net margin (%) 9.0 11.9 17.0 16.9 17.1 Effective tax rate (%) 4.3 9.8 14.0 14.0 14.0 Dividend payout (%) 21.7 13.1 13.1 13.1 13.1 Capex to sales (%) 8.7 6.9 2.9 2.2 1.8 Capex to depreciation (x) 6.4 4.3 3.2 2.7 2.4
ROE (%) 23.3 29.4 58.1 47.2 40.4 ROA (pretax %) 17.7 23.5 45.2 38.7 35.1
Growth (%)Revenue 50.3 20.0 110.0 29.1 24.6 EBITDA (0.3) 59.0 160.3 28.2 25.3
EBIT (3.2) 61.2 175.1 28.7 25.8
Normalised EPS (50.8) 59.3 (11.9) 28.7 25.8 Normalised FDEPS (50.8) 59.3 (11.9) 28.7 25.8
Per shareReported EPS (RMB) 0.83 1.32 1.16 1.50 1.88Norm EPS (RMB) 0.83 1.32 1.16 1.50 1.88Fully diluted norm EPS (RMB) 0.83 1.32 1.16 1.50 1.88Book value per share (RMB) 3.92 5.06 2.51 3.83 5.48DPS (RMB) 0.18 0.17 0.15 0.20 0.25Source: Nomura est im ates
Impressive revenue growth
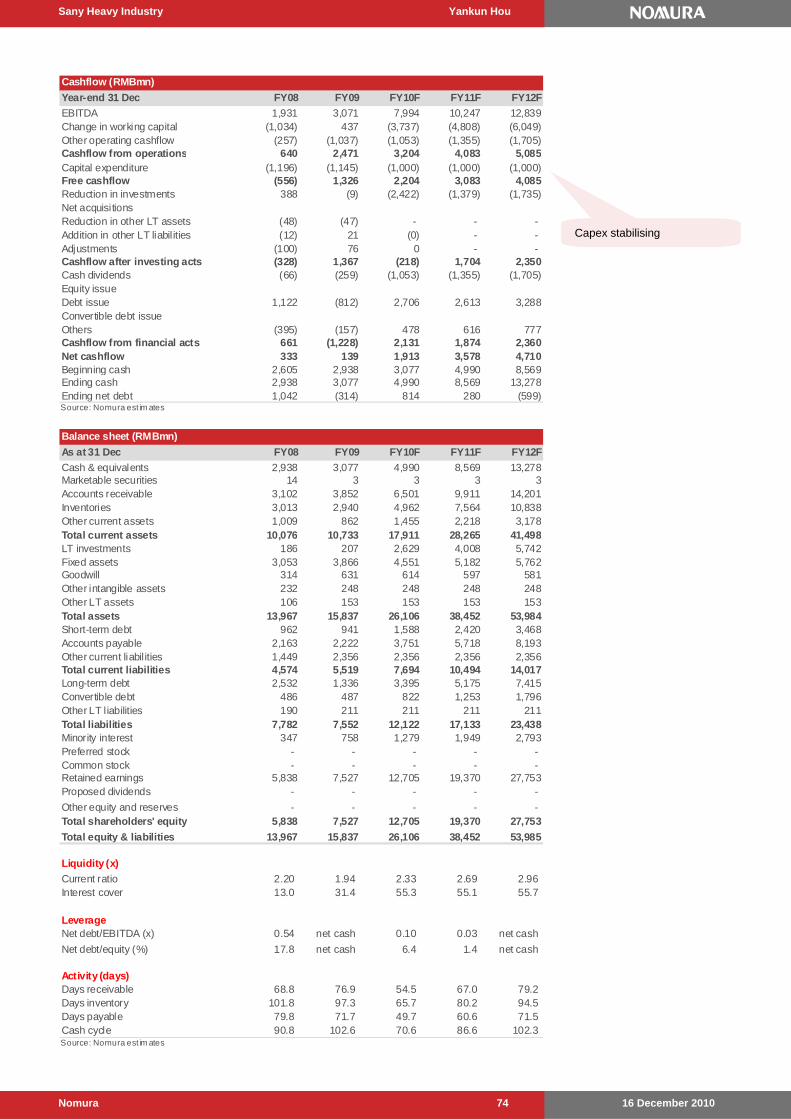
Sany Heavy Industry Yankun Hou
16 December 2010 Nomura 74
Cashflow (RMBmn)
Year-end 31 Dec FY08 FY09 FY10F FY11F FY12F
EBITDA 1,931 3,071 7,994 10,247 12,839Change in working capital (1,034) 437 (3,737) (4,808) (6,049)Other operating cashflow (257) (1,037) (1,053) (1,355) (1,705)Cashflow from operations 640 2,471 3,204 4,083 5,085Capital expenditure (1,196) (1,145) (1,000) (1,000) (1,000)Free cashflow (556) 1,326 2,204 3,083 4,085Reduction in investments 388 (9) (2,422) (1,379) (1,735)Net acquisitionsReduction in other LT assets (48) (47) - - - Addition in other LT liabilities (12) 21 (0) - - Adjustments (100) 76 0 - - Cashflow after investing acts (328) 1,367 (218) 1,704 2,350Cash dividends (66) (259) (1,053) (1,355) (1,705)Equity issueDebt issue 1,122 (812) 2,706 2,613 3,288Convertible debt issueOthers (395) (157) 478 616 777Cashflow from financial acts 661 (1,228) 2,131 1,874 2,360Net cashflow 333 139 1,913 3,578 4,710Beginning cash 2,605 2,938 3,077 4,990 8,569Ending cash 2,938 3,077 4,990 8,569 13,278Ending net debt 1,042 (314) 814 280 (599)Source: Nomura est im ates
Balance sheet (RMBmn)
As at 31 Dec FY08 FY09 FY10F FY11F FY12F
Cash & equivalents 2,938 3,077 4,990 8,569 13,278Marketable securities 14 3 3 3 3Accounts receivable 3,102 3,852 6,501 9,911 14,201Inventories 3,013 2,940 4,962 7,564 10,838Other current assets 1,009 862 1,455 2,218 3,178Total current assets 10,076 10,733 17,911 28,265 41,498LT investments 186 207 2,629 4,008 5,742Fixed assets 3,053 3,866 4,551 5,182 5,762Goodwill 314 631 614 597 581Other intangible assets 232 248 248 248 248Other LT assets 106 153 153 153 153Total assets 13,967 15,837 26,106 38,452 53,984Short-term debt 962 941 1,588 2,420 3,468Accounts payable 2,163 2,222 3,751 5,718 8,193Other current liabilities 1,449 2,356 2,356 2,356 2,356Total current liabilities 4,574 5,519 7,694 10,494 14,017Long-term debt 2,532 1,336 3,395 5,175 7,415Convertible debt 486 487 822 1,253 1,796Other LT liabilities 190 211 211 211 211Total liabilities 7,782 7,552 12,122 17,133 23,438Minority interest 347 758 1,279 1,949 2,793Preferred stock - - - - - Common stock - - - - - Retained earnings 5,838 7,527 12,705 19,370 27,753Proposed dividends - - - - -
Other equity and reserves - - - - - Total shareholders' equity 5,838 7,527 12,705 19,370 27,753
Total equity & liabilities 13,967 15,837 26,106 38,452 53,985
Liquidity (x)
Current ratio 2.20 1.94 2.33 2.69 2.96 Interest cover 13.0 31.4 55.3 55.1 55.7
LeverageNet debt/EBITDA (x) 0.54 net cash 0.10 0.03 net cash
Net debt/equity (%) 17.8 net cash 6.4 1.4 net cash
Activity (days)Days receivable 68.8 76.9 54.5 67.0 79.2 Days inventory 101.8 97.3 65.7 80.2 94.5 Days payable 79.8 71.7 49.7 60.6 71.5 Cash cycle 90.8 102.6 70.6 86.6 102.3 Source: Nomura est im ates
Capex stabilising
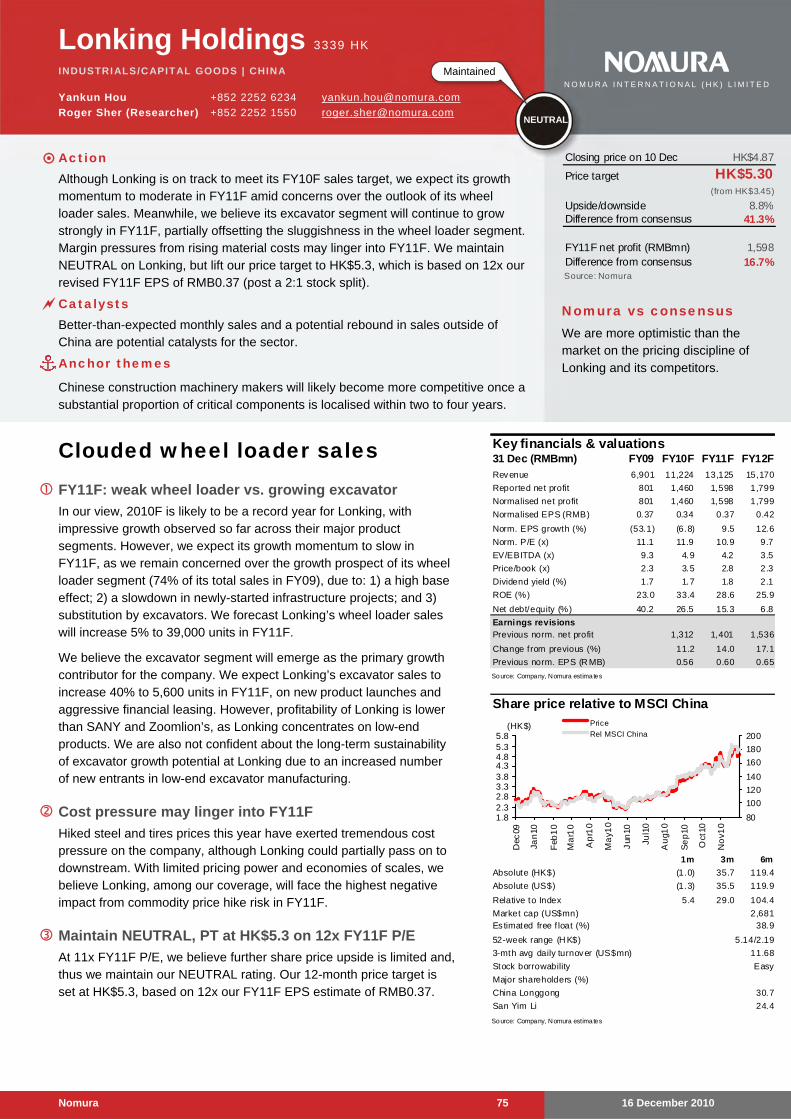
16 December 2010 Nomura 75
Lonking Holdings 3339 HK
INDUSTRIALS/CAPITAL GOODS | CHINA
Yankun Hou +852 2252 6234 [email protected]
Roger Sher (Researcher) +852 2252 1550 [email protected]
Clouded wheel loader sales FY11F: weak wheel loader vs. growing excavator
In our view, 2010F is likely to be a record year for Lonking, with impressive growth observed so far across their major product segments. However, we expect its growth momentum to slow in FY11F, as we remain concerned over the growth prospect of its wheel loader segment (74% of its total sales in FY09), due to: 1) a high base effect; 2) a slowdown in newly-started infrastructure projects; and 3) substitution by excavators. We forecast Lonking’s wheel loader sales will increase 5% to 39,000 units in FY11F.
We believe the excavator segment will emerge as the primary growth contributor for the company. We expect Lonking’s excavator sales to increase 40% to 5,600 units in FY11F, on new product launches and aggressive financial leasing. However, profitability of Lonking is lower than SANY and Zoomlion’s, as Lonking concentrates on low-end products. We are also not confident about the long-term sustainability of excavator growth potential at Lonking due to an increased number of new entrants in low-end excavator manufacturing.
Cost pressure may linger into FY11F
Hiked steel and tires prices this year have exerted tremendous cost pressure on the company, although Lonking could partially pass on to downstream. With limited pricing power and economies of scales, we believe Lonking, among our coverage, will face the highest negative impact from commodity price hike risk in FY11F.
Maintain NEUTRAL, PT at HK$5.3 on 12x FY11F P/E
At 11x FY11F P/E, we believe further share price upside is limited and, thus we maintain our NEUTRAL rating. Our 12-month price target is set at HK$5.3, based on 12x our FY11F EPS estimate of RMB0.37.
Key financials & valuations31 Dec (RMBmn) FY09 FY10F FY11F FY12F
Revenue 6,901 11,224 13,125 15,170
Reported net profit 801 1,460 1,598 1,799
Normalised net profit 801 1,460 1,598 1,799
Normalised EPS (RMB) 0.37 0.34 0.37 0.42
Norm. EPS growth (%) (53.1) (6.8) 9.5 12.6
Norm. P/E (x) 11.1 11.9 10.9 9.7
EV/EBITDA (x) 9.3 4.9 4.2 3.5
Price/book (x) 2.3 3.5 2.8 2.3
Dividend yield (%) 1.7 1.7 1.8 2.1
ROE (%) 23.0 33.4 28.6 25.9
Net debt/equity (%) 40.2 26.5 15.3 6.8
Earnings revisionsPrevious norm. net profit 1,312 1,401 1,536
Change from previous (%) 11.2 14.0 17.1
Previous norm. EPS (R MB) 0.56 0.60 0.65
Source: Company, Nomura estimates
Share price relative to MSCI China
1m 3m 6m
(1.0) 35.7 119.4
(1.3) 35.5 119.9
5.4 29.0 104.4
Easy
Source: Company, Nomura estimates
52-week range (H K$)
3-mth avg daily turnover (US$mn)
San Yim Li
Stock borrowability
24.4
Major shareholders (%)
China Longgong 30.7
Absolute (HK$)
Absolute (US$)
Relative to Index
Es timated free f loat (%)Market cap (US$mn) 2,681
38.9
5.14/2.19
11.68
1.82.32.83.33.84.34.85.35.8
Dec
09
Jan
10
Feb
10
Ma
r10
Ap
r10
Ma
y10
Jun
10
Jul1
0
Au
g10
Se
p10
Oct
10
No
v10
80
100
120
140
160
180
200
Price
Rel MSCI China(HK$)
Closing price on 10 Dec HK$4.87
Price target HK$5.30(from HK$3.45)
Upside/downside 8.8%Difference from consensus 41.3%
FY11F net profit (RMBmn) 1,598Difference from consensus 16.7%Source: Nomura
Nomura vs consensus We are more optimistic than the market on the pricing discipline of Lonking and its competitors.
Maintained
NEUTRAL
N O M U R A I N T E R N A T I O N A L ( H K ) L I M I T E D
Action Although Lonking is on track to meet its FY10F sales target, we expect its growth
momentum to moderate in FY11F amid concerns over the outlook of its wheel loader sales. Meanwhile, we believe its excavator segment will continue to grow strongly in FY11F, partially offsetting the sluggishness in the wheel loader segment. Margin pressures from rising material costs may linger into FY11F. We maintain NEUTRAL on Lonking, but lift our price target to HK$5.3, which is based on 12x our revised FY11F EPS of RMB0.37 (post a 2:1 stock split).
Catalysts Better-than-expected monthly sales and a potential rebound in sales outside of
China are potential catalysts for the sector.
Anchor themes
Chinese construction machinery makers will likely become more competitive once a substantial proportion of critical components is localised within two to four years.
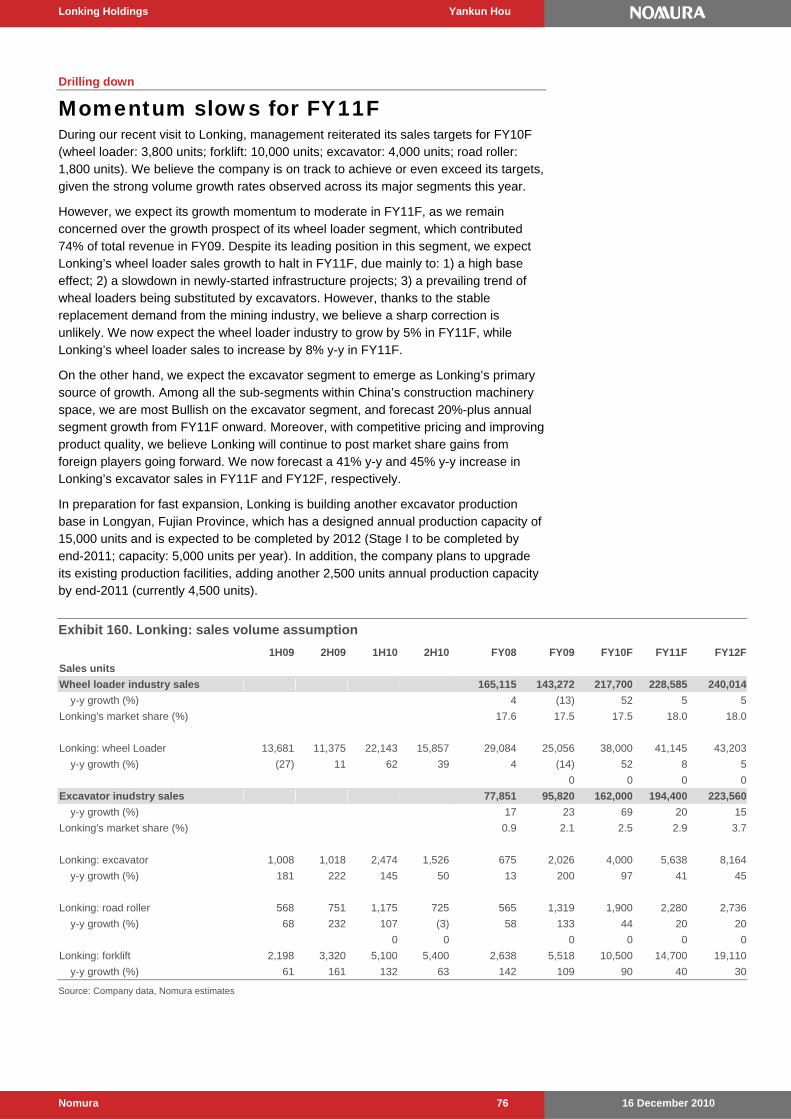
Lonking Holdings Yankun Hou
16 December 2010 Nomura 76
Drilling down
Momentum slows for FY11F During our recent visit to Lonking, management reiterated its sales targets for FY10F (wheel loader: 3,800 units; forklift: 10,000 units; excavator: 4,000 units; road roller: 1,800 units). We believe the company is on track to achieve or even exceed its targets, given the strong volume growth rates observed across its major segments this year.
However, we expect its growth momentum to moderate in FY11F, as we remain concerned over the growth prospect of its wheel loader segment, which contributed 74% of total revenue in FY09. Despite its leading position in this segment, we expect Lonking’s wheel loader sales growth to halt in FY11F, due mainly to: 1) a high base effect; 2) a slowdown in newly-started infrastructure projects; 3) a prevailing trend of wheal loaders being substituted by excavators. However, thanks to the stable replacement demand from the mining industry, we believe a sharp correction is unlikely. We now expect the wheel loader industry to grow by 5% in FY11F, while Lonking’s wheel loader sales to increase by 8% y-y in FY11F.
On the other hand, we expect the excavator segment to emerge as Lonking’s primary source of growth. Among all the sub-segments within China’s construction machinery space, we are most Bullish on the excavator segment, and forecast 20%-plus annual segment growth from FY11F onward. Moreover, with competitive pricing and improving product quality, we believe Lonking will continue to post market share gains from foreign players going forward. We now forecast a 41% y-y and 45% y-y increase in Lonking’s excavator sales in FY11F and FY12F, respectively.
In preparation for fast expansion, Lonking is building another excavator production base in Longyan, Fujian Province, which has a designed annual production capacity of 15,000 units and is expected to be completed by 2012 (Stage I to be completed by end-2011; capacity: 5,000 units per year). In addition, the company plans to upgrade its existing production facilities, adding another 2,500 units annual production capacity by end-2011 (currently 4,500 units).
Exhibit 160. Lonking: sales volume assumption
1H09 2H09 1H10 2H10 FY08 FY09 FY10F FY11F FY12F
Sales units
Wheel loader industry sales 165,115 143,272 217,700 228,585 240,014
y-y growth (%) 4 (13) 52 5 5
Lonking's market share (%) 17.6 17.5 17.5 18.0 18.0
Lonking: wheel Loader 13,681 11,375 22,143 15,857 29,084 25,056 38,000 41,145 43,203
y-y growth (%) (27) 11 62 39 4 (14) 52 8 5
0 0 0 0
Excavator inudstry sales 77,851 95,820 162,000 194,400 223,560
y-y growth (%) 17 23 69 20 15
Lonking's market share (%) 0.9 2.1 2.5 2.9 3.7
Lonking: excavator 1,008 1,018 2,474 1,526 675 2,026 4,000 5,638 8,164
y-y growth (%) 181 222 145 50 13 200 97 41 45
Lonking: road roller 568 751 1,175 725 565 1,319 1,900 2,280 2,736
y-y growth (%) 68 232 107 (3) 58 133 44 20 20
0 0 0 0 0 0
Lonking: forklift 2,198 3,320 5,100 5,400 2,638 5,518 10,500 14,700 19,110
y-y growth (%) 61 161 132 63 142 109 90 40 30 Source: Company data, Nomura estimates
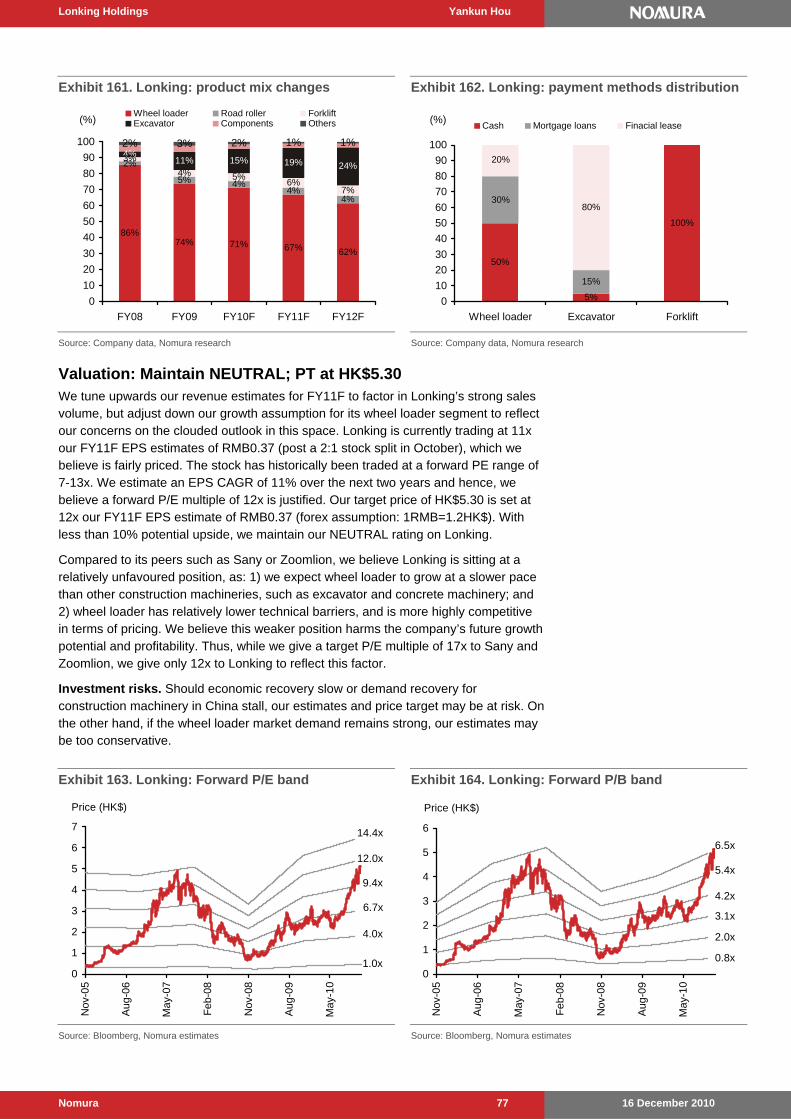
Lonking Holdings Yankun Hou
16 December 2010 Nomura 77
Exhibit 161. Lonking: product mix changes
86%74% 71% 67% 62%
5% 4%4%
4%
4% 5%6%
7%
4%11% 15% 19% 24%
2% 3% 2% 1% 1%
2%3%
0
10
20
30
40
50
60
70
80
90
100
FY08 FY09 FY10F FY11F FY12F
Wheel loader Road roller ForkliftExcavator Components Others(%)
Source: Company data, Nomura research
Exhibit 162. Lonking: payment methods distribution
50%
5%
100%
15%
80%30%
20%
0
10
20
30
40
50
60
70
80
90
100
Wheel loader Excavator Forklift
Cash Mortgage loans Finacial lease(%)
Source: Company data, Nomura research
Valuation: Maintain NEUTRAL; PT at HK$5.30 We tune upwards our revenue estimates for FY11F to factor in Lonking’s strong sales volume, but adjust down our growth assumption for its wheel loader segment to reflect our concerns on the clouded outlook in this space. Lonking is currently trading at 11x our FY11F EPS estimates of RMB0.37 (post a 2:1 stock split in October), which we believe is fairly priced. The stock has historically been traded at a forward PE range of 7-13x. We estimate an EPS CAGR of 11% over the next two years and hence, we believe a forward P/E multiple of 12x is justified. Our target price of HK$5.30 is set at 12x our FY11F EPS estimate of RMB0.37 (forex assumption: 1RMB=1.2HK$). With less than 10% potential upside, we maintain our NEUTRAL rating on Lonking.
Compared to its peers such as Sany or Zoomlion, we believe Lonking is sitting at a relatively unfavoured position, as: 1) we expect wheel loader to grow at a slower pace than other construction machineries, such as excavator and concrete machinery; and 2) wheel loader has relatively lower technical barriers, and is more highly competitive in terms of pricing. We believe this weaker position harms the company’s future growth potential and profitability. Thus, while we give a target P/E multiple of 17x to Sany and Zoomlion, we give only 12x to Lonking to reflect this factor.
Investment risks. Should economic recovery slow or demand recovery for construction machinery in China stall, our estimates and price target may be at risk. On the other hand, if the wheel loader market demand remains strong, our estimates may be too conservative.
Exhibit 163. Lonking: Forward P/E band
1.0x
4.0x
6.7x
9.4x
12.0x
14.4x
0
1
2
3
4
5
6
7
Nov
-05
Aug
-06
May
-07
Feb
-08
Nov
-08
Aug
-09
May
-10
Price (HK$)
Source: Bloomberg, Nomura estimates
Exhibit 164. Lonking: Forward P/B band
0.8x
2.0x
3.1x
4.2x
5.4x
6.5x
0
1
2
3
4
5
6
Nov
-05
Aug
-06
May
-07
Feb
-08
Nov
-08
Aug
-09
May
-10
Price (HK$)
Source: Bloomberg, Nomura estimates
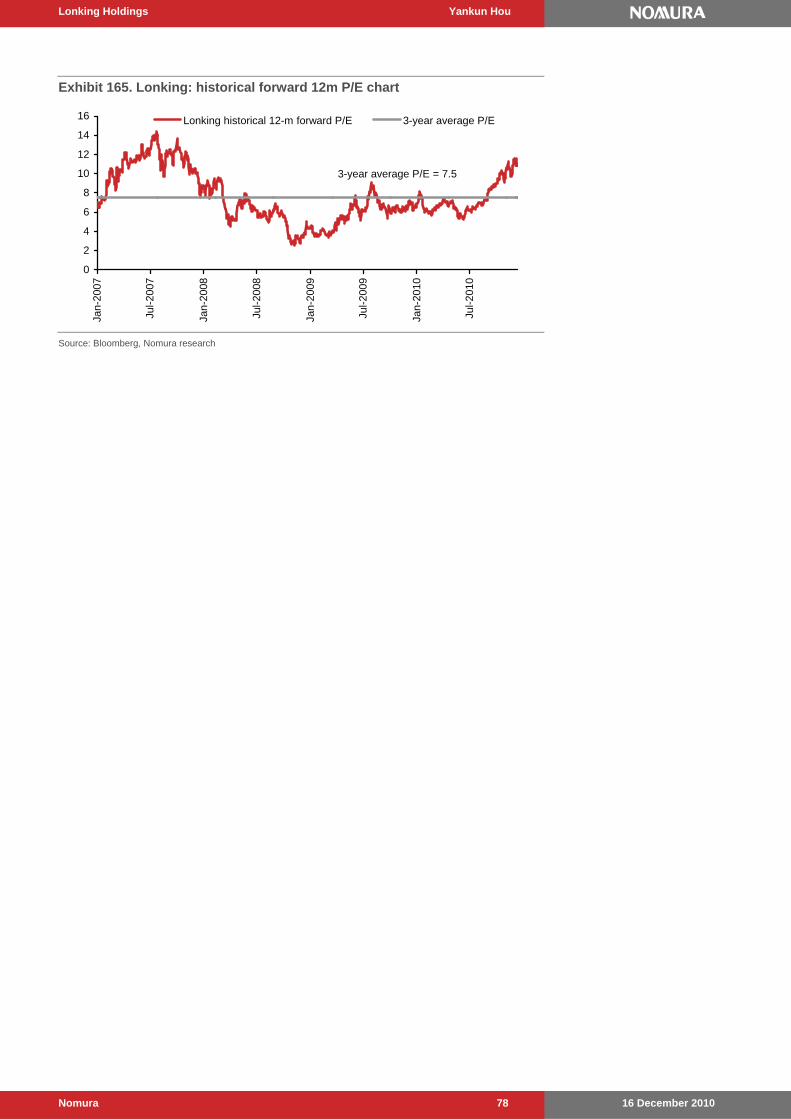
Lonking Holdings Yankun Hou
16 December 2010 Nomura 78
Exhibit 165. Lonking: historical forward 12m P/E chart
3-year average P/E = 7.5
0
2
4
6
8
10
12
14
16
Jan-
2007
Jul-2
007
Jan-
2008
Jul-2
008
Jan-
2009
Jul-2
009
Jan-
2010
Jul-2
010
Lonking historical 12-m forward P/E 3-year average P/E
Source: Bloomberg, Nomura research

Lonking Holdings Yankun Hou
16 December 2010 Nomura 79
Financial statements
Income statement (RMBmn)
Year-end 31 Dec FY08 FY09 FY10F FY11F FY12F
Revenue 6,145 6,901 11,224 13,125 15,170Cost of goods sold (4,970) (5,283) (8,401) (9,861) (11,411)Gross profit 1,175 1,618 2,822 3,264 3,759SG&A (347) (658) (954) (1,116) (1,320)Employee share expense - - - - - Operating profit 828 960 1,868 2,148 2,440
EBITDA 923 1,099 2,020 2,307 2,605Depreciation (91) (135) (147) (154) (161)Amortisation (4) (5) (5) (5) (4)EBIT 828 960 1,868 2,148 2,440Net interest expense (109) (171) (278) (325) (375)Associates & JCEs - - - - - Other income 281 117 157 90 90Earnings before tax 1,000 906 1,748 1,914 2,155Income tax (73) (106) (288) (316) (355)Net profit after tax 928 801 1,460 1,598 1,799Minority interests - - - - - Other items - - - - -
Preferred dividends - - - - - Normalised NPAT 928 801 1,460 1,598 1,799Extraordinary items - - - - - Reported NPAT 928 801 1,460 1,598 1,799
Dividends (214) (153) (292) (320) (360)Transfer to reserves 714 648 1,168 1,278 1,439
Valuation and ratio analysisFD normalised P/E (x) 5.2 11.1 11.9 10.9 9.7
FD normalised P/E at price target (x) 5.7 12.1 13.0 11.8 10.5 Reported P/E (x) 5.2 11.1 11.9 10.9 9.7 Dividend yield (%) 4.4 1.7 1.7 1.8 2.1 Price/cashflow (x) na 11.2 13.9 12.6 11.2 Price/book (x) 1.5 2.3 3.5 2.8 2.3 EV/EBITDA (x) 11.1 9.3 4.9 4.2 3.5 EV/EBIT (x) 12.4 10.6 5.4 4.5 3.8 Gross margin (%) 19.1 23.4 25.1 24.9 24.8 EBITDA margin (%) 15.0 15.9 18.0 17.6 17.2
EBIT margin (%) 13.5 13.9 16.6 16.4 16.1 Net margin (%) 15.1 11.6 13.0 12.2 11.9 Effective tax rate (%) 7.3 11.7 16.5 16.5 16.5 Dividend payout (%) 23.1 19.1 20.0 20.0 20.0 Capex to sales (%) 17.1 12.3 3.6 2.3 2.0 Capex to depreciation (x) 11.6 6.3 2.7 1.9 1.9
ROE (%) 31.1 23.0 33.4 28.6 25.9 ROA (pretax %) 12.7 12.2 19.2 18.3 17.6
Growth (%)Revenue 15.8 12.3 62.6 16.9 15.6 EBITDA (2.3) 19.1 83.8 14.2 12.9
EBIT (5.9) 15.9 94.7 15.0 13.6
Normalised EPS 4.2 (53.1) (6.8) 9.5 12.6 Normalised FDEPS 4.2 (53.1) (6.8) 9.5 12.6
Per shareReported EPS (RMB) 0.78 0.37 0.34 0.37 0.42Norm EPS (RMB) 0.78 0.37 0.34 0.37 0.42Fully diluted norm EPS (RMB) 0.78 0.37 0.34 0.37 0.42
Book value per share (RMB) 2.65 1.73 1.16 1.46 1.79DPS (RMB) 0.18 0.07 0.07 0.07 0.08Source: Nomura estimates
Growth momentum started to slow down post FY10F
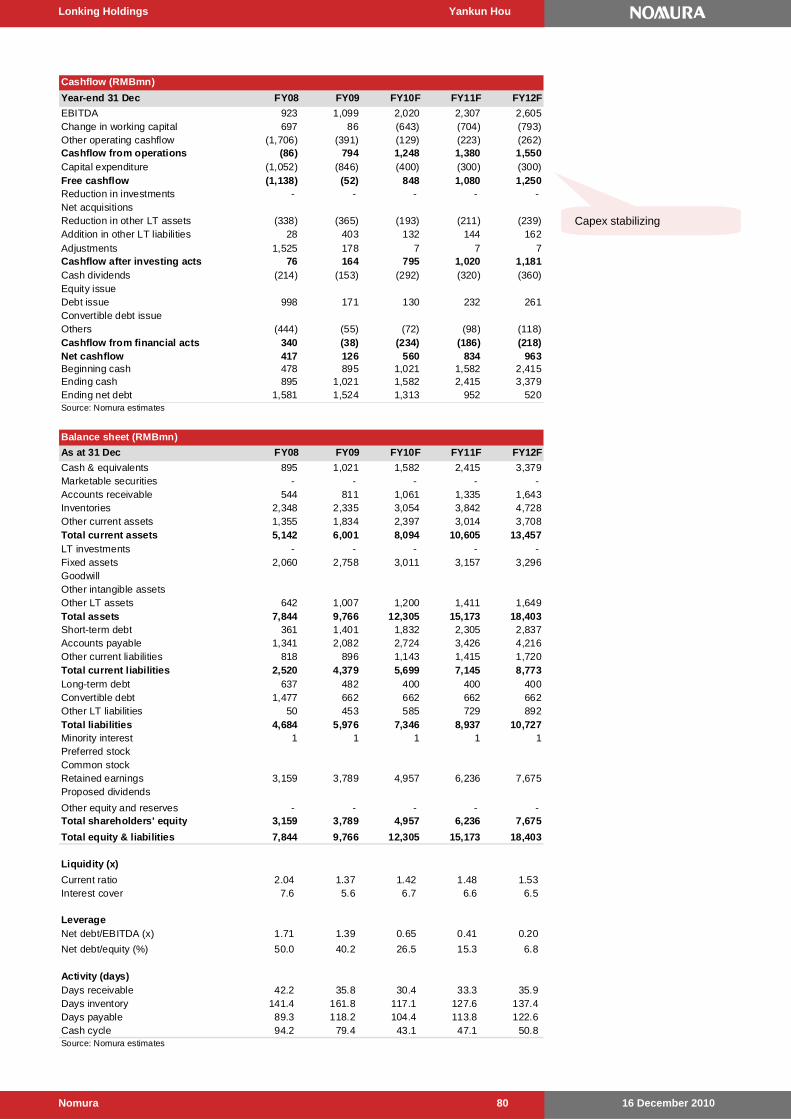
Lonking Holdings Yankun Hou
16 December 2010 Nomura 80
Cashflow (RMBmn)
Year-end 31 Dec FY08 FY09 FY10F FY11F FY12F
EBITDA 923 1,099 2,020 2,307 2,605Change in working capital 697 86 (643) (704) (793)Other operating cashflow (1,706) (391) (129) (223) (262)Cashflow from operations (86) 794 1,248 1,380 1,550Capital expenditure (1,052) (846) (400) (300) (300)Free cashflow (1,138) (52) 848 1,080 1,250Reduction in investments - - - - - Net acquisitionsReduction in other LT assets (338) (365) (193) (211) (239)Addition in other LT liabilities 28 403 132 144 162
Adjustments 1,525 178 7 7 7Cashflow after investing acts 76 164 795 1,020 1,181Cash dividends (214) (153) (292) (320) (360)Equity issueDebt issue 998 171 130 232 261Convertible debt issueOthers (444) (55) (72) (98) (118)Cashflow from financial acts 340 (38) (234) (186) (218)Net cashflow 417 126 560 834 963Beginning cash 478 895 1,021 1,582 2,415Ending cash 895 1,021 1,582 2,415 3,379Ending net debt 1,581 1,524 1,313 952 520Source: Nomura estimates
Balance sheet (RMBmn)
As at 31 Dec FY08 FY09 FY10F FY11F FY12F
Cash & equivalents 895 1,021 1,582 2,415 3,379Marketable securities - - - - - Accounts receivable 544 811 1,061 1,335 1,643Inventories 2,348 2,335 3,054 3,842 4,728Other current assets 1,355 1,834 2,397 3,014 3,708Total current assets 5,142 6,001 8,094 10,605 13,457LT investments - - - - - Fixed assets 2,060 2,758 3,011 3,157 3,296GoodwillOther intangible assetsOther LT assets 642 1,007 1,200 1,411 1,649Total assets 7,844 9,766 12,305 15,173 18,403Short-term debt 361 1,401 1,832 2,305 2,837Accounts payable 1,341 2,082 2,724 3,426 4,216Other current liabilities 818 896 1,143 1,415 1,720Total current liabilities 2,520 4,379 5,699 7,145 8,773Long-term debt 637 482 400 400 400Convertible debt 1,477 662 662 662 662Other LT liabilities 50 453 585 729 892Total liabilities 4,684 5,976 7,346 8,937 10,727Minority interest 1 1 1 1 1Preferred stockCommon stockRetained earnings 3,159 3,789 4,957 6,236 7,675Proposed dividends
Other equity and reserves - - - - - Total shareholders' equity 3,159 3,789 4,957 6,236 7,675
Total equity & liabilities 7,844 9,766 12,305 15,173 18,403
Liquidity (x)
Current ratio 2.04 1.37 1.42 1.48 1.53 Interest cover 7.6 5.6 6.7 6.6 6.5
LeverageNet debt/EBITDA (x) 1.71 1.39 0.65 0.41 0.20
Net debt/equity (%) 50.0 40.2 26.5 15.3 6.8
Activity (days)Days receivable 42.2 35.8 30.4 33.3 35.9 Days inventory 141.4 161.8 117.1 127.6 137.4 Days payable 89.3 118.2 104.4 113.8 122.6 Cash cycle 94.2 79.4 43.1 47.1 50.8 Source: Nomura estimates
Capex stabilizing

16 December 2010 Nomura 81
Kobe Steel 5406 JP
STEEL | TOKYO (TSE-1)
Yuji Matsumoto +81 3 6703 1220 [email protected]
Construction machinery: largest source of profit
Most bullish among the blast furnace steelmakers
Recent earnings have been strong and we think the construction machinery business will be the main driver of earnings growth over the near term. Over the longer term, we expect the company's proprietary iron-making process to become a key driver of growth. We are most bullish on Kobe Steel among the blast furnace steelmakers we cover, owing to the strength of near-term earnings and its growth strategy for the longer term, both of which give it an edge over competitors.
Construction machinery: largest source of profits
Kobe Steel's construction machinery business comprises: 1) Kobelco Construction Machinery (in which Kobe Steel has an 80% stake), which mainly manufactures and sells hydraulic excavators; and 2) Kobelco Cranes (wholly owned), which concentrates mainly on crawler cranes. As a result of growth in Chinese hydraulic excavator sales, we expect the construction machinery business to contribute ¥29bn to recurring profits, or 34% of the company's total recurring profits in 11/3F, making this the largest source of profits, exceeding the earnings contribution from the iron & steel business.
We estimate recurring profits of ¥54bn for 14/3
The most notable feature of Kobe Steel's construction machinery business is the rapid growth of Chinese operations at Kobelco Construction Machinery. In recent years, the Chinese operation of Kobelco Construction Machinery has grown even more quickly than the market as a whole, which has itself been expanding rapidly. In its medium-term plan, Kobelco Construction Machinery is targeting 16/3 sales of ¥400bn and recurring profits of more than ¥40bn. We are forecasting recurring profits of ¥49bn in 13/3, rising to ¥54bn in 14/3.
31 Mar (¥bn) 10/3 11/3F 12/3F 13/3F
Sales 1,671 1,880 1,990 2,110
(Company Est) - 1,910 - -
Operating Profits 46 125 150 170
(Company Est) - 115 - -
Net Profit 6.3 45.0 55.0 65.0
(Company Est) - 45.0 - -
EPS (¥) 2.1 15.0 18.3 21.6
(% y-y) - 7.1x 22.0 18.0
(Company Est) - 15.0 - -
BPS (¥) 172.1 180.2 194.8 211.8
PER (x) 98.1 13.7 11.3 9.5
PBR (x) 1.2 1.1 1.1 1.0
EV/EBITDA (x) 8.5 5.7 5.0 4.5
D/E ratio (x) 1.8 1.6 1.3 1.1
ROE (%) 1.3 8.5 9.8 10.6
Earnings revisions
Previous net profit - 45.0 55.0 65.0
(Chg from previous, %) - na na na
Previous EPS (¥) - 15.0 18.3 21.6
(Chg from previous, %) - na na naSource: Company, Nomura estimates
Share price relative to MSCI Japan
1m 3m 6m
7.9 9.0 13.8
6.0 9.5 24.2
4.0 1.9 10.2
Source: Company, Nomura estimates
7,680
52-week range (¥) 223.0/157.0
Absolute (¥)
Absolute (US$)
Relative to Index
Market cap (US$mn)
150160170180190200210220230
De
c09
Jan
10
Fe
b10
Ma
r10
Ap
r10
Ma
y10
Jun
10
Jul1
0
Au
g10
Se
p10
Oct
10
Nov
10
80
90
100
110
120
130
Price
Rel MSCI Japan
(¥)
Closing price on 10 Dec ¥206.0Price target
Upside/downside 45.6%Difference from consensus 34.8%
12/3F net profit (¥bn) 55.0 Difference from consensus 3.8%Source: Nomura
¥300
Nomura vs consensus We expect stronger sales from its construction machinery division
Maintained
BUY
N O M U R A S E C U R I T I E S C O L T D
Action We reiterate our BUY rating for Kobe Steel. Margin deterioration at the machinery
segment through to 12/3 owing to the strong yen is a concern, but we revise up our projections for Kobelco Construction Machinery as we continue to look for strong overall profit growth in line with our previous forecasts. In the steel businesses, we see longer-term growth potential from the company's new production method.
Catalysts Better-than-expected construction machinery sales in China and higher capacity
utilisation of its first commercial facility in the US are potential catalysts.
Anchor themes
Global demand for construction machinery is strong. In our view, profit growth at construction machinery makers will hinge on their ability to increase production capacity and rein in costs. In the steel sector, market prices have staged a sharp turnaround and look set for a recovery through 11/3 Q4.
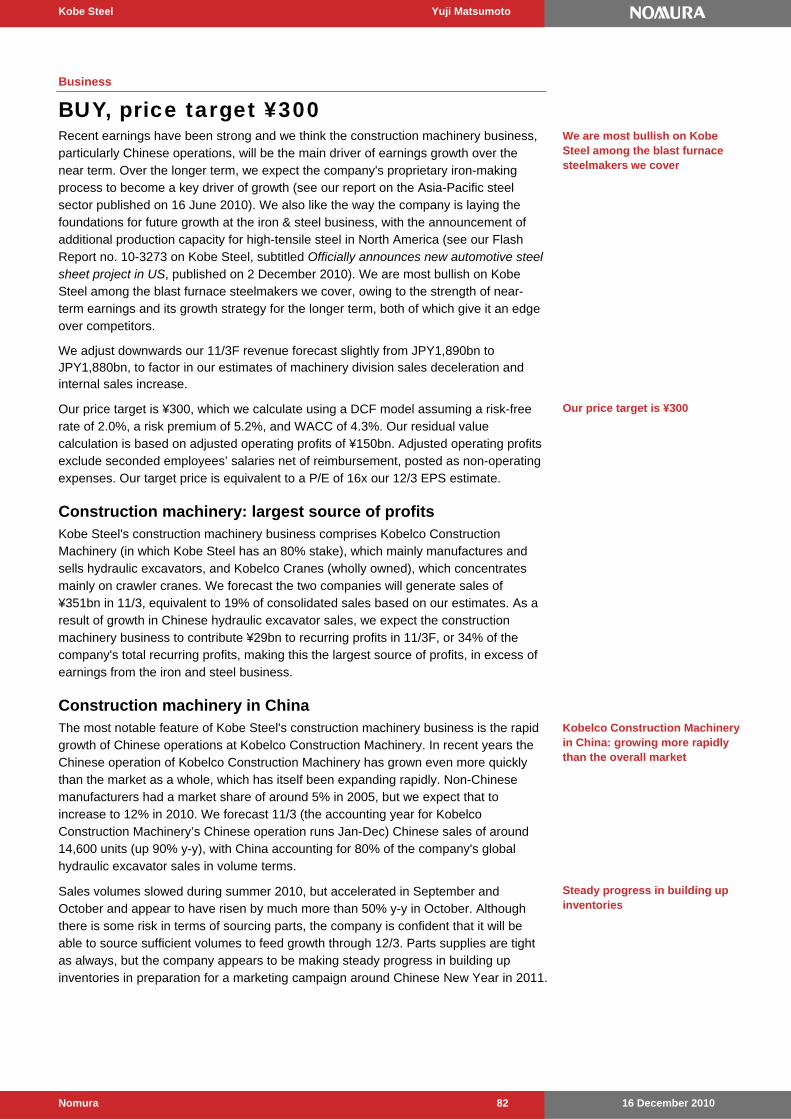
Kobe Steel Yuji Matsumoto
16 December 2010 Nomura 82
Business
BUY, price target ¥300 Recent earnings have been strong and we think the construction machinery business, particularly Chinese operations, will be the main driver of earnings growth over the near term. Over the longer term, we expect the company's proprietary iron-making process to become a key driver of growth (see our report on the Asia-Pacific steel sector published on 16 June 2010). We also like the way the company is laying the foundations for future growth at the iron & steel business, with the announcement of additional production capacity for high-tensile steel in North America (see our Flash Report no. 10-3273 on Kobe Steel, subtitled Officially announces new automotive steel sheet project in US, published on 2 December 2010). We are most bullish on Kobe Steel among the blast furnace steelmakers we cover, owing to the strength of near-term earnings and its growth strategy for the longer term, both of which give it an edge over competitors.
We adjust downwards our 11/3F revenue forecast slightly from JPY1,890bn to JPY1,880bn, to factor in our estimates of machinery division sales deceleration and internal sales increase.
Our price target is ¥300, which we calculate using a DCF model assuming a risk-free rate of 2.0%, a risk premium of 5.2%, and WACC of 4.3%. Our residual value calculation is based on adjusted operating profits of ¥150bn. Adjusted operating profits exclude seconded employees’ salaries net of reimbursement, posted as non-operating expenses. Our target price is equivalent to a P/E of 16x our 12/3 EPS estimate.
Construction machinery: largest source of profits Kobe Steel's construction machinery business comprises Kobelco Construction Machinery (in which Kobe Steel has an 80% stake), which mainly manufactures and sells hydraulic excavators, and Kobelco Cranes (wholly owned), which concentrates mainly on crawler cranes. We forecast the two companies will generate sales of ¥351bn in 11/3, equivalent to 19% of consolidated sales based on our estimates. As a result of growth in Chinese hydraulic excavator sales, we expect the construction machinery business to contribute ¥29bn to recurring profits in 11/3F, or 34% of the company's total recurring profits, making this the largest source of profits, in excess of earnings from the iron and steel business.
Construction machinery in China The most notable feature of Kobe Steel's construction machinery business is the rapid growth of Chinese operations at Kobelco Construction Machinery. In recent years the Chinese operation of Kobelco Construction Machinery has grown even more quickly than the market as a whole, which has itself been expanding rapidly. Non-Chinese manufacturers had a market share of around 5% in 2005, but we expect that to increase to 12% in 2010. We forecast 11/3 (the accounting year for Kobelco Construction Machinery’s Chinese operation runs Jan-Dec) Chinese sales of around 14,600 units (up 90% y-y), with China accounting for 80% of the company's global hydraulic excavator sales in volume terms.
Sales volumes slowed during summer 2010, but accelerated in September and October and appear to have risen by much more than 50% y-y in October. Although there is some risk in terms of sourcing parts, the company is confident that it will be able to source sufficient volumes to feed growth through 12/3. Parts supplies are tight as always, but the company appears to be making steady progress in building up inventories in preparation for a marketing campaign around Chinese New Year in 2011.
We are most bullish on Kobe Steel among the blast furnace steelmakers we cover
Our price target is ¥300
Steady progress in building up inventories
Kobelco Construction Machinery in China: growing more rapidly than the overall market
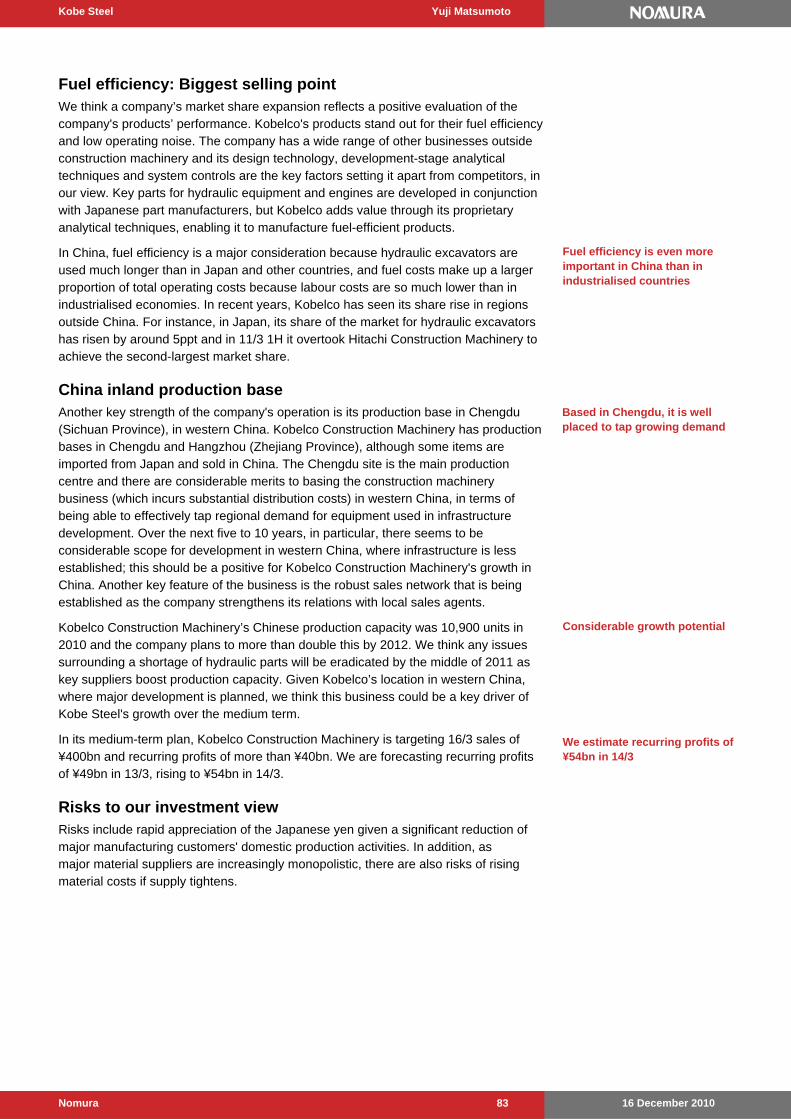
Kobe Steel Yuji Matsumoto
16 December 2010 Nomura 83
Fuel efficiency: Biggest selling point We think a company’s market share expansion reflects a positive evaluation of the company's products’ performance. Kobelco's products stand out for their fuel efficiency and low operating noise. The company has a wide range of other businesses outside construction machinery and its design technology, development-stage analytical techniques and system controls are the key factors setting it apart from competitors, in our view. Key parts for hydraulic equipment and engines are developed in conjunction with Japanese part manufacturers, but Kobelco adds value through its proprietary analytical techniques, enabling it to manufacture fuel-efficient products.
In China, fuel efficiency is a major consideration because hydraulic excavators are used much longer than in Japan and other countries, and fuel costs make up a larger proportion of total operating costs because labour costs are so much lower than in industrialised economies. In recent years, Kobelco has seen its share rise in regions outside China. For instance, in Japan, its share of the market for hydraulic excavators has risen by around 5ppt and in 11/3 1H it overtook Hitachi Construction Machinery to achieve the second-largest market share.
China inland production base Another key strength of the company's operation is its production base in Chengdu (Sichuan Province), in western China. Kobelco Construction Machinery has production bases in Chengdu and Hangzhou (Zhejiang Province), although some items are imported from Japan and sold in China. The Chengdu site is the main production centre and there are considerable merits to basing the construction machinery business (which incurs substantial distribution costs) in western China, in terms of being able to effectively tap regional demand for equipment used in infrastructure development. Over the next five to 10 years, in particular, there seems to be considerable scope for development in western China, where infrastructure is less established; this should be a positive for Kobelco Construction Machinery's growth in China. Another key feature of the business is the robust sales network that is being established as the company strengthens its relations with local sales agents.
Kobelco Construction Machinery’s Chinese production capacity was 10,900 units in 2010 and the company plans to more than double this by 2012. We think any issues surrounding a shortage of hydraulic parts will be eradicated by the middle of 2011 as key suppliers boost production capacity. Given Kobelco’s location in western China, where major development is planned, we think this business could be a key driver of Kobe Steel's growth over the medium term.
In its medium-term plan, Kobelco Construction Machinery is targeting 16/3 sales of ¥400bn and recurring profits of more than ¥40bn. We are forecasting recurring profits of ¥49bn in 13/3, rising to ¥54bn in 14/3.
Risks to our investment view Risks include rapid appreciation of the Japanese yen given a significant reduction of major manufacturing customers' domestic production activities. In addition, as major material suppliers are increasingly monopolistic, there are also risks of rising material costs if supply tightens.
Based in Chengdu, it is well placed to tap growing demand
Fuel efficiency is even more important in China than in industrialised countries
Considerable growth potential
We estimate recurring profits of ¥54bn in 14/3
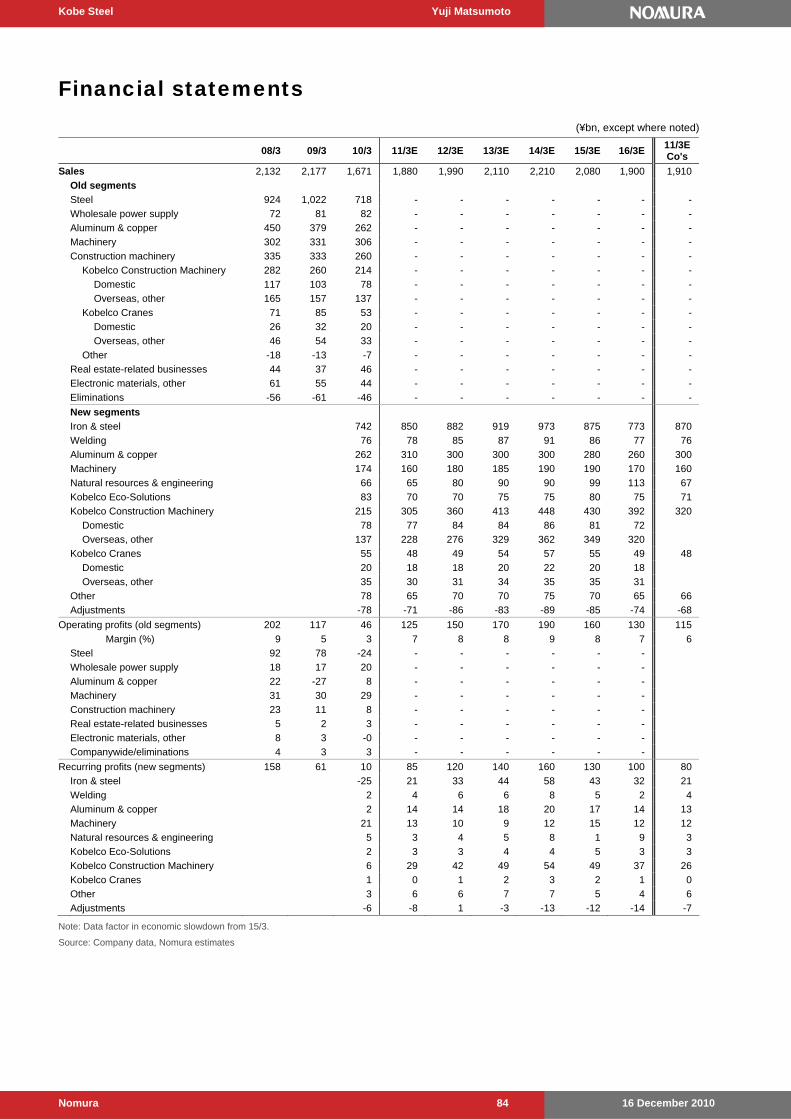
Kobe Steel Yuji Matsumoto
16 December 2010 Nomura 84
Financial statements
(¥bn, except where noted)
08/3 09/3 10/3 11/3E 12/3E 13/3E 14/3E 15/3E 16/3E 11/3ECo's
Sales 2,132 2,177 1,671 1,880 1,990 2,110 2,210 2,080 1,900 1,910
Old segments
Steel 924 1,022 718 - - - - - - -
Wholesale power supply 72 81 82 - - - - - - -
Aluminum & copper 450 379 262 - - - - - - -
Machinery 302 331 306 - - - - - - -
Construction machinery 335 333 260 - - - - - - -
Kobelco Construction Machinery 282 260 214 - - - - - - -
Domestic 117 103 78 - - - - - - -
Overseas, other 165 157 137 - - - - - - -
Kobelco Cranes 71 85 53 - - - - - - -
Domestic 26 32 20 - - - - - - -
Overseas, other 46 54 33 - - - - - - -
Other -18 -13 -7 - - - - - - -
Real estate-related businesses 44 37 46 - - - - - - -
Electronic materials, other 61 55 44 - - - - - - -
Eliminations -56 -61 -46 - - - - - - -
New segments
Iron & steel 742 850 882 919 973 875 773 870
Welding 76 78 85 87 91 86 77 76
Aluminum & copper 262 310 300 300 300 280 260 300
Machinery 174 160 180 185 190 190 170 160
Natural resources & engineering 66 65 80 90 90 99 113 67
Kobelco Eco-Solutions 83 70 70 75 75 80 75 71
Kobelco Construction Machinery 215 305 360 413 448 430 392 320
Domestic 78 77 84 84 86 81 72
Overseas, other 137 228 276 329 362 349 320
Kobelco Cranes 55 48 49 54 57 55 49 48
Domestic 20 18 18 20 22 20 18
Overseas, other 35 30 31 34 35 35 31
Other 78 65 70 70 75 70 65 66
Adjustments -78 -71 -86 -83 -89 -85 -74 -68
Operating profits (old segments) 202 117 46 125 150 170 190 160 130 115
Margin (%) 9 5 3 7 8 8 9 8 7 6
Steel 92 78 -24 - - - - - -
Wholesale power supply 18 17 20 - - - - - -
Aluminum & copper 22 -27 8 - - - - - -
Machinery 31 30 29 - - - - - -
Construction machinery 23 11 8 - - - - - -
Real estate-related businesses 5 2 3 - - - - - -
Electronic materials, other 8 3 -0 - - - - - -
Companywide/eliminations 4 3 3 - - - - - -
Recurring profits (new segments) 158 61 10 85 120 140 160 130 100 80
Iron & steel -25 21 33 44 58 43 32 21
Welding 2 4 6 6 8 5 2 4
Aluminum & copper 2 14 14 18 20 17 14 13
Machinery 21 13 10 9 12 15 12 12
Natural resources & engineering 5 3 4 5 8 1 9 3
Kobelco Eco-Solutions 2 3 3 4 4 5 3 3
Kobelco Construction Machinery 6 29 42 49 54 49 37 26
Kobelco Cranes 1 0 1 2 3 2 1 0
Other 3 6 6 7 7 5 4 6
Adjustments -6 -8 1 -3 -13 -12 -14 -7
Note: Data factor in economic slowdown from 15/3.
Source: Company data, Nomura estimates
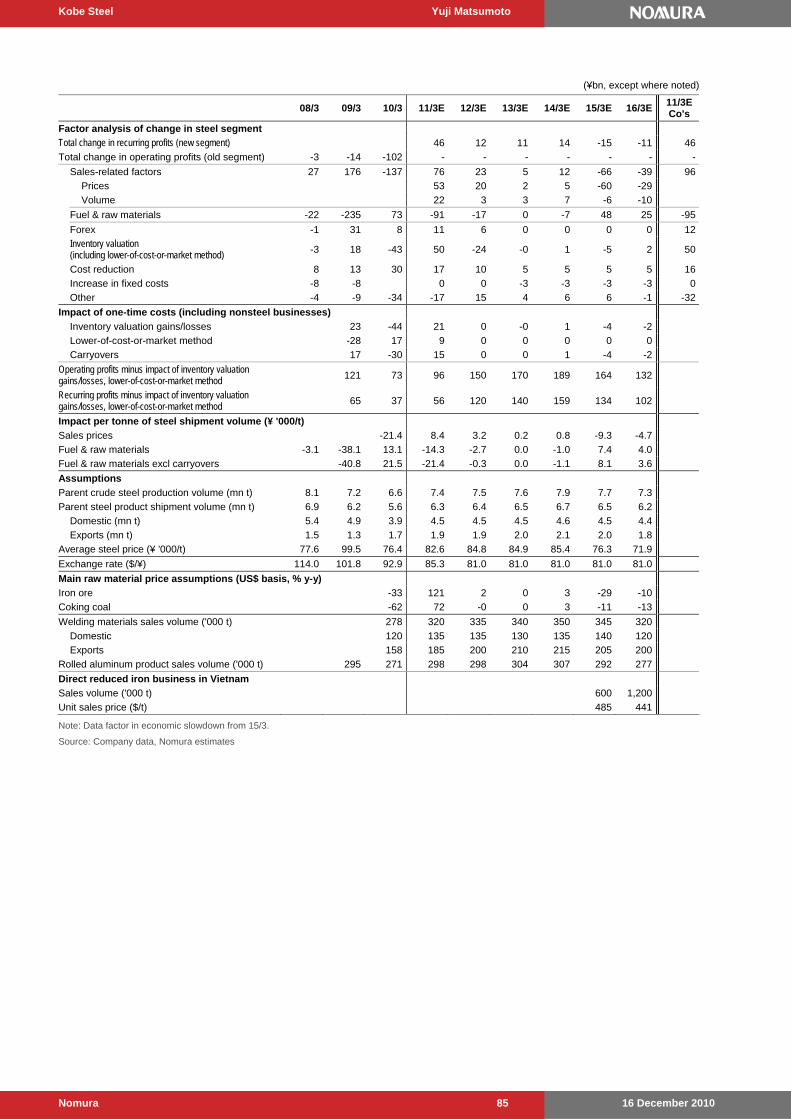
Kobe Steel Yuji Matsumoto
16 December 2010 Nomura 85
(¥bn, except where noted)
08/3 09/3 10/3 11/3E 12/3E 13/3E 14/3E 15/3E 16/3E 11/3ECo's
Factor analysis of change in steel segment
Total change in recurring profits (new segment) 46 12 11 14 -15 -11 46
Total change in operating profits (old segment) -3 -14 -102 - - - - - - -
Sales-related factors 27 176 -137 76 23 5 12 -66 -39 96
Prices 53 20 2 5 -60 -29
Volume 22 3 3 7 -6 -10
Fuel & raw materials -22 -235 73 -91 -17 0 -7 48 25 -95
Forex -1 31 8 11 6 0 0 0 0 12
Inventory valuation (including lower-of-cost-or-market method) -3 18 -43 50 -24 -0 1 -5 2 50
Cost reduction 8 13 30 17 10 5 5 5 5 16
Increase in fixed costs -8 -8 0 0 -3 -3 -3 -3 0
Other -4 -9 -34 -17 15 4 6 6 -1 -32
Impact of one-time costs (including nonsteel businesses)
Inventory valuation gains/losses 23 -44 21 0 -0 1 -4 -2
Lower-of-cost-or-market method -28 17 9 0 0 0 0 0
Carryovers 17 -30 15 0 0 1 -4 -2
Operating profits minus impact of inventory valuation gains/losses, lower-of-cost-or-market method 121 73 96 150 170 189 164 132
Recurring profits minus impact of inventory valuation gains/losses, lower-of-cost-or-market method 65 37 56 120 140 159 134 102
Impact per tonne of steel shipment volume (¥ '000/t)
Sales prices -21.4 8.4 3.2 0.2 0.8 -9.3 -4.7
Fuel & raw materials -3.1 -38.1 13.1 -14.3 -2.7 0.0 -1.0 7.4 4.0
Fuel & raw materials excl carryovers -40.8 21.5 -21.4 -0.3 0.0 -1.1 8.1 3.6
Assumptions
Parent crude steel production volume (mn t) 8.1 7.2 6.6 7.4 7.5 7.6 7.9 7.7 7.3
Parent steel product shipment volume (mn t) 6.9 6.2 5.6 6.3 6.4 6.5 6.7 6.5 6.2
Domestic (mn t) 5.4 4.9 3.9 4.5 4.5 4.5 4.6 4.5 4.4
Exports (mn t) 1.5 1.3 1.7 1.9 1.9 2.0 2.1 2.0 1.8
Average steel price (¥ '000/t) 77.6 99.5 76.4 82.6 84.8 84.9 85.4 76.3 71.9
Exchange rate ($/¥) 114.0 101.8 92.9 85.3 81.0 81.0 81.0 81.0 81.0
Main raw material price assumptions (US$ basis, % y-y)
Iron ore -33 121 2 0 3 -29 -10
Coking coal -62 72 -0 0 3 -11 -13
Welding materials sales volume ('000 t) 278 320 335 340 350 345 320
Domestic 120 135 135 130 135 140 120
Exports 158 185 200 210 215 205 200
Rolled aluminum product sales volume ('000 t) 295 271 298 298 304 307 292 277
Direct reduced iron business in Vietnam
Sales volume ('000 t) 600 1,200
Unit sales price ($/t) 485 441
Note: Data factor in economic slowdown from 15/3.
Source: Company data, Nomura estimates

Kobe Steel Yuji Matsumoto
16 December 2010 Nomura 86
(¥bn, except where noted)
08/3 09/3 10/3 11/3E 12/3E 13/3E 14/3E 15/3E 16/3E 11/3ECo's
Income statement
Sales 2,132 2,177 1,671 1,880 1,990 2,110 2,210 2,080 1,900 1,910
Operating profits 202 117 46 125 150 170 190 160 130 115
Net interest income -16 -14 -17 -17 -13 -12 -10 -11 -9
Equity in net income of affiliates 13 8 2 3 6 8 10 8 6
Other -41 -50 -21 -26 -23 -26 -30 -28 -27
Recurring profits 158 61 10 85 120 140 160 130 100 80
Extraordinary gains 2 0 7 3 0 0 0 0 0
Extraordinary losses 7 33 4 5 5 5 5 5 5
Pretax profits 153 28 14 83 115 135 155 125 95
Taxes 60 60 1 24 41 48 57 46 35
Tax rate (%) 39 215 7 29 36 36 37 37 37
Minority interests 5 -1 7 14 19 22 24 22 16
Net profits 89 -31 6 45 55 65 74 57 44 45
EPS (¥) 29.6 -10.5 2.1 15.0 18.3 21.6 24.6 19.0 14.7 15.0
% y-y -16 - - 8.0x 22 18 14 -23 -23 -
DPS (¥) 7.0 3.5 1.5 3.0 4.0 5.0 6.0 5.0 4.0
Capex 151 118 129 95 90 115 115 115 105 105
Depreciation 112 129 119 118 110 110 115 115 115 115
Balance sheet
Current assets 957 1,041 973 990 1,020 1,069 1,109 1,057 983
Cash & deposits, securities 69 188 132 85 90 95 99 94 86
Long-term assets 1,372 1,255 1,277 1,226 1,215 1,230 1,243 1,253 1,252
Total assets 2,329 2,295 2,249 2,216 2,235 2,299 2,352 2,310 2,235
Liabilities 1,681 1,782 1,692 1,621 1,577 1,568 1,540 1,436 1,315
Accounts payable 488 480 435 454 481 510 534 503 459
Interest-bearing debt 823 954 955 840 752 707 646 584 518
Other 370 349 303 327 344 351 360 349 338
Net assets 648 513 557 595 658 731 812 874 920
Shareholders' equity 600 479 517 541 585 636 693 733 763
Minority interests 48 34 40 54 73 95 119 141 157
BPS (¥) 199.8 159.6 172.1 180.2 194.8 211.8 230.8 244.1 254.1
ROE (%) 14.9 -5.8 1.3 8.5 9.8 10.6 11.1 8.0 5.9
Shareholders' equity to total assets (%) 25.8 20.9 23.0 24.4 26.2 27.7 29.5 31.7 34.1
D/E ratio (x) 1.4 2.0 1.8 1.6 1.3 1.1 0.9 0.8 0.7
Cash flow
Net profits 89 -31 6 45 55 65 74 57 44
Depreciation 112 129 119 118 110 110 115 115 115
Change in working capital -88 23 49 -35 2 -15 -12 16 22
Other 12 -2 -45 53 32 24 25 6 1
Operating cash flow 124 118 129 181 199 184 202 194 182
Investment cash flow -187 -127 -149 -97 -95 -120 -120 -120 -110
Free cash flow -63 -9 -20 84 104 64 82 74 72
Financial cash flow 31 139 -7 -121 -99 -59 -78 -79 -80
Other adjustments (changes in scope of consolidation)
1 -10 -29 -10 0 0 0 0 0
Change in cash & equivalents -31 120 -56 -47 5 5 4 -5 -8
Note: Data factor in economic slowdown from 15/3.
Source: Company data, Nomura estimates

16 December 2010 Nomura 87
Toshiba Machine 6104 JP
MACHINE TOOLS | TOKYO (TSE-1)
Wenjie Ge +81 3 6703 1168 [email protected]
Strong performance in molding machinery, hydraulic equipment
Rising orders for extrusion machines
Sales and profit growth prospects appear to be improving in the molding machinery segment. Demand is strong for extrusion machinery (which we expect to account for 26% of molding machinery sales in 11/3), used in the manufacture of sheets and films, and orders have been rising from manufacturers of products used in optical devices, lithium-ion batteries and LCD TV film.
Hydraulic equipment: likely to account for 24% of OP
Hyest, which is responsible for the manufacture and sale of hydraulic equipment, was spun off from Toshiba Machine's hydraulic equipment division in April 2008. Over 80% of its sales are to manufacturers of construction machinery, and it mainly produces hydraulic valves (around 50% of sales at the business), rotation motors (around 40%) and pumps (around 10%). It appears to have the top share of hydraulic equipment used in some small and large hydraulic excavators.
Strengthening alliances with Chinese companies
Toshiba Machine has been strengthening alliances with local companies in the strategic Chinese market, and in June 2010, it signed a strategic partnership with Yuchai. Toshiba Machine started supplying hydraulic equipment to Yuchai in 2001, which now accounts for around 10% of the former’s sales of hydraulic equipment. We forecast ongoing sales growth now that the two companies have entered into a strategic alliance.
31 Mar (¥mn) 10/3 11/3F 12/3F 13/3F
Sales 74,694 91,700 109,900 122,100
(Company Es t) - 92,000 - -
Operat ing Profits (1,815) 3,300 5,400 7,600
(Company Es t) - 3,200 - -
Net Profit (4,531) 1,700 2,800 4,200
(Company Es t) - 1,600 - -
EPS (¥) (30) 11.2 18.4 27.6
(% y-y) na na 64 50
(Company Es t) - 10.5 - -
BPS (¥) 416.8 425.6 440.7 462.4
PER (x) - 34.8 21.2 14.1
PBR (x) 0.9 0.9 0.9 0.8
EV/EBITD A (x) 76.1 10.5 7.9 6.2
Net D/E rat io (x) (0.2) (0.2) (0.1) (0.1)
ROE (%) (6.9) 2.7 4.3 6.2
Earnings revisions
Previous net profit - 1,700 2,800 4,200
(Chg from previous, %) - na na na
Previous EPS (¥) - 11.2 18.4 27.6
(Chg from previous, %) - na na na
Source: Company, Nomura estimates
Share price relative to MSCI Japan
1m 3m 6m
9.2 37.3 9.9
7.4 37.9 19.9
5.3 30.4 5.9
Source: Company, Nomura estimates
Relat ive to Index
Market cap (U S$mn) 779
Absolute (¥)
52-week range (¥) 439.0/269.0
Absolute (US$)
250
300
350
400
450
Dec
09
Jan
10
Fe
b10
Ma
r10
Ap
r10
May
10
Jun
10
Jul1
0
Au
g10
Se
p10
Oct
10
Nov
10
80859095100105110115120125
Price
Rel MSCI Japan(¥)
Closing price on 10 Dec ¥390
Price target
Upside/downside 20.5%Difference from consensus 9.6%
12/3F net profit (¥mn) 2,800
Difference from consensus -18.4%
Source: Nomura
¥470
Nomura vs consensus We forecast 12/3 OP of ¥5.4bn vs Bloomberg consensus (as of 10 December) of ¥6.3bn. We are cautious on earnings improvements in the machine tool segment.
N O M U R A S E C U R I T I E S C O L T D
Action The mainstay molding machinery segment (which we expect to account for 51% of
11/3 sales and 39% of operating profits) now looks more likely to sustain sales and profit growth. The hydraulic equipment business (which mainly makes motors and hydraulic valves that have high entry barriers) is also likely to benefit greatly from demand from the construction machinery industry, especially in China. BUY.
Catalysts Orders have started to recover in the lucrative machine tool segment and are also
rising for hydraulic equipment used in construction machinery, which could become a new cash cow.
Anchor themes
With demand for construction machinery strong, we are focusing on hydraulic equipment for construction machinery, in which Japanese companies have a strong presence.
Maintained
BUY
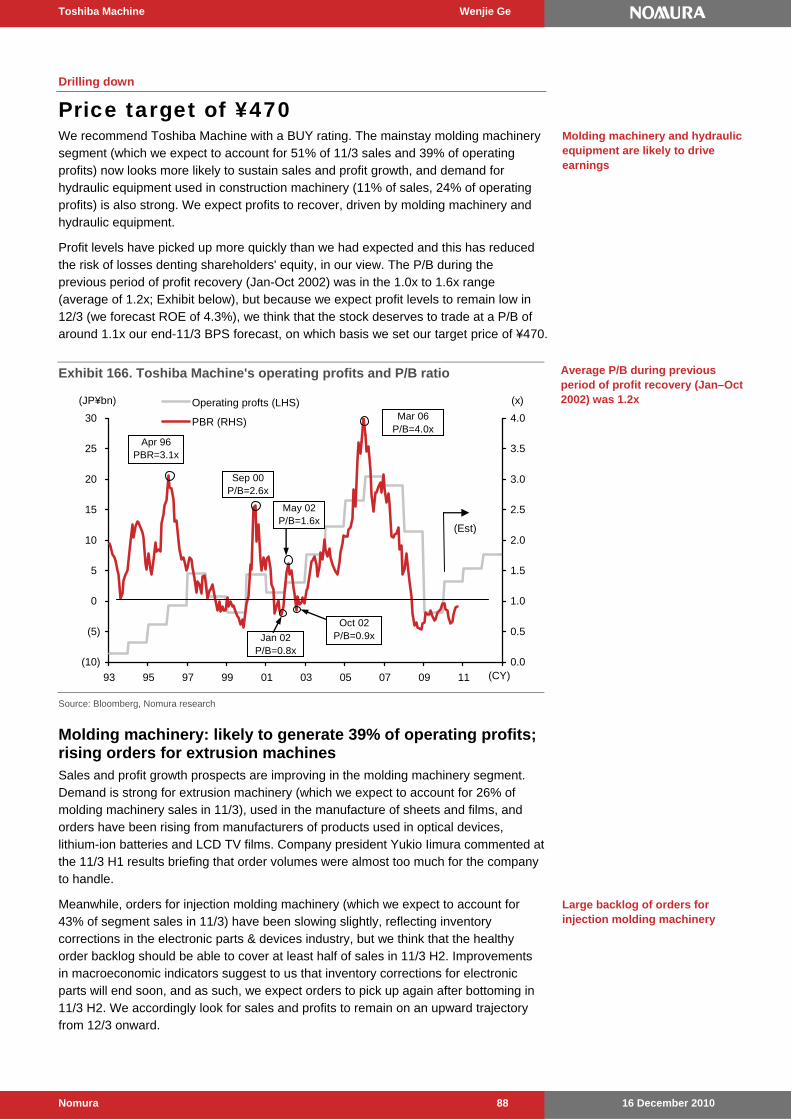
Toshiba Machine Wenjie Ge
16 December 2010 Nomura 88
Drilling down
Price target of ¥470 We recommend Toshiba Machine with a BUY rating. The mainstay molding machinery segment (which we expect to account for 51% of 11/3 sales and 39% of operating profits) now looks more likely to sustain sales and profit growth, and demand for hydraulic equipment used in construction machinery (11% of sales, 24% of operating profits) is also strong. We expect profits to recover, driven by molding machinery and hydraulic equipment.
Profit levels have picked up more quickly than we had expected and this has reduced the risk of losses denting shareholders' equity, in our view. The P/B during the previous period of profit recovery (Jan-Oct 2002) was in the 1.0x to 1.6x range (average of 1.2x; Exhibit below), but because we expect profit levels to remain low in 12/3 (we forecast ROE of 4.3%), we think that the stock deserves to trade at a P/B of around 1.1x our end-11/3 BPS forecast, on which basis we set our target price of ¥470.
Exhibit 166. Toshiba Machine's operating profits and P/B ratio
(10)
(5)
0
5
10
15
20
25
30
93 95 97 99 01 03 05 07 09 11
0.0
0.5
1.0
1.5
2.0
2.5
3.0
3.5
4.0
Operating profts (LHS)
PBR (RHS)
(JP¥bn) (x)
(CY)
(Est)
Oct 02P/B=0.9xJan 02
P/B=0.8x
May 02P/B=1.6x
Sep 00P/B=2.6x
Mar 06P/B=4.0x
Apr 96PBR=3.1x
Source: Bloomberg, Nomura research
Molding machinery: likely to generate 39% of operating profits; rising orders for extrusion machines Sales and profit growth prospects are improving in the molding machinery segment. Demand is strong for extrusion machinery (which we expect to account for 26% of molding machinery sales in 11/3), used in the manufacture of sheets and films, and orders have been rising from manufacturers of products used in optical devices, lithium-ion batteries and LCD TV films. Company president Yukio Iimura commented at the 11/3 H1 results briefing that order volumes were almost too much for the company to handle.
Meanwhile, orders for injection molding machinery (which we expect to account for 43% of segment sales in 11/3) have been slowing slightly, reflecting inventory corrections in the electronic parts & devices industry, but we think that the healthy order backlog should be able to cover at least half of sales in 11/3 H2. Improvements in macroeconomic indicators suggest to us that inventory corrections for electronic parts will end soon, and as such, we expect orders to pick up again after bottoming in 11/3 H2. We accordingly look for sales and profits to remain on an upward trajectory from 12/3 onward.
Molding machinery and hydraulic equipment are likely to drive earnings
Average P/B during previous period of profit recovery (Jan–Oct 2002) was 1.2x
Large backlog of orders for injection molding machinery
Toshiba Machine Wenjie Ge
16 December 2010 Nomura 89
Hydraulic equipment: likely to account for 24% of operating profits Hyest, which is responsible for the manufacture and sale of hydraulic equipment, was spun off from Toshiba Machine's hydraulic equipment division in April 2008. Over 80% of its sales are to manufacturers of construction machinery, and it mainly produces hydraulic valves (around 50% of sales at the business), rotation motors (around 40%), and pumps (around 10%). It appears to have the top share of hydraulic equipment used in some small and large hydraulic excavators.
China accounts for around half of the global hydraulic excavator market and is currently exhibiting strong demand. Toshiba Machine has a three-shift, 24-hour production setup at its Sagami plant at present, but even so it cannot keep up with orders, and inquiries appear to be running at over double the level of actual orders. The company commenced mass production of rotation motors at its Shanghai plant from 11/3, with a view to increasing monthly output first from 500 units to 1,000 units and later to 1,500 units in 12/3 and 2,000 units in 13/3. It plans to use resulting spare capacity at the Sagami plant to increase valve output.
At the same time, Toshiba Machine will be supplying production technology to Korean hydraulic equipment manufacturers with a view to using them to plug production shortfalls. It will be supplying hydraulic valve technology to Daesung Industry, part of Daesung Group Holdings, for mass production from 2013, and rotation motor technology to the Sungbo group, for mass production from 2011.
Strengthening alliances with Chinese companies Toshiba Machine has been strengthening alliances with local companies in the strategic Chinese market, and in June 2010, it signed a strategic partnership with Yuchai, a Chinese diesel engine manufacturer founded in 1989 that also produces and sells mini excavators and had an 18% share of the Chinese market in Jan–Oct 2010, behind Doosan Infracore with 20%. Having formed a partnership with Toshiba Machine in June 2010, Yuchai went on to form alliances with major US filter manufacturer Donaldson in September and with two Chinese companies, Shantui Construction Machinery and Jining Yongsheng Construction Machinery, in November, in order to ensure a stable supply of parts as it moves into the markets for medium-sized and large hydraulic excavators.
Toshiba Machine started supplying hydraulic equipment to Yuchai in 2001, which now accounts for around 10% of the former’s sales of hydraulic equipment. We forecast ongoing sales growth now that the two companies have entered into a strategic alliance.
Risks to our investment view Risks to our investment view include slower-than-expected improvement in profit, and a
dramatic slowdown in global economic growth, as well as customer investment.
Healthy demand in China, capacity increases inside and outside Japan
Supplying technology to Korean companies with view to mass producing hydraulic equipment
Prospect of ongoing growth in sales to Chinese company
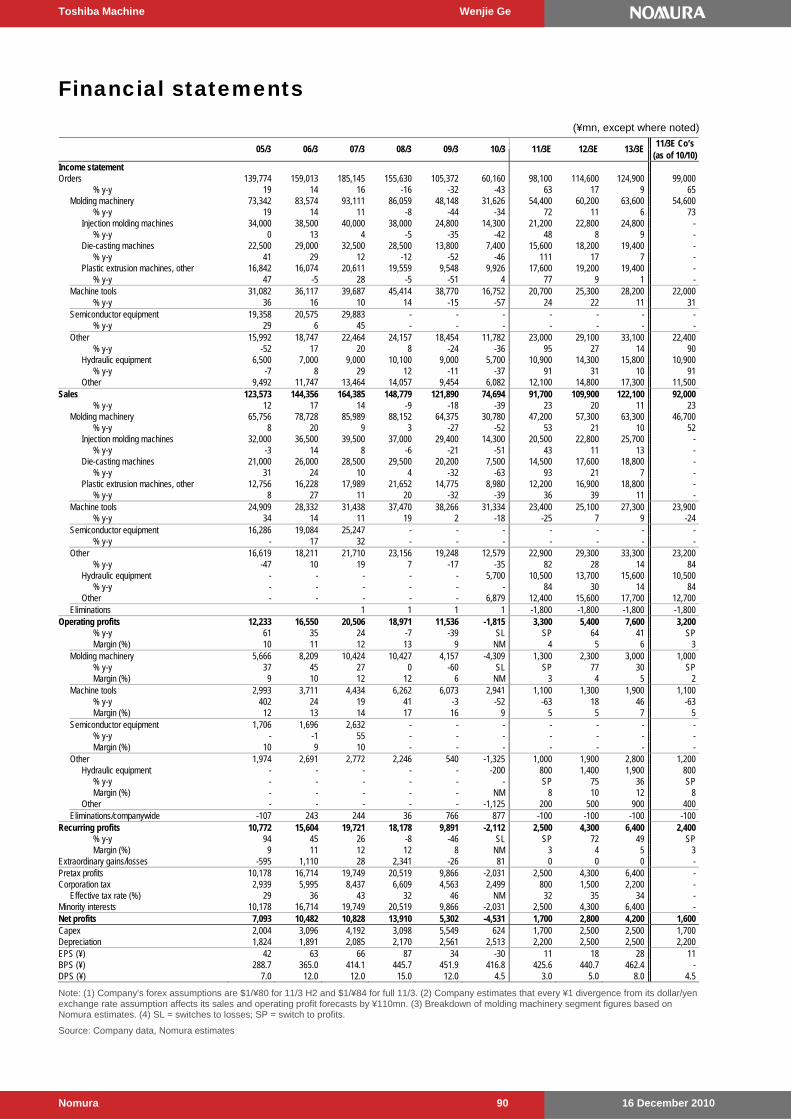
Toshiba Machine Wenjie Ge
16 December 2010 Nomura 90
Financial statements
(¥mn, except where noted)
11/3E Co’s
05/3 06/3 07/3 08/3 09/3 10/3 11/3E 12/3E 13/3E (as of 10/10)
Income statement Orders 139,774 159,013 185,145 155,630 105,372 60,160 98,100 114,600 124,900 99,000 % y-y 19 14 16 -16 -32 -43 63 17 9 65 Molding machinery 73,342 83,574 93,111 86,059 48,148 31,626 54,400 60,200 63,600 54,600 % y-y 19 14 11 -8 -44 -34 72 11 6 73 Injection molding machines 34,000 38,500 40,000 38,000 24,800 14,300 21,200 22,800 24,800 - % y-y 0 13 4 -5 -35 -42 48 8 9 - Die-casting machines 22,500 29,000 32,500 28,500 13,800 7,400 15,600 18,200 19,400 - % y-y 41 29 12 -12 -52 -46 111 17 7 - Plastic extrusion machines, other 16,842 16,074 20,611 19,559 9,548 9,926 17,600 19,200 19,400 - % y-y 47 -5 28 -5 -51 4 77 9 1 - Machine tools 31,082 36,117 39,687 45,414 38,770 16,752 20,700 25,300 28,200 22,000 % y-y 36 16 10 14 -15 -57 24 22 11 31 Semiconductor equipment 19,358 20,575 29,883 - - - - - - - % y-y 29 6 45 - - - - - - - Other 15,992 18,747 22,464 24,157 18,454 11,782 23,000 29,100 33,100 22,400 % y-y -52 17 20 8 -24 -36 95 27 14 90 Hydraulic equipment 6,500 7,000 9,000 10,100 9,000 5,700 10,900 14,300 15,800 10,900 % y-y -7 8 29 12 -11 -37 91 31 10 91 Other 9,492 11,747 13,464 14,057 9,454 6,082 12,100 14,800 17,300 11,500 Sales 123,573 144,356 164,385 148,779 121,890 74,694 91,700 109,900 122,100 92,000 % y-y 12 17 14 -9 -18 -39 23 20 11 23 Molding machinery 65,756 78,728 85,989 88,152 64,375 30,780 47,200 57,300 63,300 46,700 % y-y 8 20 9 3 -27 -52 53 21 10 52 Injection molding machines 32,000 36,500 39,500 37,000 29,400 14,300 20,500 22,800 25,700 - % y-y -3 14 8 -6 -21 -51 43 11 13 - Die-casting machines 21,000 26,000 28,500 29,500 20,200 7,500 14,500 17,600 18,800 - % y-y 31 24 10 4 -32 -63 93 21 7 - Plastic extrusion machines, other 12,756 16,228 17,989 21,652 14,775 8,980 12,200 16,900 18,800 - % y-y 8 27 11 20 -32 -39 36 39 11 - Machine tools 24,909 28,332 31,438 37,470 38,266 31,334 23,400 25,100 27,300 23,900 % y-y 34 14 11 19 2 -18 -25 7 9 -24 Semiconductor equipment 16,286 19,084 25,247 - - - - - - - % y-y - 17 32 - - - - - - - Other 16,619 18,211 21,710 23,156 19,248 12,579 22,900 29,300 33,300 23,200 % y-y -47 10 19 7 -17 -35 82 28 14 84 Hydraulic equipment - - - - - 5,700 10,500 13,700 15,600 10,500 % y-y - - - - - - 84 30 14 84 Other - - - - - 6,879 12,400 15,600 17,700 12,700 Eliminations 1 1 1 1 -1,800 -1,800 -1,800 -1,800 Operating profits 12,233 16,550 20,506 18,971 11,536 -1,815 3,300 5,400 7,600 3,200 % y-y 61 35 24 -7 -39 SL SP 64 41 SP Margin (%) 10 11 12 13 9 NM 4 5 6 3 Molding machinery 5,666 8,209 10,424 10,427 4,157 -4,309 1,300 2,300 3,000 1,000 % y-y 37 45 27 0 -60 SL SP 77 30 SP Margin (%) 9 10 12 12 6 NM 3 4 5 2 Machine tools 2,993 3,711 4,434 6,262 6,073 2,941 1,100 1,300 1,900 1,100 % y-y 402 24 19 41 -3 -52 -63 18 46 -63 Margin (%) 12 13 14 17 16 9 5 5 7 5 Semiconductor equipment 1,706 1,696 2,632 - - - - - - - % y-y - -1 55 - - - - - - - Margin (%) 10 9 10 - - - - - - - Other 1,974 2,691 2,772 2,246 540 -1,325 1,000 1,900 2,800 1,200 Hydraulic equipment - - - - - -200 800 1,400 1,900 800 % y-y - - - - - - SP 75 36 SP Margin (%) - - - - - NM 8 10 12 8 Other - - - - - -1,125 200 500 900 400 Eliminations/companywide -107 243 244 36 766 877 -100 -100 -100 -100 Recurring profits 10,772 15,604 19,721 18,178 9,891 -2,112 2,500 4,300 6,400 2,400 % y-y 94 45 26 -8 -46 SL SP 72 49 SP Margin (%) 9 11 12 12 8 NM 3 4 5 3 Extraordinary gains/losses -595 1,110 28 2,341 -26 81 0 0 0 - Pretax profits 10,178 16,714 19,749 20,519 9,866 -2,031 2,500 4,300 6,400 - Corporation tax 2,939 5,995 8,437 6,609 4,563 2,499 800 1,500 2,200 - Effective tax rate (%) 29 36 43 32 46 NM 32 35 34 - Minority interests 10,178 16,714 19,749 20,519 9,866 -2,031 2,500 4,300 6,400 - Net profits 7,093 10,482 10,828 13,910 5,302 -4,531 1,700 2,800 4,200 1,600 Capex 2,004 3,096 4,192 3,098 5,549 624 1,700 2,500 2,500 1,700 Depreciation 1,824 1,891 2,085 2,170 2,561 2,513 2,200 2,500 2,500 2,200 EPS (¥) 42 63 66 87 34 -30 11 18 28 11 BPS (¥) 288.7 365.0 414.1 445.7 451.9 416.8 425.6 440.7 462.4 - DPS (¥) 7.0 12.0 12.0 15.0 12.0 4.5 3.0 5.0 8.0 4.5
Note: (1) Company's forex assumptions are $1/¥80 for 11/3 H2 and $1/¥84 for full 11/3. (2) Company estimates that every ¥1 divergence from its dollar/yen exchange rate assumption affects its sales and operating profit forecasts by ¥110mn. (3) Breakdown of molding machinery segment figures based on Nomura estimates. (4) SL = switches to losses; SP = switch to profits.
Source: Company data, Nomura estimates
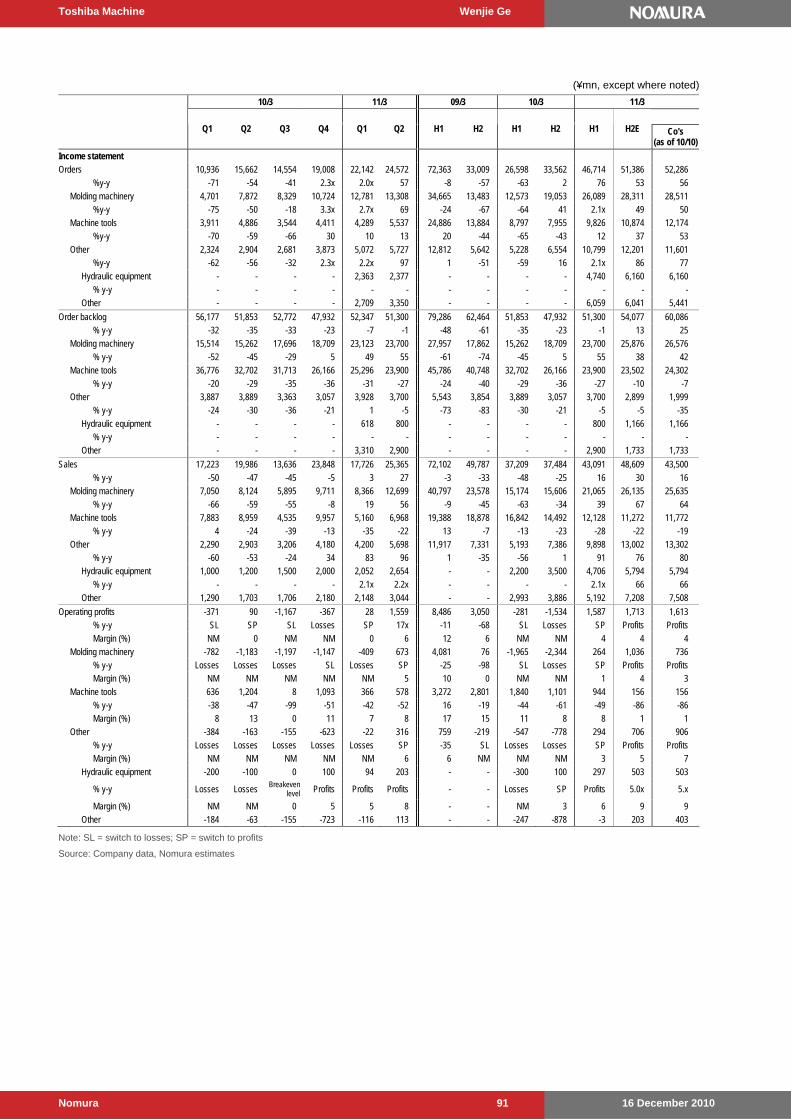
Toshiba Machine Wenjie Ge
16 December 2010 Nomura 91
(¥mn, except where noted)
10/3 11/3 09/3 10/3 11/3
Q1 Q2 Q3 Q4 Q1 Q2 H1 H2 H1 H2 H1 H2E Co's
(as of 10/10)
Income statement Orders 10,936 15,662 14,554 19,008 22,142 24,572 72,363 33,009 26,598 33,562 46,714 51,386 52,286
%y-y -71 -54 -41 2.3x 2.0x 57 -8 -57 -63 2 76 53 56 Molding machinery 4,701 7,872 8,329 10,724 12,781 13,308 34,665 13,483 12,573 19,053 26,089 28,311 28,511 %y-y -75 -50 -18 3.3x 2.7x 69 -24 -67 -64 41 2.1x 49 50 Machine tools 3,911 4,886 3,544 4,411 4,289 5,537 24,886 13,884 8,797 7,955 9,826 10,874 12,174 %y-y -70 -59 -66 30 10 13 20 -44 -65 -43 12 37 53
Other 2,324 2,904 2,681 3,873 5,072 5,727 12,812 5,642 5,228 6,554 10,799 12,201 11,601 %y-y -62 -56 -32 2.3x 2.2x 97 1 -51 -59 16 2.1x 86 77 Hydraulic equipment - - - - 2,363 2,377 - - - - 4,740 6,160 6,160 % y-y - - - - - - - - - - - - -
Other - - - - 2,709 3,350 - - - - 6,059 6,041 5,441
Order backlog 56,177 51,853 52,772 47,932 52,347 51,300 79,286 62,464 51,853 47,932 51,300 54,077 60,086 % y-y -32 -35 -33 -23 -7 -1 -48 -61 -35 -23 -1 13 25 Molding machinery 15,514 15,262 17,696 18,709 23,123 23,700 27,957 17,862 15,262 18,709 23,700 25,876 26,576
% y-y -52 -45 -29 5 49 55 -61 -74 -45 5 55 38 42 Machine tools 36,776 32,702 31,713 26,166 25,296 23,900 45,786 40,748 32,702 26,166 23,900 23,502 24,302 % y-y -20 -29 -35 -36 -31 -27 -24 -40 -29 -36 -27 -10 -7 Other 3,887 3,889 3,363 3,057 3,928 3,700 5,543 3,854 3,889 3,057 3,700 2,899 1,999 % y-y -24 -30 -36 -21 1 -5 -73 -83 -30 -21 -5 -5 -35
Hydraulic equipment - - - - 618 800 - - - - 800 1,166 1,166 % y-y - - - - - - - - - - - - - Other - - - - 3,310 2,900 - - - - 2,900 1,733 1,733
Sales 17,223 19,986 13,636 23,848 17,726 25,365 72,102 49,787 37,209 37,484 43,091 48,609 43,500
% y-y -50 -47 -45 -5 3 27 -3 -33 -48 -25 16 30 16 Molding machinery 7,050 8,124 5,895 9,711 8,366 12,699 40,797 23,578 15,174 15,606 21,065 26,135 25,635 % y-y -66 -59 -55 -8 19 56 -9 -45 -63 -34 39 67 64 Machine tools 7,883 8,959 4,535 9,957 5,160 6,968 19,388 18,878 16,842 14,492 12,128 11,272 11,772
% y-y 4 -24 -39 -13 -35 -22 13 -7 -13 -23 -28 -22 -19 Other 2,290 2,903 3,206 4,180 4,200 5,698 11,917 7,331 5,193 7,386 9,898 13,002 13,302 % y-y -60 -53 -24 34 83 96 1 -35 -56 1 91 76 80 Hydraulic equipment 1,000 1,200 1,500 2,000 2,052 2,654 - - 2,200 3,500 4,706 5,794 5,794 % y-y - - - - 2.1x 2.2x - - - - 2.1x 66 66
Other 1,290 1,703 1,706 2,180 2,148 3,044 - - 2,993 3,886 5,192 7,208 7,508
Operating profits -371 90 -1,167 -367 28 1,559 8,486 3,050 -281 -1,534 1,587 1,713 1,613 % y-y SL SP SL Losses SP 17x -11 -68 SL Losses SP Profits Profits
Margin (%) NM 0 NM NM 0 6 12 6 NM NM 4 4 4 Molding machinery -782 -1,183 -1,197 -1,147 -409 673 4,081 76 -1,965 -2,344 264 1,036 736 % y-y Losses Losses Losses SL Losses SP -25 -98 SL Losses SP Profits Profits Margin (%) NM NM NM NM NM 5 10 0 NM NM 1 4 3 Machine tools 636 1,204 8 1,093 366 578 3,272 2,801 1,840 1,101 944 156 156
% y-y -38 -47 -99 -51 -42 -52 16 -19 -44 -61 -49 -86 -86 Margin (%) 8 13 0 11 7 8 17 15 11 8 8 1 1 Other -384 -163 -155 -623 -22 316 759 -219 -547 -778 294 706 906 % y-y Losses Losses Losses Losses Losses SP -35 SL Losses Losses SP Profits Profits Margin (%) NM NM NM NM NM 6 6 NM NM NM 3 5 7
Hydraulic equipment -200 -100 0 100 94 203 - - -300 100 297 503 503
% y-y Losses Losses Breakeven level Profits Profits Profits - - Losses SP Profits 5.0x 5.x
Margin (%) NM NM 0 5 5 8 - - NM 3 6 9 9 Other -184 -63 -155 -723 -116 113 - - -247 -878 -3 203 403
Note: SL = switch to losses; SP = switch to profits
Source: Company data, Nomura estimates
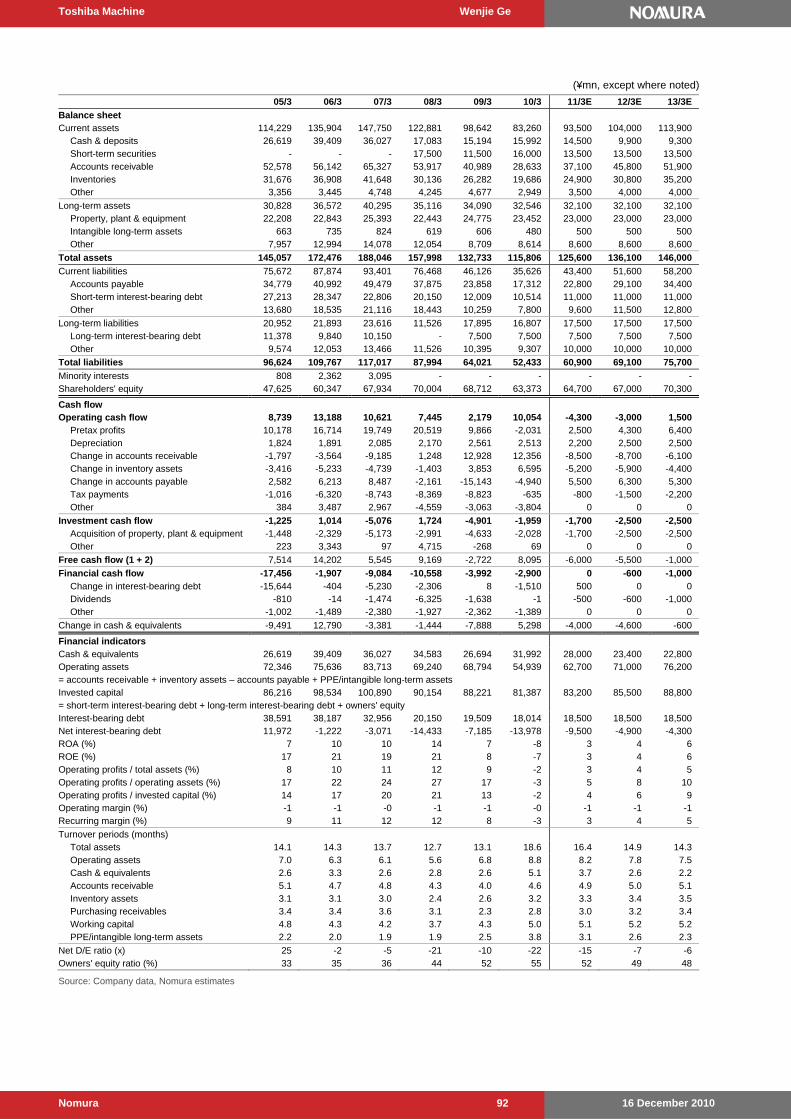
Toshiba Machine Wenjie Ge
16 December 2010 Nomura 92
(¥mn, except where noted)
05/3 06/3 07/3 08/3 09/3 10/3 11/3E 12/3E 13/3E
Balance sheet Current assets 114,229 135,904 147,750 122,881 98,642 83,260 93,500 104,000 113,900 Cash & deposits 26,619 39,409 36,027 17,083 15,194 15,992 14,500 9,900 9,300 Short-term securities - - - 17,500 11,500 16,000 13,500 13,500 13,500 Accounts receivable 52,578 56,142 65,327 53,917 40,989 28,633 37,100 45,800 51,900 Inventories 31,676 36,908 41,648 30,136 26,282 19,686 24,900 30,800 35,200 Other 3,356 3,445 4,748 4,245 4,677 2,949 3,500 4,000 4,000
Long-term assets 30,828 36,572 40,295 35,116 34,090 32,546 32,100 32,100 32,100 Property, plant & equipment 22,208 22,843 25,393 22,443 24,775 23,452 23,000 23,000 23,000 Intangible long-term assets 663 735 824 619 606 480 500 500 500 Other 7,957 12,994 14,078 12,054 8,709 8,614 8,600 8,600 8,600
Total assets 145,057 172,476 188,046 157,998 132,733 115,806 125,600 136,100 146,000
Current liabilities 75,672 87,874 93,401 76,468 46,126 35,626 43,400 51,600 58,200 Accounts payable 34,779 40,992 49,479 37,875 23,858 17,312 22,800 29,100 34,400 Short-term interest-bearing debt 27,213 28,347 22,806 20,150 12,009 10,514 11,000 11,000 11,000 Other 13,680 18,535 21,116 18,443 10,259 7,800 9,600 11,500 12,800
Long-term liabilities 20,952 21,893 23,616 11,526 17,895 16,807 17,500 17,500 17,500 Long-term interest-bearing debt 11,378 9,840 10,150 - 7,500 7,500 7,500 7,500 7,500 Other 9,574 12,053 13,466 11,526 10,395 9,307 10,000 10,000 10,000
Total liabilities 96,624 109,767 117,017 87,994 64,021 52,433 60,900 69,100 75,700
Minority interests 808 2,362 3,095 - - - - - - Shareholders' equity 47,625 60,347 67,934 70,004 68,712 63,373 64,700 67,000 70,300
Cash flow Operating cash flow 8,739 13,188 10,621 7,445 2,179 10,054 -4,300 -3,000 1,500 Pretax profits 10,178 16,714 19,749 20,519 9,866 -2,031 2,500 4,300 6,400 Depreciation 1,824 1,891 2,085 2,170 2,561 2,513 2,200 2,500 2,500 Change in accounts receivable -1,797 -3,564 -9,185 1,248 12,928 12,356 -8,500 -8,700 -6,100 Change in inventory assets -3,416 -5,233 -4,739 -1,403 3,853 6,595 -5,200 -5,900 -4,400 Change in accounts payable 2,582 6,213 8,487 -2,161 -15,143 -4,940 5,500 6,300 5,300 Tax payments -1,016 -6,320 -8,743 -8,369 -8,823 -635 -800 -1,500 -2,200 Other 384 3,487 2,967 -4,559 -3,063 -3,804 0 0 0
Investment cash flow -1,225 1,014 -5,076 1,724 -4,901 -1,959 -1,700 -2,500 -2,500 Acquisition of property, plant & equipment -1,448 -2,329 -5,173 -2,991 -4,633 -2,028 -1,700 -2,500 -2,500 Other 223 3,343 97 4,715 -268 69 0 0 0
Free cash flow (1 + 2) 7,514 14,202 5,545 9,169 -2,722 8,095 -6,000 -5,500 -1,000
Financial cash flow -17,456 -1,907 -9,084 -10,558 -3,992 -2,900 0 -600 -1,000 Change in interest-bearing debt -15,644 -404 -5,230 -2,306 8 -1,510 500 0 0 Dividends -810 -14 -1,474 -6,325 -1,638 -1 -500 -600 -1,000 Other -1,002 -1,489 -2,380 -1,927 -2,362 -1,389 0 0 0
Change in cash & equivalents -9,491 12,790 -3,381 -1,444 -7,888 5,298 -4,000 -4,600 -600
Financial indicators Cash & equivalents 26,619 39,409 36,027 34,583 26,694 31,992 28,000 23,400 22,800 Operating assets 72,346 75,636 83,713 69,240 68,794 54,939 62,700 71,000 76,200 = accounts receivable + inventory assets – accounts payable + PPE/intangible long-term assets Invested capital 86,216 98,534 100,890 90,154 88,221 81,387 83,200 85,500 88,800 = short-term interest-bearing debt + long-term interest-bearing debt + owners' equity Interest-bearing debt 38,591 38,187 32,956 20,150 19,509 18,014 18,500 18,500 18,500 Net interest-bearing debt 11,972 -1,222 -3,071 -14,433 -7,185 -13,978 -9,500 -4,900 -4,300 ROA (%) 7 10 10 14 7 -8 3 4 6 ROE (%) 17 21 19 21 8 -7 3 4 6 Operating profits / total assets (%) 8 10 11 12 9 -2 3 4 5 Operating profits / operating assets (%) 17 22 24 27 17 -3 5 8 10 Operating profits / invested capital (%) 14 17 20 21 13 -2 4 6 9 Operating margin (%) -1 -1 -0 -1 -1 -0 -1 -1 -1 Recurring margin (%) 9 11 12 12 8 -3 3 4 5
Turnover periods (months) Total assets 14.1 14.3 13.7 12.7 13.1 18.6 16.4 14.9 14.3 Operating assets 7.0 6.3 6.1 5.6 6.8 8.8 8.2 7.8 7.5 Cash & equivalents 2.6 3.3 2.6 2.8 2.6 5.1 3.7 2.6 2.2 Accounts receivable 5.1 4.7 4.8 4.3 4.0 4.6 4.9 5.0 5.1 Inventory assets 3.1 3.1 3.0 2.4 2.6 3.2 3.3 3.4 3.5 Purchasing receivables 3.4 3.4 3.6 3.1 2.3 2.8 3.0 3.2 3.4 Working capital 4.8 4.3 4.2 3.7 4.3 5.0 5.1 5.2 5.2 PPE/intangible long-term assets 2.2 2.0 1.9 1.9 2.5 3.8 3.1 2.6 2.3
Net D/E ratio (x) 25 -2 -5 -21 -10 -22 -15 -7 -6 Owners' equity ratio (%) 33 35 36 44 52 55 52 49 48
Source: Company data, Nomura estimates
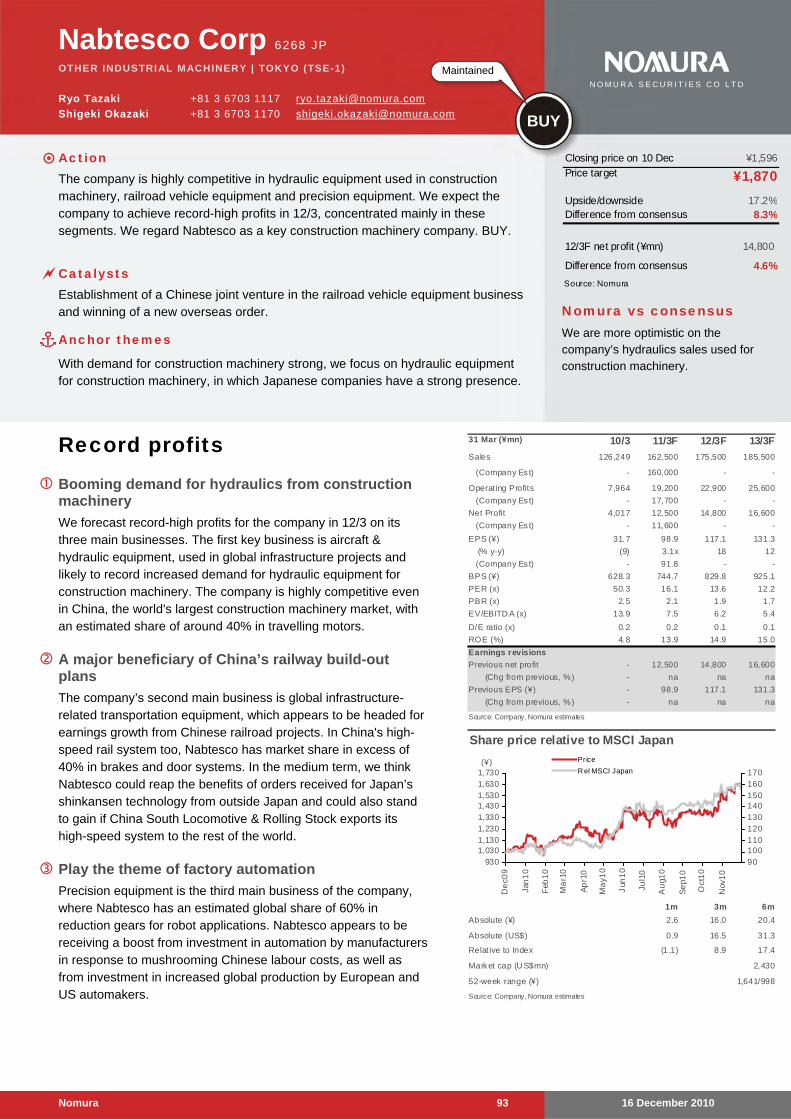
16 December 2010 Nomura 93
Nabtesco Corp 6268 JP
OTHER INDUSTRIAL MACHINERY | TOKYO (TSE-1)
Ryo Tazaki +81 3 6703 1117 [email protected]
Shigeki Okazaki +81 3 6703 1170 [email protected]
Record profits Booming demand for hydraulics from construction
machinery
We forecast record-high profits for the company in 12/3 on its three main businesses. The first key business is aircraft & hydraulic equipment, used in global infrastructure projects and likely to record increased demand for hydraulic equipment for construction machinery. The company is highly competitive even in China, the world's largest construction machinery market, with an estimated share of around 40% in travelling motors.
A major beneficiary of China’s railway build-out plans
The company’s second main business is global infrastructure-related transportation equipment, which appears to be headed for earnings growth from Chinese railroad projects. In China's high-speed rail system too, Nabtesco has market share in excess of 40% in brakes and door systems. In the medium term, we think Nabtesco could reap the benefits of orders received for Japan’s shinkansen technology from outside Japan and could also stand to gain if China South Locomotive & Rolling Stock exports its high-speed system to the rest of the world.
Play the theme of factory automation
Precision equipment is the third main business of the company, where Nabtesco has an estimated global share of 60% in reduction gears for robot applications. Nabtesco appears to be receiving a boost from investment in automation by manufacturers in response to mushrooming Chinese labour costs, as well as from investment in increased global production by European and US automakers.
31 Mar (¥mn) 10/3 11/3F 12/3F 13/3F
Sales 126,249 162,500 175,500 185,500
(Company Es t) - 160,000 - -
Operat ing Profits 7,964 19,200 22,900 25,600
(Company Es t) - 17,700 - -
Net Profit 4,017 12,500 14,800 16,600
(Company Es t) - 11,600 - -
EPS (¥) 31.7 98.9 117.1 131.3
(% y-y) (9) 3.1x 18 12
(Company Es t) - 91.8 - -
BPS (¥) 628.3 744.7 829.8 925.1
PER (x) 50.3 16.1 13.6 12.2
PBR (x) 2.5 2.1 1.9 1.7
EV/EBITD A (x) 13.9 7.5 6.2 5.4
D/E ratio (x) 0.2 0.2 0.1 0.1
ROE (%) 4.8 13.9 14.9 15.0
Earnings revisions
Previous net profit - 12,500 14,800 16,600
(Chg from previous, %) - na na na
Previous EPS (¥) - 98.9 117.1 131.3
(Chg from previous, %) - na na na
Source: Company, Nomura estimates
Share price relative to MSCI Japan
1m 3m 6m
2.6 16.0 20.4
0.9 16.5 31.3
(1.1) 8.9 17.4
Source: Company, Nomura estimates
Absolute (¥)
Absolute (US$)
Relat ive to Index
Market cap (U S$mn) 2,430
52-week range (¥) 1,641/998
9301,0301,1301,2301,3301,4301,5301,6301,730
De
c09
Jan
10
Feb
10
Ma
r10
Ap
r10
Ma
y10
Jun
10
Jul1
0
Au
g10
Se
p10
Oct
10
Nov
10
90100110120130140150160170
Price
R el MSCI Japan (¥)
Closing price on 10 Dec ¥1,596
Price target
Upside/downside 17.2%Difference from consensus 8.3%
12/3F net profit (¥mn) 14,800
Difference from consensus 4.6%
Source: Nomura
¥1,870
Nomura vs consensus We are more optimistic on the company’s hydraulics sales used for construction machinery.
Maintained
BUY
N O M U R A S E C U R I T I E S C O L T D
Action The company is highly competitive in hydraulic equipment used in construction
machinery, railroad vehicle equipment and precision equipment. We expect the company to achieve record-high profits in 12/3, concentrated mainly in these segments. We regard Nabtesco as a key construction machinery company. BUY.
Catalysts Establishment of a Chinese joint venture in the railroad vehicle equipment business
and winning of a new overseas order.
Anchor themes
With demand for construction machinery strong, we focus on hydraulic equipment for construction machinery, in which Japanese companies have a strong presence.
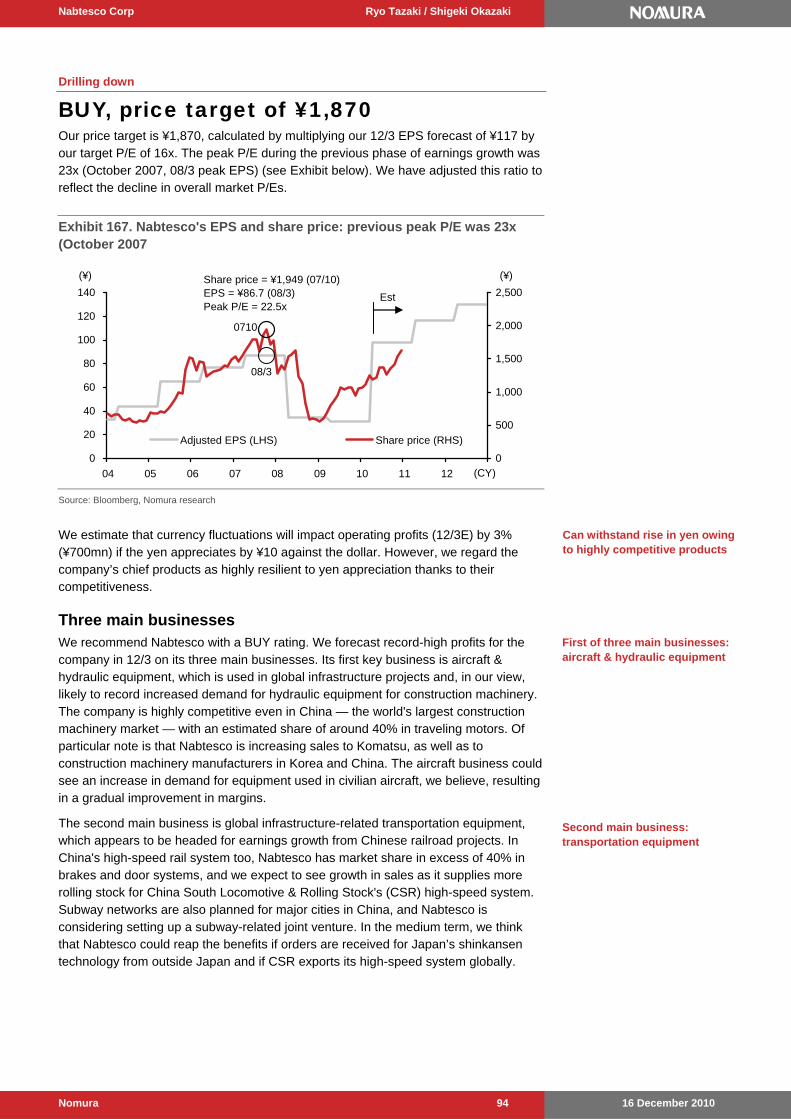
Nabtesco Corp Ryo Tazaki / Shigeki Okazaki
16 December 2010 Nomura 94
Drilling down
BUY, price target of ¥1,870 Our price target is ¥1,870, calculated by multiplying our 12/3 EPS forecast of ¥117 by our target P/E of 16x. The peak P/E during the previous phase of earnings growth was 23x (October 2007, 08/3 peak EPS) (see Exhibit below). We have adjusted this ratio to reflect the decline in overall market P/Es.
Exhibit 167. Nabtesco's EPS and share price: previous peak P/E was 23x (October 2007
0
20
40
60
80
100
120
140
04 05 06 07 08 09 10 11 12
0
500
1,000
1,500
2,000
2,500
Adjusted EPS (LHS) Share price (RHS)
Share price = ¥1,949 (07/10)EPS = ¥86.7 (08/3)Peak P/E = 22.5x
(¥)
08/3
E t
(CY)
(¥)
Est
0710
Source: Bloomberg, Nomura research
We estimate that currency fluctuations will impact operating profits (12/3E) by 3% (¥700mn) if the yen appreciates by ¥10 against the dollar. However, we regard the company’s chief products as highly resilient to yen appreciation thanks to their competitiveness.
Three main businesses We recommend Nabtesco with a BUY rating. We forecast record-high profits for the company in 12/3 on its three main businesses. Its first key business is aircraft & hydraulic equipment, which is used in global infrastructure projects and, in our view, likely to record increased demand for hydraulic equipment for construction machinery. The company is highly competitive even in China — the world's largest construction machinery market — with an estimated share of around 40% in traveling motors. Of particular note is that Nabtesco is increasing sales to Komatsu, as well as to construction machinery manufacturers in Korea and China. The aircraft business could see an increase in demand for equipment used in civilian aircraft, we believe, resulting in a gradual improvement in margins.
The second main business is global infrastructure-related transportation equipment, which appears to be headed for earnings growth from Chinese railroad projects. In China's high-speed rail system too, Nabtesco has market share in excess of 40% in brakes and door systems, and we expect to see growth in sales as it supplies more rolling stock for China South Locomotive & Rolling Stock's (CSR) high-speed system. Subway networks are also planned for major cities in China, and Nabtesco is considering setting up a subway-related joint venture. In the medium term, we think that Nabtesco could reap the benefits if orders are received for Japan’s shinkansen technology from outside Japan and if CSR exports its high-speed system globally.
First of three main businesses: aircraft & hydraulic equipment
Second main business: transportation equipment
Can withstand rise in yen owing to highly competitive products
Nabtesco Corp Ryo Tazaki / Shigeki Okazaki
16 December 2010 Nomura 95
The third main business is precision equipment, where Nabtesco has an estimated global share of 60% in reduction gears for robot applications. Nabtesco is increasing its sales to Japanese robot manufacturers, particularly Fanuc, as well as German manufacturers KUKA and ABB. Nabtesco appears to be receiving a boost from investment in automation by manufacturers in response to mushrooming Chinese labour costs, as well as from investment in increased global production by European and US automakers.
Hydraulic equipment: Cash cow for the company Nabtesco's hydraulic equipment operation is the mainstay of its business: it accounted for around 65% of the aircraft & hydraulic equipment business’ sales in 10/3 and we expect it to account for over 70% in 11/3F. By our estimate, the business will generate 26% of the company's total sales and just over 20% of its operating profits in 11/3F.
In the hydraulic equipment segment, Nabtesco is involved in travelling motors for construction machinery and control valves. The company offers an extensive line-up of travelling motors for use in products ranging from 3 tonne mini excavators to 250 tonne crawler cranes. Travelling units, which house reduction gears, brakes and valves in a single integrated system, have been well received by many users for their compactness and reliability as a main suspension component. Meanwhile, Nabtesco is looking to maintain its technological edge by 1) securing patents; 2) establishing a five-year lead on rivals in new product development; and 3) maintaining a black box production system for manufacturing processes by keeping production of machine tools in house, for example.
Nabtesco has a domestic market share of around 40% in travelling motors for power excavators and a similar share of around 40% in China as well, as it supplies not only Japanese, but also Chinese and Korean construction machinery manufacturers. Besides Japanese manufacturers such as Komatsu and Kobelco Construction Machinery, its major customers include companies such as Sany Heavy Industry and Doosan Infracore. The company also has a large market share in China as a result of increasing sales to overseas construction machinery manufacturers.
The business has production bases in China and Thailand. Its Chinese unit, Shanghai Nabtesco Hydraulic, is a major base, generating around half of the hydraulic equipment business' sales. Nabtesco is increasing production capacity in both China and Thailand, and has set its sights on achieving a y-y increase of over 20% in 12/3.
We expect operating profits to reach 2.8x the 10/3 level in 11/3 and grow another 30% in 12/3 at the aircraft & hydraulic equipment segment on rising demand for construction machinery, particularly in emerging economies. Nabtesco regards hydraulic equipment, railroad vehicle equipment and precision equipment as its medium-term growth drivers. In the hydraulic equipment business, it intends to expand its overseas production base to meet growth in construction machinery demand resulting from infrastructure investment in emerging economies.
Risks to our investment view Risks to our investment view include any fluctuations in capital goods spending in aviation hydraulic equipment, precision instruments, etc, as well as any adverse fluctuation in exchange rates, changes in material prices, profit margin and quality issues.
Third main business: Precision equipment
Hydraulic equipment generates over 20% of operating profits
Broad product line-up in travelling motors
Large market share in travelling motors
Expanding overseas bases
Hydraulic equipment is one of Nabtesco's growth businesses
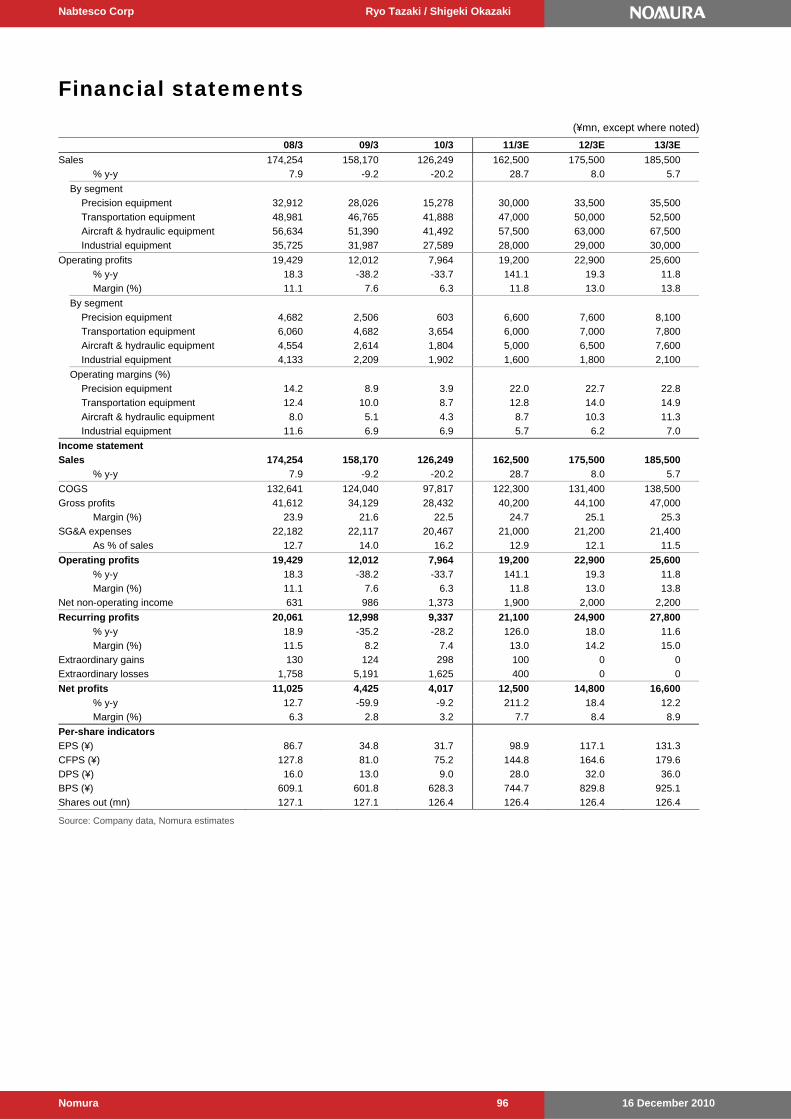
Nabtesco Corp Ryo Tazaki / Shigeki Okazaki
16 December 2010 Nomura 96
Financial statements
(¥mn, except where noted)
08/3 09/3 10/3 11/3E 12/3E 13/3E
Sales 174,254 158,170 126,249 162,500 175,500 185,500
% y-y 7.9 -9.2 -20.2 28.7 8.0 5.7
By segment
Precision equipment 32,912 28,026 15,278 30,000 33,500 35,500
Transportation equipment 48,981 46,765 41,888 47,000 50,000 52,500
Aircraft & hydraulic equipment 56,634 51,390 41,492 57,500 63,000 67,500
Industrial equipment 35,725 31,987 27,589 28,000 29,000 30,000
Operating profits 19,429 12,012 7,964 19,200 22,900 25,600
% y-y 18.3 -38.2 -33.7 141.1 19.3 11.8
Margin (%) 11.1 7.6 6.3 11.8 13.0 13.8
By segment
Precision equipment 4,682 2,506 603 6,600 7,600 8,100
Transportation equipment 6,060 4,682 3,654 6,000 7,000 7,800
Aircraft & hydraulic equipment 4,554 2,614 1,804 5,000 6,500 7,600
Industrial equipment 4,133 2,209 1,902 1,600 1,800 2,100
Operating margins (%)
Precision equipment 14.2 8.9 3.9 22.0 22.7 22.8
Transportation equipment 12.4 10.0 8.7 12.8 14.0 14.9
Aircraft & hydraulic equipment 8.0 5.1 4.3 8.7 10.3 11.3
Industrial equipment 11.6 6.9 6.9 5.7 6.2 7.0
Income statement
Sales 174,254 158,170 126,249 162,500 175,500 185,500
% y-y 7.9 -9.2 -20.2 28.7 8.0 5.7
COGS 132,641 124,040 97,817 122,300 131,400 138,500
Gross profits 41,612 34,129 28,432 40,200 44,100 47,000
Margin (%) 23.9 21.6 22.5 24.7 25.1 25.3
SG&A expenses 22,182 22,117 20,467 21,000 21,200 21,400
As % of sales 12.7 14.0 16.2 12.9 12.1 11.5
Operating profits 19,429 12,012 7,964 19,200 22,900 25,600
% y-y 18.3 -38.2 -33.7 141.1 19.3 11.8
Margin (%) 11.1 7.6 6.3 11.8 13.0 13.8
Net non-operating income 631 986 1,373 1,900 2,000 2,200
Recurring profits 20,061 12,998 9,337 21,100 24,900 27,800
% y-y 18.9 -35.2 -28.2 126.0 18.0 11.6
Margin (%) 11.5 8.2 7.4 13.0 14.2 15.0
Extraordinary gains 130 124 298 100 0 0
Extraordinary losses 1,758 5,191 1,625 400 0 0
Net profits 11,025 4,425 4,017 12,500 14,800 16,600
% y-y 12.7 -59.9 -9.2 211.2 18.4 12.2
Margin (%) 6.3 2.8 3.2 7.7 8.4 8.9
Per-share indicators
EPS (¥) 86.7 34.8 31.7 98.9 117.1 131.3
CFPS (¥) 127.8 81.0 75.2 144.8 164.6 179.6
DPS (¥) 16.0 13.0 9.0 28.0 32.0 36.0
BPS (¥) 609.1 601.8 628.3 744.7 829.8 925.1
Shares out (mn) 127.1 127.1 126.4 126.4 126.4 126.4
Source: Company data, Nomura estimates

Nabtesco Corp Ryo Tazaki / Shigeki Okazaki
16 December 2010 Nomura 97
(¥mn, except where noted)
08/3 09/3 10/3 11/3E 12/3E 13/3E
Balance sheet
Current assets 99,237 84,306 89,893 102,993 108,265 118,351
Cash & deposits 11,131 9,422 11,040 9,857 9,838 15,855
Accounts receivable 46,641 35,159 36,117 46,488 50,207 53,067
Marketable securities 19,000 18,000 24,499 24,000 24,000 24,000
Inventory assets 18,421 16,492 15,265 19,648 21,220 22,429
Other 4,044 5,233 2,972 3,000 3,000 3,000
Long-term assets 64,079 60,379 59,587 60,602 61,602 62,502
Property, plant & equipment 43,346 45,206 44,102 45,102 46,102 47,002
Investments, other 19,350 13,724 14,292 14,000 14,000 14,000
Intangible long-term assets 1,383 1,449 1,193 1,500 1,500 1,500
Total assets 163,317 144,685 149,480 163,595 169,867 180,853
Current liabilities 58,182 41,209 43,610 48,467 48,984 47,920
Accounts payable 31,462 22,329 24,447 31,467 33,984 35,920
Short-term interest-bearing debt 12,114 8,160 8,920 7,000 5,000 2,000
Other 14,606 10,720 10,243 10,000 10,000 10,000
Long-term liabilities 22,642 21,759 20,702 21,000 16,000 16,000
Long-term interest-bearing debt 11,000 11,000 11,000 11,000 6,000 6,000
Other 11,642 10,759 9,702 10,000 10,000 10,000
Net assets 82,492 81,716 85,167 94,128 104,883 116,933
Total liabilities & shareholders' equity 163,317 144,685 149,480 163,595 169,867 180,853
ROA (%) 11.9 7.8 5.4 12.3 13.7 14.6
ROE (%) 13.8 5.4 4.8 13.9 14.9 15.0
Total capital turnover ratio (x/year) 1.1 1.1 0.8 1.0 1.0 1.0
Net D/E ratio (x) -0.1 -0.1 -0.2 -0.2 -0.2 -0.3
Owners' equity ratio (%) 50.5 56.5 57.0 57.5 61.7 64.7
Cash flow
Net profits 11,025 4,425 4,017 12,500 14,800 16,600
Depreciation 5,215 5,867 5,485 5,800 6,000 6,100
Change in working capital 2,284 4,278 2,387 -7,734 -2,774 -2,133
Operating cash flow 18,524 14,570 11,889 10,566 18,026 20,567
Capex 5,601 9,184 4,809 6,800 7,000 7,000
Free cash flow 12,923 5,386 7,080 3,766 11,026 13,567
Source: Company data, Nomura estimates
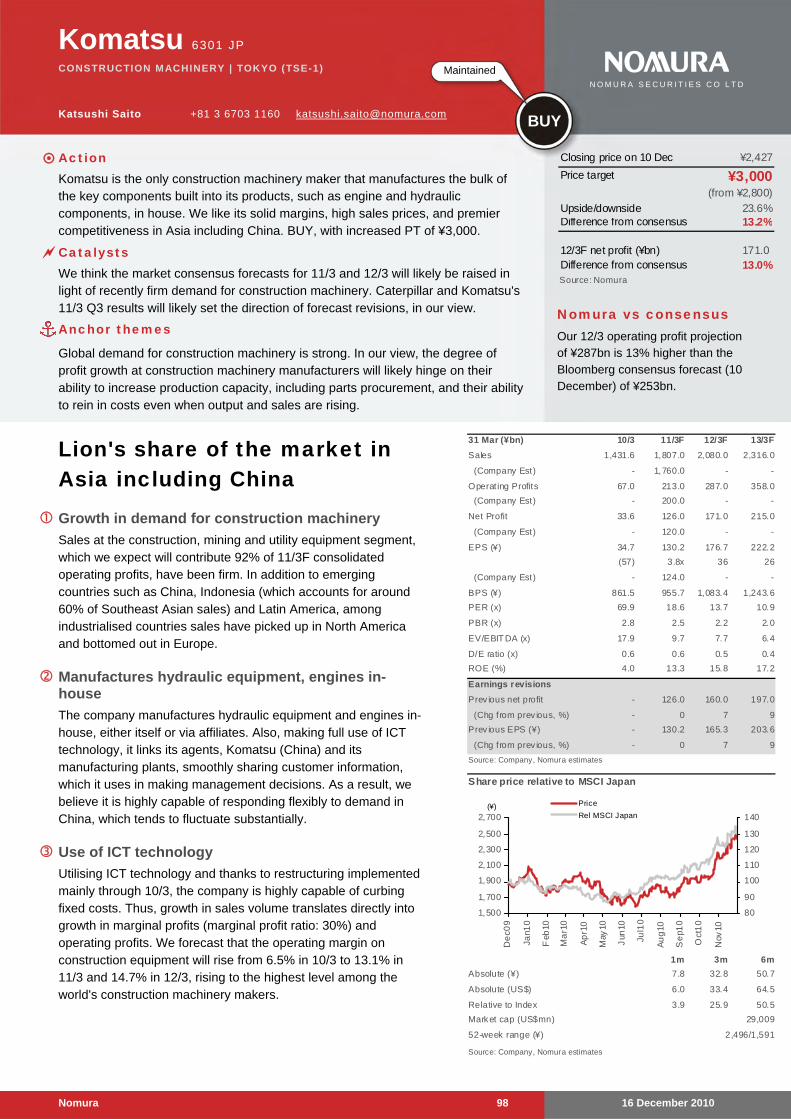
16 December 2010 Nomura 98
Komatsu 6301 JP
CONSTRUCTION MACHINERY | TOKYO (TSE-1)
Katsushi Saito +81 3 6703 1160 [email protected]
Lion's share of the market in Asia including China
Growth in demand for construction machinery
Sales at the construction, mining and utility equipment segment, which we expect will contribute 92% of 11/3F consolidated operating profits, have been firm. In addition to emerging countries such as China, Indonesia (which accounts for around 60% of Southeast Asian sales) and Latin America, among industrialised countries sales have picked up in North America and bottomed out in Europe.
Manufactures hydraulic equipment, engines in-house
The company manufactures hydraulic equipment and engines in-house, either itself or via affiliates. Also, making full use of ICT technology, it links its agents, Komatsu (China) and its manufacturing plants, smoothly sharing customer information, which it uses in making management decisions. As a result, we believe it is highly capable of responding flexibly to demand in China, which tends to fluctuate substantially.
Use of ICT technology
Utilising ICT technology and thanks to restructuring implemented mainly through 10/3, the company is highly capable of curbing fixed costs. Thus, growth in sales volume translates directly into growth in marginal profits (marginal profit ratio: 30%) and operating profits. We forecast that the operating margin on construction equipment will rise from 6.5% in 10/3 to 13.1% in 11/3 and 14.7% in 12/3, rising to the highest level among the world's construction machinery makers.
31 Mar (¥bn) 10/3 11/3F 12/3F 13/3F
Sales 1,431.6 1,807.0 2,080.0 2,316.0
(Company Est) - 1,760.0 - -
Operat ing Profits 67.0 213.0 287.0 358.0
(Company Est) - 200.0 - -
Net Profit 33.6 126.0 171.0 215.0
(Company Est) - 120.0 - -
EPS (¥) 34.7 130.2 176.7 222.2
(57) 3.8x 36 26
(Company Est) - 124.0 - -
BPS (¥) 861.5 955.7 1,083.4 1,243.6
PER (x) 69.9 18.6 13.7 10.9
PBR (x) 2.8 2.5 2.2 2.0
EV/EBIT DA (x) 17.9 9.7 7.7 6.4
D/E ratio (x) 0.6 0.6 0.5 0.4
ROE (%) 4.0 13.3 15.8 17.2
Earnings revisions
Prev ious net profit - 126.0 160.0 197.0
(Chg from prev ious, %) - 0 7 9
Prev ious EPS (¥) - 130.2 165.3 203.6
(Chg from prev ious, %) - 0 7 9
Source: Company, Nomura estimates
Share price relative to MSCI Japan
1m 3m 6m
7.8 32.8 50.7
6.0 33.4 64.5
3.9 25.9 50.5
Source: Company, Nomura estimates
29,009
52-week range (¥) 2,496/1,591
Relative to Index
Market cap (US$mn)
Absolute (¥)
Absolute (US$)
1,500
1,700
1,900
2,100
2,300
2,500
2,700
De
c09
Jan1
0
Feb
10
Ma
r10
Ap
r10
May
10
Jun
10
Jul1
0
Au
g10
Se
p10
Oct
10
Nov
10
80
90
100
110
120
130
140
Price
Rel MSCI Japan(¥)
Closing price on 10 Dec ¥2,427
Price target ¥3,000(from ¥2,800)
Upside/downside 23.6%Difference from consensus 13.2%
12/3F net profit (¥bn) 171.0 Difference from consensus 13.0%Source: Nomura
Nomura vs consensus Our 12/3 operating profit projection of ¥287bn is 13% higher than the Bloomberg consensus forecast (10 December) of ¥253bn.
Maintained
BUY
N O M U R A S E C U R I T I E S C O L T D
Action Komatsu is the only construction machinery maker that manufactures the bulk of
the key components built into its products, such as engine and hydraulic components, in house. We like its solid margins, high sales prices, and premier competitiveness in Asia including China. BUY, with increased PT of ¥3,000.
Catalysts We think the market consensus forecasts for 11/3 and 12/3 will likely be raised in
light of recently firm demand for construction machinery. Caterpillar and Komatsu's 11/3 Q3 results will likely set the direction of forecast revisions, in our view.
Anchor themes
Global demand for construction machinery is strong. In our view, the degree of profit growth at construction machinery manufacturers will likely hinge on their ability to increase production capacity, including parts procurement, and their ability to rein in costs even when output and sales are rising.
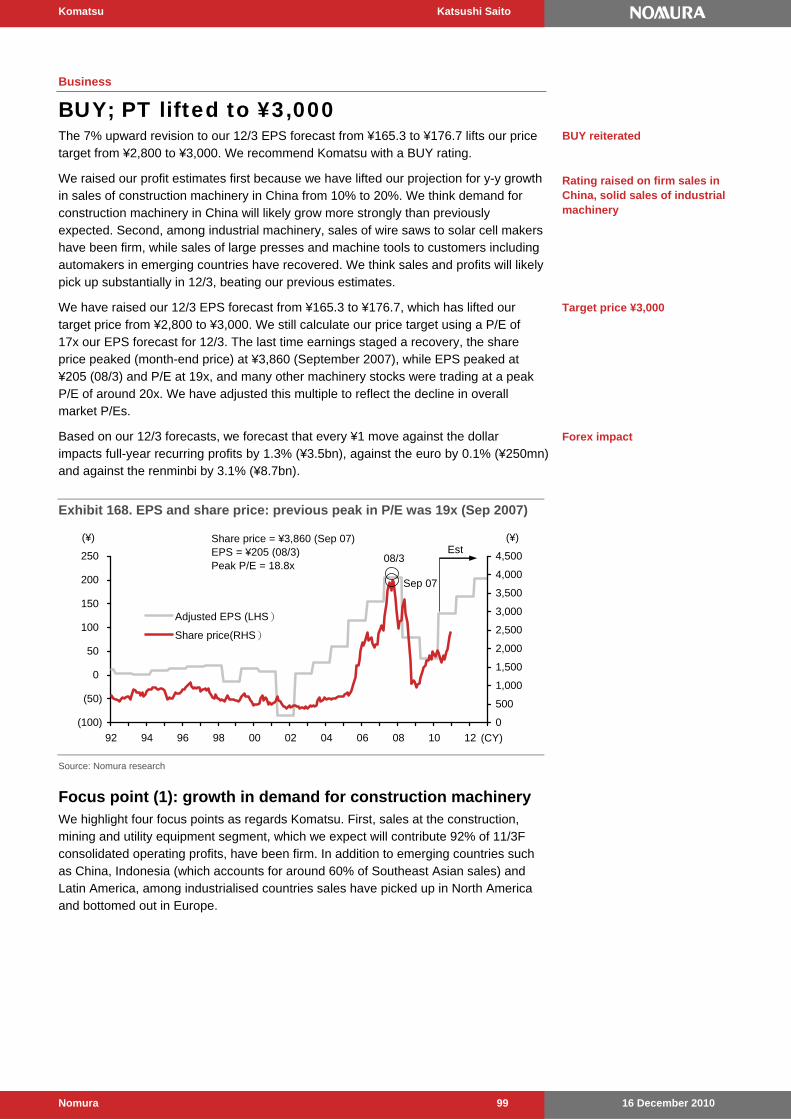
Komatsu Katsushi Saito
16 December 2010 Nomura 99
Business
BUY; PT lifted to ¥3,000 The 7% upward revision to our 12/3 EPS forecast from ¥165.3 to ¥176.7 lifts our price target from ¥2,800 to ¥3,000. We recommend Komatsu with a BUY rating.
We raised our profit estimates first because we have lifted our projection for y-y growth in sales of construction machinery in China from 10% to 20%. We think demand for construction machinery in China will likely grow more strongly than previously expected. Second, among industrial machinery, sales of wire saws to solar cell makers have been firm, while sales of large presses and machine tools to customers including automakers in emerging countries have recovered. We think sales and profits will likely pick up substantially in 12/3, beating our previous estimates.
We have raised our 12/3 EPS forecast from ¥165.3 to ¥176.7, which has lifted our target price from ¥2,800 to ¥3,000. We still calculate our price target using a P/E of 17x our EPS forecast for 12/3. The last time earnings staged a recovery, the share price peaked (month-end price) at ¥3,860 (September 2007), while EPS peaked at ¥205 (08/3) and P/E at 19x, and many other machinery stocks were trading at a peak P/E of around 20x. We have adjusted this multiple to reflect the decline in overall market P/Es.
Based on our 12/3 forecasts, we forecast that every ¥1 move against the dollar impacts full-year recurring profits by 1.3% (¥3.5bn), against the euro by 0.1% (¥250mn) and against the renminbi by 3.1% (¥8.7bn).
Exhibit 168. EPS and share price: previous peak in P/E was 19x (Sep 2007)
(100)
(50)
0
50
100
150
200
250
92 94 96 98 00 02 04 06 08 10 12
0
500
1,000
1,500
2,000
2,500
3,000
3,500
4,000
4,500
Adjusted EPS (LHS)
Share price(RHS)
(¥)
(CY)
Share price = ¥3,860 (Sep 07)EPS = ¥205 (08/3)Peak P/E = 18.8x
08/3
Sep 07
Est(¥)
Source: Nomura research
Focus point (1): growth in demand for construction machinery We highlight four focus points as regards Komatsu. First, sales at the construction, mining and utility equipment segment, which we expect will contribute 92% of 11/3F consolidated operating profits, have been firm. In addition to emerging countries such as China, Indonesia (which accounts for around 60% of Southeast Asian sales) and Latin America, among industrialised countries sales have picked up in North America and bottomed out in Europe.
BUY reiterated
Rating raised on firm sales in China, solid sales of industrial machinery
Target price ¥3,000
Forex impact

Komatsu Katsushi Saito
16 December 2010 Nomura 100
Focus point (2): manufactures hydraulic equipment, engines in house Second, the company manufactures hydraulic equipment and engines in-house, either itself or via affiliates. Also, making full use of ICT technology, it links its agents, Komatsu (China) and its manufacturing plants, smoothly sharing customer information, which it uses in making management decisions. As a result, it is highly capable of responding flexibly to demand in China, which tends to fluctuate substantially.
Focus point (3): use of ICT technology Third, utilising ICT technology and thanks to restructuring implemented mainly through 10/3, the company is highly capable of curbing fixed costs. Thus, growth in sales volume translates directly into growth in marginal profits (marginal profit ratio: 30%) and operating profits. We forecast that the operating margin on construction equipment will rise from 6.5% in 10/3 to 13.1% in 11/3, and 14.7% in 12/3, rising to the highest level among the world's construction machinery makers.
Focus point (4): rapid recovery in industrial machinery business Fourth, we think industrial machinery business (accounting for around 8% of operating profits) will also pick up sharply. Demand for wire saws, which cut silicon for solar cells, has picked up sharply at subsidiary Komatsu NTC (formerly Nippei Toyama). Also, orders from emerging countries for large presses for automobile production have recovered, and we think sales will start to rise from 12/3 H2, one year ahead. We look for operating profits at the industrial machinery segment to rise from ¥3.0bn in 10/3 (operating margin of 1.8%) to ¥18.0bn in 11/3 (8.2%) and ¥33.4bn in 12/3 (11.7%).
For 11/3, we expect emerging countries to account for 68% of sales at Komatsu's construction equipment segment, with industrialised countries accounting for 32%. Thus, while we think emerging countries will account for a large proportion of sales, we expect sales to be well distributed worldwide. We expect China to account for the largest proportion among emerging countries at 20%, followed by Asia (17%, of which Indonesia should account for 60%), Latin America (13%, with Chile followed by Brazil accounting for large proportions), Oceania (8%, mining equipment accounting for a large proportion), Africa (4%), Russia and the rest of the CIS (3%) and the Middle East (3%). We think China will account for a large proportion of sales, but a special feature of Komatsu's business is that sales are also distributed among other emerging countries.
However, demand in emerging countries other than China is also impacted to a large extent by the following chain of events: growth in demand in China drives up resource prices, resulting in firm demand in other emerging countries due to growth in sales of mining machinery and economic growth. Economic trends in China are keys as they are the epicenter.
Among industrialised countries, Japan accounts for 15% of sales, North America for 11% and Europe for 6%. In all these areas, demand for construction machinery has started to recover from major declines. In volume terms, y-y demand for the seven main types of construction machinery rose 36% in Jul–Sep 2010 and 50% in October in Japan; rose 32% and 15% in North America (preliminary estimates); and rose 27% and 22% in Europe (preliminary estimates).
Emerging countries account for 68% of construction machinery sales
Emerging countries indirectly impacted by China
Industrialised countries account for 32% of sales
Komatsu Katsushi Saito
16 December 2010 Nomura 101
Organisation in China The structure of Komatsu's construction, mining and utility equipment business in China is as follows. Komatsu (China), located in Shanghai and wholly owned by Komatsu, is the head office. Komatsu Shantui Construction Machinery (located in Shandong, 60% owned by Komatsu) is the production company, which manufactures hydraulic shovels and other types of construction equipment. Komatsu (Changzhou) Construction Machinery (Jiangsu, 85%) makes hydraulic shovels, wheel loaders and dump trucks. Komatsu Utility (China) Machine (Shandong) makes small hydraulic shovels, mini-excavators (less than 6t) and forklifts.
In components, Komatsu also has numerous production companies that manufacture items such as foundry products, endless track and hydraulic cylinders. In October 2010, Komatsu (China) hived off its mining business division and established Komatsu China Mining, which is engaged in mining equipment sales and services.
The company has 32 agents in China, based on its policy of establishing one agent per province. At one time the company had several agents in individual provinces, but it has since rationalised. As a rule, agents are set up by local Chinese investors.
Komatsu has been the leader in the Chinese market for hydraulic shovels weighing more than 6t since 2006. From 2002 to 2004, Hyundai Heavy Industry was in first place, then in 2005, Hitachi Construction Machinery took the lead.
We estimate that Komatsu's products are priced broadly on a par with those of Caterpillar, slightly higher than sales prices at Hitachi Construction Machinery and Kobelco Construction Machinery (the construction equipment maker in the Kobe Steel group), around 20% higher than prices at Sany and around 25-30% higher than prices at Doosan and Hyundai.
Strengths of Chinese business (1): in-house production of core components The special features and strengths of Komatsu's business in China are, first, that it manufactures core components of construction machinery such as hydraulic equipment and engines in-house (including at affiliates). As regards hydraulic equipment, the company mainly procures valves from its own production plants in Japan, motors from Nabtesco's Chinese subsidiary (in which Komatsu has a 15% stake) and its own plants in Japan, pumps from its plants in Japan, and cylinders from its own plants in China. It manufactures valves from material castings made by subsidiary Komatsu Castex, which also sells foundry products to companies such as Kawasaki Heavy Industries.
For other construction machinery makers, we believe skill in terms of procuring components is now key to steadily expanding production. With heavy sales volumes after the Lunar New Year holidays, flexible production planning is necessary. As Komatsu manufactures core components in-house, we think it can respond flexibly to changes in demand.
Also many cylinder and other component manufacturing companies
Has 32 agents, based on one-agent-per-province policy
Leader in hydraulic shovels bigger than 6t since 2006
Sales prices 20% higher than Sany, 20–30% higher than Korean makers
Able to respond flexibly to demand swings
Komatsu Katsushi Saito
16 December 2010 Nomura 102
Strengths of Chinese business (2): use of ICT, typified by Komtrax Another special feature/strength of the company's Chinese business is its use of ICT (information and communications technology). The company uses ICT systems to link its agents, Komatsu (China) and its plants and to smoothly obtain data about customers and the state of its machinery where it is being used, and utilises this data in management decision making. Komtrax, a machinery operation management system that the company started fitting to its equipment as standard in February 2004, is one such system. Rivals have similar systems, but we think Komatsu makes the fullest use of them. Capacity utilisation data obtained via Komtrax is obtained by machine type and by region in real time and is supplied to senior management in Japan. Capacity utilisation trends are key in relation to parts orders, and appear to help forecast demand two to three months ahead.
Komics, an ICT system the company introduced in January 2007, allows sales staff at agents to input client data such as by-type inquiries, via a mobile phone, which is sent to agents, Komatsu (China) and the company's production plants. Based on data obtained via Komtrax, Komics and other ICT systems, management revises sales and production plans at meetings held twice a month.
Sales volumes in China are heavy after the Lunar New Year holidays. Key to success, therefore, is accurate demand forecasting and optimum production levels. Parts from Japan have to be ordered around 10 weeks ahead of the sale of completed equipment in China. Thus, forecasting demand 10 weeks ahead as accurately as possible is vital, and we think that forecasting accuracy has been increasing thanks to the use of ICT systems.
Strengths of Chinese business (3): input of management resources in China A third special feature/strength of the company's Chinese business is its inputting of human resources at the managerial level in China. Senior executive officer and deputy representative of all China operations Nobukazu Kotake was previously chief of the development division and is now responsible for development, product planning and quality assurance in China. Senior executive officer and deputy representative of all China operations Tetsuro Kajiya was previously head of the purchasing division and is now responsible for production and procurement. Mr Kotake and Mr Kajiya have been stationed in China since April 2010.
The input of such human resources should ensure that the company makes progress in switching to local procurement. Komatsu (China) has set up an SVC (standard variable cost) improvement project office, and is striving to boost local procurement and reduce manufacturing costs in China. The local procurement rate was around 50% previously, and we estimate that it has risen to 50–60% on mass produced hydraulic shovels in the 20t class. Components procured in Japan include engines, hydraulic valves, pumps and some motors.
Senior executive officer and representative of all China operations Taizo Kayata has considerable experience doing business in China. Strategy meetings at Komatsu (China) are run by Mr Kayata, Mr Kotake, Mr Kajiya and Mr Wang. Decisions are made swiftly in coordination with Japan, in our opinion. This reflects the company's way of thinking with regard to localisation.
Sales staff at agents enter client data via Komics system
Accurately forecasting demand 10 weeks ahead is vital
Progress in switching to local procurement
Localisation
Komatsu Katsushi Saito
16 December 2010 Nomura 103
Strengths of Chinese business (4): expanding sales of components A fourth special feature/strength of the company's Chinese business is that as part of its value chain strategy, it is striving to boost sales of parts and services after the sale of new machinery. In industrialised countries, customers bear costs broadly on a par with the purchase cost of new equipment over around 10 years of use, comprising regular inspections, maintenance and parts replacement. In the case of mining equipment, the costs are double the purchase cost, as key components have to be overhauled. Margins on parts are high. If Komatsu could garner costs paid by its customers as sales, its profits as a construction machinery maker would be kept in a stable fashion, we believe.
Komatsu has been putting effort into expanding parts sales in China, too. For example, it has offered extended warranties to customers that use its oil filters. As a result, we estimate its share of filter sales for its hydraulic shovels to have risen from 10% to 70%. Previously, many customers used cheaper third-party filters rather than Komatsu products. We think it will likely adopt the same technique in other areas.
The company has also been evolving Komtrax, aiming to bring Komtrax Parts, which will enable remote monitoring of parts usage status, replacement history and other data via IC tags attached to consumable components, on stream in 2011. It appears that the company plans to fit this as standard to 20t class hydraulic shovels in China, too.
Annual utilisation of hydraulic shovels is comparatively long in China at around 2,000hrs, versus 1,200–1,500hrs in Europe and the US, and 800hrs in Japan. Consumable components are changed often, presumably making it easy to leverage new systems.
Komatsu plans to open a techno center in Changzhou, Jiangsu Province in January 2011. It plans to use the center as a demonstration and testing center, as a location for downstream value chain business such as recycling of old machinery and auctions of used equipment, and for training of staff and executives. It will be the company's third such center after one in Japan and one in the US, and we think demonstrates the company's commitment to China.
Risks to our investment view Risks to our investment view include worse-than-expected economic conditions in the region, including China. A sharp fall in commodity prices may also result in a decline in sales of equipment used for mining, which accounts for a large portion of the company’s sales.
Rise in filter share from 10% to 70%
Advent of Komtrax Parts
Annual utilisation 2,000hrs in China, versus 800hrs in Japan, 1,200–1,500hrs in Europe and US
Expanding into environmental business such as used equipment sales and recycling
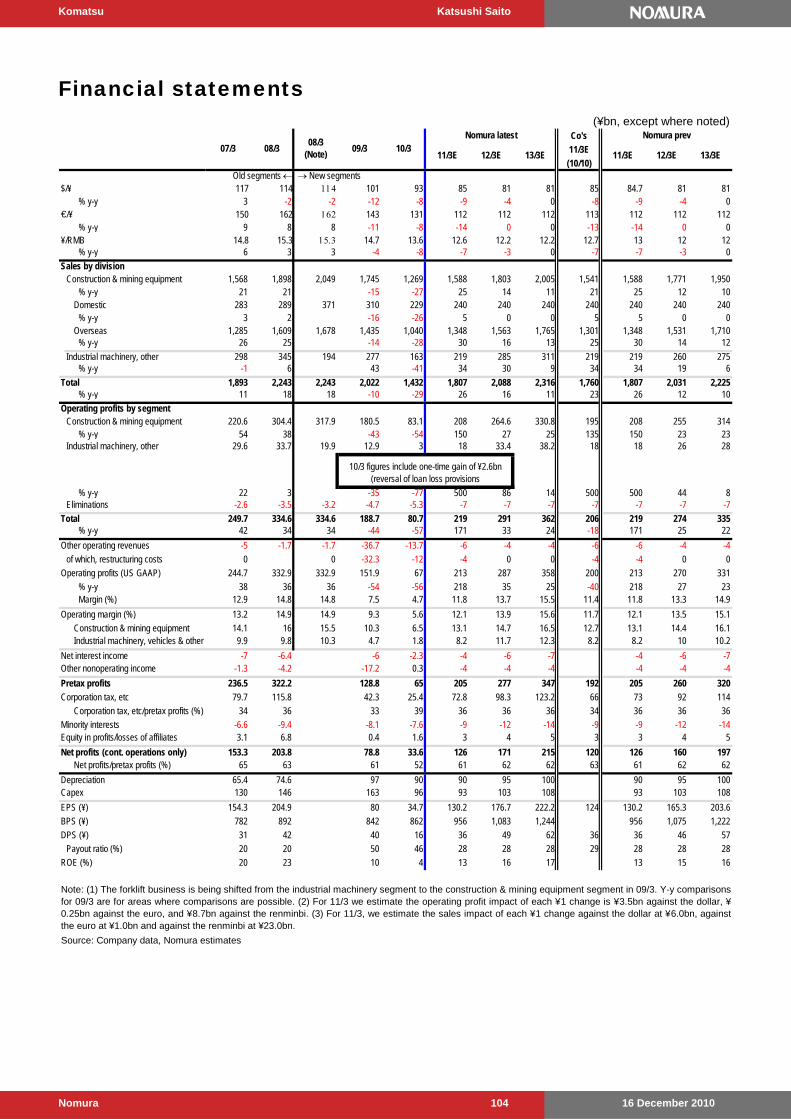
Komatsu Katsushi Saito
16 December 2010 Nomura 104
Financial statements
(¥bn, except where noted)Co's
11/3E
(10/10)
117 114 101 93 85 81 81 85 84.7 81 81% y-y 3 -2 -2 -12 -8 -9 -4 0 -8 -9 -4 0
150 162 143 131 112 112 112 113 112 112 112% y-y 9 8 8 -11 -8 -14 0 0 -13 -14 0 0
14.8 15.3 14.7 13.6 12.6 12.2 12.2 12.7 13 12 12% y-y 6 3 3 -4 -8 -7 -3 0 -7 -7 -3 0
1,568 1,898 2,049 1,745 1,269 1,588 1,803 2,005 1,541 1,588 1,771 1,950% y-y 21 21 -15 -27 25 14 11 21 25 12 10
283 289 371 310 229 240 240 240 240 240 240 240% y-y 3 2 -16 -26 5 0 0 5 5 0 0
1,285 1,609 1,678 1,435 1,040 1,348 1,563 1,765 1,301 1,348 1,531 1,710% y-y 26 25 -14 -28 30 16 13 25 30 14 12
298 345 194 277 163 219 285 311 219 219 260 275% y-y -1 6 43 -41 34 30 9 34 34 19 6
1,893 2,243 2,243 2,022 1,432 1,807 2,088 2,316 1,760 1,807 2,031 2,225% y-y 11 18 18 -10 -29 26 16 11 23 26 12 10
220.6 304.4 317.9 180.5 83.1 208 264.6 330.8 195 208 255 314% y-y 54 38 -43 -54 150 27 25 135 150 23 23
29.6 33.7 19.9 12.9 3 18 33.4 38.2 18 18 26 28
% y-y 22 3 -35 -77 500 86 14 500 500 44 8-2.6 -3.5 -3.2 -4.7 -5.3 -7 -7 -7 -7 -7 -7 -7
249.7 334.6 334.6 188.7 80.7 219 291 362 206 219 274 335% y-y 42 34 34 -44 -57 171 33 24 -18 171 25 22
-5 -1.7 -1.7 -36.7 -13.7 -6 -4 -4 -6 -6 -4 -4
0 0 -32.3 -12 -4 0 0 -4 -4 0 0
244.7 332.9 332.9 151.9 67 213 287 358 200 213 270 331
% y-y 38 36 36 -54 -56 218 35 25 -40 218 27 23Margin (%) 12.9 14.8 14.8 7.5 4.7 11.8 13.7 15.5 11.4 11.8 13.3 14.9
13.2 14.9 14.9 9.3 5.6 12.1 13.9 15.6 11.7 12.1 13.5 15.1
14.1 16 15.5 10.3 6.5 13.1 14.7 16.5 12.7 13.1 14.4 16.19.9 9.8 10.3 4.7 1.8 8.2 11.7 12.3 8.2 8.2 10 10.2
-7 -6.4 -6 -2.3 -4 -6 -7 -4 -6 -7-1.3 -4.2 -17.2 0.3 -4 -4 -4 -4 -4 -4
236.5 322.2 128.8 65 205 277 347 192 205 260 320
79.7 115.8 42.3 25.4 72.8 98.3 123.2 66 73 92 114
34 36 33 39 36 36 36 34 36 36 36
-6.6 -9.4 -8.1 -7.6 -9 -12 -14 -9 -9 -12 -143.1 6.8 0.4 1.6 3 4 5 3 3 4 5
153.3 203.8 78.8 33.6 126 171 215 120 126 160 19765 63 61 52 61 62 62 63 61 62 62
65.4 74.6 97 90 90 95 100 90 95 100130 146 163 96 93 103 108 93 103 108
154.3 204.9 80 34.7 130.2 176.7 222.2 124 130.2 165.3 203.6
782 892 842 862 956 1,083 1,244 956 1,075 1,222
31 42 40 16 36 49 62 36 36 46 57
20 20 50 46 28 28 28 29 28 28 28
20 23 10 4 13 16 17 13 15 16
07/3 08/3 09/3 10/3Nomura latest Nomura prev
11/3E 12/3E 13/3E 11/3E 12/3E 13/3E
Old segments New segments$/¥
€/¥
¥/RMB
Sales by divisionConstruction & mining equipment
Domestic
Overseas
Industrial machinery, other
Total
Operating profits by segmentConstruction & mining equipment
Industrial machinery, other
10/3 figures include one-time gain of ¥2.6bn(reversal of loan loss provisions
Eliminations
Total
Other operating revenues
of which, restructuring costs
Operating profits (US GAAP)
Operating margin (%)
Construction & mining equipmentIndustrial machinery, vehicles & other
Net interest incomeOther nonoperating income
Pretax profits
Corporation tax, etc
Corporation tax, etc/pretax profits (%)
Minority interestsEquity in profits/losses of affiliates
Net profits (cont. operations only)Net profits/pretax profits (%)
Source: Company data, Nomura estimates
08/3(Note)
DPS (¥)
Payout ratio (%)
ROE (%)
Note: (1) The forklift business is being shifted from the industrial machinery segment to the construction & mining equipment segment in 09/3. Y-y comparisonsfor 09/3 are for areas where comparisons are possible. (2) For 11/3 we estimate the operating profit impact of each ¥1 change is ¥3.5bn against the dollar, ¥0.25bn against the euro, and ¥8.7bn against the renminbi. (3) For 11/3, we estimate the sales impact of each ¥1 change against the dollar at ¥6.0bn, againstthe euro at ¥1.0bn and against the renminbi at ¥23.0bn.
DepreciationCapex
EPS (¥)
BPS (¥)

Komatsu Katsushi Saito
16 December 2010 Nomura 105
(¥
bn,
exce
pt w
here
not
ed)
08
/30
8/3
09
/31
0/3
11
/3E
12
/3E
13
/3E
11
/3E
11
/3E
12
/3E
13
/3E
(No
te)
as
%o
f sa
les
Q1
Q2
Q3
Q4
Q1
Q2
H1
H2
H1
H2
EH
2F
ull
11
41
14
10
19
38
58
18
19
79
49
09
19
18
5.7
95
90
88
81
82
85
85
81
81
% y
-y-2
-2-1
2-8
-9-4
0-7
-13
-6-3
-7-8
-10
-5-7
-10
-9-8
-9-4
0
16
21
62
14
31
31
11
21
12
11
21
33
13
41
33
12
51
15
11
11
33
12
91
13
11
21
14
11
31
12
11
21
12
% y
-y8
8-1
1-8
-14
00
-20
-16
53
-13
-17
-18
4-1
5-1
3-1
2-1
3-1
40
0
15
.31
5.3
14
.71
3.6
12
.61
2.2
12
.21
4.2
13
.71
3.1
13
.21
3.4
12
.61
41
3.2
13
12
.21
2.3
12
.71
2.6
12
.21
2.2
% y
-y3
3-4
-8-7
-30
-5-1
3-7
-5-6
-8-9
-5-7
-8-7
-7-7
-30
1,8
98
2,0
49
1,7
45
1,2
69
1,5
88
1,8
03
2,0
05
10
02
85
28
53
17
38
24
05
35
85
70
69
97
64
82
47
77
1,5
41
1,5
88
1,7
71
1,9
50
% y
-y2
1-1
5-2
72
51
41
1-4
7-4
5-1
62
14
22
6-4
61
34
18
11
21
25
12
10
28
93
71
31
02
29
24
02
40
24
01
55
25
56
16
15
46
31
07
12
21
17
12
31
23
24
02
40
24
02
40
% y
-y2
-16
-26
50
0-3
5-3
3-2
8-4
51
5-3
4-1
81
00
05
50
0
1,6
09
1,6
78
1,4
35
1,0
40
1,3
48
1,5
63
1,7
65
85
23
32
30
25
63
21
35
12
95
46
35
77
64
67
02
65
51
,30
11
,34
81
,53
11
,71
0
% y
-y2
5-1
4-2
83
01
61
3-4
9-4
7-1
32
75
12
8-4
86
40
22
13
25
30
14
12
48
15
11
46
23
06
37
04
11
45
62
37
37
07
68
79
89
21
43
16
31
90
18
01
70
36
03
70
41
14
56
% y
-y0
-9-3
42
11
11
1-4
4-4
9-2
6-3
35
31
-47
-15
33
10
41
82
11
11
1
29
73
23
24
81
36
16
71
84
20
61
13
63
23
23
64
14
26
86
88
38
48
21
65
16
71
84
20
6
% y
-y-1
2-2
3-4
52
31
01
2-4
9-5
6-4
3-2
81
53
0-5
2-3
62
32
42
12
22
31
01
2
18
41
88
21
51
71
20
32
27
25
01
33
73
84
55
05
75
07
59
51
07
96
88
19
52
03
22
72
50
% y
-y3
11
4-2
11
91
21
0-3
9-4
3-7
29
53
31
-41
94
21
-81
41
91
21
0
41
44
27
27
31
22
15
51
78
20
21
03
22
73
03
34
03
25
96
37
28
37
81
50
15
51
78
20
2
% y
-y3
3-3
6-5
52
71
51
3-7
0-6
8-3
6-1
23
20
-69
-21
22
32
24
23
27
15
13
33
73
41
18
49
01
00
10
81
18
62
22
12
32
42
72
24
34
74
95
14
69
51
00
10
81
18
% y
-y2
4-4
6-5
11
18
9-7
3-6
2-7
12
25
-68
-31
38
-25
11
89
77
86
89
32
55
70
84
31
06
79
13
10
16
16
23
32
32
55
55
70
84
% y
-y8
83
-64
74
28
20
-63
-80
-68
-92
87
2-7
2-5
04
51
03
10
37
47
42
82
0
31
73
29
31
02
82
39
54
64
52
62
55
46
37
49
19
38
91
17
16
51
82
21
31
93
37
53
95
46
45
26
% y
-y3
8-6
-94
01
71
3-4
3-3
71
38
17
14
1-4
04
35
53
01
73
34
01
71
3
17
51
86
18
81
69
27
03
24
37
31
73
23
64
65
66
36
16
71
02
12
41
46
12
62
50
27
03
24
37
3
% y
-y5
51
-10
60
20
15
-46
-45
25
10
11
00
71
-45
58
84
44
24
48
60
20
15
14
11
43
12
21
13
12
51
40
15
38
23
27
28
35
30
28
50
63
58
67
67
12
51
25
14
01
53
% y
-y2
1-1
4-7
10
12
9-3
8-2
1-3
57
31
2-3
02
41
57
71
11
01
29
17
61
82
17
92
45
32
03
84
44
22
05
54
95
68
49
85
41
05
14
01
53
16
71
57
31
03
20
35
23
87
% y
-y6
2-1
36
31
20
15
-11
25
13
25
77
71
13
80
46
19
12
27
31
10
10
22
12
30
21
08
61
08
12
61
39
71
82
12
12
62
12
83
94
65
05
85
61
06
10
81
26
13
9
% y
-y4
3-9
-59
26
17
10
-69
-71
-62
11
83
4-7
0-4
22
72
62
12
42
61
71
0
11
61
23
12
63
24
85
86
43
67
71
31
01
21
32
02
12
72
54
64
85
86
4
% y
-y4
02
-74
50
20
10
-84
-86
-76
37
07
1-8
5-5
37
03
62
54
35
02
01
0
10
51
07
85
53
60
68
75
41
31
41
31
41
21
62
72
72
83
23
26
06
06
87
5%
y-y
45
-21
-37
13
13
10
-45
-40
-48
3-5
16
-43
-30
61
91
91
31
31
31
0
97
51
,01
51
,00
38
14
1,0
81
1,2
71
1,4
41
68
17
51
77
20
22
60
28
32
32
35
24
62
51
45
67
52
71
,04
11
,08
11
,23
91
,38
6
%y-
y3
9-1
-19
33
18
13
-42
-42
-64
66
13
1-4
21
84
62
31
42
83
31
51
29
23
1,0
34
74
24
54
50
75
32
56
43
21
09
10
81
15
12
21
22
12
72
17
23
72
49
25
82
51
50
05
07
53
25
64
% y
-y7
-28
-39
12
56
-53
-48
-30
-12
12
18
-51
-22
-71
-46
12
56
30
4.4
31
7.9
18
0.5
83
.12
08
26
4.6
33
0.8
7.4
13
.42
3.3
38
.95
4.3
48
20
.86
2.3
10
2.3
10
5.7
93
19
52
08
25
53
14
% y
-y3
8-4
3-5
41
50
27
25
-91
-81
-41
-6
30
26
0-8
69
63
92
70
49
13
51
50
23
23
1-1
7-1
9-4
5-9
0-1
6-1
8-1
2-
--
-45
-90
Op
era
ting
ma
rgin
(%
)1
61
5.5
10
.36
.51
3.1
14
.71
6.5
2.6
4.7
7.4
10
.21
3.4
13
.43
.68
.91
3.4
12
.81
1.9
12
.71
3.1
14
.41
6.1
11
/3E
Co
's l
ate
st
No
mu
ra l
ate
st
No
mu
ra p
rev
Old
se
gm
en
ts
N
ew
se
gm
en
ts
10
/31
1/3
10
/31
1/3
$/¥
€/¥
¥/R
MB
Sa
les
Sa
les
by
reg
ion
Jap
Ove
rse
as
(1)
+ (
2)
+ (
3)
+ (
4)
+ (
5)
Am
eri
cas
(1)
No
rth
Am
eri
ca
Mid
dle
& S
ou
th A
me
rica
Eu
rop
e/C
IS (
2)
(no
te)
We
ste
rn &
Ea
ste
rn E
uro
pe
(n
ote
)
CIS
(R
uss
ia,
etc
) (n
ote
)
Asi
a,
Oce
an
ia (
3)
Asi
a
Oce
an
ia
Ch
ina
(4
)
Mid
dle
Ea
st,
Afr
ica
(5
)
Mid
dle
Ea
st
Afr
ica
Not
e:(1
)S
egm
enta
tion
isbe
ing
revi
sed
from
09/3
,w
ithth
efo
rklif
tbu
sine
ssin
clud
edw
ithin
the
cons
truc
tion
&m
inin
geq
uipm
ent
segm
ent.
Y-y
com
paris
ons
are
for
area
sw
here
com
paris
ons
are
poss
ible
.(3
)W
ees
timat
eth
eop
erat
ing
prof
it(1
1/3
estim
ates
)im
pact
ofea
ch¥
1ch
ange
is¥
3.5b
nag
ains
tth
edo
llar,
¥0.2
5bn
agai
nst
the
euro
,an
d¥8
.7bn
agai
nst
the
renm
inbi
.(4
)W
ees
timat
eth
esa
les
impa
ctof
each
¥1
chan
geis
¥6.
0bn
agai
nst
the
dolla
r, ¥
1.0b
n ag
ains
t th
e eu
ro,
and
¥23.
0bn
agai
nst
the
renm
inbi
.
Sou
rce:
Com
pany
dat
a, N
omur
a es
timat
es
(Re
f) E
me
rgin
g m
ark
ets
Ad
van
ced
eco
no
mie
s (J
ap
an
, U
S,
Eu
rop
e)
Op
era
ting
pro
fits
(Re
f) F
ore
x im
pa
ct
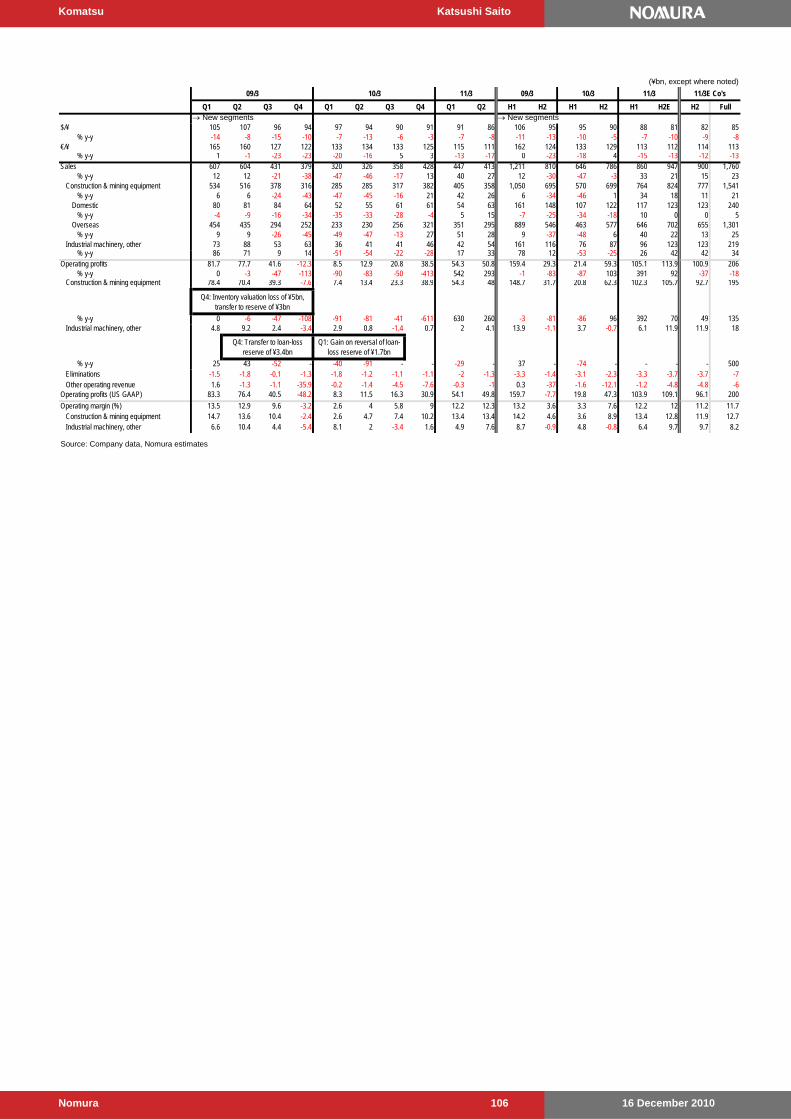
Komatsu Katsushi Saito
16 December 2010 Nomura 106
(¥bn, except where noted)
Q1 Q2 Q3 Q4 Q1 Q2 Q3 Q4 Q1 Q2 H1 H2 H1 H2 H1 H2E H2 Full
105 107 96 94 97 94 90 91 91 86 106 95 95 90 88 81 82 85% y-y -14 -8 -15 -10 -7 -13 -6 -3 -7 -8 -11 -13 -10 -5 -7 -10 -9 -8
165 160 127 122 133 134 133 125 115 111 162 124 133 129 113 112 114 113% y-y 1 -1 -23 -23 -20 -16 5 3 -13 -17 0 -23 -18 4 -15 -13 -12 -13
607 604 431 379 320 326 358 428 447 413 1,211 810 646 786 860 947 900 1,760% y-y 12 12 -21 -38 -47 -46 -17 13 40 27 12 -30 -47 -3 33 21 15 23
534 516 378 316 285 285 317 382 405 358 1,050 695 570 699 764 824 777 1,541% y-y 6 6 -24 -43 -47 -45 -16 21 42 26 6 -34 -46 1 34 18 11 21
80 81 84 64 52 55 61 61 54 63 161 148 107 122 117 123 123 240% y-y -4 -9 -16 -34 -35 -33 -28 -4 5 15 -7 -25 -34 -18 10 0 0 5
454 435 294 252 233 230 256 321 351 295 889 546 463 577 646 702 655 1,301% y-y 9 9 -26 -45 -49 -47 -13 27 51 28 9 -37 -48 6 40 22 13 25
73 88 53 63 36 41 41 46 42 54 161 116 76 87 96 123 123 219% y-y 86 71 9 14 -51 -54 -22 -28 17 33 78 12 -53 -25 26 42 42 34
81.7 77.7 41.6 -12.3 8.5 12.9 20.8 38.5 54.3 50.8 159.4 29.3 21.4 59.3 105.1 113.9 100.9 206% y-y 0 -3 -47 -113 -90 -83 -50 -413 542 293 -1 -83 -87 103 391 92 -37 -18
78.4 70.4 39.3 -7.6 7.4 13.4 23.3 38.9 54.3 48 148.7 31.7 20.8 62.3 102.3 105.7 92.7 195
% y-y 0 -6 -47 -108 -91 -81 -41 -611 630 260 -3 -81 -86 96 392 70 49 1354.8 9.2 2.4 -3.4 2.9 0.8 -1.4 0.7 2 4.1 13.9 -1.1 3.7 -0.7 6.1 11.9 11.9 18
% y-y 25 43 -52 - -40 -91 - - -29 - 37 - -74 - - - - 500-1.5 -1.8 -0.1 -1.3 -1.8 -1.2 -1.1 -1.1 -2 -1.3 -3.3 -1.4 -3.1 -2.3 -3.3 -3.7 -3.7 -71.6 -1.3 -1.1 -35.9 -0.2 -1.4 -4.5 -7.6 -0.3 -1 0.3 -37 -1.6 -12.1 -1.2 -4.8 -4.8 -6
83.3 76.4 40.5 -48.2 8.3 11.5 16.3 30.9 54.1 49.8 159.7 -7.7 19.8 47.3 103.9 109.1 96.1 200
13.5 12.9 9.6 -3.2 2.6 4 5.8 9 12.2 12.3 13.2 3.6 3.3 7.6 12.2 12 11.2 11.714.7 13.6 10.4 -2.4 2.6 4.7 7.4 10.2 13.4 13.4 14.2 4.6 3.6 8.9 13.4 12.8 11.9 12.7
6.6 10.4 4.4 -5.4 8.1 2 -3.4 1.6 4.9 7.6 8.7 -0.9 4.8 -0.8 6.4 9.7 9.7 8.2
10/3 11/3 11/3E Co's
New segments New segments
09/3 10/3 11/3 09/3
$/¥
€/¥
Sales
Construction & mining equipment
Domestic
Overseas
Industrial machinery, other
Operating profits
Construction & mining equipment
Q4: Inventory valuation loss of ¥5bn,transfer to reserve of ¥3bn
Industrial machinery, other
Q4: Transfer to loan-lossreserve of ¥3.4bn
Q1: Gain on reversal of loan-loss reserve of ¥1.7bn
EliminationsOther operating revenue
Operating profits (US GAAP)
Operating margin (%)Construction & mining equipmentIndustrial machinery, other
Source: Company data, Nomura estimates

Komatsu Katsushi Saito
16 December 2010 Nomura 107
(¥mn, except where noted)07/3 08/3 09/3 10/3 11/3E 12/3E 13/3E
92,253 102,107 90,607 83,561 100,300 120,400 156,5000 0 0 0 0 0 0
551,732 613,319 476,870 598,665 755,668 873,180 968,527437,894 518,441 507,357 396,416 440,145 491,190 544,826135,535 129,505 131,374 112,451 127,196 137,086 144,571388,393 491,146 525,462 525,100 527,885 540,670 558,455238,175 250,628 237,389 242,862 242,862 242,862 242,862
1,843,982 2,105,146 1,969,059 1,959,055 2,194,057 2,405,388 2,615,741
365,065 387,104 214,375 207,024 261,317 301,954 334,926174,734 216,818 307,749 229,394 299,591 334,125 343,926174,340 235,277 292,106 356,985 356,985 356,985 356,985353,126 378,821 339,888 331,677 331,677 331,677 331,677776,717 887,126 814,941 833,975 944,487 1,080,647 1,248,227
349,074 452,095 599,855 586,379 656,576 691,110 700,911256,821 349,988 509,248 502,818 556,276 570,710 544,411
22.2 25 13.3 5.7 13.7 16.4 18.624.7 27.1 14.6 6.1 15 18.2 20.813.5 15.9 9.6 4.1 10 12.1 13.819.7 23 9.7 4 13.3 15.8 17.2
13.2 14.9 9.3 5.6 12.1 13.9 15.612.5 14.4 6.4 4.5 11.3 13.3 15
7.1 7.2 8.4 11.9 10.6 10.2 10.111.7 11.3 11.7 16.4 14.6 13.8 13.66.4 6.6 7.7 11 9.7 9.2 90.6 0.5 0.5 0.7 0.7 0.7 0.83.5 3.3 2.8 5 5 5 52.8 2.8 3 3.3 2.9 2.8 2.82.3 2.1 1.3 1.7 1.7 1.7 1.7
4 4 4.6 6.6 6.2 6.1 6.12.5 2.6 3.1 4.4 3.5 3.1 2.9
0.33 0.39 0.62 0.6 0.59 0.53 0.4442.1 42.1 41.4 42.6 43 44.9 47.7
104,507 164,389 148,973 124,492 55,030 123,405 181,719153,264 203,826 78,797 33,559 126,000 171,000 215,00065,421 74,628 97,241 90,215 90,215 90,215 90,215
-114,178 -114,065 -27,065 718 -161,185 -137,810 -123,496Accounts receivable -80,890 -61,587 136,449 -121,795 -157,003 -117,511 -95,347Inventories -67,820 -80,547 11,084 110,941 -43,729 -51,045 -53,636Accounts payable 60,289 22,039 -172,729 -7,351 54,293 40,636 32,972Other current assets -25,757 6,030 -1,869 18,923 -14,745 -9,890 -7,485
-130,375 -164,139 -157,251 -89,537 -93,000 -103,000 -108,000-129,600 -177,381 -131,557 -75,853 -93,000 -103,000 -108,000
-775 13,242 -25,694 -13,684 0 0 0-25,868 250 -8,278 34,955 -37,970 20,405 73,719
-45,690 73,234 107,899 -38,772 54,709 -305 -37,619-17,869 -30,802 -41,783 -25,625 -15,488 -34,839 -47,420-28,839 103,021 147,760 -13,476 70,197 34,535 9,801
1,018 1,015 1,922 329 0 0 0
-71,558 73,484 99,621 -3,817 16,739 20,100 36,10093,760 -63,630 -111,121 -3,229 0 0 0
22,202 9,854 -11,500 -7,046 16,739 20,100 36,100
Source: Company data, Nomura estimates
SEC basis
Balance sheetCash & depositsShort-term marketable securitiesAccounts receivableInventory assetsOther current assetsProperty, plant & equipmentOtherTotal assets
Accounts payableShort-term borrowingsLong-term borrowingsOther Owners' equity
Interest-bearing debt Net interest-bearing debt
Financial indicatorsROIC (%)OROA (%)
1,125,791 1,339,221
ROA (%)ROE (%)
Operating margin (%)Recurring margin (%)
1,949,138Turnover periods (months)
Invested capital Total assets
1,414,796 1,420,354 1,601,063 1,771,758
Invested capital(owners' equity + interest-bearing debt)
Operating assetsCash & equivalentsAccounts receivableInventoriesAccounts payableWorking capitalProperty, plant & equipment
Net D/E ratio (x)Owners' equity ratio (%)
Cash flowOperating cash flow (1)
Net profitsDepreciationChange in working capital
Investment cash flow (2)L-T asset (PPE/intangible) acquisition (capex)Change in investments, other assets
Free cash flow (3) = (1) + (2)
Financial cash flow (4)Dividends
Change in cash & equivalents
Note: 07/3 includes impact of sale of silicon wafer business.
Change in interest-bearing debtChange in capital stock, legal reserves
(3) + (4)Change in other
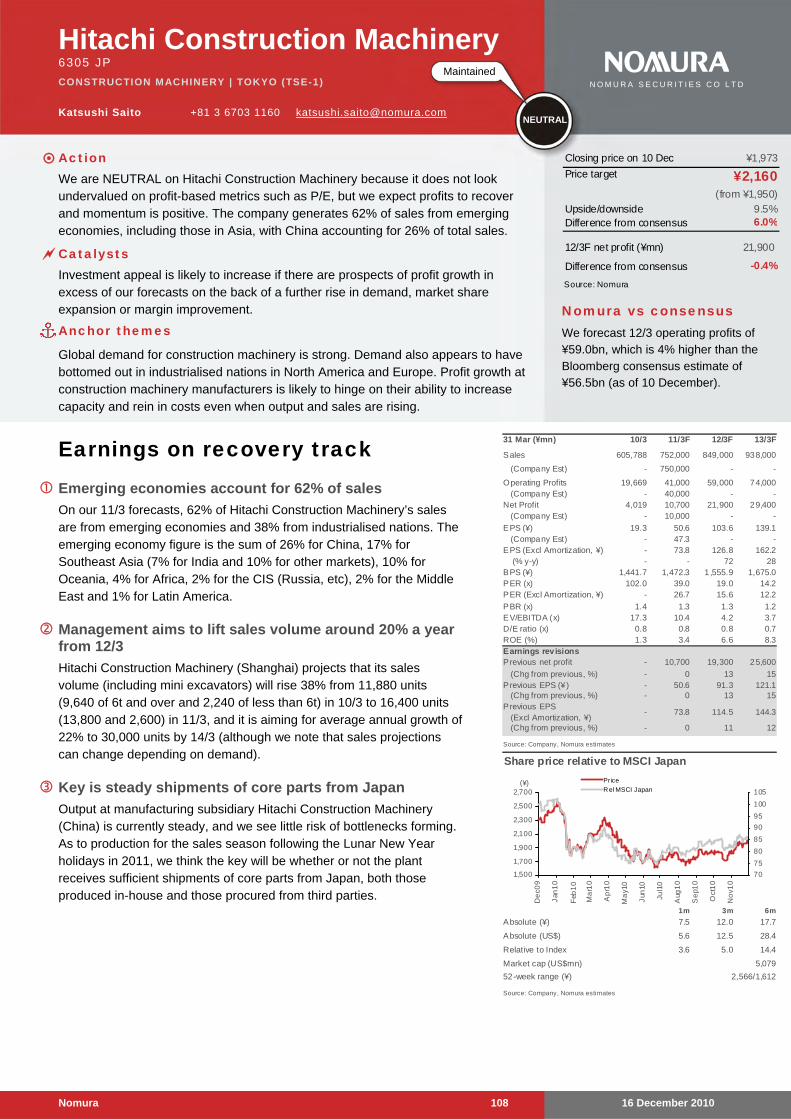
16 December 2010 Nomura 108
Hitachi Construction Machinery 6305 JP
CONSTRUCTION MACHINERY | TOKYO (TSE-1)
Katsushi Saito +81 3 6703 1160 [email protected]
Earnings on recovery track Emerging economies account for 62% of sales
On our 11/3 forecasts, 62% of Hitachi Construction Machinery’s sales are from emerging economies and 38% from industrialised nations. The emerging economy figure is the sum of 26% for China, 17% for Southeast Asia (7% for India and 10% for other markets), 10% for Oceania, 4% for Africa, 2% for the CIS (Russia, etc), 2% for the Middle East and 1% for Latin America.
Management aims to lift sales volume around 20% a year from 12/3
Hitachi Construction Machinery (Shanghai) projects that its sales volume (including mini excavators) will rise 38% from 11,880 units (9,640 of 6t and over and 2,240 of less than 6t) in 10/3 to 16,400 units (13,800 and 2,600) in 11/3, and it is aiming for average annual growth of 22% to 30,000 units by 14/3 (although we note that sales projections can change depending on demand).
Key is steady shipments of core parts from Japan
Output at manufacturing subsidiary Hitachi Construction Machinery (China) is currently steady, and we see little risk of bottlenecks forming. As to production for the sales season following the Lunar New Year holidays in 2011, we think the key will be whether or not the plant receives sufficient shipments of core parts from Japan, both those produced in-house and those procured from third parties.
31 Mar (¥mn) 10/3 11/3F 12/3F 13/3F
Sales 605,788 752,000 849,000 938,000
(Company Est) - 750,000 - -
Operating Profits 19,669 41,000 59,000 74,000 (Company Est) - 40,000 - -Net Profit 4,019 10,700 21,900 29,400 (Company Est) - 10,000 - -
EPS (¥) 19.3 50.6 103.6 139.1 (Company Est) - 47.3 - -EPS (Excl Amortization, ¥) - 73.8 126.8 162.2 (% y-y) - - 72 28BPS (¥) 1,441.7 1,472.3 1,555.9 1,675.0PER (x) 102.0 39.0 19.0 14.2PER (Excl Amortization, ¥) - 26.7 15.6 12.2
PBR (x) 1.4 1.3 1.3 1.2EV/EBITDA (x) 17.3 10.4 4.2 3.7D/E ratio (x) 0.8 0.8 0.8 0.7ROE (%) 1.3 3.4 6.6 8.3Earnings revisionsPrevious net profit - 10,700 19,300 25,600
(Chg from previous, %) - 0 13 15Previous EPS (¥) - 50.6 91.3 121.1 (Chg from previous, %) - 0 13 15Previous EPS (Excl Amortization, ¥)
- 73.8 114.5 144.3
(Chg from previous, %) - 0 11 12
Source: Company, Nomura estimates
Share price relative to MSCI Japan
1m 3m 6m
7.5 12.0 17.7
5.6 12.5 28.4
3.6 5.0 14.4
Source: Company, Nomura estimates
5,079
52-week range (¥) 2,566/1,612
Relative to Index
Market cap (US$mn)
Absolute (¥)
Absolute (US$)
1,500
1,700
1,900
2,100
2,300
2,500
2,700
De
c09
Jan
10
Feb
10
Ma
r10
Ap
r10
Ma
y10
Jun
10
Jul1
0
Aug
10
Se
p10
Oct
10
No
v10
70
75
80
85
90
95
100
105
Price
R el MSCI Japan(¥)
Closing price on 10 Dec ¥1,973
Price target
(from ¥1,950)
Upside/downside 9.5%Difference from consensus 6.0%
12/3F net profit (¥mn) 21,900
Difference from consensus -0.4%
Source: Nomura
¥2,160
Nomura vs consensus We forecast 12/3 operating profits of ¥59.0bn, which is 4% higher than the Bloomberg consensus estimate of ¥56.5bn (as of 10 December).
Maintained
NEUTRAL
N O M U R A S E C U R I T I E S C O L T D
Action We are NEUTRAL on Hitachi Construction Machinery because it does not look
undervalued on profit-based metrics such as P/E, but we expect profits to recover and momentum is positive. The company generates 62% of sales from emerging economies, including those in Asia, with China accounting for 26% of total sales.
Catalysts Investment appeal is likely to increase if there are prospects of profit growth in
excess of our forecasts on the back of a further rise in demand, market share expansion or margin improvement.
Anchor themes
Global demand for construction machinery is strong. Demand also appears to have bottomed out in industrialised nations in North America and Europe. Profit growth at construction machinery manufacturers is likely to hinge on their ability to increase capacity and rein in costs even when output and sales are rising.
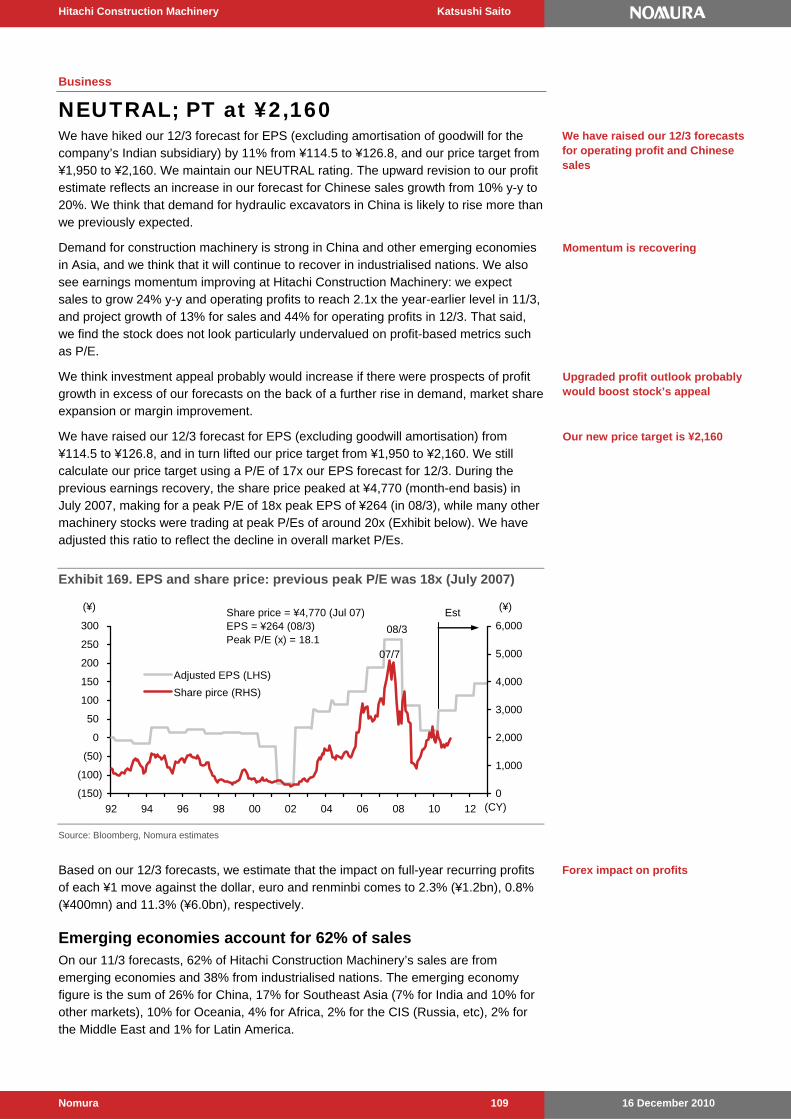
Hitachi Construction Machinery Katsushi Saito
16 December 2010 Nomura 109
Business
NEUTRAL; PT at ¥2,160 We have hiked our 12/3 forecast for EPS (excluding amortisation of goodwill for the company’s Indian subsidiary) by 11% from ¥114.5 to ¥126.8, and our price target from ¥1,950 to ¥2,160. We maintain our NEUTRAL rating. The upward revision to our profit estimate reflects an increase in our forecast for Chinese sales growth from 10% y-y to 20%. We think that demand for hydraulic excavators in China is likely to rise more than we previously expected.
Demand for construction machinery is strong in China and other emerging economies in Asia, and we think that it will continue to recover in industrialised nations. We also see earnings momentum improving at Hitachi Construction Machinery: we expect sales to grow 24% y-y and operating profits to reach 2.1x the year-earlier level in 11/3, and project growth of 13% for sales and 44% for operating profits in 12/3. That said, we find the stock does not look particularly undervalued on profit-based metrics such as P/E.
We think investment appeal probably would increase if there were prospects of profit growth in excess of our forecasts on the back of a further rise in demand, market share expansion or margin improvement.
We have raised our 12/3 forecast for EPS (excluding goodwill amortisation) from ¥114.5 to ¥126.8, and in turn lifted our price target from ¥1,950 to ¥2,160. We still calculate our price target using a P/E of 17x our EPS forecast for 12/3. During the previous earnings recovery, the share price peaked at ¥4,770 (month-end basis) in July 2007, making for a peak P/E of 18x peak EPS of ¥264 (in 08/3), while many other machinery stocks were trading at peak P/Es of around 20x (Exhibit below). We have adjusted this ratio to reflect the decline in overall market P/Es.
Exhibit 169. EPS and share price: previous peak P/E was 18x (July 2007)
(150)
(100)
(50)
0
50
100
150
200
250
300
92 94 96 98 00 02 04 06 08 10 12
0
1,000
2,000
3,000
4,000
5,000
6,000
Adjusted EPS (LHS)
Share pirce (RHS)
08/3
07/7
(CY)
(¥)Share price = ¥4,770 (Jul 07)EPS = ¥264 (08/3)Peak P/E (x) = 18.1
(¥)Est
Source: Bloomberg, Nomura estimates
Based on our 12/3 forecasts, we estimate that the impact on full-year recurring profits of each ¥1 move against the dollar, euro and renminbi comes to 2.3% (¥1.2bn), 0.8% (¥400mn) and 11.3% (¥6.0bn), respectively.
Emerging economies account for 62% of sales On our 11/3 forecasts, 62% of Hitachi Construction Machinery’s sales are from emerging economies and 38% from industrialised nations. The emerging economy figure is the sum of 26% for China, 17% for Southeast Asia (7% for India and 10% for other markets), 10% for Oceania, 4% for Africa, 2% for the CIS (Russia, etc), 2% for the Middle East and 1% for Latin America.
We have raised our 12/3 forecasts for operating profit and Chinese sales
Forex impact on profits
Momentum is recovering
Upgraded profit outlook probably would boost stock’s appeal
Our new price target is ¥2,160

Hitachi Construction Machinery Katsushi Saito
16 December 2010 Nomura 110
Hitachi Construction Machinery has a higher weighting of sales to China and India than Komatsu, and it has the top share of the Indian market for hydraulic excavators, according to our channel checks. It does not sell much to Latin America, however. In that region, it entrusts sales of products other than mining machinery to John Deere, as in North America, but John Deere is not proactive in construction machinery sales in Latin America.
The weighting of sales to industrialised economies includes a high weighting of 23% for the Japanese market. This is because the company includes revenues from rental operations at consolidated dealer subsidiaries, as well as new vehicle sales and service revenues. Western Europe accounts for 9% of total sales and North America for 7%. In North America, Hitachi Construction Machinery supplies products to John Deere, and most sales in the region are via John Deere resellers under the John Deere brand.
Suppliers of core parts In terms of core components, Hitachi Construction Machinery mostly sources diesel engines from Isuzu Motors and purchases large engines from Cummins. For hydraulic equipment, we think that its main suppliers are Kayaba Industry for cylinders and Kayaba Industry and Kawasaki Heavy Industries for valves and pumps. It manufactures some valves and pumps in-house, and most of its motors are produced in-house, too, although it gets some from Kayaba Industry and Nachi-Fujikoshi.
Business in China Hitachi Construction Machinery’s organisation in China consists mainly of sales company Hitachi Construction Machinery (Shanghai) (54% stake) and assembly subsidiary Hitachi Construction Machinery (China) (81%) in Hefei, Anhui province. The former sells products made by the latter. This accounts for some 80% of the sales volume in China of Hitachi Construction Machinery brand products.
The remaining 20% or so consists of hydraulic excavators assembled at the Tsuchiura plant in Japan, which are then shipped to reseller Elle Construction Machinery (China) (19% stake), which then sells them all over China.
Hitachi Construction Machinery (Shanghai), which sells Chinese-made hydraulic excavators, has 27 resellers, and Elle Construction Machinery, which sells Japanese-made hydraulic excavators, has 28 resellers in China, for a total of 50, factoring in that five resellers offer products from both companies.
Focus point (1): Broad lineup of hydraulic excavators Here we outline the features, strengths and strategies of Hitachi Construction Machinery’s Chinese operations. Our first point is that Hitachi Construction Machinery is a global supplier with particular strengths in hydraulic excavators, where it has a broad lineup ranging from mini excavators to ultra-large equipment. It also has a long track record in global sales and product support. We think that the company has a strong competitive edge that gives it a firm foundation. According to our channel checks, it has the leading share of the global market for ultra-large excavators used in mining (100t and over), beating Komatsu.
Focus point (2): New products capable of running on low-grade fuel for Chinese market Our second point is that the launch of new models designed for emerging economies has helped it start to regain some lost market share in China. Through 2009, Hitachi Construction Machinery’s sales in China were of Tier-3 emission regulation-compliant machinery, in contrast to other manufacturers. However, low-grade fuels (containing impurities, partly due to poor storage) are often used in China, which can result in mechanical failures, such as the clogging up of delicate fuel injection systems.
Highly exposed to Chinese and Indian markets
Industrialised economies account for 38% of sales
Some 80% of Chinese sales are Chinese made, 20% Japanese made
50 resellers

Hitachi Construction Machinery Katsushi Saito
16 December 2010 Nomura 111
In view of this, Hitachi Construction Machinery has reverted to Tier 2-compliant engines and since March 2010 has launched a string of products focused on durability. In July, it launched a new 20t class hydraulic excavator (around 30% of demand volume for 6t and over is for this class), and its share of sales of non-Chinese 20t class excavators in China moved from 14.8% in 09/3 to 15.8% in 10/3, 14.3% in 11/3 Q1, and 15.6% in 11/3 Q2, according to the company.
It also launched a 24t class model in July (22% of demand), and its share of that market moved from 15.4% in 09/3 to 15.0% in 10/3, 12.9% in 11/3 Q1, and 16.8% in 11/3 Q2, according to the company.
The company launched new products in the 30-35t class (20% of demand) in March, and its market share went from 15.7% in 09/3 to 12.8% in 10/3 and 13.7% in 11/3 Q1, although shortages for some parts caused its share to dip back to 11.8% in 11/3 Q2, according to the company.
Focus point (3): Change of management at sales subsidiary in October Third, we note a change in management at sales subsidiary Hitachi Construction Machinery (Shanghai) in October. The new head is executive officer Akihiko Hiraoka, who has been resident in China since 2004, when he was in charge of marketing. We think that Mr Hiraoka will come up with even more aggressive measures for regaining market share. We think that rather than involving cuts in sales prices, the new policies will focus on further tailoring products to the specific requirements of the Chinese market, such as providing excavators with bigger scoops, shortening delivery lead times through production efficiency gains, and strengthening on-site marketing and service capabilities.
Mr Hiraoka, in his earlier comments to us, stated that he expects demand in China to increase at least 10-15% in 12/3.
Focus point (4): Management aims to lift sales volume around 20% a year from 12/3 Our fourth point is that Hitachi Construction Machinery (Shanghai) projects that its sales volume (including mini excavators) will rise 38% from 11,880 units (9,640 of 6t and over and 2,240 of less than 6t) in 10/3 to 16,400 units (13,800 and 2,600) in 11/3. The company is aiming for average annual growth of 22% to 30,000 units by 14/3 (although we note that sales projections can change depending on demand).
The sales subsidiary has come up with specific strategies for achieving unit sales of 30,000 in 14/3. These include raising the number of sales and service bases at resellers and increasing their marketing and service headcount, sending personnel from Hitachi Construction Machinery (Shanghai) to key regions (Beijing, Shenyang, Hefei, Chengdu, Nanning, and Inner Mongolia), working to retain major customers with a broad geographical reach, under guidance from Hitachi Construction Machinery Shanghai, and strengthening sales to the mining industry via the establishment of a mining division in April 2010.
Focus point (5): Key is steady shipments of core parts from Japan Fifth, we note that output at manufacturing subsidiary Hitachi Construction Machinery (China) is currently steady, and we see little risk of bottlenecks forming. As to production for the sales season following the Lunar New Year holidays in 2011, we think the key will be whether or not the plant receives sufficient shipments of core parts from Japan, both those produced in-house and those procured from third parties.
Regaining share of 20t class market
Regaining market share in 24t class too
Sharp recovery in 30–35t class equipment has led to part shortages
For 12/3, new head sees 10–15% demand growth
Aiming for sales of 30,000 units in 14/3
Hitachi Construction Machinery Katsushi Saito
16 December 2010 Nomura 112
Our visit to manufacturing subsidiary We visited Hitachi Construction Machinery (China) in late November 2010. The plant is located in Hefei, Anhui province, some three and a half hours from Shanghai via high-speed rail. The subsidiary is located in an economic and technological development zone and is surrounded by suppliers of components such as steel sheet and worked metal parts, as well as the forklift plant of Hitachi Construction Machinery subsidiary TCM. We were told by executive Masaki Kanehara that production was progressing steadily, in line with projections.
Hitachi Construction Machinery (China) manufactures one 6t class mini excavator (6t or less) and 28 models of hydraulic excavator (6t or more), ranging from 7t through 87t. It also makes cranes (both crawler and wheel type), albeit in small volumes, with two models for the Chinese market and four for export. It has made a total of 152 cranes since 06/3.
Management expects to produce 3,160 mini excavators and 15,460 hydraulic excavators in 11/3, for a total of 18,620 units (although this may change depending on demand trends). This represents an 86% increase over the total of around 10,000 that it produced in 09/3–10/3. Over the medium term, the company plans to increase output 18% y-y to 22,000 units in 12/3, 14% to 25,000 units in 13/3 and 20% to 30,000 units in 14/3.
On the day that we visited the plant, the company was planning to assemble 75 excavators (including mini excavators). A simple calculation based on 22 working days a month gives monthly output of 1,650 units, which looks steady to us.
At the plant, vehicle assembly is on a one-shift system, metalwork (welding steel plate to form parts such as scoops, arms, and booms) is on a two-shift system, and cutting work (cutting steel plate for metalwork processes) is on a 24-hour three-shift system.
To boost production capacity in metalworking processes, the company plans to increase the number of welding robots from the current 35 by 49% to 52 by end-2010. This is also to stabilise welding quality and factors in the difficulty of training up workers sufficiently for a rapid increase in output.
In the cutting process, the plant has 42 steel plate cutters. The majority of these are made in Japan, primarily from Koike Sanso Kogyo and Tanaka Sanso Industry (unlisted).
Currently, the plant procures around 45% of parts and materials locally, but over the medium term, the aim is to raise this to 60%. To achieve this, management is considering procuring costly hydraulic cylinders and transmissions from China, including from Chinese plants of Japanese manufacturers. In the future, it may even procure parts from Chinese hydraulic cylinder manufacturers such as Jiangsu Hengli Highpressure Oil Cylinder (unlisted) if it can meet the company’s quality and lead time requirements. Meanwhile, we think that it will continue to procure hydraulic valves, pumps and motors from Japan.
Risks to our investment view
Risks to our call include worse-than-expected economic conditions in the region, including China. A sharp fall in commodity prices may also result in a decline in sales of mining equipment, which accounts for a large portion of the company’s sales.
Output currently is steady
Aiming to increase local procurement from 45% to 60%
Makes hydraulic excavators ranging from 6t class through 87t class
Plans to have setup to produce 30,000 excavators by 14/3
Production setup
Increasing number of welding robots from 35 to 52
Steel plate cutters from Koike Sanso Kogyo
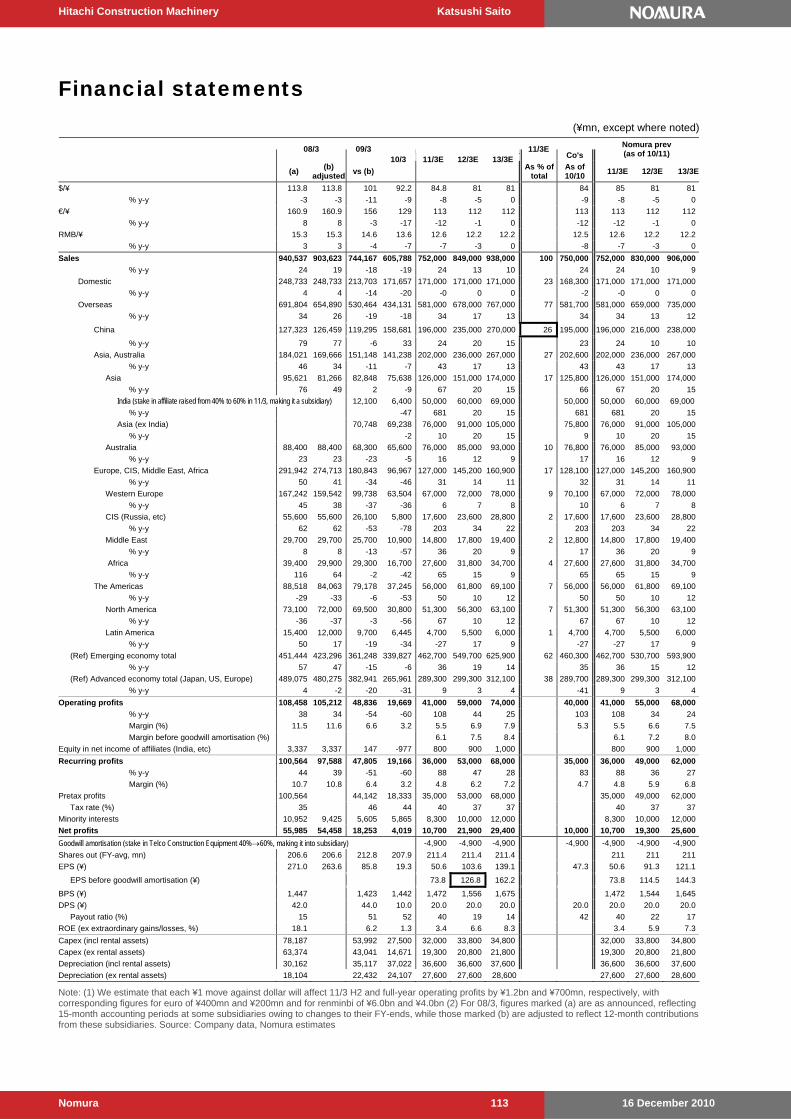
Hitachi Construction Machinery Katsushi Saito
16 December 2010 Nomura 113
Financial statements
(¥mn, except where noted)
08/3 09/3 11/3E
Co's Nomura prev (as of 10/11)
(a) (b)
adjustedvs (b)
10/3 11/3E 12/3E 13/3E As % of
total As of 10/10
11/3E 12/3E 13/3E
$/¥ 113.8 113.8 101 92.2 84.8 81 81 84 85 81 81
% y-y -3 -3 -11 -9 -8 -5 0 -9 -8 -5 0
€/¥ 160.9 160.9 156 129 113 112 112 113 113 112 112
% y-y 8 8 -3 -17 -12 -1 0 -12 -12 -1 0
RMB/¥ 15.3 15.3 14.6 13.6 12.6 12.2 12.2 12.5 12.6 12.2 12.2
% y-y 3 3 -4 -7 -7 -3 0 -8 -7 -3 0
Sales 940,537 903,623 744,167 605,788 752,000 849,000 938,000 100 750,000 752,000 830,000 906,000
% y-y 24 19 -18 -19 24 13 10 24 24 10 9
Domestic 248,733 248,733 213,703 171,657 171,000 171,000 171,000 23 168,300 171,000 171,000 171,000
% y-y 4 4 -14 -20 -0 0 0 -2 -0 0 0
Overseas 691,804 654,890 530,464 434,131 581,000 678,000 767,000 77 581,700 581,000 659,000 735,000
% y-y 34 26 -19 -18 34 17 13 34 34 13 12
China 127,323 126,459 119,295 158,681 196,000 235,000 270,000 26 195,000 196,000 216,000 238,000
% y-y 79 77 -6 33 24 20 15 23 24 10 10
Asia, Australia 184,021 169,666 151,148 141,238 202,000 236,000 267,000 27 202,600 202,000 236,000 267,000
% y-y 46 34 -11 -7 43 17 13 43 43 17 13
Asia 95,621 81,266 82,848 75,638 126,000 151,000 174,000 17 125,800 126,000 151,000 174,000
% y-y 76 49 2 -9 67 20 15 66 67 20 15
India (stake in affiliate raised from 40% to 60% in 11/3, making it a subsidiary) 12,100 6,400 50,000 60,000 69,000 50,000 50,000 60,000 69,000
% y-y -47 681 20 15 681 681 20 15
Asia (ex India) 70,748 69,238 76,000 91,000 105,000 75,800 76,000 91,000 105,000
% y-y -2 10 20 15 9 10 20 15
Australia 88,400 88,400 68,300 65,600 76,000 85,000 93,000 10 76,800 76,000 85,000 93,000
% y-y 23 23 -23 -5 16 12 9 17 16 12 9
Europe, CIS, Middle East, Africa 291,942 274,713 180,843 96,967 127,000 145,200 160,900 17 128,100 127,000 145,200 160,900
% y-y 50 41 -34 -46 31 14 11 32 31 14 11
Western Europe 167,242 159,542 99,738 63,504 67,000 72,000 78,000 9 70,100 67,000 72,000 78,000
% y-y 45 38 -37 -36 6 7 8 10 6 7 8
CIS (Russia, etc) 55,600 55,600 26,100 5,800 17,600 23,600 28,800 2 17,600 17,600 23,600 28,800
% y-y 62 62 -53 -78 203 34 22 203 203 34 22
Middle East 29,700 29,700 25,700 10,900 14,800 17,800 19,400 2 12,800 14,800 17,800 19,400
% y-y 8 8 -13 -57 36 20 9 17 36 20 9
Africa 39,400 29,900 29,300 16,700 27,600 31,800 34,700 4 27,600 27,600 31,800 34,700
% y-y 116 64 -2 -42 65 15 9 65 65 15 9
The Americas 88,518 84,063 79,178 37,245 56,000 61,800 69,100 7 56,000 56,000 61,800 69,100
% y-y -29 -33 -6 -53 50 10 12 50 50 10 12
North America 73,100 72,000 69,500 30,800 51,300 56,300 63,100 7 51,300 51,300 56,300 63,100
% y-y -36 -37 -3 -56 67 10 12 67 67 10 12
Latin America 15,400 12,000 9,700 6,445 4,700 5,500 6,000 1 4,700 4,700 5,500 6,000
% y-y 50 17 -19 -34 -27 17 9 -27 -27 17 9
(Ref) Emerging economy total 451,444 423,296 361,248 339,827 462,700 549,700 625,900 62 460,300 462,700 530,700 593,900
% y-y 57 47 -15 -6 36 19 14 35 36 15 12
(Ref) Advanced economy total (Japan, US, Europe) 489,075 480,275 382,941 265,961 289,300 299,300 312,100 38 289,700 289,300 299,300 312,100
% y-y 4 -2 -20 -31 9 3 4 -41 9 3 4
Operating profits 108,458 105,212 48,836 19,669 41,000 59,000 74,000 40,000 41,000 55,000 68,000
% y-y 38 34 -54 -60 108 44 25 103 108 34 24
Margin (%) 11.5 11.6 6.6 3.2 5.5 6.9 7.9 5.3 5.5 6.6 7.5
Margin before goodwill amortisation (%) 6.1 7.5 8.4 6.1 7.2 8.0
Equity in net income of affiliates (India, etc) 3,337 3,337 147 -977 800 900 1,000 800 900 1,000
Recurring profits 100,564 97,588 47,805 19,166 36,000 53,000 68,000 35,000 36,000 49,000 62,000
% y-y 44 39 -51 -60 88 47 28 83 88 36 27
Margin (%) 10.7 10.8 6.4 3.2 4.8 6.2 7.2 4.7 4.8 5.9 6.8
Pretax profits 100,564 44,142 18,333 35,000 53,000 68,000 35,000 49,000 62,000
Tax rate (%) 35 46 44 40 37 37 40 37 37
Minority interests 10,952 9,425 5,605 5,865 8,300 10,000 12,000 8,300 10,000 12,000
Net profits 55,985 54,458 18,253 4,019 10,700 21,900 29,400 10,000 10,700 19,300 25,600
Goodwill amortisation (stake in Telco Construction Equipment 40%60%, making it into subsidiary) -4,900 -4,900 -4,900 -4,900 -4,900 -4,900 -4,900
Shares out (FY-avg, mn) 206.6 206.6 212.8 207.9 211.4 211.4 211.4 211 211 211
EPS (¥) 271.0 263.6 85.8 19.3 50.6 103.6 139.1 47.3 50.6 91.3 121.1
EPS before goodwill amortisation (¥) 73.8 126.8 162.2 73.8 114.5 144.3
BPS (¥) 1,447 1,423 1,442 1,472 1,556 1,675 1,472 1,544 1,645
DPS (¥) 42.0 44.0 10.0 20.0 20.0 20.0 20.0 20.0 20.0 20.0
Payout ratio (%) 15 51 52 40 19 14 42 40 22 17
ROE (ex extraordinary gains/losses, %) 18.1 6.2 1.3 3.4 6.6 8.3 3.4 5.9 7.3
Capex (incl rental assets) 78,187 53,992 27,500 32,000 33,800 34,800 32,000 33,800 34,800
Capex (ex rental assets) 63,374 43,041 14,671 19,300 20,800 21,800 19,300 20,800 21,800
Depreciation (incl rental assets) 30,162 35,117 37,022 36,600 36,600 37,600 36,600 36,600 37,600
Depreciation (ex rental assets) 18,104 22,432 24,107 27,600 27,600 28,600 27,600 27,600 28,600
Note: (1) We estimate that each ¥1 move against dollar will affect 11/3 H2 and full-year operating profits by ¥1.2bn and ¥700mn, respectively, with corresponding figures for euro of ¥400mn and ¥200mn and for renminbi of ¥6.0bn and ¥4.0bn (2) For 08/3, figures marked (a) are as announced, reflecting 15-month accounting periods at some subsidiaries owing to changes to their FY-ends, while those marked (b) are adjusted to reflect 12-month contributions from these subsidiaries. Source: Company data, Nomura estimates

Hitachi Construction Machinery Katsushi Saito
16 December 2010 Nomura 114
(¥mn, except where noted)
Q1 Q2 Q3 Q4 Q1 Q2 Q3 Q4 Q1 Q2 H1 H2 H1 H2E H2 Full
102 108 96 94 97 94.5 89.3 90 91.6 85.7 96 90 89 81 80 84
% y-y -14 -9 -15 -11 -5 -12 -7 -4 -5 -9 -9 -6 -7 -10 -11 -9
161 165 127 122 131 135 132 125 118 111 133 129 115 112 112 113
% y-y 0 2 -23 -23 -19 -18 5 2 -9 -18 -19 4 -14 -13 -13 -12
15 15.7 14.1 13.7 14.2 13.7 13.1 13.2 13.4 12.7 14 13.2 13.1 12.2 12 12.5
% y-y -4 1 -7 -7 -5 -13 -7 -4 -6 -7 -9 -5 -6 -8 -9 -8
233,881 220,171 146,109 144,006 132,302 140,015 141,432 192,039 167,339 178,761 272,317 333,471 346,100 405,900 403,900 750,000
% y-y 13 5 -32 -47 -43 -36 -3 33 26 28 -40 15 27 22 21 24
49,123 60,059 50,327 54,194 34,243 45,758 42,653 49,003 34,397 45,422 80,001 91,656 79,819 91,181 88,481 168,300
% y-y -4 -8 -19 -23 -30 -24 -15 -10 0 -1 -27 -12 0 -1 -3 -2
184,758 160,112 95,782 89,812 98,059 94,257 98,779 143,036 132,942 133,339 192,316 241,815 266,281 314,719 315,419 581,700
% y-y 19 11 -37 -56 -47 -41 3 59 36 41 -44 30 38 30 30 34
40,025 30,225 19,443 29,602 34,372 27,896 36,955 59,458 51,611 37,597 62,268 96,413 89,208 106,792 105,792 195,000
% y-y 17 72 -30 -37 -14 -8 90 101 50 35 -11 97 43 11 10 23
45,900 44,888 31,397 28,963 31,639 34,178 30,257 45,164 42,973 51,982 65,817 75,421 94,955 107,045 107,645 202,600
% y-y 26 10 -23 -56 -31 -24 -4 56 36 52 -28 25 44 42 43 43
23,400 23,300 17,782 18,366 17,239 17,878 16,900 23,621 26,973 30,682 35,117 40,521 57,655 68,345 68,145 125,800
% y-y 54 31 -22 -28 -26 -23 -5 29 56 72 -25 12 64 69 68 66
1,400 900 1,800 2,300 9,700 10,400 2,300 4,100 20,100 29,900 29,900 50,000
% y-y 593 1,056 774 629 629 681
15,839 16,978 15,100 21,321 17,273 20,282 32,817 36,421 37,555 38,445 38,245 75,800
% y-y 9 19 14 6 5 9
22,500 21,600 13,615 10,585 14,400 16,300 13,357 21,543 16,000 21,300 30,700 34,900 37,300 38,700 39,500 76,800
% y-y 6 -6 -25 -59 -36 -25 -2 104 11 31 -30 44 21 11 13 17
71,917 65,883 27,122 15,921 21,152 23,310 23,698 28,807 27,328 31,972 44,462 52,505 59,300 67,700 68,800 128,100
% y-y 21 -5 -59 -84 -71 -65 -13 81 29 37 -68 22 33 29 31 32
38,361 32,539 16,081 12,757 15,298 15,499 15,010 17,697 16,100 15,449 30,797 32,707 31,549 35,451 38,551 70,100
% y-y 0 -20 -56 -71 -60 -52 -7 39 5 0 -57 13 2 8 18 10
14,900 12,900 -1,057 -643 300 1,300 2,200 2,000 2,500 4,300 1,600 4,200 6,800 10,800 10,800 17,600
% y-y 51 -5 -107 -104 -98 -90 -308 -411 733 231 -94 -347 325 157 157 203
8,700 7,800 6,415 2,785 2,500 2,665 1,900 3,835 3,800 3,700 5,165 5,735 7,500 7,300 5,300 12,800
% y-y 55 -6 -4 -69 -71 -66 -70 38 52 39 -69 -38 45 27 -8 17
9,900 12,700 5,721 979 3,000 3,900 4,600 5,200 5,000 8,491 6,900 9,800 13,491 14,109 14,109 27,600
% y-y 74 92 -25 -90 -70 -69 -20 431 67 118 -69 46 96 44 44 65
26,916 19,159 17,777 15,326 10,896 8,873 7,869 9,607 11,030 11,748 19,769 17,476 22,778 33,222 33,222 56,000
% y-y 6 17 1 -47 -60 -54 -56 -37 1 32 -57 -47 15 90 90 50
23,116 16,884 15,649 13,851 9,000 6,800 6,300 8,700 9,900 10,600 15,800 15,000 20,500 30,800 30,800 51,300
% y-y 9 19 2 -35 -61 -60 -60 -37 10 56 -61 -49 30 105 105 67
3,800 2,300 2,128 1,472 1,896 2,073 1,569 907 1,200 1,078 3,969 2,476 2,278 2,422 2,422 4,700
% y-y -10 5 -7 -55 -50 -10 -26 -38 -37 -48 -35 -31 -43 -2 -2 -27
24,352 22,777 9,618 -7,911 -2,438 3,383 887 17,837 4,300 7,961 945 18,724 12,261 28,739 27,739 40,000
% y-y 5 -18 -52 - - -85 -91 - - 135 -98 997 1,197 53 48 103
Margin (%) 10.4 10.3 6.6 -5.5 -1.8 2.4 0.6 9.3 2.6 4.5 0.3 5.6 3.5 7.1 6.9 5.3
Margin before goodwill amortization (%) 3.3 5.1 4.3 7.7 7.5 6
26,994 18,458 9,337 -6,984 -4,098 1,465 1,729 20,070 4,093 7,890 -2,633 21,799 11,983 24,017 23,017 35,000
% y-y 23 -25 -50 -120 -115 -92 -81 - - 439 - 826 - 10 6 83
Margin (%) 11.5 8.4 6.4 -4.8 -3.1 1 1.2 10.5 2.4 4.4 -1 6.5 3.5 5.9 6 5
Source: Company data, Nomura estimates
Africa
The Americas
North America
Latin America
Europe, CIS, Africa, Middle East
Western Europe
CIS (Russia, etc)
Middle East
Asia
India
Asia (ex India)
Australia
Domestic
Overseas
China
Asia, Australia
11/3E Co's
(as of 10/10)
$/¥
€/¥
10/3 11/3 10/3 11/309/3
RMB/¥
Sales
Recurring profits
Operating profits
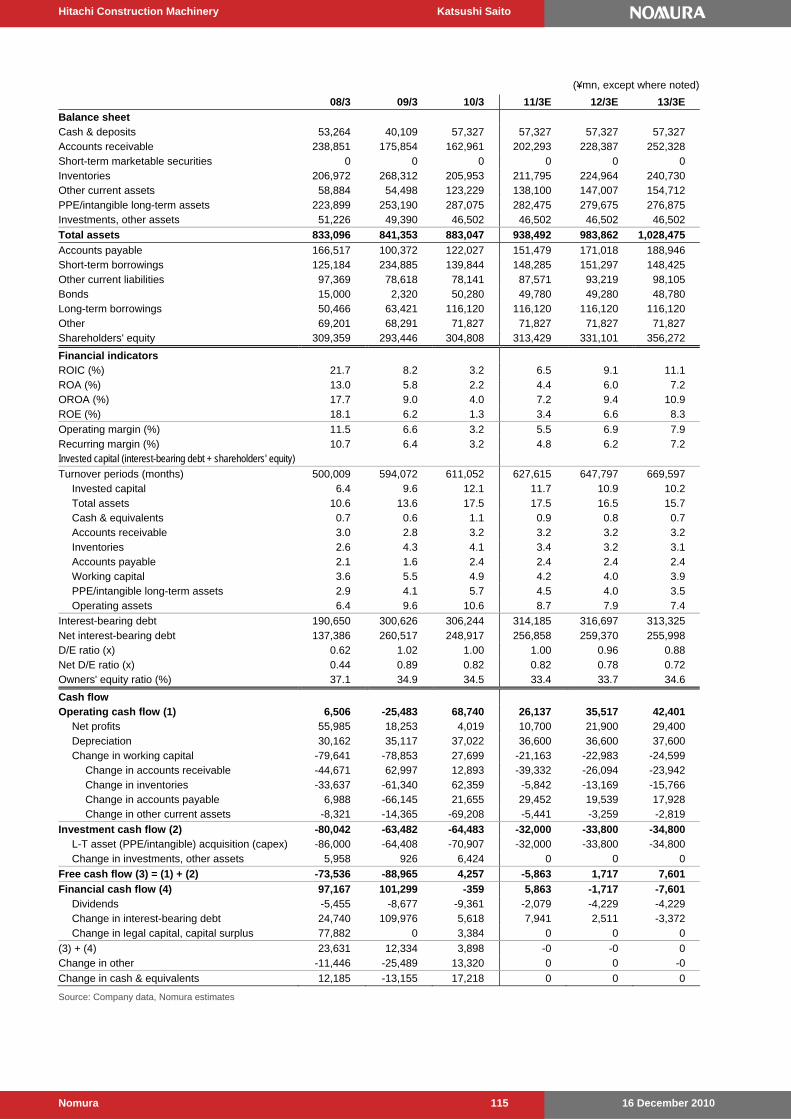
Hitachi Construction Machinery Katsushi Saito
16 December 2010 Nomura 115
(¥mn, except where noted)
08/3 09/3 10/3 11/3E 12/3E 13/3E
Balance sheet Cash & deposits 53,264 40,109 57,327 57,327 57,327 57,327 Accounts receivable 238,851 175,854 162,961 202,293 228,387 252,328 Short-term marketable securities 0 0 0 0 0 0 Inventories 206,972 268,312 205,953 211,795 224,964 240,730 Other current assets 58,884 54,498 123,229 138,100 147,007 154,712 PPE/intangible long-term assets 223,899 253,190 287,075 282,475 279,675 276,875 Investments, other assets 51,226 49,390 46,502 46,502 46,502 46,502
Total assets 833,096 841,353 883,047 938,492 983,862 1,028,475
Accounts payable 166,517 100,372 122,027 151,479 171,018 188,946 Short-term borrowings 125,184 234,885 139,844 148,285 151,297 148,425 Other current liabilities 97,369 78,618 78,141 87,571 93,219 98,105 Bonds 15,000 2,320 50,280 49,780 49,280 48,780 Long-term borrowings 50,466 63,421 116,120 116,120 116,120 116,120 Other 69,201 68,291 71,827 71,827 71,827 71,827 Shareholders' equity 309,359 293,446 304,808 313,429 331,101 356,272
Financial indicators ROIC (%) 21.7 8.2 3.2 6.5 9.1 11.1 ROA (%) 13.0 5.8 2.2 4.4 6.0 7.2 OROA (%) 17.7 9.0 4.0 7.2 9.4 10.9 ROE (%) 18.1 6.2 1.3 3.4 6.6 8.3
Operating margin (%) 11.5 6.6 3.2 5.5 6.9 7.9 Recurring margin (%) 10.7 6.4 3.2 4.8 6.2 7.2 Invested capital (interest-bearing debt + shareholders' equity)
Turnover periods (months) 500,009 594,072 611,052 627,615 647,797 669,597 Invested capital 6.4 9.6 12.1 11.7 10.9 10.2 Total assets 10.6 13.6 17.5 17.5 16.5 15.7 Cash & equivalents 0.7 0.6 1.1 0.9 0.8 0.7 Accounts receivable 3.0 2.8 3.2 3.2 3.2 3.2 Inventories 2.6 4.3 4.1 3.4 3.2 3.1 Accounts payable 2.1 1.6 2.4 2.4 2.4 2.4 Working capital 3.6 5.5 4.9 4.2 4.0 3.9 PPE/intangible long-term assets 2.9 4.1 5.7 4.5 4.0 3.5 Operating assets 6.4 9.6 10.6 8.7 7.9 7.4
Interest-bearing debt 190,650 300,626 306,244 314,185 316,697 313,325 Net interest-bearing debt 137,386 260,517 248,917 256,858 259,370 255,998 D/E ratio (x) 0.62 1.02 1.00 1.00 0.96 0.88 Net D/E ratio (x) 0.44 0.89 0.82 0.82 0.78 0.72 Owners' equity ratio (%) 37.1 34.9 34.5 33.4 33.7 34.6
Cash flow Operating cash flow (1) 6,506 -25,483 68,740 26,137 35,517 42,401 Net profits 55,985 18,253 4,019 10,700 21,900 29,400 Depreciation 30,162 35,117 37,022 36,600 36,600 37,600 Change in working capital -79,641 -78,853 27,699 -21,163 -22,983 -24,599 Change in accounts receivable -44,671 62,997 12,893 -39,332 -26,094 -23,942 Change in inventories -33,637 -61,340 62,359 -5,842 -13,169 -15,766 Change in accounts payable 6,988 -66,145 21,655 29,452 19,539 17,928 Change in other current assets -8,321 -14,365 -69,208 -5,441 -3,259 -2,819
Investment cash flow (2) -80,042 -63,482 -64,483 -32,000 -33,800 -34,800 L-T asset (PPE/intangible) acquisition (capex) -86,000 -64,408 -70,907 -32,000 -33,800 -34,800 Change in investments, other assets 5,958 926 6,424 0 0 0
Free cash flow (3) = (1) + (2) -73,536 -88,965 4,257 -5,863 1,717 7,601
Financial cash flow (4) 97,167 101,299 -359 5,863 -1,717 -7,601 Dividends -5,455 -8,677 -9,361 -2,079 -4,229 -4,229 Change in interest-bearing debt 24,740 109,976 5,618 7,941 2,511 -3,372 Change in legal capital, capital surplus 77,882 0 3,384 0 0 0
(3) + (4) 23,631 12,334 3,898 -0 -0 0 Change in other -11,446 -25,489 13,320 0 0 -0
Change in cash & equivalents 12,185 -13,155 17,218 0 0 0
Source: Company data, Nomura estimates
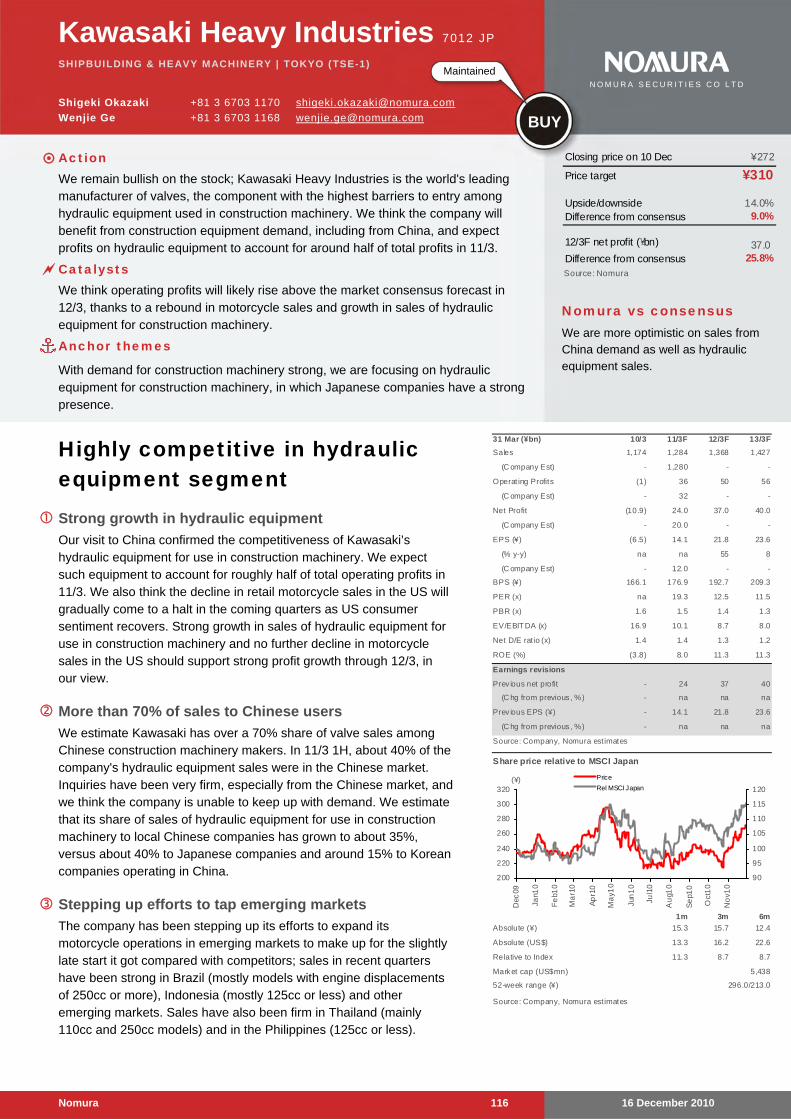
16 December 2010 Nomura 116
Kawasaki Heavy Industries 7012 JP
SHIPBUILDING & HEAVY MACHINERY | TOKYO (TSE-1)
Shigeki Okazaki +81 3 6703 1170 [email protected]
Wenjie Ge +81 3 6703 1168 [email protected]
Highly competitive in hydraulic equipment segment
Strong growth in hydraulic equipment
Our visit to China confirmed the competitiveness of Kawasaki’s hydraulic equipment for use in construction machinery. We expect such equipment to account for roughly half of total operating profits in 11/3. We also think the decline in retail motorcycle sales in the US will gradually come to a halt in the coming quarters as US consumer sentiment recovers. Strong growth in sales of hydraulic equipment for use in construction machinery and no further decline in motorcycle sales in the US should support strong profit growth through 12/3, in our view.
More than 70% of sales to Chinese users
We estimate Kawasaki has over a 70% share of valve sales among Chinese construction machinery makers. In 11/3 1H, about 40% of the company's hydraulic equipment sales were in the Chinese market. Inquiries have been very firm, especially from the Chinese market, and we think the company is unable to keep up with demand. We estimate that its share of sales of hydraulic equipment for use in construction machinery to local Chinese companies has grown to about 35%, versus about 40% to Japanese companies and around 15% to Korean companies operating in China.
Stepping up efforts to tap emerging markets
The company has been stepping up its efforts to expand its motorcycle operations in emerging markets to make up for the slightly late start it got compared with competitors; sales in recent quarters have been strong in Brazil (mostly models with engine displacements of 250cc or more), Indonesia (mostly 125cc or less) and other emerging markets. Sales have also been firm in Thailand (mainly 110cc and 250cc models) and in the Philippines (125cc or less).
31 Mar (¥bn) 10/3 11/3F 12/3F 13/3F
Sales 1,174 1,284 1,368 1,427
(C ompany Est) - 1,280 - -
Operat ing Profits (1) 36 50 56
(C ompany Est) - 32 - -
Net Profit (10.9) 24.0 37.0 40.0
(C ompany Est) - 20.0 - -
EPS (¥) (6.5) 14.1 21.8 23.6
(% y-y) na na 55 8
(C ompany Est) - 12.0 - -
BPS (¥) 166.1 176.9 192.7 209.3
PER (x) na 19.3 12.5 11.5
PBR (x) 1.6 1.5 1.4 1.3
EV/EBIT DA (x) 16.9 10.1 8.7 8.0
Net D/E rat io (x) 1.4 1.4 1.3 1.2
ROE (%) (3.8) 8.0 11.3 11.3
Earnings revisions
Prev ious net profit - 24 37 40
(C hg from previous , %) - na na na
Prev ious EPS (¥) - 14.1 21.8 23.6
(C hg from previous , %) - na na na
Source: Company, Nomura est imates
Share price relative to MSCI Japan
1m 3m 6m
15.3 15.7 12.4
13.3 16.2 22.6
11.3 8.7 8.7
Source: Company, Nomura est imates
5,438
52-week range (¥) 296.0/213.0
Relative to Index
Market cap (US$mn)
Absolute (¥)
Absolute (US$)
200
220
240
260
280
300
320
Dec
09
Jan1
0
Fe
b10
Ma
r10
Ap
r10
Ma
y10
Jun
10
Jul1
0
Au
g10
Se
p10
Oct
10
No
v10
90
95
100
105
110
115
120
Price
Rel MSCI Japan(¥)
Closing price on 10 Dec ¥272
Price target ¥310
Upside/downside 14.0%Difference from consensus 9.0%
12/3F net profit (¥bn) 37.0 Difference from consensus 25.8%Source: Nomura
Nomura vs consensus We are more optimistic on sales from China demand as well as hydraulic equipment sales.
Maintained
BUY
N O M U R A S E C U R I T I E S C O L T D
Action We remain bullish on the stock; Kawasaki Heavy Industries is the world's leading
manufacturer of valves, the component with the highest barriers to entry among hydraulic equipment used in construction machinery. We think the company will benefit from construction equipment demand, including from China, and expect profits on hydraulic equipment to account for around half of total profits in 11/3.
Catalysts We think operating profits will likely rise above the market consensus forecast in
12/3, thanks to a rebound in motorcycle sales and growth in sales of hydraulic equipment for construction machinery.
Anchor themes
With demand for construction machinery strong, we are focusing on hydraulic equipment for construction machinery, in which Japanese companies have a strong presence.
Kawasaki Heavy Industries Shigeki Okazaki
16 December 2010 Nomura 117
Business
BUY, price target of ¥310 Our visit to China confirmed the competitiveness of the company's hydraulic equipment for use in construction machinery. We expect such equipment to account for roughly half of total operating profits in 11/3. We also think the decline in retail sales of motorcycles for the US will come to a halt in coming quarters as US consumer sentiment recovers. We rate the company BUY, as we think that strong growth in sales of hydraulic equipment for use in construction machinery and the halt in the decline in motorcycle sales in the US will support strong profit growth through 12/3.
The basis for our price target is the average P/E for the NOMURA 400 based on our 12/3 EPS estimates. Thanks in part to growth in sales of hydraulic equipment, we forecast 12/3 EPS of ¥22, to which we apply the average P/E for the NOMURA 400 (14x), giving a price target of ¥310.
Firm sales of hydraulic equipment Peripheral surveys at the Bauma China international construction machinery exhibition confirmed for us that Kawasaki Heavy Industries’ (KHI) competitive position in the field of hydraulic equipment and the effect of its expansion of production capacity in terms of sales growth could be greater than we previously thought. We think the company has the potential to increase production capacity for hydraulic equipment used in construction machinery from ¥100bn sales equivalent in 10/3 to around ¥140bn over the next year. KHI has been increasing production capacity at its Nishi Kobe Works, which makes valves (an area of strength for the company), and at motor and pump factories in Suzhou and Zhejiang provinces, respectively.
We estimate Kawasaki has over a 70% share of valve sales among Chinese construction machinery makers. In 11/3 H1, about 40% of the company's hydraulic equipment sales were in the Chinese market. Inquiries have been very firm, especially from the Chinese market, and we think the company is unable to keep up with demand. Based on our meetings with KHI customers and suppliers, Lonking Holdings and Sany Heavy Industry are two of the company's main customers in China, we estimate that its share of sales of hydraulic equipment for use in construction machinery to Chinese companies has grown to about 35%, versus about 40% to Japanese companies and around 15% to Korean companies operating in China.
Valves are technically more difficult to make than other hydraulic equipment components such as pumps, motors and cylinders. Valves must be developed to the specifications of customers, which are construction machinery makers, and requires a strong understanding of how to control pressure. We think it will take two to three years for Dongyang Mechatronics of Korea, Jiangsu Hengli Highpressure Oil Cylinder (unlisted) of China, and other local Chinese and Korean parts makers to catch up. Sales of hydraulic equipment overseas are mostly denominated in yen, and thus the direct risk from yen appreciation is small.
Motorcycle: efforts in emerging markets Retail sales volume of motorcycles in the US declined by single digits y-y in October and November, indicating that declines are slowing from the 10% or so fall seen in Jul-Sep. Indicators such as US manufacturing ISM and CPI also appear to be bottoming, indicating to us that the risk of a sharp decline in demand through 12/3 has diminished. Inventory in distribution channels, including KHI’s own inventory, is still somewhat excessive, but we think the company is steadily paring this in line with its plan.
Strong growth in hydraulic equipment
Our price target is ¥310
Has more than 70% share of sales of valves to Chinese construction equipment makers
We look for North American motorcycle demand to bottom
Its edge in valves will likely continue
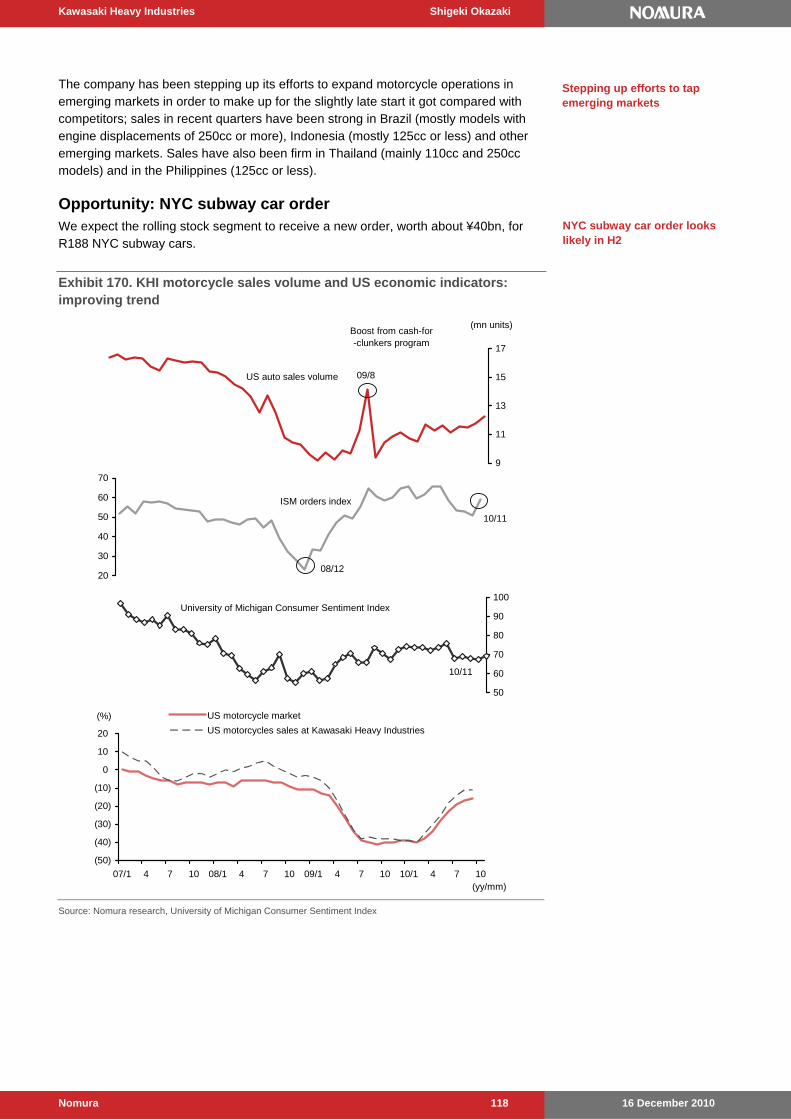
Kawasaki Heavy Industries Shigeki Okazaki
16 December 2010 Nomura 118
The company has been stepping up its efforts to expand motorcycle operations in emerging markets in order to make up for the slightly late start it got compared with competitors; sales in recent quarters have been strong in Brazil (mostly models with engine displacements of 250cc or more), Indonesia (mostly 125cc or less) and other emerging markets. Sales have also been firm in Thailand (mainly 110cc and 250cc models) and in the Philippines (125cc or less).
Opportunity: NYC subway car order We expect the rolling stock segment to receive a new order, worth about ¥40bn, for R188 NYC subway cars.
Exhibit 170. KHI motorcycle sales volume and US economic indicators: improving trend
(50)
(40)
(30)
(20)
(10)
0
10
20
07/1 4 7 10 08/1 4 7 10 09/1 4 7 10 10/1 4 7 10
US motorcycle market
US motorcycles sales at Kawasaki Heavy Industries
(yy/mm)
(%)
University of Michigan Consumer Sentiment Index
50
60
70
80
90
100
10/11
US auto sales volume
9
11
13
15
17
(mn units)Boost from cash-for-clunkers program
09/8
ISM orders index
20
30
40
50
60
70
08/12
10/11
Source: Nomura research, University of Michigan Consumer Sentiment Index
Stepping up efforts to tap emerging markets
NYC subway car order looks likely in H2

Kawasaki Heavy Industries Shigeki Okazaki
16 December 2010 Nomura 119
Profit forecasts and currency risk We expect the company to move into the black at the operating level in 11/3 with profits of ¥36bn, thanks to cost improvements for motorcycles and engines, as well as rapid growth in sales of hydraulic equipment. In 12/3, we expect operating profits to increase 38%, as earnings from hydraulic equipment continue to expand and those from the motorcycle & engine segment improve.
The greatest risk to our outlook is yen appreciation impacting the motorcycle & engine segment. We estimate that every ¥1 rise versus our dollar/yen assumption for 12/3 would have the effect of lowering our operating profits by about ¥1.9bn.
Risks to our call Risks to our call include 1) slower-than-expected motorcycle sales in Europe and Asia due to recession; 2) further appreciation of the Japanese Yen; 3) engine business earnings fall short; and 4) intensifying competition in the domestic marine business.
We forecast 38% growth in operating profits in 12/3
Greatest risk is a stronger yen, in our view
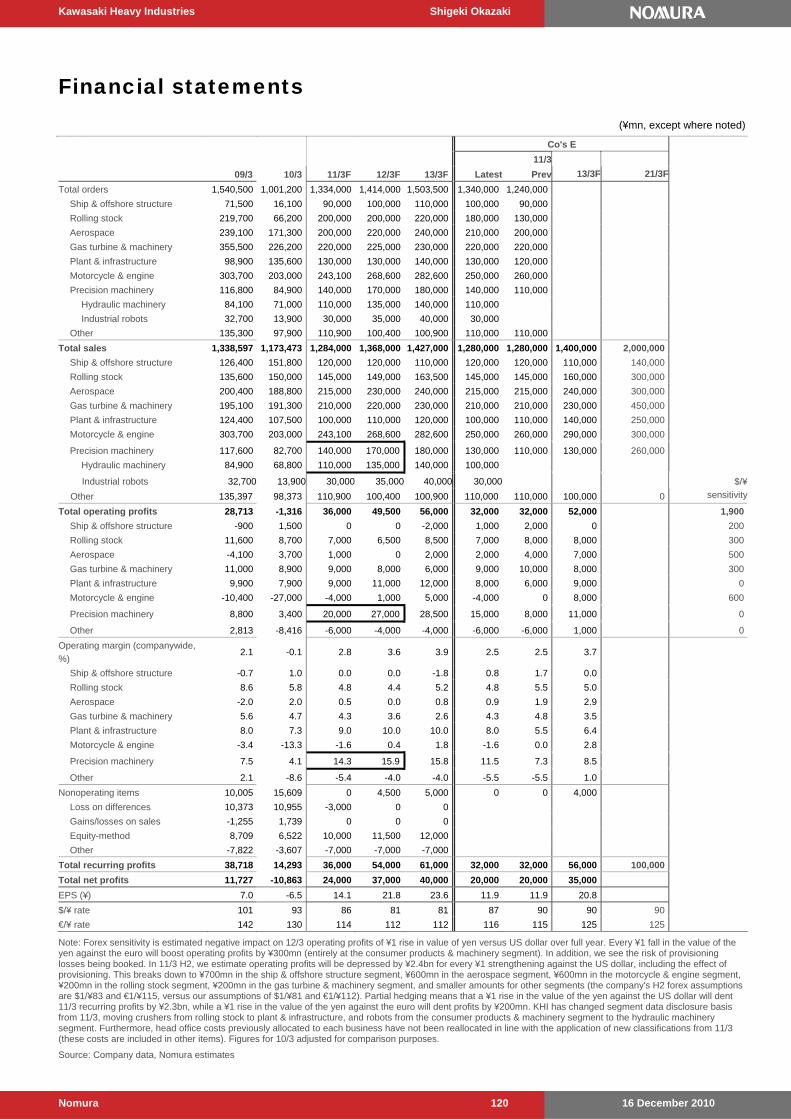
Kawasaki Heavy Industries Shigeki Okazaki
16 December 2010 Nomura 120
Financial statements
(¥mn, except where noted)
Co's E
11/3
09/3 10/3 11/3F 12/3F 13/3F Latest Prev 13/3F 21/3F
Total orders 1,540,500 1,001,200 1,334,000 1,414,000 1,503,500 1,340,000 1,240,000
Ship & offshore structure 71,500 16,100 90,000 100,000 110,000 100,000 90,000
Rolling stock 219,700 66,200 200,000 200,000 220,000 180,000 130,000
Aerospace 239,100 171,300 200,000 220,000 240,000 210,000 200,000
Gas turbine & machinery 355,500 226,200 220,000 225,000 230,000 220,000 220,000
Plant & infrastructure 98,900 135,600 130,000 130,000 140,000 130,000 120,000
Motorcycle & engine 303,700 203,000 243,100 268,600 282,600 250,000 260,000
Precision machinery 116,800 84,900 140,000 170,000 180,000 140,000 110,000
Hydraulic machinery 84,100 71,000 110,000 135,000 140,000 110,000
Industrial robots 32,700 13,900 30,000 35,000 40,000 30,000
Other 135,300 97,900 110,900 100,400 100,900 110,000 110,000
Total sales 1,338,597 1,173,473 1,284,000 1,368,000 1,427,000 1,280,000 1,280,000 1,400,000 2,000,000
Ship & offshore structure 126,400 151,800 120,000 120,000 110,000 120,000 120,000 110,000 140,000
Rolling stock 135,600 150,000 145,000 149,000 163,500 145,000 145,000 160,000 300,000
Aerospace 200,400 188,800 215,000 230,000 240,000 215,000 215,000 240,000 300,000
Gas turbine & machinery 195,100 191,300 210,000 220,000 230,000 210,000 210,000 230,000 450,000
Plant & infrastructure 124,400 107,500 100,000 110,000 120,000 100,000 110,000 140,000 250,000
Motorcycle & engine 303,700 203,000 243,100 268,600 282,600 250,000 260,000 290,000 300,000
Precision machinery 117,600 82,700 140,000 170,000 180,000 130,000 110,000 130,000 260,000
Hydraulic machinery 84,900 68,800 110,000 135,000 140,000 100,000
Industrial robots 32,700 13,900 30,000 35,000 40,000 30,000
Other 135,397 98,373 110,900 100,400 100,900 110,000 110,000 100,000 0
$/¥
sensitivity
Total operating profits 28,713 -1,316 36,000 49,500 56,000 32,000 32,000 52,000 1,900
Ship & offshore structure -900 1,500 0 0 -2,000 1,000 2,000 0 200
Rolling stock 11,600 8,700 7,000 6,500 8,500 7,000 8,000 8,000 300
Aerospace -4,100 3,700 1,000 0 2,000 2,000 4,000 7,000 500
Gas turbine & machinery 11,000 8,900 9,000 8,000 6,000 9,000 10,000 8,000 300
Plant & infrastructure 9,900 7,900 9,000 11,000 12,000 8,000 6,000 9,000 0
Motorcycle & engine -10,400 -27,000 -4,000 1,000 5,000 -4,000 0 8,000 600
Precision machinery 8,800 3,400 20,000 27,000 28,500 15,000 8,000 11,000 0
Other 2,813 -8,416 -6,000 -4,000 -4,000 -6,000 -6,000 1,000 0
Operating margin (companywide,
%) 2.1 -0.1 2.8 3.6 3.9 2.5 2.5 3.7
Ship & offshore structure -0.7 1.0 0.0 0.0 -1.8 0.8 1.7 0.0
Rolling stock 8.6 5.8 4.8 4.4 5.2 4.8 5.5 5.0
Aerospace -2.0 2.0 0.5 0.0 0.8 0.9 1.9 2.9
Gas turbine & machinery 5.6 4.7 4.3 3.6 2.6 4.3 4.8 3.5
Plant & infrastructure 8.0 7.3 9.0 10.0 10.0 8.0 5.5 6.4
Motorcycle & engine -3.4 -13.3 -1.6 0.4 1.8 -1.6 0.0 2.8
Precision machinery 7.5 4.1 14.3 15.9 15.8 11.5 7.3 8.5
Other 2.1 -8.6 -5.4 -4.0 -4.0 -5.5 -5.5 1.0
Nonoperating items 10,005 15,609 0 4,500 5,000 0 0 4,000
Loss on differences 10,373 10,955 -3,000 0 0
Gains/losses on sales -1,255 1,739 0 0 0
Equity-method 8,709 6,522 10,000 11,500 12,000
Other -7,822 -3,607 -7,000 -7,000 -7,000
Total recurring profits 38,718 14,293 36,000 54,000 61,000 32,000 32,000 56,000 100,000
Total net profits 11,727 -10,863 24,000 37,000 40,000 20,000 20,000 35,000
EPS (¥) 7.0 -6.5 14.1 21.8 23.6 11.9 11.9 20.8
$/¥ rate 101 93 86 81 81 87 90 90 90
€/¥ rate 142 130 114 112 112 116 115 125 125
Note: Forex sensitivity is estimated negative impact on 12/3 operating profits of ¥1 rise in value of yen versus US dollar over full year. Every ¥1 fall in the value of the yen against the euro will boost operating profits by ¥300mn (entirely at the consumer products & machinery segment). In addition, we see the risk of provisioning losses being booked. In 11/3 H2, we estimate operating profits will be depressed by ¥2.4bn for every ¥1 strengthening against the US dollar, including the effect of provisioning. This breaks down to ¥700mn in the ship & offshore structure segment, ¥600mn in the aerospace segment, ¥600mn in the motorcycle & engine segment, ¥200mn in the rolling stock segment, ¥200mn in the gas turbine & machinery segment, and smaller amounts for other segments (the company's H2 forex assumptions are $1/¥83 and €1/¥115, versus our assumptions of $1/¥81 and €1/¥112). Partial hedging means that a ¥1 rise in the value of the yen against the US dollar will dent 11/3 recurring profits by ¥2.3bn, while a ¥1 rise in the value of the yen against the euro will dent profits by ¥200mn. KHI has changed segment data disclosure basis from 11/3, moving crushers from rolling stock to plant & infrastructure, and robots from the consumer products & machinery segment to the hydraulic machinery segment. Furthermore, head office costs previously allocated to each business have not been reallocated in line with the application of new classifications from 11/3 (these costs are included in other items). Figures for 10/3 adjusted for comparison purposes.
Source: Company data, Nomura estimates
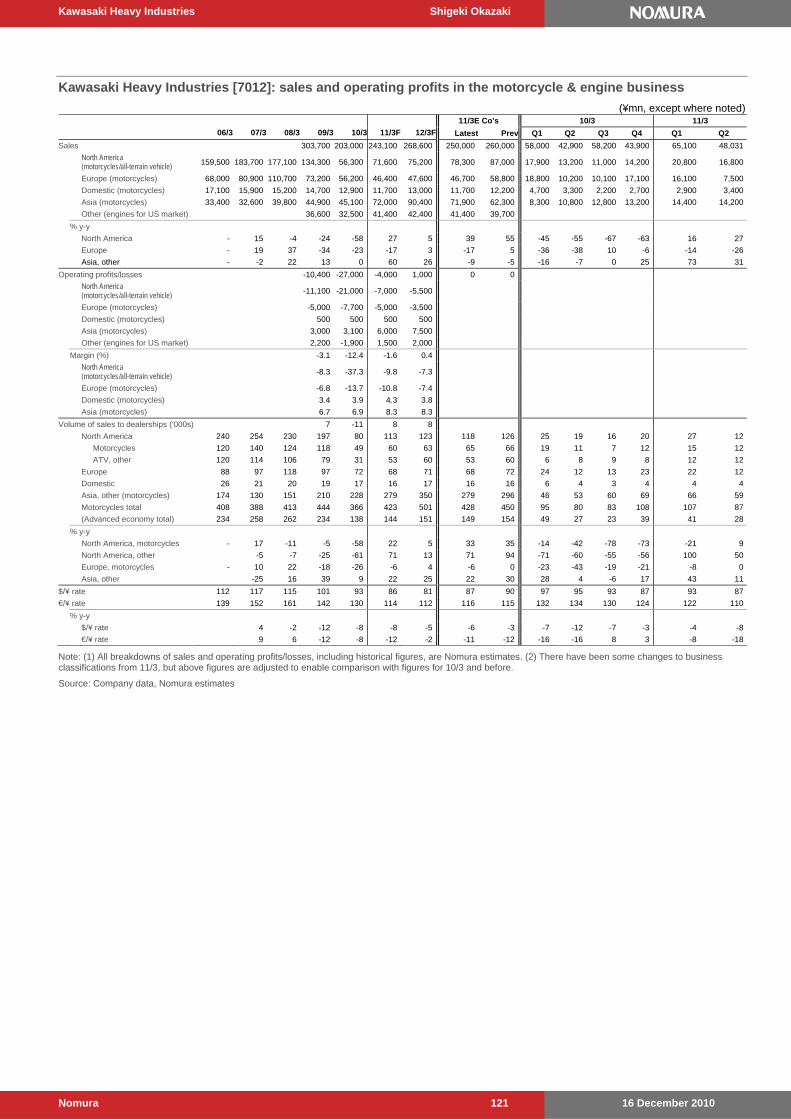
Kawasaki Heavy Industries Shigeki Okazaki
16 December 2010 Nomura 121
Kawasaki Heavy Industries [7012]: sales and operating profits in the motorcycle & engine business
(¥mn, except where noted) 11/3E Co's 10/3 11/3
06/3 07/3 08/3 09/3 10/3 11/3F 12/3F Latest Prev Q1 Q2 Q3 Q4 Q1 Q2
Sales 303,700 203,000 243,100 268,600 250,000 260,000 58,000 42,900 58,200 43,900 65,100 48,031
North America (motorcycles/all-terrain vehicle) 159,500 183,700 177,100 134,300 56,300 71,600 75,200 78,300 87,000 17,900 13,200 11,000 14,200 20,800 16,800
Europe (motorcycles) 68,000 80,900 110,700 73,200 56,200 46,400 47,600 46,700 58,800 18,800 10,200 10,100 17,100 16,100 7,500
Domestic (motorcycles) 17,100 15,900 15,200 14,700 12,900 11,700 13,000 11,700 12,200 4,700 3,300 2,200 2,700 2,900 3,400
Asia (motorcycles) 33,400 32,600 39,800 44,900 45,100 72,000 90,400 71,900 62,300 8,300 10,800 12,800 13,200 14,400 14,200
Other (engines for US market) 36,600 32,500 41,400 42,400 41,400 39,700
% y-y
North America - 15 -4 -24 -58 27 5 39 55 -45 -55 -67 -63 16 27
Europe - 19 37 -34 -23 -17 3 -17 5 -36 -38 10 -6 -14 -26
Asia, other - -2 22 13 0 60 26 -9 -5 -16 -7 0 25 73 31
Operating profits/losses -10,400 -27,000 -4,000 1,000 0 0
North America (motorcycles/all-terrain vehicle) -11,100 -21,000 -7,000 -5,500
Europe (motorcycles) -5,000 -7,700 -5,000 -3,500
Domestic (motorcycles) 500 500 500 500
Asia (motorcycles) 3,000 3,100 6,000 7,500
Other (engines for US market) 2,200 -1,900 1,500 2,000
Margin (%) -3.1 -12.4 -1.6 0.4
North America (motorcycles/all-terrain vehicle) -8.3 -37.3 -9.8 -7.3
Europe (motorcycles) -6.8 -13.7 -10.8 -7.4
Domestic (motorcycles) 3.4 3.9 4.3 3.8
Asia (motorcycles) 6.7 6.9 8.3 8.3
Volume of sales to dealerships (‘000s) 7 -11 8 8
North America 240 254 230 197 80 113 123 118 126 25 19 16 20 27 12
Motorcycles 120 140 124 118 49 60 63 65 66 19 11 7 12 15 12
ATV, other 120 114 106 79 31 53 60 53 60 6 8 9 8 12 12
Europe 88 97 118 97 72 68 71 68 72 24 12 13 23 22 12
Domestic 26 21 20 19 17 16 17 16 16 6 4 3 4 4 4
Asia, other (motorcycles) 174 130 151 210 228 279 350 279 296 46 53 60 69 66 59
Motorcycles total 408 388 413 444 366 423 501 428 450 95 80 83 108 107 87
(Advanced economy total) 234 258 262 234 138 144 151 149 154 49 27 23 39 41 28
% y-y
North America, motorcycles - 17 -11 -5 -58 22 5 33 35 -14 -42 -78 -73 -21 9
North America, other -5 -7 -25 -61 71 13 71 94 -71 -60 -55 -56 100 50
Europe, motorcycles - 10 22 -18 -26 -6 4 -6 0 -23 -43 -19 -21 -8 0
Asia, other -25 16 39 9 22 25 22 30 28 4 -6 17 43 11
$/¥ rate 112 117 115 101 93 86 81 87 90 97 95 93 87 93 87
€/¥ rate 139 152 161 142 130 114 112 116 115 132 134 130 124 122 110
% y-y
$/¥ rate 4 -2 -12 -8 -8 -5 -6 -3 -7 -12 -7 -3 -4 -8
€/¥ rate 9 6 -12 -8 -12 -2 -11 -12 -16 -16 8 3 -8 -18
Note: (1) All breakdowns of sales and operating profits/losses, including historical figures, are Nomura estimates. (2) There have been some changes to business classifications from 11/3, but above figures are adjusted to enable comparison with figures for 10/3 and before.
Source: Company data, Nomura estimates
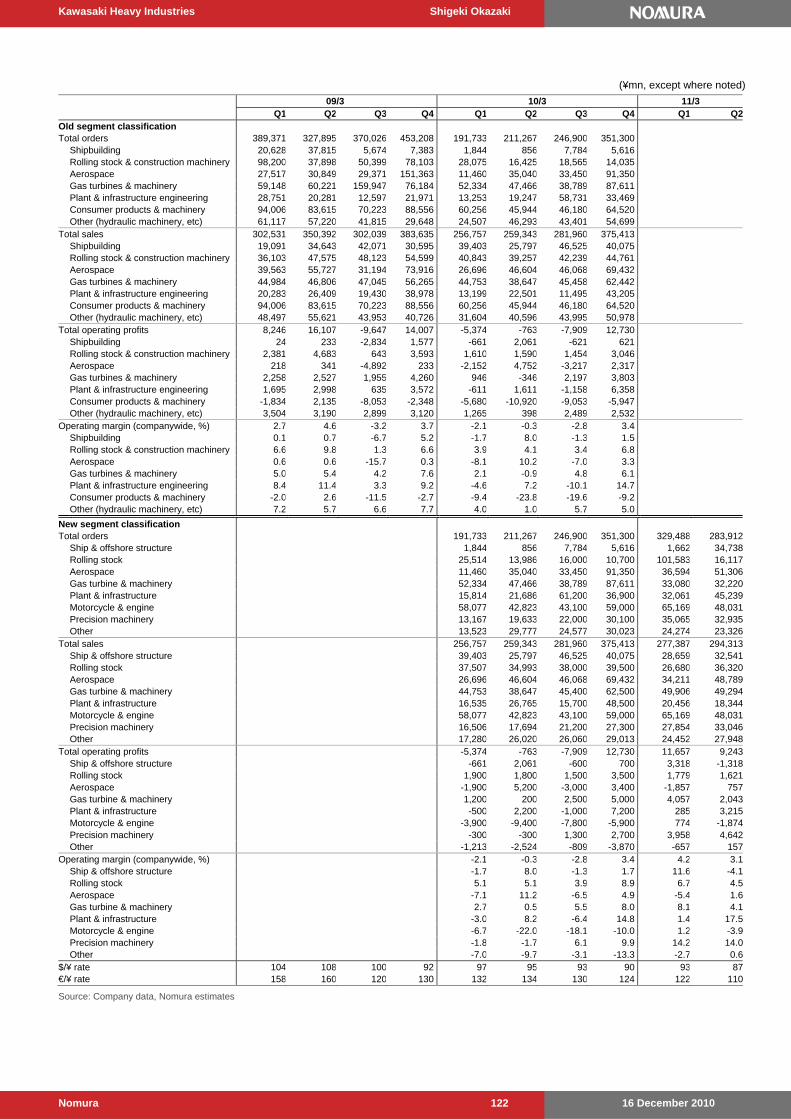
Kawasaki Heavy Industries Shigeki Okazaki
16 December 2010 Nomura 122
(¥mn, except where noted)
09/3 10/3 11/3 Q1 Q2 Q3 Q4 Q1 Q2 Q3 Q4 Q1 Q2Old segment classification Total orders 389,371 327,895 370,026 453,208 191,733 211,267 246,900 351,300 Shipbuilding 20,628 37,815 5,674 7,383 1,844 856 7,784 5,616 Rolling stock & construction machinery 98,200 37,898 50,399 78,103 28,075 16,425 18,565 14,035 Aerospace 27,517 30,849 29,371 151,363 11,460 35,040 33,450 91,350 Gas turbines & machinery 59,148 60,221 159,947 76,184 52,334 47,466 38,789 87,611 Plant & infrastructure engineering 28,751 20,281 12,597 21,971 13,253 19,247 58,731 33,469 Consumer products & machinery 94,006 83,615 70,223 88,556 60,256 45,944 46,180 64,520 Other (hydraulic machinery, etc) 61,117 57,220 41,815 29,648 24,507 46,293 43,401 54,699 Total sales 302,531 350,392 302,039 383,635 256,757 259,343 281,960 375,413 Shipbuilding 19,091 34,643 42,071 30,595 39,403 25,797 46,525 40,075 Rolling stock & construction machinery 36,103 47,575 48,123 54,599 40,843 39,257 42,239 44,761 Aerospace 39,563 55,727 31,194 73,916 26,696 46,604 46,068 69,432 Gas turbines & machinery 44,984 46,806 47,045 56,265 44,753 38,647 45,458 62,442 Plant & infrastructure engineering 20,283 26,409 19,430 38,978 13,199 22,501 11,495 43,205 Consumer products & machinery 94,006 83,615 70,223 88,556 60,256 45,944 46,180 64,520 Other (hydraulic machinery, etc) 48,497 55,621 43,953 40,726 31,604 40,596 43,995 50,978 Total operating profits 8,246 16,107 -9,647 14,007 -5,374 -763 -7,909 12,730 Shipbuilding 24 233 -2,834 1,577 -661 2,061 -621 621 Rolling stock & construction machinery 2,381 4,683 643 3,593 1,610 1,590 1,454 3,046 Aerospace 218 341 -4,892 233 -2,152 4,752 -3,217 2,317 Gas turbines & machinery 2,258 2,527 1,955 4,260 946 -346 2,197 3,803 Plant & infrastructure engineering 1,695 2,998 635 3,572 -611 1,611 -1,158 6,358 Consumer products & machinery -1,834 2,135 -8,053 -2,348 -5,680 -10,920 -9,053 -5,947 Other (hydraulic machinery, etc) 3,504 3,190 2,899 3,120 1,265 398 2,489 2,532 Operating margin (companywide, %) 2.7 4.6 -3.2 3.7 -2.1 -0.3 -2.8 3.4 Shipbuilding 0.1 0.7 -6.7 5.2 -1.7 8.0 -1.3 1.5 Rolling stock & construction machinery 6.6 9.8 1.3 6.6 3.9 4.1 3.4 6.8 Aerospace 0.6 0.6 -15.7 0.3 -8.1 10.2 -7.0 3.3 Gas turbines & machinery 5.0 5.4 4.2 7.6 2.1 -0.9 4.8 6.1 Plant & infrastructure engineering 8.4 11.4 3.3 9.2 -4.6 7.2 -10.1 14.7 Consumer products & machinery -2.0 2.6 -11.5 -2.7 -9.4 -23.8 -19.6 -9.2 Other (hydraulic machinery, etc) 7.2 5.7 6.6 7.7 4.0 1.0 5.7 5.0
New segment classification Total orders 191,733 211,267 246,900 351,300 329,488 283,912 Ship & offshore structure 1,844 856 7,784 5,616 1,662 34,738 Rolling stock 25,514 13,986 16,000 10,700 101,583 16,117 Aerospace 11,460 35,040 33,450 91,350 36,594 51,306 Gas turbine & machinery 52,334 47,466 38,789 87,611 33,080 32,220 Plant & infrastructure 15,814 21,686 61,200 36,900 32,061 45,239 Motorcycle & engine 58,077 42,823 43,100 59,000 65,169 48,031 Precision machinery 13,167 19,633 22,000 30,100 35,065 32,935 Other 13,523 29,777 24,577 30,023 24,274 23,326Total sales 256,757 259,343 281,960 375,413 277,387 294,313 Ship & offshore structure 39,403 25,797 46,525 40,075 28,659 32,541 Rolling stock 37,507 34,993 38,000 39,500 26,680 36,320 Aerospace 26,696 46,604 46,068 69,432 34,211 48,789 Gas turbine & machinery 44,753 38,647 45,400 62,500 49,906 49,294 Plant & infrastructure 16,535 26,765 15,700 48,500 20,456 18,344 Motorcycle & engine 58,077 42,823 43,100 59,000 65,169 48,031 Precision machinery 16,506 17,694 21,200 27,300 27,854 33,046 Other 17,280 26,020 26,060 29,013 24,452 27,948Total operating profits -5,374 -763 -7,909 12,730 11,657 9,243 Ship & offshore structure -661 2,061 -600 700 3,318 -1,318 Rolling stock 1,900 1,800 1,500 3,500 1,779 1,621 Aerospace -1,900 5,200 -3,000 3,400 -1,857 757 Gas turbine & machinery 1,200 200 2,500 5,000 4,057 2,043 Plant & infrastructure -500 2,200 -1,000 7,200 285 3,215 Motorcycle & engine -3,900 -9,400 -7,800 -5,900 774 -1,874 Precision machinery -300 -300 1,300 2,700 3,958 4,642 Other -1,213 -2,524 -809 -3,870 -657 157Operating margin (companywide, %) -2.1 -0.3 -2.8 3.4 4.2 3.1 Ship & offshore structure -1.7 8.0 -1.3 1.7 11.6 -4.1 Rolling stock 5.1 5.1 3.9 8.9 6.7 4.5 Aerospace -7.1 11.2 -6.5 4.9 -5.4 1.6 Gas turbine & machinery 2.7 0.5 5.5 8.0 8.1 4.1 Plant & infrastructure -3.0 8.2 -6.4 14.8 1.4 17.5 Motorcycle & engine -6.7 -22.0 -18.1 -10.0 1.2 -3.9 Precision machinery -1.8 -1.7 6.1 9.9 14.2 14.0 Other -7.0 -9.7 -3.1 -13.3 -2.7 0.6$/¥ rate 104 108 100 92 97 95 93 90 93 87€/¥ rate 158 160 120 130 132 134 130 124 122 110
Source: Company data, Nomura estimates
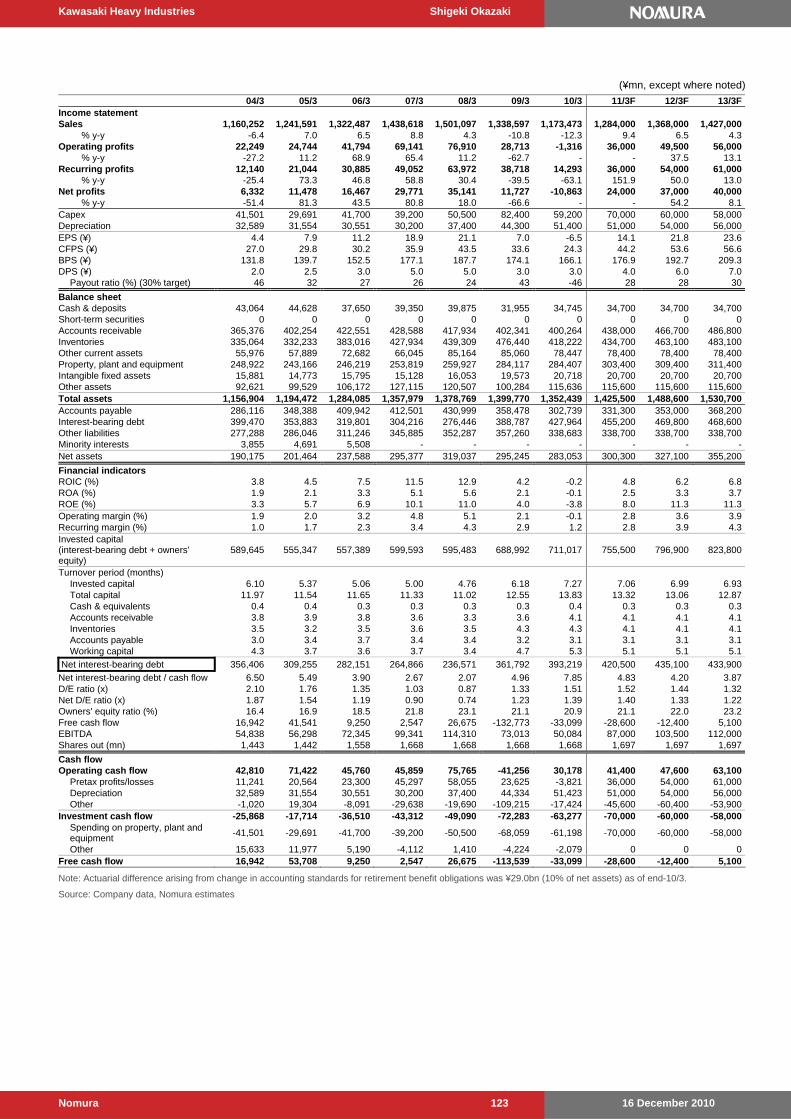
Kawasaki Heavy Industries Shigeki Okazaki
16 December 2010 Nomura 123
(¥mn, except where noted)
04/3 05/3 06/3 07/3 08/3 09/3 10/3 11/3F 12/3F 13/3FIncome statement Sales 1,160,252 1,241,591 1,322,487 1,438,618 1,501,097 1,338,597 1,173,473 1,284,000 1,368,000 1,427,000 % y-y -6.4 7.0 6.5 8.8 4.3 -10.8 -12.3 9.4 6.5 4.3Operating profits 22,249 24,744 41,794 69,141 76,910 28,713 -1,316 36,000 49,500 56,000 % y-y -27.2 11.2 68.9 65.4 11.2 -62.7 - - 37.5 13.1Recurring profits 12,140 21,044 30,885 49,052 63,972 38,718 14,293 36,000 54,000 61,000 % y-y -25.4 73.3 46.8 58.8 30.4 -39.5 -63.1 151.9 50.0 13.0Net profits 6,332 11,478 16,467 29,771 35,141 11,727 -10,863 24,000 37,000 40,000 % y-y -51.4 81.3 43.5 80.8 18.0 -66.6 - - 54.2 8.1Capex 41,501 29,691 41,700 39,200 50,500 82,400 59,200 70,000 60,000 58,000Depreciation 32,589 31,554 30,551 30,200 37,400 44,300 51,400 51,000 54,000 56,000EPS (¥) 4.4 7.9 11.2 18.9 21.1 7.0 -6.5 14.1 21.8 23.6CFPS (¥) 27.0 29.8 30.2 35.9 43.5 33.6 24.3 44.2 53.6 56.6BPS (¥) 131.8 139.7 152.5 177.1 187.7 174.1 166.1 176.9 192.7 209.3DPS (¥) 2.0 2.5 3.0 5.0 5.0 3.0 3.0 4.0 6.0 7.0 Payout ratio (%) (30% target) 46 32 27 26 24 43 -46 28 28 30
Balance sheet Cash & deposits 43,064 44,628 37,650 39,350 39,875 31,955 34,745 34,700 34,700 34,700Short-term securities 0 0 0 0 0 0 0 0 0 0Accounts receivable 365,376 402,254 422,551 428,588 417,934 402,341 400,264 438,000 466,700 486,800Inventories 335,064 332,233 383,016 427,934 439,309 476,440 418,222 434,700 463,100 483,100Other current assets 55,976 57,889 72,682 66,045 85,164 85,060 78,447 78,400 78,400 78,400Property, plant and equipment 248,922 243,166 246,219 253,819 259,927 284,117 284,407 303,400 309,400 311,400Intangible fixed assets 15,881 14,773 15,795 15,128 16,053 19,573 20,718 20,700 20,700 20,700Other assets 92,621 99,529 106,172 127,115 120,507 100,284 115,636 115,600 115,600 115,600Total assets 1,156,904 1,194,472 1,284,085 1,357,979 1,378,769 1,399,770 1,352,439 1,425,500 1,488,600 1,530,700Accounts payable 286,116 348,388 409,942 412,501 430,999 358,478 302,739 331,300 353,000 368,200Interest-bearing debt 399,470 353,883 319,801 304,216 276,446 388,787 427,964 455,200 469,800 468,600Other liabilities 277,288 286,046 311,246 345,885 352,287 357,260 338,683 338,700 338,700 338,700Minority interests 3,855 4,691 5,508 - - - - - - -Net assets 190,175 201,464 237,588 295,377 319,037 295,245 283,053 300,300 327,100 355,200
Financial indicators ROIC (%) 3.8 4.5 7.5 11.5 12.9 4.2 -0.2 4.8 6.2 6.8ROA (%) 1.9 2.1 3.3 5.1 5.6 2.1 -0.1 2.5 3.3 3.7ROE (%) 3.3 5.7 6.9 10.1 11.0 4.0 -3.8 8.0 11.3 11.3Operating margin (%) 1.9 2.0 3.2 4.8 5.1 2.1 -0.1 2.8 3.6 3.9Recurring margin (%) 1.0 1.7 2.3 3.4 4.3 2.9 1.2 2.8 3.9 4.3Invested capital (interest-bearing debt + owners' equity)
589,645 555,347 557,389 599,593 595,483 688,992 711,017 755,500 796,900 823,800
Turnover period (months) Invested capital 6.10 5.37 5.06 5.00 4.76 6.18 7.27 7.06 6.99 6.93 Total capital 11.97 11.54 11.65 11.33 11.02 12.55 13.83 13.32 13.06 12.87 Cash & equivalents 0.4 0.4 0.3 0.3 0.3 0.3 0.4 0.3 0.3 0.3 Accounts receivable 3.8 3.9 3.8 3.6 3.3 3.6 4.1 4.1 4.1 4.1 Inventories 3.5 3.2 3.5 3.6 3.5 4.3 4.3 4.1 4.1 4.1 Accounts payable 3.0 3.4 3.7 3.4 3.4 3.2 3.1 3.1 3.1 3.1 Working capital 4.3 3.7 3.6 3.7 3.4 4.7 5.3 5.1 5.1 5.1
Net interest-bearing debt 356,406 309,255 282,151 264,866 236,571 361,792 393,219 420,500 435,100 433,900
Net interest-bearing debt / cash flow 6.50 5.49 3.90 2.67 2.07 4.96 7.85 4.83 4.20 3.87D/E ratio (x) 2.10 1.76 1.35 1.03 0.87 1.33 1.51 1.52 1.44 1.32Net D/E ratio (x) 1.87 1.54 1.19 0.90 0.74 1.23 1.39 1.40 1.33 1.22Owners' equity ratio (%) 16.4 16.9 18.5 21.8 23.1 21.1 20.9 21.1 22.0 23.2Free cash flow 16,942 41,541 9,250 2,547 26,675 -132,773 -33,099 -28,600 -12,400 5,100EBITDA 54,838 56,298 72,345 99,341 114,310 73,013 50,084 87,000 103,500 112,000Shares out (mn) 1,443 1,442 1,558 1,668 1,668 1,668 1,668 1,697 1,697 1,697
Cash flow Operating cash flow 42,810 71,422 45,760 45,859 75,765 -41,256 30,178 41,400 47,600 63,100 Pretax profits/losses 11,241 20,564 23,300 45,297 58,055 23,625 -3,821 36,000 54,000 61,000 Depreciation 32,589 31,554 30,551 30,200 37,400 44,334 51,423 51,000 54,000 56,000 Other -1,020 19,304 -8,091 -29,638 -19,690 -109,215 -17,424 -45,600 -60,400 -53,900Investment cash flow -25,868 -17,714 -36,510 -43,312 -49,090 -72,283 -63,277 -70,000 -60,000 -58,000
Spending on property, plant and equipment
-41,501 -29,691 -41,700 -39,200 -50,500 -68,059 -61,198 -70,000 -60,000 -58,000
Other 15,633 11,977 5,190 -4,112 1,410 -4,224 -2,079 0 0 0Free cash flow 16,942 53,708 9,250 2,547 26,675 -113,539 -33,099 -28,600 -12,400 5,100
Note: Actuarial difference arising from change in accounting standards for retirement benefit obligations was ¥29.0bn (10% of net assets) as of end-10/3.
Source: Company data, Nomura estimates
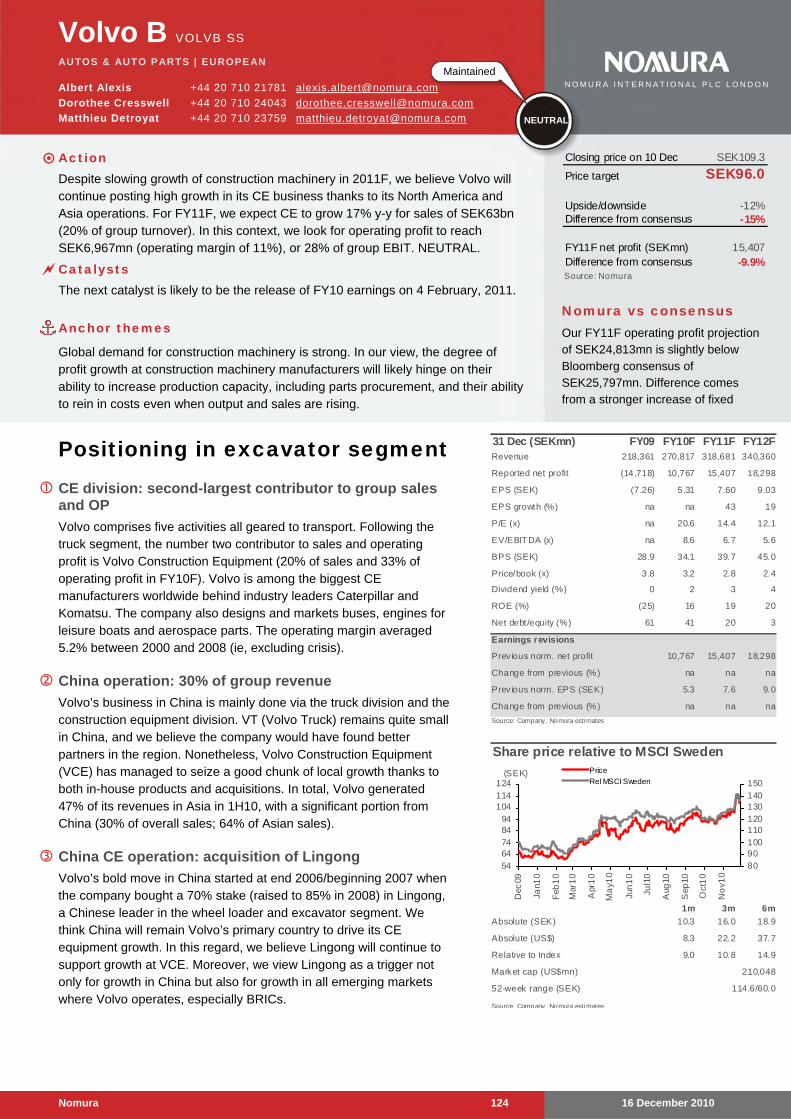
16 December 2010 Nomura 124
Volvo B VOLVB SS
AUTOS & AUTO PARTS | EUROPEAN
Albert Alexis +44 20 710 21781 [email protected]
Dorothee Cresswell +44 20 710 24043 [email protected]
Matthieu Detroyat +44 20 710 23759 [email protected]
Positioning in excavator segment CE division: second-largest contributor to group sales
and OP
Volvo comprises five activities all geared to transport. Following the truck segment, the number two contributor to sales and operating profit is Volvo Construction Equipment (20% of sales and 33% of operating profit in FY10F). Volvo is among the biggest CE manufacturers worldwide behind industry leaders Caterpillar and Komatsu. The company also designs and markets buses, engines for leisure boats and aerospace parts. The operating margin averaged 5.2% between 2000 and 2008 (ie, excluding crisis).
China operation: 30% of group revenue
Volvo’s business in China is mainly done via the truck division and the construction equipment division. VT (Volvo Truck) remains quite small in China, and we believe the company would have found better partners in the region. Nonetheless, Volvo Construction Equipment (VCE) has managed to seize a good chunk of local growth thanks to both in-house products and acquisitions. In total, Volvo generated 47% of its revenues in Asia in 1H10, with a significant portion from China (30% of overall sales; 64% of Asian sales).
China CE operation: acquisition of Lingong
Volvo’s bold move in China started at end 2006/beginning 2007 when the company bought a 70% stake (raised to 85% in 2008) in Lingong, a Chinese leader in the wheel loader and excavator segment. We think China will remain Volvo’s primary country to drive its CE equipment growth. In this regard, we believe Lingong will continue to support growth at VCE. Moreover, we view Lingong as a trigger not only for growth in China but also for growth in all emerging markets where Volvo operates, especially BRICs.
31 Dec (SEKmn) FY09 FY10F FY11F FY12FRevenue 218,361 270,817 318,681 340,360
Reported net profit (14,718) 10,767 15,407 18,298
EPS (SEK) (7.26) 5.31 7.60 9.03
EPS growth (%) na na 43 19
P/E (x) na 20.6 14.4 12.1
EV/EBIT DA (x) na 8.6 6.7 5.6
BPS (SEK) 28.9 34.1 39.7 45.0
Price/book (x) 3.8 3.2 2.8 2.4
Dividend yield (%) 0 2 3 4
ROE (%) (25) 16 19 20
Net debt/equity (%) 61 41 20 3
Earnings revisions
Prev ious norm. net profit 10,767 15,407 18,298
Change from previous (%) na na na
Prev ious norm. EPS (SEK) 5.3 7.6 9.0
Change from previous (%) na na na
Source: Company, Nomura estimates
Share price relative to MSCI Sweden
1m 3m 6m
10.3 16.0 18.9
8.3 22.2 37.7
9.0 10.8 14.9
Source: Company, Nomura estimates
210,048
52-week range (SEK) 114.6/60.0
Absolute (SEK)
Absolute (US$)
Relative to Index
Market cap (US$mn)
5464748494
104114124
Dec
09
Jan1
0
Feb
10
Mar
10
Apr
10
Ma
y10
Jun
10
Jul1
0
Aug
10
Sep
10
Oct
10
No
v10
8090100110120130140150
Price
Rel MSCI Sweden(SEK)
Closing price on 10 Dec SEK109.3
Price target SEK96.0
Upside/downside -12%Difference from consensus -15%
FY11F net profit (SEKmn) 15,407Difference from consensus -9.9%Source: Nomura
Nomura vs consensus Our FY11F operating profit projection of SEK24,813mn is slightly below Bloomberg consensus of SEK25,797mn. Difference comes from a stronger increase of fixed
Maintained
NEUTRAL
N O M U R A I N T E R N A T I O N A L P L C L O N D O N
Action Despite slowing growth of construction machinery in 2011F, we believe Volvo will
continue posting high growth in its CE business thanks to its North America and Asia operations. For FY11F, we expect CE to grow 17% y-y for sales of SEK63bn (20% of group turnover). In this context, we look for operating profit to reach SEK6,967mn (operating margin of 11%), or 28% of group EBIT. NEUTRAL.
Catalysts The next catalyst is likely to be the release of FY10 earnings on 4 February, 2011.
Anchor themes
Global demand for construction machinery is strong. In our view, the degree of profit growth at construction machinery manufacturers will likely hinge on their ability to increase production capacity, including parts procurement, and their ability to rein in costs even when output and sales are rising.
Volvo B Albert Alexis
16 December 2010 Nomura 125
Drilling down
NEUTRAL, price target SEK96.0 Over the past few years, Volvo has strongly increased its business in China with some successes and failures. The disappointment, in our view, would be the lack of a strong partnership in the truck division. In contrast, however, the acquisition of Lingong (a Chinese construction equipment company) could be viewed as the best recent move of Volvo in the construction machinery segment. Despite this exposure, we maintain our NEUTRAL rating on Volvo. We appreciate the restructuring work done by the company during the crisis and believe it will continue to benefit from the recovery of both the truck market and the CE market. Nevertheless, the current valuation fully discounts this recovery, in our view. Volvo currently trades on 2011/2012 EV/sales of 72% (slightly above the average of around 70%) and EV/EBITDA of 6.7x/5.6x.
Our earnings multiple-based price target stands at SEK96, based on a normalised total profit margin of 7.5%, turnover of SEK305bn and a P/E multiple of 14x (long-term average). Worsening of the economies of the US and emerging markets, such as China, would be the main risk to our target price. We believe investors continue to see Volvo as a good proxy to North America (around 16% of sales) among the truck manufacturers in Europe. As a result, slow growth of the truck market in the US could hurt the share price. As for China, the company’s main exposure is the construction equipment market. Upside risk to our price target would be higher-than-expected growth in the US and China markets.
Company overview Volvo comprises five activities all geared to transport. Following the disposal of Volvo Cars in 1999 and the acquisition of Renault Véhicules Industriels (RVI) in 2001 and Nissan Diesel (UD) in 2007, Volvo is the world’s number-two truck maker by market share thanks to its four brands (Mack, Renault, Volvo and UD). After trucks (66% of sales), the number two contributor to sales and operating profit is Volvo Construction Equipment (20% of 2010 sales and 33% of 2010 operating profit). Volvo is among the biggest CE manufacturers in the world, behind industry leaders Caterpillar and Komatsu. Volvo also designs and markets buses, engines for leisure boats and aerospace parts. The company’s operating margin averaged 5.2% between 2000 and 2008 (ie, excluding the crisis).
Business in China Volvo’s business in China is conducted mainly via its truck and construction equipment divisions. VT (Volvo Truck) remains quite small in China, and we believe the company’s success has been limited by its choice of partners. In total, Asia accounted for 32% of 2009 sales (contributing SEK25bn), but only 4% of that total was from China, or only slightly more than 1% of VT’s revenues. When it comes to Volvo Construction Equipment (VCE), the situation is quite different, and the company has managed to seize a good chunk of the local growth thanks to both in-house products and acquisitions. In total, Volvo generated 47% of its revenues in Asia in H1 2010, with a significant portion from China (30% of total sales; 64% of Asian sales).
Volvo B Albert Alexis
16 December 2010 Nomura 126
The bold move in China started at end-2006/early 2007 when Volvo bought a stake (70% increased to 85% in 2008) in Lingong, a Chinese leader on the wheel loader and excavator segment. According to data provided by the company, Volvo/Lingong owns 8.3% of the Chinese VE market, making it the fourth largest player in the region after Liugong (13.2% market share), Longong (11.1%) and Xiegong (10%). However, the share of Volvo on the specific excavator segment is smaller. According to data collected by Nomura, Volvo’s excavator market share was 4.3% in the period January to October 2010, up from 3.2% in FY2009. Lingong is better known in China under the brand SDLG. The brand has a good dealership network with 107 sales agents and a sales force of 1,620. Lingong was established in 1972 and moved to brand new facilities in 2005.
Going forward, China will continue to represent the main growth region for CE equipment. In this regard Lingong will continue to support the growth of VCE. Moreover, we see Lingong not only as a trigger for growth in China but also for growth in every emerging country that Volvo operates in, especially BRICs. The SDLG brand is likely to be Volvo’s entry product offer wherever there is demand for relatively inexpensive products. This is already the case in Brazil where we think Chinese manufacturers are gaining market share.
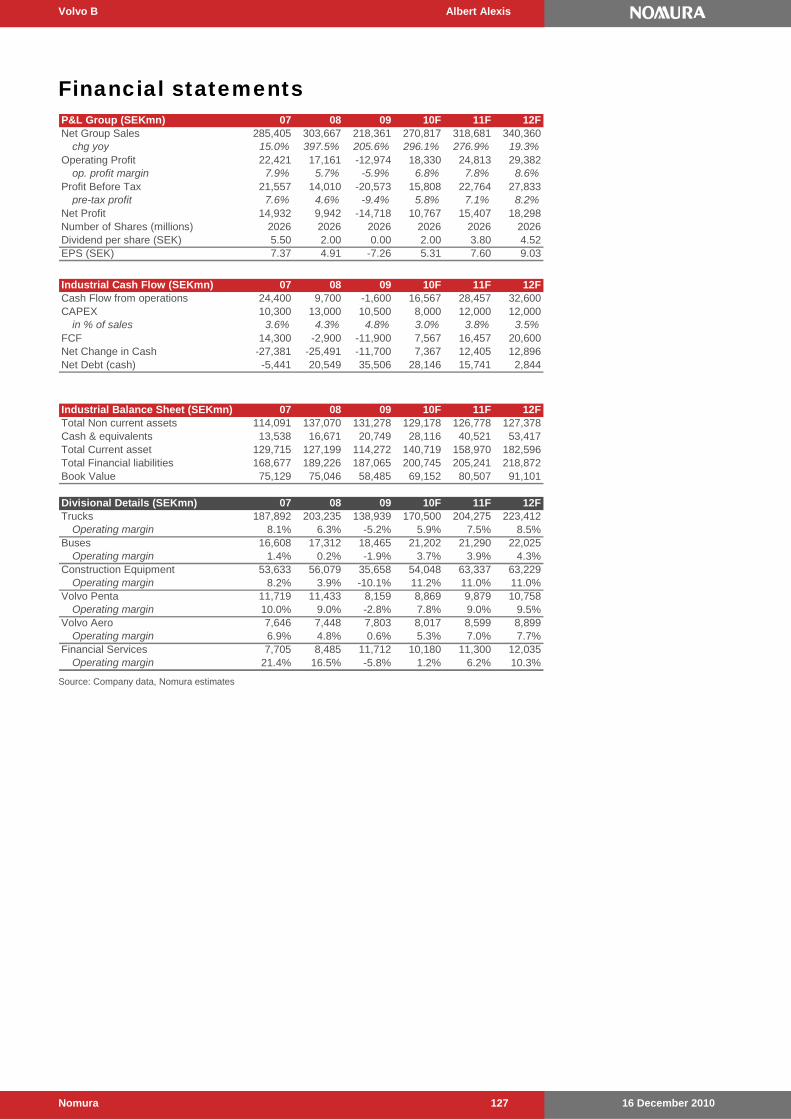
Volvo B Albert Alexis
16 December 2010 Nomura 127
Financial statements P&L Group (SEKmn) 07 08 09 10F 11F 12FNet Group Sales 285,405 303,667 218,361 270,817 318,681 340,360
chg yoy 15.0% 397.5% 205.6% 296.1% 276.9% 19.3%Operating Profit 22,421 17,161 -12,974 18,330 24,813 29,382
op. profit margin 7.9% 5.7% -5.9% 6.8% 7.8% 8.6%Profit Before Tax 21,557 14,010 -20,573 15,808 22,764 27,833
pre-tax profit 7.6% 4.6% -9.4% 5.8% 7.1% 8.2%Net Profit 14,932 9,942 -14,718 10,767 15,407 18,298Number of Shares (millions) 2026 2026 2026 2026 2026 2026Dividend per share (SEK) 5.50 2.00 0.00 2.00 3.80 4.52EPS (SEK) 7.37 4.91 -7.26 5.31 7.60 9.03
Industrial Cash Flow (SEKmn) 07 08 09 10F 11F 12FCash Flow from operations 24,400 9,700 -1,600 16,567 28,457 32,600CAPEX 10,300 13,000 10,500 8,000 12,000 12,000
in % of sales 3.6% 4.3% 4.8% 3.0% 3.8% 3.5%FCF 14,300 -2,900 -11,900 7,567 16,457 20,600Net Change in Cash -27,381 -25,491 -11,700 7,367 12,405 12,896Net Debt (cash) -5,441 20,549 35,506 28,146 15,741 2,844
Industrial Balance Sheet (SEKmn) 07 08 09 10F 11F 12FTotal Non current assets 114,091 137,070 131,278 129,178 126,778 127,378Cash & equivalents 13,538 16,671 20,749 28,116 40,521 53,417Total Current asset 129,715 127,199 114,272 140,719 158,970 182,596Total Financial liabilities 168,677 189,226 187,065 200,745 205,241 218,872Book Value 75,129 75,046 58,485 69,152 80,507 91,101
Divisional Details (SEKmn) 07 08 09 10F 11F 12FTrucks 187,892 203,235 138,939 170,500 204,275 223,412
Operating margin 8.1% 6.3% -5.2% 5.9% 7.5% 8.5%Buses 16,608 17,312 18,465 21,202 21,290 22,025
Operating margin 1.4% 0.2% -1.9% 3.7% 3.9% 4.3%Construction Equipment 53,633 56,079 35,658 54,048 63,337 63,229
Operating margin 8.2% 3.9% -10.1% 11.2% 11.0% 11.0%Volvo Penta 11,719 11,433 8,159 8,869 9,879 10,758
Operating margin 10.0% 9.0% -2.8% 7.8% 9.0% 9.5%Volvo Aero 7,646 7,448 7,803 8,017 8,599 8,899
Operating margin 6.9% 4.8% 0.6% 5.3% 7.0% 7.7%Financial Services 7,705 8,485 11,712 10,180 11,300 12,035
Operating margin 21.4% 16.5% -5.8% 1.2% 6.2% 10.3% Source: Company data, Nomura estimates
16 December 2010 Nomura 128
Machinery | China Yankun Hou

Machinery | China Yankun Hou
16 December 2010 Nomura 129
Any Authors named on this report are Research Analysts unless otherwise indicated
Analyst Certification
We, Yankun Hou, Katsushi Saito, Wenjie Ge, Yuji Matsumoto, Ryo Tazaki, Shigeki Okazaki and Alexis Albert, hereby certify (1) that the views expressed in this Research report accurately reflect our personal views about any or all of the subject securities or issuers referred to in this Research report, (2) no part of our compensation was, is or will be directly or indirectly related to the specific recommendations or views expressed in this Research report and (3) no part of our compensation is tied to any specific investment banking transactions performed by Nomura Securities International, Inc., Nomura International plc or any other Nomura Group company.
Important Disclosures Conflict-of-interest disclosures Important disclosures may be accessed through the following website: http://www.nomura.com/research/pages/disclosures/disclosures.aspx . If you have difficulty with this site or you do not have a password, please contact your Nomura Securities International, Inc. salesperson (1-877-865-5752) or email [email protected] for assistance. Online availability of research and additional conflict-of-interest disclosures Nomura Japanese Equity Research is available electronically for clients in the US on NOMURA.COM, REUTERS, BLOOMBERG and THOMSON ONE ANALYTICS. For clients in Europe, Japan and elsewhere in Asia it is available on NOMURA.COM, REUTERS and BLOOMBERG. Important disclosures may be accessed through the left hand side of the Nomura Disclosure web page http://www.nomura.com/research or requested from Nomura Securities International, Inc., on 1-877-865-5752. If you have any difficulties with the website, please email [email protected] for technical assistance. The analysts responsible for preparing this report have received compensation based upon various factors including the firm's total revenues, a portion of which is generated by Investment Banking activities. Industry Specialists identified in some Nomura International plc research reports are employees within the Firm who are responsible for the sales and trading effort in the sector for which they have coverage. Industry Specialists do not contribute in any manner to the content of research report in which their names appear. Distribution of ratings (Global) Nomura Global Equity Research has 1878 companies under coverage. 48% have been assigned a Buy rating which, for purposes of mandatory disclosures, are classified as a Buy rating; 41% of companies with this rating are investment banking clients of the Nomura Group*. 37% have been assigned a Neutral rating which, for purposes of mandatory disclosures, is classified as a Hold rating; 54% of companies with this rating are investment banking clients of the Nomura Group*. 13% have been assigned a Reduce rating which, for purposes of mandatory disclosures, are classified as a Sell rating; 16% of companies with this rating are investment banking clients of the Nomura Group*. As at 30 September 2010. *The Nomura Group as defined in the Disclaimer section at the end of this report. Explanation of Nomura's equity research rating system in Europe, Middle East and Africa, US and Latin America for ratings published from 27 October 2008 The rating system is a relative system indicating expected performance against a specific benchmark identified for each individual stock. Analysts may also indicate absolute upside to price target defined as (fair value - current price)/current price, subject to limited management discretion. In most cases, the fair value will equal the analyst's assessment of the current intrinsic fair value of the stock using an appropriate valuation methodology such as discounted cash flow or multiple analysis, etc. STOCKS A rating of 'Buy', indicates that the analyst expects the stock to outperform the Benchmark over the next 12 months. A rating of 'Neutral', indicates that the analyst expects the stock to perform in line with the Benchmark over the next 12 months. A rating of 'Reduce', indicates that the analyst expects the stock to underperform the Benchmark over the next 12 months. A rating of 'RS-Rating Suspended', indicates that the rating and target price have been suspended temporarily to comply with applicable regulations and/or firm policies in certain circumstances including when Nomura is acting in an advisory capacity in a merger or strategic transaction involving the company. Benchmarks are as follows: United States/Europe: Please see valuation methodologies for explanations of relevant benchmarks for stocks (accessible through the left hand side of the Nomura Disclosure web page: http://www.nomura.com/research);Global Emerging Markets (ex-Asia): MSCI Emerging Markets ex-Asia, unless otherwise stated in the valuation methodology. SECTORS A 'Bullish' stance, indicates that the analyst expects the sector to outperform the Benchmark during the next 12 months. A 'Neutral' stance, indicates that the analyst expects the sector to perform in line with the Benchmark during the next 12 months. A 'Bearish' stance, indicates that the analyst expects the sector to underperform the Benchmark during the next 12 months. Benchmarks are as follows: United States: S&P 500; Europe: Dow Jones STOXX 600; Global Emerging Markets (ex-Asia): MSCI Emerging Markets ex-Asia.
Machinery | China Yankun Hou
16 December 2010 Nomura 130
Explanation of Nomura's equity research rating system for Asian companies under coverage ex Japan published from 30 October 2008 and in Japan from 6 January 2009 STOCKS Stock recommendations are based on absolute valuation upside (downside), which is defined as (Price Target - Current Price) / Current Price, subject to limited management discretion. In most cases, the Price Target will equal the analyst's 12-month intrinsic valuation of the stock, based on an appropriate valuation methodology such as discounted cash flow, multiple analysis, etc. A 'Buy' recommendation indicates that potential upside is 15% or more. A 'Neutral' recommendation indicates that potential upside is less than 15% or downside is less than 5%. A 'Reduce' recommendation indicates that potential downside is 5% or more. A rating of 'RS' or 'Rating Suspended' indicates that the rating and target price have been suspended temporarily to comply with applicable regulations and/or firm policies in certain circumstances including when Nomura is acting in an advisory capacity in a merger or strategic transaction involving the subject company. Securities and/or companies that are labelled as 'Not rated' or shown as 'No rating' are not in regular research coverage of the Nomura entity identified in the top banner. Investors should not expect continuing or additional information from Nomura relating to such securities and/or companies. SECTORS A 'Bullish' rating means most stocks in the sector have (or the weighted average recommendation of the stocks under coverage is) a positive absolute recommendation. A 'Neutral' rating means most stocks in the sector have (or the weighted average recommendation of the stocks under coverage is) a neutral absolute recommendation. A 'Bearish' rating means most stocks in the sector have (or the weighted average recommendation of the stocks under coverage is) a negative absolute recommendation. Explanation of Nomura's equity research rating system in Japan published prior to 6 January 2009 (and ratings in Europe, Middle East and Africa, US and Latin America published prior to 27 October 2008) STOCKS A rating of '1' or 'Strong buy', indicates that the analyst expects the stock to outperform the Benchmark by 15% or more over the next six months. A rating of '2' or 'Buy', indicates that the analyst expects the stock to outperform the Benchmark by 5% or more but less than 15% over the next six months. A rating of '3' or 'Neutral', indicates that the analyst expects the stock to either outperform or underperform the Benchmark by less than 5% over the next six months. A rating of '4' or 'Reduce', indicates that the analyst expects the stock to underperform the Benchmark by 5% or more but less than 15% over the next six months. A rating of '5' or 'Sell', indicates that the analyst expects the stock to underperform the Benchmark by 15% or more over the next six months. Stocks labeled 'Not rated' or shown as 'No rating' are not in Nomura's regular research coverage. Nomura might not publish additional research reports concerning this company, and it undertakes no obligation to update the analysis, estimates, projections, conclusions or other information contained herein. SECTORS A 'Bullish' stance, indicates that the analyst expects the sector to outperform the Benchmark during the next six months. A 'Neutral' stance, indicates that the analyst expects the sector to perform in line with the Benchmark during the next six months. A 'Bearish' stance, indicates that the analyst expects the sector to underperform the Benchmark during the next six months. Benchmarks are as follows: Japan: TOPIX; United States: S&P 500, MSCI World Technology Hardware & Equipment; Europe, by sector - Hardware/Semiconductors: FTSE W Europe IT Hardware; Telecoms: FTSE W Europe Business Services; Business Services: FTSE W Europe; Auto & Components: FTSE W Europe Auto & Parts; Communications equipment: FTSE W Europe IT Hardware; Ecology Focus: Bloomberg World Energy Alternate Sources; Global Emerging Markets: MSCI Emerging Markets ex-Asia. Explanation of Nomura's equity research rating system for Asian companies under coverage ex Japan published prior to 30 October 2008 STOCKS Stock recommendations are based on absolute valuation upside (downside), which is defined as (Fair Value - Current Price)/Current Price, subject to limited management discretion. In most cases, the Fair Value will equal the analyst's assessment of the current intrinsic fair value of the stock using an appropriate valuation methodology such as Discounted Cash Flow or Multiple analysis etc. However, if the analyst doesn't think the market will revalue the stock over the specified time horizon due to a lack of events or catalysts, then the fair value may differ from the intrinsic fair value. In most cases, therefore, our recommendation is an assessment of the difference between current market price and our estimate of current intrinsic fair value. Recommendations are set with a 6-12 month horizon unless specified otherwise. Accordingly, within this horizon, price volatility may cause the actual upside or downside based on the prevailing market price to differ from the upside or downside implied by the recommendation. A 'Strong buy' recommendation indicates that upside is more than 20%. A 'Buy' recommendation indicates that upside is between 10% and 20%. A 'Neutral' recommendation indicates that upside or downside is less than 10%. A 'Reduce' recommendation indicates that downside is between 10% and 20%. A 'Sell' recommendation indicates that downside is more than 20%. SECTORS A 'Bullish' rating means most stocks in the sector have (or the weighted average recommendation of the stocks under coverage is) a positive absolute recommendation. A 'Neutral' rating means most stocks in the sector have (or the weighted average recommendation of the stocks under coverage is) a neutral absolute recommendation. A 'Bearish' rating means most stocks in the sector have (or the weighted average recommendation of the stocks under coverage is) a negative absolute recommendation.

Machinery | China Yankun Hou
16 December 2010 Nomura 131
Price targets Price targets, if discussed, reflect in part the analyst's estimates for the company's earnings. The achievement of any price target may be impeded by general market and macroeconomic trends, and by other risks related to the company or the market, and may not occur if the company's earnings differ from estimates. Disclaimers This publication contains material that has been prepared by the Nomura entity identified on the banner at the top or the bottom of page 1 herein and, if applicable, with the contributions of one or more Nomura entities whose employees and their respective affiliations are specified on page 1 herein or elsewhere identified in the publication. Affiliates and subsidiaries of Nomura Holdings, Inc. (collectively, the 'Nomura Group'), include: Nomura Securities Co., Ltd. ('NSC') Tokyo, Japan; Nomura International plc, United Kingdom; Nomura Securities International, Inc. ('NSI'), New York, NY; Nomura International (Hong Kong) Ltd., Hong Kong; Nomura Financial Investment (Korea) Co., Ltd., Korea (Information on Nomura analysts registered with the Korea Financial Investment Association ('KOFIA') can be found on the KOFIA Intranet at http://dis.kofia.or.kr ); Nomura Singapore Ltd., Singapore (Registration number 197201440E, regulated by the Monetary Authority of Singapore); Nomura Securities Singapore Pte Ltd., Singapore (Registration number 198702521E, regulated by the Monetary Authority of Singapore); Capital Nomura Securities Public Company Limited; Nomura Australia Ltd., Australia (ABN 48 003 032 513), regulated by the Australian Securities and Investment Commission and holder of an Australian financial services licence number 246412; P.T. Nomura Indonesia, Indonesia; Nomura Securities Malaysia Sdn. Bhd., Malaysia; Nomura International (Hong Kong) Ltd., Taipei Branch, Taiwan; Nomura Financial Advisory and Securities (India) Private Limited, Mumbai, India (Registered Address: Ceejay House, Level 11, Plot F, Shivsagar Estate, Dr. Annie Besant Road, Worli, Mumbai- 400 018, India; SEBI Registration No: BSE INB011299030, NSE INB231299034, INF231299034, INE 231299034). THIS MATERIAL IS: (I) FOR YOUR PRIVATE INFORMATION, AND WE ARE NOT SOLICITING ANY ACTION BASED UPON IT; (II) NOT TO BE CONSTRUED AS AN OFFER TO SELL OR A SOLICITATION OF AN OFFER TO BUY ANY SECURITY IN ANY JURISDICTION WHERE SUCH OFFER OR SOLICITATION WOULD BE ILLEGAL; AND (III) BASED UPON INFORMATION THAT WE CONSIDER RELIABLE. NOMURA GROUP DOES NOT WARRANT OR REPRESENT THAT THE PUBLICATION IS ACCURATE, COMPLETE, RELIABLE, FIT FOR ANY PARTICULAR PURPOSE OR MERCHANTABLE AND DOES NOT ACCEPT LIABILITY FOR ANY ACT (OR DECISION NOT TO ACT) RESULTING FROM USE OF THIS PUBLICATION AND RELATED DATA. TO THE MAXIMUM EXTENT PERMISSIBLE ALL WARRANTIES AND OTHER ASSURANCES BY NOMURA GROUP ARE HEREBY EXCLUDED AND NOMURA GROUP SHALL HAVE NO LIABILITY FOR THE USE, MISUSE, OR DISTRIBUTION OF THIS INFORMATION. Opinions expressed are current opinions as of the original publication date appearing on this material only and the information, including the opinions contained herein, are subject to change without notice. Nomura is under no duty to update this publication. If and as applicable, NSI's investment banking relationships, investment banking and non-investment banking compensation and securities ownership (identified in this report as 'Disclosures Required in the United States'), if any, are specified in disclaimers and related disclosures in this report. In addition, other members of the Nomura Group may from time to time perform investment banking or other services (including acting as advisor, manager or lender) for, or solicit investment banking or other business from, companies mentioned herein. Further, the Nomura Group, and/or its officers, directors and employees, including persons, without limitation, involved in the preparation or issuance of this material may, to the extent permitted by applicable law and/or regulation, have long or short positions in, and buy or sell, the securities (including ownership by NSI, referenced above), or derivatives (including options) thereof, of companies mentioned herein, or related securities or derivatives. In addition, the Nomura Group, excluding NSI, may act as a market maker and principal, willing to buy and sell certain of the securities of companies mentioned herein. Further, the Nomura Group may buy and sell certain of the securities of companies mentioned herein, as agent for its clients. Investors should consider this report as only a single factor in making their investment decision and, as such, the report should not be viewed as identifying or suggesting all risks, direct or indirect, that may be associated with any investment decision. Please see the further disclaimers in the disclosure information on companies covered by Nomura analysts available at www.nomura.com/research under the 'Disclosure' tab. Nomura Group produces a number of different types of research product including, among others, fundamental analysis, quantitative analysis and short term trading ideas; recommendations contained in one type of research product may differ from recommendations contained in other types of research product, whether as a result of differing time horizons, methodologies or otherwise; it is possible that individual employees of Nomura may have different perspectives to this publication. NSC and other non-US members of the Nomura Group (i.e. excluding NSI), their officers, directors and employees may, to the extent it relates to non-US issuers and is permitted by applicable law, have acted upon or used this material prior to, or immediately following, its publication. Foreign-currency-denominated securities are subject to fluctuations in exchange rates that could have an adverse effect on the value or price of, or income derived from, the investment. In addition, investors in securities such as ADRs, the values of which are influenced by foreign currencies, effectively assume currency risk. The securities described herein may not have been registered under the US Securities Act of 1933, and, in such case, may not be offered or sold in the United States or to US persons unless they have been registered under such Act, or except in compliance with an exemption from the registration requirements of such Act. Unless governing law permits otherwise, you must contact a Nomura entity in your home jurisdiction if you want to use our services in effecting a transaction in the securities mentioned in this material. This publication has been approved for distribution in the United Kingdom and European Union as investment research by Nomura International plc ('NIPlc'), which is authorized and regulated by the UK Financial Services Authority ('FSA') and is a member of the London Stock Exchange. It does not constitute a personal recommendation, as defined by the FSA, or take into account the particular investment objectives, financial situations, or needs of individual investors. It is intended only for investors who are 'eligible counterparties' or 'professional clients' as defined by the FSA, and may not, therefore, be redistributed to retail clients as defined by the FSA. This publication may be distributed in Germany via Nomura Bank (Deutschland) GmbH, which is authorized and regulated in Germany by the Federal Financial Supervisory Authority ('BaFin'). This publication has been approved by Nomura International (Hong Kong) Ltd. ('NIHK'), which is regulated by the Hong Kong Securities and Futures Commission, for distribution in Hong Kong by NIHK. This publication has been approved for distribution in Australia by Nomura Australia Ltd, which is authorized and regulated in Australia by the Australian Securities and Investment Commission ('ASIC'). This publication has also been approved for distribution in Malaysia by Nomura Securities Malaysia Sdn Bhd. In Singapore, this publication has been distributed by Nomura Singapore Limited ('NSL') and/or Nomura Securities Singapore Pte Ltd ('NSS'). NSL and NSS accepts legal responsibility for the content of this publication, where it concerns securities, futures and foreign exchange, issued by their foreign affiliates in respect of recipients who are not accredited, expert or institutional investors as defined by the Securities and Futures Act (Chapter 289). Recipients of this publication should contact NSL or NSS (as the case may be) in respect of matters arising from, or in connection with, this publication. Unless prohibited by the provisions of Regulation S of the U.S. Securities Act of 1933, this material is distributed in the United States, by Nomura Securities International, Inc., a US-registered broker-dealer, which accepts responsibility for its contents in accordance with the provisions of Rule 15a-6, under the US Securities Exchange Act of 1934.
Machinery | China Yankun Hou
16 December 2010 Nomura 132
This publication has not been approved for distribution in the Kingdom of Saudi Arabia or to clients other than 'professional clients' in the United Arab Emirates by Nomura Saudi Arabia, Nomura International plc or any other member of the Nomura Group, as the case may be. Neither this publication nor any copy thereof may be taken or transmitted or distributed, directly or indirectly, by any person other than those authorised to do so into the Kingdom of Saudi Arabia or in the United Arab Emirates or to any person located in the Kingdom of Saudi Arabia or to clients other than 'professional clients' in the United Arab Emirates. By accepting to receive this publication, you represent that you are not located in the Kingdom of Saudi Arabia or that you are a 'professional client' in the United Arab Emirates and agree to comply with these restrictions. Any failure to comply with these restrictions may constitute a violation of the laws of the Kingdom of Saudi Arabia or the United Arab Emirates. No part of this material may be (i) copied, photocopied, or duplicated in any form, by any means; or (ii) redistributed without the prior written consent of the Nomura Group member identified in the banner on page 1 of this report. Further information on any of the securities mentioned herein may be obtained upon request. If this publication has been distributed by electronic transmission, such as e-mail, then such transmission cannot be guaranteed to be secure or error-free as information could be intercepted, corrupted, lost, destroyed, arrive late or incomplete, or contain viruses. The sender therefore does not accept liability for any errors or omissions in the contents of this publication, which may arise as a result of electronic transmission. If verification is required, please request a hard-copy version. Additional information available upon request NIPlc and other Nomura Group entities manage conflicts identified through the following: their Chinese Wall, confidentiality and independence policies, maintenance of a Restricted List and a Watch List, personal account dealing rules, policies and procedures for managing conflicts of interest arising from the allocation and pricing of securities and impartial investment research and disclosure to clients via client documentation. Disclosure information is available at the Nomura Disclosure web page: http://www.nomura.com/research/pages/disclosures/disclosures.aspx
CH/HK80a/81b/82d
Nomura Asian Equity Research Group
Hong Kong Nomura International (Hong Kong) Limited 30/F Two International Finance Centre, 8 Finance Street, Central, Hong Kong Tel: +852 2536 1111 Fax: +852 2536 1820
Singapore
Nomura Singapore Limited 5 Temasek Boulevard #11-01, Suntec Tower Five, Singapore 038985, Singapore Tel: +65 6433 6288 Fax: +65 6433 6169
Taipei Nomura International (Hong Kong) Limited, Taipei Branch 17th Floor, Walsin Lihwa Xinyi Building, No.1, Songzhi Road, Taipei 11047, Taiwan, R.O.C. Tel: +886 2 2176 9999 Fax: +886 2 2176 9900
Seoul Nomura Financial Investment (Korea) Co., Ltd. 17th floor, Seoul Finance Center, 84 Taepyeongno 1-ga, Jung-gu, Seoul 100-768, Korea Tel: +82 2 3783 2000 Fax: +82 2 3783 2500
Kuala Lumpur Nomura Securities Malaysia Sdn. Bhd. Suite No 16.5, Level 16, Menara IMC, 8 Jalan Sultan Ismail, 50250 Kuala Lumpur, Malaysia Tel: +60 3 2027 6811 Fax: +60 3 2027 6888
India Nomura Financial Advisory and Securities (India) Private Limited Ceejay House, Level 11, Plot F, Shivsagar Estate, Dr. Annie Besant Road, Worli, Mumbai- 400 018, India Tel: +91 22 4037 4037 Fax: +91 22 4037 4111
Indonesia PT. Nomura Indonesia Suite 209A, 9th Floor, Sentral Senayan II Building Jl. Asia Afrika No. 8, Gelora Bung Karno, Jakarta 10270, Indonesia Tel: +62 21 2991 3300 Fax: +62 21 2991 3333
Sydney Nomura Australia Ltd. Level 25, Governor Phillip Tower, 1 Farrer Place, Sydney NSW 2000 Tel: +61 2 8062 8000 Fax: +61 2 8062 8362
Tokyo Equity Research Department Financial & Economic Research Center Nomura Securities Co., Ltd. 17/F Urbannet Building, 2-2, Otemachi 2-chome Chiyoda-ku, Tokyo 100-8130, Japan Tel: +81 3 5255 1658 Fax: +81 3 5255 1747, 3272 0869
Caring for the environment: to receive only the electronic versions of our research, please contact your sales representative.