01 company update frans van houten - · pdf fileindal we made significant portfolio changes...
TRANSCRIPT

1
Company updateFrans van Houten, CEO Royal Philips

2
• Accelerate! is working and we are committed to achieving our 2013 targets; on-going headwinds remain a concern
• We have actively restructured and significantlyimproved the quality of our portfolio
• Philips is now a diversified technology company serving attractive markets with a dynamic portfolio of 40 businesses; with great unlocked potential
• Accelerate! will continue to create significant value, with the 2016 targets as the next step on our Path-to-Value, and more to come thereafter
Key takeaways

3
Agenda
• Our progress 2011-2013
• Our approach to value creation
• Unlocking the full potential of our portfolio
• Next steps on our Path-to-Value

The start of our journey…
4
• In 2011, with Accelerate! we set out to:
• Restore performance
• Improve the quality of our portfolio
• Fundamentally change our culture
• Address balance-sheet efficiency
• Deliver on ambitious mid-term targetsby 2013

5
Active portfolio management, granular strategies and resource allocation to ensure value creation in relevant business-market combinations
Culture
Customer centricity
End2End
Operating model
Resource to win
Simpler operating procedures, clear governance, lower operating costs. Effective real-time performance management systems. Develop and embed our repeatable Philips Business System
Create a growth and performance culture to be a more agile and market oriented growth company
Innovating with higher speed and excellence to outpace competition through effective, Lean and agile End2End customer value chains
Strong customer centricity and entrepreneurship in our markets to improve brand preference and growth
Our transformation program Accelerate! is addressing the five root causes for underperformance

6
Accelerate! is transforming Philips top to bottomWe are delivering on our milestones
2013…..Performance
Box
• Executive Committee• Growth investments• Philips Business System• BMC1 performance management• Share buy back• TV Joint Venture• Improving Lighting performance
Val
ue
ROIC
2011 Performance
BoxGro
wth
ROIC
Laying the foundation to improve performance
Transform Philips through Accelerate! • Accelerate! Healthcare• Restoring Lighting profitability, leading the
LED transformation• Closing the Audio, Video, Multimedia and
Accessories deal• EUR 1.1 billion cost reduction program • Cost savings on procurement • Value delivery from past acquisitions• Next value creation steps beyond 2013• Performance culture
Gro
wth
2012Performance
Box
• Good sales growth• Improved operating margins• Increased cost reduction plan• Inventory improvement • Share buy back• Lumileds and Consumer Luminaires
returned to profitability• Culture change
Accelerating performance improvement
Gro
wth
ROIC
1 BMC = Business Market Combination
= Areas of ongoing focus in 2013
2011 – 2013 Accelerating performance improvement
• Executive Committee and leadership strengthened• Investments in growth stepped-up• BMC1 performance management implemented• EUR 1.1 billion cost reduction program on track• Operating margins & Inventory management improved • Television and Audio, Video, Multimedia & Accessories addressed• EUR 2 billion Share buy back completed• Culture change gaining strong traction• Philips Business System being implemented
7
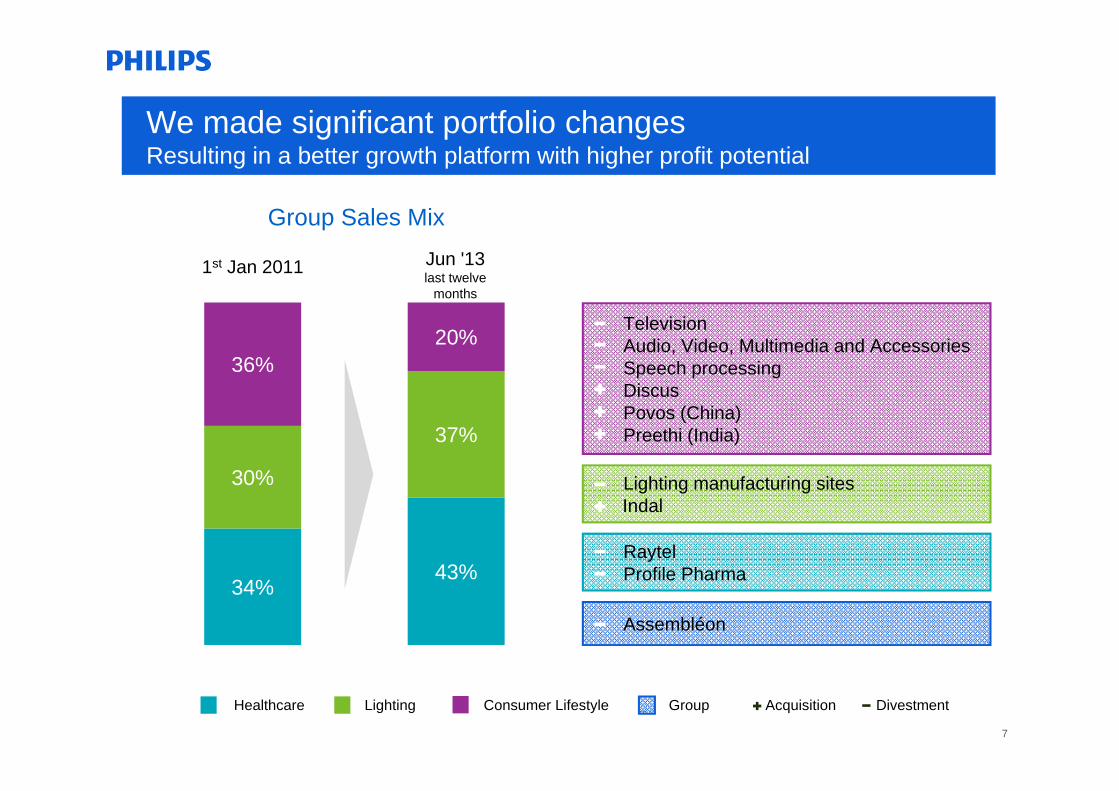
Healthcare Lighting Consumer Lifestyle Group Acquisition Divestment
TelevisionAudio, Video, Multimedia and Accessories Speech processing DiscusPovos (China)Preethi (India)
1st Jan 2011
RaytelProfile Pharma
Lighting manufacturing sites Indal
We made significant portfolio changesResulting in a better growth platform with higher profit potential
Jun '13last twelve
months
34%43%
30%
37%
36%20%
34%
Group Sales Mix
Assembléon

8
We are committed to achieving our 2013 targetsComparable CAGR1 of 4 to 6%, EBITA2 of 10 to 12%, and ROIC of 12 to 14%
• Our 2011-2013 comparable Sales CAGR is progressing towards the range of 4 to 6%, despite global real GDP being below 3%
• Our reported EBITA for 2013 is progressing towards the lower end of our target range; although ongoing headwinds remain
• Improved earnings and better working capital management drive ROIC improvement towards the range of 12 to 14%
1 Assuming real GDP growth of 3 to 4% 2 Including restructuring and acquisition-related charges 3 2011 EBITA incl. Television and Audio, Video, Multimedia and Accessories business 4European Commission fine related to Cathode-Ray Tubes, a business divested by Philips in 2011. Charges were taken in Q4 2012
0%
2%
4%
6%
8%
1Q12 2Q12 3Q12 4Q12 1Q13 2Q13
Group comparable sales growth
0%
4%
8%
12%
2011 1H13
Reported EBITA margins3
-5.5%
7.0%
9.2%
-10%
-5%
0%
5%
10%
15%
1Q12 1Q13 2Q13
ROIC excl. EC fine4
Discount rate ROIC excl. EC fine

9
Agenda
• Our progress 2011-2013
• Our approach to value creation
• Unlocking the full potential of our portfolio
• Next steps on our Path-to-Value

10
We are a global diversified technology company
We manage a dynamic portfolio of ~40 businesses serving attractive markets of Healthcare, Personal health & well-being and Lighting
More than 1/3 of the revenue from growth geographies
€23.5 billion sales in 2012 enabled by the 115,000+ people employed
€1.8 billion annual investments in innovationand ~59,000 patents
Market reach in over 100 countries across the world
More than 1/4 of revenues from recurring revenue streams
Over 50% of the portfoliohas global leadership positions

11
Mission
Vision
• To make the world healthier and more sustainable through innovation• To improve the lives of 3 billion people a year by 2025• To offer the best place to work for people who share our passion• To deliver superior value for our customers and shareholders
• Improving people’s lives through meaningful innovation
We have created a clear direction for the company
Guiding Statement
• Manage a dynamic portfolio of technology businesses which we build to global leadership performance
• We create value through our ability to innovate with local relevance and global scale, leveraging our capabilities and deep customer insights
• The Philips Business System enables us to deliver superior results as an agile, Lean, and learning organization
Brand Promise • We deliver innovation that matters to you

12
We are implementing the Philips Business SystemOur repeatable system to unlock and deliver value
The Philips Business System enables us to:
• Manage our portfolio with granular value creation plans for every business
• Leverage our differentiating Capabilities, Assets and Positions to drive global scale and local relevance
• Be a learning organization that delivers with speed and excellence to our customers
• Live a growth and performance culture
• Deliver increasing value in a repeatablemanner

13
We leverage our strong differentiating Capabilities, Assets and Positions
Philips Group Portfolio
Deep Market Insights
Technology Innovation
Global Footprint
The Philips Brand Our People
Supported by a strong balance sheet
• Technology, know-how and strong IP positions (59,000 registered patents)
• World’s 41st most valuable brand 2012 compared to the 65th in 2004
• Brand value reached a record level of more than USD 9 billion
• Loyal customer base in 100+ countries
• 35% of Group revenues from growth geographies
• Employee Engagement Index2 exceeds high performance benchmark valueof 70%
• Culturally diverse top-200 leadership team
• Global market leader in Lighting
• Top 3 Healthcare player
• Leadership positions1 in over half of Group revenues
1 Global #1 position in the market2 Based on annual Philips’ Employee Engagement Survey

14
Agenda
• Our progress 2011-2013
• Our approach to value creation
• Unlocking the full potential of our portfolio
• Next steps on our Path-to-Value

15
Mega trends create great opportunities for profitable growth
Sources: World health organization, Agriculture and Agri-food Canada, OECD observer, and Philips Lighting global market study
Mega Trends
• Around 65% of deaths globally are due to chronic and non-communicable diseases
• World’s population of people 60 years+ doubled since 1980; forecast to reach 2 billion by 2050
• Growing and aging population with more chronic diseases
• Growing demand for integral value-based healthcare solutions
• Urbanization leading to 3 billion more people in cities by 2050
• LED to be 45-50% of the market by 2016, as inefficient technologies are being phased out
• The world needs more light and energy efficient lighting
• Digitalization driving demand for integrated lighting solutions
• Growth geographies with growing middle class
• Rising health & well-being consciousness
• The global middle class is expected to increase from 1.8 billion in 2009 to 4.9 billion by 2030
• Aging population, high obesity rates, and a raised awareness of un-healthy foods
Sizeable Opportunities

16
Our business domains play right into these megatrends
• Growing and aging population with more chronic diseases
• Growing demand for integral value-based healthcare solutions
• Growth geographies with growing middle class
• Rising health & well-being consciousness
• The world needs more light and energy efficient lighting
• Digitalization driving demand for integrated lighting solutions
Our Business Domains
Personal health & well-being appliances and services
Light sources
Lighting applications, systems and services
Patient care for hospital and home
Clinical Informatics & consulting services
Hea
lthca
reLi
ghtin
g
Imaging systems for diagnostics and therapy
Mega Trends
Con
sum
er
Life
styl
e

17
Imaging Systems for diagnostics and therapy
Each of our businesses has a granular value creation roadmap towards 2016 targets and beyond
Our Businesses Our value creation levers
• Radiology modalities & applications• Ultrasound Imaging• Image guided interventional therapy
• Male Grooming, Beauty • Oral Healthcare, Mother & Childcare• Kitchen Appliances, Garment Care, Coffee
• Conventional lamps and drivers• LED lamps, drivers and modules• Lumileds, Automotive, OLED
• Professional Lighting Systems and Controls
• Consumer Luminaires
• Acute and therapeutic care products• Sleep & respiratory care
• Hospital and home patient monitoring• Clinical informatics applications• Healthcare consulting services
Our Business domains
Personal health & well-being appliances and services
Light sources
Lighting applications, systems and services
Patient care for hospital and home
Clinical Informatics & consulting services
• Lean out & address under-performance issues
• Speed up innovation
• End2End business model redesign
• Exploit Philips’ global footprint for geographical adjacencies (spottiness)
• Strong focus on growth geographies
• Fill out logical product adjacencies
• Emerging businesses fitting our CAPs
Hea
lthca
reLi
ghtin
gO
ther IP licensing
Emerging businesses
• IP and Brand licensing
• Various
1
1 Capabilities, Assets and Positions
Con
sum
er
Life
styl
e
• Ultrasound ImagingImaging Systems for diagnostics and therapy

18
Healthy and profitable business, leadership in the premium segment
Example value creation approach: Ultrasound
Imaging Systems for diagnostics and therapy
• Ultrasound will have wider clinical applications in healthcare
• Profitable value segment will be key to further value creation
Treat Ultrasound as a growth business and re-invest to expand:
• Leverage India R&D and China operations to expand value segment
• Develop channels in growth geographies to capture opportunities from mega trends
• Strengthen solutions approach by adding clinical decision support through anatomical intelligence
• Develop adjacency into services and new business models allowing remote diagnostics
• Grow partnerships in interventional applications and therapies
Market Insights
Value creation roadmapDomain
Ultrasound Imaging
Business
The new era in advanced Ultrasound Philips EPIQ with anatomical intelligence
Business Assessment

19
Our Path-to-Value is clearly mapped out
Close performance gaps
• Productivity & margin improvements• Turnaround underperforming units• Portfolio correction• Lean processes, real time IT
Expand leadership positions
• Invest to strengthen core• Resource allocation to right businesses &
geographies
2011 2016
Initiate new growth
• Invest in adjacencies to core • Seed emerging business areas
1 Capabilities, Assets and Positions
1
20
Agenda
• Our progress 2011-2013
• Our approach to value creation
• Unlocking the full potential of our portfolio
• Next steps on our Path-to-Value

21
Accelerate! delivers growth and profitability improvements supporting 2016 targets and beyond
Net Improvement in 2016 Reported EBITA 100-200 bps
1 Approximate margin impact in 2016 compared to 2013 baseline
Categories Measures Margin Impact 20161
Productivity
• Overhead cost reduction program increased from EUR 1.1 billion to EUR 1.5 billion by 2015
• EUR 1 billion through Design for Excellence (DfX) between 2014-2016 contributing to gross margin expansion
• End2End productivity gains to be achieved by 2016
>100 bps
100-200 bps
>100 bps
Additional Productivity Improvements 300-400 bps
Investments in productivity
• Incremental one-time restructuring costs, investments to upgrade IT systems, and re-engineer end to end processes between 2014-2016
Investments in growth
• Incremental investments in new (organic) growth in adjacencies with returns after 2016
- 100 bps
- 50 bps
Contingency • Contingencies to cater for moderate fluctuations in market growth and price erosion compared to our assumptions
- 50 bps

22
Targets 2016 and longer term direction
1 Assumption is 3-4% real GDP growth 2 Including restructuring and acquisition-related charges3 Excluding M&A impact
Financial targets 2016
• Sales Growth Comparable CAGR1 2014 to 2016 4 – 6%• Group Reported2 EBITA 11-12%
– Healthcare businesses 16-17%– Consumer Lifestyle businesses 11-13%– Lighting businesses 9-11%
• Group ROIC3 > 14%
Longer term direction
• Further improvement to sales CAGR and EBITA targets from growth and productivity initiatives
• Group ROIC of 15-20%3
Capital allocation
• Invest in high ROIC organic growth opportunities as well as selected value creating bolt-on acquisitions
• Maintain our A3/A- credit rating • New share buy back program: EUR 1.5 billion over next 2-3 years • Sustained dividend growth (40-50% of continuing net income)

23
Our Path-to-Value
ROIC (%)
4
6
8
28 12 14 18
Com
para
ble
sale
s gr
owth
(%)
Performance Box 2013
Philips Mid-Term Performance Box
2011
2013
2016
2020
24
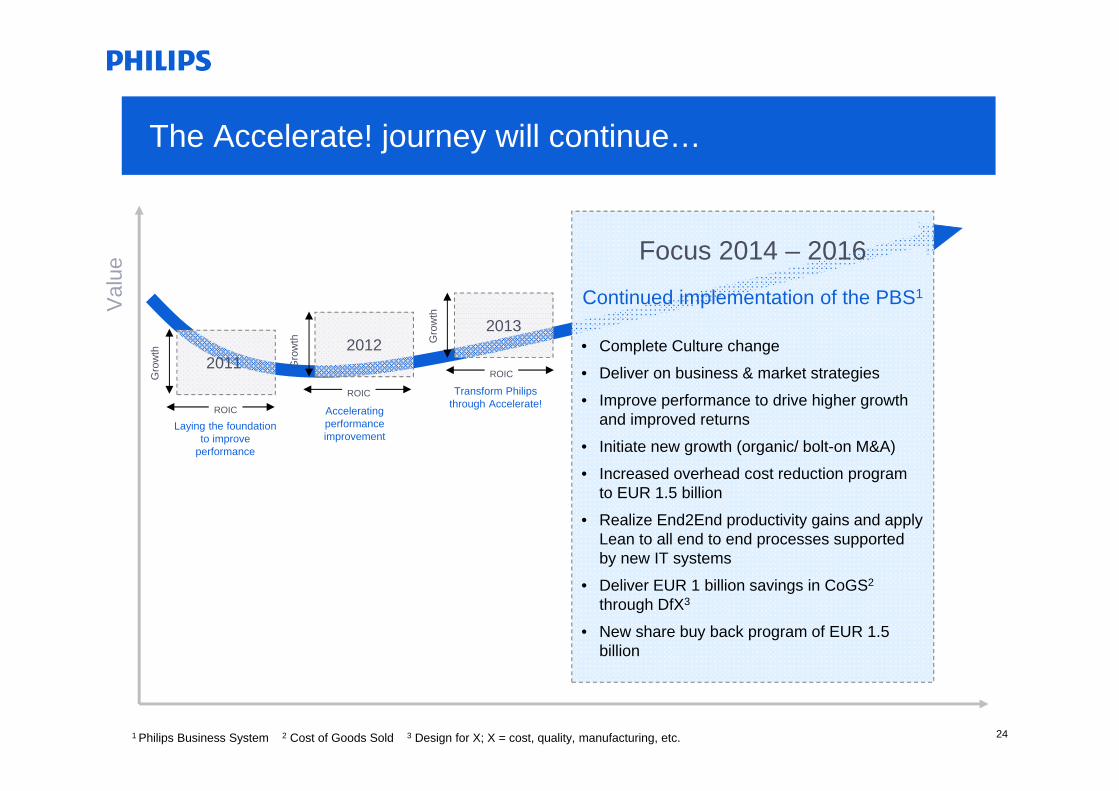
The Accelerate! journey will continue…
2013
Val
ue
ROIC2011
Gro
wth
ROIC
Laying the foundation to improve
performance
Transform Philips through Accelerate!
Gro
wth
2012
Accelerating performance improvement
Gro
wth
ROIC
Focus 2014 – 2016
Continued implementation of the PBS1
• Complete Culture change
• Deliver on business & market strategies
• Improve performance to drive higher growth and improved returns
• Initiate new growth (organic/ bolt-on M&A)
• Increased overhead cost reduction program to EUR 1.5 billion
• Realize End2End productivity gains and apply Lean to all end to end processes supported by new IT systems
• Deliver EUR 1 billion savings in CoGS2
through DfX3
• New share buy back program of EUR 1.5 billion
1 Philips Business System 2 Cost of Goods Sold 3 Design for X; X = cost, quality, manufacturing, etc.

25
Key takeaways
• Accelerate! is working and we are committed to achieving our 2013 targets; on-going headwinds remain a concern
• We have actively restructured and significantlyimproved the quality of our portfolio
• Philips is now a diversified technology company serving attractive markets with a dynamic portfolio of 40 businesses; with great unlocked potential
• Accelerate! will continue to create significant value, with the 2016 targets as the next step on our Path-to-Value, and more to come thereafter

26