01 february 2021 results review 3qfy21 shree cement
TRANSCRIPT
01 February 2021 Results Review 3QFY21
Shree Cement
HSIE Research is also available on Bloomberg ERH HDF <GO> & Thomson Reuters
Robust volume growth and margin sustained
Shree Cement (SRCM) reported a strong 3QFY21. Standalone net
sales/EBITDA/APAT rose 16/28/102% YoY to INR 33.1/10.9/6.3bn respectively.
This is led by strong 15% YoY volume uptick and as margin firmed up, 11%
YoY to INR 1,511/MT on lower opex. SRCM continues to deliver industry-
leading operating performance and return ratios, owing to its robust cost
controls and its strong focus on high trade sales (~75-80%). We upgrade to
ADD with an unchanged SOTP-based target price of INR 25,500.
Robust volume growth: SRCM’s 3QFY21 volumes rose 15% YoY, mainly
driven by strong growth in the eastern region and rising sales in the
southern region. Utilisation firmed up to 71% vs 62% YoY. Share of trade
sales remained flattish at ~77%. NSR fell 1% QoQ (down 2% YoY), mainly
pulled down by price correction in the east and south markets.
Cost reduction keeps margin buoyant: SRCM’s opex fell 7% YoY due to
fuel mix optimisation and strong cost controls. On QoQ basis, higher fuel
prices led to ~5% rise in its power cost (on calorific value basis). Freight cost
was up 5% QoQ on rising share of the east (in SRCM’s sales mix) and higher
diesel prices. However, fixed costs control and op-lev gains offset the
impact, leading to 2% QoQ opex decline. Subsequently, unitary EBITDA
(standalone) remained flat QoQ at INR 1,511 (up 11% YoY).
Subsidiary performance, Capex updates: During 3QFY21, while SRCM’s
UAE subsidiary reported a 22% revenue decline YoY to INR 2.32bn, its
EBITDA rose 22% YoY to INR 370mn on lower input costs. SRCM will
commission its 3mn MT split grinding units in Odisha and Maharashtra
each in 4QFY21. Thereafter, it will commission the ongoing 4mn MT clinker
expansion at Chhattisgarh by Sep’22E. These will increase SRCM’s
standalone clinker/cement capacity to 29/46mn MT by FY23E.
Outlook: SRCM continues to deliver industry-leading operating
performance and return ratios, owing to its robust cost controls and strong
focus on high trade sales (~75-80%). We maintain our earnings estimates and
our SOTP-based target price of INR 25,500. We value its standalone business
at 16.5x its Dec’22E EBITDA and its UAE subsidiary at 1x BV. We upgrade
rating to ADD from REDUCE earlier.
Standalone Quarterly/Annual Financial summary YE Mar
(INR mn)
Q3
FY21
Q3
FY21
YoY
(%)
Q2
FY21
QoQ
(%) FY19 FY20 FY21E FY22E FY23E
Net Sales 33,094 28,483 16.2 30,224 9.5 117,220 119,040 122,285 135,753 158,017
EBITDA 10,890 8,493 28.2 9,880 10.2 27,693 36,745 39,124 43,879 51,487
APAT 6,262 3,100 102.0 5,473 14.4 12,457 15,702 20,960 24,168 28,240
AEPS (INR) 173.6 85.9 102.0 151.7 14.4 357.6 435.2 580.9 669.8 782.7
EV/EBITDA (x)
29.5 21.2 19.6 17.3 14.6
EV/MT (INR bn)
19.75 18.51 17.37 17.24 15.37
P/E (x)
65.3 51.8 38.8 33.7 28.8
RoE (%)
13.5 13.9 15.2 15.4 15.8
Source: Company, HSIE Research
ADD
CMP (as on 29 Jan 2021) 22,749
Target Price 25,500
NIFTY 13,635
KEY
CHANGES OLD NEW
Rating REDUCE ADD
Price Target 25,500 25,500
EBITDA % FY21E FY22E
- -
KEY STOCK DATA
Bloomberg code SRCM IN
No. of Shares (mn) 36
MCap (INR bn) / ($ mn) 821/11,252
6m avg traded value (Rs mn) 1,529
52 Week high / low Rs 25,980/15,410
STOCK PERFORMANCE (%)
3M 6M 12M
Absolute (%) 4.9 4.6 (3.1)
Relative (%) (11.5) (17.0) (15.4)
SHAREHOLDING PATTERN (%)
Sep-20 Dec-20
Promoters 62.55 62.55
FIs & Local MFs 11.54 11.04
FPIs 11.37 12.18
Public & Others 14.54 14.20
Pledged Shares - -
Source : BSE
Pledged shares as % of total shares
Rajesh Ravi
+91-22-6171-7352
Saurabh Dugar
+91-22-6171-7353
Page | 2
Shree Cement: Results Review 3QFY21
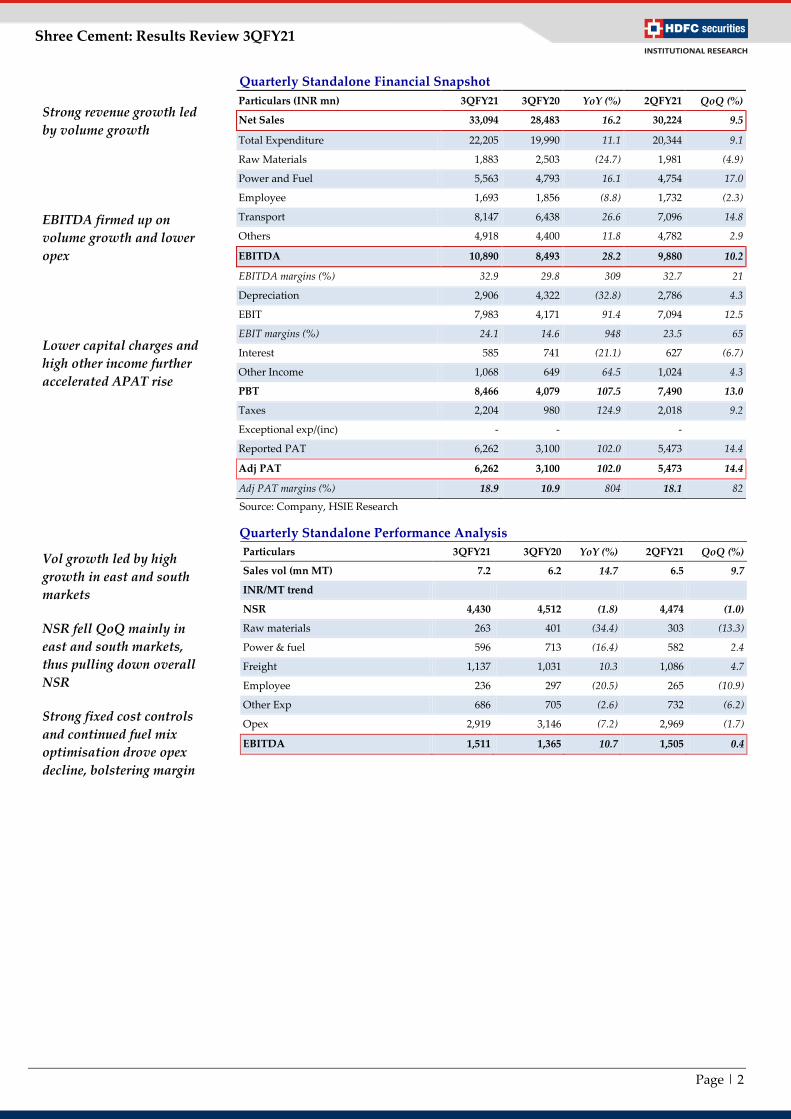
Quarterly Standalone Financial Snapshot
Particulars (INR mn) 3QFY21 3QFY20 YoY (%) 2QFY21 QoQ (%)
Net Sales 33,094 28,483 16.2 30,224 9.5
Total Expenditure 22,205 19,990 11.1 20,344 9.1
Raw Materials 1,883 2,503 (24.7) 1,981 (4.9)
Power and Fuel 5,563 4,793 16.1 4,754 17.0
Employee 1,693 1,856 (8.8) 1,732 (2.3)
Transport 8,147 6,438 26.6 7,096 14.8
Others 4,918 4,400 11.8 4,782 2.9
EBITDA 10,890 8,493 28.2 9,880 10.2
EBITDA margins (%) 32.9 29.8 309 32.7 21
Depreciation 2,906 4,322 (32.8) 2,786 4.3
EBIT 7,983 4,171 91.4 7,094 12.5
EBIT margins (%) 24.1 14.6 948 23.5 65
Interest 585 741 (21.1) 627 (6.7)
Other Income 1,068 649 64.5 1,024 4.3
PBT 8,466 4,079 107.5 7,490 13.0
Taxes 2,204 980 124.9 2,018 9.2
Exceptional exp/(inc) - - -
Reported PAT 6,262 3,100 102.0 5,473 14.4
Adj PAT 6,262 3,100 102.0 5,473 14.4
Adj PAT margins (%) 18.9 10.9 804 18.1 82
Source: Company, HSIE Research
Quarterly Standalone Performance Analysis
Particulars 3QFY21 3QFY20 YoY (%) 2QFY21 QoQ (%)
Sales vol (mn MT) 7.2 6.2 14.7 6.5 9.7
INR/MT trend
NSR 4,430 4,512 (1.8) 4,474 (1.0)
Raw materials 263 401 (34.4) 303 (13.3)
Power & fuel 596 713 (16.4) 582 2.4
Freight 1,137 1,031 10.3 1,086 4.7
Employee 236 297 (20.5) 265 (10.9)
Other Exp 686 705 (2.6) 732 (6.2)
Opex 2,919 3,146 (7.2) 2,969 (1.7)
EBITDA 1,511 1,365 10.7 1,505 0.4
Strong revenue growth led
by volume growth
EBITDA firmed up on
volume growth and lower
opex
Lower capital charges and
high other income further
accelerated APAT rise
Vol growth led by high
growth in east and south
markets
NSR fell QoQ mainly in
east and south markets,
thus pulling down overall
NSR
Strong fixed cost controls
and continued fuel mix
optimisation drove opex
decline, bolstering margin

Page | 3
Shree Cement: Results Review 3QFY21
Standalone Operational Trends and Assumptions
Particulars FY18 FY19 FY20 FY21E FY22E FY23E
Sales Capacity (mn MT) 34.8 37.8 40.3 46.3 46.3 46.3
Sales Volume (mn MT) 22.5 25.9 24.9 26.0 28.4 32.3
YoY change (%) 9.5 14.8 (3.6) 4.3 9.3 13.7
Capacity Utilisation (%) 64.8 68.4 61.9 56.1 61.3 69.7
(INR/ MT trend)
NSR (1) 4,172 4,223 4,568 4,494 4,613 4,740
YoY change (%) 7.0 1.2 8.2 (1.6) 2.6 2.7
Raw Materials (2) 342 334 308 300 309 319
Power & Fuel (3) 693 822 797 670 683 697
Freight costs (4) 1,120 1,116 1,045 1,100 1,131 1,170
Employee cost (5) 261 262 293 280 275 285
Other expense (6) 683 688 713 681 702 704
Total Opex (7)= sum(2 thru 6) 3,099 3,223 3,157 3,031 3,100 3,175
YoY change (%) 12.5 4.0 (2.0) (4.0) 2.3 2.4
EBITDA per MT (1-7) 1,073 1,000 1,459 1,488 1,513 1,565
YoY change (%) (6.2) (6.8) 45.8 2.0 1.7 3.4
Source: Company, HSIE Research
We model in 9/1% sales
volume and NSR CAGR
during FY20-23E
Subsequently, we model in
unitary EBIDTA to expand
to ~INR 1565/MT

Page | 4
Shree Cement: Results Review 3QFY21
Financials Income Statement
YE Mar (INR mn) FY18 FY19 FY20 FY21E FY22E FY23E
Revenues 98,331 117,220 119,040 122,285 135,753 158,017
Growth % 14.4 19.2 1.6 2.7 11.0 16.4
Raw Material 7,704 8,642 7,682 7,799 8,776 10,287
Power & Fuel 19,797 27,450 23,476 21,778 23,228 26,519
Freight Expense 25,249 28,869 26,061 28,596 32,123 37,795
Employee cost 5,881 6,778 7,310 7,279 7,811 9,203
Other Expenses 15,381 17,787 17,765 17,709 19,936 22,727
EBITDA 24,320 27,693 36,745 39,124 43,879 51,487
EBIDTA Margin (%) 24.7 23.6 30.9 32.0 32.3 32.6
EBITDA Growth % (3.2) 13.9 32.7 6.5 12.2 17.3
Depreciation 8,994 13,917 16,994 13,288 14,380 16,580
EBIT 15,326 13,776 19,751 25,836 29,499 34,906
Other Income (Including EO Items) 4,294 (493) 2,716 4,232 4,443 4,665
Interest 1,353 2,470 2,865 2,121 1,718 1,918
PBT 18,267 10,814 19,602 27,947 32,224 37,654
Tax 4,430 1,304 3,900 6,987 8,056 9,413
RPAT 13,837 9,510 15,702 20,960 24,168 28,240
EO (Loss) / Profit (Net Of Tax) 403 (2,947) - - - -
APAT 13,434 12,457 15,702 20,960 24,168 28,240
APAT Growth (%) 0.3 (7.3) 26.1 33.5 15.3 16.9
AEPS 385.6 357.6 435.2 580.9 669.8 782.7
AEPS Growth % 0.3 (7.3) 21.7 33.5 15.3 16.9
Source: Company, HSIE Research
Balance Sheet YE Mar (INR mn) FY18 FY19 FY20 FY21E FY22E FY23E
SOURCES OF FUNDS
Share Capital 348 348 361 361 361 361
Reserves And Surplus 88,620 95,626 129,003 146,356 166,194 189,744
Total Equity 88,968 95,974 129,364 146,717 166,555 190,104
Long-term Debt 22,171 23,300 24,458 14,387 14,387 19,387
Short-term Debt 11,859 4,680 7,087 7,087 7,087 7,087
Total Debt 34,030 27,980 31,546 21,474 21,474 26,474
Deferred Tax Liability (5,131) (6,126) (7,438) (7,438) (7,438) (7,438)
Long-term Liab+ Provisions 10,697 13,002 15,617 17,174 18,887 20,771
TOTAL SOURCES OF FUNDS 128,565 130,829 169,089 177,928 199,478 229,912
APPLICATION OF FUNDS
Net Block 35,892 44,757 43,189 44,901 55,521 53,941
Capital WIP 14,272 11,211 9,621 11,621 16,621 31,621
Goodwill - - - - - -
Other Non-current Assets 7,890 5,810 6,583 6,903 7,596 8,383
Total Non-current Investments - 21,583 25,579 25,579 25,579 25,579
Total Non-current Assets 58,053 83,361 84,972 89,004 105,317 119,524
Inventories 15,690 15,891 14,279 14,733 17,105 19,953
Debtors 4,593 7,324 8,285 9,167 9,826 11,462
Cash and Cash Equivalents 55,552 25,934 64,657 69,598 75,374 90,349
Other Current Assets (& Loans/adv) 12,400 13,297 13,749 12,797 11,984 11,298
Total Current Assets 88,235 62,446 100,969 106,296 114,289 133,061
Creditors 7,273 4,508 5,280 4,911 6,187 7,217
Other Current Liabilities & Provns 10,450 10,470 11,571 12,461 13,940 15,457
Total Current Liabilities 17,723 14,978 16,852 17,372 20,127 22,673
Net Current Assets 70,512 47,468 84,117 88,923 94,162 110,388
TOTAL APPLICATION OF FUNDS 128,565 130,829 169,089 177,928 199,478 229,912
Source: Company, HSIE Research

Page | 5
Shree Cement: Results Review 3QFY21
Cash Flow
YE Mar (INR mn) FY18 FY19 FY20 FY21E FY22E FY23E
Reported PBT 18,272 12,596 19,602 27,947 32,224 37,654
Non-operating & EO Items (3,632) (784) (2,680) (4,232) (4,443) (4,665)
Interest Expenses 1,353 2,470 2,865 2,121 1,718 1,918
Depreciation 8,994 13,917 16,994 13,288 14,380 16,580
Working Capital Change (1,131) (5,302) 5,591 1,372 1,558 (156)
Tax Paid (5,068) (2,300) (4,859) (6,987) (8,056) (9,413)
OPERATING CASH FLOW ( a ) 18,788 20,597 37,514 33,509 37,381 41,917
Capex (25,263) (18,853) (12,941) (17,000) (30,000) (30,000)
Free Cash Flow (FCF) (6,475) 1,744 24,573 16,509 7,381 11,917
Investments (18,365) 8,234 (42,698) - - -
Non-operating Income 7,680 2,493 1,906 4,232 4,443 4,665
Others
INVESTING CASH FLOW ( b ) (35,947) (8,126) (53,733) (12,768) (25,557) (25,335)
Debt Issuance/(Repaid) 20,353 (7,591) 1,175 (10,071) - 5,000
Interest Expenses (1,248) (2,753) (2,868) (2,121) (1,718) (1,918)
FCFE 12,631 (8,600) 22,880 4,317 5,663 14,999
Share Capital Issuance - - 23,833 - - -
Dividend (1,843) (2,308) (6,231) (3,608) (4,330) (4,690)
FINANCING CASH FLOW ( c ) 17,262 (12,653) 15,910 (15,800) (6,048) (1,608)
NET CASH FLOW (a+b+c) 102 (182) (310) 4,941 5,777 14,974
EO Items, Others
Closing Cash & Equivalents 41,638 55,370 25,625 69,598 75,374 90,349
Key Ratios FY18 FY19 FY20 FY21E FY22E FY23E
PROFITABILITY %
EBITDA Margin 24.7 23.6 30.9 32.0 32.3 32.6
EBIT Margin 15.6 11.8 16.6 21.1 21.7 22.1
APAT Margin 13.7 10.6 13.2 17.1 17.8 17.9
RoE 16.2 13.5 13.9 15.2 15.4 15.8
RoIC 18.4 13.6 15.1 18.2 19.0 19.9
RoCE 13.1 11.0 12.0 13.0 13.5 13.8
EFFICIENCY
Tax Rate % 24.3 12.1 19.9 25.0 25.0 25.0
Fixed Asset Turnover (x) 1.8 1.5 1.2 1.1 1.0 1.0
Inventory (days) 58 49 44 44 46 46
Debtors (days) 17 23 25 27 26 26
Other Current Assets (days) 75 59 62 59 53 45
Payables (days) 27 14 16 15 17 17
Other Current Liab & Provns (days) 78 73 83 88 88 84
Cash Conversion Cycle (days) 45 45 32 27 20 18
Net Debt/EBITDA (x) (0.9) 0.1 (0.9) (1.2) (1.2) (1.2)
Net D/E (0.2) 0.0 (0.3) (0.3) (0.3) (0.3)
Interest Coverage 11.3 5.6 6.9 12.2 17.2 18.2
PER SHARE DATA (INR)
EPS 385.6 357.6 435.2 580.9 669.8 782.7
CEPS 643.8 757.0 906.2 949.2 1,068.4 1,242.2
Dividend 50.0 60.0 110.0 100.0 120.0 130.0
Book Value 2,553.8 2,754.9 3,585.4 4,066.3 4,616.2 5,268.9
VALUATION
P/E (x) 60.6 65.3 51.8 38.8 33.7 28.8
P/Cash EPS (x) 35.6 34.7 24.9 23.8 21.1 18.2
P/BV (x) 9.1 8.5 6.3 5.5 4.9 4.3
EV/EBITDA (x) 32.6 29.5 21.2 19.6 17.3 14.6
EV/MT (INR bn) 23.34 19.75 18.51 17.37 17.24 15.37
Dividend Yield (%) 0.2 0.3 0.5 0.4 0.5 0.6
OCF/EV (%) 2.4 2.5 4.8 4.4 4.9 5.6
FCFF/EV (%) (0.8) 0.2 3.1 2.2 1.0 1.6
FCFE/M Cap (%) 1.6 (1.1) 2.8 0.5 0.7 1.8
Source: Company, HSIE Research

Page | 6
Shree Cement: Results Review 3QFY21
Rating Criteria
BUY: >+15% return potential
ADD: +5% to +15% return potential
REDUCE: -10% to +5% return potential
SELL: > 10% Downside return potential
Date CMP Reco Target
10-Jan-20 22,815 NEU 20,000
17-Feb-20 24,434 SELL 19,900
2-Mar-20 22,671 SELL 20,600
5-Mar-20 23,256 SELL 20,600
17-Apr-20 18,929 REDUCE 17,900
7-May-20 18,432 REDUCE 17,900
8-May-20 18,733 REDUCE 17,900
8-Jul-20 22,850 REDUCE 17,900
14-Jul-20 22,300 REDUCE 20,900
11-Aug-20 22,396 REDUCE 20,900
22-Sep-20 18,840 REDUCE 20,900
14-Oct-20 20,965 ADD 21,700
13-Nov-20 23,442 ADD 24,500
11-Jan-21 25,814 REDUCE 25,500
1-Feb-21 22,749 ADD 25,500
From 2nd March 2020, we have moved to new rating system
RECOMMENDATION HISTORY
10,000
12,000
14,000
16,000
18,000
20,000
22,000
24,000
26,000
Jan
-20
Feb
-20
Ma
r-2
0
Ap
r-2
0
Ma
y-2
0
Jun
-20
Jul-
20
Au
g-2
0
Sep
-20
Oct
-20
No
v-2
0
Dec
-20
Jan
-21
Shree Cement TP

Page | 7
Shree Cement: Results Review 3QFY21
Disclosure:
We, Rajesh Ravi, MBA & Saurabh Dugar, MBA, authors and the names subscribed to this report, hereby certify that all of the views expressed in this research
report accurately reflect our views about the subject issuer(s) or securities. HSL has no material adverse disciplinary history as on the date of publication of this
report. We also certify that no part of our compensation was, is, or will be directly or indirectly related to the specific recommendation(s) or view(s) in this
report.
Research Analyst or his/her relative or HDFC Securities Ltd. does not have any financial interest in the subject company. Also Research Analyst or his relative
or HDFC Securities Ltd. or its Associate may have beneficial ownership of 1% or more in the subject company at the end of the month immediately preceding
the date of publication of the Research Report. Further Research Analyst or his relative or HDFC Securities Ltd. or its associate does not have any material
conflict of interest.
Any holding in stock –No
HDFC Securities Limited (HSL) is a SEBI Registered Research Analyst having registration no. INH000002475.
Disclaimer:
This report has been prepared by HDFC Securities Ltd and is solely for information of the recipient only. The report must not be used as a singular basis of any
investment decision. The views herein are of a general nature and do not consider the risk appetite or the particular circumstances of an individual investor;
readers are requested to take professional advice before investing. Nothing in this document should be construed as investment advice. Each recipient of this
document should make such investigations as they deem necessary to arrive at an independent evaluation of an investment in securities of the companies
referred to in this document (including merits and risks) and should consult their own advisors to determine merits and risks of such investment. The
information and opinions contained herein have been compiled or arrived at, based upon information obtained in good faith from sources believed to be
reliable. Such information has not been independently verified and no guaranty, representation of warranty, express or implied, is made as to its accuracy,
completeness or correctness. All such information and opinions are subject to change without notice. Descriptions of any company or companies or their
securities mentioned herein are not intended to be complete. HSL is not obliged to update this report for such changes. HSL has the right to make changes and
modifications at any time.
This report is not directed to, or intended for display, downloading, printing, reproducing or for distribution to or use by, any person or entity who is a citizen
or resident or located in any locality, state, country or other jurisdiction where such distribution, publication, reproduction, availability or use would be
contrary to law or regulation or what would subject HSL or its affiliates to any registration or licensing requirement within such jurisdiction.
If this report is inadvertently sent or has reached any person in such country, especially, United States of America, the same should be ignored and brought to
the attention of the sender. This document may not be reproduced, distributed or published in whole or in part, directly or indirectly, for any purposes or in
any manner.
Foreign currencies denominated securities, wherever mentioned, are subject to exchange rate fluctuations, which could have an adverse effect on their value or
price, or the income derived from them. In addition, investors in securities such as ADRs, the values of which are influenced by foreign currencies effectively
assume currency risk. It should not be considered to be taken as an offer to sell or a solicitation to buy any security.
This document is not, and should not, be construed as an offer or solicitation of an offer, to buy or sell any securities or other financial instruments. This report
should not be construed as an invitation or solicitation to do business with HSL. HSL may from time to time solicit from, or perform broking, or other services
for, any company mentioned in this mail and/or its attachments.
HSL and its affiliated company(ies), their directors and employees may; (a) from time to time, have a long or short position in, and buy or sell the securities of
the company(ies) mentioned herein or (b) be engaged in any other transaction involving such securities and earn brokerage or other compensation or act as a
market maker in the financial instruments of the company(ies) discussed herein or act as an advisor or lender/borrower to such company(ies) or may have any
other potential conflict of interests with respect to any recommendation and other related information and opinions.
HSL, its directors, analysts or employees do not take any responsibility, financial or otherwise, of the losses or the damages sustained due to the investments
made or any action taken on basis of this report, including but not restricted to, fluctuation in the prices of shares and bonds, changes in the currency rates,
diminution in the NAVs, reduction in the dividend or income, etc.
HSL and other group companies, its directors, associates, employees may have various positions in any of the stocks, securities and financial instruments dealt
in the report, or may make sell or purchase or other deals in these securities from time to time or may deal in other securities of the companies / organizations
described in this report.
HSL or its associates might have managed or co-managed public offering of securities for the subject company or might have been mandated by the subject
company for any other assignment in the past twelve months.
HSL or its associates might have received any compensation from the companies mentioned in the report during the period preceding twelve months from the
date of this report for services in respect of managing or co-managing public offerings, corporate finance, investment banking or merchant banking, brokerage
services or other advisory service in a merger or specific transaction in the normal course of business.
HSL or its analysts did not receive any compensation or other benefits from the companies mentioned in the report or third party in connection with
preparation of the research report. Accordingly, neither HSL nor Research Analysts have any material conflict of interest at the time of publication of this
report. Compensation of our Research Analysts is not based on any specific merchant banking, investment banking or brokerage service transactions. HSL may
have issued other reports that are inconsistent with and reach different conclusion from the information presented in this report.
Research entity has not been engaged in market making activity for the subject company. Research analyst has not served as an officer, director or employee of
the subject company. We have not received any compensation/benefits from the subject company or third party in connection with the Research Report.
HDFC securities Limited, I Think Techno Campus, Building - B, "Alpha", Office Floor 8, Near Kanjurmarg Station, Opp. Crompton Greaves, Kanjurmarg
(East), Mumbai 400 042 Phone: (022) 3075 3400 Fax: (022) 2496 5066 Compliance Officer: Binkle R. Oza Email: [email protected] Phone: (022)
3045 3600
HDFC Securities Limited, SEBI Reg. No.: NSE, BSE, MSEI, MCX: INZ000186937; AMFI Reg. No. ARN: 13549; PFRDA Reg. No. POP: 11092018; IRDA
Corporate Agent License No.: CA0062; SEBI Research Analyst Reg. No.: INH000002475; SEBI Investment Adviser Reg. No.: INA000011538; CIN -
U67120MH2000PLC152193
HDFC securities
Institutional Equities
Unit No. 1602, 16th Floor, Tower A, Peninsula Business Park,
Senapati Bapat Marg, Lower Parel, Mumbai - 400 013
Board: +91-22-6171-7330 www.hdfcsec.com