01 iea-task33 intro&recommendations
TRANSCRIPT
1

Implementing Agreement for Co-operation in the Research, Development, and Deployment of Wind Energy Systems
Data collection and reliability assessment for O&M optimization of wind turbinesBerthold Hahn, Fraunhofer IWES, Operating agent of IEA Wind Task 33Dr. Thomas Welte, SINTEF Energy researchProf. Dr. Gerard van Bussel, Delft University of Technology
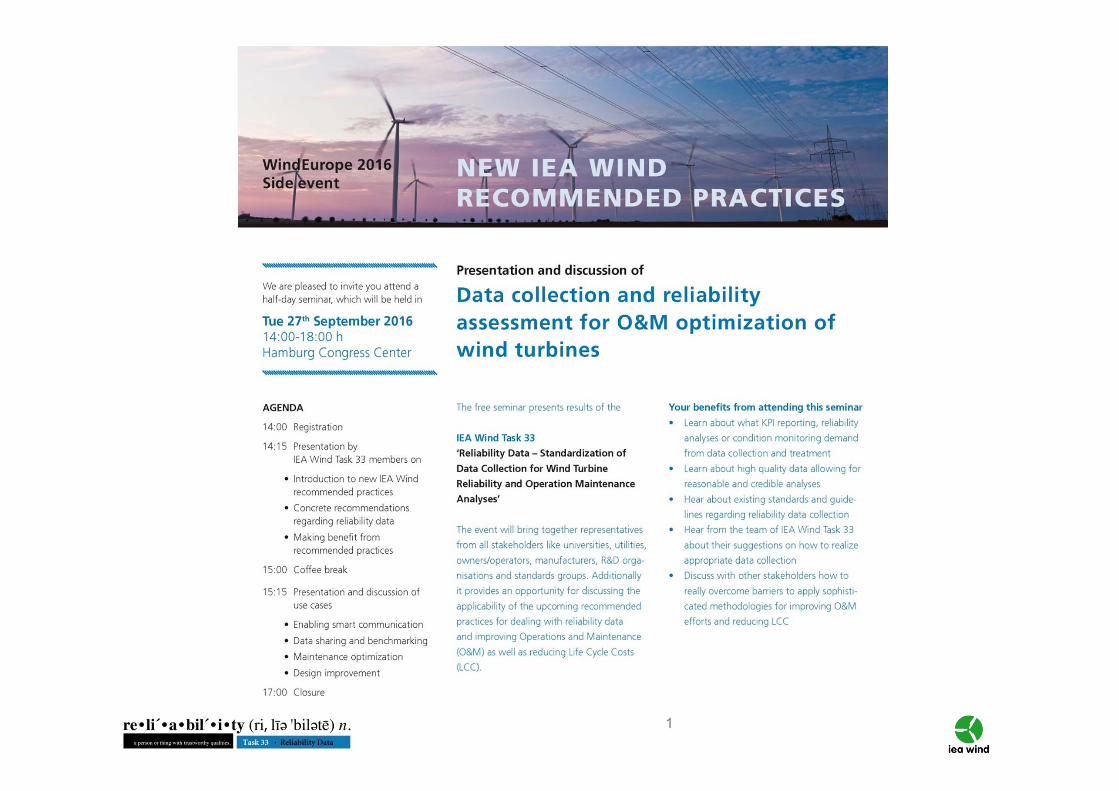
New IEA Windrecommended practices
WindEurope 2016 side event, 27th Sep, Hamburg, Germany
3
Data collection and reliability assessment forO&M optimization of wind turbines
Agenda
• Introduction to IEA Wind and task 33
• Detailed findings on analyses and data
• Recommendations to operators and wind community

IEA Wind
International Energy Agency (IEA) Implementing Agreement for Co-operation in the Research, Development, and Deployment of Wind Energy Systems - IEA Windwww.ieawind.org
• Founded in 1974• 20 member countries• Cooperative research • Forum for international
discussion of R&D issues

5
B. Hahn, Fraunhofer IWESM. Asgarpour, ECN Energy research Centre of the NetherlandsP. Bangalore, Chalmers University GothenburgS. Faulstich, Fraunhofer IWESK. Harrisson, ORE CatapultB. Karlson, Sandia National LabsF. O’Connor, ServusNetL. Pettersson, Vattenfall SwedenC. Soraghan, ORE CatapultC. Stock-Williams, ECN Energy research Centre of the NetherlandsJ. Dalsgaard Sorensen, DTU / University AalborgG. van Bussel, Delft University of TechnologyJ. Vatn, NTNU University TrondheimT. Welte, SINTEF Energy Research
Main contributors
5
6
IEA Wind Task 33
Task 33 - Reliability Data:
Standardizing data collection for wind turbine reliability and O&M analyses
7
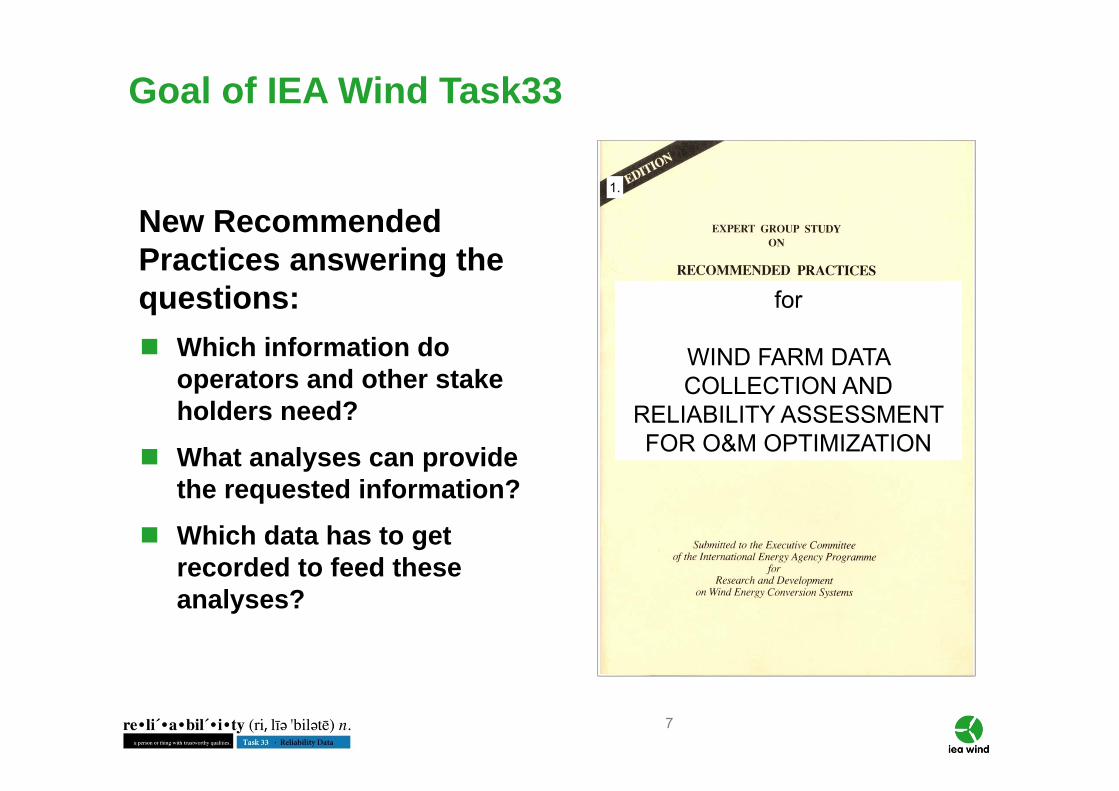
Goal of IEA Wind Task33
New Recommended Practices answering the questions: Which information do
operators and other stake holders need?
What analyses can provide the requested information?
Which data has to get recorded to feed these analyses?
for
WIND FARM DATA COLLECTION AND
RELIABILITY ASSESSMENT FOR O&M OPTIMIZATION
1.
8
The Task 33 Recommended practices do not intend to:
- Deal with health and safety issues- Deal with structural reliability testing- Provide the best reliability data base- Provide the standard for data collection
IEA Task 33 Reliability Data
9
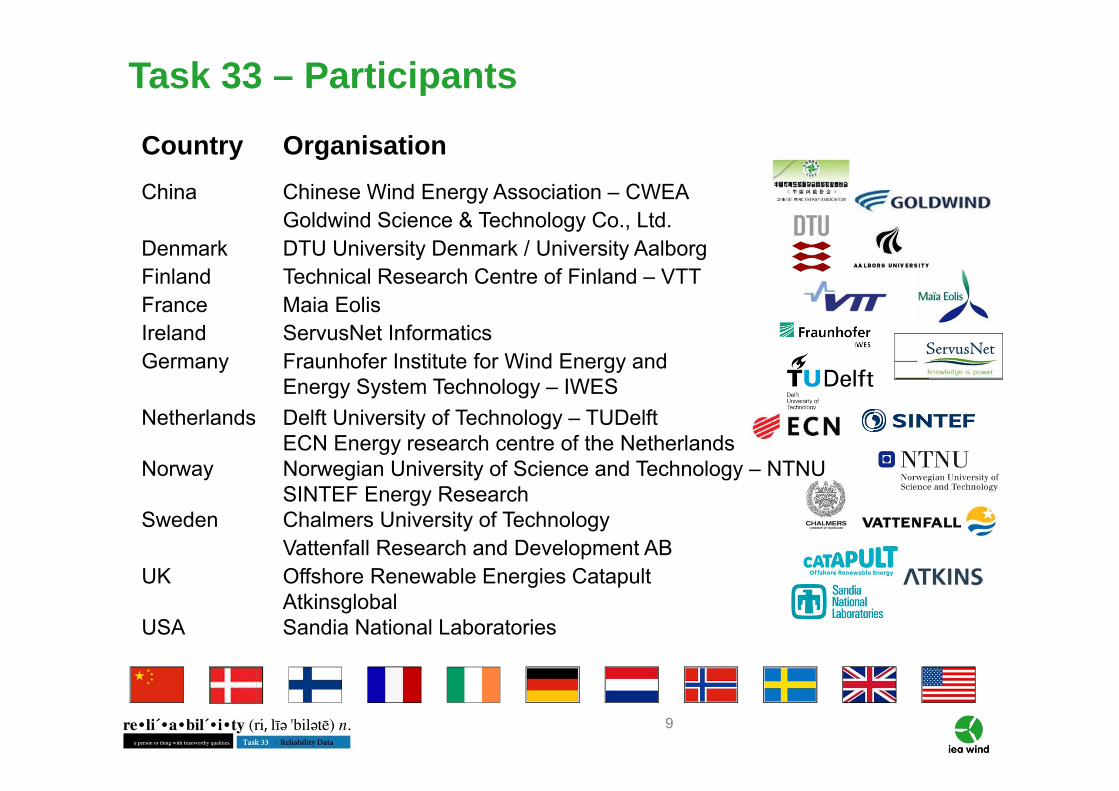
Task 33 – Participants
Country OrganisationChina Chinese Wind Energy Association – CWEA
Goldwind Science & Technology Co., Ltd.Denmark DTU University Denmark / University AalborgFinland Technical Research Centre of Finland – VTT France Maia EolisIreland ServusNet InformaticsGermany Fraunhofer Institute for Wind Energy and
Energy System Technology – IWES Netherlands Delft University of Technology – TUDelft
ECN Energy research centre of the NetherlandsNorway Norwegian University of Science and Technology – NTNU
SINTEF Energy ResearchSweden Chalmers University of Technology
Vattenfall Research and Development ABUK Offshore Renewable Energies Catapult
AtkinsglobalUSA Sandia National Laboratories
10
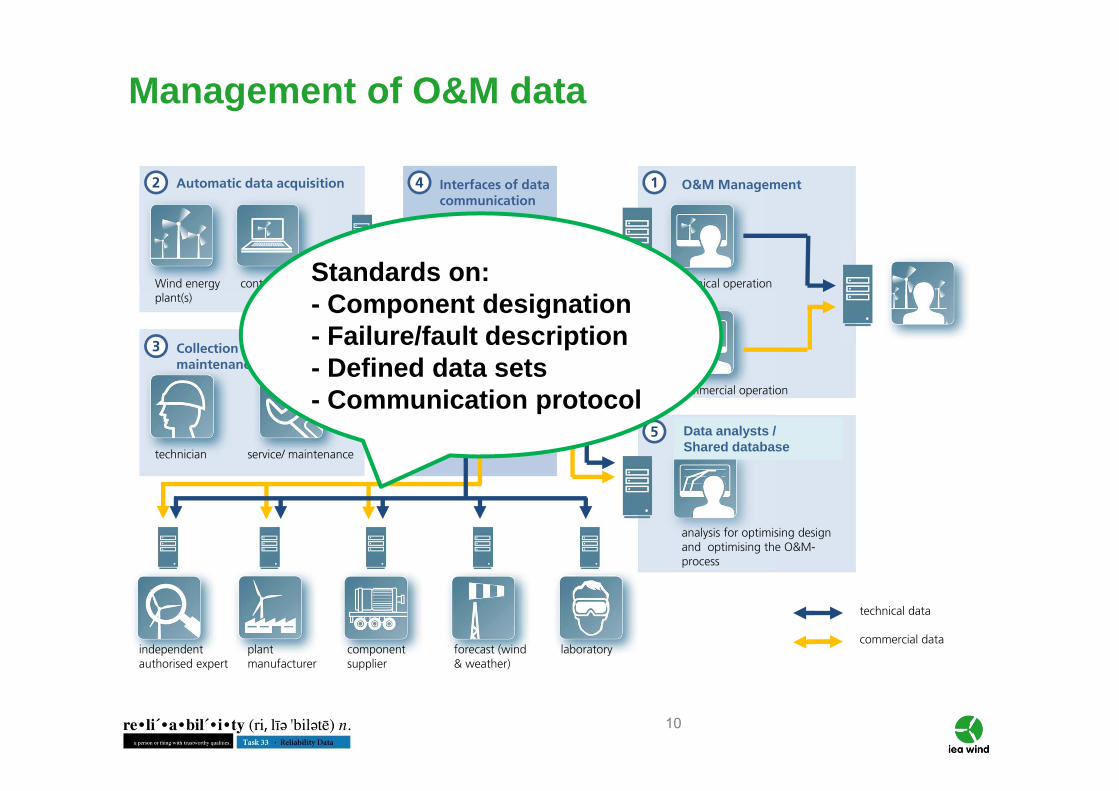
Management of O&M data
2
3
4 1
5
Wind energy plant(s)
controller/ SCADA technical operation
Automatic data acquisition
Collection of data during maintenance & inspection
O&M Management
WInD-Pool
Interfaces of datacommunication
service/ maintenancetechnician
laboratory
Commercial operation
forecast (wind& weather)
component supplier
plant manufacturer
independentauthorised expert
analysis for optimising design and optimising the O&M-process
technical data
commercial data
Standards on:- Component designation- Failure/fault description- Defined data sets- Communication protocol
Data analysts /Shared database

IEA Wind Task 33Recommended Practices for Reliability
Data
StandardsTaxonomies
DataEntries______________________________
Data Groups
Roles
ObjectivesAnalyses
From roles to taxonomies
12
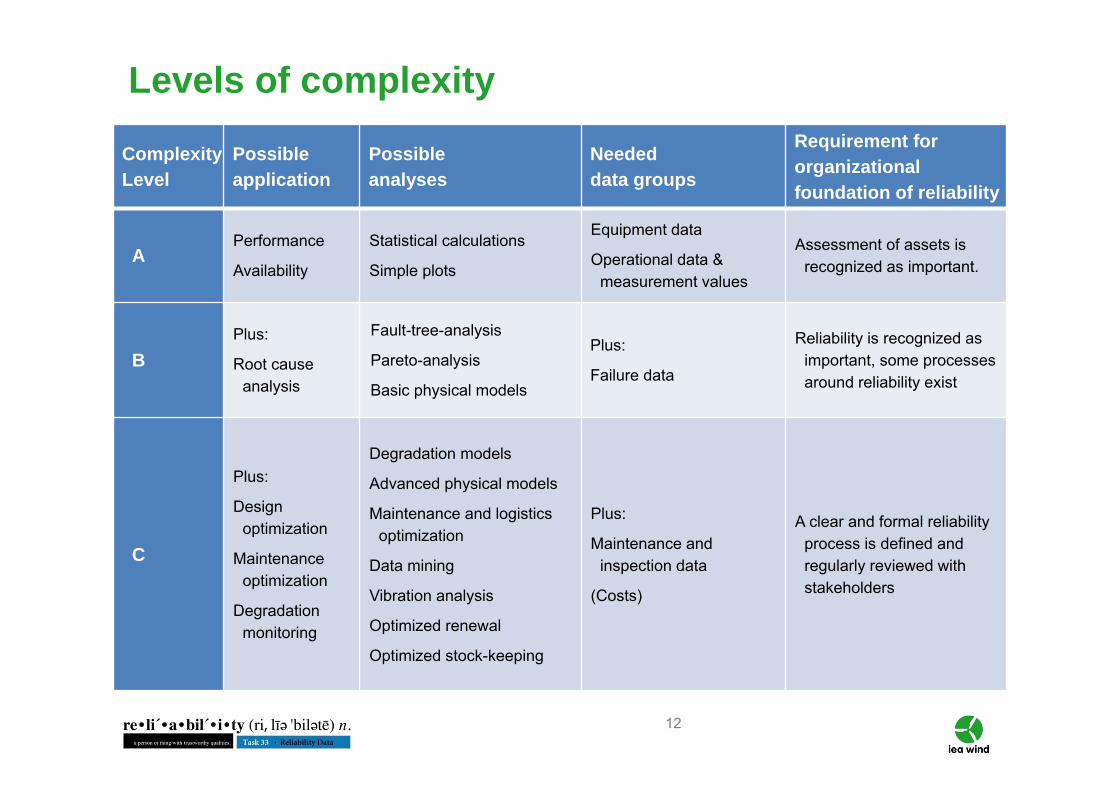
Complexity Level
Possibleapplication
Possibleanalyses
Neededdata groups
Requirement for organizational foundation of reliability
APerformance
Availability
Statistical calculations
Simple plots
Equipment data
Operational data & measurement values
Assessment of assets is recognized as important.
BPlus:
Root cause analysis
Fault-tree-analysis
Pareto-analysis
Basic physical models
Plus:
Failure data
Reliability is recognized as important, some processes around reliability exist
C
Plus:
Design optimization
Maintenance optimization
Degradation monitoring
Degradation models
Advanced physical models
Maintenance and logistics optimization
Data mining
Vibration analysis
Optimized renewal
Optimized stock-keeping
Plus:
Maintenance and inspection data
(Costs)
A clear and formal reliability process is defined and regularly reviewed with stakeholders
Levels of complexity
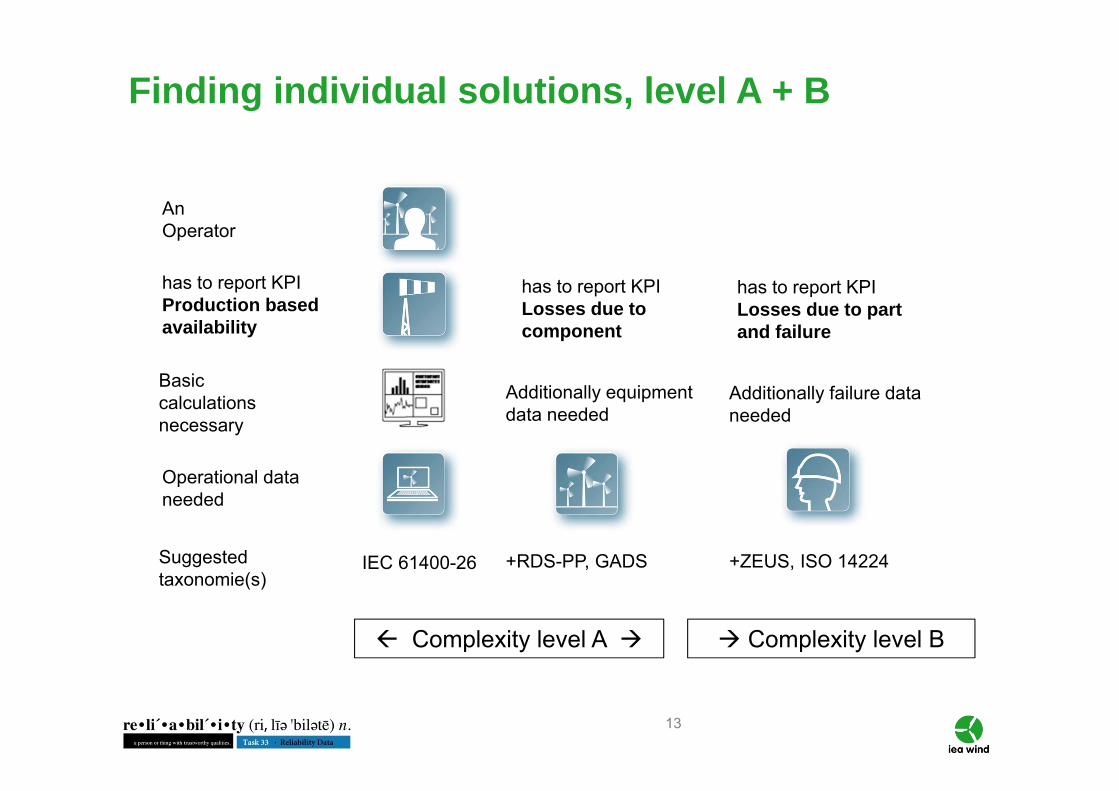
13
An Operator
has to report KPIProduction based availability
Operational data needed
Suggested taxonomie(s)
Basic calculations necessary
IEC 61400-26
has to report KPILosses due to component
has to report KPILosses due to part and failure
+RDS-PP, GADS +ZEUS, ISO 14224
Additionally equipment data needed
Additionally failure data needed
Finding individual solutions, level A + B
Complexity level A Complexity level B

14
An Operator
Detailed equipment data, operational data, failure data and maintenance data needed
Suggested Taxonomies IEC 61400-26 +RDS-PP, GADS
wants to optimize maintenance by grouping preventive measures
Modelling failure behavior needed
f(x)
+ZEUS, ISO 14224
Finding individual solutions, level C
Complexity level C
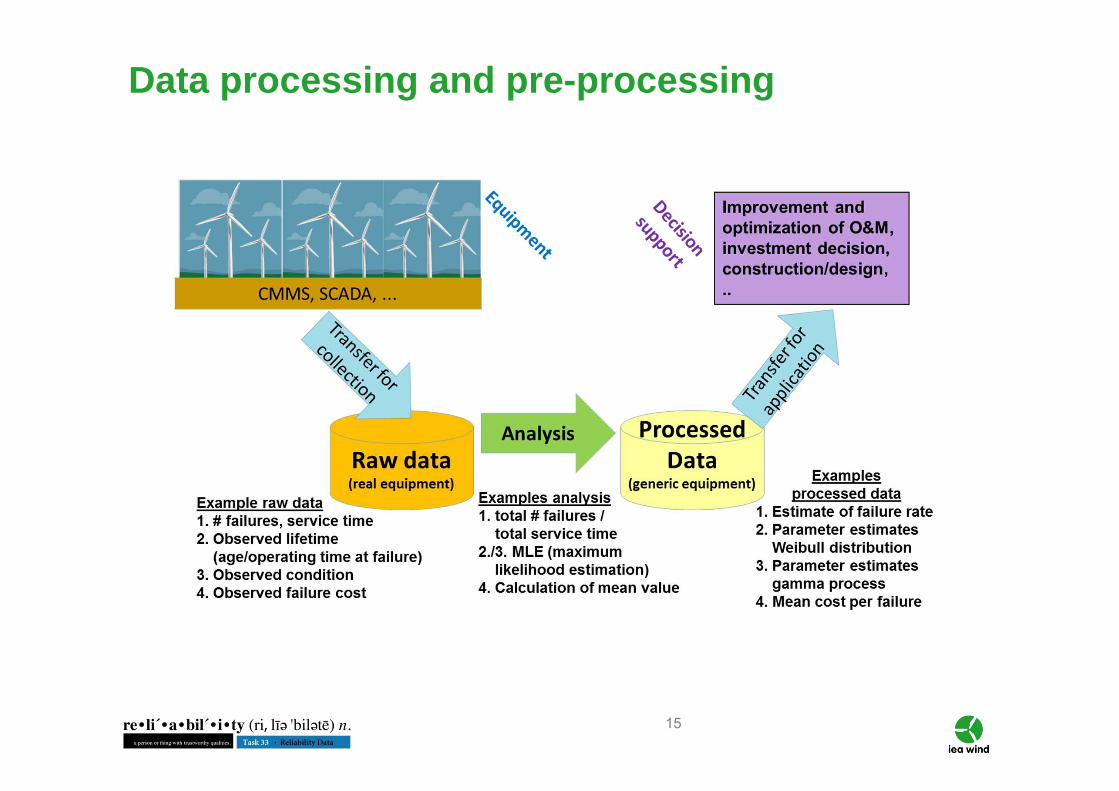
15
Data processing and pre-processing
16
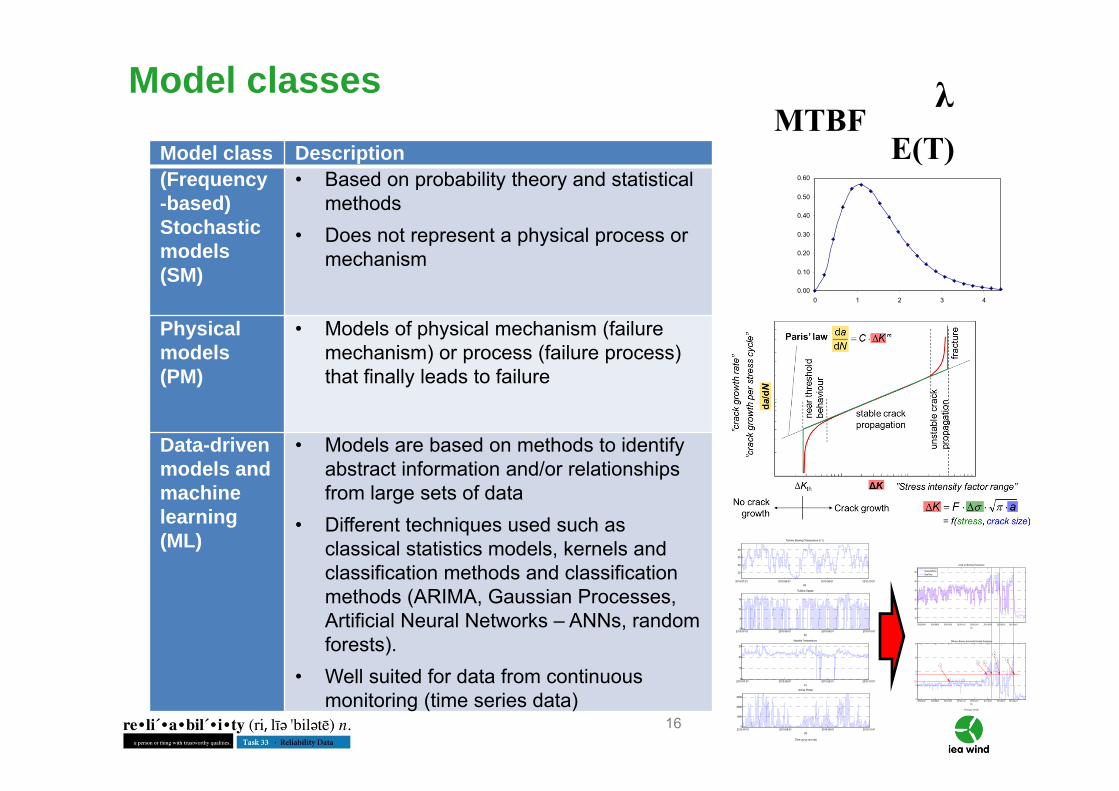
Model class Description(Frequency-based)Stochastic models (SM)
• Based on probability theory and statistical methods
• Does not represent a physical process or mechanism
Physical models (PM)
• Models of physical mechanism (failure mechanism) or process (failure process) that finally leads to failure
Data-driven models and machinelearning (ML)
• Models are based on methods to identify abstract information and/or relationships from large sets of data
• Different techniques used such as classical statistics models, kernels and classification methods and classification methods (ARIMA, Gaussian Processes, Artificial Neural Networks – ANNs, random forests).
• Well suited for data from continuous monitoring (time series data)
Model classes
0.00
0.10
0.20
0.30
0.40
0.50
0.60
0 1 2 3 4
MTBFλ
E(T)
2010-07-01 2010-08-01 2010-09-01 2010-10-01
25
30
35
40
(a)
Turbine Bearing Temperature (t-1)
2010-07-01 2010-08-01 2010-09-01 2010-10-010
5
10
15
(b)
Turbine Speed
2010-07-01 2010-08-01 2010-09-01 2010-10-010
10
20
30
(c)
Nacelle Temperature
2010-07-01 2010-08-01 2010-09-01 2010-10-010
1000
2000
3000
Active Power
(d)
Time (yyyy-mm-dd)
2010-08-01 2010-09-01 2010-10-01 2010-11-01 2010-12-01 2011-01-01 2011-02-01 2011-03-01
10
20
30
40
50
60
(a)
Actual and Estimated Temperature
EstimatedTempBearTemp
2010-08-01 2010-09-01 2010-10-01 2010-11-01 2010-12-01 2011-01-01 2011-02-01 2011-03-01-5
0
5
10
15Difference Between Actual and Estimated Temperature
(b)
Time (yyyy-mm-dd)
4
52 3
1
4
1.5

17
Factors influencing model choice
System complexity
System novelty
Prediction horizon
Quantitative vs. qualitative
Single vs. multiple faults
Single vs. population of components
Time or sequence dependent behavior
Usability for dependent events
Bottom-up vs. top-down
Level of experience requiredAcceptance and commonality of method
Need for and availability of tools
Standardization
18
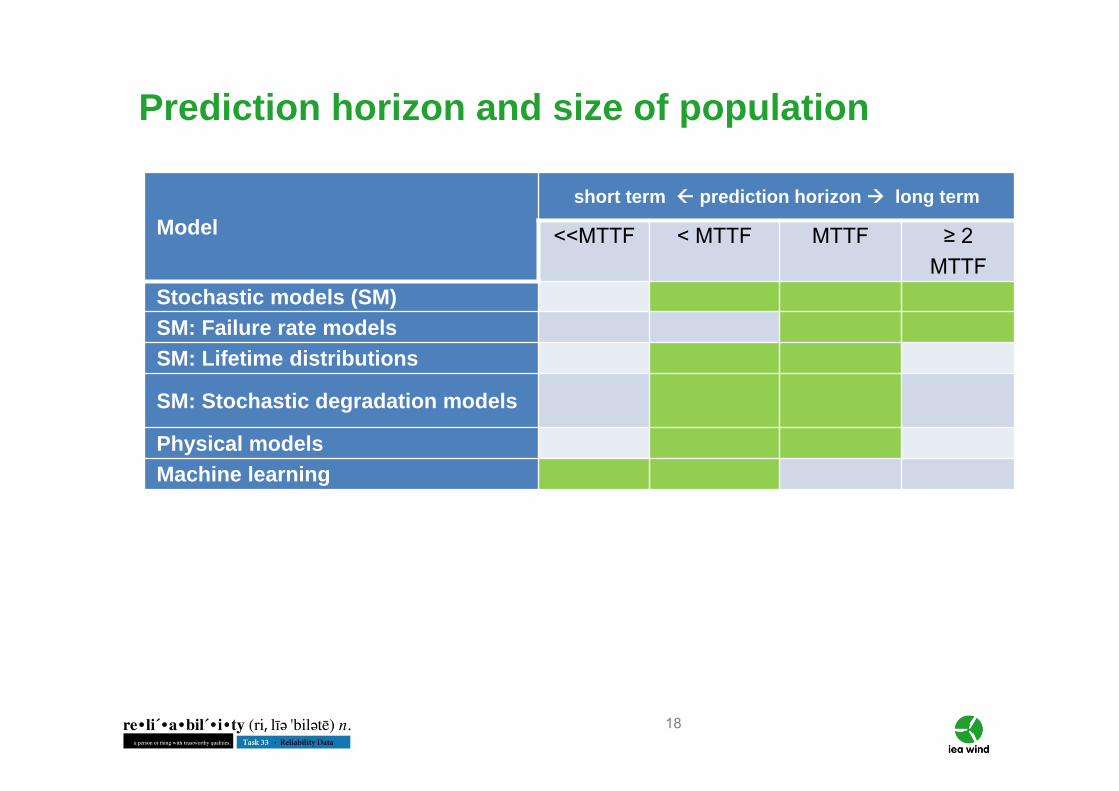
Prediction horizon and size of population
Modelshort term prediction horizon long term
<<MTTF < MTTF MTTF ≥ 2 MTTF
Stochastic models (SM)SM: Failure rate modelsSM: Lifetime distributions
SM: Stochastic degradation models
Physical modelsMachine learning
19
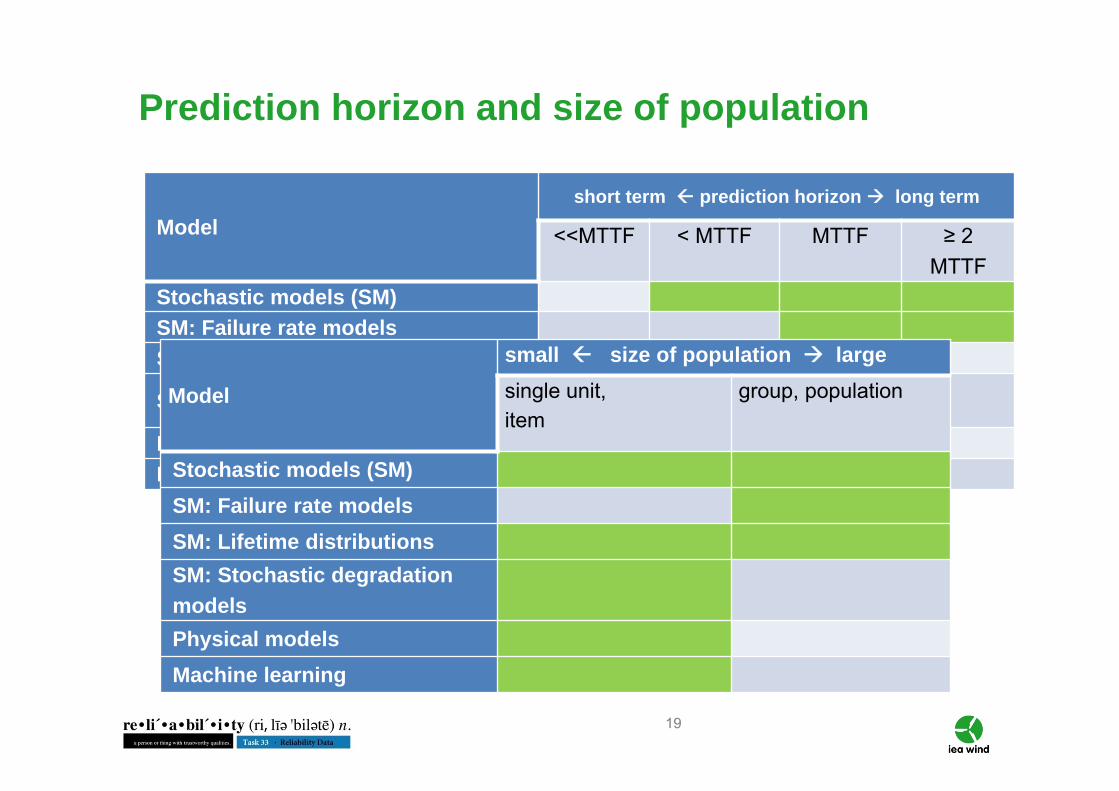
Prediction horizon and size of population
Modelshort term prediction horizon long term
<<MTTF < MTTF MTTF ≥ 2 MTTF
Stochastic models (SM)SM: Failure rate modelsSM: Lifetime distributions
SM: Stochastic degradation models
Physical modelsMachine learning
Model
small size of population largesingle unit,item
group, population
Stochastic models (SM)SM: Failure rate modelsSM: Lifetime distributions SM: Stochastic degradation modelsPhysical modelsMachine learning
20
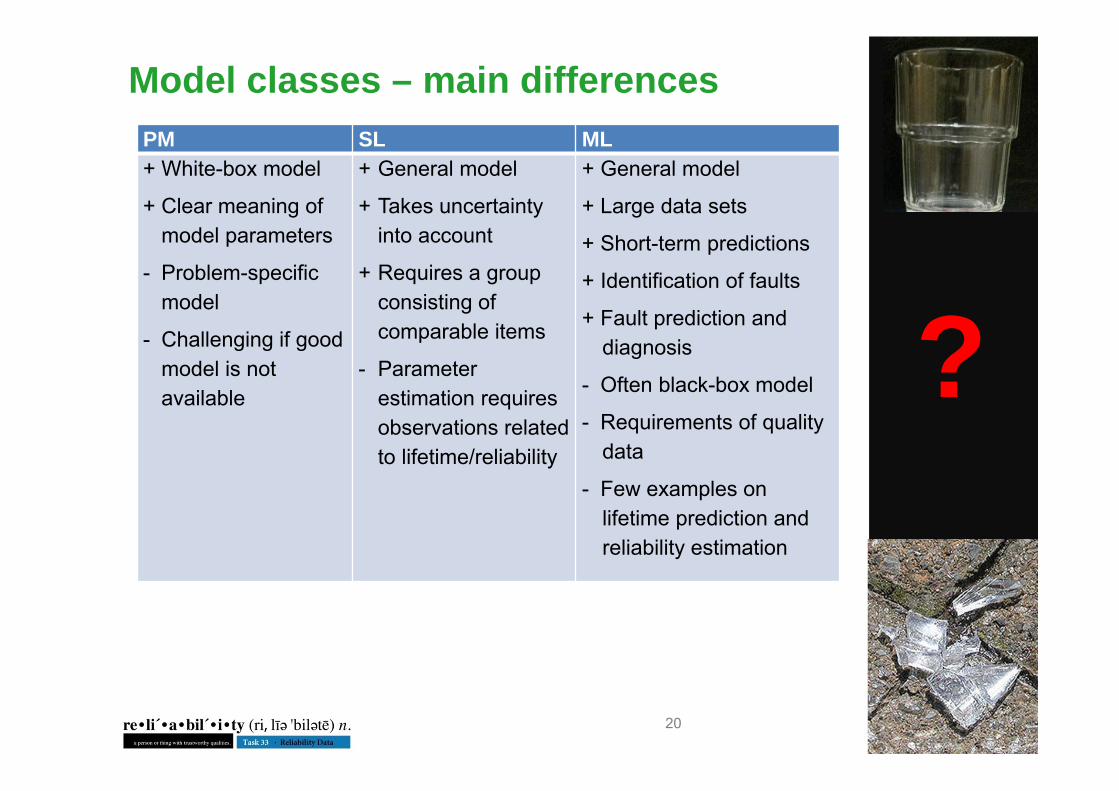
Model classes – main differencesPM SL ML+ White-box model
+ Clear meaning of model parameters
- Problem-specific model
- Challenging if good model is not available
+ General model
+ Takes uncertainty into account
+ Requires a group consisting of comparable items
- Parameter estimation requires observations related to lifetime/reliability
+ General model
+ Large data sets
+ Short-term predictions
+ Identification of faults
+ Fault prediction and diagnosis
- Often black-box model
- Requirements of qualitydata
- Few examples on lifetime prediction and reliability estimation
?
21
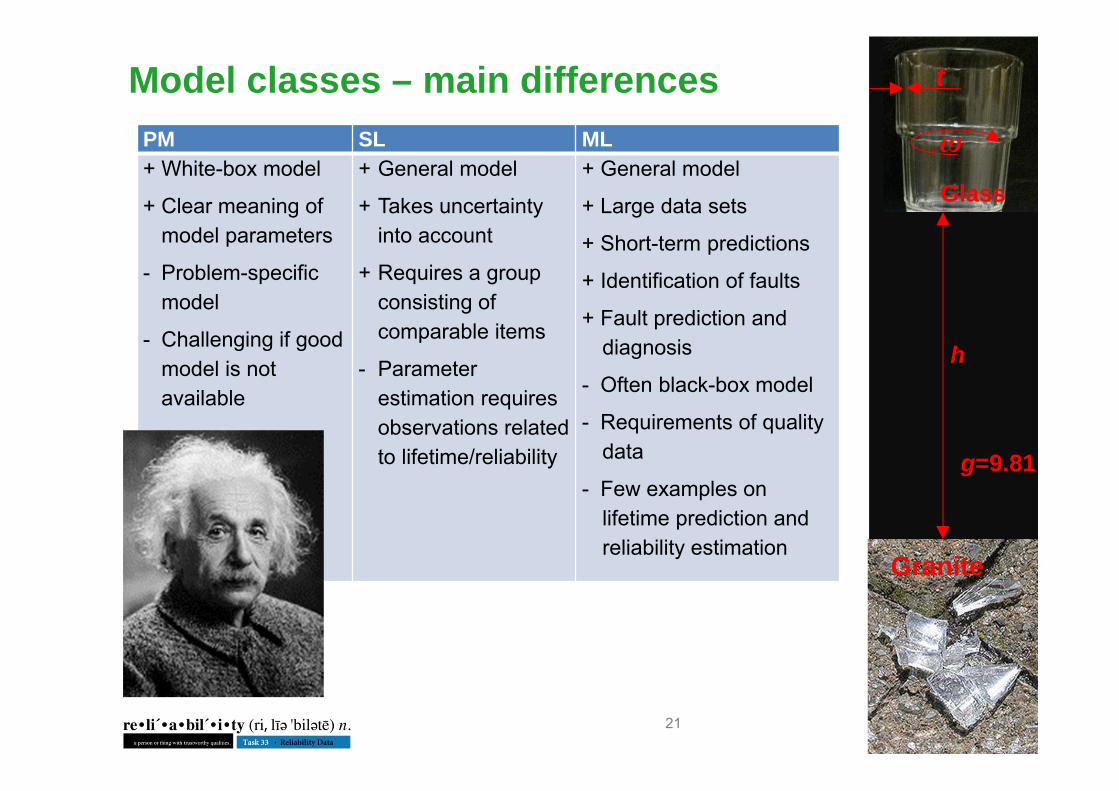
Model classes – main differencesPM SL ML+ White-box model
+ Clear meaning of model parameters
- Problem-specific model
- Challenging if good model is not available
+ General model
+ Takes uncertainty into account
+ Requires a group consisting of comparable items
- Parameter estimation requires observations related to lifetime/reliability
+ General model
+ Large data sets
+ Short-term predictions
+ Identification of faults
+ Fault prediction and diagnosis
- Often black-box model
- Requirements of qualitydata
- Few examples on lifetime prediction and reliability estimation
Glass
Granite
h
t
g=9.81
ω
22
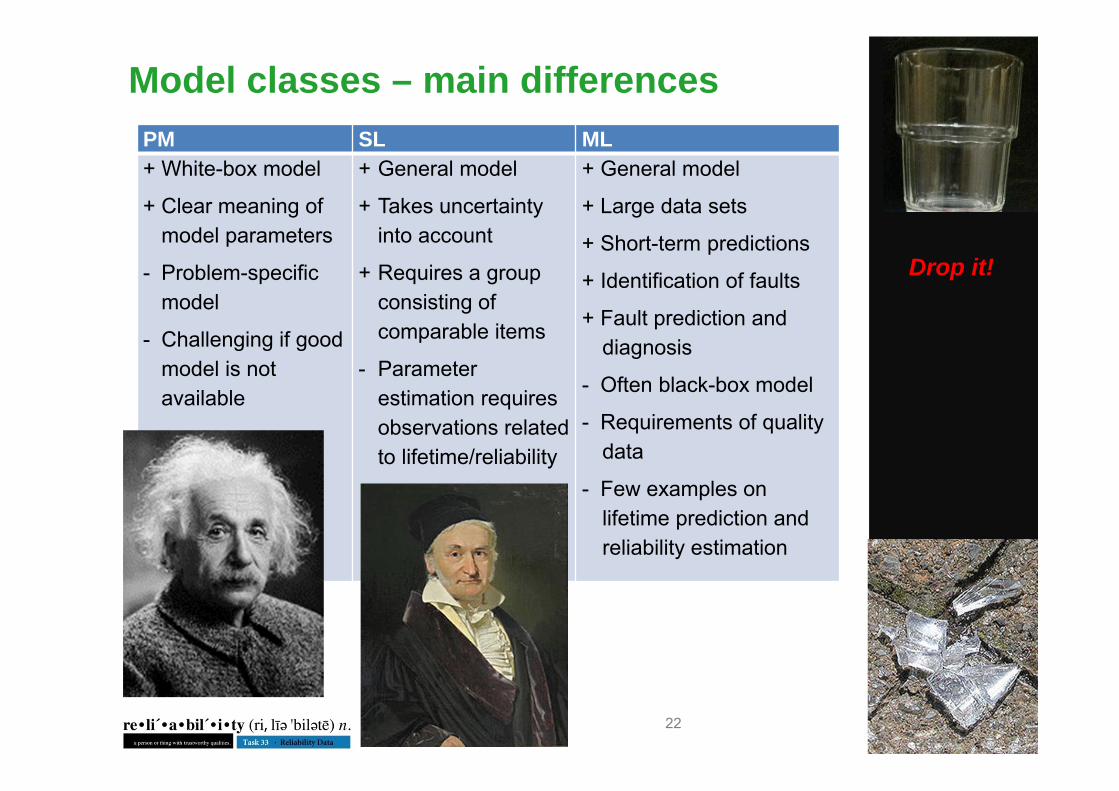
Model classes – main differencesPM SL ML+ White-box model
+ Clear meaning of model parameters
- Problem-specific model
- Challenging if good model is not available
+ General model
+ Takes uncertainty into account
+ Requires a group consisting of comparable items
- Parameter estimation requires observations related to lifetime/reliability
+ General model
+ Large data sets
+ Short-term predictions
+ Identification of faults
+ Fault prediction and diagnosis
- Often black-box model
- Requirements of qualitydata
- Few examples on lifetime prediction and reliability estimation
Drop it!

23
Model classes – main differencesPM SL ML+ White-box model
+ Clear meaning of model parameters
- Problem-specific model
- Challenging if good model is not available
+ General model
+ Takes uncertainty into account
+ Requires a group consisting of comparable items
- Parameter estimation requires observations related to lifetime/reliability
+ General model
+ Large data sets
+ Short-term predictions
+ Identification of faults
+ Fault prediction and diagnosis
- Often black-box model
- Requirements of qualitydata
- Few examples on lifetime prediction and reliability estimation
Drop it!
And again!
24
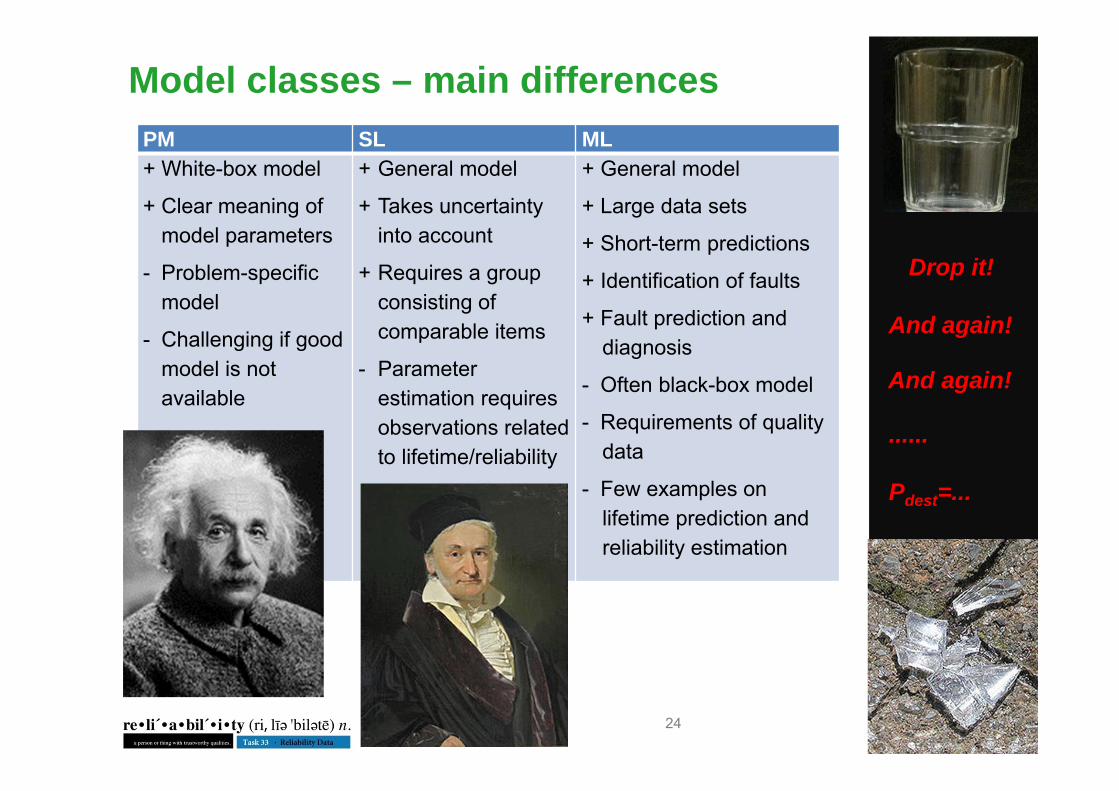
Model classes – main differencesPM SL ML+ White-box model
+ Clear meaning of model parameters
- Problem-specific model
- Challenging if good model is not available
+ General model
+ Takes uncertainty into account
+ Requires a group consisting of comparable items
- Parameter estimation requires observations related to lifetime/reliability
+ General model
+ Large data sets
+ Short-term predictions
+ Identification of faults
+ Fault prediction and diagnosis
- Often black-box model
- Requirements of qualitydata
- Few examples on lifetime prediction and reliability estimation
Drop it!
And again!
And again!
......
Pdest=...
25
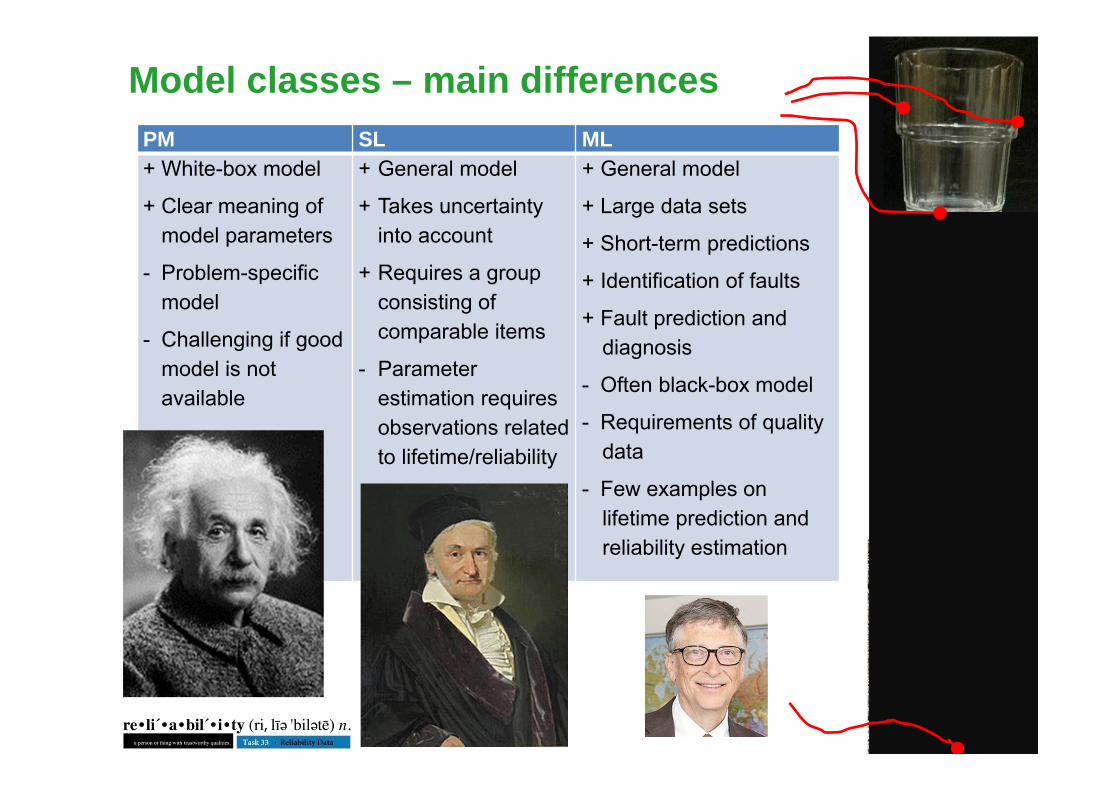
Model classes – main differencesPM SL ML+ White-box model
+ Clear meaning of model parameters
- Problem-specific model
- Challenging if good model is not available
+ General model
+ Takes uncertainty into account
+ Requires a group consisting of comparable items
- Parameter estimation requires observations related to lifetime/reliability
+ General model
+ Large data sets
+ Short-term predictions
+ Identification of faults
+ Fault prediction and diagnosis
- Often black-box model
- Requirements of qualitydata
- Few examples on lifetime prediction and reliability estimation
26
Summary models
Many different models No model serves all purposes Choice of model depends on different factors Difficult to recommend specific models
Overview of different model classes Typical application areas Typical input data requirements Recommendations on model choice
Recommended practices provide:
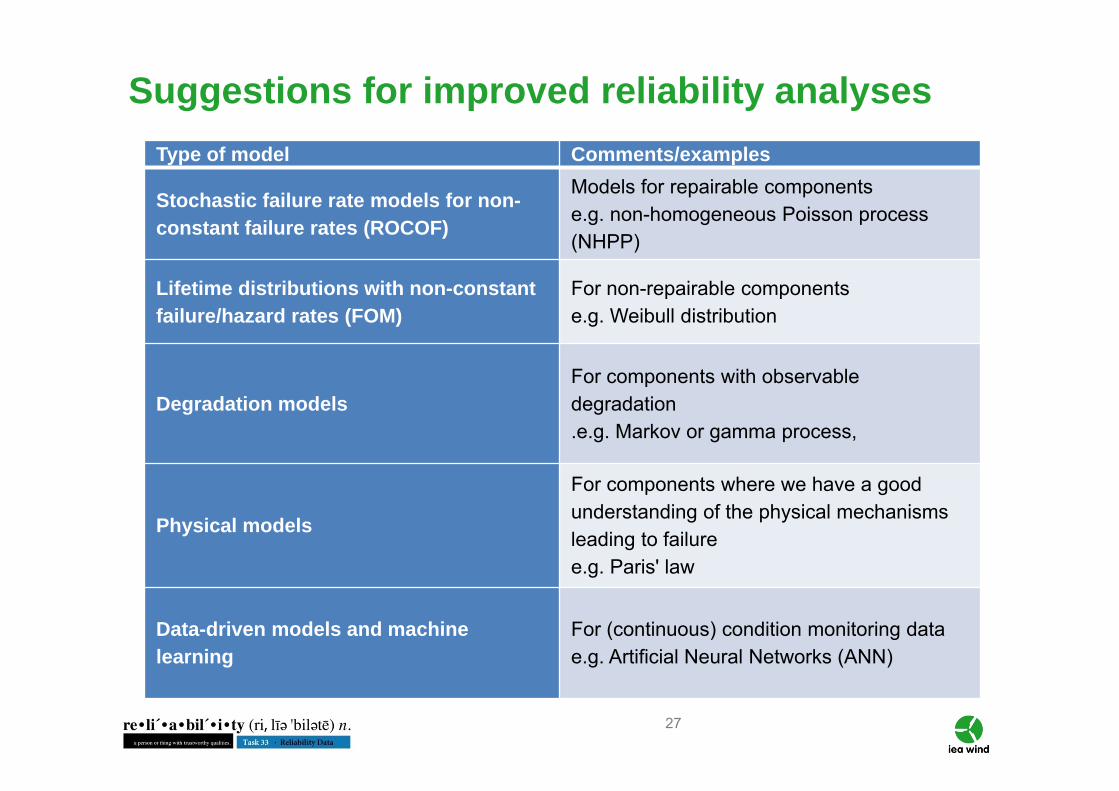
27
Suggestions for improved reliability analysesType of model Comments/examples
Stochastic failure rate models for non-constant failure rates (ROCOF)
Models for repairable componentse.g. non-homogeneous Poisson process (NHPP)
Lifetime distributions with non-constant failure/hazard rates (FOM)
For non-repairable componentse.g. Weibull distribution
Degradation modelsFor components with observable degradation.e.g. Markov or gamma process,
Physical models
For components where we have a good understanding of the physical mechanisms leading to failuree.g. Paris' law
Data-driven models and machine learning
For (continuous) condition monitoring datae.g. Artificial Neural Networks (ANN)

28
Data groups and sub-groupsData groups Sub-groups / objects
Equipment data (ED)IdentificationTime dataTechnical information
Operating data /measurement values (OP)
Time stampMeasurement values (SCADA, etc)Operational states
Failure / fault data (FD)
IdentificationTime dataFailure descriptionFailure effectFailure detectionFault properties
Maintenance & inspection data (MD)
IdentificationTime dataTask / measure / activityResourcesMaintenance results
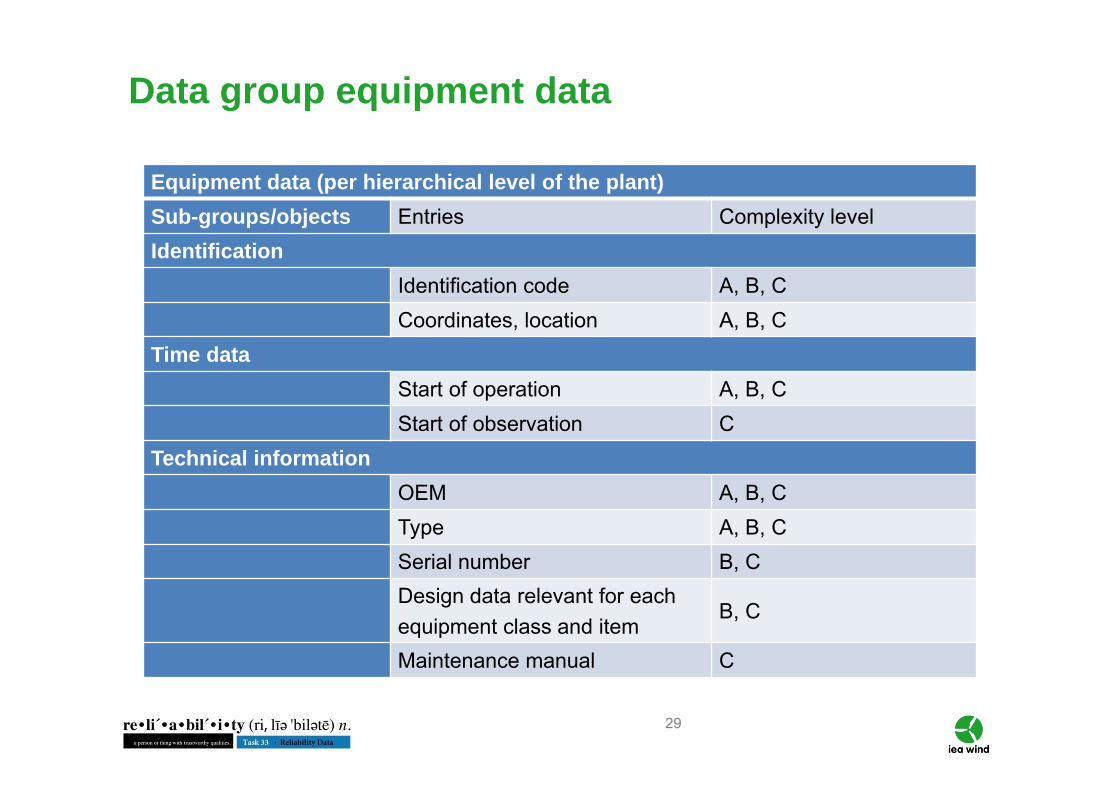
29
Data group equipment data
Equipment data (per hierarchical level of the plant)Sub-groups/objects Entries Complexity levelIdentification
Identification code A, B, CCoordinates, location A, B, C
Time dataStart of operation A, B, CStart of observation C
Technical informationOEM A, B, C Type A, B, C Serial number B, C Design data relevant for each equipment class and item
B, C
Maintenance manual C

30
Data groups /taxonomies Equipment data
Operating /measurement
data
Failure data
Maintenance & inspection data
VGB RDS-PP® o
NERC GADS o - -
ReliaWind o
ISO 14224 o* +* +*
FGW ZEUS o + +
IEC 61400-25 +
IEC 61400-26 o
Standards covering data groups and entries
+ entries with a high level of detailo entries with a medium level of detail- entries on a more general level* not wind-specific
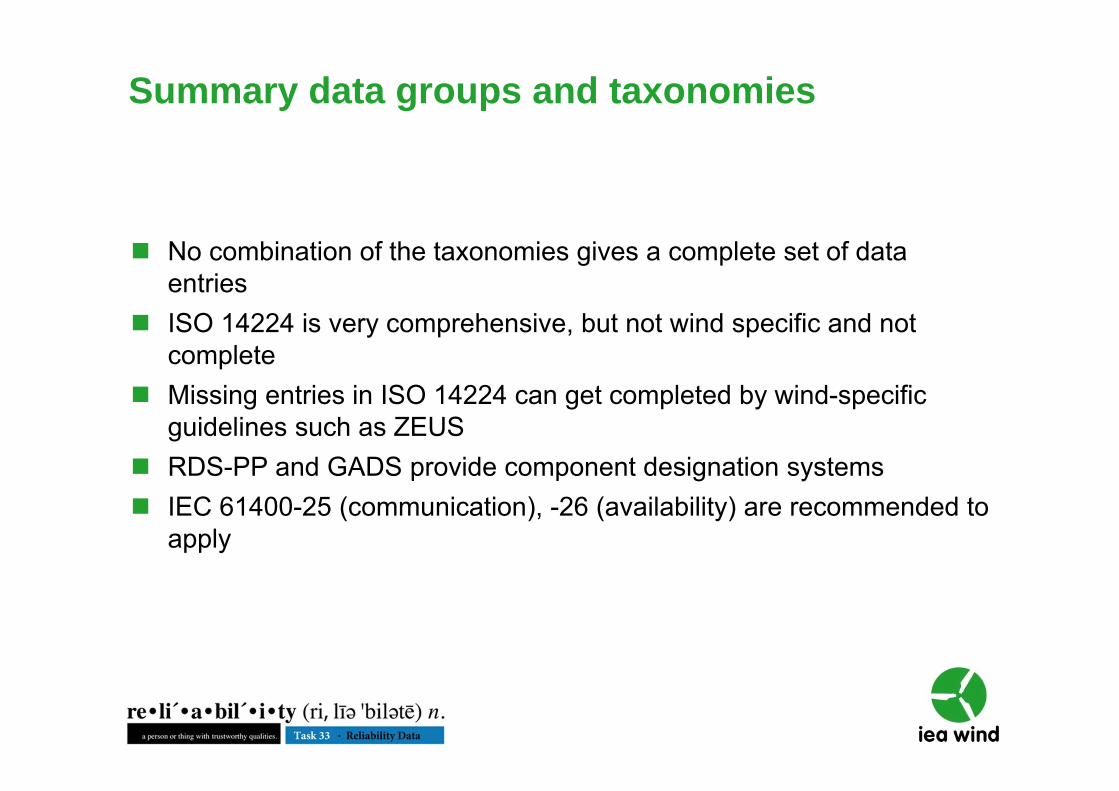
Summary data groups and taxonomies
No combination of the taxonomies gives a complete set of data entries
ISO 14224 is very comprehensive, but not wind specific and not complete
Missing entries in ISO 14224 can get completed by wind-specific guidelines such as ZEUS
RDS-PP and GADS provide component designation systems IEC 61400-25 (communication), -26 (availability) are recommended to
apply
32
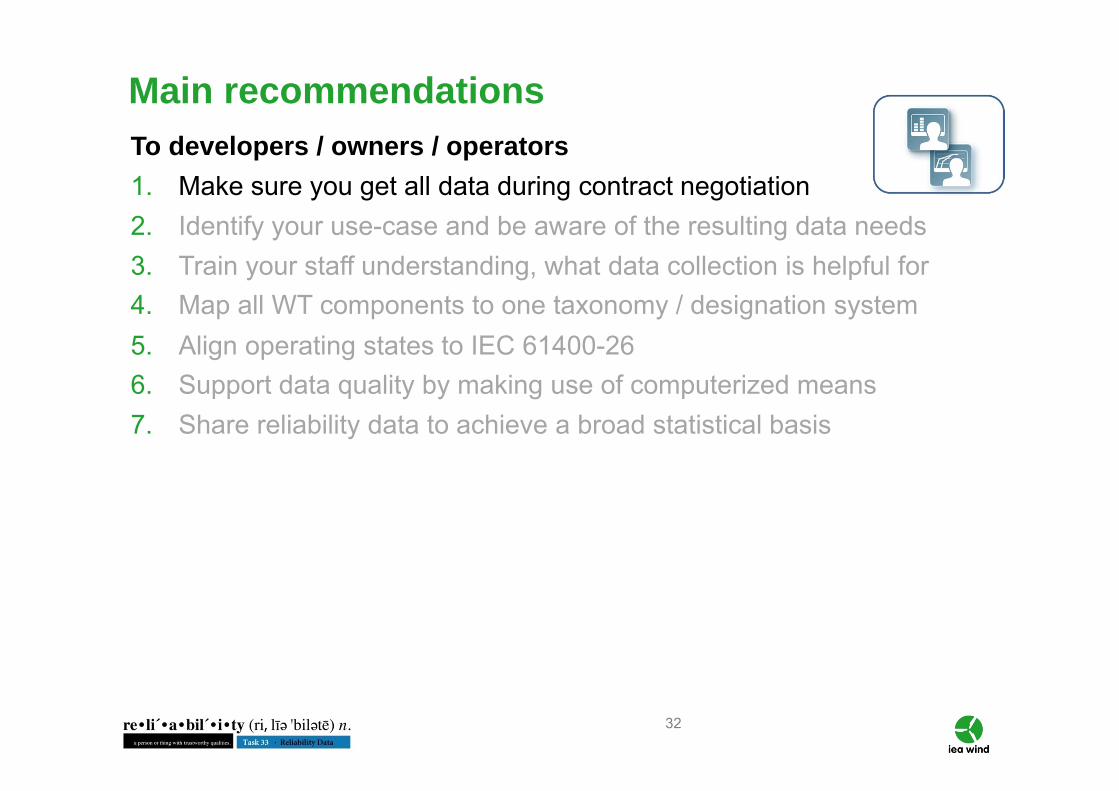
Main recommendationsTo developers / owners / operators1. Make sure you get all data during contract negotiation2. Identify your use-case and be aware of the resulting data needs3. Train your staff understanding, what data collection is helpful for4. Map all WT components to one taxonomy / designation system5. Align operating states to IEC 61400-266. Support data quality by making use of computerized means7. Share reliability data to achieve a broad statistical basis
33
To developers / owners / operators1. Make sure you get all data during contract negotiation
- high value for wind farm asset management and operations 2. Identify your use-case and be aware of the resulting data needs3. Train your staff understanding, what data collection is helpful for4. Map all WT components to one taxonomy / designation system5. Align operating states to IEC 61400-266. Support data quality by making use of computerized means7. Share reliability data to achieve a broad statistical basis
Main recommendations
34
To developers / owners / operators1. Make sure you get all data during contract negotiation 2. Identify your use-case and be aware of the resulting data needs3. Train your staff understanding, what data collection is helpful for4. Map all WT components to one taxonomy / designation system5. Align operating states to IEC 61400-266. Support data quality by making use of computerized means7. Share reliability data to achieve a broad statistical basis
Main recommendations

35
To developers / owners / operators1. Make sure you get all data during contract negotiation 2. Identify your use-case and be aware of the resulting data needs
- design comparison (developer)- (non) availability assessment- grouping of maintenance tasks- monitoring of degradation processes
3. Train your staff understanding, what data collection is helpful for4. Map all WT components to one taxonomy / designation system5. Align operating states to IEC 61400-266. Support data quality by making use of computerized means7. Share reliability data to achieve a broad statistical basis
Main recommendations
36
To developers / owners / operators1. Make sure you get all data during contract negotiation 2. Identify your use-case and be aware of the resulting data needs
- design comparison- (non) availability assessment (owner/ operator)- grouping of maintenance tasks- monitoring of degradation processes
3. Train your staff understanding, what data collection is helpful for4. Map all WT components to one taxonomy / designation system5. Align operating states to IEC 61400-266. Support data quality by making use of computerized means7. Share reliability data to achieve a broad statistical basis
Main recommendations
37
To developers / owners / operators1. Make sure you get all data during contract negotiation 2. Identify your use-case and be aware of the resulting data needs
- design comparison- (non) availability assessment- grouping of maintenance tasks (operator)- monitoring of degradation processes (operator / asset engineer)
3. Train your staff understanding, what data collection is helpful for4. Map all WT components to one taxonomy / designation system5. Align operating states to IEC 61400-266. Support data quality by making use of computerized means7. Share reliability data to achieve a broad statistical basis
Main recommendations
38
To developers / owners / operators 1. Make sure you get all data during contract negotiation2. Identify your use-case and be aware of the resulting data needs3. Train your staff understanding, what data collection is helpful for4. Map all WT components to one taxonomy / designation system5. Align operating states to IEC 61400-266. Support data quality by making use of computerized means7. Share reliability data to achieve a broad statistical basis
Main recommendations
39
To developers / owners / operators 1. Make sure you get all data during contract negotiation2. Identify your use-case and be aware of the resulting data needs3. Train your staff understanding, what data collection is helpful for
- motivates - shows benefits of systematical data collection and evaluation- saves time and effort in the longer run
4. Map all WT components to one taxonomy / designation system5. Align operating states to IEC 61400-266. Support data quality by making use of computerized means7. Share reliability data to achieve a broad statistical basis
Main recommendations
40
To developers / owners / operators :1. Make sure you get all data during contract negotiation2. Identify your use-case and be aware of the resulting data needs3. Train your staff understanding, what data collection is helpful for4. Map all WT components to one taxonomy / designation system5. Align operating states to IEC 61400-266. Support data quality by making use of computerized means7. Share reliability data to achieve a broad statistical basis
Main recommendations
41
To developers / owners / operators:1. Make sure you get all data during contract negotiation2. Identify your use-case and be aware of the resulting data needs3. Train your staff understanding, what data collection is helpful for4. Map all WT components to one taxonomy / designation system
- IEC 61400-25- RDS-PP- GADS
5. Align operating states to IEC 61400-266. Support data quality by making use of computerized means7. Share reliability data to achieve a broad statistical basis
Main recommendations
42
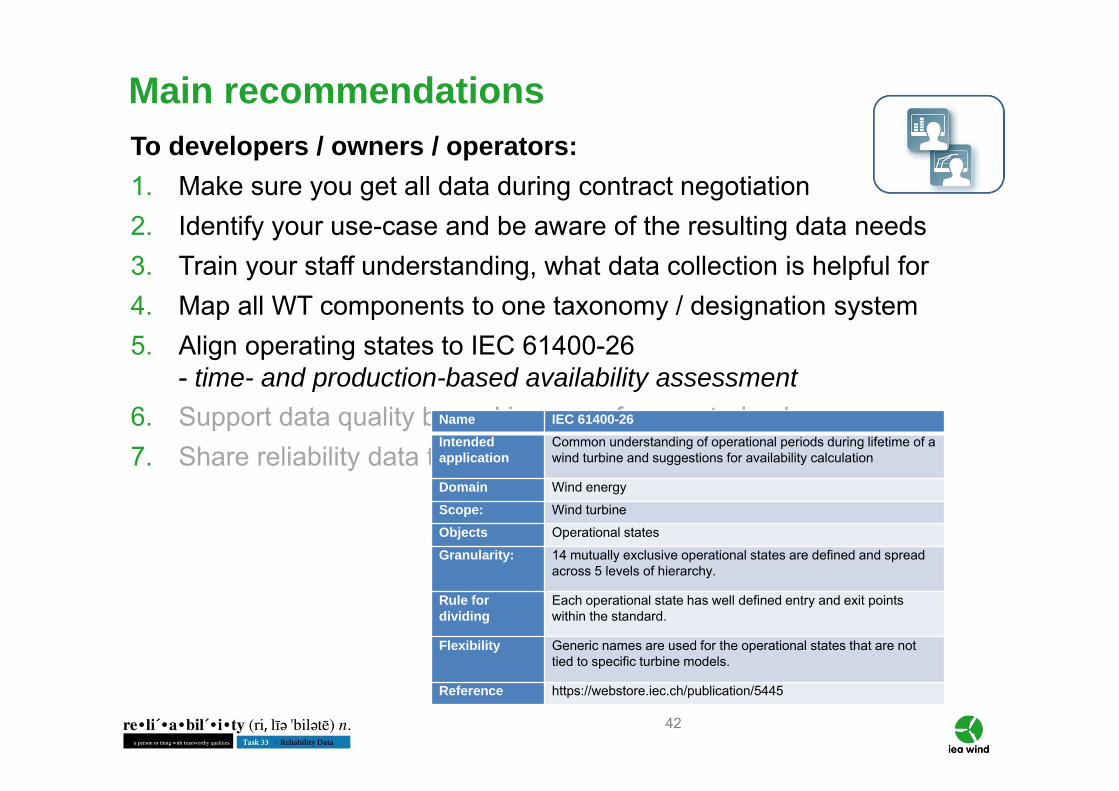
To developers / owners / operators:1. Make sure you get all data during contract negotiation2. Identify your use-case and be aware of the resulting data needs3. Train your staff understanding, what data collection is helpful for4. Map all WT components to one taxonomy / designation system5. Align operating states to IEC 61400-26
- time- and production-based availability assessment 6. Support data quality by making use of computerized means7. Share reliability data to achieve a broad statistical basis
Name IEC 61400-26Intended application
Common understanding of operational periods during lifetime of a wind turbine and suggestions for availability calculation
Domain Wind energy
Scope: Wind turbine
Objects Operational states
Granularity: 14 mutually exclusive operational states are defined and spread across 5 levels of hierarchy.
Rule for dividing
Each operational state has well defined entry and exit points within the standard.
Flexibility Generic names are used for the operational states that are not tied to specific turbine models.
Reference https://webstore.iec.ch/publication/5445
Main recommendations
43
To developers / owners / operators:1. Make sure you get all data during contract negotiation2. Identify your use-case and be aware of the resulting data needs3. Train your staff understanding, what data collection is helpful for4. Map all WT components to one taxonomy / designation system5. Align operating states to IEC 61400-266. Support data quality by making use of computerized means
- reduces human errors, improves data quality & data analysis7. Share reliability data to achieve a broad statistical basis
Main recommendations
44
To developers / owners / operators:1. Make sure you get all data during contract negotiation2. Identify your use-case and be aware of the resulting data needs3. Train your staff understanding, what data collection is helpful for4. Map all WT components to one taxonomy / designation system5. Align operating states to IEC 61400-266. Support data quality by making use of computerized means7. Share reliability data to achieve a broad statistical basis
Main recommendations
45
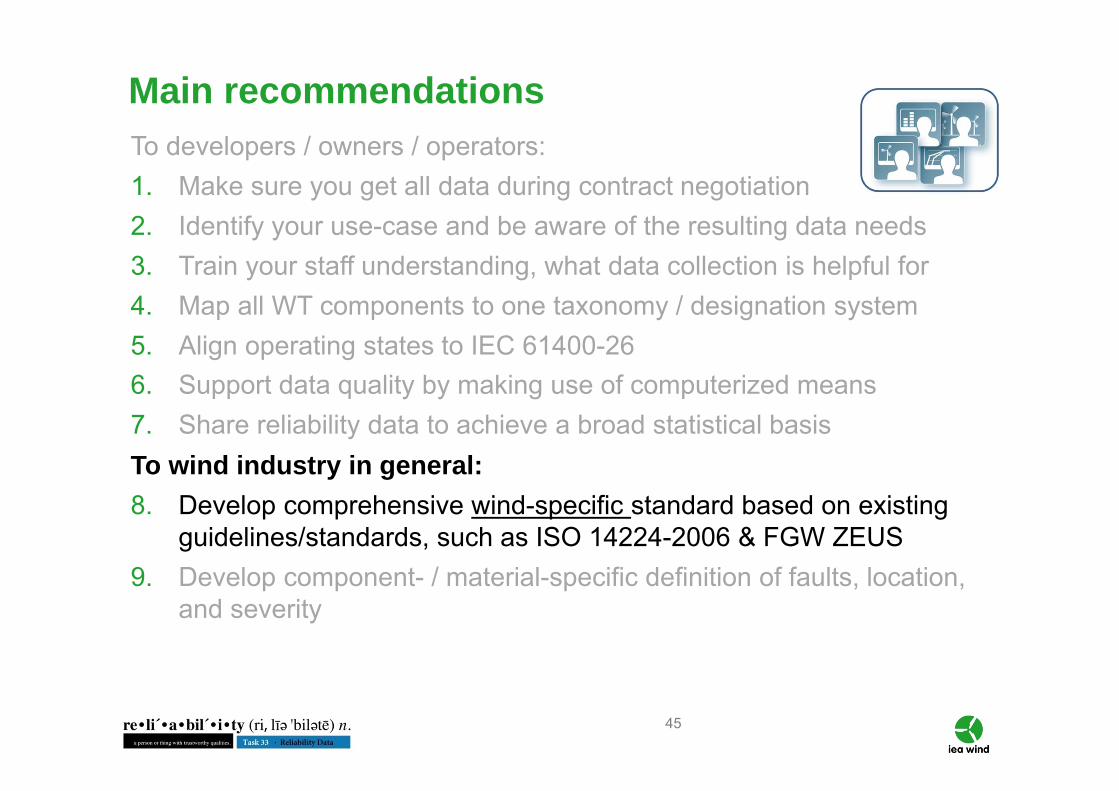
To developers / owners / operators:1. Make sure you get all data during contract negotiation2. Identify your use-case and be aware of the resulting data needs3. Train your staff understanding, what data collection is helpful for4. Map all WT components to one taxonomy / designation system5. Align operating states to IEC 61400-266. Support data quality by making use of computerized means7. Share reliability data to achieve a broad statistical basisTo wind industry in general:8. Develop comprehensive wind-specific standard based on existing
guidelines/standards, such as ISO 14224-2006 & FGW ZEUS9. Develop component- / material-specific definition of faults, location,
and severity
Main recommendations

46
To owners / operators:1. Make sure you get all data during contract negotiation2. Identify your use-case and be aware of the resulting data needs3. Train your staff understanding, what data collection is helpful for4. Map all WT components to one taxonomy / designation system5. Align operating states to IEC 61400-266. Support data quality by making use of computerized means7. Share reliability data to achieve a broad statistical basisTo wind industry in general:8. Develop comprehensive wind-specific standard based on existing
guidelines/standards, such as ISO 14224-2006 & FGW ZEUS9. Develop component- / material-specific definition of faults, location,
and severity
No Hierarchical levels Exemplary items
1 Plant Wind power plant
2 System Wind turbine
3 Sub-System Drive train
4 Assembly Shaft assembly
5 Maintainable item Bearing
6 Part Roller
Wind specific following industry standard ISO 14224
Main recommendations
47
To owners / operators:1. Make sure you get all data during contract negotiation2. Identify your use-case and be aware of the resulting data needs3. Train your staff understanding, what data collection is helpful for4. Map all WT components to one taxonomy / designation system5. Align operating states to IEC 61400-266. Support data quality by making use of computerized means7. Share reliability data to achieve a broad statistical basisTo wind industry in general:8. Develop comprehensive wind-specific standard based on existing
guidelines/standards, such as ISO 14224-2006 & FGW ZEUS9. Develop component- / material-specific definition of faults, location,
and severity- evaluate initial defects and propagation, identify fault mechanisms, & enable an estimation of residual life time
Main recommendations
48
To owners / operators:1. Make sure you get all data during contract negotiation2. Identify your use-case and be aware of the resulting data needs3. Train your staff understanding, what data collection is helpful for4. Map all WT components to one taxonomy / designation system5. Align operating states to IEC 61400-266. Support data quality by making use of computerized means7. Share reliability data to achieve a broad statistical basisTo wind industry in general:8. Develop comprehensive wind-specific standard based on existing
guidelines/standards, such as ISO 14224-2006 & FGW ZEUS9. Develop component- / material-specific definition of faults, location,
and severity
Main recommendations