012 - total visibility 2017-07-24 - senki - scaling this thing … · · 2017-07-26•any...
TRANSCRIPT

Total Visibility
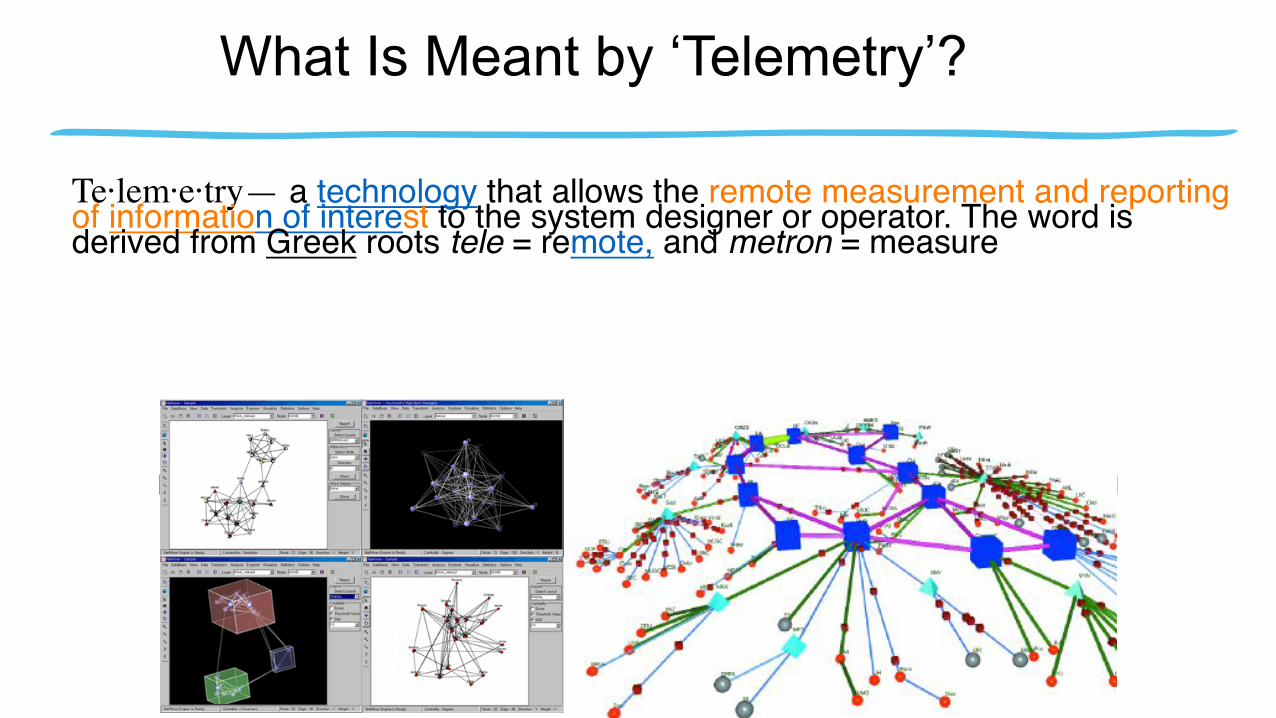
What Is Meant by ‘Telemetry’?
Te·lem·e·try— a technology that allows the remote measurement and reporting of information of interest to the system designer or operator. The word is derived from Greek roots tele = remote, and metron = measure
Check List
• Check SNMP. Is there more you can do with it to pull down security information?
• Check RMON. Can you use it?• Check Netflow. Are you using it, can you pull down more?• Check Passive DNS• See addendum for lots of links.

Holistic Approach to System-Wide Telemetry
Cardiologist
OphthalmologistNeurologist
NephrologistHematologist
Podiatrist
Holistic Approach to Patient CareUses a system-wide approach, coordinating with various specialists, resulting in the patient’s better overall health and wellbeing.
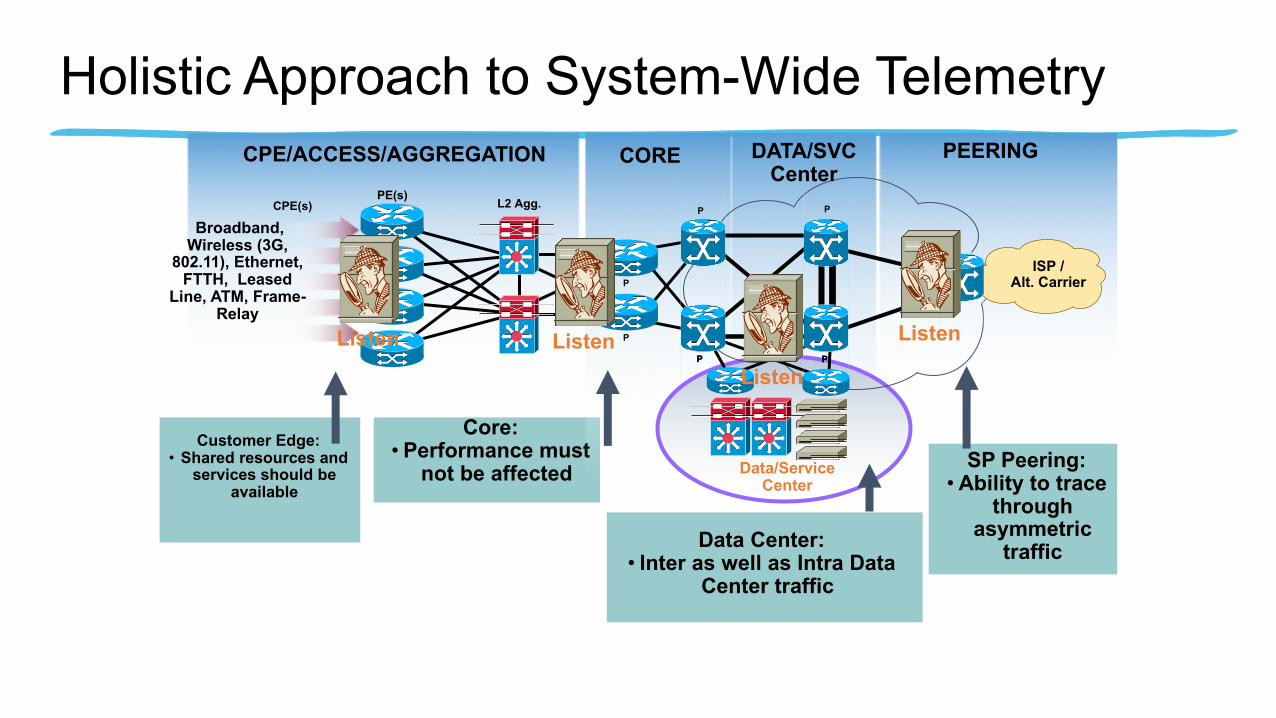
Holistic Approach to System-Wide Telemetry
Data Center:• Inter as well as Intra Data
Center traffic
Customer Edge:• Shared resources and
services should be available
Core:• Performance must
not be affected SP Peering:• Ability to trace
through asymmetric
traffic
P
P
P
P
PE
P
P
PE(s) L2 Agg.
Broadband, Wireless (3G,
802.11), Ethernet, FTTH, Leased
Line, ATM, Frame-Relay
CPE(s)
P P
Data/Service Center
CPE/ACCESS/AGGREGATION CORE PEERINGDATA/SVC Center
ISP / Alt. Carrier
Listen ListenListen
Listen
Source: University of Wisconsin
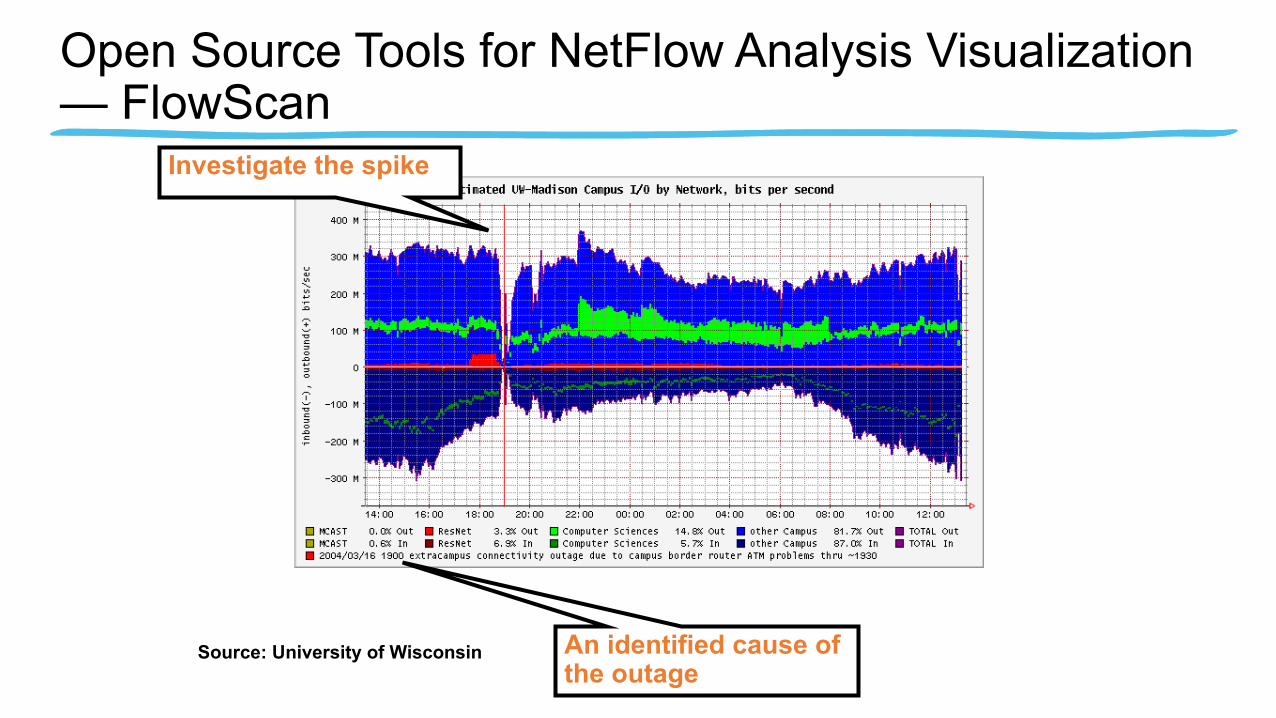
Open Source Tools for NetFlow Analysis Visualization — FlowScan
Investigate the spike
An identified cause of the outage

7
What’s NetFlow?
• NetFlow is a form of telemetry pushed from the network devices.• Netflow is best used in combination with other technologies: IPS, vulnerability
scanners, and full traffic capture.•Traffic capture is like a wiretap•NetFlow is like a phone bill
• We can learn a lot from studying the network phone bill!•Who’s talking to whom? And when?•Over what protocols & ports?•How much data was transferred?•At what speed?•For what duration?

Elements of a Netflow Packet
•Packet Count•Byte Count
Usage
QoS
Timeof Day
Application
PortUtilization
From/To
Routing andPeering
•Input ifIndex•Output ifIndex
•Type of Service•TCP Flags•Protocol
•Start sysUpTime•End sysUpTime
•Source TCP/UDP Port•Destination TCP/UDP Port
•Next Hop Address•Source AS Number•Dest. AS Number•Source Prefix Mask•Dest. Prefix Mask
•Source IP Address•Destination IP Address
Ingress i/f
Egress i/f
Data Flow Data Flow
Netflow is our #1 tool

9
Netflow Setup•Don’t have a copy of netflow data b/c IT won’t share?
•Many products have the ability to copy flow data off to other destinations
Collector
Peakflow NetQoS
Storage
Export netflow data to OSU Flowtools Collector
Regionalized collection to minimize WAN impact
Netflow data copied to other destinations with flow-fanout

NetFlow Collection at Cisco
• DMZ Netflow Collection (4 servers)• Data Center Netflow Collection (20+ servers)• Query/Reporting tools (OSU Flowtools, DFlow, Netflow Report Generator) 200K pps
3 ISP gateways600GB ~ 3 months

11
OSU Flowtools - Netflow Collector Setup
• Tool: OSU FlowTools• Free!• Developed by Ohio State University
• Examples of capabilitiesDid 192.168.15.40 talk to 216.213.22.14?What hosts and ports did 192.168.15.40 talk
to?Who’s connecting to port TCP/6667?Did anyone transfer data > 500MB to an
external host?

12
OSU Flowtools ExampleWho’s Talking?
• Scenario: New botnet, variant undetected• You need to identify all systems that ‘talked’ to the botnet C&C• Luckily you’ve deployed netflow collection at all your PoPs
put in specific query syntax for the example[mynfchost]$ head flow.acl
ip access-list standard bot permit host 69.50.180.3ip access-list standard bot permit host 66.182.153.176
[mynfchost]$ flow-cat /var/local/flows/data/2007-02-12/ft* | flow-filter -Sbot -o -...
Start End Sif SrcIPaddress SrcP DIf DstIPaddress DstP0213.08:39:49.911 0213.08:40:34.519 58 10.10.71.100 8343 98 69.50.180.3 313370213.08:40:33.590 0213.08:40:42.294 98 69.50.180.3 31337 58 10.10.71.100 83
flow.acl file uses familiar ACL syntax. create a list named ‘bot’ concatenate all
files from Feb 12, 2007 then filter for src or dest of ‘bot’ acl
we’ve got a host in the botnet!

Custom NetFlow Report GeneratorQuery by IP
14
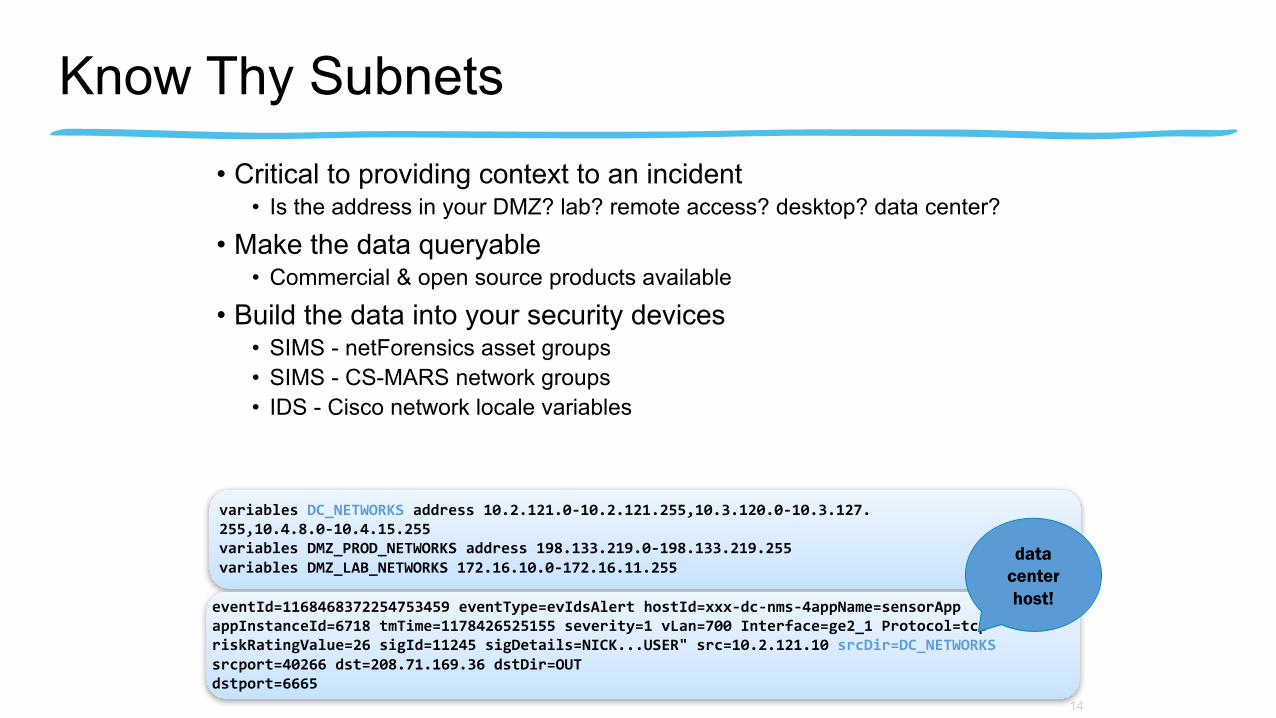
Know Thy Subnets• Critical to providing context to an incident
• Is the address in your DMZ? lab? remote access? desktop? data center?
• Make the data queryable• Commercial & open source products available
• Build the data into your security devices• SIMS - netForensics asset groups• SIMS - CS-MARS network groups• IDS - Cisco network locale variables
variables DC_NETWORKS address 10.2.121.0-10.2.121.255,10.3.120.0-10.3.127.255,10.4.8.0-10.4.15.255variables DMZ_PROD_NETWORKS address 198.133.219.0-198.133.219.255variables DMZ_LAB_NETWORKS 172.16.10.0-172.16.11.255
eventId=1168468372254753459 eventType=evIdsAlert hostId=xxx-dc-nms-4appName=sensorAppappInstanceId=6718 tmTime=1178426525155 severity=1 vLan=700 Interface=ge2_1 Protocol=tcpriskRatingValue=26 sigId=11245 sigDetails=NICK...USER" src=10.2.121.10 srcDir=DC_NETWORKSsrcport=40266 dst=208.71.169.36 dstDir=OUTdstport=6665
data center host!
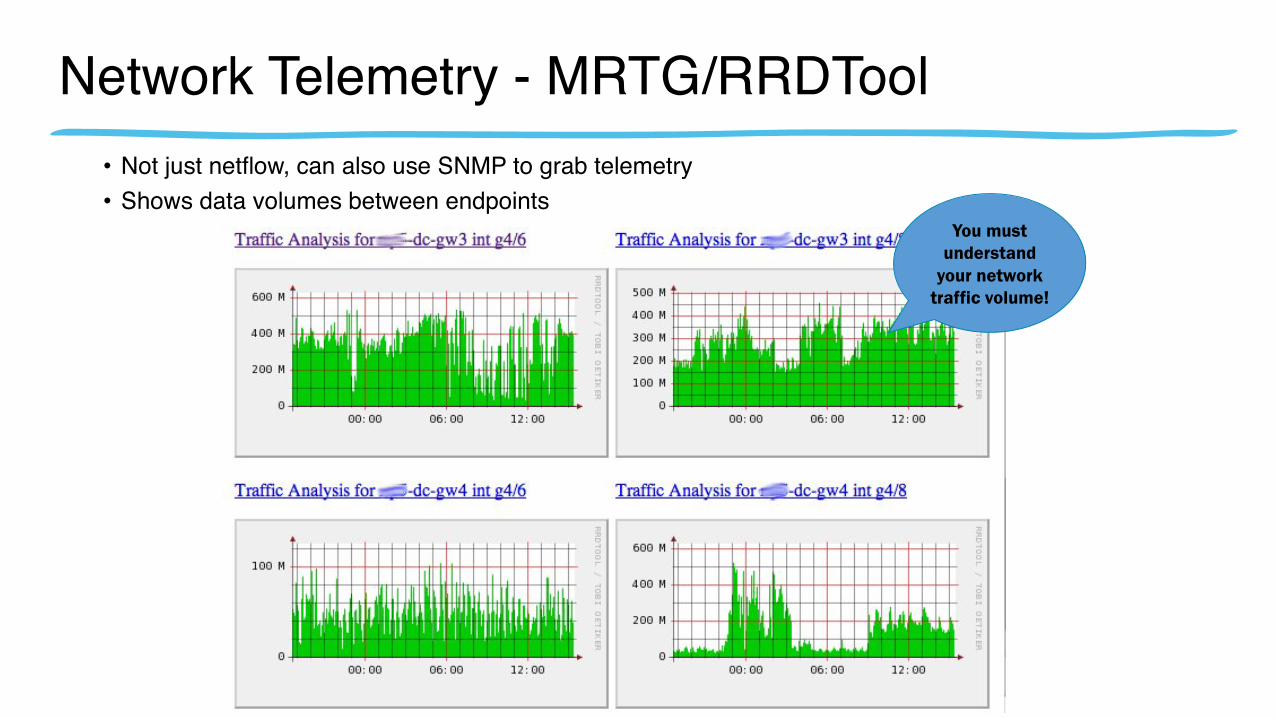
Network Telemetry - MRTG/RRDTool• Not just netflow, can also use SNMP to grab telemetry• Shows data volumes between endpoints
You must understand
your network traffic volume!
16
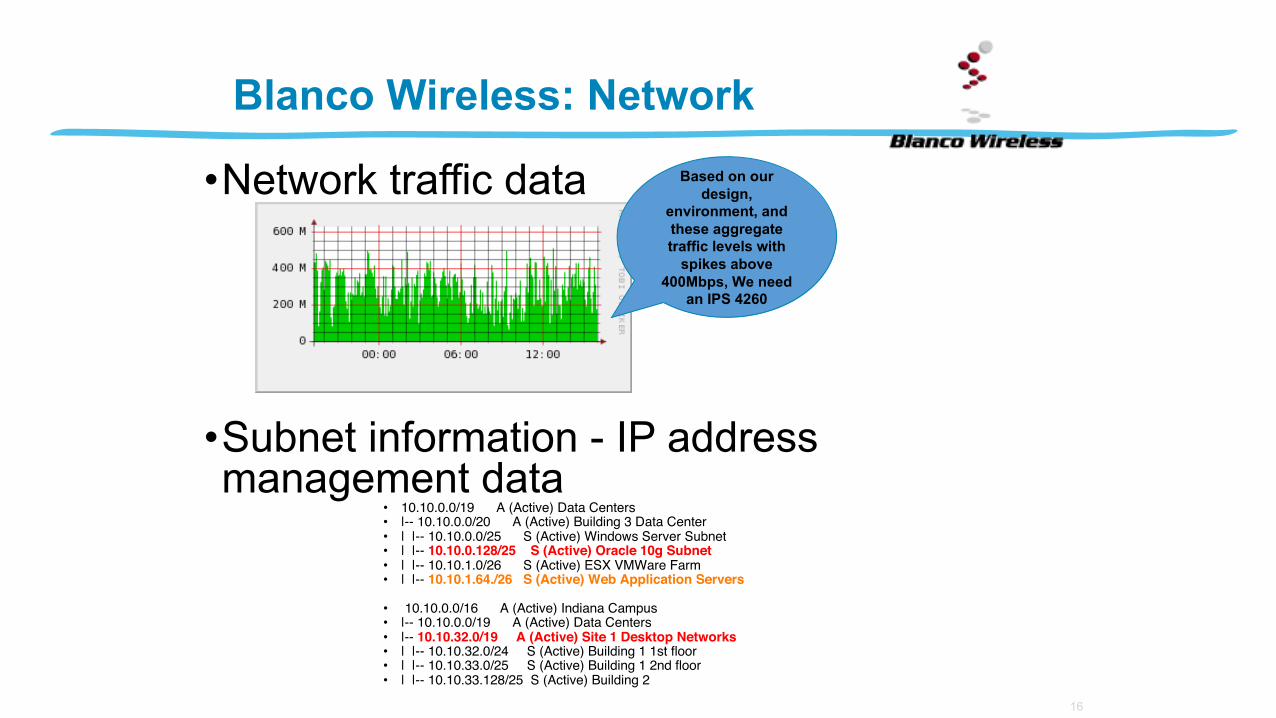
•Network traffic data
•Subnet information - IP address management data
• 10.10.0.0/19 A (Active) Data Centers• |-- 10.10.0.0/20 A (Active) Building 3 Data Center• | |-- 10.10.0.0/25 S (Active) Windows Server Subnet• | |-- 10.10.0.128/25 S (Active) Oracle 10g Subnet• | |-- 10.10.1.0/26 S (Active) ESX VMWare Farm• | |-- 10.10.1.64./26 S (Active) Web Application Servers
• 10.10.0.0/16 A (Active) Indiana Campus• |-- 10.10.0.0/19 A (Active) Data Centers• |-- 10.10.32.0/19 A (Active) Site 1 Desktop Networks• | |-- 10.10.32.0/24 S (Active) Building 1 1st floor• | |-- 10.10.33.0/25 S (Active) Building 1 2nd floor• | |-- 10.10.33.128/25 S (Active) Building 2
Based on our design,
environment, and these aggregate traffic levels with
spikes above 400Mbps, We need
an IPS 4260
Blanco Wireless: Network

Source: UNINETT
NetFlow - Stager
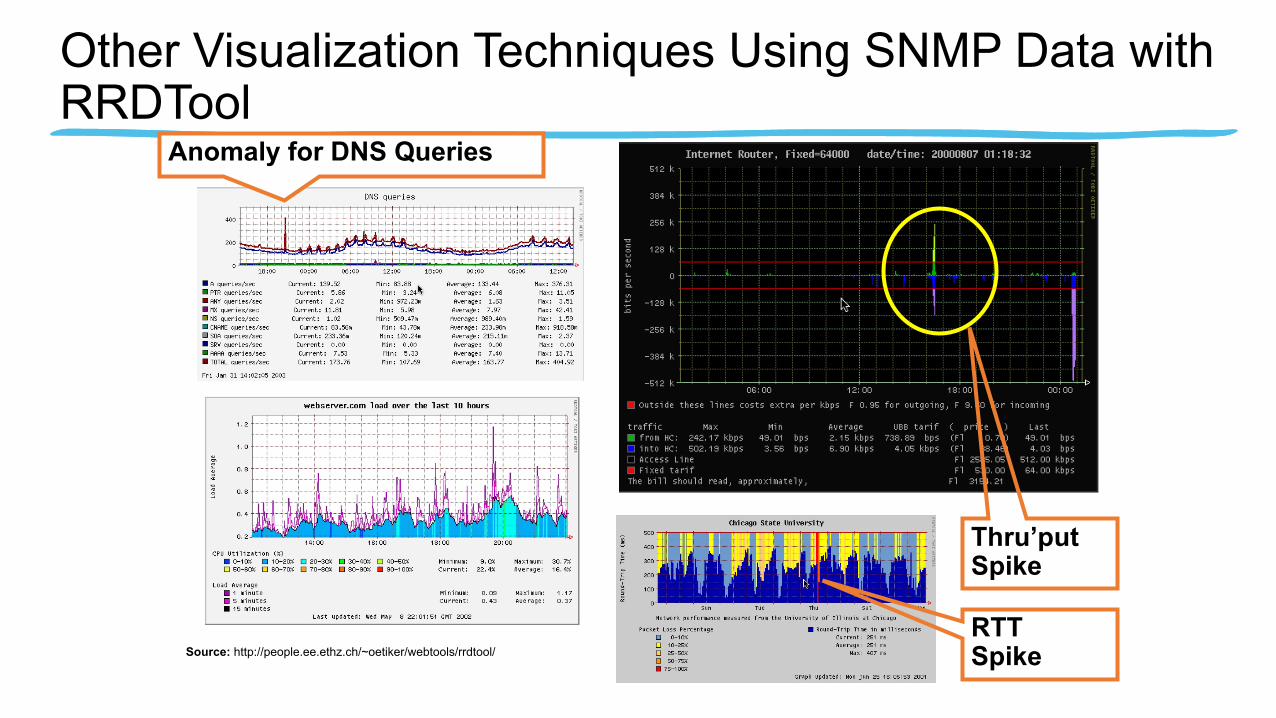
Source: http://people.ee.ethz.ch/~oetiker/webtools/rrdtool/
Other Visualization Techniques Using SNMP Data with RRDTool
Anomaly for DNS Queries
Thru’put Spike
RTTSpike
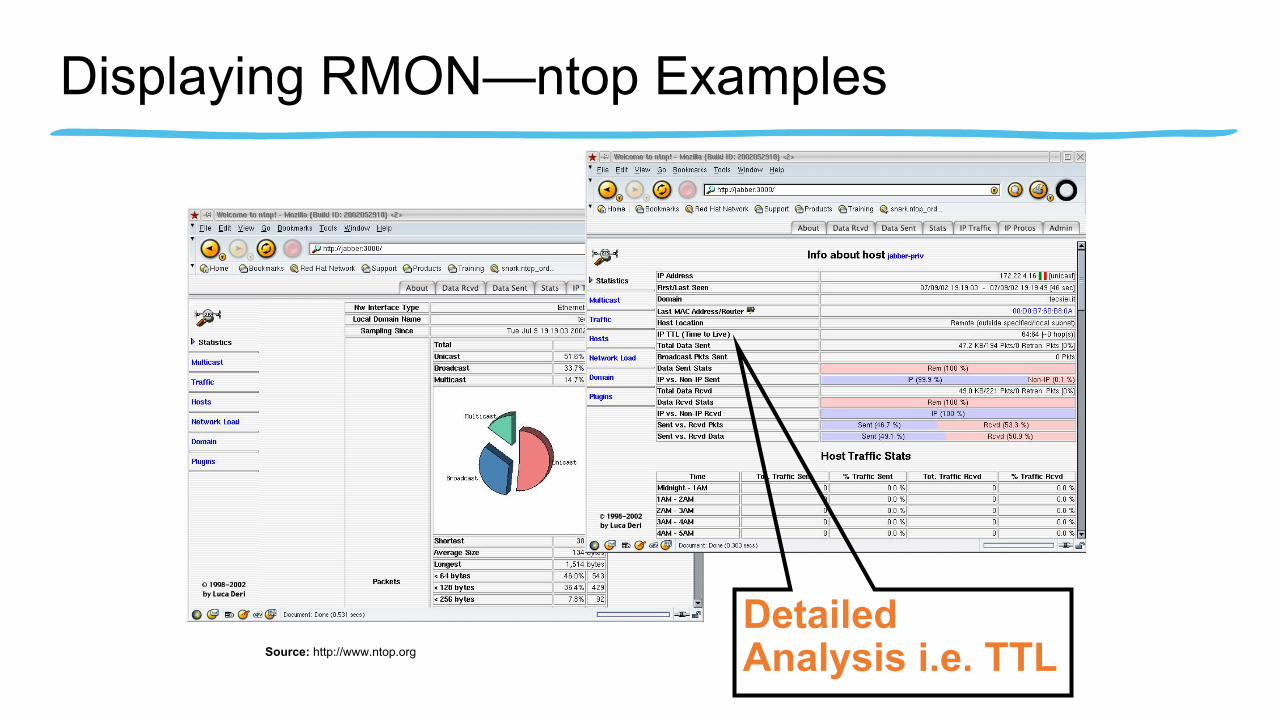
Source: http://www.ntop.org
Displaying RMON—ntop Examples
Detailed Analysis i.e. TTL
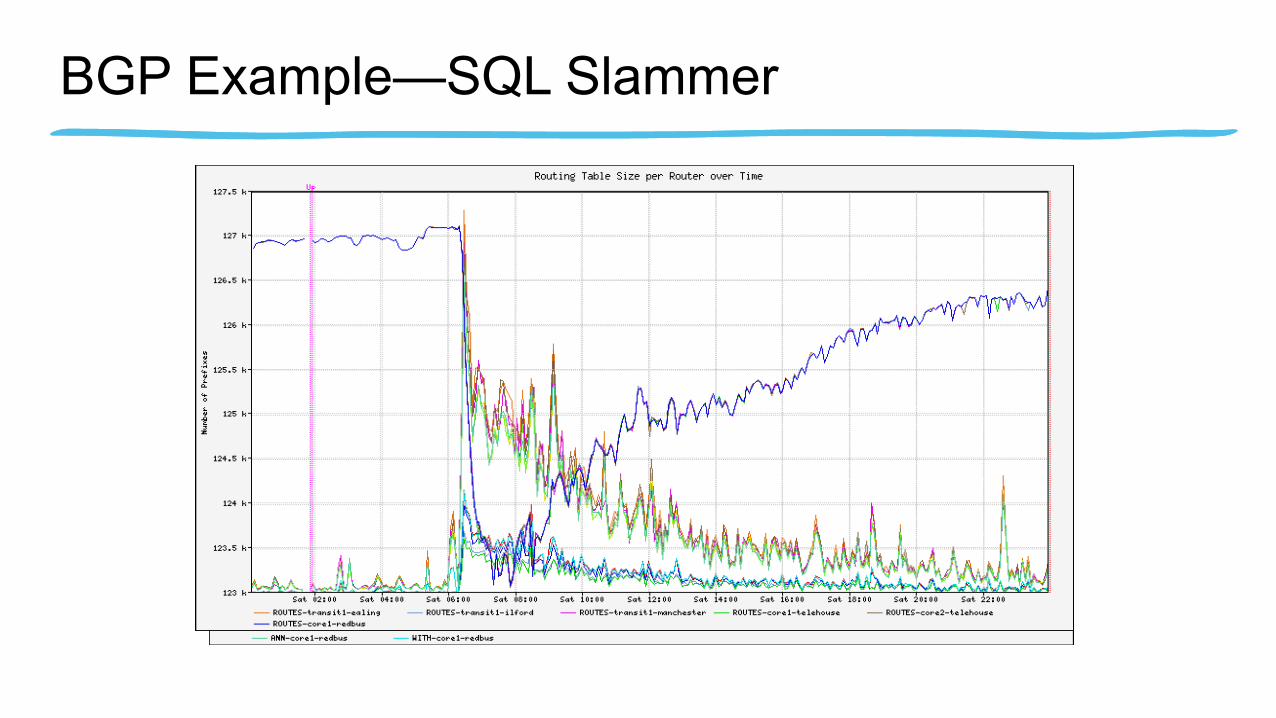
BGP Example—SQL Slammer

Correlating NetFlow and Routing Data
Matching data collected from different tools
Syslog
• De facto logging standard for hosts, network infrastructure devices, supported in all most routers and switches
• Many levels of logging detail available—choose the level(s) which are appropriate for each device/situation
• Logging of ACLs is generally contraindicated due to CPU overhead—NetFlow provides more info, doesn’t max the box
• Can be used in conjunction with Anycast and databases such as MySQL (http://www.mysql.com) to provide a scalable, robust logging infrastructure
• Different facility numbers allows for segregation of log info based upon device type, function, other criteria
• Syslog-ng from http://www.balabit.com/products/syslog_ng/ adds a lot of useful functionality—HOW-TO located at http://www.campin.net/newlogcheck.html

Benefits of Deploying NTP• Very valuable on a global network with network elements in different time
zones• Easy to correlate data from a global or a sizable network with a consistent time
stamp• NTP based timestamp allows to trace security events for chronological forensic
work• Any compromise or alteration is easy to detect as network elements would go
out of sync with the main ‘clock’• Did you there is an NTP MIB? Some think that we may be able to use “NTP
Jitter” to watch what is happening in the network.

Source: http://www.ethereal.com
Packet Capture Examples
Wealth of information, L1-L7 raw data for analysis

Open Source Netflow Tools

Open Source Netflow Tools
• NTop (or Ntopng) Probably the most well-known open source traffic analyzers, Ntop, is a web-based tool that runs on Ubuntu x64 versions, CentOS/Redhat x64 Linux flavors, Windows x64 Operating systems, BeagleBoard ARM, Ubiquity networks EdgeRouter and even Mac OSX per their github site. nTopng also includes suuport for sFlowand IPFIX (through nProbe add-on), as its becoming a new standard that many manufacturers are using for flow analysis. RRD is used for databases and storing of data on a per-host level.

Open Source Netflow Tools
• Flow-tools - Flow-tools is a toolset that can be used to Collect, Send, Process and generate Reports for Netflowdata flows and provides an API for developing custom features and applications. Flow Tools is hosted at http://flow-tools.googlecode.com.

Open Source Netflow Tools
• FlowScan Flowscan is more of a visualization tool that analyzes and reports Netflow data and can produce visual graphs that are in “near” real-time to see whats going on in your network. Flowscan can be deployed on a GNU/Linux or BSD system and uses some of the following packages in order to correctly collect and process flows: “cflowd” to as the flow collector, “flowscan” which is a perl script that makes up the software package itself (“FlowScan”) and is responsible for loading and executing reports and the last major component is “RRDtool” which is used to store all flow information in its database.

Open Source Netflow Tools
• EHNT EHNT (which is pronounced “ent”) is an acronym for Extreme Happy NetFlow Tool. This is a commandline tool that supports Netflow Version 5 only and provides reports for intervals between 1 min to 24 hrs and provides information about Ip Protocols, TCP/UDP ports and more.
• BPFT (which stands for Berlekey Packet Filter Traffic collector) is a built on top of the BPF “pseudo-device” and libpcap for capturing IP traffic, including Source/Destination IP’s & Ports, number of transmitted/received bytes which are all stored in one compact form binary file.
Open Source Netflow Tools
• Maji Maji is an implementation of an IPFIX meter which is based on libtrace, a packet capturing and processing library. Maji seems to have an array of information per their website and the latest release was from 07/2011. One of the major benefits to maji is the custom templates you can develop with as many elements included into them as you want, and can be exported via Network over SCTP/TCP/UDP, SQLite database or the terminal.
Open Source Netflow Tools
• Cflowd - cflowd is a tool that is made for analyzing Netflowenabled devices and includes modules for collecting, storing and analyzing netflow data. Apparently cflowd is no longer being supported per their website, and is directing users to use flow-tools with FlowScan in order to take advantage of cflowd and its modules.
• AnonTool - AnonTool is more of an anonymization tool for netflow v5 & v9 traces.

Open Source Netflow Tools
• Panoptis - According to the sourceforge page, this project is no longer being developed or supported and was an open-source project that used NetFlow data to help detect and stop (Distributed) Denial of Service attacks. It is no longer support or being updated, so use at your own risk. Check out their Sourceforge page for more information and a download link.
Open Source Netflow Tools
• Pmgraph - pmGraph is a great open source tool for graphing and monitoring bandwidth using pmacct, which is a network monitoring and auditing tool. pmacct collects and monitors traffic using Netflow or Sflow on network devices (including firewalls, routers and switches) into a database and allows for analysis of that data using pmGraph. The software was developed by Aptivate staff and volunteers and looks to still be active.
Open Source Netflow Tools
• InMon sFlow Toolkit - sFlow toolkit is an open source software package the is used for analyzing sFlow data and can be used with other utilities including tcpdump, ntop and Snort for further analysis. “sflowtool” is the main component of the sFlow toolkit software and is a command-line utility that gives you the ability to view network traffic devices in real-time and interface with other software packages for mapping out graphical images of IP flow. sflowtool is also available for windows as well per their website.
Open Source Netflow Tools
• NDSAD Traffic Collector - NDSAD, which stands for NetUP’s Data Stream Accounting Daemon, was developed by NetUP as a tool to capture packets and generate Netflow v5 data streams and was specifically used for ISP billing purposes. The software still seems to be supported as well.

Open Source Netflow Tools
• NFsen/NFDump NFsen, which is short for Netflow Sensor, is a web-based front-end tool for nfdump to present the user a nice graphical image of all the data nfdump pumps out. You have the ability to generate reports of your netflow data with information including Flows, Packets and bytes using RRD database tool, as well as setup alerts and view historical data. nfsen project is still very active and can be downloaded from its Sourceforgepage here and runs on any Unix/Linux systems. You’ll need PHP, PERL (along with Perl Mail::Header and Mail::Internet modules), RRD Tools module and Nfdump tools installed on your system in order to use it correctly.

Total Visibility - Addendum

NetFlow—More Information
• Cisco NetFlow Home—http://www.cisco.com/warp/public/732/Tech/nmp/netflow
• Linux NetFlow Reports HOWTO—http://www.linuxgeek.org/netflow-howto.php
• Arbor Networks Peakflow SP—http://www.arbornetworks.com/products_sp.php

More Information about SNMP
• Cisco SNMP Object Tracker— http://www.cisco.com/pcgi-bin/Support/Mibbrowser/mibinfo.pl?tab=4
• Cisco MIBs and Trap Definitions— http://www.cisco.com/public/sw-center/netmgmt/cmtk/mibs.shtml
• SNMPLink—http://www.snmplink.org/• SEC-1101/2102 give which SNMP parameters should be looked at.

RMON—More Information
• IETF RMON WG—http://www.ietf.org/html.charters/rmonmib-charter.html
• Cisco RMON Home—http://www.cisco.com/en/US/tech/tk648/tk362/tk560/tech_protocol_home.html
• Cisco NAM Product Page—http://www.cisco.com/en/US/products/hw/modules/ps2706/ps5025/index.html

BGP—More Information
• Cisco BGP Home—http://www.cisco.com/en/US/tech/tk365/tk80/tech_protocol_family_home.html
• Slammer/BGP analysis—http://www.nge.isi.edu/~masseyd/pubs/massey_iwdc03.pdf
• Team CYMRU BGP Tools—http://www.cymru.com/BGP/index.html

Syslog—More Information
• Syslog.org - http://www.syslog.org/• Syslog Logging w/PostGres HOWTO—
http://kdough.net/projects/howto/syslog_postgresql/• Agent Smith Explains Syslog—
http://routergod.com/agentsmith/

Packet Capture—More Information
• tcpdump/libpcap Home—http://www.tcpdump.org/
• Vinayak Hegde’s Linux Gazette article—http://www.linuxgazette.com/issue86/vinayak.html
Remote Triggered Black Hole
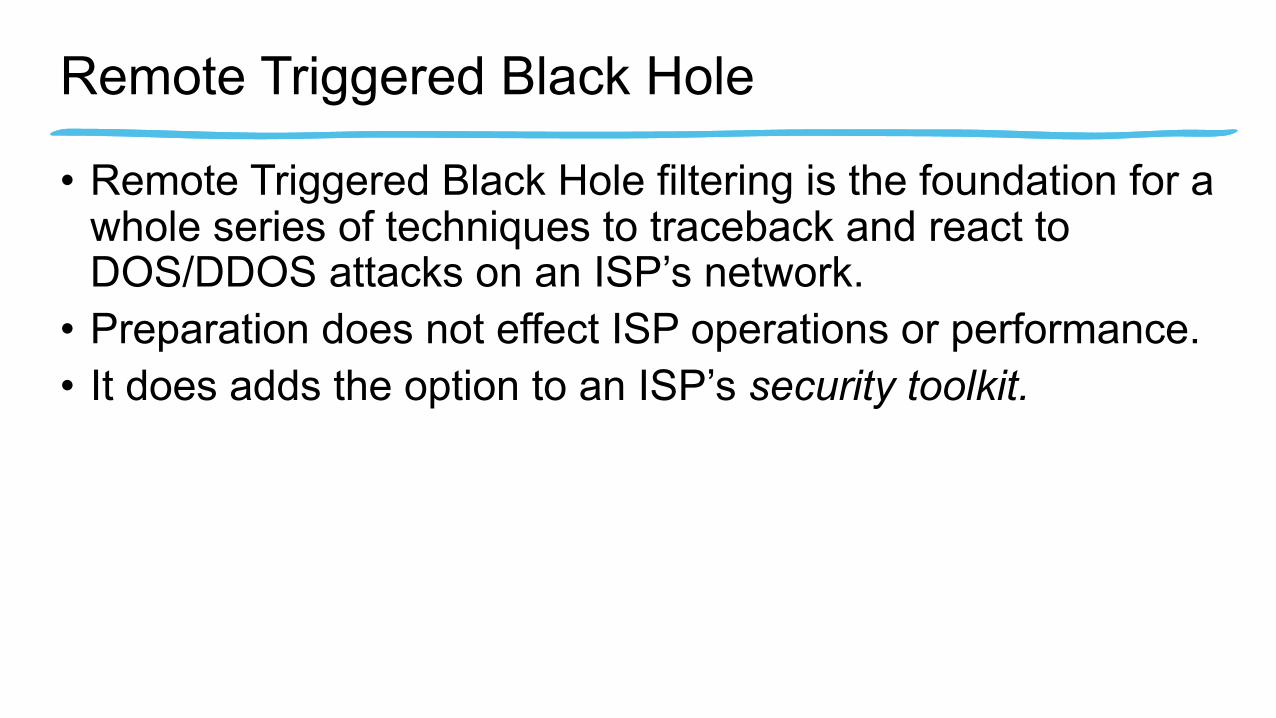
• Remote Triggered Black Hole filtering is the foundation for a whole series of techniques to traceback and react to DOS/DDOS attacks on an ISP’s network.
• Preparation does not effect ISP operations or performance.• It does adds the option to an ISP’s security toolkit.
More Netflow Tools
• NfSen - Netflow Sensor• http://nfsen.sourceforge.net/
• NFDUMP• http://nfdump.sourceforge.net/
• FlowCon• http://www.cert.org/flocon/

PROACTIVE TELEMETRY: NETFLOW
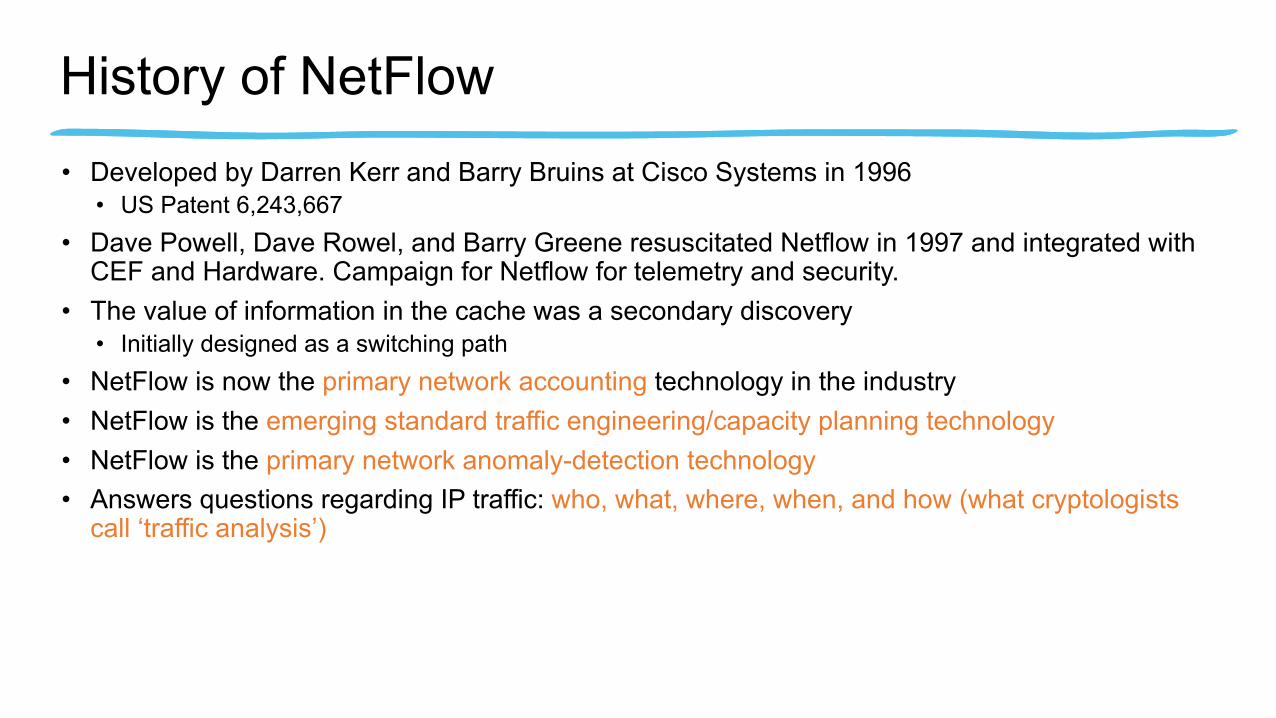
History of NetFlow• Developed by Darren Kerr and Barry Bruins at Cisco Systems in 1996
• US Patent 6,243,667• Dave Powell, Dave Rowel, and Barry Greene resuscitated Netflow in 1997 and integrated with
CEF and Hardware. Campaign for Netflow for telemetry and security.• The value of information in the cache was a secondary discovery
• Initially designed as a switching path• NetFlow is now the primary network accounting technology in the industry • NetFlow is the emerging standard traffic engineering/capacity planning technology• NetFlow is the primary network anomaly-detection technology• Answers questions regarding IP traffic: who, what, where, when, and how (what cryptologists
call ‘traffic analysis’)

What Is a Flow?
• Defined by seven unique keys:• Source IP address• Destination IP address• Source port• Destination port• Layer 3 protocol type• TOS byte (DSCP)• Input logical interface
(ifIndex)
Exported Data

Creating Export Packets
Core Network
Enable NetFlow
Traffic
CollectorNFC, flow-tools, Arbor
UDP NetFlowExport
Packets
Application GUIArbor, FlowScan
PE
Export Packets• Approximately 1500 bytes• Typically contain 20-50 flow
records• Sent more frequently if traffic
increases on NetFlow-enabled interfaces

Key Concept—NetFlow Scalability
• Packet capture is like a wiretap• NetFlow is like a phone bill• This level of granularity allows NetFlow to scale for very
large amounts of traffic
We can learn a lot from studying the phone bill!
Who’s talking to whom, over what protocols & ports, for how long, at what speed, for what duration, etc.
NetFlow is a form of telemetry pushed from the routers/switches - each one can be a sensor!
NetFlow Versions: Clarifying the Version Myth
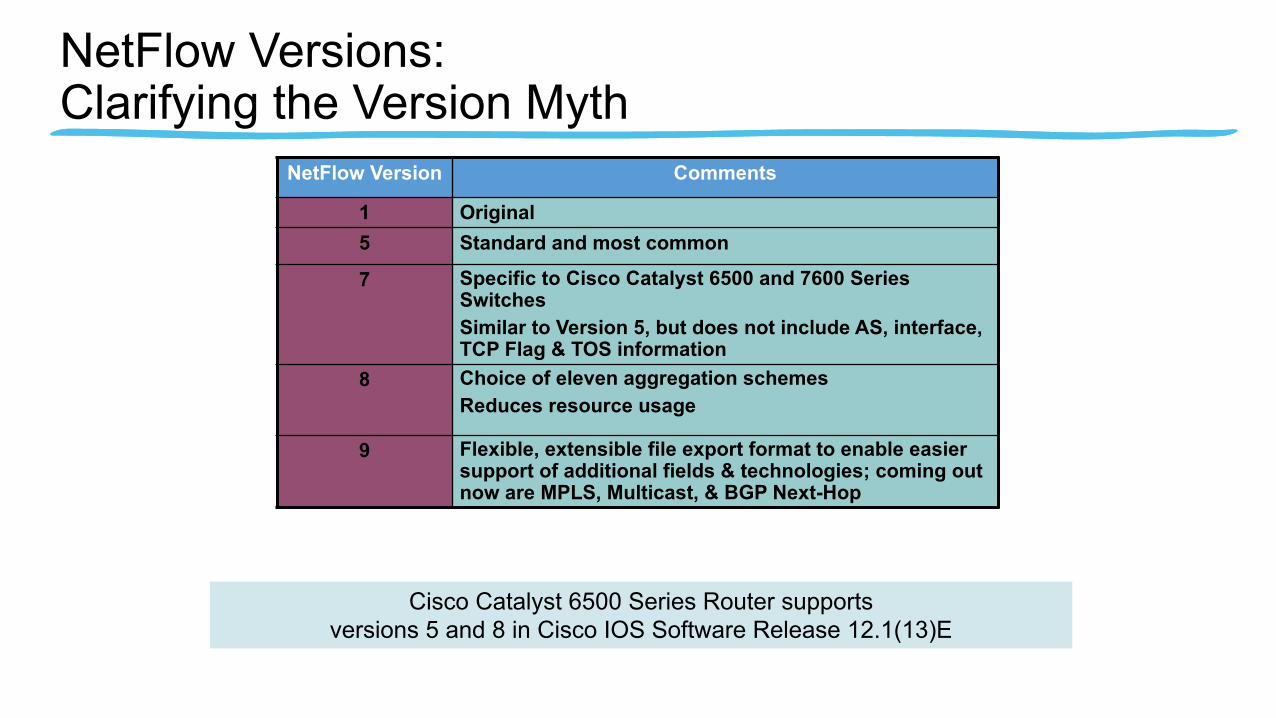
Cisco Catalyst 6500 Series Router supportsversions 5 and 8 in Cisco IOS Software Release 12.1(13)E
NetFlow Version Comments
1 Original5 Standard and most common
7 Specific to Cisco Catalyst 6500 and 7600 Series Switches Similar to Version 5, but does not include AS, interface, TCP Flag & TOS information
8 Choice of eleven aggregation schemesReduces resource usage
9 Flexible, extensible file export format to enable easier support of additional fields & technologies; coming out now are MPLS, Multicast, & BGP Next-Hop
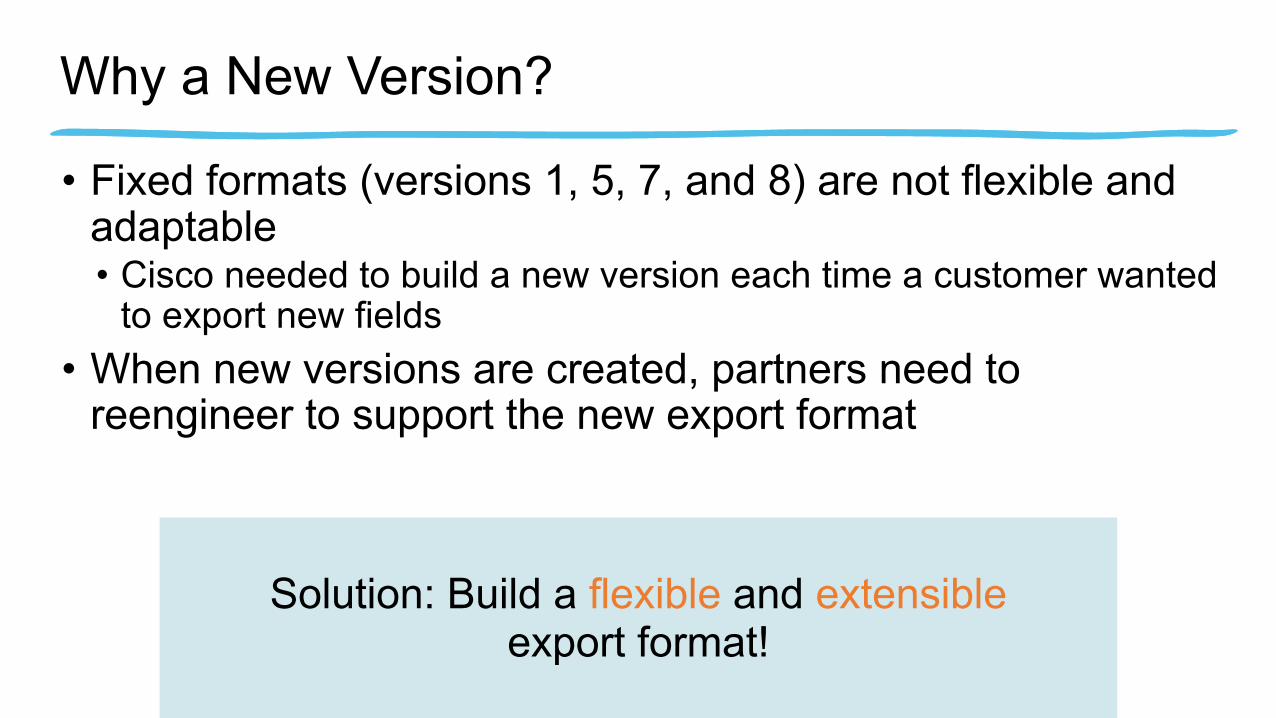
Why a New Version?
• Fixed formats (versions 1, 5, 7, and 8) are not flexible and adaptable• Cisco needed to build a new version each time a customer wanted
to export new fields• When new versions are created, partners need to
reengineer to support the new export format
Solution: Build a flexible and extensible export format!
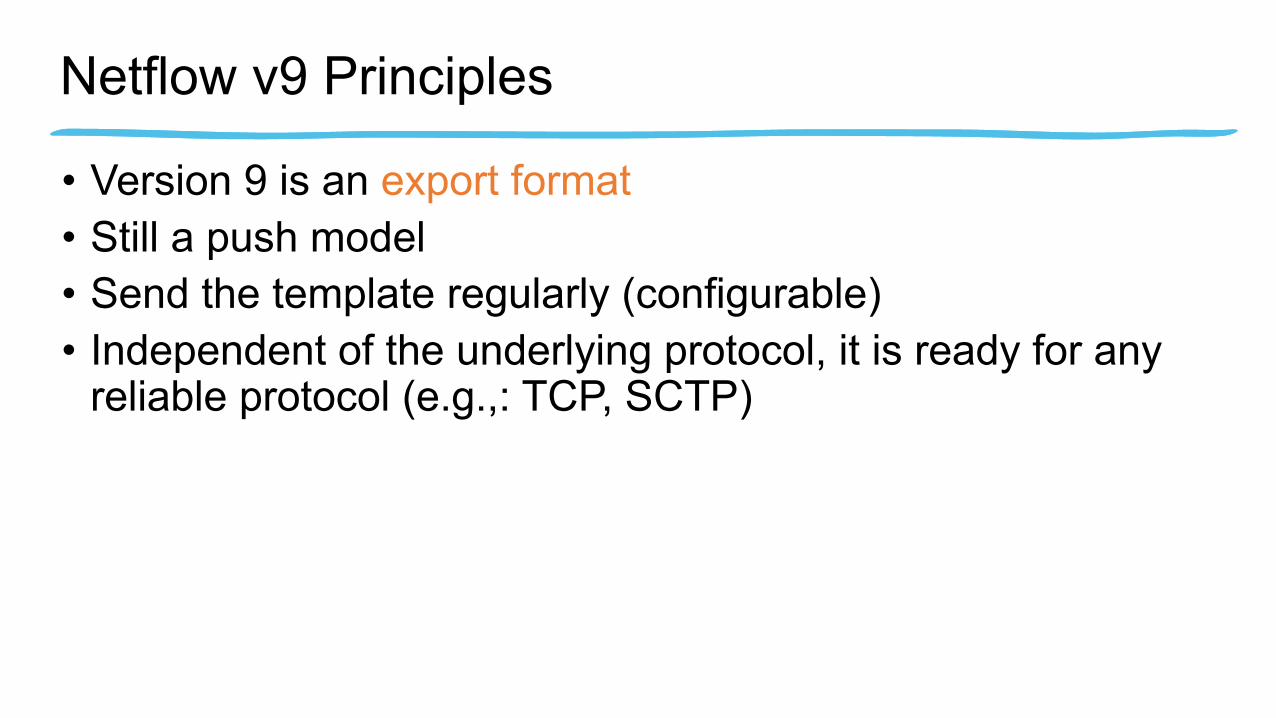
Netflow v9 Principles
• Version 9 is an export format• Still a push model• Send the template regularly (configurable)• Independent of the underlying protocol, it is ready for any
reliable protocol (e.g.,: TCP, SCTP)
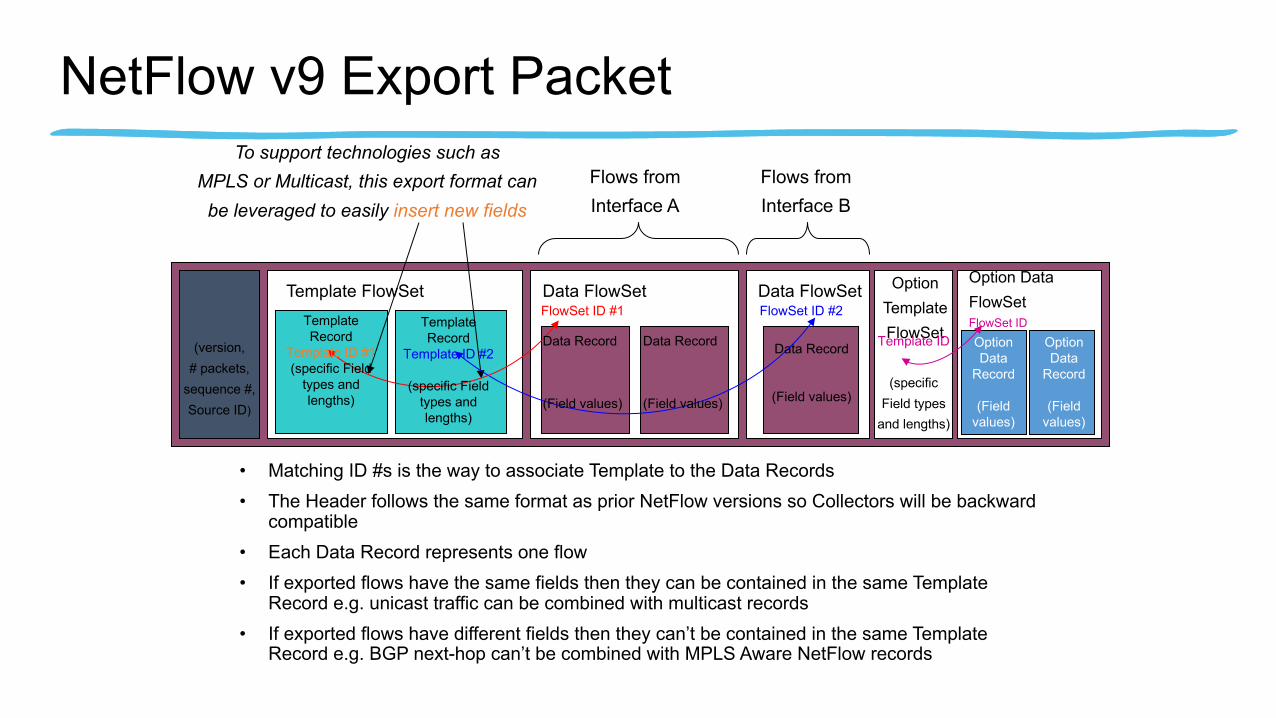
NetFlow v9 Export Packet
• Matching ID #s is the way to associate Template to the Data Records• The Header follows the same format as prior NetFlow versions so Collectors will be backward
compatible• Each Data Record represents one flow• If exported flows have the same fields then they can be contained in the same Template
Record e.g. unicast traffic can be combined with multicast records• If exported flows have different fields then they can’t be contained in the same Template
Record e.g. BGP next-hop can’t be combined with MPLS Aware NetFlow records
Data FlowSetTemplate FlowSet Option TemplateFlowSet
FlowSet ID #1Data FlowSetFlowSet ID #2
Template ID
(specific Field types
and lengths)
(version, # packets,
sequence #, Source ID)
Flows from Interface A
Flows from Interface B
To support technologies such asMPLS or Multicast, this export format canbe leveraged to easily insert new fields
Option DataFlowSetFlowSet IDOption Data
Record
(Field values)
Option Data
Record
(Field values)
Template Record
Template ID #2
(specific Field types and lengths)
Template Record
Template ID #1(specific Field
types and lengths)
Data Record
(Field values)
Data Record
(Field values)
Data Record
(Field values)
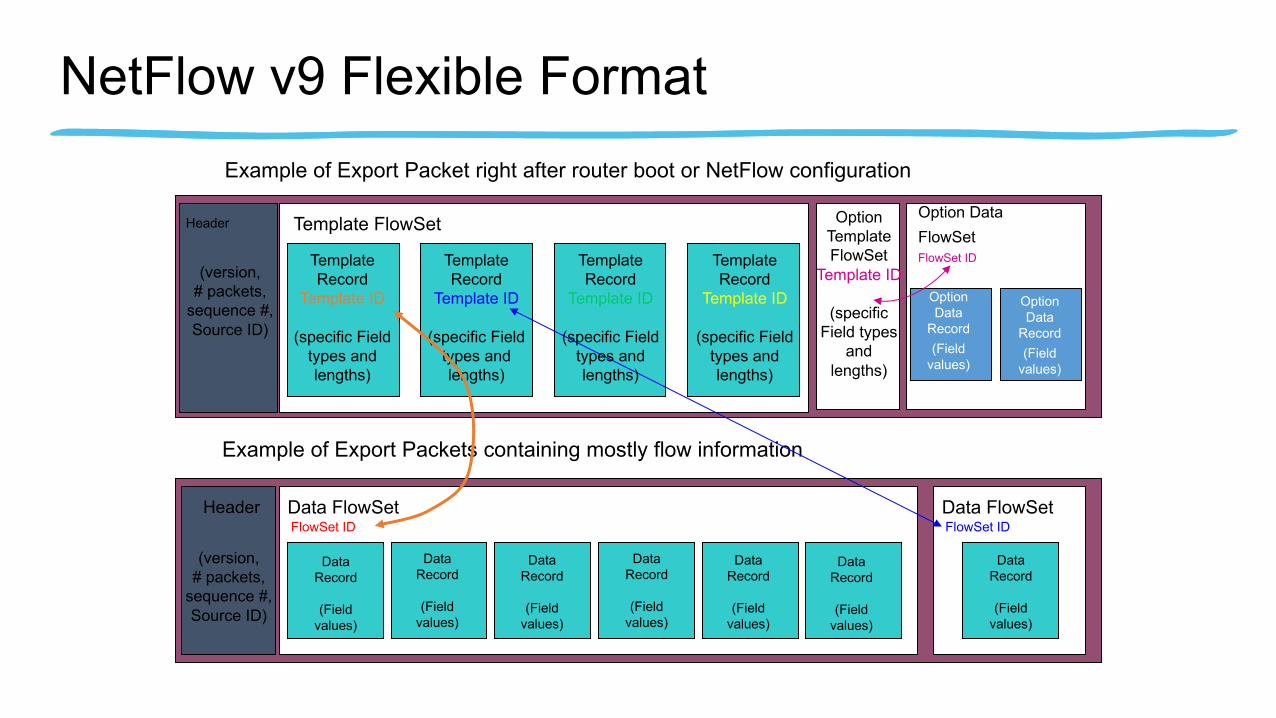
NetFlow v9 Flexible Format
Template FlowSet
Data FlowSetFlowSet ID
Data FlowSetFlowSet ID
Example of Export Packet right after router boot or NetFlow configuration
Example of Export Packets containing mostly flow information
Option DataFlowSetFlowSet ID
Header
Header
Option Data
Record(Field
values)
Option Data
Record(Field
values)
Data Record
(Field values)
Data Record
(Field values)
Data Record
(Field values)
Data Record
(Field values)
Data Record
(Field values)
Data Record
(Field values)
Data Record
(Field values)
(version, # packets,
sequence #, Source ID)
(version, # packets,
sequence #, Source ID)
Template Record
Template ID
(specific Field types and lengths)
Template Record
Template ID
(specific Field types and lengths)
Template Record
Template ID
(specific Field types and lengths)
Template Record
Template ID
(specific Field types and lengths)
Option TemplateFlowSet
Template ID
(specific Field types
and lengths)

NetFlow v9 Export
pamela(config)# ip flow-export version ?
1
5
9
pamela(config)# ip flow-export version 9 .
Configuring Version 9 export
pamela(config)# ip flow-aggregation cache as pamela(config-flow-cache)# enabled pamela(config-flow-cache)# export ? destination Specify the Destination IP address version configure aggregation cache export version
pamela(config-flow-cache)# export version ?8 Version 8 export format9 Version 9 export format
pamela(config-flow-cache)# export version 9
Configuring Version 9 export for an aggregation scheme
Export versions available for standard NetFlow flows
Export versions available for aggregated NetFlow flows
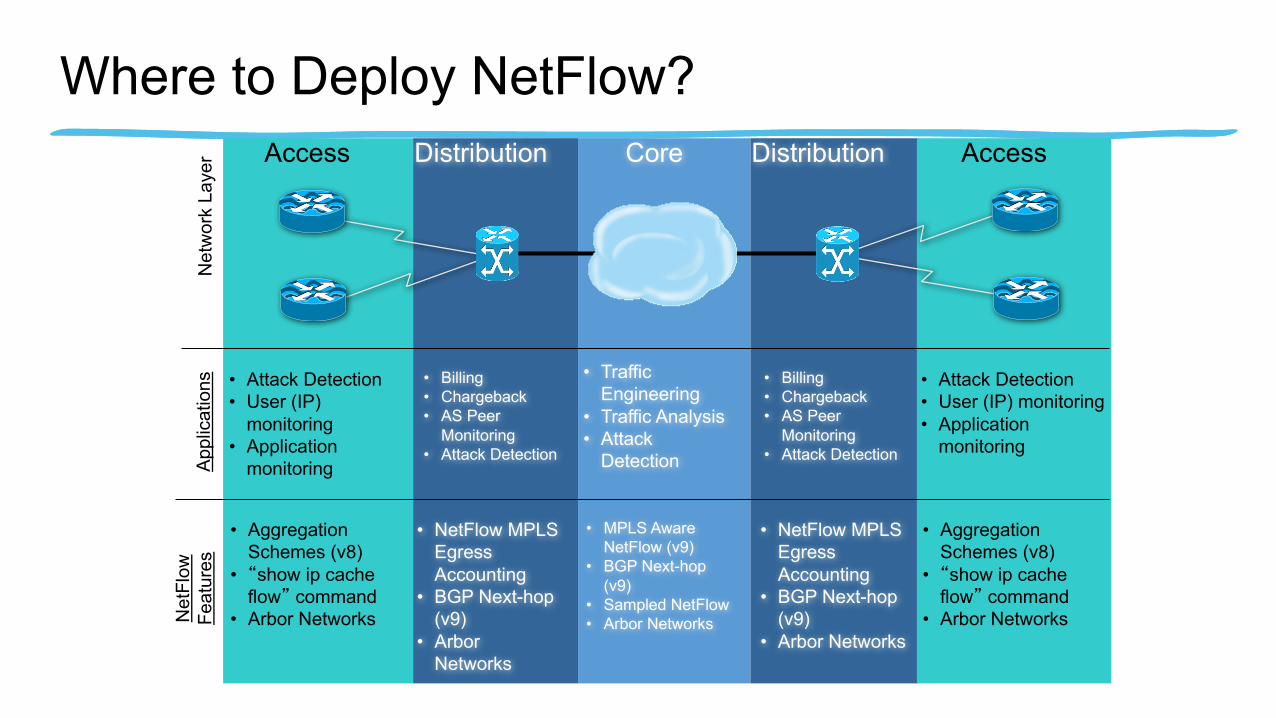
Where to Deploy NetFlow?
• Attack Detection• User (IP)
monitoring• Application
monitoring
• Billing• Chargeback• AS Peer
Monitoring• Attack Detection
• Traffic Engineering
• Traffic Analysis• Attack
DetectionAppl
icat
ions • Attack Detection
• User (IP) monitoring• Application
monitoring
• Billing• Chargeback• AS Peer
Monitoring• Attack Detection
Net
wor
k La
yer Access Distribution Distribution AccessCore
Net
Flow
Feat
ures
• Aggregation Schemes (v8)
• “show ip cache flow” command
• Arbor Networks
• NetFlow MPLS Egress Accounting
• BGP Next-hop (v9)
• Arbor Networks
• MPLS Aware NetFlow (v9)
• BGP Next-hop (v9)
• Sampled NetFlow• Arbor Networks
• NetFlow MPLS Egress Accounting
• BGP Next-hop (v9)
• Arbor Networks
• Aggregation Schemes (v8)
• “show ip cache flow” command
• Arbor Networks

Cisco 7200 NetFlow Example7200>sh ip cache flow
IP packet size distribution (14952M total packets):
1-32 64 96 128 160 192 224 256 288 320 352 384 416 448 480
.001 .325 .096 .198 .029 .014 .010 .010 .012 .003 .003 .005 .003 .003 .002
512 544 576 1024 1536 2048 2560 3072 3584 4096 4608
.004 .005 .009 .043 .217 .000 .000 .000 .000 .000 .000
IP Flow Switching Cache, 4456704 bytes
65527 active, 9 inactive, 2364260060 added
4143679566 ager polls, 0 flow alloc failures
Active flows timeout in 30 minutes
Inactive flows timeout in 15 seconds
last clearing of statistics never
Active flows
NetFlow Timeouts –tune to avoid the
churn

Cisco 7200 NetFlow Example (Cont.)Protocol Total Flows Packets Bytes Packets Active(Sec) Idle(Sec)
-------- Flows /Sec /Flow /Pkt /Sec /Flow /Flow
TCP-Telnet 1398292 0.3 14 156 4.6 6.0 17.2
TCP-FTP 99569986 23.1 1 41 24.2 0.0 4.8
TCP-FTPD 185530 0.0 1 66 0.0 1.5 17.4
TCP-WWW 440235639 102.5 8 483 919.5 2.9 10.1
TCP-SMTP 18951357 4.4 21 629 94.1 6.4 20.0
TCP-X 11340 0.0 1 48 0.0 0.2 40.8
TCP-BGP 4018 0.0 2 51 0.0 7.5 12.5
TCP-NNTP 2701390 0.6 104 846 65.5 10.6 16.9
TCP-Frag 38932 0.0 11 407 0.1 1.9 17.2
TCP-other 403434143 93.9 7 444 688.2 6.9 18.6
UDP-DNS 65590214 15.2 1 114 24.0 1.6 17.7
UDP-NTP 2415600 0.5 1 76 0.6 0.5 18.6
UDP-TFTP 70011 0.0 5 77 0.0 32.2 17.8
UDP-Frag 1017582 0.2 85 88 20.1 14.4 17.9
UDP-other 462375834 107.6 11 392 1189.0 5.3 23.5
ICMP 856323251 199.3 1 89 217.4 0.3 37.7
IGMP 98 0.0 4275 444 0.0 487.8 15.4
IPINIP 46 0.0 11229 412 0.1 1039.7 6.8
GRE 104643 0.0 10 86 0.2 47.9 15.8
IP-other 9766627 2.2 102 318 232.5 85.6 19.7
Total: 2364194533 550.4 6 411 3481.2 3.3 24.3
Traffic type
Hint:How many TCP based applications you know
have 1 pkt / flow?
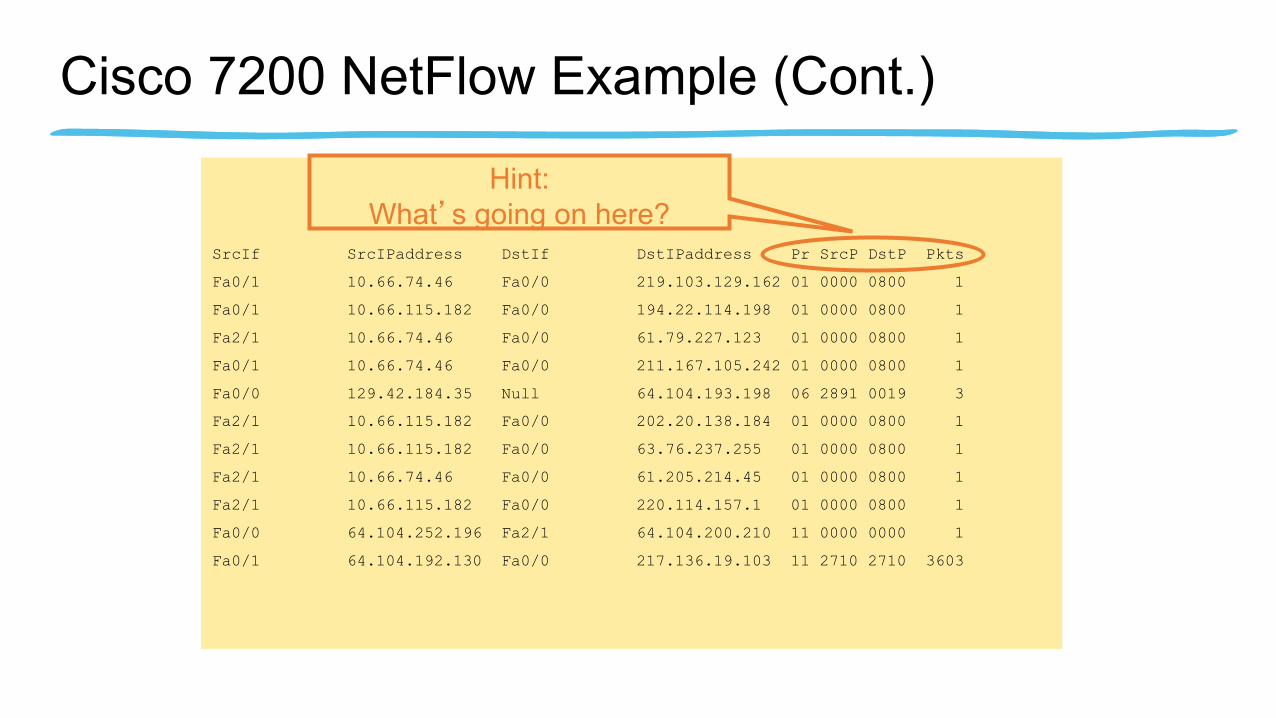
Cisco 7200 NetFlow Example (Cont.)
SrcIf SrcIPaddress DstIf DstIPaddress Pr SrcP DstP Pkts
Fa0/1 10.66.74.46 Fa0/0 219.103.129.162 01 0000 0800 1
Fa0/1 10.66.115.182 Fa0/0 194.22.114.198 01 0000 0800 1
Fa2/1 10.66.74.46 Fa0/0 61.79.227.123 01 0000 0800 1
Fa0/1 10.66.74.46 Fa0/0 211.167.105.242 01 0000 0800 1
Fa0/0 129.42.184.35 Null 64.104.193.198 06 2891 0019 3
Fa2/1 10.66.115.182 Fa0/0 202.20.138.184 01 0000 0800 1
Fa2/1 10.66.115.182 Fa0/0 63.76.237.255 01 0000 0800 1
Fa2/1 10.66.74.46 Fa0/0 61.205.214.45 01 0000 0800 1
Fa2/1 10.66.115.182 Fa0/0 220.114.157.1 01 0000 0800 1
Fa0/0 64.104.252.196 Fa2/1 64.104.200.210 11 0000 0000 1
Fa0/1 64.104.192.130 Fa0/0 217.136.19.103 11 2710 2710 3603
Hint:What’s going on here?
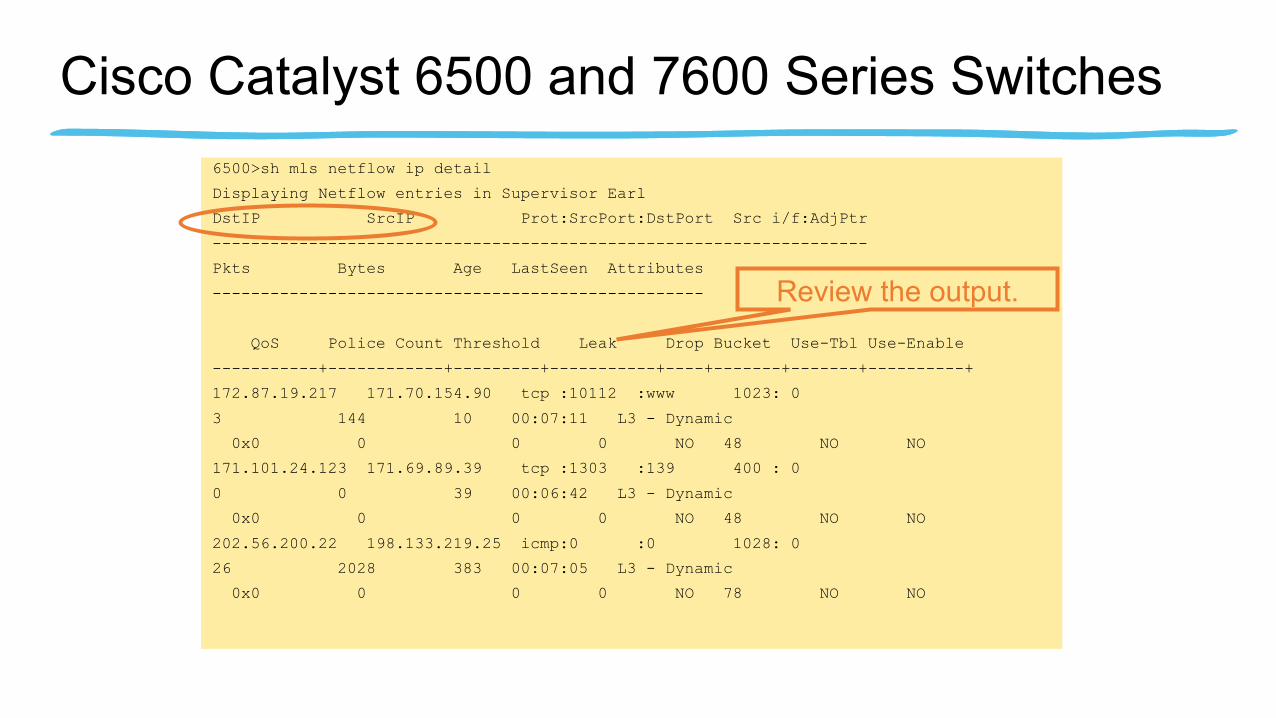
Cisco Catalyst 6500 and 7600 Series Switches6500>sh mls netflow ip detail
Displaying Netflow entries in Supervisor Earl
DstIP SrcIP Prot:SrcPort:DstPort Src i/f:AdjPtr
--------------------------------------------------------------------
Pkts Bytes Age LastSeen Attributes
---------------------------------------------------
QoS Police Count Threshold Leak Drop Bucket Use-Tbl Use-Enable
-----------+------------+---------+-----------+----+-------+-------+----------+
172.87.19.217 171.70.154.90 tcp :10112 :www 1023: 0
3 144 10 00:07:11 L3 - Dynamic
0x0 0 0 0 NO 48 NO NO
171.101.24.123 171.69.89.39 tcp :1303 :139 400 : 0
0 0 39 00:06:42 L3 - Dynamic
0x0 0 0 0 NO 48 NO NO
202.56.200.22 198.133.219.25 icmp:0 :0 1028: 0
26 2028 383 00:07:05 L3 - Dynamic
0x0 0 0 0 NO 78 NO NO
Review the output.
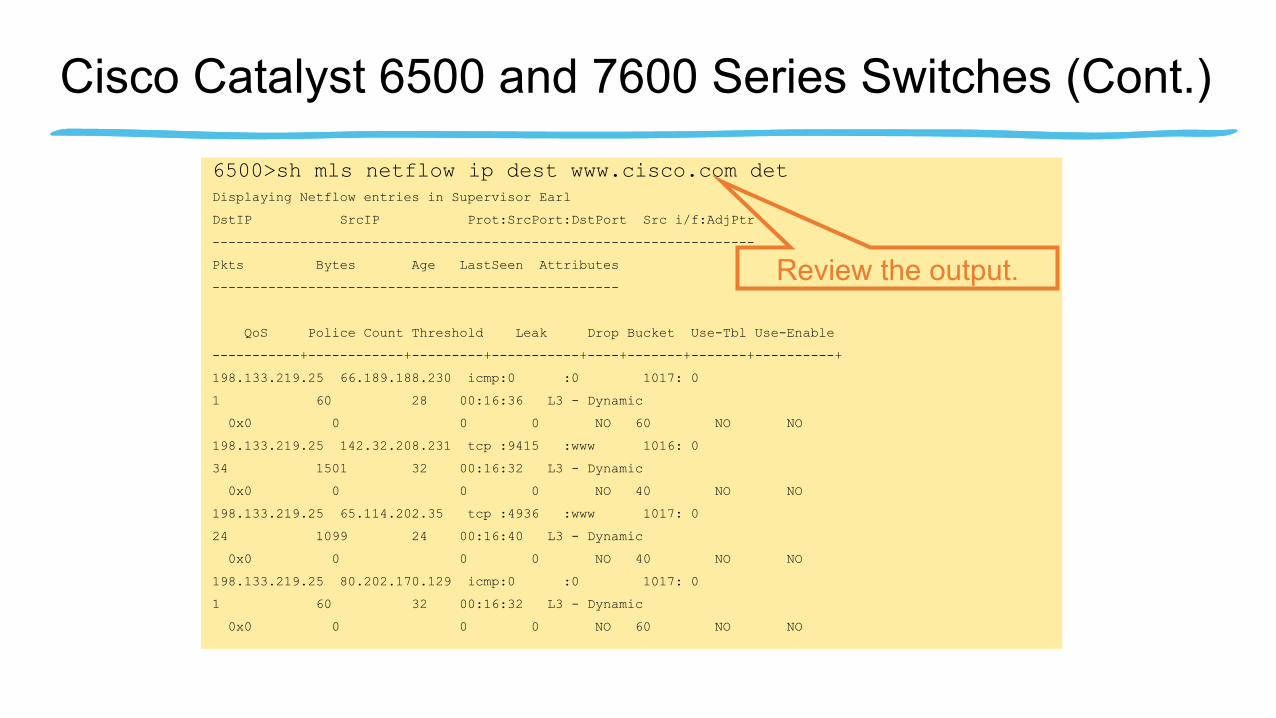
Cisco Catalyst 6500 and 7600 Series Switches (Cont.)
6500>sh mls netflow ip dest www.cisco.com detDisplaying Netflow entries in Supervisor Earl
DstIP SrcIP Prot:SrcPort:DstPort Src i/f:AdjPtr
--------------------------------------------------------------------
Pkts Bytes Age LastSeen Attributes
---------------------------------------------------
QoS Police Count Threshold Leak Drop Bucket Use-Tbl Use-Enable
-----------+------------+---------+-----------+----+-------+-------+----------+
198.133.219.25 66.189.188.230 icmp:0 :0 1017: 0
1 60 28 00:16:36 L3 - Dynamic
0x0 0 0 0 NO 60 NO NO
198.133.219.25 142.32.208.231 tcp :9415 :www 1016: 0
34 1501 32 00:16:32 L3 - Dynamic
0x0 0 0 0 NO 40 NO NO
198.133.219.25 65.114.202.35 tcp :4936 :www 1017: 0
24 1099 24 00:16:40 L3 - Dynamic
0x0 0 0 0 NO 40 NO NO
198.133.219.25 80.202.170.129 icmp:0 :0 1017: 0
1 60 32 00:16:32 L3 - Dynamic
0x0 0 0 0 NO 60 NO NO
Review the output.

Principal NetFlow Benefits
• Peering arrangements
• SLA VPN user reporting
• Usage-based billing
• DoS/worm detection
• Traffic engineering
• Troubleshooting
• Internet access monitoring (protocol distribution, traffic origin/destination)
• Associate cost of IT to departments
• More scalable than RMON
• DoS/worm detection
• Policy compliance monitoring
• Troubleshooting
SERVICE PROVIDER ENTERPRISE
Open Source Tools for NetFlow Analysis —The OSU Flow-Tools• Open source NetFlow collection and retrieval tools• Developed and maintained by Mark Fullmer, available from http://www.splintered.net/sw/flow-
tools/• Runs on common *NIX platforms (Linux, FreeBSD, Mac OS/X, Solaris, etc.)• Command-line tools allow for very display/sorting of specific criteria (source/dest IP, source/dest
ASN, protocol, port, etc.) • Data can be batched and imported into database such as Oracle, MySQL, Postgres, etc.• Can be combined with other tools to provide visualization of traffic patterns• Many other useful features - check it out today!

Open Source Tools for NetFlow Analysis Visualization—FlowScan• Open source NetFlow graphing/visualization tools• Developed and maintained by Dave Plonka, available from
http://net.doit.wisc.edu/~plonka/FlowScan/• Runs on common *NIX platforms (Linux, FreeBSD, Mac OS/X, Solaris, etc.)• Makes use of NetFlow data collected via flow-tools to build traffic graphs • Top-talkers by subnet, other types of reports supported• Makes use of RRDTool for graphing• Add-ons such as JKFlow module allow more detailed graphing

Source: University of Wisconsin
Open Source Tools for NetFlow Analysis Visualization—FlowScan (Cont.)
Investigate the spike
An identified cause of the outage

Source: University of Wisconsin
Open Source Tools for NetFlow Analysis Visualization—FlowScan (Cont.)
Undesirable Applications
present?
Traffic breakdown by applications
NetFlow-Based Traffic Characterization and Anomaly Detection w/Arbor Networks
• Network Anomaly Detection and Traffic Characterization/Capacity Planning• Most widely deployed Anomaly Detection system for SPs• Uses NetFlow to quickly identify, classify, and scope DoS, worms, etc.• Traffic component combines NetFlow traffic characterization w/BGP• Allows comprehensive peering analysis in real-time• A ‘force multiplier’ which greatly reduces reaction-times by providing the
relevant information up-front• Can also generate its own flows from packet-capture if NetFlow isn’t available
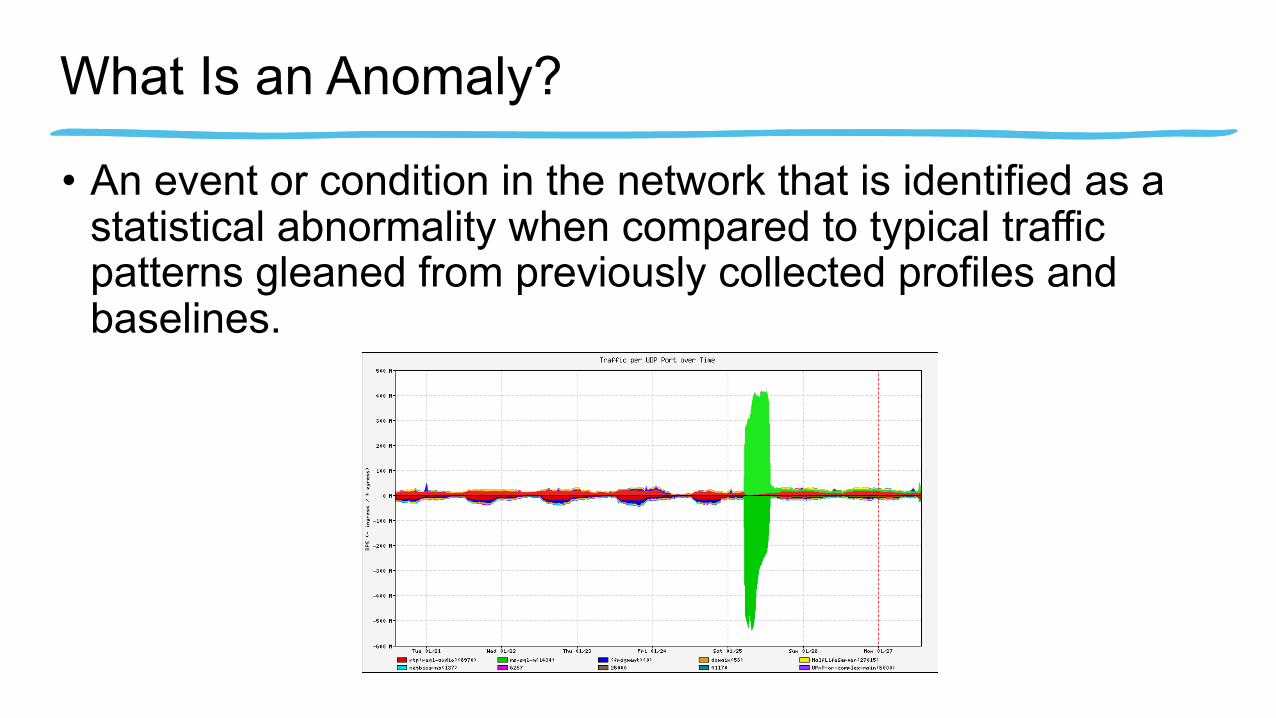
What Is an Anomaly?
• An event or condition in the network that is identified as a statistical abnormality when compared to typical traffic patterns gleaned from previously collected profiles and baselines.

NetFlow-Based Traceback
NetFlow-Based Traceback (Cont)
• Provides information about the anomaly– 31.59 kpps @ 21:14
• Statistically accurate analysis provided• Provides correlated analysis – near real time• Reliable analysis with comprehensive coverage• Ability to provide a quick snapshot• Fully characterizing and accounting for full impact of attack
can de provided

The Attack in More Detail

The Attack in More Detail (Cont.)Useful Src IP
to investigate?
Identified port related to the
attack
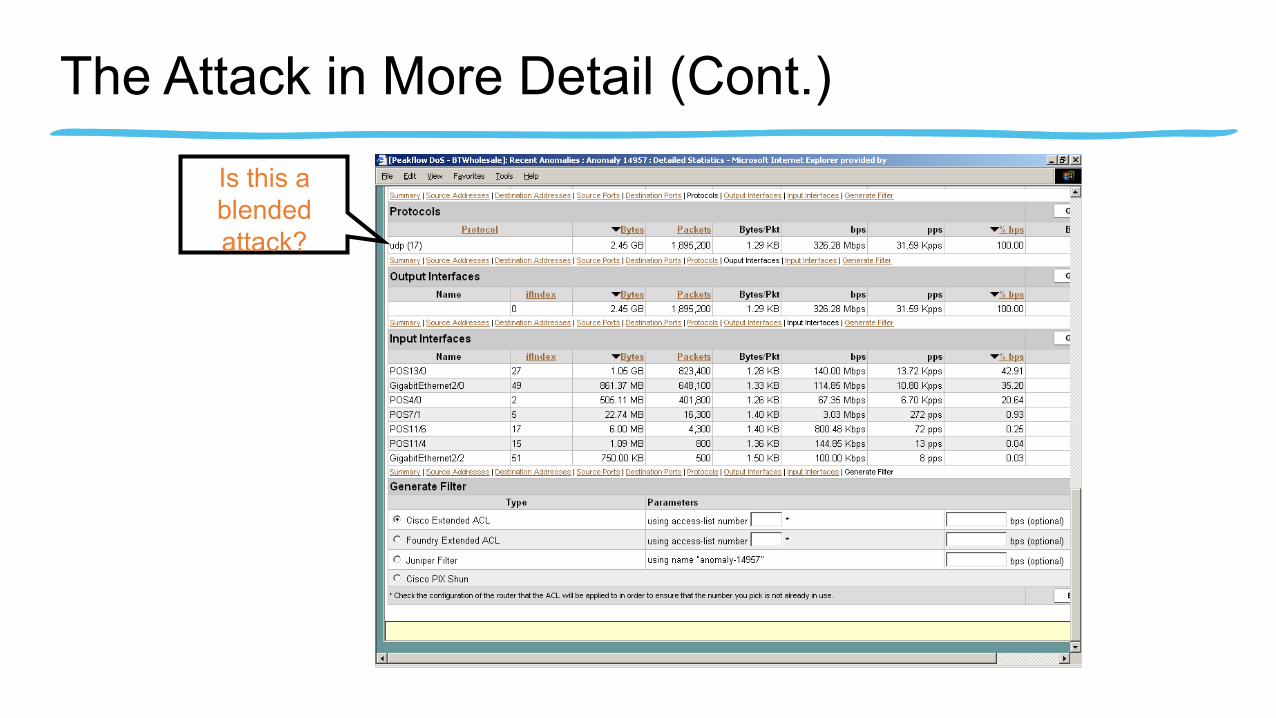
The Attack in More Detail (Cont.)
Is this a blended attack?
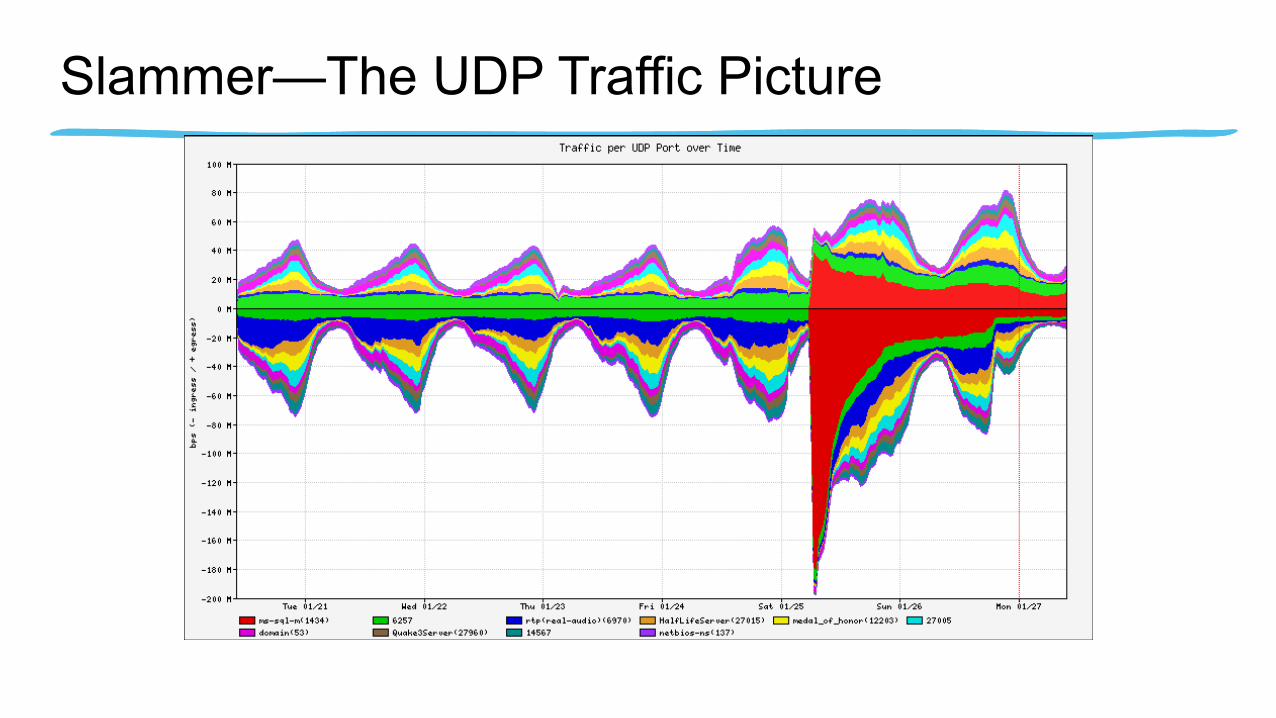
Slammer—The UDP Traffic Picture
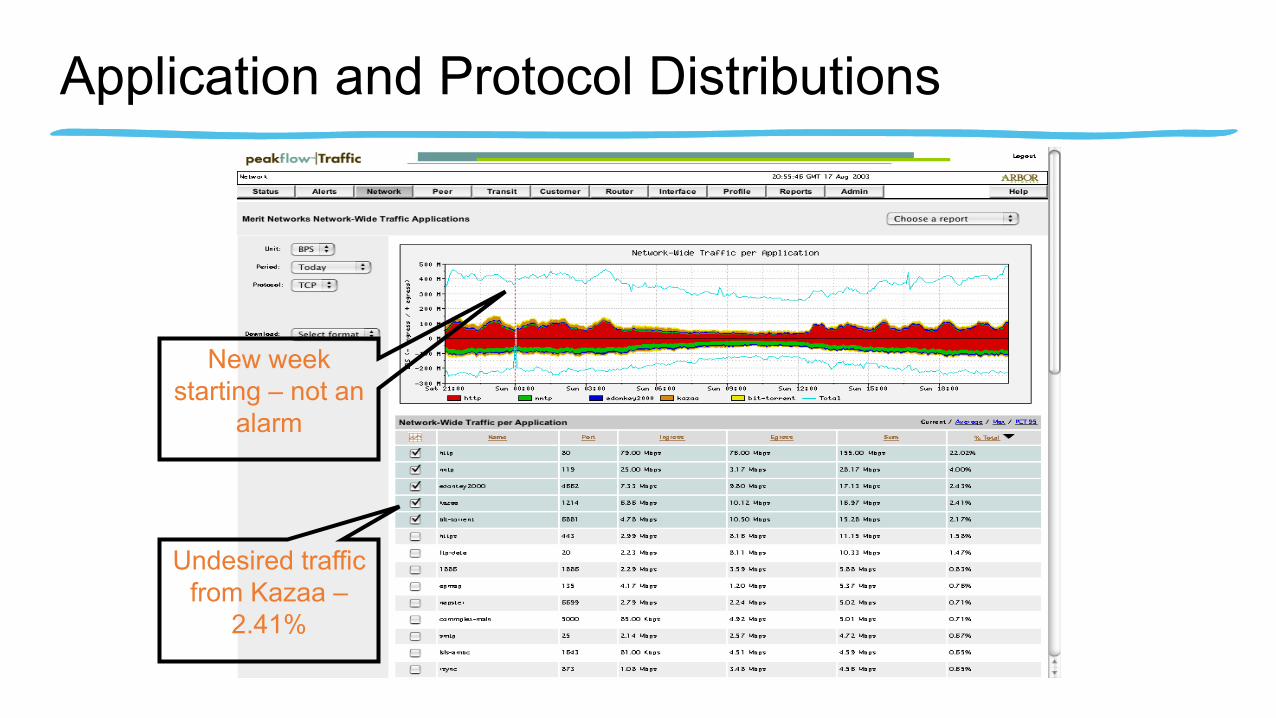
Application and Protocol Distributions
Undesired traffic from Kazaa –
2.41%
New week starting – not an
alarm

Coupling Control and Data Planes

NetFlow—More Information
• Cisco NetFlow Home—http://www.cisco.com/warp/public/732/Tech/nmp/netflow
• Linux NetFlow Reports HOWTO—http://www.linuxgeek.org/netflow-howto.php
• Arbor Networks Peakflow SP—http://www.arbornetworks.com/products_sp.php

PROACTIVE TELEMETRY:SNMP

SNMP• SNMP = Simple Network Management Protocol• Canonical method of obtaining real-time information from network devices• SNMPv3 provides authentication, encryption• MIBs support polling of statistics ranging from interface bandwidth to CPU utilization to chassis
temperature, etc.• Both a ‘pull’ model for statistical polling and a ‘push’ model for trap generation based upon
events such as link up/down• Many open-source and commercial collection systems, visualization tools• Easiest way to get into profiling of general network characteristics
Displaying SNMP Data with MRTG
• MRTG—the Multi Router Traffic Grapher• Open source SNMP visualization toolset developed by Tobi
Oetiker, available from http://people.ee.ethz.ch/~oetiker/webtools/mrtg/
• Long track-record - (in general use since 1995)• Can be used to graph router/switch data, host performance info
from systems running SNMP agents, etc. (generates HTML w/PNG images)
• Runs on Linux, FreeBSD, Mac OS/X, Solaris, other *NIX, Windows
• Written in Perl, has its own SNMP implementation

Source: mrtg.org
Powerful Visualization of SNMP with MRTG

Source: mrtg.org
Powerful Visualization of SNMP with MRTG (Cont.)
Various type of statistics
gathering and display

Other Visualization Techniques Using SNMP Data with RRDTool• RRDTool—the Round Robin Database Tool• Another open source SNMP visualization toolset developed by Tobi Oetiker, available from
http://people.ee.ethz.ch/~oetiker/webtools/rrdtool/• Improved graphing performance, new types of graphs• Can be used in conjunction with MRTG - does not do its own SNMP collection (can also be used
w/NetFlow via OSU flow-tools & FlowScan)• Runs on Linux, FreeBSD, Mac OS/X, Solaris, other *NIX, Windows• Many nice HTML/PHP front-ends such as Cacti, Cricket, Big Sister, etc.

Source: http://people.ee.ethz.ch/~oetiker/webtools/rrdtool/
Other Visualization Techniques Using SNMP Data with RRDTool (Cont.)
Anomaly for DNS Queries
Thru’put Spike
RTTSpike
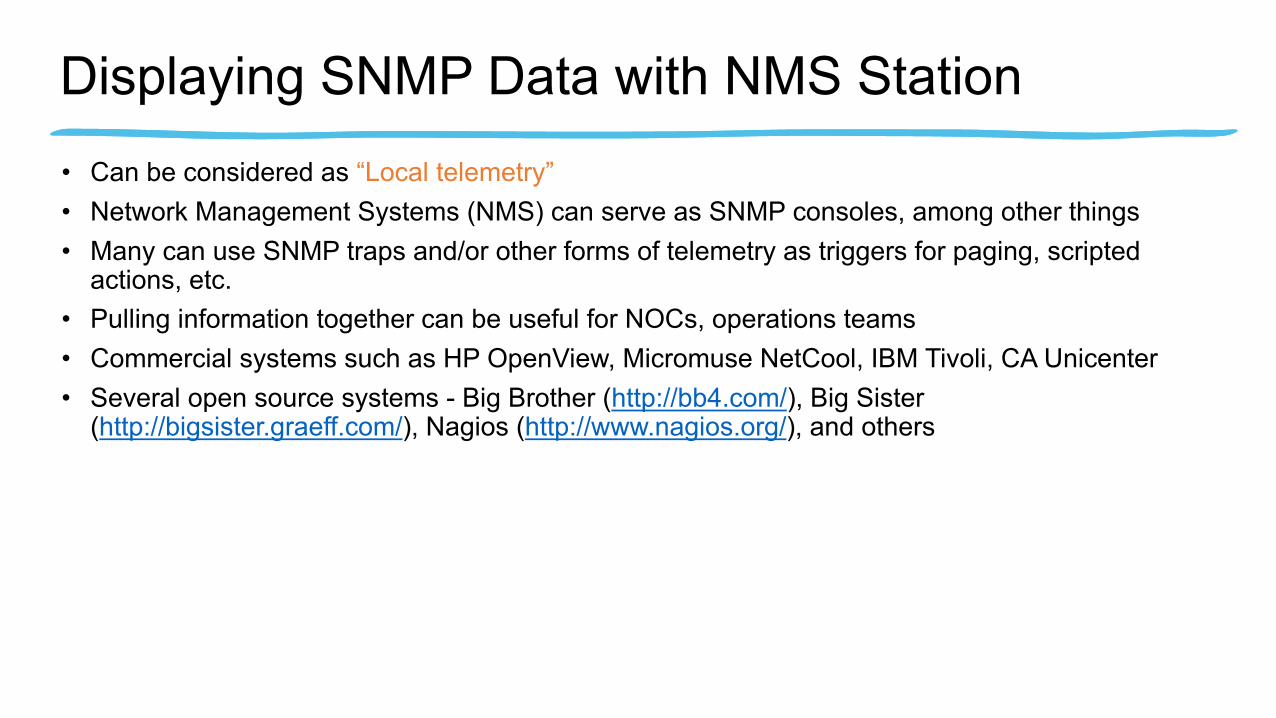
Displaying SNMP Data with NMS Station• Can be considered as “Local telemetry”• Network Management Systems (NMS) can serve as SNMP consoles, among other things• Many can use SNMP traps and/or other forms of telemetry as triggers for paging, scripted
actions, etc.• Pulling information together can be useful for NOCs, operations teams• Commercial systems such as HP OpenView, Micromuse NetCool, IBM Tivoli, CA Unicenter• Several open source systems - Big Brother (http://bb4.com/), Big Sister
(http://bigsister.graeff.com/), Nagios (http://www.nagios.org/), and others
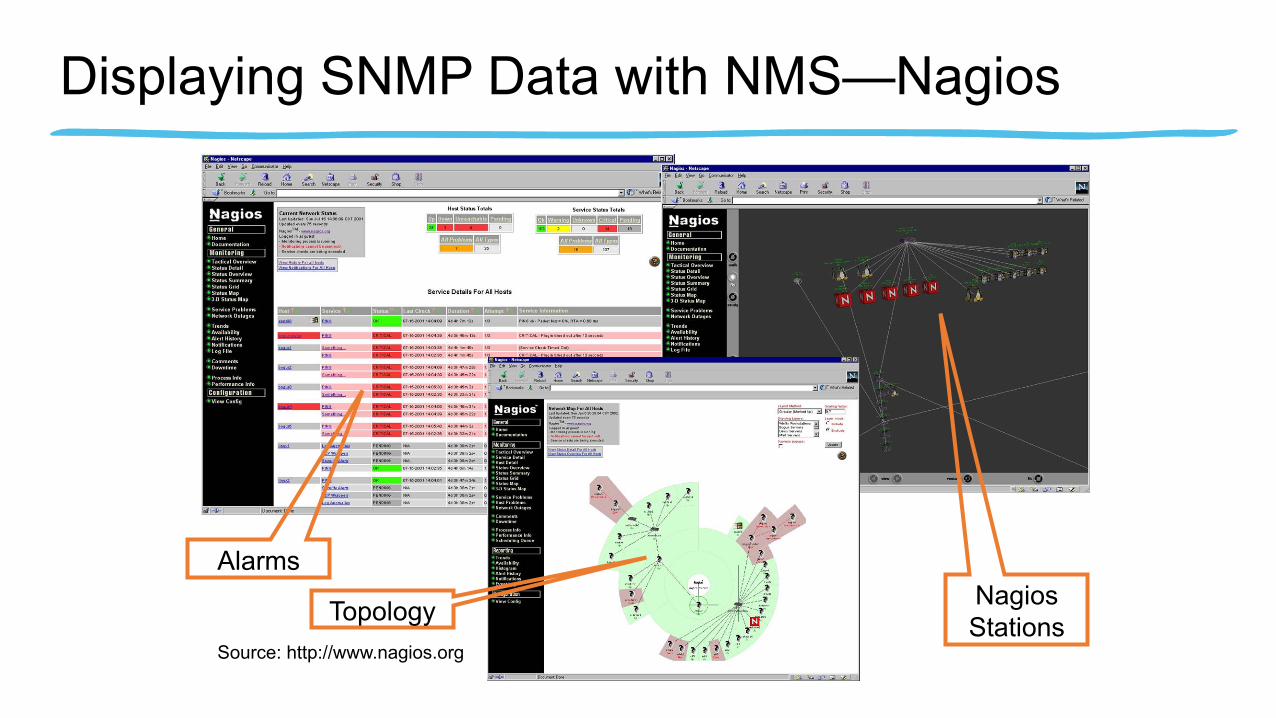
Source: http://www.nagios.org
Displaying SNMP Data with NMS—Nagios
Alarms
Topology Nagios Stations
More Information about SNMP
• Cisco SNMP Object Tracker— http://www.cisco.com/pcgi-bin/Support/Mibbrowser/mibinfo.pl?tab=4
• Cisco MIBs and Trap Definitions—http://www.cisco.com/public/sw-center/netmgmt/cmtk/mibs.shtml
• SNMPLink—http://www.snmplink.org/• SEC-1101/2102 give which SNMP parameters should be
looked at.

PROACTIVE TELEMETRY:
BGP
BGP—Why Do We Care?• Large-scale network security events such as worms, DDoS attacks, etc. often produce side-effects visible
in the global routing table• Correlating BGP information with other forms of telemetry (NetFlow, SNMP, RMON, etc.) can be effective in
determining the true impact of incidents• Zebra (http://www.zebra.org) and Quagga (http://www.quagga.net) are two open source BGP daemons
which can log BGP updates for further analysis• Arbor Peakflow SP Traffic provides BGP visualization, trending, NetFlow traffic correlation, additional
functionality (http://www.arbornetworks.com/products_sp.php)• RIBs/updates available from http://archive.routeviews.org/, http://www.ripe.net/ris/index.html,
http://www.renesys.com (commerical, useful monitoring tools/services for your ASN)

BGP Example—SQL Slammer

Correlating NetFlow and Routing Data
Matching data collected from different tools

How to Deploy BGP?• Start with open source tools: Zebra and Auagga• Correlating BGP information with other forms of telemetry (NetFlow, SNMP, RMON, etc.) can be
effective in determining the true impact of incidents• Zebra (http://www.zebra.org) and Quagga (http://www.quagga.net) are two open source BGP
daemons which can log BGP updates for further analysis• Arbor Peakflow SP Traffic provides BGP visualization, trending, NetFlow traffic correlation,
additional functionality (http://www.arbornetworks.com/products_sp.php)• RIBs/updates available from http://archive.routeviews.org/, http://www.ripe.net/ris/index.html,
http://www.renesys.com (commerical, useful monitoring tools/services for your ASN)
BGP—More Information
• Cisco BGP Home—http://www.cisco.com/en/US/tech/tk365/tk80/tech_protocol_family_home.html
• Slammer/BGP analysis—http://www.nge.isi.edu/~masseyd/pubs/massey_iwdc03.pdf
• Team CYMRU BGP Tools— http://www.cymru.com/BGP/index.html
TELEMETRY: SYSLOG
Syslog• De facto logging standard for hosts, network infrastructure
devices, supported in all Cisco routers and switches• Many levels of logging detail available—choose the level(s) which
are appropriate for each device/situation• Logging of ACLs is generally contraindicated due to CPU
overhead—NetFlow provides more info, doesn’t max the box• Can be used in conjunction with Anycast and databases such as
MySQL (http://www.mysql.com) to provide a scalable, robust logging infrastructure
• Different facility numbers allows for segregation of log info based upon device type, function, other criteria
• Syslog-ng from http://www.balabit.com/products/syslog_ng/ adds a lot of useful functionality—HOW-TO located at http://www.campin.net/newlogcheck.html
Configuring Syslog on a Router• Syslog data is invaluable
• Attack forensics• Day to day events and debugging
• To log messages to a syslog server host, use the logging global configuration command• logging host • logging trap level
• To log to internal buffer use:• logging buffered size
• Ensure timestamps• service timestamps log…

syslog - CS-MARS

syslog - Sawmill
Benefits of Deploying Syslog
• Syslog data can be available from a centralized SysLog server(s) as well as router’s local buffer
• Deploy on routers, switches, firewall, IPS sensors and other network elements to get a holistic picture
• Analysis tools available such as Cisco MARS, SEC, ModLogAn and others
• SysLog Server such as Kiwi and syslog-ng

Syslog—More Information
• Syslog.org - http://www.syslog.org/• Syslog Logging w/PostGres HOWTO—
http://kdough.net/projects/howto/syslog_postgresql/• Agent Smith Explains Syslog— http://routergod.com/agentsmith/• Cisco CS-MARS
http://www.cisco.com/en/US/products/ps6241/index.html

PROACTIVE TELEMETRY: NETWORK TIME PROTOCOL
Network Time Protocol
• Synchronize time across all devices• When security event occurs, data must have consistent
timestamps• From external time source
• Upstream ISP, Internet, GPS, atomic clock• From internal time source• Router can act as stratum 1 time source• ntp source loopback0• ntp server 10.1.1.1 source loopback0

Benefits of Deploying NTP
• Very valuable on a global network with network elements in different time zones
• Easy to correlate data from a global or a sizable network with a consistent time stamp
• NTP based timestamp allows to trace security events for chronological forensic work
• Any compromise or alteration is easy to detect as network elements would go out of sync with the main ‘clock’
REACTIVE TELEMETRY: PACKET CAPTURE

Packet Capture• Sometimes, there’s just no substitute for looking at the packets on the wire• SPAN/RSPAN/ERSPAN allow packet capture from Catalyst switches; ip packet export allows
packet capture from routers• Open source tools such as tcpdump, snoop, Ethereal (http://www.ethereal.com) on free *NIX or
Windows allow inexpensive packet-capture solutions to be built and deployed• Commercial tools such as Cisco NAM-2, NAI Sniffer/Distributed Sniffer, Wandel and Goltermann
available• Use macroanalytical telemetry such as SNMP, NetFlow, RMON to guide your use of
microanalytical telemetry (i.e., packet capture)

Source: http://www.ethereal.com, Cisco Systems, Inc.
Packet Capture Examples
Wealth of information, L1-L7
raw data for analysis

How to Use Packet Capture• Mainly a reactionary tool
• Generally a reaction after finding out that there is an anomaly• Used in telemetry during the security event
• Need to know where to capture the packet.• Sometimes, the same packet needs to be captured in multiple places
• Wealth of information• Informs what type of outbreak one is observing on the network• Provides raw data for further analysis• Helps by providing information on how to bring the safeguards for short term and long tem mitigation
Packet Capture - More Information
• tcpdump/libpcap home—• http://www.tcpdump.org/
• Vinayak Hegde’s Linux Gazette article—• http://www.linuxgazette.com/issue86/vinayak.html
• Cisco SPAN/RSPAN for 6500/7600 docs—• http://www.cisco.com/en/US/products/hw/switches/ps708/products_confi
guration_guide_chapter09186a008007f323.html• tcpdump/libpcap home—
• http://www.tcpdump.org/• Ethereal
• http://www.ethereal.com
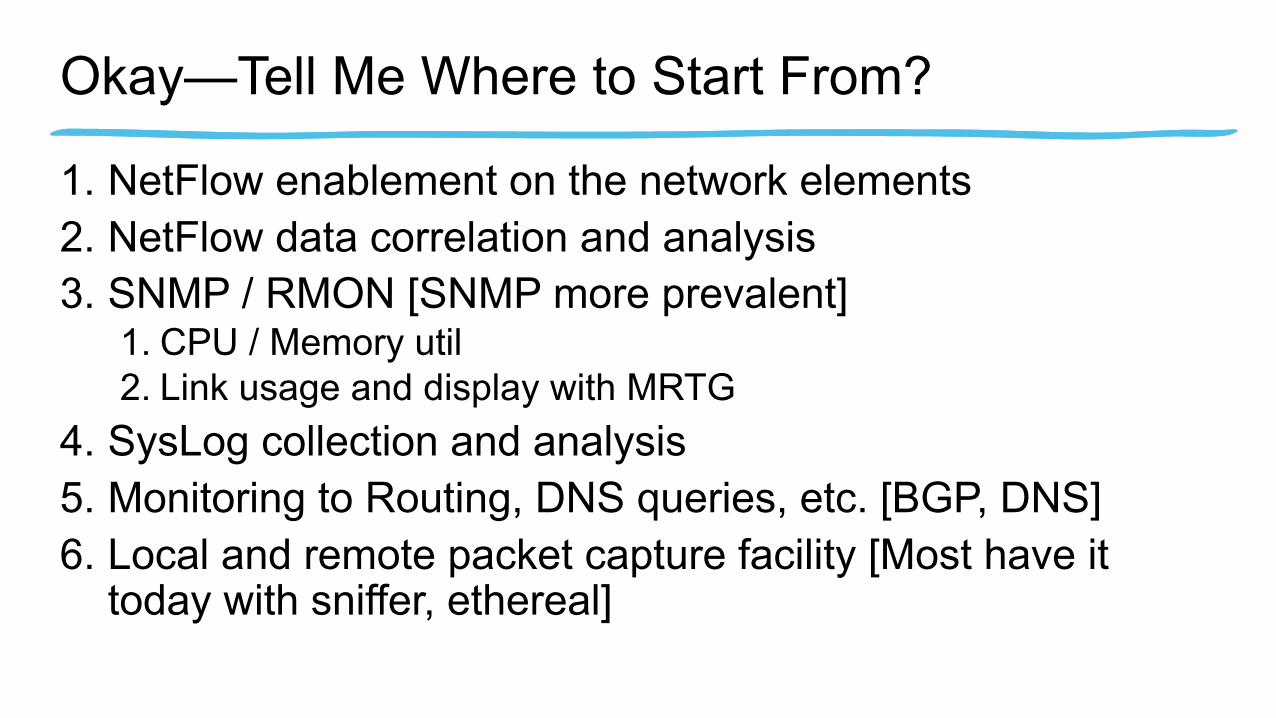
Okay—Tell Me Where to Start From?
1. NetFlow enablement on the network elements2. NetFlow data correlation and analysis 3. SNMP / RMON [SNMP more prevalent]
1. CPU / Memory util2. Link usage and display with MRTG
4. SysLog collection and analysis5. Monitoring to Routing, DNS queries, etc. [BGP, DNS]6. Local and remote packet capture facility [Most have it
today with sniffer, ethereal]
Summary
• Define telemetry strategy—ASAP• Local and remote
• Need to start deployment today where the most bang for the buck is offered. However, the end goal is to achieve the holistic view
• Telemetry: Deploy, Understand and Practice• For any security event – Proactive Telemetryor
telemetry during the incident, if ‘SECOPS’ trained then they can use it with familiarity of ‘back of their hand’
• Telemetry builds foundation to be successful with all the other 5 of 6 steps methodology

Additional References
• Product Security: • Cisco’s product vulnerabilities; a page that every SE MUST know!!!
[http://www.cisco.com/warp/public/707/advisory.html]• Security reference information: Various white papers on DoS attacks and
how to defeat them [http://www.cisco.com/warp/public/707/ref.html]
• ISP Essentials:• Technical tips for ISPs every ISP should know
[ftp://ftp-eng.cisco.com/cons/isp/]
• Technical tips:• Troubleshooting High CPU Utilization on Cisco Routers
[http://www.cisco.com/warp/public/63/highcpu.html]• The “show processes” command
[http://www.cisco.com/warp/public/63/showproc_cpu.html]• NetFlow performance white paper
[http://www.cisco.com/warp/public/cc/pd/iosw/prodlit/ntfo_wp.htm]
• Mailing lists: • Cust-security-announce: All customers should be on this list • Cust-security-discuss: For informal discussions

Recommended Reading
Silence on the Wireby Michael ZalewskiISBN: 1593270461
Recommended Reading
The Tao of Network Security Monitoringby Richard BejtlichISBN: 0321246772

Recommended Reading
TCP/IP Illustrated, Vol. I (The Protocols)by W. Richard StevensISBN: 0201633469