02 nhdr 2010 english
TRANSCRIPT

Egypt Human Development Report 2010

Egypt Human Development Report 2010
Youth in Egypt: Building our Future
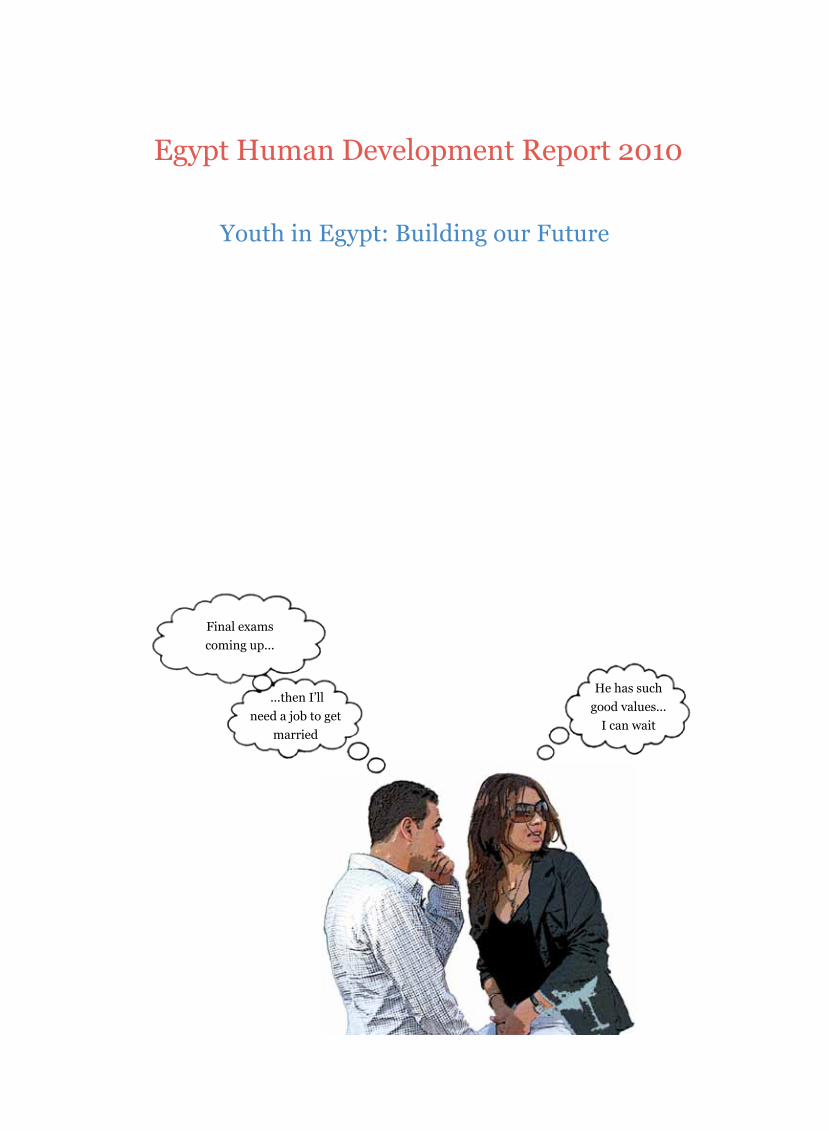
Final exams
coming up...
...then I’ll
need a job to get
married
He has such
good values...
I can wait

The Egypt Human Development Report 2010 is a major output of the Human Development Project, executed bythe Institute of National Planning, Egypt, under the project document EGY/01/006 of technical cooperation with the United Nations Development Programme (UNDP).
Copyright 2010, United Nations Development Programme, and the Institute of National Planning, Egypt.
The analysis and policy recommendations of this report do not necessarily reflect the views of the UNDP or the Ministry of Economic Development. The authors hold responsibility for the opinions expressed in this publication.
All rights reserved. No part of this publication may be reproduced, stored in a retrieval system or transmitted in any form or by any means, electronic, mechanical, photocopying, recording or otherwise, without prior permission or reference to this source.
Concept, cover, photo montage, design, layout by Joanne Cunningham.
Illustration creditsAll photography by Joanne Cunningham, UNDP, MDG Sailing the Nile Project.
Printed by Virgin Graphics (www.virgingraphic.com)
Local: 2010/9803 ISBN: 977-5023-12-2

Acknowledgements
Heba Handoussa
Heba Handoussa
Ashraf el Araby, Hoda el Nemr, Zeinat Tobala
Ghada Barsoum, Mohamed Ramadan,
Safaa el Kogali
Heba Nassar, Ghada Barsoum, Fadia Elwan,
Hanan el Shair
Magued Osman, Saeed el Masry
Heba Handoussa, Heba el Laithy
Maya Morsy
Ali Sawi, Zein Abdel Hady
Laila el Baradei
Ziad Bahaa el Din
Ragui Assaad
Amira Kazem
Habiba Wassef, Tarek Okasha
Mostafa Madbouly
Heba Handoussa, Magued Osman,
Sahar el Tawila, Mohamed Ramadan,
Heba el Laithy, Dina Armanious
Sally Isaac, Shaheer Ishak, Nihal Elwan,
Seif Abou Zeid, Abeer Soliman,
Nermine Wally, Salma El Fawal,
Engy el Refaee
Director anD LeaD author
authorsChapter One
Chapter Two
Chapter Three
Chapter Four
Chapter Five
Chapter Six
Chapter Seven
Chapter Eight
Chapter Nine
Chapter Ten
Chapter Eleven
Chapter Twelve
Chapter Thirteen
Chapter Fourteen
Chapter Fifteen
Chapter Sixteen
{ V }
inP contributors Ashraf el Araby, Fadia Abdel Salam
Hoda el Nemr, Zeinat Tobala
eDitor anD aDvisorGillian Potter
reaDersOsman M Osman, Safie El-Din Kharboush,
Ali el Din Hilal, Hossam Badrawi,
Djavad Salehi-Isfahani, Dina Shehata,
Mounir Tabet, Nahla Zeitoun,
Glenda Gallardo, Mario Posas
research anD coorDinationNahla Zeitoun, Heba Abu Shnief,
Defne Abbas
transLation arabic Nadia Abdel Azim, Mohamed Ghazal,
Rosette Francis
arabic Copy Editing
Nadia Abdel Azim
sPeciaL thanksNoha Mekkawy, Mohamed Abou El-Khir,
Seheir Habib
Special thanks are due to
the Population Council for
providing the full results of its
extensive Survey of Young People
in Egypt (SYPE) which was
undertaken in the summer
of 2009. Sincere thanks are
owed to Sherif Kamel and Halla
Shaffey for their continuous
involvement with the 2010 EHDR
Team and for their valuable
background papers which have
informed various chapters of the
report. Thanks are also due to
Ehaab Abdou and to the energetic
young team who authored
Chapter 16 and conducted focus
groups to follow-up on the SYPE
results and their implications.
{ VI }

Preface
Today, about one quarter of Egypt’s population — young men and women between the ages of 18 to 29 years — aspire to full and productive lives as they move from education to work, to citizen-
ship, marriage and the establishment of independent households. As the next generation, many will take on positions of leadership, while others will contribute significantly to productivity and rising prosper-ity. It is clear therefore that their wellbeing will affect the growth and welfare of Egypt as a whole.
The outcome of youth’s transition to adulthood, if badly managed, becomes highly
problematic. Many will suffer from poorer skill and job outcomes and therefore
prolonged periods of unemployment; young cohorts with little experience of com-
munity participation and civic duties will acquire a fragile understanding of citi-
zenship and its responsibilities; and many will develop an unproductive depen-
dency on family and state, when what is needed is a young and dynamic body of
industrious and resourceful citizens able to meet development goals in a fruitful
and inventive manner.
A positive outcome to this susceptible transition phase to adulthood depends on an
environment that will enable young people to successfully negotiate the drawbacks
and difficulties they may have to face. Emancipation and empowerment are essen-
tial to egalitarian participation — not only as a commitment from government but
also from young people themselves. Civic freedoms and personal liberties need to
be accompanied by the performance of public and national duties, by responsible
and accountable citizenry. And as one young contributor to this report suggests,
commitment to such obligations must also come from families, learning institu-
tions, academia, NGOs, private voluntary organizations, the private sector, youth
led-organizations, the media, political parties and religious institutions. Each of
these institutions has a vital role to play in ensuring that the Egypt of tomorrow will
meet the ambitions of today.
Many national governments have also devised comprehensive youth strategies,
youth policies, employed youth lenses, formed youth development bodies or estab-
lished independent youth budgets to help youth overcome obstacles in their path
to adulthood. Egypt is no exception. Youth’s modest participation and little civic
engagement are being addressed through the creation of clubs, sports and leisure
centers, while political parties, the ruling National Democratic Party in particu-
{ VII }

lar, are promoting youthful membership and contributions to the political debate.
Young people’s high unemployment rates, particularly for those entering the labor
market for the first time, are a source of great concern to the Government of Egypt,
and efforts are being exerted so that the mismatch between higher educational and
labor market requirements is significantly reduced. Indeed, the education system
as a whole is being reformed to introduce pedagogical practices that promote not
only marketable skills, but also critical thinking, creative problem-solving, and at a
more fundamental level, the values of tolerance and openness.
This report suggests that to complement such enabling conditions, a number of pre-
requisite must be addressed. Egypt’s record of democracy and respect for human
rights must match internationally accepted standards, corruption and deteriorat-
ing individual and community values must continue to be attended to, and reli-
gious intolerance eradicated. These are concerns that have been frequently articu-
lated by young people in this report. More attention needs to be given to enable the
culture of voluntarism and civic engagement to grow. Participatory mechanisms
can be further developed for young people to have a greater say in the planning
and implementation of affairs that will impact their lives, notably with regard the
design of political platforms and the partaking in local and national elections.
The government is committed to develop and adopt a multidimensional concept
of youth welfare that gives greater focus to the interrelated dimensions of educa-
tion, access to ICT, employment and the quality of jobs, income levels, gender
parity, health, civic participation, and so forth, and to translate these into an inte-
grated strategy and action plan. The government is also committed to attain an
equitable distribution of capabilities and opportunities for all of Egypt’s youth.
What will be more difficult will be to address such issues as leisure, well-being,
and even the dynamics of the family including social cohesiveness, which fall
under the umbrella of civil society. In this respect, it is clear that both older and
younger generations alike must bear an equal responsibility for preservation of
the environment, citizen safety, community values, positive aspects of culture,
and oversight for good governance.
Osman Mohamed Osman
Minister of Economic Development
Chairman of the Board,
Institute of National Planning
{ VIII }

Foreword
I I am delighted to write this foreword for the latest Egypt Human Development Report (EHDR), which focuses on the vital issue of youth in Egypt: their aspirations, the opportunities available to
them, the challenges they face in realizing their personal goals, and their potential to contribute to human development in Egypt. This is the eleventh such report produced by the Institute of National Plan-ning, Ministry of Economic Development, with support from the United Nations Development Programme (UNDP).
According to the 2006 census, approximately 40 percent of Egyptians are between
the ages of 10 and 29. The 2010 EHDR analyses the opportunities and constraints
facing youth from a human development perspective. It examines the role of youth
in Egypt’s development process on issues such as education, health, gender, pov-
erty, employment, housing, and participation in society. The Report showcases
success stories of youth-centred initiatives, programmes, and projects, calling for
greater consultation and communication among young people, the Government
and civil society. It also identifies and assesses the most pressing issues affecting
youth in Egypt, with the aim of formulating a ‘vision for youth’ that is based on
equity, opportunity, ownership and their participation in the development process.
As such, the Report highlights Nine Main Messages to ensure youth’s inclusion and
full participation in society.
It is auspicious that this Report coincides with the International Year of Youth.
Under the theme ‘Dialogue and Mutual Understanding,’ the Year of Youth aims to
encourage dialogue and understanding across generations and promote the ideals
of peace, respect for human rights, freedoms, and solidarity. The Year of Youth also
encourages young people to do their part to help achieve the Millennium Develop-
ment Goals (MDGs) for all people, including women and children and people living
with disabilities, with special attention to those areas of Egypt where poverty rates
are highest.
As illustrated throughout the Report, Egypt’s youth aspire to a socially inclusive
society in which they feel valued, with opportunities to learn well, find decent work,
engage productively in the community, have a voice, afford marriage, and establish
their own homes. Achieving such outcomes for youth requires a coherent frame-
work for action that sets priorities, provides clear lines of accountability, and is
integrated within national planning and implementation mechanisms.
{ IX }

The Egypt Human Development Report (EHDR) for 2010 was prepared by a core
group led by Heba Handoussa, with the participation of a multidisciplinary team
of 26 authors, and in collaboration with Egypt’s Institute of National Planning, the
Ministry of Economic Development, and the National Council for Youth. Young
people in Egypt were also actively involved in preparing and contributing at all
stages of the report. A draft of the report was presented for comment at a youth
conference held at Cairo University in March 2010 and hosting over 1500 attend-
ees from across Egypt. This same draft was reviewed by a team of six distinguished
readers whose comments were incorporated into the material available. A small
team of eight young Egyptians conducted numerous focus groups with their peers
and subsequently contributed a full chapter to the report themselves. Many chap-
ters also provide young peoples’ views and proposals through direct quotations.
Evidence from large and recent surveys is used throughout the chapters of this
report, providing a number of rich and comprehensive data sets which have been
analyzed in the context of youth dimensions of human development, forms of
deprivation, behavioral changes, attitudes and aspirations. These include the Pop-
ulation Council’s comprehensive 2009 Survey of Young People in Egypt (SYPE),
undertaken in collaboration with the Information and Decision Support Center
(IDSC) of the Egyptian Cabinet, with support from UNFPA, UNICEF, UNIFEM,
and UNDP, as well as the Ford Foundation, World Bank, CIDA, the Netherlands
Government and SIDA.
EHDR 2010 has also used data from the 2008 official Household Income Expen-
diture and Consumption Survey (HIECS), the Egypt Chapter of the World Values
Survey 2008 conducted by IDSC, and the 2005 and 2008 Demographic and Health
Survey (DHS) for Egypt. And, for the first time, an original Youth Well-Being Index
was also designed and applied, and is featured in a full chapter to measure all forms
of youth exclusion, starting with those that are highly correlated with being poor.
On behalf of UNDP, I wish to sincerely thank Professor Heba Handoussa and her
EHDR team of authors for their invaluable contributions to this Report.
It is our hope that this Report will stimulate policy dialogue to create a more
favourable environment for youth in Egypt – one where they can realize their full
potential and play a bigger role in Egypt’s development process.
James W. Rawley
UNDP Resident Representative
{ X }

Preamble
Defining the ages that constitute youth has no internationally agreed convention. For an analysis of Egypt’s young cohorts, youth, in this report, are defined as belonging to the 18 to 29
age group — which constitutes about 20 million individuals or close to a quarter of the population. The definition accommodates for the lower age limit of 18 years adopted by Egyptian law as the transition from childhood to adulthood as well as the upper age limit of 29 years when society and most youth themselves expect and hope to have formed a family and acquired a house. A profile of these young cohorts, whether from an urban or rural stratum, whether privileged or underprivileged, suggests that they are familiar with the impact of the revolution in ICT, and have been touched by the consequences of a newly globalized world. Although their circumstances may not allow access to their ben-efits, they often chose to merge traditional values with new perceptions of freedom and democracy. These factors are covered throughout the report, and a special emphasis is placed on the impact of poverty as it affects young Egyptians.
One characteristic predominates in the profile of young Egyptians today. Egypt’s
youth bulge is at its peak, but opportunities appear much less promising than those
of previous generations. The outcome of overly generous job creation in govern-
ment in the 1970s and 1980s, little or no reform in the education and training
systems, and the failure to control population growth has resulted in a serious loss
in productivity and an accompanying decline in real wages and stagnation in the
standard of living of those employed in the public and private sectors. The prospect
of integrating Egypt in the global economy and reap the benefits of its young and
fast-growing labor force must now be vigorously identified and exploited in all tra-
ditional and modern sectors of the economy.
Young women and men are a formidable force for change. They are ready to take up
new initiatives as entrepreneurs, acquire additional skills to access better jobs, and
engage in community and political decisions and programs. This is a critical time
when life decisions are made — whether to work or pursue further studies, accept a
low paying job or start a new enterprise, participate in or refrain from engagement in
community affairs, delay marriage or opt to marry and settle under less than optimal
conditions. These decisions, if well directed and taken under an enabling socioeco-
nomic environment, will thrust young human capital into the foreground, as a prin-
cipal factor in the growth and development of the country as a whole. On the other
hand, the consequence of a mismanaged transition — most often through no fault of
young people themselves — becomes prolonged periods of unemployment, a fragile
{ XI }

understanding of citizenship and its responsibilities, a greater dependency on family
and state, and a marked slowdown on the road to national prosperity.
The EHDR 2010 very properly uses the concepts of exclusion and inclusion as a
framework for understanding the environment in which youth are situated. Social
exclusion contains two parties, the excluders and excluded. It may be measured in
terms of factors such as unemployment, or youth crime or drug use. It is also multi-
dimensional, including poverty and other forms of social disadvantage. Addition-
ally, youth exclusion is exacerbated by gender, whether due to sex segregation,
parental supervision, or other cultural or religious reasons. There is considerable
concern that these isolated youth are exploited by extremist groups who prey upon
their sense of social hopelessness.
Inclusion, on the other hand, implies that youth are situated at a social advantage
in joining institutions and organizations in their societies. As recommended in the
nine messages of this 2010 Egypt Human Development Report, this will require a
reorientation by government and civil society — a new paradigm, such that young
people are included in national planning and implementation mechanisms, that
education system failures are tackled and overcome, that poverty among youth and
its main attributes, namely lack of education and skills, are addressed, that toler-
ance and respect for the other are promoted, whether directed at religious or gen-
der affiliation, that youth are permitted to participate in ‘responsive governance’
with administrative or political bodies likely to shape their future , that facilities
are provided for financing start-up projects or ownership of some assets — such as
land — by youth.
This report on youth in Egypt, as one contribution to the current international
“Year of Youth’ is only one example of national efforts to draw young people into
mainstream society. The report proposes that a ‘Wellbeing Index’ should be pre-
pared annually for Egypt, possibly by the National Youth Council, and that this
would assess progress on indicators such as access to services, income and depri-
vation, gender, employment, as well as civic participation, family life, leisure and
security. The objective would be to inform policy makers on youth areas needing
attention and would set the stage for an integrated Action Plan, the outcome of
which could be a comprehensive strategy at the policy and programmatic levels.
The goal, clearly, would be to create a socioeconomic setting that allows Egypt’s
young and abundant human resources to better contribute to development.
Heba Handoussa
Lead Author{ XII }

BDSSP Business Development Services Support ProjectBMI Body Mass IndexCAOA Central Agency for Organization and AdministrationCAPMAS Central Agency for Public Mobilization and StatisticsCBHRM Competency Based Human Resource ManagementCCT Conditional Cash TransferCEDAW Convention on the Elimination of all Forms of DiscriminationCEED Centre for Entrepreneurship Education & DevelopmentCPI Consumer Price IndexCRC Convention on the Rights of the ChildCSO Civil Society OrganizationDHS Egypt Demographic and Health SurveyECEU European Training Foundation of European Commission UnionEFSA Egyptian Financial Supervisory AuthorityEHDR Egypt Human Development ReportELMS Egypt Labor Market SurveyELMPS Egypt Labor Market Panel SurveyESD Education for Sustainable DevelopmentETP Enterprise Training PartnershipsEVQ Egyptian Vocational QualificationsFDI Foreign Direct InvestmentFGM Female Genital MutilationFPL Food Poverty LineGAFI General Authority for Investment and Free ZonesGALAE General Authority for Literacy and Adult EducationGDP Gross Domestic ProductGEM Global Entrepreneurship Monitor SurveyGOE Government of EgyptGYWI General Youth Well-Being IndexHCV Hepatitis C Viral InfectionHD Human DevelopmentHDI Human Development IndicatorHIECS Household Income & Expenditure Consumption SurveyHR Human ResourcesICT Information and Communications TechnologyIDA Industrial Development AuthorityIDSC Information and Decision Support Center of the CabinetILO International Labor OrganizationIMC Industrial Modernization CenterINP Institute of National PlanningITC Industrial Training CouncilLE Egyptian PoundLPC Local Popular CouncilMDGs Millennium Development GoalsMCIT Ministry of Communication and Information TechnologyMENA Middle East and North AfricaMIT Massachusetts Institute of Technology MKI Mubarak-Kohl InitiativeMOA Ministry of AgricultureMOE Ministry of EducationMOH Ministry of HousingMOHE Ministry of Higher Education
Acronyms
{ XIII }
MOF Ministry of Finance MOI Ministry of InvestmentMOSS Ministry of Social SolidarityMOTI Ministry of Trade and IndustryNCCM National Council for Childhood and MotherhoodNCD Non-Communicable DiseasesNCSCR National Center for Social and Criminology ResearchNCW National Council for WomenNCY National Council for YouthNDP National Democratic PartyNGO Non-Governmental OrganizationNHP National Housing ProgramNSSP National Skills Standards ProjectSC Social ContractSCC Social Contract CenterSDP Skills Development ProjectSFD Social Fund for DevelopmentSME Small and Medium EnterprisesSYPE Survey of Young People in EgyptTPL Total Poverty LineTVET Technical and Vocational Education and TrainingUNDP United Nations Development ProgramUNFPA United Nations Population FundUNICEF United Nations Children’s FundUNIFEM United Nations Development Fund for WomenWB World BankWEF World Economic ForumWFP World Food ProgramWVS World Values SurveyYEN Youth Employment NetworkYWBI Youth Well-Being Index
{ XIV }
Table of Contents
chaPter 1: overview anD Messages 1The Status of Youth 1
Identifying the Constraints 3
National Action Plan on Youth Employment 12
Youth’s Identification of Critical Issues 15
Conclusion 17
chaPter 2: the status of huMan DeveLoPMent, the MDgs anD Poverty 19
Trends in the Human Development Indicators 20
Achieving the MDGs in the Five Years to 2015? 23
Youth: Accelerating Achievement on the MDGs 28
The Poverty Map and the Poorest 1000+ Villages Program 30
chaPter 3: youth Life transitions: oPPortunities, caPabiLities anD risks 35
Youth Health Outcomes 36
Schooling 37
Youth Labor Market Participation 38
Migration 39
Family Formation 39
Exercising Citizenship 40
Time Use and Civic Participation 41
Conclusion 41
chaPter 4: eDucation for the 21st century 43Education: A Tool for Inclusion? 44
Global Competitiveness 47
Social Empowerment 50
Addressing the Challenges 51
Demand Driven Education for a Service Society 53
Annex 4.1 TDC ICT Infrastructure Outcomes In Relation
To MOE Strategic Plan 2008 56
{ XV }

{ XVI }
chaPter 5: a reaDing into the worLD vaLues survey 57 Desire for the Good Life but With No Responsibility 58
Hope for Work Regardless of Competence 60
Values of a Free Economy 62
Political Views 65
Nationalist Feelings and Concomitant Identities 68
Family Values and Patriarchal Legacy 69
The Centrality of Religion 71
Attitudes towards Others 72
chaPter 6: Poverty anD youth excLusion 75Characteristics of Poor Youth 76
The Various Dimensions of Income Poverty 76
The Intergenerational Transmission of Poverty 77
The Link between Wealth and Youth Deprivation 79
Education 80
A Profile of Poor Rural Youth 83
The Profile of Youth in Ashwaiyat 84
Dreams and Aspirations of Youth from Disadvantaged Families 85
Coping Mechanisms of the Young and Poor 88
Conclusions 89
chaPter 7: genDer equaLity anD freeDoMs 93Marriage the Official Way 94
Marriage the Unofficial Way 95
Obstacles in the Public Domain 96
Young Women in the Workplace 98
Violence against Women 102
Legislating Against Sexual Offenses 102
A Dream for Gender Equality for Egypt’s Youth 103
The Way Forward 104
chaPter 8: youth anD ParticiPation in society 105 The Concerns of Youth: An Informal Exploration 106
The Internet and Political Involvement 113
Internet Political Participation: Risks in Analysis 114
Proposals for Reform 120
What Does the Future Offer? 121
{ XVI }
Egypt Human Development Report 2010 { XVII }
chaPter 9: achieving gooD governance 123Status Quo in Relation to the Government Sector 124
Positive Youth Initiatives for Better Quality Governance 128
Recommendations: Enhancing Youth Participation in Quality Governance 131
chaPter 10: youth anD entrePreneurshiP 135Prevalence of Entrepreneurship among Young People in Egypt 136
Key Constraints and Impediments 138
Towards an Enabling Environment 141
The Many Faces of Opportunity 143
chaPter 11: huMan DeveLoPMent anD Labor Markets 147The Transitions into Employment 148
Why is Education Not Paying Off for Young People Any More? 155
The Occupational Outlook Facing Young People Today 159
chaPter 12: technicaL anD vocationaL eDucation anD training for youth 163
The Vocational and Training Path 164
The Current TVET System 165
A Policy Framework 168
National Efforts towards an Upgraded Qualifications Framework 170
The Way Forward 171
chaPter 13: questions of heaLth 177Health Profile of Youth in Egypt 178
The Egypt 2008 Demographic and Health Survey 181
Policy Implications and Recommendations 182
Mental Health and Mental Disorders 184
A Mental Well-Being Profile for Egypt’s Youth 184
Incidence of Disorders in Egypt 185
{ XVII }

chaPter 14: housing anD transPortation: a youth PersPective 193
Status of the National Social Housing Program 194
Improving the Efficiency of Subsidies to Reach Target Groups 196
The National Program for Improving the Poorest 1000 Villages 197
Housing Status of Youth in Informal Settlements or Aashawiyat 198
Access to Transportation and Impact on Living & Employment 201
chaPter 15: constructing a youth weLL-being inDex 205Objectives and Priorities 206
Defining and Measuring Poverty 206
International Approaches to the Well-Being Index 209
Identifying Domains and Indicators for Egypt’s Youth Well-Being Index 213
Calculating Egypt’s Youth Well-Being Index 216
Annex 15.1: An Explanation of Domains and Their Related Indicators 218
chaPter 16: a vision for ‘youth 2020’ 219Sally: An Overview 220
Shaheer: The Politics of Participation 222
Nihal: Thoughts on Education 225
Seif: Entrepreneurship and Youth 227
Abeer: Family Formation 230
Nermine: The Centrality of Sexuality 231
Salma: Youth as Vehicles of Social Change 232
technicaL notes anD sources of Data 235National Indicators 243
Governorate Indicators 253
{ XVIII }

{ XIX }
Boxes, Tables and Figures
boxes1.1 International Year of Youth to Promote Inclusion and Participation 2
1.2 Youth as Vehicles of Change 4
1.3 Young Egyptians: An Untapped Resource 8
1.4 The Nine Messages of EHDR 2010 9
1.5 The Proposed National Policy for Youth in Egypt 13
1.6 Youth, Volunteerism and Development in Egypt 16
4.1 Education Reform in Egypt 45
4.2 Admission Policies in Higher Education 47
4.3 The Battle with Unemployment? 50
6.1 Poor Youth have Irregular Work 79
6.2 Work and Education are Closely Correlated 82
6.3 Causes of Poverty As Perceived by the Poor 86
6.4 Activities to Promote Regular Migration and Positive Alternatives 90
7.1 Progress on the Political Front? 97
7.2 The Figures behind Employment 100
7.3 Work Related Discrimination 100
7.4: Incidence of Sexual Harassment in Egypt 100
7.5 Young Women and Girls Call For Action 101
8.1 What Dreams are Made of 108
8.2 Y-PEER (Youth Peer Education Network) 110
8.3 Joining Political Parties Requires an Enabling Environment 112
8.4 President Mubarak on Youth 121
10.1 Entities Involved in the Investment Process in Egypt 137
10.2 Canada’s Second Chance Route: A Model to Emulate 140
10.3 Potential for Growth of Franchising in Egypt 145
11.1 Egyptian Youth Migration: Patterns, Aspirations and Motivations 157
12.1 The Private Sector’s Don Bosco Experience 167
12.2 Government-led Technical Interventions 168
12.3 The National Skills Standards Project of Egypt’s Social Fund for Development 171
12.4 The Skills Development Project 172
12.5 The EC Project: Assistance to the Reform of the TVET System 173
12.6 The Media-based Employment Initiative 175
13.1 Developing a Physical Exercise Habit for Youth 180
14.1 The Housing Market and Youth 196
14.2 Life in Informal Districts of Cairo 200
15.1 Youth and the United Nations 210
15.2 Gross National Happiness Index of Bhutan 212
16.1 Recollections from a Freer University Era 224
16.2 What is Missing in the Education Curriculum in Egypt 225
16.3 Turkey’s Student Selection Exam (OSS) 226
16.4 The Operation of Turkey’s Youth Councils 233
{ XIX }

tabLes2.1 Evolution of the Human Development Index 20
2.2 Comparison between Cairo and Ismailia Governorates 22
2.3 Absolute Increase in HDI According to Region Egypt Human Development Report 2010 22
2.4 Gap between Urban and Rural Areas 24
2.5 Updated Poverty Map: Geographic Distribution of Poorest Villages 31
4.1 Number of Enrolled and Graduates by University Academic Year 2008/2009 48
4.2 Numbers of Qualified and Non Qualified Teachers in 2005/2006 48
4.3 Distribution of Young Workers’ Skills Assessment by Employers SWTS 2005. 48
5.1 Youth Participation in Opposition Political Action 66
6.1 Poverty Rates by Region and Age 67
6.2 Poverty Rates within Households of 5/6 members, by Number of Young Adults 77
6.3 Youth Poverty as Multiple Deprivations 78
6.4 Percent of Youth Experiencing Different Forms of Deprivation (by Wealth Quintile) 79
6.5 Youth Unemployment Rates by Education Level and Poverty Status, 2008-09 82
6.6 Distribution of Employed Youth By Poverty Status 82
6.7 Distribution of Youth in Labor Force by Employment Categories, 2008-09 83
8.1 Allegiance on the Site 116
8.2 Gender Distribution in Websites 116
8.3 Degree of Transparency in Mentioning Names of Site Editors 117
8.4 Date of Appearance in Youth Internet Sites 117
8.5 Language Used on Youth Websites 117
8.6 Interaction on Youth Sites 117
8.7 Guests Hosted by Sites 118
8.8 Number of Visitors to Youth Sites 118
9.1 Number of Employees in the Egyptian Government Higher Echelons 125
9.2 Distribution of Youth by Age Category and Gender in the Egyptian Bureaucracy 126
9.3 Distribution of Youth Age Bracket 20-35 in the Egyptian Governmental Sector 126
9.4 Number of Youth in the Government Sector According to the Budgets of Agencies 127
9.5 Number of Youth in the Government Sector As stated in the budgets 127
9.6 Number of Youth in the Government Sector Distributed according to the Financial Grades 127
(Including Public Cadres & Special Regulation)
9.7 Number of Youth in the Government Sector Distributed according to the Financial Grades 127
(Special Regulation)
9.8 Number of Appointed Youth in the Government Sector during the Last Ten Years 128
9.9 Funds Allocated By the Government for Youth Related Activities Based on Ministry of Finance Estimations 130
10.1 Egypt’s Ranking in the Ease of Doing Business Report 138
10.2 Franchising Activity by Sector 145
11.1 Standard and Broad Youth Unemployment Rates by Selected Characteristics 150
11.2 Youth Jobless Rates by Selected Characteristics, 1998, 2006, 2009, Ages 15-29 151
11.3 Classification of Occupations According to Rate of Growth and Size of Absolute Growth 161
12.1 TVET Systems and Providers 165
12.2 TVET Policy Statements Interventions 169
14.1 Distribution of Housing Units According to Seven Axes of National Housing Program 194
14.2 Distribution of Ibni Beitak Units 194
14.3 Distribution of Social Services 194
{ XX }

15.1 Most Deprived Youths by Youth Characteristics 208
15.2 Correlates of Severe Youth Deprivations 208
15.3 Estimated Average per Capita Food & Total Poverty Line (LE per year), by region, 2008-09 209
15.4 Egypt’s Proposed Youth Well-Being Index 214
15.5 Calculating Egypt’s Youth Well-Being Index 215
figures2.1 Evolution of the Human Development Index 21
2.2 Evolution of Sub-Indexes of the Human Development Index in Various Reports 21
2.3 Regional Trends in the Human Development Index 23
2.4 Gap between Males and Females over Different Reports 24
3.1 Young People’s Smoking Behavior in Egypt 36
3.2 Education Status of Youth in Egypt 37
3.3 Youth Labor Force Participation 38
3.4 Unemployment Rates among men and women (15-29) in Egypt 1998, 2006, 2009. 38
5.1 Values of the Meaning of the Life 59
5.2 Government’s Responsibility to Meet an Individual’s Needs by Country 59
5.3 Youth’s Work Values 60
5.4 Priority in Job Search 61
5.5 The Value of Aptness and Fulfillment in Work by Country 61
5.6 How Far Youth Values are linked to Free Economy 62
5.7 Youth Value of Savings by Country 64
5.8 Ownership of Business or Industry by Country 64
5.9 Major Concerns in Life 65
5.10 Interest in Politics by Country 65
5.11 Youth’s Political Trends by Country 68
5.12 Importance of Living in a Democratic System by Country 68
5.13 Concern for Parent’s Pride by Country 71
5.14 Preference of Men to Women in Work by Country 72
5.15 Importance of Religion in Life by Country 72
5.16 Trust in Others by Country 74
5.17 Circles of Trust among Youth 74
6.1 Income Poverty Rate by Age, 2008-09 77
6.2 Prevalence of Deprivations among Youth (18-29 Years) 78
6.3 Percentage who Attended Preschool (by Wealth Quintile) 80
6.4 Distribution of Level of Education by Wealth Quintile 80
6.5a Low Achievers – Makbool 81
6.5b High Achievers – Excellence 81
6.6 Unemployment Rate by Age, 2008-09 83
6.7 Percentage of Permanent Employment by Age, 2008-09 83
6.8 Unpaid Workers’ Share by Age and Poverty Status, 2008-09 83
6.9 Key Fears for the Future 85
6.10 What Gives Confidence about the Future? 87
6.11 Who Will Fulfill Your Dreams? 87
6.12 Coping Mechanisms by Wealth Quintile 89
7.1 Participation and Employment Rates by Age and Sex, Ages 15-29, 2009 99
7.2 Trends in Female Labor Force Participation by Educational Attainment 99
{ XXI }
7.3 Trends in Proportion of Employed Females Working in Government by Educational Attainment 99
8.1 Youth Concerns (Males) 107
8.2 Youth Concerns (Females) 107
8.3 Dreams of Youth (under age 35) 108
8.4 On whom do You Depend to Make Dreams Come True? 108
8.5 What Do You Wish for Yourself and Your Family? 108
8.6 What is the Post You Dream of Occupying? 109
8.7 Internet Users in Egypt 113
8.8 Allegiance on the Site 116
8.9 Degree of Responsibility for Site 116
8.10 Degree of Transparency 116
8.11 Degree of Risk 117
8.12 Language of Political Discourse 118
8.13 Interaction with Browsing Community 118
8.14 Figures Hosted by Site 118
8.15 Popularity of Website 118
9.1 Distribution of Youth by Age Category and Gender in the Egyptian Bureaucracy 126
9.2 Distribution of Youth Age Bracket 20-35 among the Different Types of Government Agencies in 2009 128
9.3 Distribution of Youth in the Government Sectors According to the Economic Authorities 128
9.4 Distribution According to the Financial Grades (Public and Special Regulation) 128
9.5 Number of Youths in the Government Sector, Distributed according to Financial Grades (Special Regulation) 129
9.6 Number of Appointed Youth in the Government Sector during the last Ten Years 129
9.7 Funds Allocated for Youth – 2005/2006 and 2009/2010 130
9.8 Funds Allocated for Youth 2009/2010 130
11.1 Standard Unemployment Rates by Age & Sex, Ages, 15-29, 2009 150
11.2 Participation and Employment Rates by Age and Sex, Ages 15-29, 2009 150
11.3 Jobless Rates by Age and Sex, Ages 15-29, 2009 151
11.4 Standard Unemployment Rates by Educational Attainment and Sex, 1998, 2006, 2009 152
11.5 Jobless Rates by Educational Attainment and Sex, Ages 15-29, 1998, 2006, 2009 152
11.6 Distribution of Educated New Entrants by Year of Birth and Type of First Job 154
11.7 Female Labor Force Participation Rates by Educational Attainment, 1998, 2006, 2009 154
11.8 Proportion Employed Females 15-29 Who Work in Government by Educational Attainment 154
11.9 Average Years of Schooling by Year of Birth and Sex, Four-Year Moving Average 155
11.10 Mean Job Quality by Education Attainment for Wage and Non-Wage Workers 156
13.1 Nutrition through the Life Cycle 178
13.2 Traditional and Modern Risks to Health 179
13.3 Vicious Circle Linking Poverty to Mental Illness (Adapted from Saraceno, 2004) 185
13.4 Gap between Mental Health Burden and Budget in Different Country Categories 185
14.1 Main Problems Facing Households in GCR 201
14.2 Priorities for Improvement According to Citizens’ Preference 201
14.3 Envisioned Role for Government in Improving Informal Settlements 201
{ XXII }

With some cash
I could start my own
business
...and it’s great
to have a skill
{ XXIII }

{ 1 }
Chapter One
Egypt’s young people matter because their aspirations, partici-pation, energies, imagination, values and ideals will shape the country’s future. Like youth across the world, they hope to lead
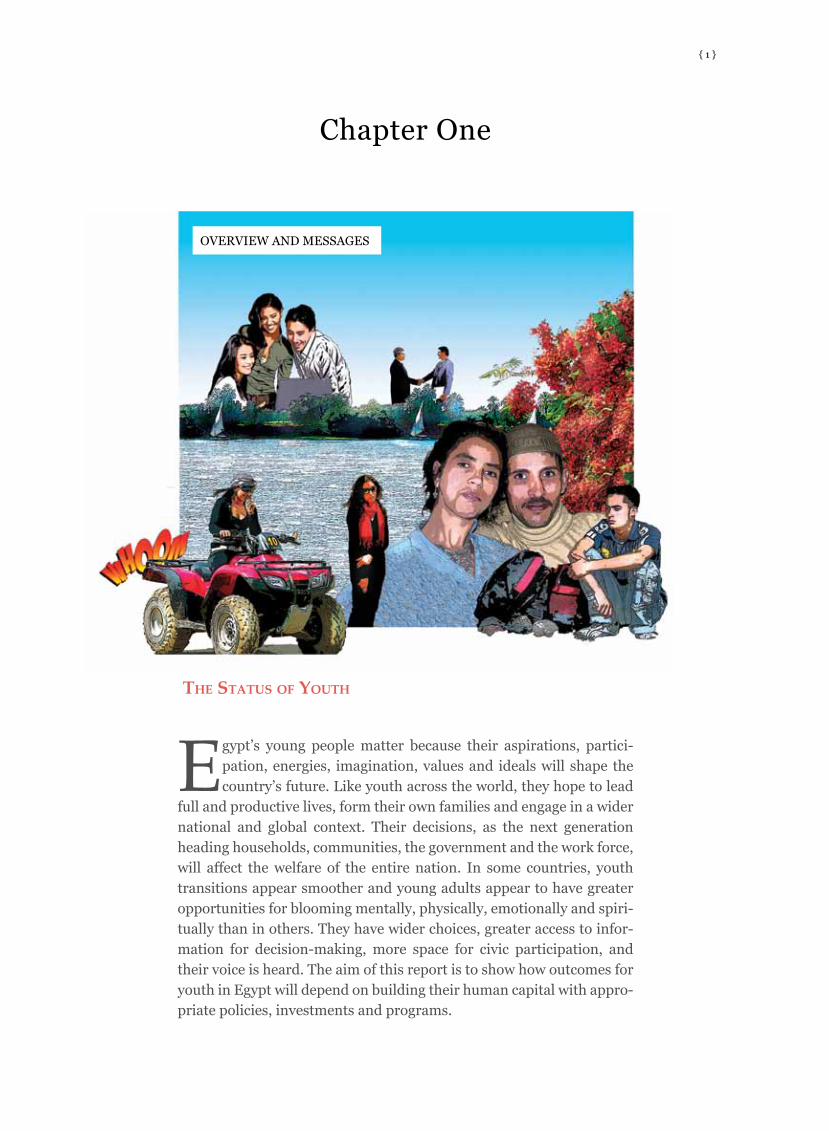
full and productive lives, form their own families and engage in a wider national and global context. Their decisions, as the next generation heading households, communities, the government and the work force, will affect the welfare of the entire nation. In some countries, youth transitions appear smoother and young adults appear to have greater opportunities for blooming mentally, physically, emotionally and spiri-tually than in others. They have wider choices, greater access to infor-mation for decision-making, more space for civic participation, and their voice is heard. The aim of this report is to show how outcomes for youth in Egypt will depend on building their human capital with appro-priate policies, investments and programs.
OVERVIEW AND MESSAGES
the status of youth

Egypt Human Development Report 2010{ 2 }
Young people constitute a formidable and once in a
nation’s history demographic bulge. This transition
– whereby the youth age group peaks relative to the
child and aging segments of the population pyramid
– is perhaps Egypt’s biggest challenge, representing
both a risk and an opportunity. On the positive side,
it could mean a significant lowering in the depen-
dence rate and the opportunity for more bread win-
ners to earn income within each family. The youth
bulge in Egypt first appeared in 1995 and is expected
to last throughout the next thirty years ending in
2045.1 This large cohort of young men and women in
the age group 18 to 29 years is estimated at 23.5% of
the total population in 2010, or 19.8 million.
This is the time when youth transition from school
to work, to higher education, to citizenship, to mar-
riage and the establishment of independent house-
holds. These five transition periods, if well guided,
will propel young human capital into a significant
factor in the growth and development of the country
as a whole. On the other hand, if badly managed, the
consequence becomes poorer skill and job outcomes
and therefore prolonged periods of unemployment, a
fragile understanding of citizenship and its responsi-
bilities, and a greater dependency on family and state
Box 1.1: International Year of Youth to Promote Inclusion and Participation
On December 18, 2009, the UN General Assembly adopted a resolution declaring the International Year of Youth to commence
on the 12th of August, 2010. The date coincides with the 25th anniversary of the first International Year of Youth (1985)
which had the theme of Participation, Development and Peace and called for the full participation of youth in society
through partnerships with youth organizations. The theme for 2010 promotes dialogue and mutual understanding across
generations while advocating for the ideals of peace, respect and freedom.
Most importantly, youth are encouraged to dedicate themselves to fostering progress, particularly with regards the MDGs.
The United Nations Programme on Youth encourages youth themselves to organize activities that promote a greater
understanding of the importance of youth participation in all aspects of society and those that further the goal of mutual
understanding. As early as January 2010, the UN asked any and all youth to submit 1-5 word slogans that would
summarize the Year and its theme via Facebook and to then vote on the most favorite one. All in all, it is hoped that
through the attention paid to young people on this Year of Youth, a greater understanding of the concerns of youth and
their potential contribution to society can be realized.
In Egypt, preparation for the Year of Youth started in March of 2010 with a consultation at Cairo University, bringing together
more than 1,500 young people from all governorates of Egypt. The purpose of the occasion was to create awareness and
help start a dialogue that would have the young people getting involved and organizing events. Moreover, the day allowed
the Human Development Report team to elicit worthwhile feedback for the 2010 report and incorporate in it the views of a
wide variety of young Egyptians. Source: http://social.un.org/youthyear/ Prepared by Defne Abbas for EHDR 2010
prior to and after marriage.
As illustrated throughout the chapters of this eleventh
in the series of Egypt Human Development Reports,
a vision of a socially inclusive society is one in which
all young Egyptians would feel valued and have the
opportunity to participate fully in the life of their soci-
ety. Achieving this vision means that young Egyptians
would have the resources, opportunities and capabil-
ity to learn well, find work, engage productively in the
community, have a voice, afford marriage and estab-
lish their own home.
If such an inclusion agenda for young people is to
be implemented, youth must be given a voice in the
design of policies and programs that affect them, as
well as participate in new partnerships with their
communities and with business. Independence of
thought and new ideas must be encouraged rather
than censored. Teaching environments and educa-
tional programs must open up rather than reduce
young peoples’ chances of finding employment and
meeting market requirements. Inclusion also means
that forums — whether student councils, political par-
ties, youth clubs or the internet — must allow youth
to freely discuss issues important to them and to par-

Egypt Human Development Report 2010 { 3 }
take in the creation of agendas that reflect their needs.
This report, in many cases, quoting perceptions and
expectations of youth themselves, concludes that in
Egypt, these conditions in many cases have yet to
translate into concrete action.
This is not to suggest that all youth are a passive
group.2As this report also details, most want a better
life for themselves. Many pursue a technical or uni-
versity education in hopes of better job prospects;
some join the informal or SME economy or set up pri-
vate businesses; some migrate in search of job oppor-
tunities elsewhere; and finally, a number of the less
fortunate have opted out of education earlier to work
and earn an income, with little prospects for more
options throughout their lives.
iDentifying the constraintsThere are common areas of difficulty for Egypt’s
youth and frequently these are associated with pov-
erty or unemployment, although cultural factors and
state policies also play a role. This report suggests
that these constraints, often interlinked, fall under
but are not limited to the following themes:
Waithood
Consequences of youth exclusion have included
young people entering ‘waithood’, a period during
which they simply wait for their lives to begin, most
notably by queuing for long periods of unemployment
during which they live with parents and are finan-
cially unable to pursue marriage or home ownership.
According to the SYPE labor market and youth study
presented in this report, the share of the youth aged
15-29 grew significantly from 1988 to 2006, posing
huge pressures on the labor market in terms of cre-
ating sufficient jobs for new entrants. While the cur-
rent young generation is the best educated ever, this
has not translated into better employment opportu-
nities. The psychological impact is also evident, with
unemployment leading to apathy, as evidenced in the
extremely low youth participation rates in elections,
volunteer activities or membership of youth clubs.
There is also considerable concern that some isolated
youth are marketed to by extremist groups who prey
upon their sense of hopelessness.3 While delayed
marriage is a trend seen in many societies, in Egypt,
an increasing number of youth are engaging in urfi or
informal marriages that offer little security to the wife
and any subsequent offspring.4
Paradoxically, a major source of inclusion for young
Egyptians is the traditional support system of the
family, with parents shouldering the bulk of the
responsibility for financing education, marriage, and
nascent entrepreneurship well beyond the age of
18 at which young people elsewhere are considered
capable of caring for themselves. While this robust
family culture provides a safety net and compen-
sates for the shortfalls that come with ‘waithood,’ it
also fosters dependency. Further, in many respects, it
transfers responsibility from the public to the private

Egypt Human Development Report 2010{ 4 }
domain and reinforces dependent behaviors and atti-
tudes on the family. The prevalence of private tuition
at all educational levels, for example, obviates the
claim that public education in Egypt is free. Lack of
proper public health facilities, insufficient middle to
low income housing, and poor mortgage facilities all
point to gaps in services for youth that are frequently
privately compensated for by parents. Not many fam-
ilies are able to provide this kind of support to their
young members, which creates serious new obstacles
to equal opportunity, equal access and social mobil-
ity for Egypt’s young generation. The challenge lies
squarely with government to upgrade and expand
such services.
Education
The age structure accompanying the youth demo-
graphic bulge places enormous pressures on the edu-
cation system, and the quality of education. While
Egypt has made great strides in achieving the MDG
goal of universal basic education enrollment, 27% of
young people aged 18-29 have not completed basic
education (17% have dropped out of school before
completing basic education and 10% have never
enrolled in school).5 Socio-economic status and fam-
ily background are considered the main predictors
of education achievement in Egypt. Children whose
families are in the middle and upper wealth quin-
tiles are more likely to perform better in certificate
examinations and to join the higher education system.
Urban/rural residency is another major predictor. In
fact, rural areas have a staggering 80% of those who
never enroll in school. The gender dimension is par-
ticularly pronounced in this group, with females con-
stituting 82% of those who never enrolled in school.6
Issues related to inequality of access to education and
education quality remain central, as discussed in Chap-
ter Four. In terms of school type, while the majority
of so called ‘achievers’ (achieving 90% in the second-
ary stage completion exam) come from government
schools, the likelihood of being an achiever increases
exponentially if a student is in a private school or in a
governmental experimental school. Primary and sec-
ondary school level education have not fared well in
terms of quality. The large numbers of students and
the shortage of qualified teachers have affected the
possibility of delivering quality learning experiences.
Box 1.2: Youth as Vehicles of Change
Young people in Egypt may have low participation rates because they believe their engagement and activism do not count.
This feeling of exclusion may come from a social understanding that places them as passive recipients of goods and
services and which gives no rewards for innovation and activism. One practical and successful approach to draw in
the active participation of young people at the level of national issues is exemplified by Nicaragua’s successful literacy
campaign of the late 1990s. The campaign reduced overall illiteracy from 50.3% to 12.9% in just five months. The
government-sponsored campaign called for mobilizing the literate half of the population, particularly youth. Over 225,000
volunteers registered to provide their services, with the burden of actual teaching falling on 100,000 volunteers. The
organization of the campaign depended heavily on youth volunteerism which contributed to its success.
Since the early 1990s, the Government of Egypt demonstrated a commitment to eradicate illiteracy through a set of policies
and programs. In 1994, the General Authority for Literacy and Adult Education (GALAE) launched a 10-year literacy
campaign aimed at enabling adults to learn how to read and write Arabic and to use written arithmetic. The strategy,
however, was less effective in poorer and more rural districts where illiteracy is highest. The idea of mobilizing young
people to carry out a massive literacy campaign on the national level has the potential of leading to exceptional results.
In Egypt, the ratio of registered university students to the estimated number of illiterates is about 1:6, and the number
of registered high school students to illiterates 1:5, indicating that if all registered high school and university students
taught five illiterate people, illiteracy above 15 years of age in Egypt would be completely eradicated. It is also possible to
focus the campaign on a smaller sub-category of illiterates, namely those aged 10-35 (5.8 million illiterates according to
the latest census), making the ratio of registered high school and university students to illiterates approximately 1:2.
Source: Salma el Fawal, Social Contract Center, Egypt

Egypt Human Development Report 2010 { 5 }
The poor are consistently worse off than the rich in
terms of school enrollment and girls from poor house-
holds are significantly more likely not to attend school.
Without including the independent Azhar system,
the total number of public Egyptian universities
in 2008 was seventeen, with a total of 1.43 million
enrolled in the academic year 2008/09. While this
high number can be a positive indicator of develop-
ment, there has been a notable decline in the quality
of higher education over the last three decades, mani-
fested in the mismatch between labor market needs
and the ever growing supply of unemployed gradu-
ates. Overcrowding strains available facilities, and an
overworked, poorly paid and limited number of aca-
demic staff has led to the deterioration in free pub-
lic universities. Entrance requirements to university
specializations are based on the single factor of their
grades in the nationwide secondary school comple-
tion examinations and may need to be reviewed (see
Chapter Four). Second chance programs for the less
privileged through the technical or vocational path
are proving successful internationally, but require
incentives such as upgraded curricula and equip-
ment, cost-sharing for training and tax incentives to
employers (see Chapter Twelve). Accountability is
also necessary with the introduction of proper certifi-
cation, based on recognized and internationally based
standards of performance.
Poverty
The dreams and aspirations of the most disadvantaged
are significantly more modest, as can be expected.
Multidimensional poverty measures assign an impor-
tant weight to a number of variables other than
income and consumption. For youth, these are shown
to include density/crowding, a decent job (occupa-
tion and job quality), access to housing, and even
ownership of a mobile telephone, as seen in Chapter
Six. Egypt is no longer a subsistence economy and yet
some 20% of the population can be ranked as poor by
all these related dimensions. Poverty, especially rural
poverty, and the lack of job opportunities has resulted
in high levels of migration to the periphery of large
towns, and particularly to that of Greater Cairo, thus
perpetuating the problems of informal settlements
and slum areas. It has thus taken more than 30 years
for the government to come to grips with the hous-
ing problem, but it is now moving with proper urban
planning, mortgage schemes and incentives for hous-
ing construction.
Poverty in Egypt has a strong inter-generational
dimension. A youth lens points to the important link
between family conditions, child and youth poverty.
This is consistent with the life cycle approach adopted
by many chapters in this report. The poor of one gen-
eration are typically the children of the poor of the
previous generation. Several factors lie behind the
presence and persistence of poverty, such as house-
hold size and composition, gender and education of
Egypt Human Development Report 2010{ 6 }
head of household, low school enrollment rate, high
dropout and illiteracy.
Lack of a permanent job is also highly correlated
with poverty. Poor youth can ill afford to remain
unemployed for long and therefore give up on the
idea of getting formal employment sooner than other
cohorts and take up whatever employment they can
find, whether temporary or seasonal. It is therefore
not getting a job which presents a route out of pov-
erty. Rather, it is getting and keeping gainful employ-
ment which is effective at raising young people out
of poverty. Employment through migration is also a
significant contributor to poverty reduction for the
migrant‘s household, and remittances contribute to
increased schooling.7
Unemployment
According to the labor market analysis presented in
Chapter Eleven, youth unemployment is the domi-
nant form of unemployment in Egypt and the most
serious kind of youth exclusion. At least 90% of the
unemployed are aged less than 30 years and many
more are affected by underemployment.8 Youth
unemployment in Egypt is therefore high by any mea-
sure. The challenge is not only creating more jobs,
but also about creating better jobs, since the infor-
mal economy currently represents the main source
of employment for new labor market entrants. The
2006 Census data indicates that the total number of
workers in the informal sector increased to 7.9 mil-
lion, up from 5 million in 1996.9
There are some indications that unemployment has
begun to decline, notwithstanding the recent financial
crisis. The male jobless rate has fallen by a third from
32% in 1998 to 24% in 2009. This trend aside, unem-
ployment is an indicator of labor market insertion
problems experienced by young people as they nego-
tiate their transition from school to work. Because
of a highly gendered labor market structure, these
transitions are significantly differentiated by gender.
While nearly all young men eventually transition into
employment, whether in the formal or informal sec-
tors, less than a fifth of young women do. Female labor
force participation has fallen, a decline that is concen-
trated among females aged 20 to 24 and among tech-
nical secondary and university graduates.10 Gender
disparities are rooted in cultural norms and may also
indicate the need for greater private sector incentives
in support of women in the labor force following the
strong withdrawal of state support in the form of jobs
and entitlements.
There is evidence of increased resort to the infor-
mal labor market by all youth for their first jobs.
This argues for active labor market policies, includ-
ing employment services and job search assistance,
enforcement of minimum wages, training programs
for the unemployed, and job creation through wage
and employment subsidies. It also suggests the need
for educational reform to overcome the mismatch
between education and labor market needs.
Vocational Training
Today, Egyptian labor does not fulfill the market
requirements and it is a critical impediment to private
sector’s growth and competitiveness. A proposed
national employment strategy must also take labor
demand factors into account. The problem is further
deepened by lack of an adequate human resources
strategy at the level of firms to offer employers
clear directions on labor or hiring issues. Not all of
Egypt’s youth have the same access to networks of
support and opportunities for decent jobs and com-
fortable incomes. On one level, university-educated
youth are experiencing high unemployment rates
as a result of the mismatch between their education
and formal labor market needs. On a second level,
graduates of technical and vocational education and
training (TVET) have also been beset by low employ-
ment rates.
Entering the vocational education track has held the
dead-end label for those who are pushed away from
general or higher education. However, most TVET
institutions are supply-driven and have a lack of clear
standards for curriculum development and train-
ing delivery, and they use outdated equipment that
is misaligned with technological development. The
result is under-skilled graduates who cannot fill the
specialized requirements of industry, of the upper
end services sectors, and must turn to the informal
sector for jobs. Evidence also indicates that, paradox-
ically, unskilled labor holds an advantage in terms of

Egypt Human Development Report 2010 { 7 }
employment opportunities, perhaps as a result of a
boom in construction.
Gender
There have undoubtedly been improvements in gen-
der parity over the past decade, as reported in Chap-
ter Seven, and especially in education. According to
SYPE, 74% of the young women interviewed have
completed basic education or above. More than half
of university enrolment is by women, and they consti-
tute 56% of those who complete university and 54%
who completed their education in two-year higher
education institutions with diploma credentials. Nev-
ertheless, the twin problems of school dropouts and
non-enrolment continue as a phenomenon that is
mostly peculiar to poor girls, and reflects the persis-
tence of gender disparities, with Upper Egypt being
the most disadvantaged region. More regional and
residence-specific programs targeting these young
girls are needed if they are to be helped out of the
cycle of poverty that accompanies lack of education.
Overall, young women in Egypt face the most difficult
school to work transition. Egypt has one of the low-
est female labor participation rates in the world at
18.5%. 11 This high rate of inactivity is partially driven
by market conditions, by cultural norms, and partly
by women’s choices. The unemployment rate is high-
est among those aged 18-24, that is, at a time when
the difficulties of finding a job or obtaining fair wages
encourages them to abandon the idea of participat-
ing in the labor market altogether. The legal mini-
mum age of marriage for girls has been raised from
16 to 18 (the same as for boys). About 40% of females
aged 18-24 in the SYPE sample are already married
and 81% are married by the time they reach the age of
29. Cultural factors play a role. Half of young women
and two thirds of young men also interviewed in
SYPE disagree that work improves a girl’s marriage
opportunities.
Among 2,496 married females surveyed and aged
15-29, all but one had at least one child.12 These fig-
ures point to a generalized trend whereby women
bear a heavier burden in housework and in child care,
and indeed may choose to focus on their role as care-
takers. Activities in the public sphere are limited as
a result, although participation in the broader social
sphere — starting with employment — is vital for the
future if young women are to learn to become leaders
in their families and communities, and to increasingly
take part in the workplace and in the community.
Jobs must be encouraged through special incentives,
possibly a government subsidy contribution for a
specified list of interventions by civil society organiza-
tions that cater to women’s needs. The lesson here is
also that policies and programs are sorely needed for
young Egyptian women to access the labor market via
tailor-made training programs for self-employment,
as well as programs to support the capacity of young
mothers to work if they so wish.
Sexual harassment is a new phenomenon in Egypt
and is often ascribed to a breakdown in traditional
behavior.13 Survey results indicate that 50% of young
women respondents had been subjected to sexual
harassment, whether verbal or physical, and fre-
quently by strangers, in public transport, in the street
or by colleagues at work. An increase in vivid stories
by the media on the growing incidence of rape has
added to a climate of fear and anxiety among young
women as reported by many young women in Chap-
ter Eight, with ‘safety’ given as a primary concern in
the public arena. The unfortunate consequence is
reduced participation in public events and recourse
to more traditional values that circumscribe their
behavior to certain narrow norms.
Family Formation
Early marriage is primarily a rural phenomenon in
Egypt with more than 70% of females in the age group
15-21 married by age 18. Similarly, 93% of males mar-
ried in the same age group live in rural areas. Poverty
is a common factor. Delayed marriage, on the other
hand, is primarily an urban phenomenon and two
factors have been at work; the first is the decline in
job opportunities and the second is the cost of mar-
riage. Prospects for family formation have somewhat
improved as a result of the easing of mortgage credit
and the increased availability of affordable public
housing, although SYPE reports that more than one
third of young people continue to live with their par-
ents upon marriage.

Egypt Human Development Report 2010{ 8 }
Customary or urfi marriage has become an increas-
ingly widespread phenomenon in Egypt as described
in Chapter Seven. Urfi marriage may be seen as one
religiously sanctioned way to avoid the increasing
cost of legal or officially registered marriage and to
permissibly circumvent restrictions on premarital sex
at a time when marriage occurs later in the life cycle.
This type of unregistered union provides little of the
social advantages of a formal marriage, but recourse
to it is, in urban areas, often prompted by the long
period of ‘waithood’ between youth and the social
inclusion of adulthood.
Housing and Transportation
Finding affordable housing is often flagged as a seri-
ous impediment to youth’s transition into marriage, a
leading feature of social inclusion. Reasonably priced
housing units have not kept pace with middle-class
and luxury housing. A comprehensive review in Chap-
ter Fourteen suggests that the forecasted increase in
construction costs will likely pose a great budgetary
challenge for any housing program in the coming
years given that most subsidy programs within it are
tied to specific income levels and unit price targets.
Accordingly, pressure is likely to build on the govern-
ment to fill the gap with subsidies that are additional
to those provided in its National Housing Program
(NHP). The National Democratic Party in its 2009
housing working paper has emphasized the need to
adopt subsidy reform to better reach the real benefi-
ciaries and avoid current distortions, in addition to
providing flexible and varied subsidy packages that
are affordable to different income groups.
Four years on, the NHP is moving towards realizing
its target of 500,000 units within a six year period,
targeted mainly to lower income groups and youth.
As of end of December 2009, 235,000 units and
land plots have been built or delivered to beneficia-
ries, while some 190,000 units are under construc-
tion. However, the NHP is already proving to be very
expensive for the government. Another concern is
affordability, since some axes of the NHP (such as the
private sector axis) require a contribution by young
people that is beyond their financial means.
Nevertheless, Chapter Fourteen reports that given
the success of the ongoing NHP so far, the Ministry of
Housing has adopted plans to support this program
by increasing the contribution of the private sector in
the various social housing schemes, moving towards
a more efficient mortgage-linked finance system with
the government in providing housing for the most
deprived groups, and developing the institutional
framework for the policy of subsidized housing which
complies with and reflects the subsidy mechanisms
and its annual budget on the national level.
Box 1.3: Young Egyptians: An Untapped Resource
Youth-led civil society in Egypt has witnessed a revival of sorts over the past 10 years and the increasing number of youth-
led NGOs and student-led clubs and associations, albeit small, is an indication of changes in youth organization. Examples
include the Youth Association for Population and Development, and student clubs like Resala and Alashanek Ya Balady.
Media tools now used by youth and for youth, including ICT, are also testimonies to this revival. This new phenomenon is
promising because youth- targeting programs led by youth are more understanding of their peers’ needs and priorities.
Youth-led civil society now confronts both opportunities and challenges. Sources of funding available for development
initiatives from the corporate and foundation sectors are beginning to materialize. There is a changing trend in funding
away from traditional short-term relief and charity to the support of development and empowerment projects. Other
opportunities derive from a rising national and international interest in youth issues. Large projects such as the Arab
League’s program on the empowerment of youth or the Brookings Institute’s Wolfensohn Centre research program on
Middle East youth are aimed at improving society’s understanding of youth through research. At home, the International
Youth Forum hosted by the Suzanne Mubarak International Women for Peace Organization, held in 2007, indicates the
increased presence of official support. Moreover, the number of corporate donors and UN agencies supporting youth led
initiatives has been on the increase. Source: Ehaab Abdou, former Nahdet El Mahroussa
Egypt Human Development Report 2010 { 9 }
Box 1.4: The Nine Messages of EHDR 2010
Influencing youth transitions requires a coherent framework. The proposed national youth policy must set priorities, coordinate
action and provide clear lines of accountability for youth outcomes. It must be integrated with national planning and
implementation mechanisms throughout key ministries and stakeholders. Initiatives from civil society organizations must
also be encouraged to respond to the needs of special groups (such as girl’s illiteracy) or to promote programs that tackle
national issues (such as poverty reduction), and they would benefit from the inclusion of young people volunteering and
leading these projects. There must also be a stronger voice from young people themselves in promoting good governance
and providing feedback on the quality of service delivery. Young people should also become the agents of change in favor
of reclaiming such traditional cultural norms as tolerance and of new ones and especially gender equity. The following nine
messages highlight this report’s key recommendations for action to support expanded opportunities for youth in Egypt.
Message 1: Overcoming education system failure: Policy makers and educators should strive to achieve a better match
between the outputs of educational institutions at all levels and the demands of the labor market. This will involve a review
of the balance of enrollment across subjects, skills and disciplines, the upgrading of technical education, and the review
of curricula to instill problem-solving skills, entrepreneurial and management capacity, and the value of self-employment.
As to illiteracy and early school attrition (dropouts), 80% of this phenomenon can be attributed to poverty and gender
bias in rural areas. The answer is geographically targeted interventions and especially conditional cash transfers which
combine financial support to households with support for literacy, education and training in second chance skill formation
programs geared for the job market.
Message 2: Breaking the cycle of poverty: This must focus on youth, given the two-way interaction between poverty and its
attributes, namely lack of education and skills, and absence of decent jobs. The answer is again geographic targeting of
poor households with a battery of cross-sectoral interventions including on-the-job training, literacy and income generation.
The National Project for the 1000+ Villages provides a unique opportunity for Egypt to mobilize all of the government,
private sector and civil society resources — both financial and managerial — so as to uproot severe poverty in all of it
manifestations. A key role in the mobilization effort should be given to youth, providing them with a goal and purpose in
the national cause through volunteer activity. There exist a number of national projects in Egypt’s current Five Year Plan
that are MDG anchored and can use the human capital of Egypt’s youth. The national programs could be offered for small
business start-ups.
Message 3: Job creation: Many job opportunities exist in the formal and informal private sector but the state must bear its
responsibility in making these jobs respectable, safe and rewarding. The answer is for the state to provide a contribution to
social security payments for new jobs for youth as recommended in the EHDR 2005. Education and training in addition to
the proposed wage subsidy (social security share) will mean higher incomes earned in the SME sector and higher taxable
income for the government which can promote what is in fact a self-sustaining budgetary scheme. Appointment of youth to
government positions should be where there is a real need and a real job opportunity in existence. Despite the overstaffed
government bureaucracy, there are some areas of deficit, such as for teachers and nurses in many governorates, but there
are insufficient applicants either because of inadequate pay or remote location. Here again, what is proposed is a time-
bound national program for jobs for youth targeted at meeting all MDG-related objectives and their indicators.
Message 4: Focus on culture: There is growing evidence of regression in attitudes of tolerance and respect of the other,
whether directed at religious or gender affiliation. NGO-led youth initiatives in areas of social concern could overcome the bias
towards narrow group attachments. Evidence also indicates that teacher values and attitudes as well as constricted curriculum
content are responsible in part for this unfortunate trend. More emphasis on liberal educational material, and on music,
theatre and the arts in general, would generate creative thinking and inventiveness. It would attenuate the bias towards limited
perspectives. Alliances with global youth initiatives would promote the ideas of both children and young people who have the
mindset and talent to overcome limited world views. In Egypt, the culture of invention and innovation by young people needs to
be reinvigorated after decades of neglect. As a precondition, open-mindedness will allow the energy of young people — who
are the leaders of the future — to create novel and original solutions to current problems.

Egypt Human Development Report 2010{ 10 }
Civic Participation
A portion of the blame for modest participation and
little civic engagement from youth should be placed
on the present cultural and political environment in
Egypt rather than on the youth themselves. About
82% of the World Values Survey sample — covered
extensively in Chapter Five of this report — stressed
the importance of preserving customs and traditions
rooted in religion and family as characteristics that
apply to them completely. The potential for the cre-
ation of an enabling environment also appears to be
undermined by the country’s record of democracy
and by a security apparatus that is intolerant of any
form of public display. However, this report clearly
demonstrates that youth are interested in inclusion,
discuss the ills of their society as they see them, and
dream about what they consider to be better condi-
tions. Aspirations revolve around better education,
Message 5: Eliminate gender discrimination: The exclusion of young girls and women is still a serious problem in Egypt. A
mix of legislative and programmatic interventions is needed to fight culturally rooted sources of discrimination. Schooling
has a role to play, but reforms under the new Child Law should also be expanded to include benefits for 18 to 29 age
women. With regards socio-economic participation, three vital projects that impact on girls and young women need scaling
up: preschool education, the one classroom schools for girls and the conditional cash transfers. All three programs were
adopted in the current Five Year Plan following recommendations in the EHDR 2005, but their implementation has fallen
well behind their 2012 target.
Message 6: Youth Well-Being: The National Youth Council should take the lead in issuing an annual review of the National
Youth Well-Being Index. The Index, which was prepared as part of the present 2010 EHDR (see Chapter Fifteen) assesses
progress on youth indicators in access to services, income and deprivation, gender, employment, as well as civic participation,
family life, leisure, and security. The objectives of the Index are fourfold: To monitor the levels and severity of youth deprivation,
to situate Egypt’s youth as compared to youth in other countries, to measure progress in youth well-being over time, and to
raise awareness on all aspects of youth welfare. Other studies and research initiatives, whether publicly or privately initiated,
should be used to supplement the data base for the Index and serve to inform policy makers on youth areas needing special
interventions.
Message 7: Governance: Enhancing youth participation for ‘responsive governance’ will improve government performance. In
the government sector, the opportunities for youth can be found in a Pay for Performance system, a Competency Based
Human Resource Management system, more utilization of e-government to combat corruption, and a reconfiguration of the
social contract binding employers and employees. Strict abidance by a merit based Human Resource Management system
would limit nepotism, patronage and ‘wasta’ as entry points to employment or to promotion. In civil society organizations
and through the independent media, youth can also push for government sector reform by holding it accountable and
monitoring its performance.
Message 8: Migration: The benefits of migration from the perspective of employment and remittances far outweigh the cost
of brain-drain — especially given Egypt’s current youth bulge. However, the state should support migration under a holistic
and institutionalized approach that is dictated by the current structure of Egypt’s human resources. It should also study future
prospects and demand in the labor markets of Europe and its aging populations, and in the labor markets of emerging oil
economies, so as to cater for these in Egypt’s education and skill formation programs. Moreover, the state should negotiate labor
movements with host countries on the basis of temporary migration (4-5 years) and terms that are win-win for all concerned.
Message 9: Breaking the land constraint: A national scheme, ‘project land’ proposes the distribution of parcels of land to
youth in Egypt‘s new regions such as the desert fringes (zaheer sahrawi), along the Nile Valley, the coastlines, and new
cities and urban developments. The conditions are that youth beneficiaries will settle the lands and engage in innovative
projects in small-scale tourism, eco-friendly agriculture, and other high value-added activities such as ICT, transport and
housing. Entrepreneurship needs to start from ownership of some asset in addition to human capital and providing youth with
physical capital assets will thus open new avenues of employment and prosperity. The purpose is to introduce a key element
that caters both for distributive justice and for good investment fundamentals. Source: Heba Handoussa, Lead Author EHDR
2010

Egypt Human Development Report 2010 { 11 }
suitable job opportunities, decent wages, and family
encouragement for civic engagement. These opin-
ions, illustrated in a number of chapters, also reflect
the conviction amongst youth of the current futility
of participation, the perception that opportunities are
unequally distributed, the presence of nepotism and
favoritism, and the many economic and social hard-
ships faced, largely as a result of unemployment.
Nevertheless, 86% of the sample from the World
Values Survey said that they were happy with their
life. Surprisingly, 62% held the state responsible for
meeting their needs and aspirations. If a good quality
life requires that an individual should take responsi-
bility to achieve it, this response seems to imply that
the transition to the values of a market economy is
not complete. Given Egypt’s high youth unemploy-
ment figures, their perception of their relationship
to work takes on great importance. Overall, attitudes
to work — identified as indispensable — are positive,
as expressed by 85.5% of the same sample. Work as
a social duty is expressed by 91.7%. However, 44%
believed that being given any work opportunity was
more important than matching skill to job.
Youth appear to endorse the importance of democ-
racy but do not perceive it as much a priority as earn-
ing a living in the future. To 72% of the sample, con-
cern over the future is over economic improvement.
This suggests that prospects for work opportuni-
ties and regular income amid growing unemploy-
ment are a more urgent preoccupation than political
issues. Further, 87% of the sample said that in case
of scarce employment opportunities, priority should
be given to men who are, it appears, considered the
principal breadwinners. In line with these findings,
66% of the sample believed that a woman’s role as a
housewife can give her the same satisfaction as work
outside home.
Health
Chapter Thirteen suggests that most young people
make the transition into adulthood in good health.
Generally, the health problems commonly occurring
relate to malnutrition, to reproductive health, sexu-
ally transmitted diseases (including HIV infection),
in addition to substance use and violence. Further
health problems arise from social and cultural pres-
sure such as early marriages and female genital cut-
ting, nutrition related non-communicable diseases,
some prevalent infectious diseases such as tubercu-
losis and hepatitis, and food borne diseases that are
often a result of poor hygiene and inadequate sanita-
tion facilities. Faulty childcare practices among young
mothers are the cause of repeated diarrheal episodes
and malnutrition. The common precipitating factor
is most often poverty, especially in rural areas. Some
health problems result from interpersonal violence,
or from the consequences of an unsafe abortion or
unattended childbirth. Furthermore, the health of
adolescents and youth may have an intergenerational
effect. Babies born to adolescent parents, or to moth-
Egypt Human Development Report 2010{ 12 }
ers who are undernourished, carry a higher risk of
being underweight and of dying.
It is proposed to revisit current national programs tar-
geting youth health and wellbeing for strengthening of
their youth dimensions. Mechanisms are needed that
facilitate and enhance cross-sectoral collaboration
within the government for programs/interventions/
activities aiming at the protection and promotion of
the health security of youth and foster initiatives to
better understand the intricate relationship between
public health and these sectors. This may be an oppor-
tune timing since three sectors, namely, health, edu-
cation and social solidarity are in the midst of a reform
process. The coordination role awaited from the Fam-
ily and Population Ministry is expected to benefit from
the design of information sharing systems, of a finan-
cial management model to facilitate accounting and
accountability in jointly implemented programs, and
a management model for multi-partner interventions.
Promoting behavior change through peer groups and
maximizing use of youth services and modern IT
communication modalities can also promote healthy
behavior. The role of Civil Society Organizations can
bring added value.
Youth Well-Being
To see improvements in all of these areas, it is nec-
essary to first have measures by which progress can
be tracked over time and even provide cross-country
comparisons. Chapter 15 makes a first attempt at
identifying and quantifying indicators of youth well-
being and aggregating them into a proposed Youth
Well-Being Index (YWBI). While education, health
and income indicators are included, the greater bene-
fit will come from the ability to measure such qualita-
tive indicators as leisure and satisfaction, the quality
of jobs, and even social capital and cohesiveness.
The YWBI is a composite index in which the ten
domains and 54 indicators are calculated from the
Household Income and Consumption Survey, the
World Value Survey, the Demographic and Health
Survey and the Survey of Young People in Egypt.
Selected variables from each domain were adjusted to
cope with the direction towards maximum well being
at 100%, and the resulting composite YWBI for Egypt
was calculated to be 61%. When differentiated by
gender, disaggregated data shows that young women
are still severely more disadvantaged than young men
on a number of fronts, specifically with regards labor
force participation, unemployment rates and abso-
lute poverty figures.
nationaL action PLan on youth eMPLoyMent
Public policy and institutions are only very slowly
emerging to create a different set of conditions to help
forge a new life course for Egypt’s youth. Heading the
list of challenges to be addressed is the issue of youth
unemployment. This requires “an integrated strategy
for growth and job creation, as well as targeted inter-
ventions to help young people overcome the specific
barriers they face in entering and remaining in the
labor market”.14 It also requires partnerships with
different actors. In this respect Egypt as a lead part-
ner in the UN Secretary General’s Youth Employment
Network (YEN) 15 has prepared a National Action
Plan on Youth Employment (NAP) with support from
the ILO and YEN.
The process has been driven and supported by the
Ministry of Manpower and Migration, with mul-
tiple social partners, national and international
actors, youth organizations, development agencies
and donors. To date, the initiative has produced a
fully comprehensive draft document that sets spe-
cific objectives and outcomes, as well as a division of
labor, financial commitments and monitoring mecha-
nisms for an integrated approach to meet the youth
employment challenge in Egypt. It is to be ratified
by Parliament and incorporated into Egypt’s current
and next Five Year Plans at an estimated LE 17 bil-
lion at LE 3.4 billion per year over five years. There
are three policy priorities: (i) Technical education and
vocational training (TVET) to increase youth employ-
ability; (ii) Enterprise development, to improve the
success rate of micro, small and medium enterprises
(MSMEs); (iii) Labor market policies and programs,
to activate minimum wage rule and its enforcement
and to upgrade employment offices and encourage
the establishment of private recruitment agencies.
This would improve the information and knowledge
base that youth can access on work opportunities,
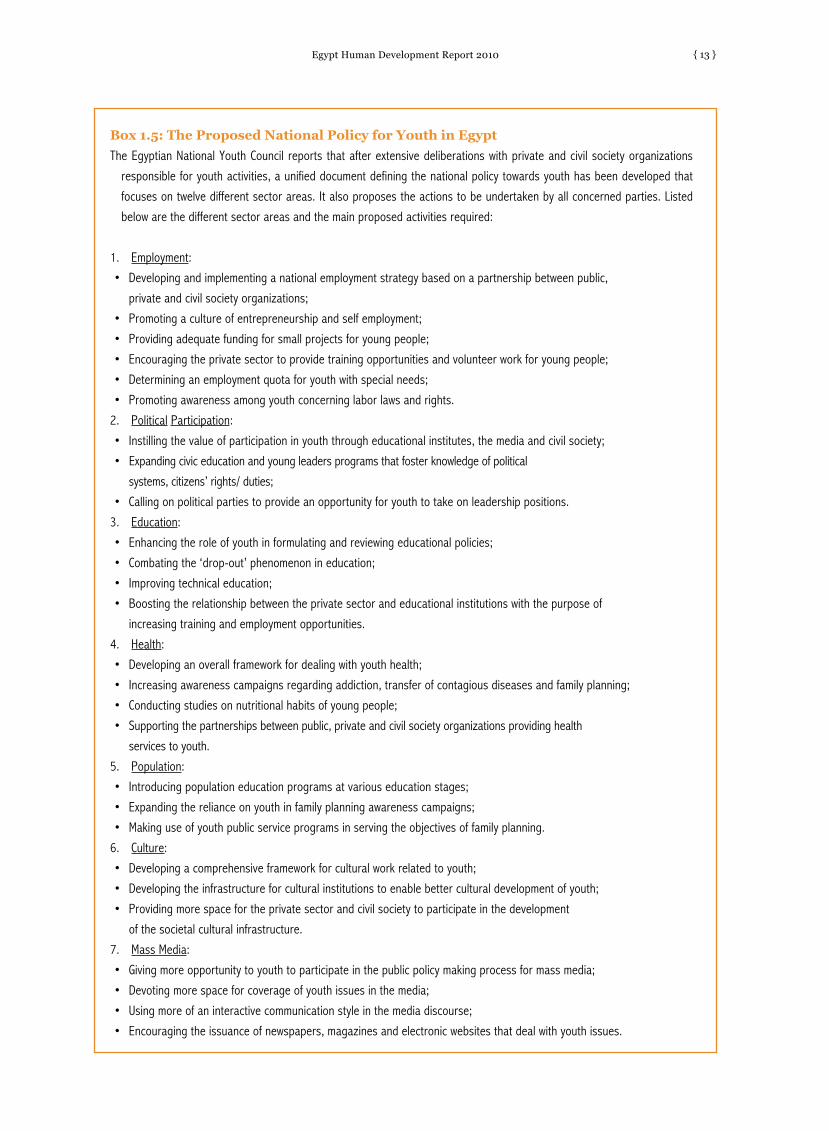
Egypt Human Development Report 2010 { 13 }
Box 1.5: The Proposed National Policy for Youth in Egypt
The Egyptian National Youth Council reports that after extensive deliberations with private and civil society organizations
responsible for youth activities, a unified document defining the national policy towards youth has been developed that
focuses on twelve different sector areas. It also proposes the actions to be undertaken by all concerned parties. Listed
below are the different sector areas and the main proposed activities required:
1. Employment:
• Developing and implementing a national employment strategy based on a partnership between public,
private and civil society organizations;
• Promoting a culture of entrepreneurship and self employment;
• Providing adequate funding for small projects for young people;
• Encouraging the private sector to provide training opportunities and volunteer work for young people;
• Determining an employment quota for youth with special needs;
• Promoting awareness among youth concerning labor laws and rights.
2. Political Participation:
• Instilling the value of participation in youth through educational institutes, the media and civil society;
• Expanding civic education and young leaders programs that foster knowledge of political
systems, citizens’ rights/ duties;
• Calling on political parties to provide an opportunity for youth to take on leadership positions.
3. Education:
• Enhancing the role of youth in formulating and reviewing educational policies;
• Combating the ‘drop-out’ phenomenon in education;
• Improving technical education;
• Boosting the relationship between the private sector and educational institutions with the purpose of
increasing training and employment opportunities.
4. Health:
• Developing an overall framework for dealing with youth health;
• Increasing awareness campaigns regarding addiction, transfer of contagious diseases and family planning;
• Conducting studies on nutritional habits of young people;
• Supporting the partnerships between public, private and civil society organizations providing health
services to youth.
5. Population:
• Introducing population education programs at various education stages;
• Expanding the reliance on youth in family planning awareness campaigns;
• Making use of youth public service programs in serving the objectives of family planning.
6. Culture:
• Developing a comprehensive framework for cultural work related to youth;
• Developing the infrastructure for cultural institutions to enable better cultural development of youth;
• Providing more space for the private sector and civil society to participate in the development
of the societal cultural infrastructure.
7. Mass Media:
• Giving more opportunity to youth to participate in the public policy making process for mass media;
• Devoting more space for coverage of youth issues in the media;
• Using more of an interactive communication style in the media discourse;
• Encouraging the issuance of newspapers, magazines and electronic websites that deal with youth issues.
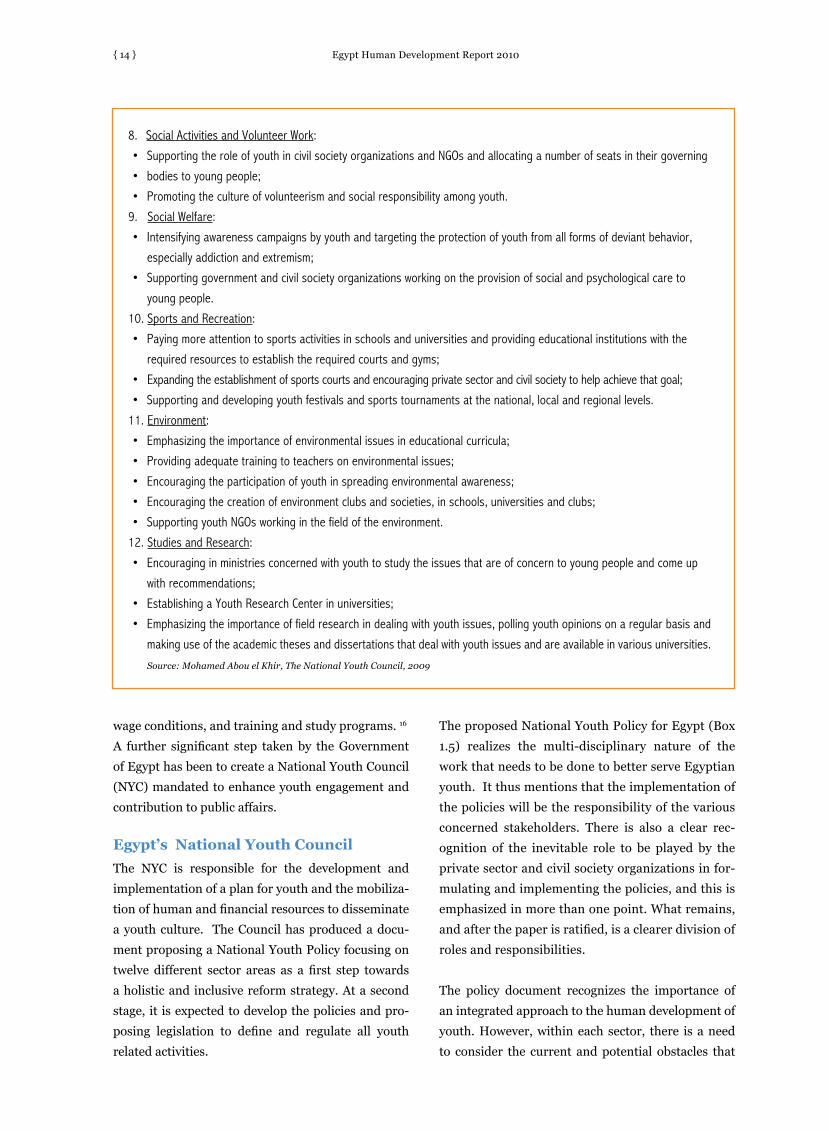
Egypt Human Development Report 2010{ 14 }
wage conditions, and training and study programs. 16
A further significant step taken by the Government
of Egypt has been to create a National Youth Council
(NYC) mandated to enhance youth engagement and
contribution to public affairs.
Egypt’s National Youth Council
The NYC is responsible for the development and
implementation of a plan for youth and the mobiliza-
tion of human and financial resources to disseminate
a youth culture. The Council has produced a docu-
ment proposing a National Youth Policy focusing on
twelve different sector areas as a first step towards
a holistic and inclusive reform strategy. At a second
stage, it is expected to develop the policies and pro-
posing legislation to define and regulate all youth
related activities.
The proposed National Youth Policy for Egypt (Box
1.5) realizes the multi-disciplinary nature of the
work that needs to be done to better serve Egyptian
youth. It thus mentions that the implementation of
the policies will be the responsibility of the various
concerned stakeholders. There is also a clear rec-
ognition of the inevitable role to be played by the
private sector and civil society organizations in for-
mulating and implementing the policies, and this is
emphasized in more than one point. What remains,
and after the paper is ratified, is a clearer division of
roles and responsibilities.
The policy document recognizes the importance of
an integrated approach to the human development of
youth. However, within each sector, there is a need
to consider the current and potential obstacles that
8. Social Activities and Volunteer Work:
• Supporting the role of youth in civil society organizations and NGOs and allocating a number of seats in their governing
• bodies to young people;
• Promoting the culture of volunteerism and social responsibility among youth.
9. Social Welfare:
• Intensifying awareness campaigns by youth and targeting the protection of youth from all forms of deviant behavior,
especially addiction and extremism;
• Supporting government and civil society organizations working on the provision of social and psychological care to
young people.
10. Sports and Recreation:
• Paying more attention to sports activities in schools and universities and providing educational institutions with the
required resources to establish the required courts and gyms;
• Expanding the establishment of sports courts and encouraging private sector and civil society to help achieve that goal;
• Supporting and developing youth festivals and sports tournaments at the national, local and regional levels.
11. Environment:
• Emphasizing the importance of environmental issues in educational curricula;
• Providing adequate training to teachers on environmental issues;
• Encouraging the participation of youth in spreading environmental awareness;
• Encouraging the creation of environment clubs and societies, in schools, universities and clubs;
• Supporting youth NGOs working in the field of the environment.
12. Studies and Research:
• Encouraging in ministries concerned with youth to study the issues that are of concern to young people and come up
with recommendations;
• Establishing a Youth Research Center in universities;
• Emphasizing the importance of field research in dealing with youth issues, polling youth opinions on a regular basis and
making use of the academic theses and dissertations that deal with youth issues and are available in various universities.
Source: Mohamed Abou el Khir, The National Youth Council, 2009
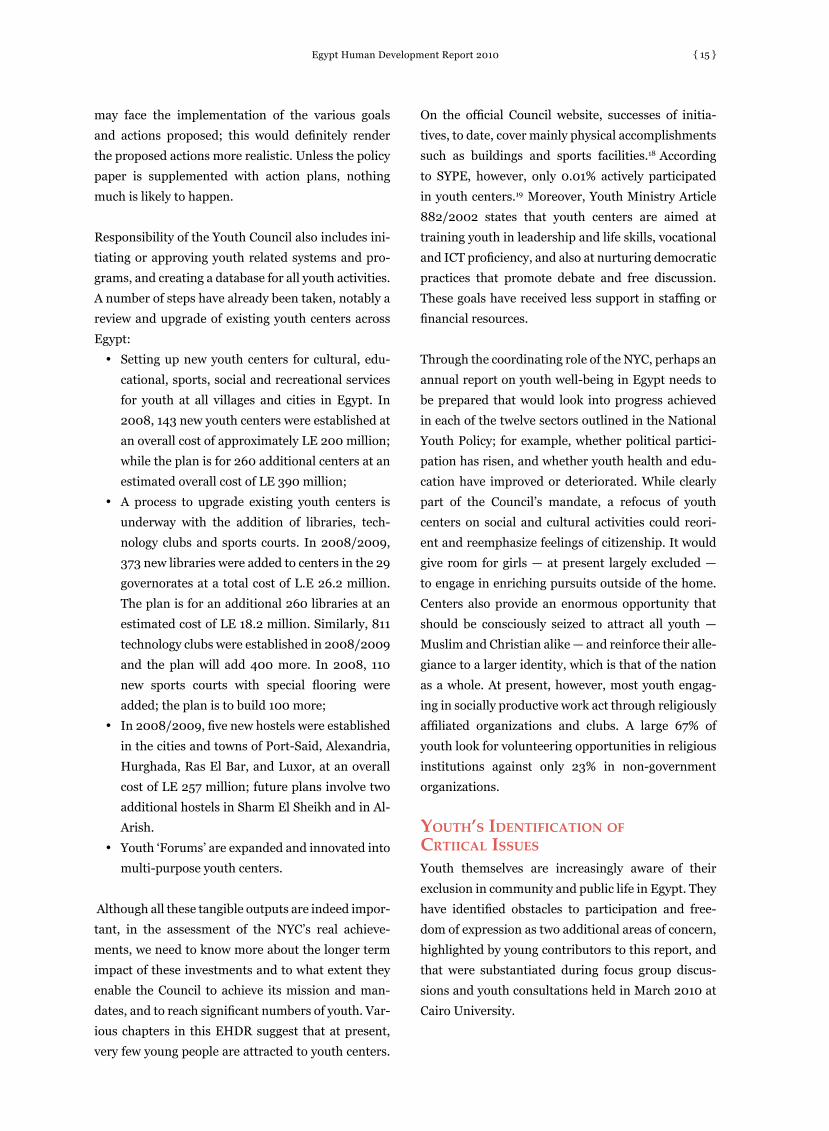
Egypt Human Development Report 2010 { 15 }
may face the implementation of the various goals
and actions proposed; this would definitely render
the proposed actions more realistic. Unless the policy
paper is supplemented with action plans, nothing
much is likely to happen.
Responsibility of the Youth Council also includes ini-
tiating or approving youth related systems and pro-
grams, and creating a database for all youth activities.
A number of steps have already been taken, notably a
review and upgrade of existing youth centers across
Egypt:
• Setting up new youth centers for cultural, edu-
cational, sports, social and recreational services
for youth at all villages and cities in Egypt. In
2008, 143 new youth centers were established at
an overall cost of approximately LE 200 million;
while the plan is for 260 additional centers at an
estimated overall cost of LE 390 million;
• A process to upgrade existing youth centers is
underway with the addition of libraries, tech-
nology clubs and sports courts. In 2008/2009,
373 new libraries were added to centers in the 29
governorates at a total cost of L.E 26.2 million.
The plan is for an additional 260 libraries at an
estimated cost of LE 18.2 million. Similarly, 811
technology clubs were established in 2008/2009
and the plan will add 400 more. In 2008, 110
new sports courts with special flooring were
added; the plan is to build 100 more;
• In 2008/2009, five new hostels were established
in the cities and towns of Port-Said, Alexandria,
Hurghada, Ras El Bar, and Luxor, at an overall
cost of LE 257 million; future plans involve two
additional hostels in Sharm El Sheikh and in Al-
Arish.
• Youth ‘Forums’ are expanded and innovated into
multi-purpose youth centers.
Although all these tangible outputs are indeed impor-
tant, in the assessment of the NYC’s real achieve-
ments, we need to know more about the longer term
impact of these investments and to what extent they
enable the Council to achieve its mission and man-
dates, and to reach significant numbers of youth. Var-
ious chapters in this EHDR suggest that at present,
very few young people are attracted to youth centers.
On the official Council website, successes of initia-
tives, to date, cover mainly physical accomplishments
such as buildings and sports facilities.18 According
to SYPE, however, only 0.01% actively participated
in youth centers.19 Moreover, Youth Ministry Article
882/2002 states that youth centers are aimed at
training youth in leadership and life skills, vocational
and ICT proficiency, and also at nurturing democratic
practices that promote debate and free discussion.
These goals have received less support in staffing or
financial resources.
Through the coordinating role of the NYC, perhaps an
annual report on youth well-being in Egypt needs to
be prepared that would look into progress achieved
in each of the twelve sectors outlined in the National
Youth Policy; for example, whether political partici-
pation has risen, and whether youth health and edu-
cation have improved or deteriorated. While clearly
part of the Council’s mandate, a refocus of youth
centers on social and cultural activities could reori-
ent and reemphasize feelings of citizenship. It would
give room for girls — at present largely excluded —
to engage in enriching pursuits outside of the home.
Centers also provide an enormous opportunity that
should be consciously seized to attract all youth —
Muslim and Christian alike — and reinforce their alle-
giance to a larger identity, which is that of the nation
as a whole. At present, however, most youth engag-
ing in socially productive work act through religiously
affiliated organizations and clubs. A large 67% of
youth look for volunteering opportunities in religious
institutions against only 23% in non-government
organizations.
youth’s iDentification of crtiicaL issues
Youth themselves are increasingly aware of their
exclusion in community and public life in Egypt. They
have identified obstacles to participation and free-
dom of expression as two additional areas of concern,
highlighted by young contributors to this report, and
that were substantiated during focus group discus-
sions and youth consultations held in March 2010 at
Cairo University.
Egypt Human Development Report 2010{ 16 }
Obstacles to Participation20
There is not only a need to expand all youth pro-
grams, as mentioned in the proposed national policy
for youth. It is also important to review the current
syllabi of civic education taught to students. For
example, at the third secondary level, a good sec-
tion of the curriculum is devoted to a discussion of
the achievements of the 1952 revolution in all sec-
tors of the economy. No objective assessment is pro-
vided and no room given to a discussion of possible
improvements on current public policies. Moreover,
no mention is made of political parties, their role in
a democracy, or citizens’ rights or duties.
A related hurdle is the apathy among youth towards
political participation, borne of the conviction that
that their voice will largely remain ignored. Whether
the case of student councils or national elections, it
is common knowledge that these or their outcomes
are often tampered with. There is sufficient evidence
from many court cases that indicate that the national
election process was neither impartial nor its results
open to public scrutiny.
The limited three month period, from the first of
November to the end of January, during which any
citizen can be issued with a voting card, may also be a
procedural hurdle. It would appear simpler to allow
citizens to use their national ID cards for voting rather
than have to apply during a short window of time for
a voting card that can easily be forged. It would also
be more useful to ask why Egypt currently has weak
opposition parties and why these have not developed
into more viable opposition movements, rather than
ask political parties to solicit youthful participation in
their programs or appoint youth in leadership posi-
tions within this context. The ruling National Demo-
cratic Party has been taking steps towards the inclu-
sion of youth in many of its activities and programs,
but this initiative is still in its early stages.
There is subtle, and sometimes overt, harassment
of university students by the security forces if they
engage in activities within the university that are
Box 1.6: Youth, Volunteerism and Development in Egypt
Youth volunteerism is a means for strengthening youth participation. It has the potential to overcome traditional obstacles for
youth development such as economic status, educational attainment, geographic location, gender roles and vulnerability
to social conditions. Community involvement is critical for promoting young people’s development and learning. From a
youth perspective, volunteerism brings a strong sense of confidence and self-satisfaction and it enables young people
to develop new skills such as leadership, creative thinking, and problem solving. In fact, volunteering empowers young
people and expands their social networks, often representing their first channel of involvement with the work environment.
The UN system promotes volunteerism for development through the United Nations Volunteers programme (UNV) administered
by UNDP. UNV was designated by the General Assembly resolution of 16 December 1976 as the major operational unit
of the UN for the execution of youth programmes. The UNV programme has been active in Egypt since 1988. It has been
growing over the past years in conformity with the growing need for UNV volunteers’ assistance to various community
development activities carried-out by the UN system, the Government, NGOs, bilateral donors and the private sector. It is
also succeeding in facilitating the setting up of mechanisms for promoting and engaging different stakeholders through
various projects and initiatives in civil society groups.
There are various volunteering opportunities in Egypt. Examples of formal volunteering include the work done in partnership
with the UNV programme by the National Council for Childhood and Motherhood (NCCM), INJAZ, Sailing the Nile for the
MDGs, and the Youth Association for Population and Development (YAPD). Informally, one can join any community’s
efforts that contribute to national efforts towards reducing poverty, organizing the young people around development
activities, promoting social capital, and assisting civil society, local groups and organizations to participate in their own
development. In addition, the UNV programme offers the Online Volunteering (OV) service that brings volunteers and
non-profit organizations, government institutions, academia and UN agencies together to collaborate online and contribute
to improving the lives of beneficiaries in developing countries Source: Leticia Troncoso, UNV, Egypt

Egypt Human Development Report 2010 { 17 }
deemed harmful or dissident. Political activities are
frowned upon if not in line with the ruling party pro-
gram. Parents often advise youth not to engage in any
kind of activity that could be construed as rebellious
or non-conformist, so as to avoid trouble with campus
police or the university authorities. This occurs across
universities and affects all students, even those affili-
ated to the Faculty of Economics and Political Science,
whose main pedagogical purpose is to teach the prac-
tice of politics.
Before calling for the participation of young people,
via Youth Centers, NGO or volunteer work, there is
need to understand why these have been unable to
attract youth in large numbers. Do they provide the
means by which youth are able to develop their own
capabilities and pursue interests that contribute to
their well-being? Are they sufficiently open to con-
sultation and feedback from young people? Do they
give young people equal opportunity to develop, to
be empowered within the organization, to grow and
gain influence over policy decisions and development
directions? Are they aware that the voice of young
people can also improve service delivery by monitor-
ing and evaluating its quality?
Freedom of Expression
The overall national media policy — as a result of
various legislative prohibitions and the Emergency
Law that is still in force — has an adverse impact on
media liberties. Rather than calling for the publica-
tion of more newspapers and magazines dealing with
anodyne youth subjects, or the development of web-
sites dealing with predetermined youth issues, there
is a need to discuss the real hurdles facing freedom
of expression by youth, especially over the net, and
there are reported cases of prosecution of some active
bloggers over the past years. The content of pro-
grams, talk shows, movies, and advertising send the
message that entertainment is paramount, and little
attention is directed towards subjects of critical con-
cern to development or participation.
concLusionThere is little argument over the need to adopt a coher-
ent framework for a youth-inclusive strategy in Egypt.
A first step would be to upgrade the status of Egypt’s
National Youth Council so that it can better fulfill its
mandate and implement a national youth policy. A
second step would be to adopt the Youth Well-Being
Index (YWBI) proposed in this report. This YWBI
captures all aspects health, education, employment,
recreation and culture for young men and women that
number close to 20 million citizens in the critical age
group 18-29 years. The index would therefore become
the benchmark whereby the government is held
accountable for progress, along with the contributions
of stakeholders in civil society and the business com-
munity. As shown in Box 1.4, the list of priority areas
for positive intervention on behalf of youth is vast.
Unemployment among young people is perhaps the
biggest challenge faced by the Government of Egypt
today. The youth bulge is a major contributing factor
since it has doubled the annual number of new entrants
to the labor force over the past two decades. The rate
of decline in the annual number of youth entering the
job market in the longer term will depend on the rate
of fertility decline in this critical decade. Equally prob-
lematic is the mismatch between employment oppor-
tunities, education and skill formation. Type and level
of education matter in the search for jobs, with univer-
sity and technical education graduates at the greatest
disadvantage, requiring a serious review of educational
standards, quality and relevance. For those numerous
young people who remain illiterate or drop out of basic
education, the need is to improve access to the founda-
tions of education, by targeting poor and rural areas
specifically, with special attention given to girls.
A proposed national employment strategy must
also take demand factors into account. The need to
improve the compatibility between the outputs of the
educational institutes and the labor market has been
emphasized in this report. Despite high unemploy-
ment rates, many employers (whether in the public or
private sector) complain from lack of availability of the
required skills and competencies needed. This is espe-
cially true for technical work positions. The upgrad-
ing of technical and vocational proficiency would
open doors to skilled and semi-skilled jobs in indus-
try, as discussed in Chapter Twelve, and an upgrade
of entrepreneurial skills would encourage youth to
look for opportunities outside of the traditional chan-

Egypt Human Development Report 2010{ 18 }
nels, and to have the optimism and audacity to ven-
ture into their own business (see Chapter 10). There
is also a bias against young women across the work
force, and whose participation rate has declined even
further in the past few years. Sufficient incentives for
young women, such as facilitated transportation and
childcare facilities, would promote work, as would the
enforcement of legal provisions on work conditions.
A strategy such as Egypt’s National Action Plan on
Youth Employment (NAP) needs also to pinpoint
where present employment opportunities lie, espe-
cially for youth with a higher education, and not
only in an expanded private sector, but also in niche
areas in the public sector. In some professions such
as teaching and nursing, for example providing fair
compensation would attract the needed young cali-
bers to apply for vacant positions. The spread of
patronage and nepotism might, in part, be challenged
through the establishment of a transparent system of
job advertising and recruiting for both public and pri-
vate openings.
Finally, a change in cultural norms towards greater
tolerance of youth freedom is closely interlinked with
a more liberally oriented education system, a greater
degree of economic independence among young peo-
ple, as well as with the removal of any coercive mea-
sures applied to limit youths’ choice of expression and
action.
Endnotes1. Figures provided by the Information and Decision Support Center of the Cabinet.2. See World Youth Report (2007), Young People’s Transition to Adulthood: Progress and Challenges, Department of
Economic and Social Affairs, UN Secretariat, New York.3. Ibid, Silver (2007).4. Diane Singerman, The Economic Imperative of Marriage: Emerging Practices and Identities among Youth in the Middle
East, Middle East Youth Initiative Working Paper, Brookings Institute, (September 2007)5. National Census, 20066. Population Council (2010), Survey of Young People in Egypt7. El Badawy and Assaad (2004)8. Ministry of Manpower and Migration/ILO, Egypt Youth Employment National Action Plan 2010-20159. Ibid10. See Chapter 11 for more details on specific study results.11. Assaad and Roushdy 2007, and Barsoum et al., 2009.12. However, poor labor prospects and difficulties in securing housing among some subgroups, notably young people with a
university education, have also led to delayed marriage.13. SYPE Preliminary Results, 201014. Ministry of Manpower and Migration/ILO, Egypt Youth Employment National Action Plan 2010-201515. Ibid16. Op.cit.17. Mohamed Abou el Khir, The National Youth Council, 2009.18. The official website of the National Council for Youth is <http://www.alshabab.gov.eg/AR_Youth_Clubs.aspx>19. SYPE Preliminary Results, 201020. Contributions to critical assessment by Laila el Baradei, American University in Cairo
references Abdel Ghani, Mohamed, Abdel Khader, Magda, and Nawar, Laila (2006). Situation and Attitudes of Youth in Egypt. Published by
the Cairo Demographic Center.Assaad, Ragui and Barsoum, Ghada (2009). Rising Expectations and Diminishing Opportunities for Egypt’s Young, in Navtej
Dhillon, and Tarik Youssef, editors, Generation in Waiting, Brookings Institute Press, Washington, DC, USAILO and Ministry of Manpower and Migration (2009). Egypt Youth Employment National Action Plan 2010-2015. (Final Draft). Cairo League of Arab States and United Nations (2007). The Millennium Development Goals in the Arab Region 2007: A Youth Lens – An
Overview.Population Council and Egyptian Cabinet Information and Decision Support Center (2010). Survey of Young People in Egypt:
Preliminary Report, Cairo.Silver, H. 2007. “Social Exclusion: Comparative Analysis of Europe and Middle East Youth.” The Middle East Youth Initiative
Working Paper No 1. Wolfenson Center for Development & Dubai School of Government.Singerman, D. 2007. “The Economic Imperatives of Marriage: Emerging Practices and Identities Among Youth in the Middle East.”
The Middle East Youth Initiative Working Paper No 6. Wolfenson Center for Development & Dubai School of Government. United Nations (2007). World Youth Report 2007: Young People’s Transition to Adulthood. New York.World Bank, MENA. (2007). Youth - An Undervalued Asset. Towards a New Agenda in MENA. Progress, Challenges and Way
Forward. Washington DC. September.
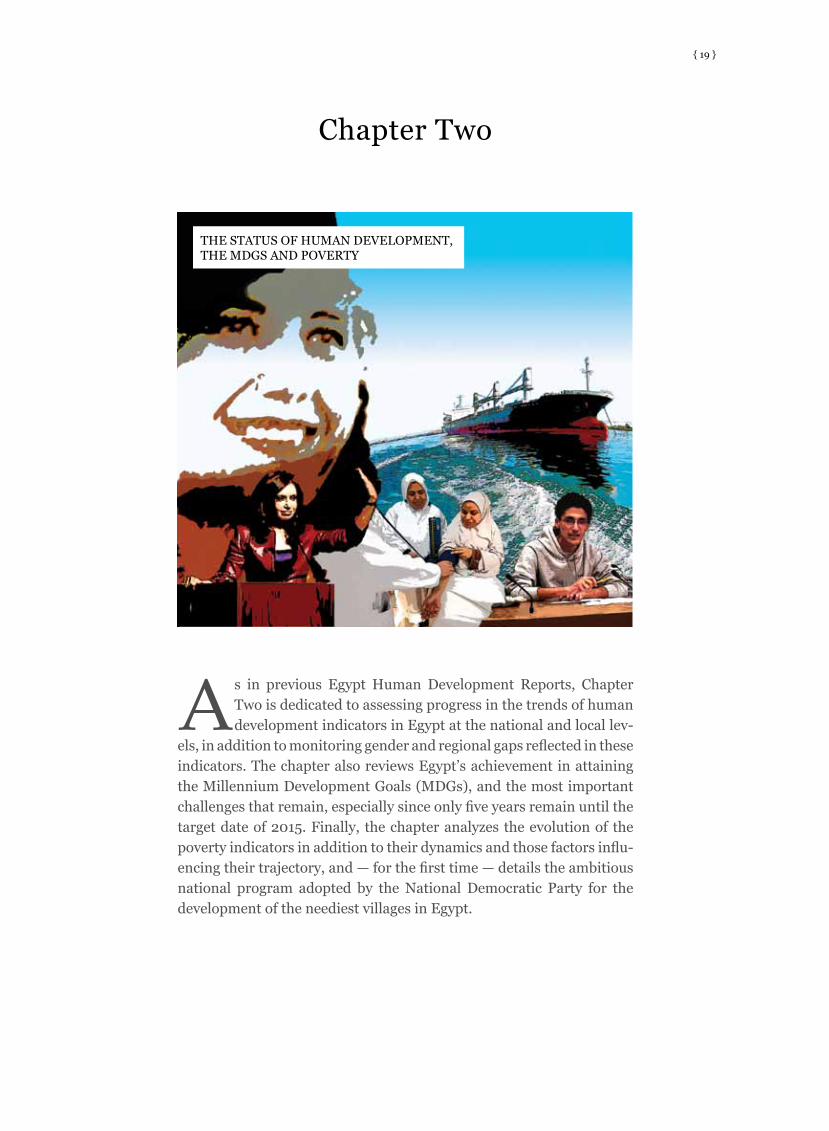
{ 19 }
As in previous Egypt Human Development Reports, Chapter Two is dedicated to assessing progress in the trends of human development indicators in Egypt at the national and local lev-
els, in addition to monitoring gender and regional gaps reflected in these indicators. The chapter also reviews Egypt’s achievement in attaining the Millennium Development Goals (MDGs), and the most important challenges that remain, especially since only five years remain until the target date of 2015. Finally, the chapter analyzes the evolution of the poverty indicators in addition to their dynamics and those factors influ-encing their trajectory, and — for the first time — details the ambitious national program adopted by the National Democratic Party for the development of the neediest villages in Egypt.
Chapter Two
THE STATUS OF HUMAN DEVELOPMENT, THE MDGS AND POVERTY

Egypt Human Development Report 2010{ 20 }
2008, an improvement that is also larger than that of
education and health.
It should be noted that the increase in average GDP
per capita between the 2008 and 2010 EHDRs took
place despite the rise in the percentage of the poor
from 19.6% to 21.6%, and the increase in the absolute
number of poor.1
The decline in value of the education index in the
EHDR 2010 compared to its value in the EHDR 2008
refers to the decrease in enrollment at all educa-
tional levels, from 76.4% in 2005/2006 to 66.0% in
2007/2008. This is due to the reintroduction of the
sixth primary grade, which has led to a significant
reduction in the numbers enrolled in some school
years and especially in the first secondary grade.
Thus, the decline that appears in the education index
value should not be considered a real decrease in edu-
cational enrollment over the period.
Another two challenges faced by the educational
system are the persistent absence of enrollment and
the school dropout rates, which are not reflected
in the gross enrollment ratios but evidenced by the
final results of the General Census of Population and
Establishments 20062 and confirmed by the Survey of
Young People in Egypt (SYPE) which was conducted
in April 2009. Moreover, earlier studies indicate that
the dropout rate from education is high in some par-
ticular grades.3
The quality of education in relation to market
demand continues to be a problem. Current educa-
tion policy pushes more than 60% of the preparatory
completers toward technical secondary education,
in which unemployment is the highest. The rate of
Table 2.1: Evolution of the Human Development Index
Source: INP. See Technical Notes. * Note: Each year refers to the data of publication of the EHDR. The reduction in the education index in the EHDR 2010 is due to the reintroduction of sixth primary grade which led to a decline in the measure of school enrollment.
1995
0.5240.3570.5440.672
1996
0.5890.5030.5690.695
1997/98
0.6310.5980.5990.695
1998/99
0.6480.6320.6140.698
2000/01
0.6550.6490.6430.702
2003
0.6800.6550.6820.702
2004
0.6870.6070.7030.752
2005
0.6890.6220.6850.760
2008
0.7230.6810.7180.772
2010
0.7310.7270.6890.778
The report*
Human Development IndexIncome IndexEducation IndexLife Expectancy Index
trenDs in the huMan DeveLoPMent inDicators
In spite of considerable efforts exerted to raise the
level of human development (HD) and the general
upward trend recorded by the human development
index (HDI) over the past 20 years, there remains a
gap not only between what has been achieved across
governorates, but also between rural and urban areas
in Egypt. Moreover, a gender gap is still evident in
some indicators. This section will therefore focus on
monitoring the following:
• The general trend of the human development
index since 1995;
• The ranking of governorates in terms of the
human development level and the extent of the
variation between Lower Egypt governorates
and Upper Egypt governorates on the human
development level;
• Trends and elements of the gap between rural
and urban areas; and
• Trends in the gender gap across relevant indica-
tors.
General Trend of the Human Development Index
Table 2.1 and Figure 2.1 show a continuing improve-
ment in HDI, reaching 0.731, up from 0.524 recorded
in the 1995 Egypt Human Development Report
(EHDR).
Although the values of the three indexes, education,
life expectancy, and income, play an important role
in the HDI, and besides the continuing improvement
of each of these indexes (Figure 2.2), the recorded
values for the progress of the income index indicates
a noticeable improvement in its value in the EHDR
2010, where it reached 0.727 compared to 0.681 in
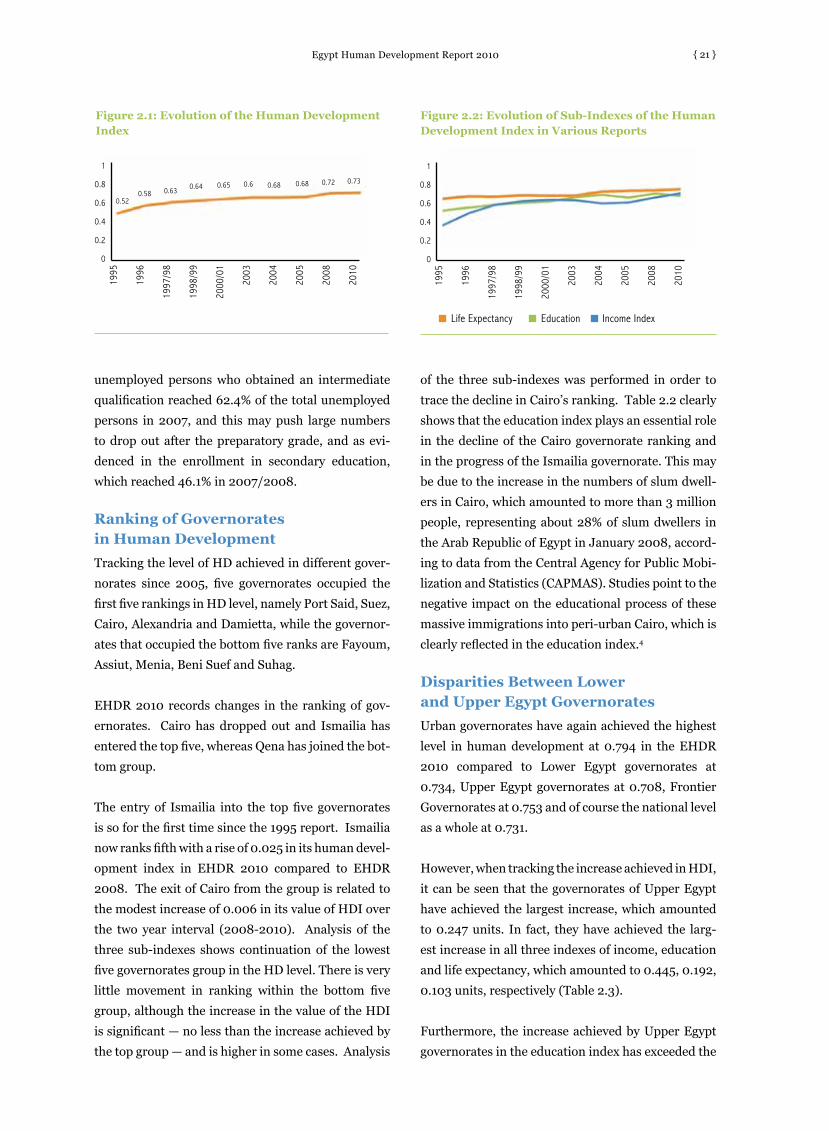
Egypt Human Development Report 2010 { 21 }
of the three sub-indexes was performed in order to
trace the decline in Cairo’s ranking. Table 2.2 clearly
shows that the education index plays an essential role
in the decline of the Cairo governorate ranking and
in the progress of the Ismailia governorate. This may
be due to the increase in the numbers of slum dwell-
ers in Cairo, which amounted to more than 3 million
people, representing about 28% of slum dwellers in
the Arab Republic of Egypt in January 2008, accord-
ing to data from the Central Agency for Public Mobi-
lization and Statistics (CAPMAS). Studies point to the
negative impact on the educational process of these
massive immigrations into peri-urban Cairo, which is
clearly reflected in the education index.4
Disparities Between Lower and Upper Egypt Governorates
Urban governorates have again achieved the highest
level in human development at 0.794 in the EHDR
2010 compared to Lower Egypt governorates at
0.734, Upper Egypt governorates at 0.708, Frontier
Governorates at 0.753 and of course the national level
as a whole at 0.731.
However, when tracking the increase achieved in HDI,
it can be seen that the governorates of Upper Egypt
have achieved the largest increase, which amounted
to 0.247 units. In fact, they have achieved the larg-
est increase in all three indexes of income, education
and life expectancy, which amounted to 0.445, 0.192,
0.103 units, respectively (Table 2.3).
Furthermore, the increase achieved by Upper Egypt
governorates in the education index has exceeded the
Figure 2.1: Evolution of the Human Development Index
Figure 2.2: Evolution of Sub-Indexes of the Human Development Index in Various Reports
unemployed persons who obtained an intermediate
qualification reached 62.4% of the total unemployed
persons in 2007, and this may push large numbers
to drop out after the preparatory grade, and as evi-
denced in the enrollment in secondary education,
which reached 46.1% in 2007/2008.
Ranking of Governorates in Human Development
Tracking the level of HD achieved in different gover-
norates since 2005, five governorates occupied the
first five rankings in HD level, namely Port Said, Suez,
Cairo, Alexandria and Damietta, while the governor-
ates that occupied the bottom five ranks are Fayoum,
Assiut, Menia, Beni Suef and Suhag.
EHDR 2010 records changes in the ranking of gov-
ernorates. Cairo has dropped out and Ismailia has
entered the top five, whereas Qena has joined the bot-
tom group.
The entry of Ismailia into the top five governorates
is so for the first time since the 1995 report. Ismailia
now ranks fifth with a rise of 0.025 in its human devel-
opment index in EHDR 2010 compared to EHDR
2008. The exit of Cairo from the group is related to
the modest increase of 0.006 in its value of HDI over
the two year interval (2008-2010). Analysis of the
three sub-indexes shows continuation of the lowest
five governorates group in the HD level. There is very
little movement in ranking within the bottom five
group, although the increase in the value of the HDI
is significant — no less than the increase achieved by
the top group — and is higher in some cases. Analysis
1995
1996
1997
/98
1998
/99
2000
/01
2003
2004
2005
2008
2010
1
0.8
0.6
0.4
0.2
0
0.520.58 0.63 0.64 0.65 0.6 0.68 0.68 0.72 0.73
1995
1996
1997
/98
1998
/99
2000
/01
2003
2004
2005
2008
2010
1
0.8
0.6
0.4
0.2
0
Life Expectancy Education Income Index
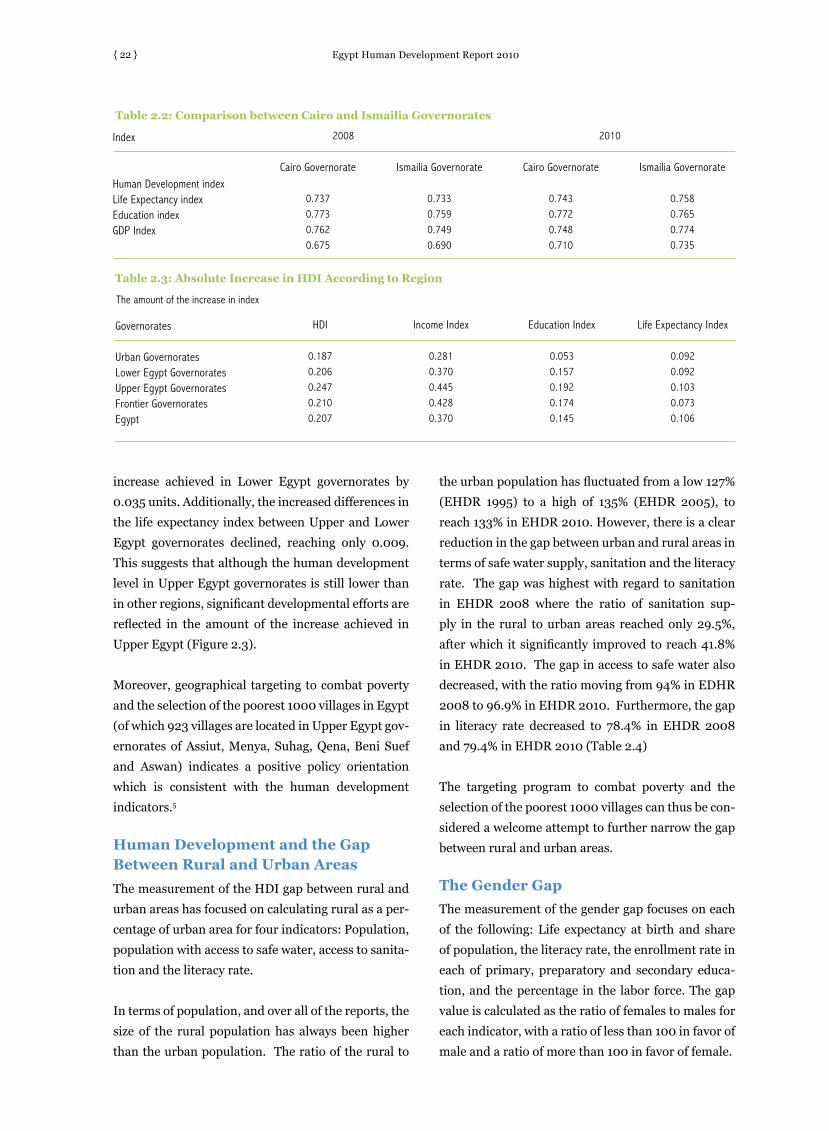
Egypt Human Development Report 2010{ 22 }
increase achieved in Lower Egypt governorates by
0.035 units. Additionally, the increased differences in
the life expectancy index between Upper and Lower
Egypt governorates declined, reaching only 0.009.
This suggests that although the human development
level in Upper Egypt governorates is still lower than
in other regions, significant developmental efforts are
reflected in the amount of the increase achieved in
Upper Egypt (Figure 2.3).
Moreover, geographical targeting to combat poverty
and the selection of the poorest 1000 villages in Egypt
(of which 923 villages are located in Upper Egypt gov-
ernorates of Assiut, Menya, Suhag, Qena, Beni Suef
and Aswan) indicates a positive policy orientation
which is consistent with the human development
indicators.5
Human Development and the Gap Between Rural and Urban Areas
The measurement of the HDI gap between rural and
urban areas has focused on calculating rural as a per-
centage of urban area for four indicators: Population,
population with access to safe water, access to sanita-
tion and the literacy rate.
In terms of population, and over all of the reports, the
size of the rural population has always been higher
than the urban population. The ratio of the rural to
Table 2.2: Comparison between Cairo and Ismailia Governorates
Cairo Governorate
0.7370.7730.7620.675
Ismailia Governorate
0.7330.7590.7490.690
Cairo Governorate
0.7430.7720.7480.710
Ismailia Governorate
0.7580.7650.7740.735
Index
Human Development indexLife Expectancy indexEducation indexGDP Index
2008 2010
Table 2.3: Absolute Increase in HDI According to Region
HDI
0.1870.2060.2470.2100.207
Income Index
0.2810.3700.4450.4280.370
Education Index
0.0530.1570.1920.1740.145
Life Expectancy Index
0.0920.0920.1030.0730.106
Governorates
Urban GovernoratesLower Egypt GovernoratesUpper Egypt GovernoratesFrontier GovernoratesEgypt
The amount of the increase in index
the urban population has fluctuated from a low 127%
(EHDR 1995) to a high of 135% (EHDR 2005), to
reach 133% in EHDR 2010. However, there is a clear
reduction in the gap between urban and rural areas in
terms of safe water supply, sanitation and the literacy
rate. The gap was highest with regard to sanitation
in EHDR 2008 where the ratio of sanitation sup-
ply in the rural to urban areas reached only 29.5%,
after which it significantly improved to reach 41.8%
in EHDR 2010. The gap in access to safe water also
decreased, with the ratio moving from 94% in EDHR
2008 to 96.9% in EHDR 2010. Furthermore, the gap
in literacy rate decreased to 78.4% in EHDR 2008
and 79.4% in EHDR 2010 (Table 2.4)
The targeting program to combat poverty and the
selection of the poorest 1000 villages can thus be con-
sidered a welcome attempt to further narrow the gap
between rural and urban areas.
The Gender Gap
The measurement of the gender gap focuses on each
of the following: Life expectancy at birth and share
of population, the literacy rate, the enrollment rate in
each of primary, preparatory and secondary educa-
tion, and the percentage in the labor force. The gap
value is calculated as the ratio of females to males for
each indicator, with a ratio of less than 100 in favor of
male and a ratio of more than 100 in favor of female.
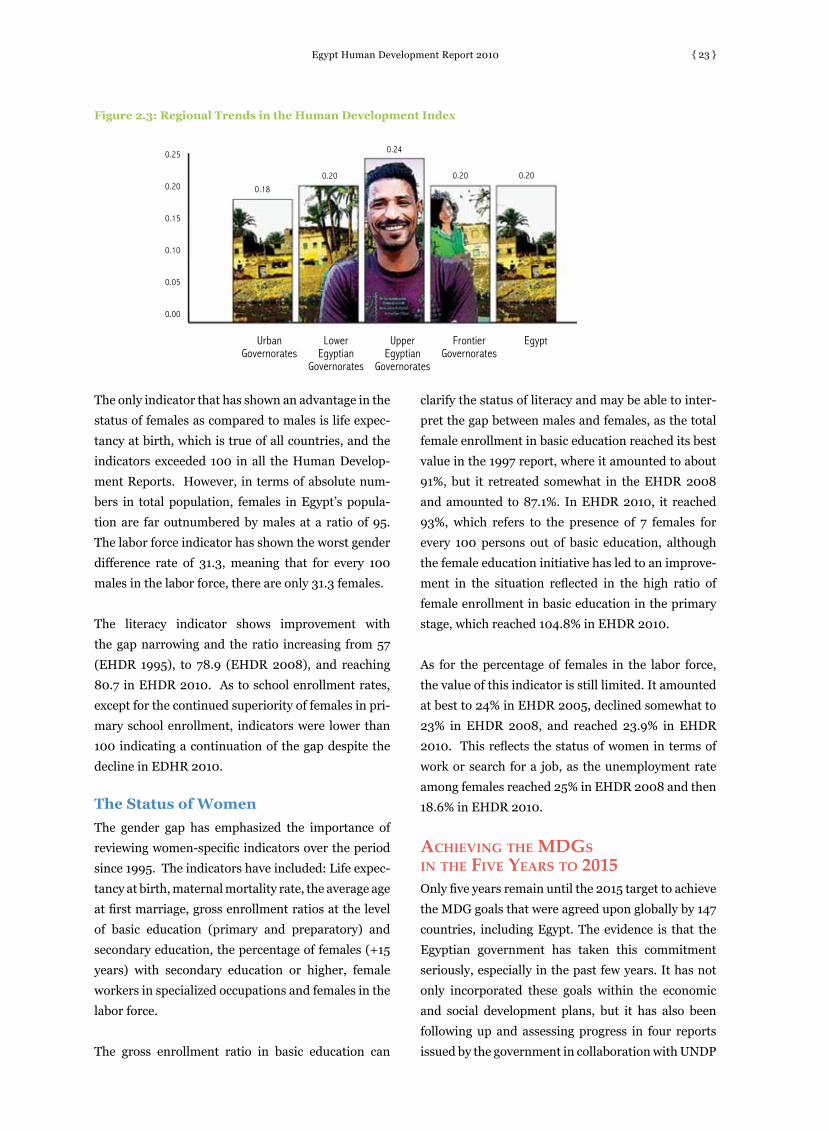
Egypt Human Development Report 2010 { 23 }
clarify the status of literacy and may be able to inter-
pret the gap between males and females, as the total
female enrollment in basic education reached its best
value in the 1997 report, where it amounted to about
91%, but it retreated somewhat in the EHDR 2008
and amounted to 87.1%. In EHDR 2010, it reached
93%, which refers to the presence of 7 females for
every 100 persons out of basic education, although
the female education initiative has led to an improve-
ment in the situation reflected in the high ratio of
female enrollment in basic education in the primary
stage, which reached 104.8% in EHDR 2010.
As for the percentage of females in the labor force,
the value of this indicator is still limited. It amounted
at best to 24% in EHDR 2005, declined somewhat to
23% in EHDR 2008, and reached 23.9% in EHDR
2010. This reflects the status of women in terms of
work or search for a job, as the unemployment rate
among females reached 25% in EHDR 2008 and then
18.6% in EHDR 2010.
achieving the MDgs in the five years to 2015Only five years remain until the 2015 target to achieve
the MDG goals that were agreed upon globally by 147
countries, including Egypt. The evidence is that the
Egyptian government has taken this commitment
seriously, especially in the past few years. It has not
only incorporated these goals within the economic
and social development plans, but it has also been
following up and assessing progress in four reports
issued by the government in collaboration with UNDP
The only indicator that has shown an advantage in the
status of females as compared to males is life expec-
tancy at birth, which is true of all countries, and the
indicators exceeded 100 in all the Human Develop-
ment Reports. However, in terms of absolute num-
bers in total population, females in Egypt’s popula-
tion are far outnumbered by males at a ratio of 95.
The labor force indicator has shown the worst gender
difference rate of 31.3, meaning that for every 100
males in the labor force, there are only 31.3 females.
The literacy indicator shows improvement with
the gap narrowing and the ratio increasing from 57
(EHDR 1995), to 78.9 (EHDR 2008), and reaching
80.7 in EHDR 2010. As to school enrollment rates,
except for the continued superiority of females in pri-
mary school enrollment, indicators were lower than
100 indicating a continuation of the gap despite the
decline in EDHR 2010.
The Status of Women
The gender gap has emphasized the importance of
reviewing women-specific indicators over the period
since 1995. The indicators have included: Life expec-
tancy at birth, maternal mortality rate, the average age
at first marriage, gross enrollment ratios at the level
of basic education (primary and preparatory) and
secondary education, the percentage of females (+15
years) with secondary education or higher, female
workers in specialized occupations and females in the
labor force.
The gross enrollment ratio in basic education can
Urban Governorates
Lower Egyptian
Governorates
Upper Egyptian
Governorates
Frontier Governorates
Egypt
0.25
0.20
0.15
0.10
0.05
0.00
Figure 2.3: Regional Trends in the Human Development Index
0.18
0.20
0.24
0.20 0.20

Egypt Human Development Report 2010{ 24 }
over the past decade.
Although Egypt seems to be moving in the right
direction, some of the goals remain out of reach and
some of the governorates and territories still suffer
from a significant disparity in the degree of progress
achieved. In addition, the global economic crisis has
imposed new challenges that may hinder or deceler-
ate achievement in the agreed timeframe. Further,
these challenges represent the minimum level to be
achieved. It is necessary not only to achieve this low
ceiling of ambition but also to seek raising this ceil-
ing, commensurate with Egypt’s circumstances and
capabilities.
This section aims at briefly highlighting the size of
achievement in accomplishing the development goals
as reflected by the latest data and the available follow-
up reports, but also concentrates on the tasks to be
addressed. It pays attention to the global economic
crisis and the challenges that this imposes by suggest-
ing a number of areas in which youth can participate
to overcome obstacles and accelerate the achieve-
ment of the desired goals within the deadline.
Ten Years of Work on MDG Targets
A number of key messages supported by figures and
facts reveal the size of achievement towards meeting
MDG goals made during the past years.6
Goal One: Eradicating Extreme Poverty and Hunger
Egypt’s commitment toward mitigating the severity
of poverty is represented in the explicit recognition
to reduce poverty to 15% by 2011/2012 in the Sixth
Five-Year Plan for Economic and Social Development
(2007- 2012). This goal is based on national poverty
lines, taking into account that Egypt has already ful-
filled its international commitment toward reducing
extreme poverty (at the rate of $1 per day) by half.
There is a clear commitment from the Government
of Egypt toward reducing regional disparities in pov-
erty rates and living standards. This is with particular
regard to Upper Egypt, identified by the last economic
and social development plans as a core priority, given
that it is the most deprived area in Egypt. One third
of total public investment has been allocated over the
past decade to Upper Egypt, and this has reflected
positively in narrowing the gap in economic and
social development indicators between Upper Egypt
and the rest of the Republic’s territories.
Moreover, a ‘Poverty Map’ was developed to iden-
tify the neediest regions and groups, and based on
this the “Geographical Targeting” and “Supporting
the Most Vulnerable Households” programs were
implemented. These programs target the villages and
households suffering most from poverty across Egypt,
using a processing method that allows both integra-
tion and empowerment because of its reliance on the
redistribution of resources, public expenditure, and
political interventions to reach the neediest catego-
Table 2.4: Gap between Urban and Rural Areas
Report
Population Safe Water Sanitation Literacy Rate
1995
127635955
1995
127635955
97/1998
13473.2
7362.5
2000/01
13576.790.363.7
2003
13384.278.567.6
2004
13584.278.567.7
2005
14084.278.567.7
2008
13594
29.578.4
2010
13396.941.879.4
(Rural area as percent of urban area)
Figure 2.4: Gap between Males and Females over Different Reports
(Females as % of Males)
1995
1996
1997
/98
1998
/99
2000
/01
2003
2004
2005
2008
2010
100.0
80.0
60.0
40.0
20.0
The Percentage in the LaborLiteracy

Egypt Human Development Report 2010 { 25 }
for both males and females during the last few years,
but rates of enrollment and dropout remain quite high
in certain areas and in specific groups; this is in spite
of intensive efforts directed to these areas and groups.
However, it can be expected that almost all children
of primary school-age will be enrolled by 2015.
Egypt is moving towards completely eliminating illit-
eracy among the 15-24 age group. This improvement
primarily reflects the progress achieved in school
enrollment. However, about 30% of the population
in the 15+ age bracket was illiterate in 2007, which
constitutes a serious challenge that requires new stra-
tegic directions.
Goal Three: Promote Gender Equality and Empower Women
Egypt has put the issue of woman’s empowerment at
the top of its priorities during the past decade, through
institutional arrangements and legislative changes. In
addition, a large number of initiatives and procedures
have been initiated, the latest of which is a quota for
women to participate in the People’s Assembly.
There are still significant challenges. The three fronts
–political, economic and social participation — which
have been the focus of the MDGs still call for intensi-
fied efforts and procedures.
On the education front, Egypt has already achieved
the Millennium Development Goals with respect to
the enrollment of girls in general secondary educa-
tion and it is on its way to achieve the same goal in
primary education. However, technical education for
girls remains a real challenge, as this sector absorbs
about 70% of students, with a percentage of females
to males of 85%. This ratio is concentrated mainly in
the commercial and agricultural sections, which are
less competitive in the labor market.
The low quality of technical education is a fact, and
the current reform efforts need to recognize clearly
the specificity of female enrollment in this educa-
tional sector. Political and economic participation of
women do not show any signs of progress, as these
two fronts need a greater prioritization and the for-
mulation of further strategies supported by a detailed
ries and the poorest regions.
The upward trend of the poverty rate during the
period 2000-2005 was reversed as a result of the
slowdown of economic growth during this period,
but became a downward trend in the period 2005-
2008 as a result of the economic boom witnessed by
Egypt at this time. However, the preliminary analysis
of the results of the national Income and Expenditure
Survey, conducted in 2008/2009, indicate a return
of the upward trend in the poverty rate during 2009
as a direct result of the global economic crisis. This
was accompanied by a decline in rates of investment,
employment and economic growth. It confirms that
poverty in Egypt is linked to economic performance,
and this calls for intensified efforts to bring back eco-
nomic growth to the higher levels that prevailed dur-
ing the three years preceding the global crisis.
Unemployment rates decreased slightly during the
period 2005-2008, but rebounded in 2009 as a result
of the global economic crisis. There are still serious
challenges, especially with regard to full productive
employment, particularly in respect of women and
young people. Further, the private sector still suf-
fers from the widening gap between the demand for
skilled labor and the provision of unskilled labor, as
well as the spread of the informal sector.
The significant differences between children who are
underweight across different governorates is a cause
for some anxiety, as the ratio of children under five
years who are classified as underweight ranges from
16% in Assiut (Upper Egypt) to 1.2% in South Sinai
(Frontier governorate). This gap requires a swift reso-
lution if Egypt is to achieve the MDG target.
There is still a need for specific policies and strategies
to reduce poverty, as this reflects on the economy and
on social cohesion. There is also a need for economic
policy outcomes of political choices to focus on eco-
nomic sectors in which the poor work and from which
they benefit.
Goal Two: Achieving Universal Primary Education
Educational enrollment has improved significantly
Egypt Human Development Report 2010{ 26 }
working program and steps for implementation.
Goal Four: Reduce Child Mortality
Egypt’s attempt to reduce the child mortality rate has
achieved real gains and the Government of Egypt is
moving toward accomplishing the objectives of the
MDG target.
However, the disparity in living standards between
different social groups and geographical areas, and
hence in the rate of child mortality, still represents
a real challenge. Among the health challenges are
reducing the high infant mortality rate where this
manifests itself, and developing a comprehensive
national program for vaccines and combating the
spread of diseases among children, especially with
regard diarrheal and acute respiratory infections.
Goal Five: Improve Maternal Health
Egypt’s commitment towards improving maternal
health, in addition to its many national programs,
have translated into a large and impressive reduction
in the rate of maternal mortality ratios and in a higher
proportion of births attended by skilled personnel.
However, the accuracy of measures needs confirma-
tion given the significant and speedy decline in the
rate of maternal mortality on the one hand, and the
existence of a gap between the official data and the
data obtained from the national Demographic Health
Survey (DHS) on the other.
Regional disparities in all the available measures for
maternal and reproductive health, especially in rural
Upper Egypt, require more effective targeting.
The additional and significant gains that have been
achieved with regard to women’s health can materi-
alize through the adoption of a “reproductive health
model.” This model would include a strong gender
component for the social and qualitative determi-
nants, in addition to a broader definition of reproduc-
tive health challenges.
Goal Six: Combat HIV/AIDS, Malaria and Other Diseases
Egypt is taking major steps towards achieving this
goal. It has begun the battle against AIDS since the
appearance of the first case in the country and it has
succeeded in controlling malaria and reduced the inci-
dence of tuberculosis and schistosomiasis. Despite
these achievements, Egypt should take steps to avoid
the risk of facing a turning point from a low to higher
level of the HIV epidemic. The infection is not limited
to high-risk groups, but exists also in the productive
age group, and a relatively high share of females suf-
fers from the risk of this disease. Moreover, Hepatitis
B and C represent a serious health threat in Egypt.
The Ministry of Health and Population has developed
preventive and remedial programs for all major dis-
eases. Egypt is also seeking the reform of the health
insurance system. The challenge that needs to be

Egypt Human Development Report 2010 { 27 }
for the attainment of the Millennium Development
Goals in Egypt and within the specified timeframe. It is
expected that the decline of investment rates and eco-
nomic growth, the shrinking of global demand and the
increase in unemployment rates and the budget defi-
cit will have a negative impact on achieving the goals
of reducing poverty, hunger and disease, promoting
equality, improving the environment and strengthen-
ing the global partnership for development.
Egypt has pursued an expansionary fiscal and mon-
etary policy during the last period to reduce the nega-
tive effects of the global crisis on the operational
objectives and on eradicating poverty in particular.
As a result, public expenditure has been increased by
about LE 15 billion. Most of this amount was directed
to investment projects in the infrastructure and social
development areas (education, health, social secu-
rity), which are characterized by the intensive use of
labor, in order to achieve a dual goal: Stimulating
domestic demand and limiting rising unemployment
and poverty rates. Monetary policies to reduce inter-
est rates and encourage domestic credit have mainly
targeted the promotion of investment and thus main-
tain acceptable rates of achievement with regard to
the goals of reducing poverty, hunger, unemploy-
ment, as well as other development objectives.
Despite the conditions brought on by the crisis, the pro-
vision of subsidies, grants and social benefits in Egypt
have increased from about L.E. 92.4 billion in June
2008 to L.E.126.8 billion in June 2009, an increase of
nearly 37%. Further, the volume of expenditure on the
wages and compensation of employees increased by
about 20% and amounted to L.E.75.2 billion during the
fiscal year 2008/2009, compared to L.E. 62.8 billion in
the previous year. The increase in the subsidy of sup-
ply commodities has amounted to about 28%, its value
reaching about L.E.21 billion in the year of the crisis
against L.E.16.4 billion in 2007/2008. Thus, the aver-
age subsidy per capita has risen from about L.E.220 to
L.E.276 in the two years respectively, according to the
Ministry of Economic Development in 2009.
The expansionary economic policies on one hand
and the social protection policies on the other hand
were reflected in the maintenance of high rates of
addressed is the excessive burden incurred by the
Ministry in the treatment of those who need health
care in addition to the responsibility for formulating
a multi-sectoral and integrated health policy in order
to address health within a social context.
Goal Seven: Ensure Environmental Sustainability
Ensuring environmental sustainability in Egypt still
represents a major challenge despite government
policies and increased investment in protection mea-
sures. The main challenges are the need to reduce the
rate of population growth with its negative impact on
the environment, improving the level of monitoring
and/or managing the increasing demand on natural
resources, and addressing the challenges of climate
change and water shortages.
Goal Eight: Develop a Global Partnership for Development
The focus here is on the progress achieved in global
commitments towards providing better aid assistance
and a more equitable basis for trade and debt relief.
This goal largely determines the success achieved
with regard to the first seven MDGs by 2015. Dur-
ing the past few years, Egypt witnessed growing offi-
cial developmental assistance from a variety of rich
countries and international organizations, which aim
at meeting the development needs of different sec-
tors. Moreover, Egypt has benefited from a number
of bilateral and multilateral trade agreements, and
the share of exports of goods and services in Egypt’s
GDP increased over the years. Egypt’s foreign debts
witnessed stable movement during the past few years,
with a decline of the ratio of debt interests to exports
of goods and services.
The ICT sector in Egypt has seen rapid growth during
the past years, especially with the increase of invest-
ments directed to it, leading to the availability of more
landlines and mobile lines and to the increased use of
personal computers and access to the Internet.
Additional Challenges to Achieve the MDGS
The global financial and economic crisis that began in
the last quarter of 2008 has imposed new challenges

Egypt Human Development Report 2010{ 28 }
domestic demand (the consumption expenditure in
particular) and in achieving an economic growth rate
that has exceeded the expectations at 4.7%. This has
eventually minimized the social damage of the crisis,
especially at the levels of living standards, education,
health and other areas related to achieving the Mil-
lennium Development Goals.
However, this did not prevent the contraction of
employment opportunities generated, which reached
600 thousand employment opportunities during
2008/2009 compared to 690 thousand jobs during
the previous year and about 750 thousand jobs tar-
geted by the Presidential electoral program. This has
led to an increase in the unemployed at an unem-
ployment rate - according to the official estimates
– by a full percentage point (from 8.4% to 9.4%)
during the last two years, respectively, according to
statistics from the Ministry of Economic Develop-
ment in 2009.
Furthermore, the findings of the preliminary analy-
sis of the Income and Expenditure and Consumption
Survey conducted in 2008/2009, refer to a return of
the upward trend in the poverty rate during the last
year after it had been declining before the global cri-
sis. There is no doubt that the continuation of the cri-
sis for a longer period will have a profound and nega-
tive impact on the potential of achieving the Millen-
nium Development Goals in the specified timeframe,
not only in Egypt but in other developing countries
as well.
youth: acceLerating achieveMent on the MDgs
Although youth in the 18-29 year age group constitute
nearly a quarter of Egypt’s population, all evidence
confirms that this human capital is still unexploited
at the optimal level. It is important, as a first step,
to create an appropriate framework as a catalyst for
the participation of youth in the development and
implementation of strategies that support the MDGs.
Youth, of course, are not just objects of public policy
but agents in their own right to achieve MDG targets.
In this respect, government must create and imple-
ment a strategy that would mobilize young Egyp-
tians, either via new forums or by taking advantage
of youth organizations already in place. The need is to
hear their point of view in the stages of planning and
policy development, and enhance their participation
on a larger scale in the various stages of implemen-
tation, monitoring and evaluation. This is no easy
task in a traditional and paternalistic society, since a
necessary precondition is to value them as indepen-
dent and dynamic young adults capable of new and
fresh ideas. Under present and restrictive conditions,
engaging youth would require what amounts to a par-
adigm shift in attitudes as well as concrete proposals
and plans to solicit their inclusion.
Nevertheless, there are signs that there is recognition
in government circles and political parties of the need
to include young people in the processes of planning
and implementation. In Egypt, and under conditions
where civil society has become increasingly active
and vocal, young people can begin to hope to join the
body politic and contribute to the MDGs in a number
of preliminary ways, with great expectations that this
space will become larger with time.
Eradicating Extreme Poverty
A major step forward would be to promote the
involvement of young people and youth organizations
in identifying problems, monitoring and evaluating
solutions via interviews and group discussions, with
the participation of local community leaders.
Organized youth initiatives could support the devel-
opment programs and plans for the 1000+ poor vil-
lages adopted recently by the government to combat
poverty and to shore up the most vulnerable house-
holds in these villages. Focus could be on awareness
campaigns covering key MDG areas such as health,
hygiene and environmental protection. Volunteer
work towards literacy programs or the skill prepa-
ration required in the competitive job market out-
side the agriculture sector is another possibility, as
is training in agricultural technologies, to raise the
volume of agricultural production. For urban areas,
information centers in poor districts and managed by
youth could mobilize and activate participation in the
development of their communities; this experience
has had success in India.

Egypt Human Development Report 2010 { 29 }
tals and clinics. This form of contribution is rare to
non-existent in Egypt and would require an aware-
ness and recruitment campaign. However, they can
be educated on and spread awareness of sexual and
reproductive health issues, for example. Young mar-
ried women need to learn how to access their best
reproductive options. Some challenges in the prevail-
ing culture encourage early marriage and early preg-
nancy and the absence of a sufficient spacing period
between one pregnancy and the other. Information
and services to married and unmarried youth alike
would offer care and guidance during pregnancy and
childbirth.
Combating HIV and Serious Diseases
Young people can participate in awareness cam-
paigns to their peers by visiting schools, clubs and
youth centers, places of worship and other assembly
points, following short training on the seriousness of
these diseases and their prevention. The necessity of
providing information to young people about avail-
able health services and preventive health includes
medical aspects on how to reduce the risk of infec-
tion, as well as providing resources to young people
to mobilize efforts.
Ensuring Enviromental Sustainability
Policy-makers can consult young people when devel-
oping local and national policies on the environ-
ment because of their ability to generate new ideas.
Officials can build and support cooperation between
youth organizations that aim at promoting sustain-
able environmental development, and they can pro-
vide incentives such as grants to young people that
operate projects to support this. Awareness of the
impact of personal behavior and consumer options
on the environment begins in schools, which supports
a sense of individual responsibility for protecting the
environment.
Developing a Global Partnership for Development
The opportunities for global partnerships are avail-
able and in application. Bilateral and multilateral
trade agreements bring governments and businesses
together across the world. International aid and donor
agencies provide openings to the global environment.
Non-traditional initiatives can reduce unemployment,
thereby reducing poverty among young people, and
the following actions are proposed: 7 Creating a mech-
anism to monitor the needs of the labor market and
publicize them; establishing centers for recruitment
of young people and providing them with vocational
training in collaboration with government, employers
and non-government organizations; providing credit
at low interest rates to finance enterprises by young
people; offering the necessary finance to improve the
educational level of the unemployed persons in the
framework of informal education programs.
Achieving Universal Primary Education
Young people can help in achieving the goal of uni-
versal primary education in their spare time by imple-
menting educational projects for children at primary
school age but not enrolled in schools. A prominent
example is the ‘Achievement’ program, where private-
sector employees devote ten hours of their time to
teach underprivileged youth. This initiative can be
extended to youth groups and NGOs.
Promote Gender Equality and Empower Women
Young people can contribute to reduce gender dis-
parity in primary and secondary education by rais-
ing awareness. Young people could also participate in
the empowerment of girls through youth association
training in community participation and leadership
to activate women’s role in the community and by
creating channels for their formal participation, such
as representation in student unions or the youth wing
of political parties. Support, however, is needed from
governments and civil society to young women lead-
ers in assessing local needs and implementing suc-
cessful projects.
Reducing Child Mortality and Improving Reproductive Health
Young people are able to design and implement pro-
grams that are consistent with the needs of society,
such as vaccination campaigns and raising awareness
in the area of neonatal and infant hygiene. Young
people can help in non-specialized areas of health
care services, through voluntary work in hospi-

Egypt Human Development Report 2010{ 30 }
diture and public investment has declined. Hence,
there is a need for new methods and mechanisms
to geographically target the poor, especially in rural
areas and villages.
The Poverty Map in Egypt
The Ministry of Economic Development, in col-
laboration with the World Bank, issued its Poverty
Assessment Report in Egypt in mid-2007. This report
included a presentation of a ‘Poverty Map’ in Egypt.
It provides detailed information about the determi-
nants behind the low standard of living and high rate
of poverty, in addition to related indicators at the
smallest administrative local unit (village and dis-
trict). The map can help combat poverty and raise the
efficiency of public expenditure through the accurate
targeting of poor areas and by identifying their actual
needs as well as reducing the leakage of benefits to
the non-poor.
To estimate poverty at the village level, about 37
indicators have been used. Each one reflects one or
more of the economic and social dimensions related
to poverty and the standard of living. The poverty
dimensions include indicators on education (literacy
rate, enrollment rates), on employment (unemploy-
ment rates, the percentage of permanent workers, of
casual workers, of temporary workers, the participa-
tion rate in the labor market), on utilities (the per-
centage of houses connected to a safe water network,
connection to a sanitation network, to an electricity
network), as well as demographic indicators (average
family size, dependency ratio). All governorates were
covered except the Frontier governorates, which were
excluded from the poverty map due to their low popu-
lation density.
The most important outcome of the poverty map has
been the identification of the 1000+ poorest villages
in Egypt and the setting of the basis for targeting poor
households to eliminate extreme poverty.
What the poverty map shows is that more than one
million poor households live in the 1000+ villages,
at a total of about 5 million people, representing
about 46% of the total population of these villages.
The number of poor in these villages represents
These could become even more impactful through
annual events targeted at youth to clarify their plans
and visions and introduce new technologies and
management skills to a wider audience. Exchange
programs for young students could foster increased
dialogue between cultures and civilization and the
spread of information and communication technolo-
gies allow the world to become available at youth’s
fingertips. They bolster internal communications on
markets, as well as present external trade opportuni-
ties, and they foster international friendship through
blogs and email. Moreover, they provide further edu-
cational opportunities online via world class institu-
tions. And mobile telephony reduces isolation and
bridges the communication gap between rural and
urban, national and international.
the Poverty MaP anD the Poorest 1000+ viLLages PrograM
The Government of Egypt (GOE) is committed to
the reduction of the poverty burden through inte-
grated development, to empower the poor and most
needy categories and to contribute to their economic
and social development, in addition to raising their
standard of living. In order to achieve this ambitious
goal, the government has used more than one mecha-
nism or method of targeting (that is, directing public
resources towards a particular set of social groups to
achieve specific goals of development policy). Some-
times it has resorted to targeting with its broad mean-
ing, i.e. providing the services or social benefits for
all the people, without specifying a particular group
as beneficiary, which is the case with supporting the
health and education services. It has also occasionally
resorted to a kind of narrower targeting, limited until
recently to self-targeting in the program of subsidized
bread and the direct targeting of subsidized supply
commodities.
The observed reality indicates that all of these mecha-
nisms have significant disadvantages that have pre-
vented complete success in targeting at the lowest
possible financial cost; leakages are high and subsi-
dies or other social benefits also reach the non-poor.
There is also the high financial cost of implementa-
tion. As a result, the effectiveness of these programs
has been reduced and the efficiency of public expen-
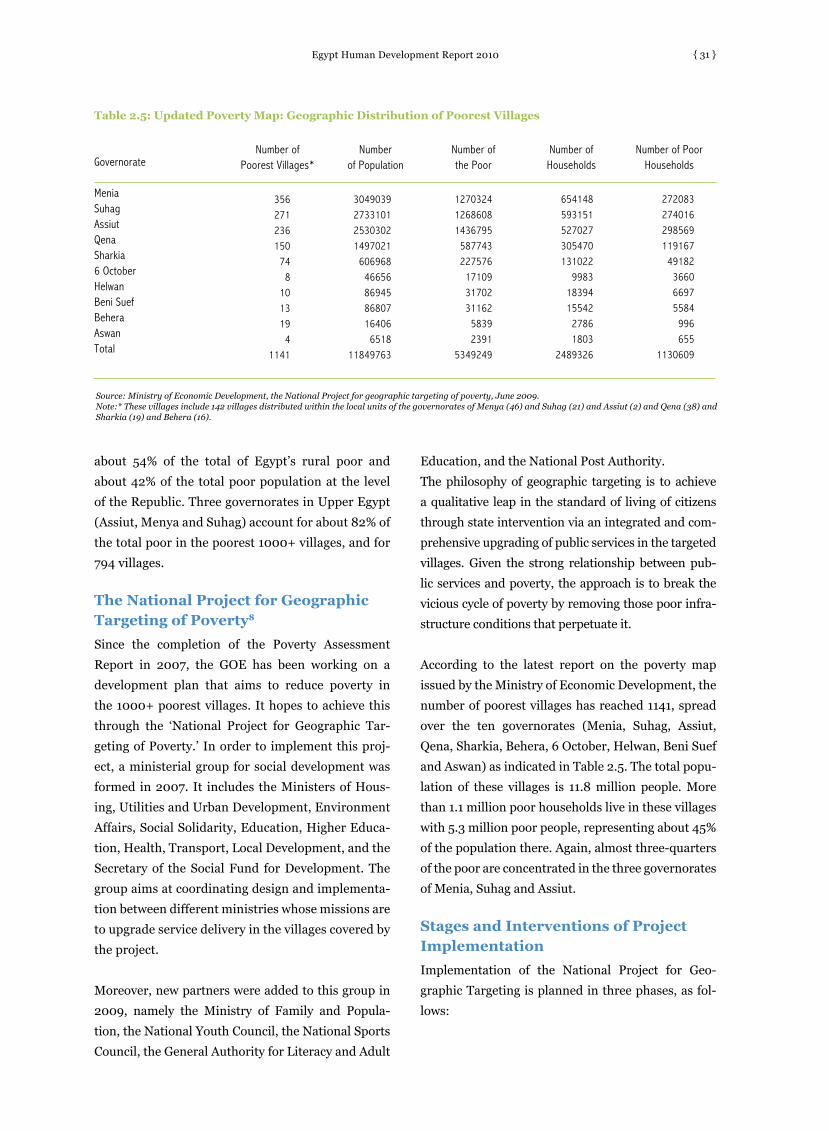
Egypt Human Development Report 2010 { 31 }
Education, and the National Post Authority.
The philosophy of geographic targeting is to achieve
a qualitative leap in the standard of living of citizens
through state intervention via an integrated and com-
prehensive upgrading of public services in the targeted
villages. Given the strong relationship between pub-
lic services and poverty, the approach is to break the
vicious cycle of poverty by removing those poor infra-
structure conditions that perpetuate it.
According to the latest report on the poverty map
issued by the Ministry of Economic Development, the
number of poorest villages has reached 1141, spread
over the ten governorates (Menia, Suhag, Assiut,
Qena, Sharkia, Behera, 6 October, Helwan, Beni Suef
and Aswan) as indicated in Table 2.5. The total popu-
lation of these villages is 11.8 million people. More
than 1.1 million poor households live in these villages
with 5.3 million poor people, representing about 45%
of the population there. Again, almost three-quarters
of the poor are concentrated in the three governorates
of Menia, Suhag and Assiut.
Stages and Interventions of Project Implementation
Implementation of the National Project for Geo-
graphic Targeting is planned in three phases, as fol-
lows:
about 54% of the total of Egypt’s rural poor and
about 42% of the total poor population at the level
of the Republic. Three governorates in Upper Egypt
(Assiut, Menya and Suhag) account for about 82% of
the total poor in the poorest 1000+ villages, and for
794 villages.
The National Project for Geographic Targeting of Poverty8
Since the completion of the Poverty Assessment
Report in 2007, the GOE has been working on a
development plan that aims to reduce poverty in
the 1000+ poorest villages. It hopes to achieve this
through the ‘National Project for Geographic Tar-
geting of Poverty.’ In order to implement this proj-
ect, a ministerial group for social development was
formed in 2007. It includes the Ministers of Hous-
ing, Utilities and Urban Development, Environment
Affairs, Social Solidarity, Education, Higher Educa-
tion, Health, Transport, Local Development, and the
Secretary of the Social Fund for Development. The
group aims at coordinating design and implementa-
tion between different ministries whose missions are
to upgrade service delivery in the villages covered by
the project.
Moreover, new partners were added to this group in
2009, namely the Ministry of Family and Popula-
tion, the National Youth Council, the National Sports
Council, the General Authority for Literacy and Adult
Source: Ministry of Economic Development, the National Project for geographic targeting of poverty, June 2009. Note:* These villages include 142 villages distributed within the local units of the governorates of Menya (46) and Suhag (21) and Assiut (2) and Qena (38) and Sharkia (19) and Behera (16).
Table 2.5: Updated Poverty Map: Geographic Distribution of Poorest Villages
356271236150
748
101319
41141
3049039273310125303021497021
60696846656869458680716406
651811849763
127032412686081436795
587743227576
171093170231162
58392391
5349249
654148593151527027305470131022
99831839415542
27861803
2489326
272083274016298569119167
49182366066975584
996655
1130609
Governorate
MeniaSuhagAssiutQenaSharkia6 OctoberHelwanBeni SuefBeheraAswanTotal
Number of Poorest Villages*
Number of Population
Number of the Poor
Number of Households
Number of Poor Households

Egypt Human Development Report 2010{ 32 }
First Phase: The development of 151 villages, followed by 750 hamlets.
These villages include nearly 1.5 million people
and are located in 24 local units (between 3-5 vil-
lages in each local unit) spread across six governor-
ates (Menya, Assiut, Suhag and Qena, Sharkia and
Behera). Implementation of this stage will take 3
years. The development of these villages is carried out
through 14 developmental interventions which are:
• Activating the participation of civil society
organizations in every local unit to assist in the
implementation of housing and waste recycling
projects;
• Providing beneficiary households at a rate of 20
housing units for each village from within the
‘National Project for Housing’;
• Improving the drinking water and sanitation
services through the establishment or expansion
and renovation of water networks and stations,
lifting and processing stations for sanitation and
home connections;
• Developing an integrated system to deal with
the problems of collection and recycling of solid
waste, and the clearance of canals and drainage
canals;
• Establishing a fire fighting and civil defense cen-
ter and providing a fire truck in every local unit,
as well as training on the work of firefighting and
civil defense.
• Upgrading the health units, providing equipped
ambulances, organizing the medical convoys,
and providing qualified medical crews;
• Improving the quality of basic education by
developing or establishing new schools and
training teachers;
• Expanding the coverage of social security and
social services and providing a social worker for
every 50 to 70 households;
• Eliminating the illiteracy of the 15-35 years
age group by making the education faculties in
regional universities assume the task. This task
will involve preparing trainers and training
courses. The role of the Adult Literacy Author-
ity is to provide the classrooms, textbooks and
training assistance, and to conduct the exams.
• Providing employment opportunities for young
people by offering soft loans for small and micro
projects from the Ministry of Local Development
and the Social Fund for Development.
• Upgrading the services of youth and sports,
through the creation and development of youth
centers, sports arenas and stadiums, and the
provision of sports equipment, in addition to
upgrading summer camps for young people.
• Reinforcing the road networks, developing the
existing road network, and providing bench-
marks;
• Conducting managerial training for local cadres
and consolidating the concept of project main-
tenance;
• Urban planning through the development of new
urban boundaries for villages and hamlets, and
the redistribution of land use, in addition to con-
trolling the random urban sprawl, and improv-
ing the urban environment.
Second Phase: Developing another 912 villages.
These villages belong to 43 centers distributed over
four governorates (Menya, Assiut, Suhag and Qena).
The implementation of this phase will take three
years. This will be achieved through several main
interventions as follows:
• Activating the participation of civil society orga-
nizations to assist in the implementation of the
project;
• Paving and lighting the entrances to villages;
• Improving environmental conditions and deal-
ing with solid waste;
• Improving the health, paramedic and emergency
services;
• Enhancing the quality of basic education;
• Expanding the coverage of social security and
social services;
• Construction of houses for the most vulnerable
households at a rate of 20 houses per village; the
programs and projects during this stage will be
financed through the allocations provided for
in the state investment budget in collaboration
with civil society organizations, businessmen,
and the private sector.
• A pilot project in one village of each governor-
ate of Sharkia, Assiut and Behera will train youth
Egypt Human Development Report 2010 { 33 }
These indicators have been divided into three groups:
The first is related to the head of household (educa-
tion, work, the existence of insurance or a pension,
land ownership); the second belongs to housing data
(type of dwelling, number of rooms, the value of the
electricity bill and telephone, the ownership of a
washing machine/color TV/vacuum cleaner); and the
third is related to data on family members (the num-
ber of working individuals, the presence of an indi-
vidual in special education, the presence of a sick or
disabled person).
Households are classified according to the degree of
poverty and into four groups in line with these crite-
ria, namely, the extremely poor, the poor, the near-
poor, and non-poor. Each group has specific charac-
teristics that determine the size and the quality of the
benefits that they will get. To illustrate the set of cri-
teria set, for example, the characteristics of extremely
poor households (in rural and urban areas) are:
• Family members are five or more (rural area),
and six or more (urban area);
• The percentage of working individuals is less
than 25%;
• Rooms per capita are less than 50%;
• Household head does not have social security;
• There is no private bathroom;
• The electricity bill is less than LE 15 (rural areas),
and less than LE 20 (urban areas);
• There is no landline telephone;
• The household does not live in an independent
apartment or a rural house built of red brick or
better (in rural areas);
• The head of the household does not have a per-
manent job or is illiterate (in urban areas).
In line with this project, the Ministry of Social Soli-
darity is in the process of reformulating the social ser-
vices and programs and activating the role of social
services centers in addition to maximizing the role of
social researchers in order to improve the effective-
ness of targeting.
Implementation Update
Overall, success or failure in applying programs for
the 1000+ poorest villages in Egypt will rest on the
ability of all parties to sustain the financial require-
on construction and building skills (carpentry,
plumbing) through training centers of the Cen-
tral Agency for Reconstruction.
Third Phase: Developing 78 villages in the governorates of Helwan, 6th October, Beni Suef and Aswan
The implementation of this phase will begin within
one year of the start of implementation of the second
phase.
National Project for Targeting Needy Households9
The State is now implementing, through the Ministry
of Social Solidarity, a national project in order to tar-
get more accurately the most vulnerable households
within poor areas. This project was launched during
2008 and the Ministry has set itself the following
goals:
• Determining the neediest households with
regard to social welfare;
• Identifying the needs of households which are
eligible for care and support;
• Monitoring the appropriateness of services pro-
vided by the State to meet these actual needs;
• Establishing a database of the neediest house-
holds with regard to social welfare;
• Developing social welfare policies and programs
in a way that suits the needs of households.
This project is based on two main types of interven-
tions, which are geographic and qualitative targeting,
in an effort to reach the most needy households.
Qualitative targeting was achieved through the design
of a standard digital socioeconomic model (one model
for rural areas and a second for urban areas) to iden-
tify and classify the levels of need of households. The
implementation of this model depends on preparing
a detailed and comprehensive map of each house-
hold condition (through social field research) and
preparing a file for each household that determines
the human and financial capacity of the households
besides their livelihood needs. The measures rely on
a number of economic and social indicators of the
household which are strongly related to the level of
household expenditure.
Egypt Human Development Report 2010{ 34 }
ments necessary for this huge and ambitious project
in all its phases. It will also require a high degree of
coordination amongst all ministries and government
bodies involved.
A detailed presentation of the first phase of the proj-
ect and the executive position until June 2009 shows
that the estimated cost of the project during the first
phase amounts to about LE 4 billion, which will be
funded from the allocations provided for in the state
investment budget and distributed over the following
ministries and agencies: Housing, Health, Education,
Transport, Environment Affairs, Social Solidarity,
Local Development, Social Fund for Development,
the Adult Education Authority, the National Youth
Council, and the National Sports Council. The Min-
istry of Housing alone holds nearly 68% of the total
estimated cost for this phase. The average cost share
of each governorate varies according to the number
of (the poorest) villages that it includes and the pri-
orities of those villages’ needs from different services.
The allocations amount to LE 733, LE 552, LE 612,
LE 665, LE 837, and LE 467 million for each of the
governorates of Menia, Assiut, Suhag, Qena, Sharkia,
Behera, respectively; this is besides an additional
amount of LE 365 million which includes LE 160 mil-
lion to cover drains and LE 205 million as the cost of
buying land distributed over the governorates.
The implementation of the first phase of the project
started in October 2008, and it is planned to complete
this phase within two years starting from the financial
year 2009/2010. The executive position of various
ministries and agencies would show that the imple-
mentation of several projects in various domains is
completed during this phase. However, the problem
of land allocation in the targeted villages is still the
main obstacle to the implementation of various proj-
ects during this phase. It is expected that 158 proj-
ects in the first phase of the program in housing and
sanitation, health, education, environment, youth
and sports will be completed in 2009-2010, besides
commencement of work in about 350 additional proj-
ects, to be completed successively during the period
of implementation of the program.
Endnotes1 The poverty rates in the 2010 report relied on the results of Income and Expenditure survey 2008/ 2009.2 The final results of the General Census of Population and Establishments 2006 indicate that 10.4% of the population in
the 6-18 years-old age group has not enrolled in education and that 4.3% dropped out.3 Tobala, Zinat, Education and the Effect of Poverty, a series of research papers, Human Development Report in Egypt
1996, National Planning Institute and the United Nations Development Program.4 Institute of National Planning. “The Population Characteristics and the Implications of Social Values”, Planning and
Development Issues, No. 210.5 Ministry of Economic Development (2008). The Geographical Targeting Program to Combat Poverty: The Poorest
1000 villages in Egypt6 This section depends mainly on the results of the follow-up report of the implementation of theMillennium Development
Goals issued by the Ministry of Economic Development in collaboration with the United Nations Development Program 20087 UNDP, 20048 This section relies mainly on the National Project Report issued by the Ministry of Economic
Development, 2009.9 Musilhy, Aly (2009), Targeting to Raise Efficiency and Effectiveness. Paper submitted to the
Conference on Integrated Social Policies, Ministry of Social Solidarity, July, Cairo.
referencesInternational Labor Organization, 2009, The Financial and Economic Crisis: A Decent Work Response?, The International Institute
for Labor Studies (IILS), Geneva. Radwan, Samir, 2009, Responding to the Financial and Economic Crisis: The Case of Egypt, International Labor conference, 4 June
2009, ILO. United Nations ,2005,Youth and MDGs :Challenges and Opportunities for Implementation Prepared by Ad Hoc Working Group for
Youth and MDGs ,UN Program on Youth in the Department of Economics and Social Affair www.un.org/esa/socdev/unyin/documents/youthmdgs.pdf
World Bank, 2009, Averting a Human Crisis During the Global Downturn, Policy Options from the World Bank’s Human Development Network, Washington, DC.
World Bank, 2009, Global Economic Prospects, Washington, DC. World Bank, 2009, Global Monitoring Report, A Development Emergency, Washington, DC.

{ 35 }
Egypt’s demographic profile shows a pronounced “youth bulge” – a situation in which the proportion of youth in the popula-tion is significantly large in comparison to other age groups. The
2006 census data show that around 25% of the Egyptian population is between the ages of 18 and 29.1 This youth bulge is the result of a popu-lation increase in the 1980s followed by relative fertility decline.
This demographic profile represents both an opportunity and a challenge. Once
these young people reach their working age, their ratio to the older and younger
non-working populations will constitute a “demographic gift” of low economic
dependency. However, the large size of this group places enormous pressures on
the educational system and the labor and housing markets. Failures in these insti-
tutions will result in the social and economic marginalization of a large proportion
of youth that will be unable to compete in an increasingly globalized economy,
Chapter Three
YOUTH LIFE TRANSITIONS: OPPORTUNITIES, CAPABILITIES AND RISKS

Egypt Human Development Report 2010{ 36 }
hence constituting a “demographic burden” rather
than a gift.
This chapter provides a profile of young people in
Egypt, focusing on the transitions that young people
undergo in terms of their health, education, entry into
the labor market, family formation and civic partici-
pation.2 The analysis will focus on the differentiated
experience of youth in terms of gender, age group,
socio-economic background and residence status in
rural or urban areas.
The analysis is based on data from the 2009 Survey of
Young People in Egypt (SYPE). The survey is a nation-
ally representative sample of 15,029 young people aged
10 to 29 reached through interviewing 11,372 house-
holds. Out of this sample, 8,488 young people are in
the age category of 18-29. The sample is distributed
proportionately to population size in all geographic
regions covering all Egyptian governorates, includ-
ing frontier governorates. The sample also included a
representation of slum areas. However, in most cases
the results showed no significant difference between
urban slum youth and other urban youth. There-
fore, data on slum areas have been merged with data
on other urban areas. Overall, 58.7% of households
included in the sample were in rural areas, 31.9% in
urban non-slum areas and 9.4% in urban slum areas.
Following the life cycle approach to young people’s
transition to adulthood, the analysis starts with a
focus on health issues, noting that health outcomes
determine, to a large extent, the life opportunities of
young people. Secondly, the analysis shifts to school-
ing, with focus on the education status of young peo-
ple showing the profile of those who drop out or never
enroll in the education system, those who are tracked
to vocational education and those who obtain higher
education. Section 3 discusses the employment sta-
tus of young people in Egypt, with particular focus on
the profile of unemployed youth. Section 4 analyzes
migration and young people’s intentions to migrate.
Section 5 observes patterns in family formation focus-
ing on marriage status, with data on early marriage,
incidence of divorce and widowhood among married
youth. Section 6 explores patterns of civic engage-
ment and social activities while section 7 looks at
young people’s time. Finally, the chapter concludes
with a summary of findings.
youth heaLth outcoMesA person’s health determines to a large extent his
or her life opportunities including access to educa-
tion, work, forming families and civic participation.
Health outcomes could lead to a virtuous or a vicious
life cycle. This section addresses the prevalence of
disability and chronic diseases among youth; nutri-
tion and diet habits including issues of obesity; smok-
ing and drug abuse; and female genital cutting/muti-
lation (FGM/C).
The survey shows that 1.5% of Egyptian youth aged 18
to 29 suffer from some form of disability. Forty seven
percent reported physical disabilities and 37% mental.
However, a breakdown by gender shows 2% of male
youth and 1% of female youth reported a disability.
There is little explanation for the gender difference
in disability distribution. One culture-specific expla-
nation is that families fear that if their daughters are
labeled as disabled, this might hamper their chances
at marriage. The prevalence of disability is highly cor-
related with the socio-economic background, with
30% of those who are disabled in the lowest wealth
quintile and 12.5% among the wealthiest group. This
is confirmed in the international literature on dis-
ability which shows the strong association between
poverty and disability, with disabled children from a
young age facing challenges to acquire the necessary
medical services. The prevalence of cases of youth
with disability is strikingly correlated with region of
residence, with 65% of the disabled being located in
rural areas.
Youth with chronic health conditions (diabetes, heart
problems, respiratory and kidney related diseases)
constitute 1.5% of the age group (18-29). Similar to
the geographic distribution of disability, rural areas
show the highest level of incidence (58%). However,
data shows no gender differences in the prevalence of
Figure 3.1: Young People’s Smoking Behavior in Egypt
Never SmokedStopped SmokingSmokes
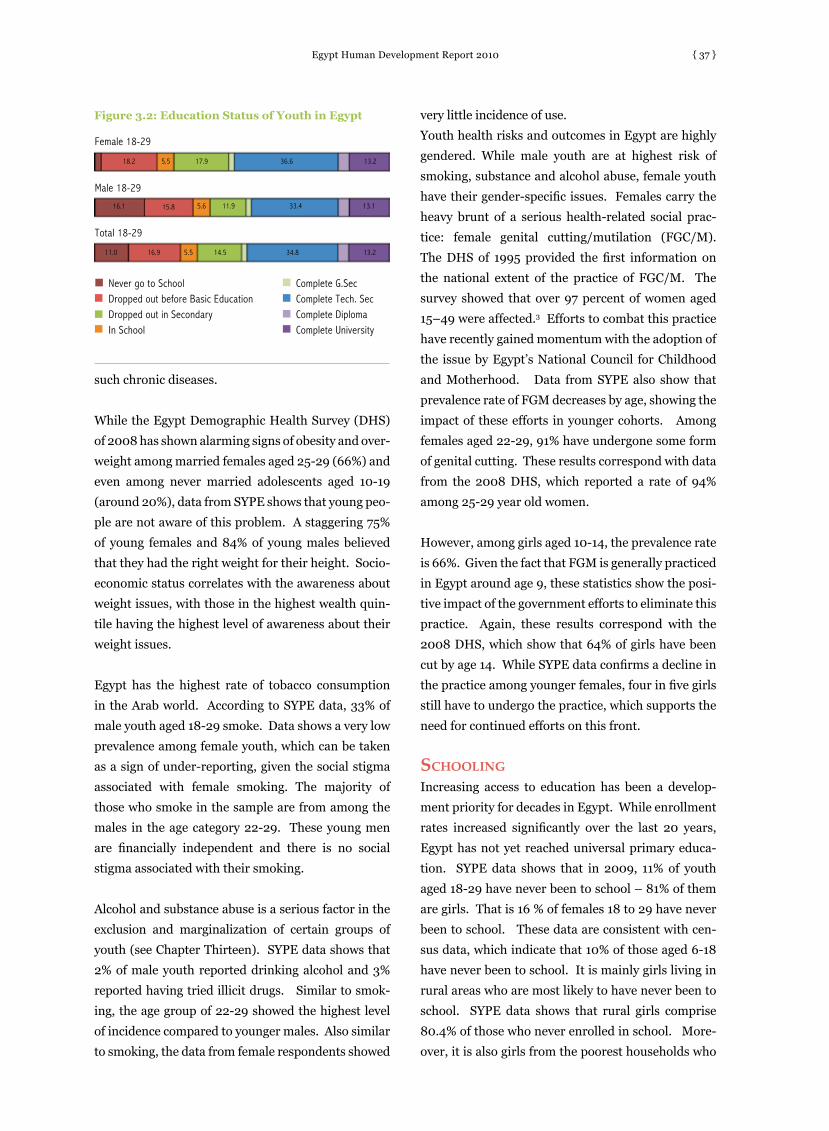
Egypt Human Development Report 2010 { 37 }
such chronic diseases.
While the Egypt Demographic Health Survey (DHS)
of 2008 has shown alarming signs of obesity and over-
weight among married females aged 25-29 (66%) and
even among never married adolescents aged 10-19
(around 20%), data from SYPE shows that young peo-
ple are not aware of this problem. A staggering 75%
of young females and 84% of young males believed
that they had the right weight for their height. Socio-
economic status correlates with the awareness about
weight issues, with those in the highest wealth quin-
tile having the highest level of awareness about their
weight issues.
Egypt has the highest rate of tobacco consumption
in the Arab world. According to SYPE data, 33% of
male youth aged 18-29 smoke. Data shows a very low
prevalence among female youth, which can be taken
as a sign of under-reporting, given the social stigma
associated with female smoking. The majority of
those who smoke in the sample are from among the
males in the age category 22-29. These young men
are financially independent and there is no social
stigma associated with their smoking.
Alcohol and substance abuse is a serious factor in the
exclusion and marginalization of certain groups of
youth (see Chapter Thirteen). SYPE data shows that
2% of male youth reported drinking alcohol and 3%
reported having tried illicit drugs. Similar to smok-
ing, the age group of 22-29 showed the highest level
of incidence compared to younger males. Also similar
to smoking, the data from female respondents showed
very little incidence of use.
Youth health risks and outcomes in Egypt are highly
gendered. While male youth are at highest risk of
smoking, substance and alcohol abuse, female youth
have their gender-specific issues. Females carry the
heavy brunt of a serious health-related social prac-
tice: female genital cutting/mutilation (FGC/M).
The DHS of 1995 provided the first information on
the national extent of the practice of FGC/M. The
survey showed that over 97 percent of women aged
15–49 were affected.3 Efforts to combat this practice
have recently gained momentum with the adoption of
the issue by Egypt’s National Council for Childhood
and Motherhood. Data from SYPE also show that
prevalence rate of FGM decreases by age, showing the
impact of these efforts in younger cohorts. Among
females aged 22-29, 91% have undergone some form
of genital cutting. These results correspond with data
from the 2008 DHS, which reported a rate of 94%
among 25-29 year old women.
However, among girls aged 10-14, the prevalence rate
is 66%. Given the fact that FGM is generally practiced
in Egypt around age 9, these statistics show the posi-
tive impact of the government efforts to eliminate this
practice. Again, these results correspond with the
2008 DHS, which show that 64% of girls have been
cut by age 14. While SYPE data confirms a decline in
the practice among younger females, four in five girls
still have to undergo the practice, which supports the
need for continued efforts on this front.
schooLingIncreasing access to education has been a develop-
ment priority for decades in Egypt. While enrollment
rates increased significantly over the last 20 years,
Egypt has not yet reached universal primary educa-
tion. SYPE data shows that in 2009, 11% of youth
aged 18-29 have never been to school – 81% of them
are girls. That is 16 % of females 18 to 29 have never
been to school. These data are consistent with cen-
sus data, which indicate that 10% of those aged 6-18
have never been to school. It is mainly girls living in
rural areas who are most likely to have never been to
school. SYPE data shows that rural girls comprise
80.4% of those who never enrolled in school. More-
over, it is also girls from the poorest households who
13.2
13.1
13.2
Figure 3.2: Education Status of Youth in Egypt
Never go to SchoolDropped out before Basic EducationDropped out in SecondaryIn School
Complete G.SecComplete Tech. SecComplete DiplomaComplete University
Female 18-29
Male 18-29
Total 18-29
18.2 5.5 17.9 36.6
16.1 15.8 5.6 11.9 33.4
11.0 16.9 5.5 14.5 34.8
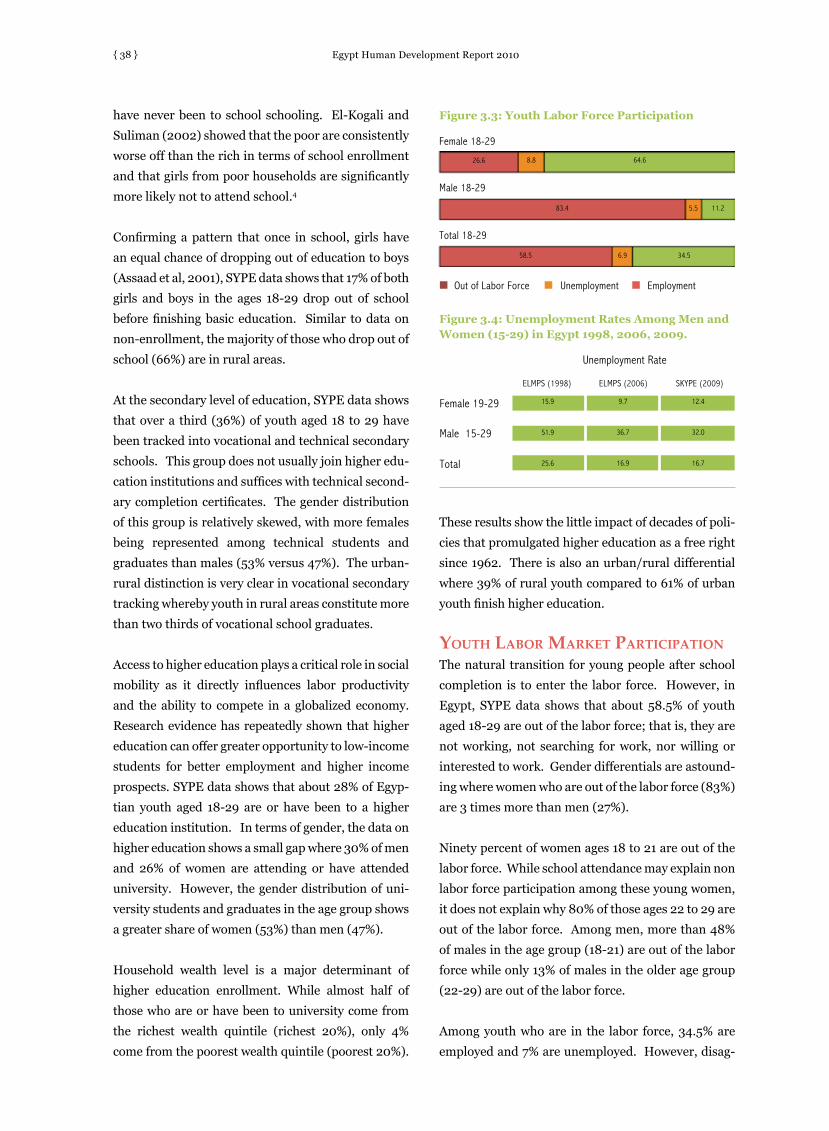
Egypt Human Development Report 2010{ 38 }
have never been to school schooling. El-Kogali and
Suliman (2002) showed that the poor are consistently
worse off than the rich in terms of school enrollment
and that girls from poor households are significantly
more likely not to attend school.4
Confirming a pattern that once in school, girls have
an equal chance of dropping out of education to boys
(Assaad et al, 2001), SYPE data shows that 17% of both
girls and boys in the ages 18-29 drop out of school
before finishing basic education. Similar to data on
non-enrollment, the majority of those who drop out of
school (66%) are in rural areas.
At the secondary level of education, SYPE data shows
that over a third (36%) of youth aged 18 to 29 have
been tracked into vocational and technical secondary
schools. This group does not usually join higher edu-
cation institutions and suffices with technical second-
ary completion certificates. The gender distribution
of this group is relatively skewed, with more females
being represented among technical students and
graduates than males (53% versus 47%). The urban-
rural distinction is very clear in vocational secondary
tracking whereby youth in rural areas constitute more
than two thirds of vocational school graduates.
Access to higher education plays a critical role in social
mobility as it directly influences labor productivity
and the ability to compete in a globalized economy.
Research evidence has repeatedly shown that higher
education can offer greater opportunity to low-income
students for better employment and higher income
prospects. SYPE data shows that about 28% of Egyp-
tian youth aged 18-29 are or have been to a higher
education institution. In terms of gender, the data on
higher education shows a small gap where 30% of men
and 26% of women are attending or have attended
university. However, the gender distribution of uni-
versity students and graduates in the age group shows
a greater share of women (53%) than men (47%).
Household wealth level is a major determinant of
higher education enrollment. While almost half of
those who are or have been to university come from
the richest wealth quintile (richest 20%), only 4%
come from the poorest wealth quintile (poorest 20%).
These results show the little impact of decades of poli-
cies that promulgated higher education as a free right
since 1962. There is also an urban/rural differential
where 39% of rural youth compared to 61% of urban
youth finish higher education.
youth Labor Market ParticiPationThe natural transition for young people after school
completion is to enter the labor force. However, in
Egypt, SYPE data shows that about 58.5% of youth
aged 18-29 are out of the labor force; that is, they are
not working, not searching for work, nor willing or
interested to work. Gender differentials are astound-
ing where women who are out of the labor force (83%)
are 3 times more than men (27%).
Ninety percent of women ages 18 to 21 are out of the
labor force. While school attendance may explain non
labor force participation among these young women,
it does not explain why 80% of those ages 22 to 29 are
out of the labor force. Among men, more than 48%
of males in the age group (18-21) are out of the labor
force while only 13% of males in the older age group
(22-29) are out of the labor force.
Among youth who are in the labor force, 34.5% are
employed and 7% are unemployed. However, disag-
Figure 3.4: Unemployment Rates Among Men and Women (15-29) in Egypt 1998, 2006, 2009.
Figure 3.3: Youth Labor Force Participation
Unemployment Rate
ELMPS (1998) ELMPS (2006) SKYPE (2009)
Female 18-29
Male 18-29
Total 18-29
26.6 8.8 64.6
83.4 11.25.5
58.5 6.9 34.5
Out of Labor Force Unemployment Employment
Female 19-29
Male 15-29
Total
15.9
51.9
25.6
9.7
36.7
16.9
12.4
32.0
16.7
Egypt Human Development Report 2010 { 39 }
gregating by gender shows that 6 times more men
are employed than women in the same age group.
Hence, while female youth are more likely to be out
of the labor force, male youth are more likely to be
employed.
Youth unemployment is a major issue preoccupying
policy makers in Egypt. Chapter Eleven shows that
unemployment in Egypt is primarily an issue of youth
insertion to the labor market and that the profile of
the unemployed in Egypt is that of a young person
who is entering the labor market for the first time.
SYPE data supports this argument. Data shows that
among youth aged 18-29, 7% are unemployed. The
majority of unemployed youth are females in the age
group 22-29, constituting 36% of the unemployed.
Male youth in the same age group constitute 33%
of the unemployed. Unemployment is more among
youth living in rural areas (55%) than among those
residing in urban areas (45%).
The unemployment rate among youth aged 18-29,
that is the proportion of the unemployed to the
labor force, is 17%. The unemployment rate is high-
est among female youth (18-29), at 33% compared to
12% among males. Other research shows that young
females are about 4 times as likely to be unemployed
as young males.5 Comparing unemployment rates
between 1998 and 2006, it is noted that unemploy-
ment for those aged 15-29 had declined between the
two points in time from 25.6% to 16.9%. SYPE data
on the same age group (15-29) shows that the unem-
ployment rate has not changed much in 2009 with a
0.2% decline.
The correlation between the unemployment rate and
socio-economic background shows an interesting pat-
tern. Unemployment is highest among youth who
come from households in the fourth wealth quintile,
slightly drops for those in the highest wealth quintile,
and is lowest among youth who come from households
in the lowest wealth quintile. This can be explained by
the fact that young people in poor households have a
lower reservation wage, and hence accept any possible
form of employment. On the other hand, young grad-
uates from the highest socio-economic classes can
afford to be unemployed until a suitable job is found.
MigrationMigration broadens young people’s opportunities
and offers them a way to earn higher income and
gain skills. The World Bank (2007) estimates that
190 million people in the world live outside their
countries, with 82% of this group migrating from
poor countries to countries in the North.6 Accord-
ing to CAPMAS (2005), there are 1.9 million tempo-
rary Egyptian migrants working outside Egypt.7 The
majority of these temporary migrants (87.6%) are in
Saudi Arabia, Libya, Jordan and Kuwait.8 The profile
of Egyptian migrant workers is that of a male youth
who has completed secondary education.9
SYPE data includes information on intention to
migrate among youth. More than 28% of male youth
expressed their intention to migrate. The inten-
tion to migrate is skewed by gender, as only 5.9% of
females expressed their intention to migrate. This
yields a total of 15.6% of youth of both genders hav-
ing the intention to migrate. Saudi Arabia, Kuwait
and United Arab Emirates were the main attraction
of this group. The list of countries to which young
people showed intention to migrate to includes Italy,
the United States, France and Germany. The profile
of youth who expressed their intention to migrate is
very similar to the profile of migrants in Egypt. They
are predominately male, with 78.6% of those who
expressed the intention to migrate being young males
(18-29). Data shows that the socio-economic back-
ground is positively correlated with the intention to
migrate, as those who showed intention to migrate
are coming from the highest socio-economic level.
Place of residence does not have a great impact on the
intention to migrate, as youth who had the intention
to migrate come from both urban and rural areas in
similar rates.
faMiLy forMationYoung people in Egypt begin to think about forming
families at a relatively young age. The legal age of
marriage in Egypt is 18. The 2009 SYPE data shows
that 55% of young women aged 18-29 and 18% of
young men, are or have been married. The majority of
married young people from both genders – 67% live
in rural areas. The survey shows that about 42% of
young women have been married between ages 20-24,
Egypt Human Development Report 2010{ 40 }
and that corresponds with data from the 2008 DHS
which showed the median age at first marriage for
females is 21. Rashad and Khadr (1998) showed that
in the age group of 20-24, the percentage of young
women who got married by the age of 20 has dropped
from 65% in 1970 to 41% in 1995. Focusing on the
same age group, El-Kogali and Al-Bassusi (2001) note
that in 1997, about 43% of young women were mar-
ried by age 20. Hence, while it seems that the age at
first marriage has increased in the 70s and 80s, there
has not been much change over the past two decades.
Assaad and Ramadan (2008) highlighted the role of
housing policy reforms in curbing delays in the age
of first marriage for young people. Using the Egypt
Labor Market Survey 2006 data collected, the authors
found that the median age of marriage among urban
and rural females born in the 1940s is five years lower
than those born in 1970, which was 23 for urban
areas and 20 for rural areas.10 Although focusing
on a younger age population (15-29), with a smaller
proportion of ever married females, SYPE data shows
that the median age of marriage of females born in
the mid of 1980s was 22 in urban and 20 in rural
areas. This suggests that among young females age at
marriage might be decreasing in response to housing
policy reforms, especially in urban areas.
The situation of age at first marriage for young males
is slightly similar. Assaad and Ramadan show that
the age at first marriage among urban males born in
the 1940s was below 27 years, reaching its peak at
over 29 for those born in 1972. SYPE data, focusing
on a younger age population (15-29) with a smaller
proportion of ever married males, shows that the 25th
percentile of age of first marriage for males born in
the mid of 1980s is much lower, at 25 years old. The
same pattern is discerned for rural youth.11 The earlier
situation of delay in marriage has been documented
in many ways, which propelled Singerman (2007) to
coin the term “waithood” to describe this prolonged
stage of waiting for marriage among youth in Egypt.12
SYPE results show a decline in the waithood phenom-
enon, showing that the peak of age at marriage for
young males born in 1970s was the highest recorded
along 50 years from 1940s to 1980s.
Egypt, like many other countries in Africa and the
Middle East has a tradition of extended family living
arrangements. The data from SYPE shows a con-
tinuation of this tradition whereby 37% of married
young people continued living with their families;
over 95% lived primarily with the husband’s family.
The extended family living arrangement was highest
among those who married at an earlier age and are in
rural settings. Households in rural areas had 79% of
extended family living arrangements. The extended
family living arrangements is highest among those
married in poorest households. In fact, the incidence
decreases with the increase in socio-economic status.
Similarly, data on consanguine marriages show that
more than 73% of such marriages take place in rural
settings and among youth from lower socio-economic
backgrounds.
Data on incidence of divorce among young people
shows that 2% of ever married women who are 29
years or younger have been divorced. Rural areas
account for 72% of divorced young people, given that
there is a higher concentration of married youth liv-
ing in rural areas. Data on incidence of widowhood
among young people shows that less than 1% of those
ever-married are widowed. All widowed youth in the
sample were females, which can possibly be explained
in view of the persistence of the phenomenon of early
marriage, where the husband is usually much older
than the wife.
exercising citizenshiP The SYPE data collection tool included a special sec-
tion on youth civic engagement, which comprises vol-
unteerism, social integrity and political participation.
The results show that less than 3% of young people
are participating in volunteer work. The participa-
tion rate does not exceed 4.5% among males, and
1.5% among females. The types of volunteer works in
which both male and female youth engage are similar.
Charitable activities represent 64% of all voluntary
work undertaken by this small group of youth. The
highest proportion of youth charitable activities were
among male youth aged 18-21, followed by those in
the age group of 22-29. Among females, voluntary
activities were mainly charitable but also included
providing tutorial and training assistance to others.

Egypt Human Development Report 2010 { 41 }
SYPE data on group membership includes partici-
pation in youth centers and sports clubs, political
parties, unions and associations, and housing and
school boards. Only 4% of young people appear to
have participated in any of these groups. The major-
ity of youth participate in recreational activities with
67% participating in youth centers and sports clubs.
Youth centers tend to focus on sports activities (and
tend to be male-oriented) while sports clubs offer a
venue for socializing and tend to have greater female
representation. Hence, women tend to be more con-
centrated in sports clubs than youth centers while the
same proportion of young men are engaged in activi-
ties in sports clubs and youth centers.
Political party membership constituted only 2.2%
of the civic engagement activities of young people
in Egypt. Those who participate in political parties
represent only 0.12% of the total young people in the
age group of 18-29. Data on voting behavior shows a
high level of youth apathy and lack of engagement.
Eighty four percent of eligible youth did not exercise
their right to vote in the last election. Only 21% of
young men and 11% of young women voted. In terms
of socio-economic characteristics, those who voted
tended to come from the middle and upper middle
wealth quintile, with the lowest level of participation
among the poorest.
tiMe use anD civic ParticiPationSYPE data included information on how young
people use their time. It is interesting to look at the
role of gender and age in defining how young people
spend their time. Data shows that housework is the
main burden for females in both age groups (18-21)
and (22-29). The older group has the largest share
of housework, with 55% of women 22-29 spending
on average 3 hours per day in housework, compared
to thirty minutes for males in the same age group.13
Care for the elderly or for children is another activity
that is generally shouldered by females, with women
spending double the time spent in this activity by men
on average.
Young men have the largest share of leisure time;
they spend on average double the time spent by
females in the same group meeting friends or playing
sports (two hours compared to one hour on average).
Sports are exercised by only 3.6% of young people,
who dedicate one hour to this activity. On the other
hand, watching television is the activity that seems to
be equally enjoyed by youth regardless of age or gen-
der. On average, young people spend 120 minutes per
day watching television. Similarly both young men
and women, regardless of age tend to talk to friends
over the phone, as opposed to going out with them,
talking an average of 15 minutes daily. Also equally
undertaken by young people of both genders and age
groups are the religious activities, which take an aver-
age of 40 minutes per day. Use of the internet is also
relatively low with15% of young men and only 5 per-
cent of young women using the internet. Men spend
an average of two hours and women an average of an
hour and half per day on the internet.
concLusionThe preparedness of young people for their future
and their successful transition to adulthood is con-
tingent on a number of issues that the analysis in
this chapter has highlighted. Primarily, household
socio-economic status is a major determinant for
a successful transition to adulthood. Young people
from poor households are faced by a constraining
environment that hampers their health, education
and employment potentials. The limited labor mar-
ket and education potentials of young people from
poor households perpetuate an intergenerational
cycle of poverty. Place of residence is another major
determinant, with those in rural settings consistently
performing poorly in terms of health, education and
labor market outcomes. Gender is also a major deter-
minant, with female youth at the losing end in educa-
tion and employment.
In terms of health, the analysis shows that while
young people are a healthy population in general, risk
factors persist. One major risk factor is obesity among
youth. Despite prevalence of obesity and being over-
weight, young people are generally satisfied about
their weight and seem to be unaware of its harmful
impact. Analysis shows that the prevalence of dis-
ability is mainly among the poor, showing the impact
of the limited health services available to this group.

Egypt Human Development Report 2010{ 42 }
Findings highlight the gendered nature of health
outcomes, with male youth suffering the impact of
harmful habits such as smoking, substance and alco-
hol abuse, and with female youth suffering from the
harmful practice of female genital mutilation (FGM).
While the data shows a decline in the prevalence of
FGM, comparing younger females to earlier cohorts,
more efforts are needed to combat this harmful prac-
tice that still affects two thirds of girls ages 10 to 14.
The opportunity structure for youth in Egypt is highly
gendered. Gender is central to schooling and labor
market outcomes. Females constitute the majority of
those who do not enroll in the education system or
drop out early. In terms of labor market participa-
tion, females are most represented among those who
are out of the labor force or among the unemployed.
Young people do not escape traditional practices of
early marriage, extended family living arrangements
and consanguine marriages. These continue to per-
sist mainly in rural settings and among the poorest
households. Early marriage is particularly relevant to
hampering successful transitions to adulthood. It is
largely connected with limited education and limited
female labor market participation.
In terms of civic participation, a disquieting finding is
that young people seem to be extremely disengaged.
The proportion of youth who actively participate in
their communities or in the political process, or even
exercise their right to vote is alarmingly low. Youth,
as data on time use shows, spend most of their time
either working or socializing, with television playing a
prime role in their pastime activities. Females spend
disproportionately longer hours in household chores
and childcare compared to males, which reflects their
limited labor market participation.
Endnotes1 CAPMAS, 20072 This framework of analysis builds on the World Bank’s World Development Report (2007)3 DHS, 20004 El-Kogali and Suliman, 20025 Assaad, 20076 World Bank, 20077 CAPMAS, 20058 Zohry and Harrell-Bond, 20039 ibid10 Assaad and Ramadan, 200811 ibid12 Singerman, 200713 Analysis in this section is based on median number of minutes spent in an activity
referencesAssaad, R. and Barsoum, G. (September 2007), “Youth Exclusion in Egypt, In Search of Second Chances.” Middle East Youth Initiative
Working Paper, Wolfenshon Center for Development and Dubai School of Government, No. 2.CAPMAS (various)El- Kogali S. and Al-Bassusi N. (2001), “Youth Livelihood Opportunities in Egypt”, Population Council, New York.El-Kogali, S. And E. Suliman (2001), “Poverty, Human Capital and Gender: A Comparative Study of Yemen and Egypt”. Working
Paper 0123, Economic Research Forum Working Paper Series.Rashad, H. and Khadr, Z. (1998), “The Demography of the Arab Region: New Challenges and Opportunities” paper presented at the
conference on Population Challenges in the Middle East & North Africa: Towards the Twenty First Century, November 2-4.Singerman, D. (2007), “The Economic Imperatives of Marriage: Emerging Practices and Identities Among Youth in the Middle East.”
Middle East Youth Initiative, The Brookings Institution and the Dubai School of Government.Zohry, A. and Harrell-Bond, B. 2003. “Contemporary Egyptian Migration 2003”. International Organization for Migration (IOM),
Italian Cooperation and Ministry of Manpower and Emigration, Cairo, Egypt.
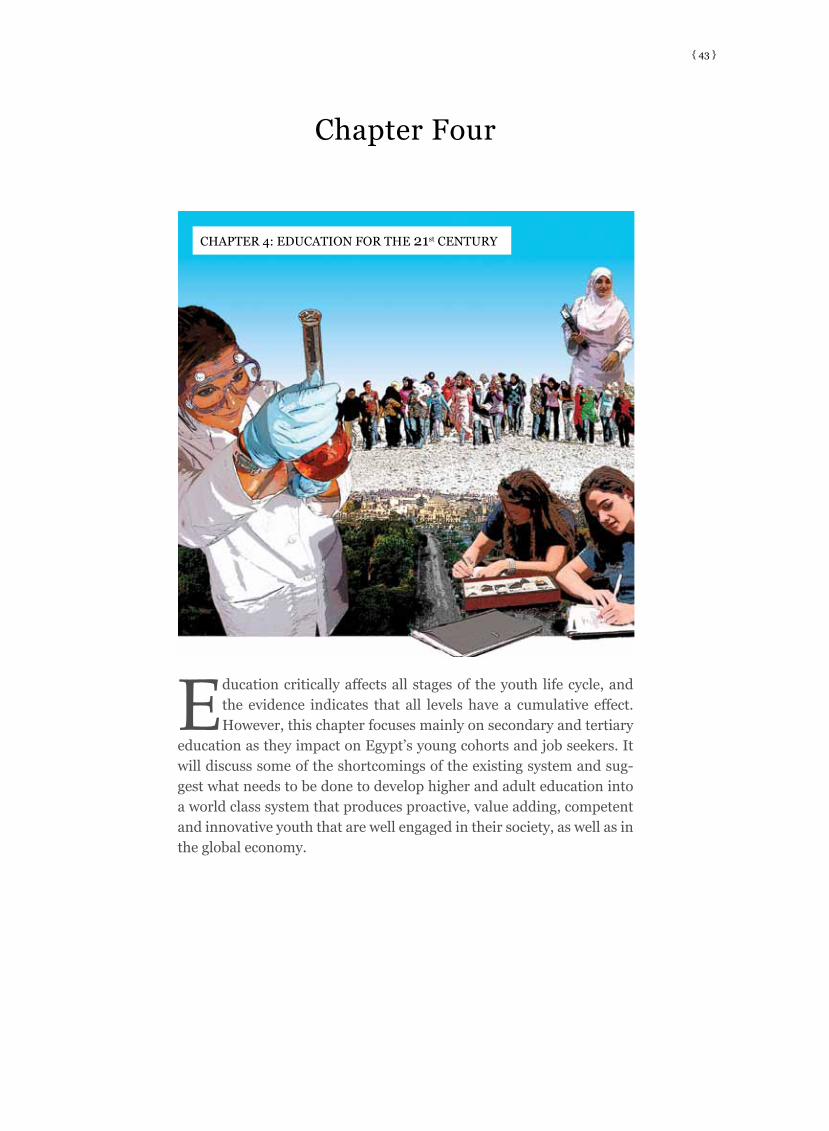
{ 43 }
Chapter Four
Education critically affects all stages of the youth life cycle, and the evidence indicates that all levels have a cumulative effect. However, this chapter focuses mainly on secondary and tertiary
education as they impact on Egypt’s young cohorts and job seekers. It will discuss some of the shortcomings of the existing system and sug-gest what needs to be done to develop higher and adult education into a world class system that produces proactive, value adding, competent and innovative youth that are well engaged in their society, as well as in the global economy.
CHAPTER 4: EDUCATION FOR THE 21st CENTURY

Egypt Human Development Report 2010{ 44 }
There are several milestones that have been achieved
in the reform of the education system in Egypt. In
higher education, opening the door for private sector
provision, applying cost sharing in some special pro-
grams in public universities, utilizing performance
based remuneration schemes for new staff in public
universities, and the new proposed draft law that
allows the establishment of non-profit higher edu-
cation institutions are some of these reforms.1 Fur-
thermore, utilizing ICT to educate students and train
teachers to effectively use technology and acquire
technological skills needed to act effectively in a tech-
nology enhanced education environment has become
fully integrated in the educational policies of the Min-
istry of Education.2
Despite this, there has been a notable decline in the
quality of higher education over the last three decades
that is manifested in the mismatch between the needs
of labor market and the ever growing supply of grad-
uates. The overcrowding of universities, strained
available facilities, and an overworked and limited
number of academic staff has led to the deterioration
of the quality of education.3 Second chance programs
for school dropouts have not kept up with the needs
of the market nor have they been successful in reach-
ing to underprivileged youth.
In order to correct this, elements of the education
system need to be aligned with Egypt’s economic
development orientation, which is mainly a mix of
industry and service economy, with the latter taking
a more leading role. However, it would be a fallacy
to focus solely on the economic dimensions of educa-
tion. Education is an important means to correct the
ailments affecting contemporary Egyptian society.
Combining both the economic and social dimensions
requires that education serve as an all-encompassing
tool for inclusion, social empowerment and com-
petitiveness. As tool for inclusion this means that
access and quality should be sensitized to the needs
of youth, especially vulnerable youth and those from
poor households. Empowering youth through edu-
cation means that it should aim to instill values and
build citizenship to transform society in a democratic
manner. In order for education to serve as a tool for
competitiveness it should aim to equip youth with
the knowledge and skills set needed to compete in a
knowledge-driven global economy.
eDucation: a tooL for incLusion? About 22% of Egypt’s population is in school age, that
is between the ages of six and seventeen, another
10.5 % are in the age group 18-22 of whom fully one
third are in higher education.4 This age structure
places enormous pressures on the education system.
Despite the great strides made to achieve univer-
sal education, issues related to inequality of access
to education and education quality remain central
(see Box 4.1). Research has repeatedly shown that
the system in Egypt provides differentiated quality
of schooling and that the poor consistently perform
poorly in education. They have low enrollment rates,
leave school early, or are tracked to majors that have
second-rate learning and labor market outcomes.
While Egypt has made great strides in achieving the
MDG goal of universal basic education enrollment,
27% of young people aged 18-29 do not complete
basic education (17% have dropped out of school
before completing basic education and 10% have
never enrolled in school). According to the Survey of
Young People in Egypt (SYPE), those who come from
the poorest households are distributed among three
main groups: those who never enrolled (29%), those
who dropped out before finishing basic education
(24%), and those who completed technical second-
ary education (29%).
Socio-economic status and family background are
considered the main predictors of education achieve-
ment in Egypt. Children whose families are in the
middle and upper wealth quintiles are more likely to
perform better in certificate examinations and to join
the higher education system. Those who come from
poor households constituted 5.3% of achievers5 in
the primary education stage, 3% of achievers in the
preparatory stage and only 0.5% of achievers in the
general secondary education stage, implying that the
presence of students from poor families is at its high-
est rate in the primary stage. The pressure of house-
hold poverty and poor educational facilities takes its
toll as students advance in the education system, and
lowers their achievement levels.
Egypt Human Development Report 2010 { 45 }
Box 4.1: Education Reform in Egypt
The Egyptian pre-university education system is considered one of the largest in the region. It encompasses more than
43,000 schools, some 1.6 million personnel (teachers, administrators and others) and over 16 million students. It is one
of the most important social services in which Egypt has invested heavily, raising the level of schooling of the population
substantially from a low base in the 1970s. Education is a right guaranteed by the state and is compulsory at the basic
primary stage. The state is now working to extend the period of compulsory education to the other stages.
The enrolment rate in Early Childhood Care and Education (ECCE) increased to 24.4% in 2007/08 with a total enrollment
of 835,297 children. The Early Childhood Education Enhancement Project (ECEEP), in collaboration with the World Bank,
CIDA, and World Food Program established an important initiative for improving the quality and institutional capacity of
ECCE, aimed at increasing the total enrollment of four to five-year-old children by 2012 through providing some 2,000
classrooms, giving priority to remote areas. In basic education, total gross enrollment rates including public, private and
Al-Azhar schools in both primary and preparatory stages has surpassed 100%.
Major Pillars of Reform
Central to the success of education reform is the move from effective access to an education of quality for all. To this effect,
the criteria for accreditation based on the Egyptian standards for quality in education has been designed, and a new
teachers’ cadre was established in 2007 and followed by the creation of the Professional Academy for Teachers. A 2006
law also established the National Authority for Quality Assurance and Accreditation of Education (NAQAAE) to assess both
the instructional process and institutional capacity of schools for accreditation.
Since its inception in 2006, school based reform lies at the core of all education reform in Egypt, consisting of important
integrated quality targeted areas and allowing schools exposure to a continuous improvement cycle, including self-
evaluation and the development of a school improvement plan. It is expected that schools will have a great deal of autonomy
and will be accountable for their processes and results. A comprehensive system of educational assessment, monitoring
and evaluation is needed. Within that context, the Ministry of Education (MOE) in collaboration with international partners
developed some standardized tests which provide benchmarks for progress in education such as CAPS, SCOPE and MAP.
Teachers and the teaching profession have received significant consideration during this educational reform review period
(2003-2008) through different laws, decrees and incentive mechanisms. MOE has been giving great attention to training
and capacity building of its most important change agents – ‘teachers’. This has resulted in training a total number of
1,832,568 trainees to date in different education levels and fields.
Under an initiative by the First Lady of Egypt, Mrs Suzanne Mubarak, the 100 Schools Project, began with the development
of 100 public schools in the lowest income areas of Cairo. The funds provided for this stage were made available through
donations by community participation institutions and the private sector. 124 schools had been rehabilitated and prepared
for accreditation in Cairo governorate by the end of 2008 including various educational stages After the success of this
stage , three other reform stages have been advanced for 2008-2010 to include an additional 208 schools that serve
more than 300,000 students. Expansion plans are underway to include two additional governorates (Giza and Luxor). The
MOE is also now taking the lead in the application of decentralization, working jointly with relevant stakeholders to activate
decentralization program and setting basic pillars of gradual transformation to the desired decentralized education system.
MOE is piloting decentralization in three governorates (Fayoum, Ismailia, and Luxor). They are also enhancing a paradigm
shift in pedagogy that aims at moving from a traditional rote memorization approach with strong focus on content to an
approach which supports learner–based education, active learning and comprehensive assessment.
With regards ICT, the overall goal is to develop, create and maintain the infrastructure and technical support needed to
implement and sustain modern pedagogy, effective education management and planning, while the objectives such as
modernizing and strengthening the technology infrastructure in all schools, activating the role of information system
management in the educational process, providing 301,131 PCs in schools, connecting 25,800 schools to the internet,
increasing the number of Egyptian Education Initiative EEI schools to 2000 preparatory schools, increasing the number of
‘Smart Schools’ to 173, teachers trained on ICDL to 240,000, teachers to 44,000 and teachers trained on ‘Learning for
Future Program’ to 266,000.
Egypt Human Development Report 2010{ 46 }
Urban/rural residency is another major predictor of
school achievement. School achievers predominately
come from urban areas. The impact of being in a
rural area increases as the student advances in the
education system. Rural students have their lowest
presence among achievers in the general secondary
completion exam and their highest presence in the
primary education stage.6 In fact, rural areas have a
staggering 80% of those who never enroll in school.
The gender dimension is particularly pronounced in
this group, with females constituting 82% of those
who never enrolled in school.7 The situation of school
drop-out is slightly different. Similar to non-enroll-
ment, the majority of school drop outs are in rural
areas (65%). However, the gender dimension is less
pronounced among school drop-outs than those who
never went to school, with females constituting only
52% of drop-outs. In terms of socio-economic back-
ground, school drop-out is more evenly distributed
than school non-enrollment. However, those in the
lowest two quintiles representing 55% of drop-out
cases.8
In terms of school type, while the majority of achiev-
ers come from government schools (90% in the sec-
ondary stage completion exam), the likelihood of
being an achiever increases exponentially if a student
is in a private school or in a governmental experimen-
tal school. More than 50% of those in governmen-
tal experimental schools are achievers, compared to
9% of those who come from regular governmental
schools. Among students in private schools, 35%
were among the achievers. It is important to note
that school type is a proxy for socio-economic back-
ground, with private and experimental government
schools charging relatively high fees compared to
regular government schools.
The presence of children from poor households
diminishes as they advance in the education system
as success in one stage is a major predictor of suc-
cess in subsequent stages. Only 4.3% of higher edu-
cation students come from the lowest income quin-
tile. Those in university predominately come from
the highest fourth (27.1%) and fifth (46.5%) wealth
quintiles. The poor tend to be more represented
among students in two-year institutions, constitut-
ing 11% of the student body and with higher rural rep-
resentation. Among those who completed university
education, 52% come from the highest wealth quin-
tile and are predominately urban, showing the strong
connection between schooling achievement and the
socio-economic background of students. In terms of
urban and rural distribution, urban students consti-
tute more than 63% of those who finished university
education among the youth and 50% of those who fin-
ished education in two-year education institutions.9
While accessibility to higher education was one of
the main principles guiding the expansion of public
universities in the post revolutionary era, the policy
of free public education has in many ways compro-
mised the quality of education. Without including
the al Azhar religious system (which has 18 % of total
enrolled undergraduates), the total number of Egyp-
tian universities in 2008 was seventeen public uni-
versities, with a total of 1.43 million enrolled in the
academic year 2008/09 (Table 4.1). While the high
number of higher university graduates can be a posi-
tive indicator of development, the problem of labor
market insertion has exacerbated unemployment (see
Chapter 11 for more details). Primary and secondary
school level education have not fared well in terms of
quality either. The over-crowding of students, and the
shortage of qualified teachers (see Table 4.2), have
affected quality learning experiences to the students.
Future plans include enhancing effective and sustainable educational reform, continue effective access to an education of
quality for all, maximizing access for ECCE, achieve a universal 9-year basic education program, harmonize technical and
general secondary education, enhance literacy – the first step towards lifelong learning, expand provision of different
educational delivery systems, institutionalize effective decentralization and accountability, and introducing a systemic
transformation of leadership, capacity building and continuing professional development
Source: Hassan el Bilawi, Ministry of Education

Egypt Human Development Report 2010 { 47 }
Many of the factors influencing the quality of higher
education are of a financial nature. Inefficiency of
public spending on higher education is a major con-
cern with 78% of Egypt’s higher education budget
allocated to current expenditures and only 22% allo-
cated to capital expenditure (i.e. maintenance and
upgrading of infrastructure to meet increasing num-
ber of students enrolled in post secondary education).
At least 75% of current expenditures go to salaries and
wages. The picture is grimmer when the fact that 50%
of total staff in Egyptian universities is administrative
as opposed to academic staff is taken into account.10
On a positive note, the gender gap in higher institu-
tion enrollment has been closed with females consti-
tuting 56% of those who completed university. They
also constitute 53.8% of those who completed their
education in two-year higher education institutions,
which provide diploma credentials.11
gLobaL coMPetitiveness It is essential to foster education initiatives that
address the intricate relationship between human
capital and the labor market. Economic success is
increasingly based on the effective utilization of intan-
gible assets, such as knowledge, skills, and innovative
potential as the key resource for competitive advan-
tage. Education is the bedrock of competitiveness.
Most developed countries have already made the shift
Box 4.2: Admission Policies in Higher Education
The current university admissions system is a single opportunity based on the scores obtained in the general secondary certificate
obtained the same year. Given that students are accepted on the single factor of their grades in the nationwide secondary
school completion examinations, a student’s future will be determined by the single opportunity which experts call a “high
stake exam”. The whole educational process and curricula are directed to that single exam, and the educational process as a
whole is reduced to rote learning of educational material on which the final examinations are based. This system is considered
one of the main reasons for private tutoring..
A national conference for the development of secondary education and admission policies in higher education was held in May
2008 under the auspices of the President of the Republic. The conference adopted a set of important reform recommendations,
chief of which was that students obtaining the certificate of completion of secondary education should be admitted to higher
education by sectoral capacity testing conducted by the Ministry of Higher Education through specialized assessment centers;
and that the sectoral capacity test could be taken more than once within a period of five years.
This is an important issue which should be discussed in national dialogue. Voices from some quarters in Egypt are now demanding
that there be what is called the estimated total, which consists of a percentage of the total sectoral capacity test by the higher
education plus a percentage of total general secondary certificate examination. This latest proposal is a grave proposal
because it re-links high school and admission to universities known as the “coupling system” while the world is moving in the
direction of their disengagement, known as “decoupling” secondary education and universities.
A study of current global trends in university admission systems shows that most countries of the world base their admission
policy: either on the final high school exams called the Exit Exam, as in Tunisia, England, Malaysia; or only on capacities test
for admission to university called the Entrance Exam, as in most of the United States, Turkey and other countries.
The Exit Exam is tough and often the bottleneck in the educational system and causes the growth of private tutoring. Therefore,
many countries that adopt this are working to open the door to considering a student’s portfolio and his performances part of
the certificate of completion of the high school stage as is done in England’s GCSE. However, this type of national examination
earns countries advanced positions in global tests internationally.
The American system does not depend on a national exam for the completion of high school education, but relies on admission
capacity tests called the Scholastic Aptitude Test SAT or, in some U.S. states the American College Test (ACT). This system is
meant to reduce tension within the pre-university stages. It makes the educational process pay attention to learners’ activities,
performance and interests. It also pays attention to life skills, and critical and creative thinking. Under this system, private
tutoring decreases or is almost non-existent as a phenomenon in the secondary stage. However, this system has not made the
countries that adopt it rank high in global tests such as PISA. Source: Hassan el Bilawi, Ministry of Education

Egypt Human Development Report 2010{ 48 }
Table 4.1: Number of Enrolled and Graduates by University Academic Year 2008/2009
Source: Supreme Council of Universities website, Higher Education Development Statistics
to a service economy with fewer jobs in manufactur-
ing and more in information services. This trend has
moved in tandem with supply side changes reflected
in the increased emphasis on higher education and a
demand driven education system that responds to the
skills needed by the new economy.
While new growth theories suggest that developing
nations have better chances of catching up when they
have a workforce that can develop new technologies
or can adopt and use foreign technology12, in the case
of Egypt one finds that its competitiveness perfor-
mance is hampered by the low attainment of higher
education and the lack of competitive industries
capable of absorbing oversupply of graduates and
skilled workforce.13 Another obstacle is the strong
preference for education that prepares for admin-
istrative careers. About 64% of students enrolled
in Egyptian universities in the academic year
2007/2008 were enrolled in social studies (Com-
merce, Law, Arts and Education). Those enrolled in
Engineering, Medicine, Pharmacy and Science have
a limited share in the total numbers of students,
representing 17.6% of students enrolled. The same
holds true for graduates of applied sciences which
represent about 15.2% of the total percentage of
graduates. In this context, it is of no surprise that in
Egypt, there is a high reliance in development proj-
University
CairoAlexandriaAin ShamsAssiutTantaMansouraZagazigHelwanMeniaMenoufiaSuez CanalGanoub el WadiBeni SuefFayoumBenhaKafr el SheikhSuhagTotal
No. enrolled
189948175379170913
7109696842
125012102816100401
474547327949693440994330723777605512520429101
1428872
%
13.2912.2711.96
4.986.788.757.207.033.325.133.483.093.031.664.241.762.04
-
3086530187361001327120493241632057018401115481762611546
906683474722
1154362286244
280920
%
10.9910.7512.85
4.727.298.607.326.554.116.274.113.232.971.684.112.222.22
-
Source: MOE 2007, National Strategic Plan for Pre-University Education Reform in Egypt, Annexes
Table 4.2: Numbers of Qualified and Non Qualified Teachers in 2005/2006
Educational level
Preparatory Secondary
No.of qualified teachers at Faculties of Education
146,773 (72%)69,822
No. of non-qualified teachers without pre-service education formation
53,776 (28%)31,313
Source: ILO (2006) School-To-Work Transition, Evidence From Egypt: Final Report
Percentage (%)
Table 4.3: Distribution of Young Workers’ Skills Assessment by Employers SWTS 2005.
Workers’ skill
Required technical skills Practical training at schoolCommunication skillsWriting skills Ability to apply knowledge
learned at school Commitment and disciplineOverall preparedness
Very Good
18.210.138.639.2
22.462.913.5
Fair
50.542.449.4
41
3728.966.1
Poor
31.347.5
1219.8
40.68.2
20.5
ects on foreign expertise.14 It can also be argued that
the capacity of the service and manufacturing indus-
tries to develop using credentials produced by higher
education institutes is limited.
No. graduates (2007/08)

Egypt Human Development Report 2010 { 49 }
The ability of graduates to apply knowledge acquired
to the workplace has not been promising (see Table
4.3). According to an ILO survey15, the level of sat-
isfaction of employers with their young recruits is
generally fair (66%). However, many employers have
criticized the low abilities of the youth graduates
in applying knowledge learned (41% of employers
assessed it as poor). The same low ranking is given
to the practical training provided to young applicants
at school (48% of employers). The education and
training system visibly fails to produce skills that are
required to perform jobs (see Box 4.2).
University graduates constitute about 12.2% of the
work force in Egypt, while holders of higher diplo-
mas, M.A. and PhD. degrees constitute another 0.4%
of the labor force. As regards to the ordering of gradu-
ate unemployment in different fields of specialization,
the highest unemployment rates during the period
from 2002 till 2004 were in commerce (34.7%), fol-
lowed by arts and archeology (about 15.3% for each),
then agriculture and law (14.5% for each), other fields
of specialization (10%), social work (7.3%), and finally
engineering (3.8%).16
Private universities supposedly enhance the quality
of graduates given that they are fee-based institu-
tions. However, to a large extent, they complete and
duplicate public university curricula with no qualita-
tive addition, often using the same pool of teaching
staff and attracting students with lower entry grades.
Their focus is mainly on engineering, medicine, man-
agement and media, but they do not contribute to
the improvement of the quality of graduates that are
demanded by the labor market.17
Nevertheless, some positive changes are taking place.
Many new initiatives in both private and public uni-
versities have been introduced to enhance the spirit
of entrepreneurship, with some programs linked to
regional projects. One example is EFHAM, a joint
initiative between Cairo University and the Egyptian
Junior Business Association, which aims to encourage
students to create their own entrepreneurial opportu-
nities. This extra-curricular program introduces the
values of risk taking, creative and critical thinking,
and civic responsibility. The Center for Small and
Medium Business at Helwan University offers young
graduates services and training on how to start up a
business and offers access to finance.
A preliminary assessment of most of these initiatives
indicates that there is a lack of coordination, follow
up and evaluation. Some programs overlap and the
route to entrepreneurship remains unclear. Students
are engaged in several projects, but programs are
lacking a clear vision and connectivity to the main
stakeholders. Linkage projects are also rare. In this
respect corporate social responsibility can play a sig-
nificant role in developing a coherent vision, plan of
action and programs to enhance the impact of entre-
preneurship education.

Egypt Human Development Report 2010{ 50 }
sociaL eMPowerMentThere have been several forces pushing today’s cam-
puses toward increased civic engagement, which
include:
• A renewed call for relevance of academic knowl-
edge with real-world questions;
• A consensus about the importance of national
civic participation and the university’s responsi-
bility in relation to it;
• Public concerns over economic and human inse-
curity, environmental degradation, hunger, poor
schooling, poverty, housing, health care;
Box 4.3: The Battle Against Unemployment?
Egypt is currently experiencing the most intensive growth in the number of youth aged 15-29, putting an enormous strain
on the ability of the labor market to secure jobs for new entrants. Securing employment for the ever-increasing pool of
labor supply is one major challenge facing policy makers. To meet this challenge, the Egyptian government is developing a
National Action Plan to focus on youth as an asset. As part of the plan, and in collaboration with the ILO, the School to Work
Transition Survey was conducted and analyzed to help develop sound policies for young people. The survey analyzes the
employment and education situation of young people through the school to work transition concept, designed to assess
the ease with which a young person moves from school to his/her first ‘career’ job:
The survey used a sample of 4000 youth, found in 5520 households around the country. The scope covered 10 governorates
randomly selected representing urban, rural, lower and upper Egyptian governorates. The survey design ensured an
adequate representation of males and females.
An additional 300 employers were interviewed representing both formal and informal enterprises.
Of employed respondents, 22% are skilled agricultural workers, 21% craftsmen and a mere 3.4% are clerks.
78% of the unemployed reported that the main reason for not finding a decent job was the lack of current job
opportunities.
Almost 50% of sampled employers find applicants’ practical training received at school and ability to apply training to be
very poor.
7% of the young employees/self-employed youth had received training for their current activity.
Of the small percentage of self-employed youth, 77% did not receive help from friends and family to establish their business
and 90% said their activity was profitable.
On the ease of transition from school to employment, most employed youth in the agriculture/fishing sector experience an
easy transition, while the majority of transited youth in all other occupations experience a difficult transition, particularly
those in higher skilled jobs.
Nearly 50% of those who had an easy transition had never been to school compared to only 24% of those with technical
secondary education and 32.6% of those with university education.
The facts presented by the survey crystallize the understanding that today, educational attainment is no guarantee of securing
employment. An educated young person is at no advantage when it comes to finding his/her way in the job market. In fact,
the opposite seems to be true. Again, this is a reflection of the mismatch between job seekers’ skills and what is on offer by
employers
The market is currently incapable of offering sufficient opportunities catering to all job seekers, particularly those with an
education. It is therefore time to turn to the alternative solution, shaping youth to suit market needs. While the above is
not meant to diminish the importance of formal schooling, it strongly points to the need to offer some form of training
and especially gearing towards sectors capable of absorbing more people. There is a strong need to focus on vocational
education training and skill building. Private sector companies, factories and local level business should be encouraged
(perhaps legally obliged) to shoulder some of the responsibility of absorbing the enormous youth capacity. Massive
initiatives such as Mubarak Kohl have their limitations because of limited capacity for existing private factories to absorb
trainees. The solution would seem to be to provide incentives whereby the private sector regularly and systematically
takes trainees, trains them and offers secured, decent employment. Box prepared by Nihal Elwan for EHDR 2010
Egypt Human Development Report 2010 { 51 }
• Universities are strategically situated for civic
engagement; they have faculty members with
credentials in academic disciplines and profes-
sional fields that have great potential for identi-
fying solutions at the societal level; this implies a
change in the traditional view of their role from
producing basic and applied knowledge to prac-
tical problem-solving;
• Civic engagement plays a major role in keeping a
strong connection between the universities and
the community.
In Egypt, facing complex social changes, it becomes
imperative to align university curricula and extra-
curricular activities to addressing and responding to
new challenges. One problem is that of lack of appro-
priate curricula addressing education for sustainable
development (ESD) as well as lack of teaching meth-
odologies that can support the infusion of ESD across
many disciplines. To address this, Cairo University
is now part of a regional project to help partner
higher education institutions develop curricula and
education methods addressing ESD through capac-
ity building of university staff and in turn transfer
those skills and knowledge to students to be able to
incorporate principles sustainable in their work and
lives.18 Another successful civic engagement project
on campus is the Hepatitis C Virus Awareness and
Combat Program currently incubated in Cairo Uni-
versity Kasr El Aini teaching hospital and funded by a
private foundation.
Further, in order to engage students in global issues,
the UNDP Egypt has partnered with Cairo University
in an award-winning MDG advocacy program that
raises awareness of the MDGs through a series of high
visibility seasonal and youth supported activities.
The program aims to sensitize youth on the MDGs
and develop a research platform on the perception
and the desirable path to adapt the implementation
of MDGs to Egyptian society through an interactive
learning and research system.
What is currently missing is a total vision for civic
engagement that properly engages students in broad
community activities that have an impact on society.
The concept of civic engagement, as a core educa-
tional subject, does not exist in traditional educa-
tion. In addition, reorienting existing education at all
levels to address sustainable development is urgent
and necessary
aDDressing the chaLLenges There are pertinent questions facing the reform of
the education system that can be classified as short,
medium to long-term challenges as follows:
Labor Market Absorption of Graduates from the Humanities & Social Sciences
The lack of a clear relationship between university
education in these disciplines and potential employ-
ment opportunities has been documented.19 With
65% of university students enrolled in humanities
and social sciences, the urgent question becomes how
to enhance the employability, production and earn-
ing capacity of these graduates? One way is to cre-
ate employment vacancies that fit their education and
interests. For example, it was found that female grad-
uates in the humanities were more interested in var-
ied social life, personal development and doing some-
thing useful for society.20 Based on this, jobs such as
working in kindergarten and nursery schools could be
seen as a good working environment for female stu-
dents who represent the majority of graduates in the
humanities.
Nevertheless, in the short-term, attention needs to be
paid to getting the message across to youth that they
may be enrolling in fields that suffer from potential
unemployment. The media, the Ministry of Educa-
tion, Ministry of Higher Education and Ministry of
Manpower need to invest in publicity campaigns to
reach out to youth from all social strata to inform
them about the skills and specializations for which
there is a shortage in the labor market. To compli-
ment this, efforts should be directed towards reduc-
ing the popularity of studies that involve status sym-
bols. Such as, medecine. Furthermore, an efficient
career counseling system is important for matching
the demand with supply for university students.
In Egypt, the information available to young people
does not allow them to make realistic choices con-
cerning the options available to them. A database
Egypt Human Development Report 2010{ 52 }
needs to be developed and made publicly available on
the demand for occupations and the growing sectors
in the economy. In addition, more emphasis should
be placed on entrance requirements that link up to
market needs. Complimenting university education
with high quality and well integrated training pro-
grams that equip young students with the basic skills
needed in the labor market is also needed (see Chap-
ter 12). Language and computer skills, in addition to
life skills, have become basic, necessary and elemen-
tary (see Chapters 8 and 14).21
Reallocation of Post Secondary Education Finance
Weak internal democracy is a problem constraining
the performance of higher education institutions in
Egypt. University councils are appointed, as opposed
to elected, by the Minister of Higher Education, and
students are rarely, if at all, consulted on issues of
education policy. This is contrary to the experience of
Europe, where students and academic staff have a say
in the management of their universities.22
Achieving autonomy requires reforms aimed at
allowing more freedoms in deciding optimal number
of students, hiring academic and non-academic staff,
and regular assessment and performance-based pay-
ment schemes. It also implies more freedom in creat-
ing new funding sources that include cost recovery,
providing training programs, technical and consul-
tancy services, as well as collecting donations. Auton-
omy also means more freedom in distributing finan-
cial resources amongst different chapters and depart-
ments based on objective criteria.23
Introducing competition between universities
requires that the public finance of higher education
shifts from a supply-side strategy to a demand-side
one. Rather than direct funding, indirect fund-
ing should be used where allocations are forwarded
based on a formula that uses various performance
indicators such as: Full-time enrollment, specializa-
tions, publications in mainstream journals, research
projects awarded by competition and the number of
distinguished academic staff. Further, cost sharing,
although socially and politically sensitive, is a poten-
tial mechanism for financing higher education, where
the burden of the cost of higher education shifts from
the government to the students, through tuition fees.
This should be paralleled with financial assistance
schemes to ensure equal access for the poor.24
Inclusion of Poor through Education
Policies need to seriously address the limitations that
face children of poor families to achieve in school edu-
cation and to qualify for higher education. Programs
need to address two major limitations that start at the
household. The first relates to the financial aspect of
education, with targeted programs providing cash or
in-kind support that would be conditional on chil-
dren’s enrollment in schooling. Nutrition and meal
plans are important for poor students and help sub-
sidize the cost of education for those who come from
poor families. The second equally important domain
relates to educating parents on the need for paren-
tal involvement in their children’s education and the
necessary environment for children to learn and grow
in a healthy manner.25
The schooling system also needs to address the
inequality in resource distribution. More resources
need to be allocated to improving the schooling
environment in poorer areas along with the student-
teacher ratios. Special incentive programs are needed
for schools in rural and poor areas to attract experi-
enced teachers that can make a difference in the edu-
cation process.
For higher education, grants, scholarships and vouch-
ers should be directly made to students, with eligibil-
ity contingent on performance26. Applying a grant
system requires an efficient and independent body
that selects eligible students. Another means through
which higher education can be made more equitable
is by making income contingent loans (ICL) avail-
able to finance their education. ICLs allow students to
cover the cost of tuition and living expenses, against
their future income earning capacity. The question
becomes which students to finance given the infor-
mation asymmetries related to tracking performing
students. Here, government can play a role in selec-
tion and tracking of students; it can also play a role
in collecting repayments though the tax authorities.27
Another means of financing higher education is
Egypt Human Development Report 2010 { 53 }
though a graduate tax. Under this scheme, students
obtain funds through issued government debt. When
they graduate, they pay a fraction of their lifetime
income to government in the form of a graduate tax.
The government pools revenues from graduate tax
to repay government debt including interest. Both
the ICL and graduate tax scheme have disadvantages
associated with insuring income risks.28
Cross subsidizing tuition fees in private universities
through private sector sponsors or endowments are
perceived as one mean through which more equal
access to private sector universities can be achieved.
NGOs can play a major role in solving the financing
problems of higher education. Most Arab countries
have long experienced religious-based volunteer-
ing participation in providing educational services
(Awqaf). This type of participation needs to be encour-
aged and extended to represent not only religious
motivations, but also secular social responsibilities.29
Improving the quality of private universities is also
necessary. Selection of students by ability as opposed
to market mechanism is perceived as one mean
through which quality of private university education
can be improved. The argument is that better quality
students enhance the quality of universities and thus of
competition. The United States takes it a step further
by applying aptitude tests that rate students according
to their innate intelligence and suitability for higher
education, rather than simple ability or knowledge,
which can be acquired through extra tutoring.30
DeManD-Driven eDucation for a service society
Evidence indicates that a highly skilled work force
can raise economic growth by about two-thirds of
a percentage point every year. This is quite a boost
to GDP growth given that the average annual GDP
growth rate worldwide for more than half a century
is 2 to 3%. Nevertheless, the definition of a highly
skilled workforce depends on the nature of the local
economy, changes in the global economy and the
associated drivers of competition.
In advanced economies, the demand is for more edu-
cated workers with the ability to respond flexibly to
complex problems, communicate effectively, manage
information, work in teams and produce new knowl-
edge. Since such countries have a high capacity for
innovation and their strategies are global in scope,
the workforce required to deal with this environment
is agile and able to deal with cross-border perspec-
tives and solutions, and apply tangible skills such as
language proficiency and skills that are less tangible,
including greater sensitivity to cultural differences,
openness to new and different ideas, and the ability
to adapt to change. Thus, essential learning outcomes
for higher education can include knowledge of human
cultures and the natural world, intellectual and prac-
tical skills, personal and social responsibilities, and
integrative learning.
To capitalize on the cumulative effect of education,
it is important to infuse these skills throughout the
educational system starting from primary school.
In Egypt, what is highly needed is a demand driven
education system that responds to the needs and
challenges of the marketplace and the global envi-
ronment in a timely fashion. For instance, for rapidly
computerizing industries and companies with heavy
ICT investments, there is a rising demand for prob-
lem solving, expert thinking and complex communi-
cations skills. Egypt’s nascent outsourcing services
require proficiency in languages other than Arabic.
An understanding of other cultures demands integra-
tive learning. Given the complexity of the develop-
ment process, growth challenges and global competi-
tion, the nature of educational reforms need to reflect
these eminent realities by devoting more resources to
creating incentives for better educational output.31
There is therefore the necessity to improve curricula
and extra-curricular content to reflect the increased
demand for soft and hard skills demanded by Egypt’s
service economy. At the same time, the government
cannot provide all educational services but should
utilize partnerships (contractors, alternative provid-
ers and complementary sponsors of certain educa-
tional activities) in a flexible manner that takes into
consideration priorities of partners.32 Indeed, an
important element of reform is close coordination
with the private sector to understand where the skills
shortages are, where partnerships can help address
shortages and where the public sector should inter-

Egypt Human Development Report 2010{ 54 }
vene to address market failure. However, partner-
ing with the private sector is not simply about joint
projects and contracting out education services, but
rather it is more about having a shared vision about
where education should be heading and how to best
achieve this.
More importantly, a concerted effort from soci-
ety, governments and business needs to be directed
towards dismantling the culture of hierarchy in
knowledge creation and dissemination that has
emerged in Egypt over several decades. Too much
emphasis on higher education and credentials as
being the prestigious route while downplaying the
role of adult education (lifelong learning, second
chance programs, vocational education) are coun-
terproductive and impact on economic development,
creating serious shortfalls in skilled and semi-skilled
labor.33 This unfortunate trend labels vocational edu-
cation as socially and educationally inferior since it
attracts mainly students with limited scores in the
lower secondary (preparatory) education stage. This
reinforces negative stereotypes and social constructs
while contributing to a system of plentiful university
students with social status but no jobs. There is in
Egypt a serious need to move to a merit-based system
that respects and rewards all types of education.34
There are many promised positive returns to demand-
driven education by modernizing and strengthening
ICT infrastructure in all schools, activating the role of
information system management in the educational
process, supporting the best use of ICT in distance
learning and training, building capacities in the ICT
domain, and merging different departments which
deal with ICT into one sector to achieve unity and
efficiency. However, at present, most projects are tak-
ing place at preparatory and secondary levels of edu-
cation. And even though many schools are equipped
with computers, these are not used effectively due to
lack of specialized personnel educated and trained on
the use of ICT.35
Currently, a number of schools and administrative
departments are provided with computers, technol-
ogy infrastructure and equipment, technology labs,
information systems, and ICT administrative man-
agement. Computer textbooks for students with spe-
cial needs, as well as students of technical and nurs-
ing schools have been produced. In higher educa-
tion, ICT infrastructure is growing and ICT services
are reaching more universities. Yet, universities still
suffer a shortage of qualified academic and adminis-
trative staff; students who are capable of implement-
ing ICT solutions and applications to achieve quality
learning; incentives to maintain qualified personnel;
relevant learning material that suits the nature of
e-learning; and awareness of undergoing ICT proj-
ects and services among students, and even among
faculty staff.36
A number of actions could help maximize the impact
of ICT on education outcomes:37
• Coordinate planning among MOE, MOHE and
MCIT for unified ICT solutions across the educa-
tion system;
• Expand training activities to include all schools,
universities and higher education institutions;
• Plan a long term-matrix for ICT training to avoid
duplication of efforts and guarantee unified level
of ICT skills at specified milestones by the end of
each educational stage;
• Increase awareness of e-learning and ICT capa-
bilities among students, staff and parents and on
how ICT can relate to better learning;
• Integrate more ICT courses into school or uni-
versity curricula and assure that those courses
are presented accurately and effectively:
• Motivate and teach students and instructors to
employ e-learning as part of the school or uni-
versity daily learning activities;
• Take advantage of youth eagerness to use inter-
net communication tools such as chat rooms
and emailing services and employ these tools
by encouraging new information, submitting
assignments electronically, or online discussion
of school or university-related issues;
• Invite skilled and qualified students to collabo-
rate and participate in the planning of ICT inte-
gration and training at their universities.

Egypt Human Development Report 2010 { 55 }
Endnotes1 Fahim and Sami, 20092 El-Shair, 20093 Elwan, 20094 CAPMAS, 20075 Achievers are identified as those who scored more than 90% in the final examinations in the final year of each education stage.6 ibid7 ibid8 ibid9 ibid10 El-Araby, 200911 Barsoum, 200912 World Bank, 200813 World Economic Forum, 200714 Nassar, 200915 The ILO survey was undertaken to assess the opportunities and challenges facing young Egyptian people age 15-29 in the labour
market as they first exit school. The survey targets 5 different groups of respondents, as well as employers and managers hiring young workers.
16 Nassar, 200917 ibid18 Identified by the UNESCO Regional Bureau for Education in the Arab States-Beirut19 Elwan, 200920 Lightbody and Dumdell, 199621 Nassar, 200922 Jacobs and Van der Ploeg, 200623 El-Araby, 200924 ibid25 Barsoum, 200926 Vouchers are not nessarily grants but a mixture of grant and loan. The composition of the voucher may vary with type of study
and student characteristic (El-Araby, 2009)27 Barsoum, 200928 ibid29 Kanaan et al, 200930 Jacobs and Van der Ploeg, 200631 World Bank, 200832 ibid33 Handoussa and Abou Shnief, 200934 Handoussa and Abou Shnief, 200835 El-Shair, 200936 ibid37 Ibid
referencesBarsoum, G. 2009. “Success in Education: A Focus on the Journey before the Destination.” Background Paper for the Egypt Human
Development Report 2010. Committee on Institutional Cooperation. 2004. “Benchmark Standards for Engagement Across the Mission: Dilemmas Provoked by
Intra and Inter-Institutional Diversity.” Committee on Institutional Cooperation, Pennsylvania State University.El-Araby, Ashraf. 2009. “Access and Equity in Higher Education: A Comparative Assessment of Financing Policies in Six Arab
Countries.” Paper presented at the ERF Regional Conference on Financing Higher Education. Amman, 17-18 June.El-Shair, H. 2009. “ICT Role in Education?” Background paper for the Egypt Human Development Report 2010. Elwan, F. 2009. “Youth Unemployment and Early Education in Egypt.” Background paper for the Egypt Human Development Report
2010. Fahim, Yasmine and Sami, Noha. 2009. “Financing Higher Education in Egypt.”Paper presented to the ERF Regional Conference on
Financing Higher Education in Arab Countries, Amman, 17-18 JuneHandoussa, H. and Abou Shnief, H. 2008. “Unleashing the Potential for Pro-Poor Growth in the Arab Region.” Paper presented to the
Arab Economic Summit, Kuwait, January.Jacobs, B. and F., Van Der Ploeg. 2006. “Guide to Reform of Higher Education: A European Perspective,” Economic Policy, July,
pp.535-592. Nassar, H. 2009. “University Education for Life.” Background paper for the Egypt Human Development Report 2010. Partnership for 21st Century Skills. 2008. “21st Century Skills, Education and Competitiveness: A Resource and Policy Guide.” Tuscon:
Partnership for 21st Century Skills. World Bank. 2008. “The Road Not Traveled: Education Reform in the Middle East and North Africa.’’ MENA Development Report.
Washington D.C.

Egypt Human Development Report 2010{ 56 }
MOE planned objectives2007-2012
Modernize and strengthen the technology infrastructure in all schools to enable them to effectively apply the new curriculum, innovated learning and teaching methodology, school based management, and pupil assessment
MOE planned targets2007-2012
Provide schools with the minimum requirements of technology infrastructure needed to support educational practices within the school.
Provide 50 % ofprimary schools withtechnology infrastructureduring the five years of the plan
Complete installation of ICT infrastructure in the preparatory schools (that are not covered by EEI) during the five years of the plan (2007/2012).
Provide secondary schools with ICT infrastructure during the five years of the plan (2007/2012).
MOE planned activities2007-2012
Provide (25,600) school buildings with six computers (for each)Provide schools (17,350) in the plan with school network and broadband internet connection.
Provide 49,956 classrooms in the pre-primary level with one computer and one data show.
Provide 13,333 community classroom schools with one computer and one data show.
Provide 3,500 (25 %) of the primary schools with a lab containing ten computers, data show, screen, and a LAN.
Provide 3,500 (25 %) of the primary schools with a mobile computer unit, one laptop, and data show.
Provide 100 % of primary schools with the needed software for visual labs.
Provide 7,000 prep. schools with computer lab, LAN, and data show, a mobile computer unit, laptop and a data show
TDC achievements by 2008
30,1131 computers
35,431 data show equipment
24,000 science labs
22,000 satellite and receiver equipment
1400 computer labs
1000 smart board
500 physics laser lab
22,000 schools with internet connection
64 distance training centers
105 Mps Internet connectivity
368 multimedia software
82 e-courses
1000 satellite internet connected remote areas –schools
500 laser physic labs
1 graphic movie
ANNEX 4.1: TDC ICT Infrastructure Outcomes In Relation to MOE Strategic Plan 2008

{ 57 }
YOUTH AND SOCIAL VALUES: A READING INTO THE WORLD VALUES SURVEY – EGYPT 2008
Chapter Five
At any given time, value systems act as points of reference and beliefs adopted by persons as a general orientation to direct their lives, and they are an integral part of their perception
of the world. A set of social values — with its range of consensus and contradiction — is a mirror that reflects on certain human behaviors in a given period of time. Youth in Egypt, like all social categories, per-ceive the present and the future through such a set of values. But young people do not constitute a homogenous group,1 even though together, they represent a large segment of the total population; they belong to many different groupings, socially, economically and culturally. This proposition implies that young people belong to diverse and changing value landscapes, and are becoming moral agents in identity formation for the social groups that generate ethical codes — such as family,2 peer groups and friends,3 the local community4 and the world of consump-tion.5

Egypt Human Development Report 2010{ 58 }
In the West, the emergence of individualism, a rejec-
tion of convention,6 and the increasing value placed
on self expression7 has weakened the social bonds
created by group conformity and cooperation. Has
this new environment had an impact on Egyptian
youth? How far are Egypt’s youth similar to or differ-
ent from their counterparts in other countries? How
do youths’ perceptions sometimes differ from those of
older persons living in the same country?
The World Values Survey (WVS) and its application
to Egypt gives some answers to these questions. The
WVS is a worldwide investigation of socio-cultural
and political change. It is conducted by a network of
social scientists at leading universities all over the
world and is coordinated by the central body, the
World Values Survey Association. These social scien-
tists survey the basic values and beliefs of the public
of over 90 societies on all continents (covering 85%
of the world’s population). The WVS is designed to
test the hypothesis that economic and technological
changes transform the basic values and motivations
of the people of industrialized societies.
Each survey in the WVS is conducted through local
funding, and in exchange for providing data with
the representative national sample of a minimum
of 1,000 people in their society, each research group
is allowed instant access to the data of all countries.
This allows for immediate cross-cultural comparisons
with regards the basic values and beliefs of people in
all societies. Moreover, the database makes it pos-
sible to examine cross-level linkages, such as between
public values and economic growth or between politi-
cal culture and democratic institutions.
The analysis presented in this section focuses on
Egypt and depends on a limited number of 18 com-
parator countries plus Egypt for the purposes of sim-
plification. These include a number of developing
countries with diverse cultures as well as a number of
economically developed countries, all of which reflect
a cultural and historical diversity expected to have an
impact on the entire body of values.
The survey in Egypt was made on a sample of 3050
adults aged 18 or more. The sample data were col-
lected in 2008 at several stages: First, a stratification
of the general frame in 26 governorates was made
across Egypt; second, each governorate was divided
into blocks according to population categories; and
third, each sample was divided according to the stan-
dard of education; finally, the fourth stage was a ran-
dom selection of a household sample within the gen-
eral framework of the sample. In light of these pro-
cedures, data were collected by personal interviews.
The subsample of Egyptian youth was 712 individ-
uals aged 18-30 and represented 23% of the total
sample. The males in the youth sample represented
40% compared to females at 60%. Another feature
was that 61% live in rural areas compared to 39% in
urban areas. Intermediary or lower level education
predominated.
Following are some of the salient features emerging
from the youth sample. An interpretation of results
is provided according to the determinants that affect
young peoples’ orientations, in addition to a com-
parison with the older generation, whenever possible.
Further, a comparison is made with the data from
the group of 18 countries selected other than Egypt
to explore whether value orientations of young Egyp-
tians are similar to the values expressed by young
people in other countries.
Desire for the gooD Life but with no resPonsibiLity Expressed values clearly show an identification of
what constitutes ‘good’ living, largely in line with
modern lifestyles. A good life worth living is identi-
fied in six main qualities, chief among which is inde-
pendence. Sixty-eight percent of the sample surveyed
said they preferred to develop an independent char-
acter rather than emulating others. This percentage
increases among youth with a university education.
This is followed by the achievement of success, fulfill-
ment and happiness, the application of science and
technology, paying attention to the environment, pro-
tecting nature and finally, leading a risk-free life.
Happiness
Eighty-six percent of the sample said that they were
happy with their life. More than half said that it was
important for a person to have a good time and sci-
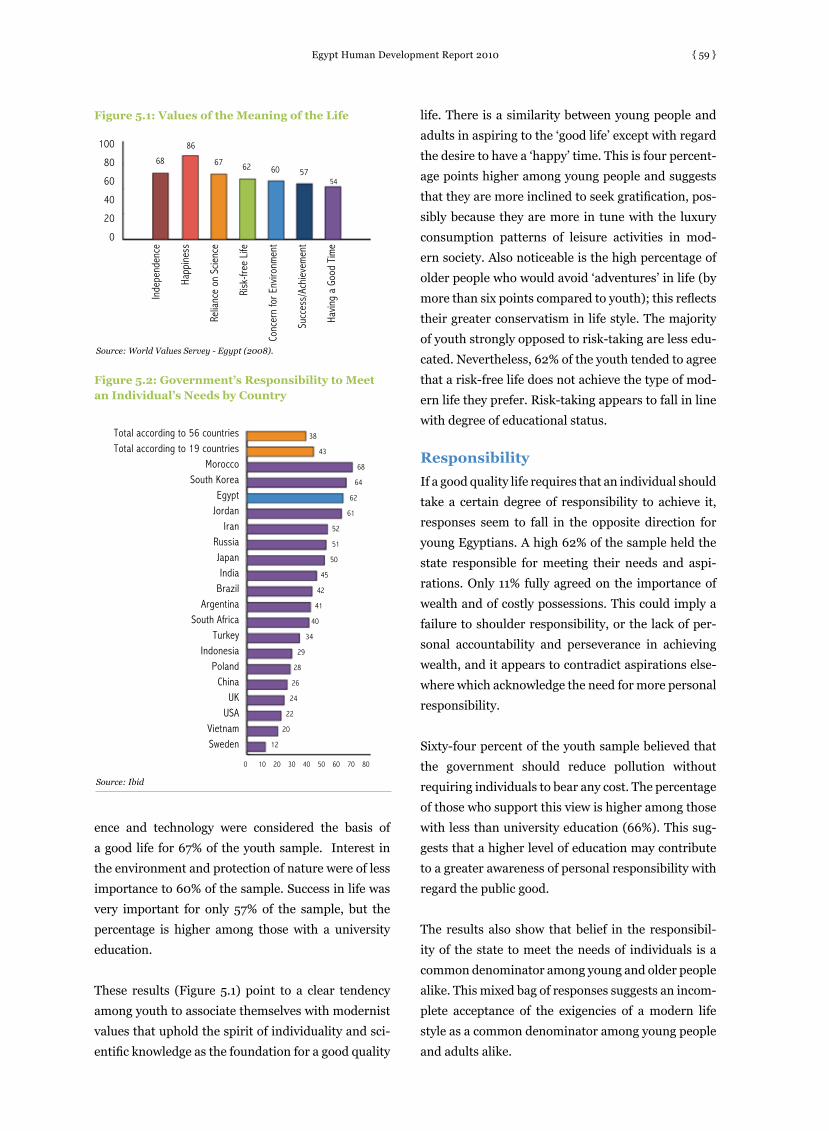
Egypt Human Development Report 2010 { 59 }
life. There is a similarity between young people and
adults in aspiring to the ‘good life’ except with regard
the desire to have a ‘happy’ time. This is four percent-
age points higher among young people and suggests
that they are more inclined to seek gratification, pos-
sibly because they are more in tune with the luxury
consumption patterns of leisure activities in mod-
ern society. Also noticeable is the high percentage of
older people who would avoid ‘adventures’ in life (by
more than six points compared to youth); this reflects
their greater conservatism in life style. The majority
of youth strongly opposed to risk-taking are less edu-
cated. Nevertheless, 62% of the youth tended to agree
that a risk-free life does not achieve the type of mod-
ern life they prefer. Risk-taking appears to fall in line
with degree of educational status.
Responsibility
If a good quality life requires that an individual should
take a certain degree of responsibility to achieve it,
responses seem to fall in the opposite direction for
young Egyptians. A high 62% of the sample held the
state responsible for meeting their needs and aspi-
rations. Only 11% fully agreed on the importance of
wealth and of costly possessions. This could imply a
failure to shoulder responsibility, or the lack of per-
sonal accountability and perseverance in achieving
wealth, and it appears to contradict aspirations else-
where which acknowledge the need for more personal
responsibility.
Sixty-four percent of the youth sample believed that
the government should reduce pollution without
requiring individuals to bear any cost. The percentage
of those who support this view is higher among those
with less than university education (66%). This sug-
gests that a higher level of education may contribute
to a greater awareness of personal responsibility with
regard the public good.
The results also show that belief in the responsibil-
ity of the state to meet the needs of individuals is a
common denominator among young and older people
alike. This mixed bag of responses suggests an incom-
plete acceptance of the exigencies of a modern life
style as a common denominator among young people
and adults alike.
Figure 5.1: Values of the Meaning of the Life
Inde
pend
ence
Happ
ines
s
Relia
nce
on S
cienc
e
Risk
-free
Life
Conc
ern
for E
nviro
nmen
t
Succ
ess/
Achi
evem
ent
Havin
g a
Good
Tim
e
86
67 62 60 5754
Source: World Values Servey - Egypt (2008).
68
Figure 5.2: Government’s Responsibility to Meet an Individual’s Needs by Country
Total according to 56 countriesTotal according to 19 countries
MoroccoSouth Korea
EgyptJordan
IranRussiaJapanIndia
BrazilArgentina
South AfricaTurkey
IndonesiaPoland
ChinaUK
USAVietnamSweden
Source: Ibid
38
43
68
64
62
61
52
51
50
45
42
41
40
34
29
28
26
24
22
20
12
ence and technology were considered the basis of
a good life for 67% of the youth sample. Interest in
the environment and protection of nature were of less
importance to 60% of the sample. Success in life was
very important for only 57% of the sample, but the
percentage is higher among those with a university
education.
These results (Figure 5.1) point to a clear tendency
among youth to associate themselves with modernist
values that uphold the spirit of individuality and sci-
entific knowledge as the foundation for a good quality
0 10 20 30 40 50 60 70 80
100
80
60
40
20
0
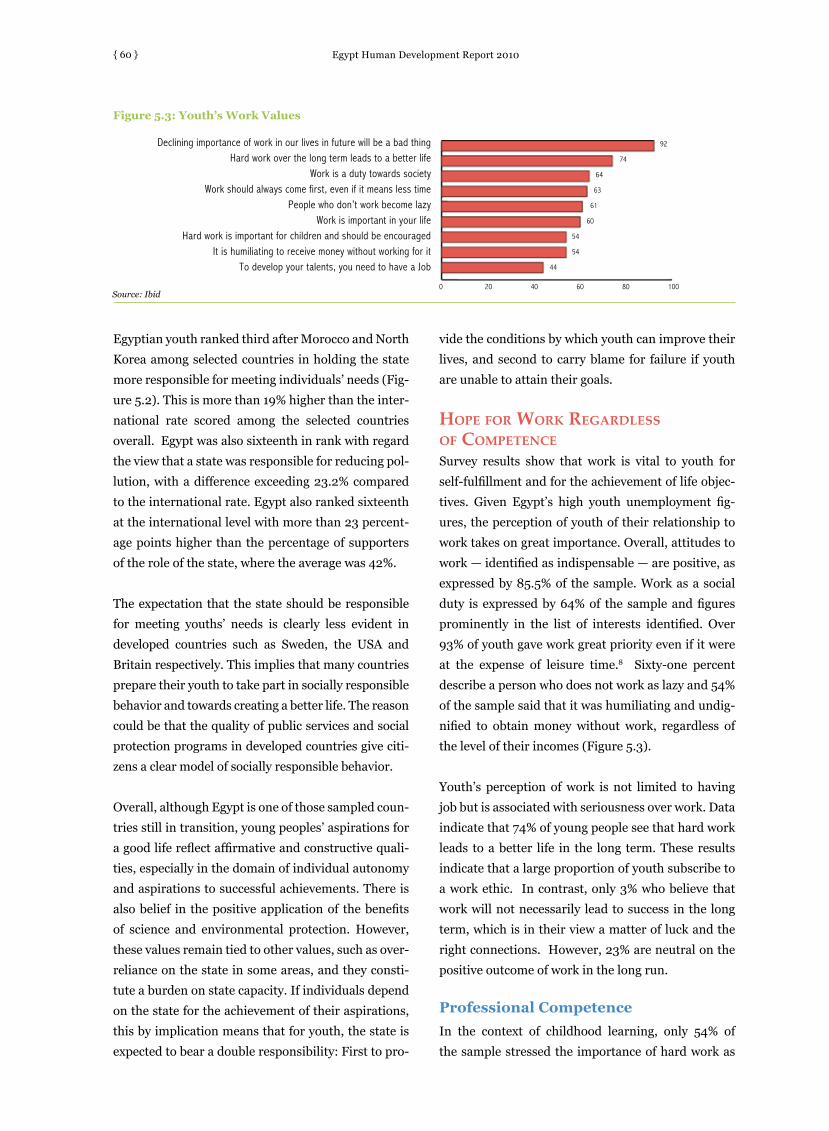
Egypt Human Development Report 2010{ 60 }
Egyptian youth ranked third after Morocco and North
Korea among selected countries in holding the state
more responsible for meeting individuals’ needs (Fig-
ure 5.2). This is more than 19% higher than the inter-
national rate scored among the selected countries
overall. Egypt was also sixteenth in rank with regard
the view that a state was responsible for reducing pol-
lution, with a difference exceeding 23.2% compared
to the international rate. Egypt also ranked sixteenth
at the international level with more than 23 percent-
age points higher than the percentage of supporters
of the role of the state, where the average was 42%.
The expectation that the state should be responsible
for meeting youths’ needs is clearly less evident in
developed countries such as Sweden, the USA and
Britain respectively. This implies that many countries
prepare their youth to take part in socially responsible
behavior and towards creating a better life. The reason
could be that the quality of public services and social
protection programs in developed countries give citi-
zens a clear model of socially responsible behavior.
Overall, although Egypt is one of those sampled coun-
tries still in transition, young peoples’ aspirations for
a good life reflect affirmative and constructive quali-
ties, especially in the domain of individual autonomy
and aspirations to successful achievements. There is
also belief in the positive application of the benefits
of science and environmental protection. However,
these values remain tied to other values, such as over-
reliance on the state in some areas, and they consti-
tute a burden on state capacity. If individuals depend
on the state for the achievement of their aspirations,
this by implication means that for youth, the state is
expected to bear a double responsibility: First to pro-
vide the conditions by which youth can improve their
lives, and second to carry blame for failure if youth
are unable to attain their goals.
hoPe for work regarDLess of coMPetence Survey results show that work is vital to youth for
self-fulfillment and for the achievement of life objec-
tives. Given Egypt’s high youth unemployment fig-
ures, the perception of youth of their relationship to
work takes on great importance. Overall, attitudes to
work — identified as indispensable — are positive, as
expressed by 85.5% of the sample. Work as a social
duty is expressed by 64% of the sample and figures
prominently in the list of interests identified. Over
93% of youth gave work great priority even if it were
at the expense of leisure time.8 Sixty-one percent
describe a person who does not work as lazy and 54%
of the sample said that it was humiliating and undig-
nified to obtain money without work, regardless of
the level of their incomes (Figure 5.3).
Youth’s perception of work is not limited to having
job but is associated with seriousness over work. Data
indicate that 74% of young people see that hard work
leads to a better life in the long term. These results
indicate that a large proportion of youth subscribe to
a work ethic. In contrast, only 3% who believe that
work will not necessarily lead to success in the long
term, which is in their view a matter of luck and the
right connections. However, 23% are neutral on the
positive outcome of work in the long run.
Professional Competence
In the context of childhood learning, only 54% of
the sample stressed the importance of hard work as
Declining importance of work in our lives in future will be a bad thing Hard work over the long term leads to a better life
Work is a duty towards societyWork should always come first, even if it means less time
People who don’t work become lazyWork is important in your life
Hard work is important for children and should be encouragedIt is humiliating to receive money without working for it
To develop your talents, you need to have a Job
Figure 5.3: Youth’s Work Values
92
74
64
63
61
60
54
54
44
Source: Ibid0 20 40 60 80 100

Egypt Human Development Report 2010 { 61 }
something to be learnt at a young age. This very aver-
age figure may suggest that young people are more
focused on their own lives and future rather than on
the education of the coming generations. Continued
employment for themselves over the longer term is
more central to 92% of respondents and many young
people expressed the belief that work was also of vital
interest in the nearer future.
Thus, it appears that work is seen to provide the
opportunity for betterment. It is with this hope that
a person can fully aspire to achieve objectives and
life goals. However, young people appeared to see no
point in identifying the type of work pursued, and 44%
believed that a full development of skills primarily
depended on first being given any work opportunity
rather than matching job choice to career expecta-
tions.
The majority of those who expressed these views were
males with a university degree. This suggests that the
wish for any employment rather than a career path
is largely associated with young men, especially those
with a higher education and striving to enter and
remain in the labor market. Given high unemploy-
ment rates among these specific young cohorts, it is
not surprising that a priority is the prospect of achiev-
ing a minimum standard of living to enable them to
achieve the basic necessities for marriage and family
formation.
Survey data support the following fears in the search
for work: Respondents were asked to choose between
four options and rank them as first and second pri-
ority in their search for employment. The options
included good pay to avoid financial worries, a secure
job without the risk of firing or unemployment, work-
ing with persons one likes, or doing work that gives a
sense of fulfillment. The results (depicted in Figure
5.4) indicate that getting a secure (permanent) job
is the top priority for 41% of the sample. This is fol-
lowed by 39% expressing preference for a good pay-
ing job. The next priority is work that gives a sense of
fulfillment as expressed by 11% of the sample, while
work with ‘persons we like was chosen by only 8%.
Although the percentages are close between males
and females in the order of priorities, the percentage
of males is higher regarding the quest for a secure job
and good pay. Women scored slightly higher regard-
ing the values of self-fulfillment in work and close
relations with colleagues.
Data also indicate that persons with less than a uni-
versity education represent a large percentage of
those who consider the values of secure jobs and good
pay important to them — 40% and 42 % respectively,
in contrast to only 36% and 37% respectively of uni-
versity graduates. The percentage of persons with
university education was higher with regard personal
fulfillment and close relations with colleagues. Over-
all, findings suggest that males with less education
are more pragmatic and materially concerned, while
females with a higher education tend to see moral
considerations important in their attitude to work.
Figure 5.4: Priority in Job Search
A secure JobA good income
A job with sense of fulfillmentWorking with people you like
Figure 5.5: The Value of Aptness and Fulfillment in Work by Country
Total of 56 countriesTotal of selected 19 countries
SwedenIran
Brazil UK
JapanTurkey
USAIndonesia
PolandChina
ArgentinaSouth Korea
JordanEgypt
South AfricaVietmanMorocco
RussiaIndia
Source: Ibid
Source: Ibid
20
20
47
37
30
29
27
26
25
20
20
19
14
13
12
11
11
11
10
9
8
41
39
11
8
0 5 10 15 20 25 30 35 40 45
0 10 20 30 40 50

Egypt Human Development Report 2010{ 62 }
International comparisons show that Egypt ranks
fourteenth with regard the values of aptness and ful-
fillment as their top priority in their search for work.
Those who had this preference represent 11% com-
pared to the international figure of 20% at the levels of
both the selected 19 countries in this survey and that
of the total 56 countries in the overall and larger sur-
vey on youth and social values. There appears to be no
clear relation between level of progress and youth opt-
ing for excellence and fulfillment. Support for these
values is high in advanced countries such as Swe-
den as well as in other less developed countries such
as Iran and Brazil. However, the high percentage in
Sweden and the lower percentages in other advanced
countries such as the UK, Japan, the US and South
Korea show that there are discrepancies even among
the developed countries themselves (Figure 5.5).
A comparison of Egypt to other countries with simi-
lar social, economic and cultural conditions, nota-
bly Iran, Brazil and Turkey, shows that Egypt lags
relatively in terms of aptitude for and fulfillment in
work (Figure 5.5). This suggests that the difficulties
associated with finding employment impact young
people’s priorities strongly in Egypt. For youth, get-
ting a secure job with a good income becomes more
important than other considerations such as capacity
or personal satisfaction. In addition, a certain fatal-
ism among Egypt’s youth partly explains the accep-
tance of any secure job – there is reluctance to turn
down ‘a lucky break’ or to ‘tempt fate’ or risk losing
an opportunity.9
vaLues of a free econoMy Starting with the economic structural adjustment pro-
gram in 1991, Egypt underwent dramatic economic
changes over a period of eighteen years towards cre-
ating a free economy. Previously, the state had been
responsible for all aspects of the economy including
employment, asset ownership, production, distribu-
tion, price setting and the implementation of a large
subsidies program.
The relative change in conditions has been accompa-
nied by a shift in youth values. Young people appear
to be adopting values in line with a free and open
economy, as observed in the expression of positive
attitudes associated with income distribution, compe-
tition and acceptance of the private creation of wealth
(Figure 5.6). On the other hand, some values appear
to contradict the foundations of an open economy,
such as derisory attitudes to savings, continued sup-
port for state ownership of the business and industrial
sectors, and support of high taxation for the rich but
state support for the poor.
Rewards for Performance
Ninety-five percent of the sample expressed support
for the principle of justice or fair dealing in linking dif-
ferences in income to efficiency at work. Supporters
of this position are mostly university educated. This
finding reflects a major change in the views on social
justice. Previously, it was confused with the concept
of egalitarianism, especially among generations of
civil servants. These found it acceptable that most
staff received equal pay and promotion, regardless
of disparities in levels of performance and efficiency.
The survey indicates that this is no longer acceptable
in the view of both younger and older generations. It
suggests a general realization of the significance of
differentials: Equating equality with egalitarianism
holds back rewards for distinction and efficiency in
work performance.
Figure 5.6: How Far Youth Values are linked to Free Economy
Income according to efficiency
Competition is good
Government Ownership
Children can be encouraged to save moneySave money
95
75
68
52
50
48
28
6
Source: Ibid0 20 40 60 80 100

Egypt Human Development Report 2010 { 63 }
Competition is an important value to 68% of the
youth sample. This is believed to generate greater
commitment to work and encourage creative think-
ing. Supporters of this viewpoint are more numer-
ous among university graduates accounting for 75%
in contrast to 67% of young people with lower levels
of education. This suggests that education plays an
important role in promoting the values of competi-
tiveness among youth and that the young genera-
tion — especially those with a better education — is
more open to developing skills, acquiring knowledge
and new experiences, and is more apt to compete
for improved work opportunities. However, belief
in competitiveness remains contingent on the pres-
ence of prospects for social mobility, recognition of
talent, and on equal opportunities for all — regard-
less of circumstances and social recognition.
Attitudes to Wealth Creation
Societies progress and become more affluent through
the opportunities they give to citizens for wealth cre-
ation and accumulation. In this respect, the survey
shows that more than half the youth sample felt posi-
tive about prospects for increasing wealth in society,
provided there is ‘enough for everybody.’ On the
other hand, 11% of the sample expressed the view
that “people can only get rich at the expense of oth-
ers.” Thirty-seven percent adopt a moderate stand
vis-a-vis wealth in society working for the good or the
bad. The survey data show that 60% who see compe-
tition as positive also see wealth creation as possible
and the potential resources sufficient for all. The cor-
relation between competition and wealth creation is
positive and supports growth in a free economy.10
Among the less educated, supporters of increased
wealth through work for all was 53%, compared to
46% among university graduates. This may suggest
that young people with less education believe the
road to wealth is not restricted to levels of educa-
tion. Evidence of social change among some groups
in society, especially with regard to manifestations of
wealth, indicates that this is not contingent on edu-
cation (and this is the case in the areas of trade and
business). On the other hand, some middle class cat-
egories that have received a higher education are not
able to enjoy any like degree of affluence most notably
among teachers, lawyers, university professors, and
other salaried professional groups. This represents
the erosion of a financial mobility enjoyed previously.
Similarly, the data also indicate that the positive atti-
tude towards wealth in society is higher among the
unemployed than among those who are employed, at
57% versus 49%, respectively. This may reflect wish-
ful thinking or the recognition that it is possible to
get rich without work as a result of the unrealistic
promotions of the culture of luxury consumption by
advertising and the media. Manifestations of corrup-
tion that have made some rich without hard work or
excellence may also be a contributing factor.
Savings Behavior
As confirmation, data have shown that in the past
years, the families of most youth were less used to
saving, which is a core value supportive of economic
growth and capital formation. As seen in Figure 5.7,
those in favor of saving represent only 6% but are at
14.3% among university graduates and drop to 5% for
those with lower than university education. Saving as
a value youth would like to develop in their children
is at a low 28%.
Poor savings behavior among Egyptian youth may
be due to the spread of a consumer culture that
encourages spending beyond actual economic means.
This could imply that the consumption style among
many young people is no longer based on the needs-
resources equation.11 Further, the link between low
saving trends and low educational level could indicate
that the less educated youth — often with less dispos-
able income — also find self-fulfillment in spending.
According to data at the international level, the poor
rating for ‘saving’ in Egypt ranks it last among 19 coun-
tries, with a difference of less than 18 percentage points
and which reaches 24%. Japan, Sweden and the USA
occupy the first top three positions in youth’s resolve
to make savings, ranging from 37% to 45%. The value
of saving is usually linked to the level of progress in
developed societies, but in countries facing economic
and social conditions similar to Egypt — that is, India,
Morocco, Vietnam and Jordan, for example – the value
of saving still ranks higher than in Egypt.

Egypt Human Development Report 2010{ 64 }
Public Versus Private Ownership
Some values from Egypt’s socialist era still remain.
This is evident in attitudes towards ownership of
business, the private sector and taxation policy.
Regarding business and industry sector ownership,
50% of the sample expressed support for the need to
increase state ownership, compared to only 9% sup-
porting private sector ownership. As for the remain-
ing 41% of young people in the survey, they fall at the
midpoint between the two positions (Figure 5.8). On
this issue, attitudes are close irrespective of the level
of education.
A comparison of Egypt’s rank with other countries
with regard to private ownership shows that Egypt
lags far behind at eighteenth position in respect to
strengthening the role of the private sector. The
difference is 14% less than the international 15%.
Egypt’s position is relatively lower than Arab, African
and Asian countries similarly in economic transfor-
mation, notably Jordan (which ranks first), Vietnam,
India, Iran, South Africa and Morocco. However,
regarding support of state ownership of the business
and industry sector, Egypt ranks second in the world
after Argentina. The difference is more than 18 points
above the international average support of state own-
ership of 32%. Sweden, Japan and the USA rank at
bottom of the list.
These results are not necessarily an indication of the
success of the public and government sectors as much
as indicative of the failure of the private sector to win
trust as an engine of economic transformation. In
spite of the many investment opportunities given to
the private sector and in spite of its important role
in absorbing unemployment, it is still having real
problems with development goals, social responsibil-
ity and poverty reduction. Further, the conditions of
employment often lack the permanence provided by
the public sector.
The media in Egypt has played an unhelpful role by
promoting negative images of the private sector and
businessmen in the community, through TV drama
and films, as well as provocative reports on nepo-
tism and corruption. For these reasons, many young
people perceive the state as a more dependable and
secure employer despite its poor pay. This is con-
firmed by the results of a survey conducted in collabo-
ration between the Information and Decision Support
Center and the National Center for Social and Crimi-
nological Research on the ‘dreams’ of Egyptians. The
results showed that 76.8% of the sample of young
people will seek government work for their children
Total according to 56 countriesTotal according to 19 countries
JapanUSA
SwedenIndia
IndonesiaChina
IranMoroccoVietnam
South AfricaJordanPoland
South KoreaArgentina
TurkeyBrazilEgypt
Figure 5.7: Youth Value of Savings by Country Figure 5.8: Ownership of Business or Industry by Country
Total according to 56 countriesTotal according to 19 countries
ArgentinaEgypt
PolandChina
IndonesiaBrazil
IranSouth Africa
JordanTurkey
IndiaVietnam
South KoreaMoroccoSweden
JapanUSA
State OwnershipNeutralPrivate Sector
Source: Ibid Source: Ibid
26
24
45
37
37
36
31
30
27
26
25
23
22
20
18
16
16
13
6
42
37
4829 26
4332 25
3954 7
50 9
42 20
44 19
47 16
2636
3335 32
40 27
2433 43
4126 33
21 33
63 17
6017
6113 26
79 17
56 40
37
37
37
33
25
21
26 26 26
24
0 10 20 30 40 500 20 40 60 80 100%
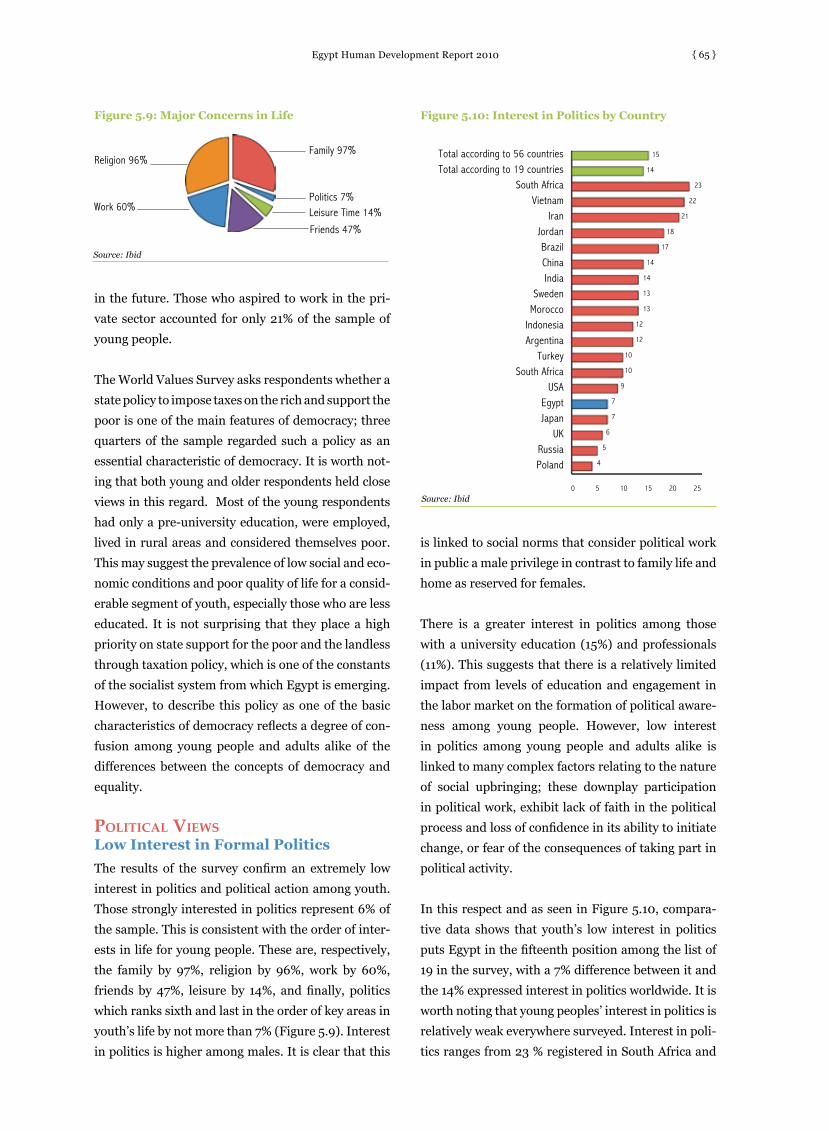
Egypt Human Development Report 2010 { 65 }
in the future. Those who aspired to work in the pri-
vate sector accounted for only 21% of the sample of
young people.
The World Values Survey asks respondents whether a
state policy to impose taxes on the rich and support the
poor is one of the main features of democracy; three
quarters of the sample regarded such a policy as an
essential characteristic of democracy. It is worth not-
ing that both young and older respondents held close
views in this regard. Most of the young respondents
had only a pre-university education, were employed,
lived in rural areas and considered themselves poor.
This may suggest the prevalence of low social and eco-
nomic conditions and poor quality of life for a consid-
erable segment of youth, especially those who are less
educated. It is not surprising that they place a high
priority on state support for the poor and the landless
through taxation policy, which is one of the constants
of the socialist system from which Egypt is emerging.
However, to describe this policy as one of the basic
characteristics of democracy reflects a degree of con-
fusion among young people and adults alike of the
differences between the concepts of democracy and
equality.
PoLiticaL viewsLow Interest in Formal Politics
The results of the survey confirm an extremely low
interest in politics and political action among youth.
Those strongly interested in politics represent 6% of
the sample. This is consistent with the order of inter-
ests in life for young people. These are, respectively,
the family by 97%, religion by 96%, work by 60%,
friends by 47%, leisure by 14%, and finally, politics
which ranks sixth and last in the order of key areas in
youth’s life by not more than 7% (Figure 5.9). Interest
in politics is higher among males. It is clear that this
is linked to social norms that consider political work
in public a male privilege in contrast to family life and
home as reserved for females.
There is a greater interest in politics among those
with a university education (15%) and professionals
(11%). This suggests that there is a relatively limited
impact from levels of education and engagement in
the labor market on the formation of political aware-
ness among young people. However, low interest
in politics among young people and adults alike is
linked to many complex factors relating to the nature
of social upbringing; these downplay participation
in political work, exhibit lack of faith in the political
process and loss of confidence in its ability to initiate
change, or fear of the consequences of taking part in
political activity.
In this respect and as seen in Figure 5.10, compara-
tive data shows that youth’s low interest in politics
puts Egypt in the fifteenth position among the list of
19 in the survey, with a 7% difference between it and
the 14% expressed interest in politics worldwide. It is
worth noting that young peoples’ interest in politics is
relatively weak everywhere surveyed. Interest in poli-
tics ranges from 23 % registered in South Africa and
Figure 5.10: Interest in Politics by Country
Total according to 56 countriesTotal according to 19 countries
South AfricaVietnam
IranJordanBrazilChinaIndia
SwedenMorocco
IndonesiaArgentina
TurkeySouth Africa
USAEgyptJapan
UKRussiaPoland
Figure 5.9: Major Concerns in Life
Religion 96%
Work 60%
Family 97%
Politics 7%Leisure Time 14%
Source: Ibid
Source: Ibid
Friends 47%
15
14
23
22
21
18
17
14
14
13
13
12
12
10
10
9
7
7
6
5
4
0 5 10 15 20 25

Egypt Human Development Report 2010{ 66 }
4% registered in Poland.
Comparative data also point to a regression in interest
in politics in countries with a long record of democ-
racy such as the United States, where those who con-
sider politics important in their lives represent only
9% of the sample. In this respect, the USA ranks four-
teenth while Japan and Britain come sixteenth and
seventeenth, registering 7% and 6%, respectively.
These results could mean that youth’s interest in poli-
tics is not necessarily linked to the general climate of
progress or to the level of democracy available, but
manifests itself rather in relation to major political
events or conflicts or to the social turmoil evident in
some countries.
Political Behavoir
The results of the survey indicate that voting by young
people did not exceed 29% of the sample in the last
parliamentary elections. Political party work is also
extremely limited and the number of party members
was at only 3% of the sample. This reflects a degree
of marginalization and exclusion of youth, some of
which is self-imposed since nearly all party programs
and platforms in Egypt appear not to attract youth or
cater to youth issues.
There are social and demographic determinants that
have an impact on participation in political action,
including gender, work and rural-urban consider-
ations. Data indicate that the majority of those who
take part in voting behavior are males, accounting for
45% in contrast to the lower female 17%. Most males
have university education and females with pre-uni-
versity education keep way from politics. It is remark-
able that a high percentage of youth participating
in elections are without work, with a 5% difference
between them and participants who have work, rep-
resenting 45%. This may indicate that social attitudes
view political activity as being in competition with
work and as though politics required fully available
and dedicated commitment.
With regard to the politics of opposition, there is a
marked tendency among young people to stay away
from petition-writing, demonstrations and sit-ins
(Table 5.1). Social characteristics of respondents
show that participation in opposition political action
is higher among males with university education,
youth still studying, and youth living in urban areas.
There are striking similarities in social characteristics
among those who have already participated in radical
political activities on one hand, and those who might
participate on the other. The prospects of future par-
ticipation of young people in opposition action is
higher among males, those with a university educa-
tion and those who are urban residents — in addition
to those who are unemployed. This suggests that the
lack of employment of highly educated urban young
men (especially) can be one of the reasons that might
drive participation in political opposition.
There is a high prevalence among females with less
than a university education, that are employed and
that live in rural areas to avoidance of political activ-
ity altogether. This may be attributed to several fac-
tors: First, there is a stereotype that ‘a woman’s place
is in the home’ and not in public life; second, that low
level education does not provide opportunities for
political education; and third, that the lesser the edu-
cation, the earlier is entry into and exit from the labor
market, with precedence given to marriage and fam-
ily formation. A further disincentive to political par-
ticipation is that this activity is socially labeled as ‘not
serious’ and at the expense of earning a stable living.
Comparing Egypt’s position internationally shows
that youth participating in opposition political action
represent 6%, with a 12% difference from the inter-
national figure of 18%. With regard to submitting
petitions and participating in demonstrations, the
percentage is 3%, with an 8% difference from the
international average. In sit-ins the percentage drops
to 2%, and the difference from the international aver-
age is 3%. Thus, Egypt’s position ranges between
Table 5.1: Youth Participation in Opposition Political Action
Source: World Values Survey – Egypt 2008 – IDSC
PetitionsDemonstrationsSit- ins
632
161010
788788
% Participated % Participate % Not Participate

Egypt Human Development Report 2010 { 67 }
fourteenth and sixteenth among four other countries
at the bottom of the list in most forms of opposition
political action, namely Jordan, Vietnam, Russia,
Indonesia, and Egypt respectively. Egypt’s positions
range between sixteenth and last in all fields of oppo-
sition political action in the world.
These and other results on intention to participate in
the future indicate that youth involvement in politi-
cal activities depends on several factors, chief among
which are the level of social and economic progress
and welfare, the level of the exercise in democracy
and its link with the quality of life in general, condi-
tions of political transformation, a clear accompany-
ing space to allow transformation, and the extent of
political openness and scope of restrictions on politi-
cal action.
Political Moderation with some
Leftist Inclinations
However, Egyptian youth do have a political sense.
The survey indicates that they have a clear political
vision, an attitude to political practice and the value
of democracy, an outlook on the state’s political objec-
tives, and expectations for the future.
There is a general trend towards moderation in
youth’s political orientation. Almost half of the sam-
ple classified themselves as moderate. These were fol-
lowed by those leaning to the left (38%) and rightists
representing only 12% of the sample. There are no
gender or marital divides in political orientations in
general, but there are clear educational differences.
Most rightists or moderates have a university educa-
tion while the majority of those who classify them-
selves as leftists have below university level educa-
tion.
It is obvious that a moderate political current is pre-
dominant among youth worldwide. They represent
55%, with the USA topping the list. Egypt ranks elev-
enth with a 5% difference from the world percentage.
Youth with rightist orientations represent 28% of the
sample, with Egypt ranking eleventh with 16% less
than the world percentage (in a list of countries where
Vietnam ranks first).
As seen in Figure 5.11, very few young people on the
international scale saw themselves as leftists, not
exceeding 17%. Egypt ranks second after India which
scores 28% and with more than a 21% difference
higher than the international figure. This suggests
that their orientation is in line with the moderate cur-
rent predominant globally. However, it is worth not-
ing that the percentage of youth with leftist tenden-
cies in Egypt is relatively high. This may not neces-
sarily mean that they embrace socialism or Marxist
thought, but rather adopt more radical attitudes in
opposition to current conditions and use these posi-
tions to fuel their criticism.
Belief in the Values of Democracy
Yes to DemocracyEighty four percent of the youth sample expressed
strong support for the importance of living under a
democratic rule. Most were males with university
education. One of the paradoxes of international
comparisons is that the democratic rule option
among youth puts Egypt in eighth position at the
world level (see Figure 5.12) with 8% higher than the
international 76%. Thus, Egypt is ahead of devel-
oped countries with long records of democracy such
as Japan, the USA, Britain, Russia and India. This
may indicate a wish among young Egyptians for
more democracy than presently available.
The survey shows that youth recognize the impor-
tance of people’s choice of their leaders through free
elections. Those who support it represent 90%, while
82% believe in the possibility of changing laws by ref-
erendum. Those who see that civil rights can protect
freedoms and guard against oppression represent
73%. Younger and older respondents are close with
regard these trends. The difference ranges between
two to three percent and suggests that young people
are expressing a general trend in society.
With regard international comparisons, the high per-
centage of youth among those who stress the impor-
tance of living in a democratic regime ranks Egypt
eighth, with an eight percent lead over the interna-
tional average of 76% among a number of countries
with similar conditions to Egypt (Jordan, Vietnam,
Argentina, Morocco and South Africa). Sweden is an

Egypt Human Development Report 2010{ 68 }
exception among the group. This affirms our earlier
conclusion that democracy is a higher priority for
youth among peoples struggling for further democ-
racy, while it does not figure high among the priorities
of youth in countries with long records of democratic
practices.
Democracy Not a Top Priority
However, and surprisingly, responses to the ques-
tion on democracy as a top priority in the coming ten
years indicate a remarkably low rating for Egypt (Fig-
ure 5.13). The percentage of youth who believe in the
people’s participation in government decision mak-
ing as a top priority does not exceed 11%. It is higher
among males with university education. Further,
people’s ability to make a difference in their societies
is not seen as a top priority except by 11% of the youth
sample, the majority of which were female. Freedom
of expression was the lowest as a first priority in the
exercise of democracy in Egypt in the next ten years,
at only 3%. Responses were, rather, largely in favor of
a higher level of economic development and combat-
ing price increaces as a top priority over ten years.
These results also cast doubt on the current argument
by Egyptian intellectuals that democratic reform is
a priority demand. Youth appear to have visions of
democracy but do not perceive it as a priority for their
country in the future. To 72% of the sample, concern
about the future is over economic improvement. This
suggests that prospects for work opportunities and
regular income amid growing unemployment are
a more urgent preoccupation than political issues.
There appears to be no association made between
choice of political regimes and economic well-being.
nationaList feeLings anD concoMitant iDentities Pride in their Nationality
Seventy-one percent of the sample affirms their sense
of national belonging and identity, most of which
are females. This may be because women are keener
to preserve the common cultural heritage wherein
national allegiance ranks top. Among them, females
with university level education have the strongest
sense of allegiance. The general view expressed in
media talk shows is that the sense of allegiance is low
among university students and this result appears
to contradict that opinion. Again, 71.1% of the sam-
ple is proud of their Egyptian nationality – most are
males with university level education. A comparison
between young and older people in this respect shows
that the percentage of people proud of their Egyp-
Total according to 56 countries Total according to 19 countries
EgyptJordan
MoroccoArgentina
BrazilSouth Africa
TurkeyIndonesia
South KoreaVietnam
IndiaPolandJapan
SwedenUSAUK
Figure 5.11: Youth’s Political Trends by Country
Source: Ibid
Left ModerateRight
Figure 5.12: Importance of Living in a Democratic System by Country
Total according to 56 CountriesTotal according to19 countries
SwedenJordan
VietnamTurkey
ArgentinaMorocco
South AfricaEgypt
South KoreaPoland
IndonesiaChinaBrazil
IranJapan
USABritianRussia
India
78
76
93
91
90
88
86
85
84
84
78
77
77
75
69
66
64
62
62
61
48
5818
5517 28
9038 13
4121 37
776 18
7513 13
6222 16
498 44
5020 31
637 31
6424 12
8514
4548 7
729 19
7122 7
6219 19
80 14
70 9
%
24
21
0 20 40 60 80 100
0 20 40 60 80 100
%
Source: Ibid
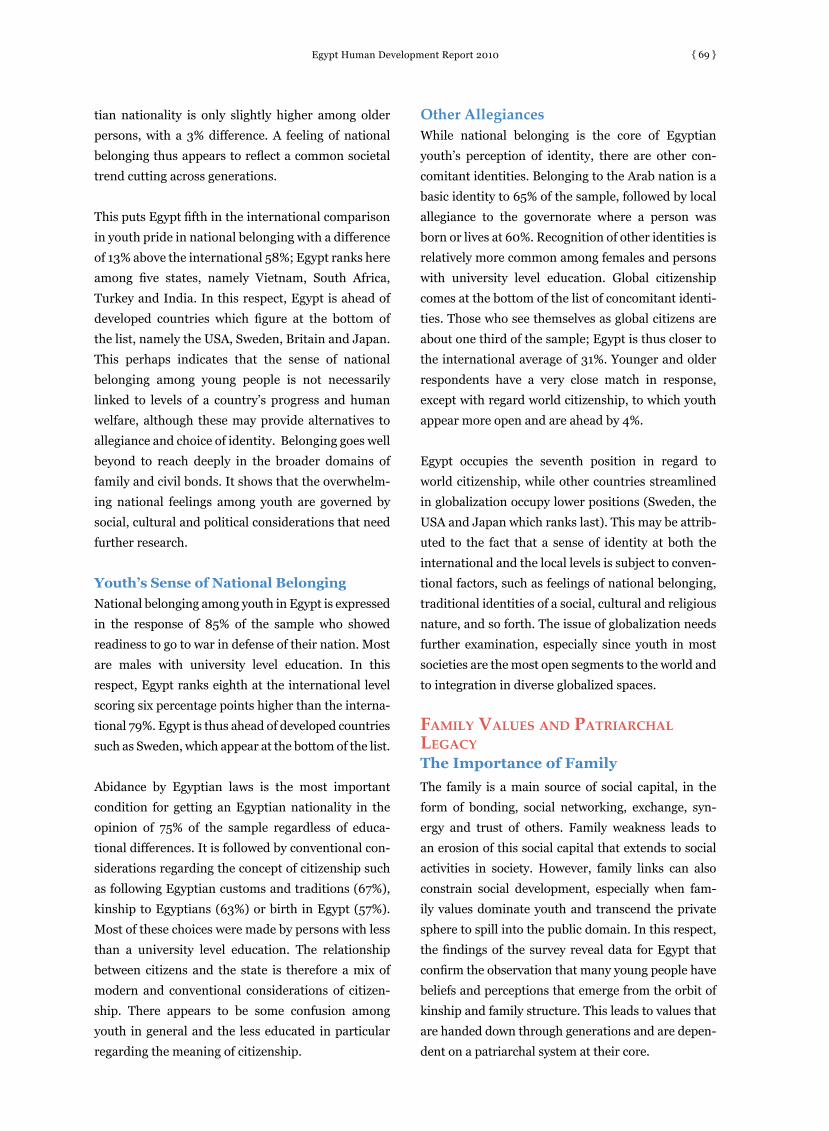
Egypt Human Development Report 2010 { 69 }
tian nationality is only slightly higher among older
persons, with a 3% difference. A feeling of national
belonging thus appears to reflect a common societal
trend cutting across generations.
This puts Egypt fifth in the international comparison
in youth pride in national belonging with a difference
of 13% above the international 58%; Egypt ranks here
among five states, namely Vietnam, South Africa,
Turkey and India. In this respect, Egypt is ahead of
developed countries which figure at the bottom of
the list, namely the USA, Sweden, Britain and Japan.
This perhaps indicates that the sense of national
belonging among young people is not necessarily
linked to levels of a country’s progress and human
welfare, although these may provide alternatives to
allegiance and choice of identity. Belonging goes well
beyond to reach deeply in the broader domains of
family and civil bonds. It shows that the overwhelm-
ing national feelings among youth are governed by
social, cultural and political considerations that need
further research.
Youth’s Sense of National Belonging
National belonging among youth in Egypt is expressed
in the response of 85% of the sample who showed
readiness to go to war in defense of their nation. Most
are males with university level education. In this
respect, Egypt ranks eighth at the international level
scoring six percentage points higher than the interna-
tional 79%. Egypt is thus ahead of developed countries
such as Sweden, which appear at the bottom of the list.
Abidance by Egyptian laws is the most important
condition for getting an Egyptian nationality in the
opinion of 75% of the sample regardless of educa-
tional differences. It is followed by conventional con-
siderations regarding the concept of citizenship such
as following Egyptian customs and traditions (67%),
kinship to Egyptians (63%) or birth in Egypt (57%).
Most of these choices were made by persons with less
than a university level education. The relationship
between citizens and the state is therefore a mix of
modern and conventional considerations of citizen-
ship. There appears to be some confusion among
youth in general and the less educated in particular
regarding the meaning of citizenship.
Other AllegiancesWhile national belonging is the core of Egyptian
youth’s perception of identity, there are other con-
comitant identities. Belonging to the Arab nation is a
basic identity to 65% of the sample, followed by local
allegiance to the governorate where a person was
born or lives at 60%. Recognition of other identities is
relatively more common among females and persons
with university level education. Global citizenship
comes at the bottom of the list of concomitant identi-
ties. Those who see themselves as global citizens are
about one third of the sample; Egypt is thus closer to
the international average of 31%. Younger and older
respondents have a very close match in response,
except with regard world citizenship, to which youth
appear more open and are ahead by 4%.
Egypt occupies the seventh position in regard to
world citizenship, while other countries streamlined
in globalization occupy lower positions (Sweden, the
USA and Japan which ranks last). This may be attrib-
uted to the fact that a sense of identity at both the
international and the local levels is subject to conven-
tional factors, such as feelings of national belonging,
traditional identities of a social, cultural and religious
nature, and so forth. The issue of globalization needs
further examination, especially since youth in most
societies are the most open segments to the world and
to integration in diverse globalized spaces.
faMiLy vaLues anD PatriarchaL LegacyThe Importance of Family
The family is a main source of social capital, in the
form of bonding, social networking, exchange, syn-
ergy and trust of others. Family weakness leads to
an erosion of this social capital that extends to social
activities in society. However, family links can also
constrain social development, especially when fam-
ily values dominate youth and transcend the private
sphere to spill into the public domain. In this respect,
the findings of the survey reveal data for Egypt that
confirm the observation that many young people have
beliefs and perceptions that emerge from the orbit of
kinship and family structure. This leads to values that
are handed down through generations and are depen-
dent on a patriarchal system at their core.

Egypt Human Development Report 2010{ 70 }
The survey indicates that the family represents an
important area of life for youth, with 98% supporting
this view. Most respondents are females, with univer-
sity level education, have jobs and are married; they
also belong to the upper and middle classes, but there
are no significant differences between urban and
rural areas in this respect.
Egypt ranks third in the world next to Turkey and
Indonesia with a difference of five points above the
international rating of 93%. The difference between
the highest percentage —Turkey at 98% and the
lowest — China at 81% - does not exceed 17%. This
suggests that the general trend among youth, both
internationally and locally, is that family is the most
important institution in life. No doubt, the high per-
centage of youth supporting the importance of fam-
ily in developed countries which champion values of
individuality and autonomy is one of the paradoxes
that need further examination.
Young people’s belief in the importance of family
extends to the future. When asked about their rating
of the importance of four basic aspects of life (family,
work, technology and respect for authority) in the near
future, 97% of the sample said paying greater atten-
tion to family is good, followed by attention to work
at 92%, then technology at 79% and lastly respect for
authority at 75%. The gender divide is small but is rel-
atively higher among youth with university degrees,
having jobs, living in urban areas and considering
themselves below the middle class.
Traditional Attitudes
In a significant result on young persons’ perception of
themselves, 82% of the sample saw themselves as per-
sons striving to keep the customs and traditions drawn
from their religion and family ties. Most were females.
Not less than 57% males with a university degree saw
themselves as living up to what others expected of
them. Family (and social) values thus obviously con-
tribute to a self image that is conservative and which
one frequently associates rather with a lower social
and economic status.
Further, in the sample, 74% saw that a main objec-
tive was to live up to their parent’s pride in them
(Figure 5.14). Most of the respondents were males
from urban settings, with a university education but
jobless. International comparisons show that Egypt
ranks second in the world, next to Morocco, in youths’
desire for parental pride, with a difference of 26%
above the international figure of 48%. In this respect,
countries with traditional legacies top the list that
includes Morocco, Egypt, Jordan, Indonesia, South
Africa and India. On the other hand, the bottom of
the list is predominantly occupied by the West, with
the exception of China. It includes Sweden, Japan,
the USA and Britain. In these countries, youth’s quest
for pride goes beyond blessings by the family, even in
China with its strong family heritage.
One of the family values relating to upbringing is the
expressed need for a father and a mother within a
family framework. Youth concurring with this view
overwhelmingly represented 98% of the sample,
underlying a belief in the importance of family in
building human capital. It is also in line with a con-
servative attitude to child upbringing. Data indicate
that 26% of the sample sees it as important that
children should not be brought up as independent,
where dependence appears to be a value of high pri-
ority in youth’s perception of child upbringing. This
is also in line with a tendency to highlight the value
of obedience as something that children should learn
very early in their lives. Those who support this view
represent 70% of the sample. Most advocates were
females with below university level education, unem-
ployed and residents of rural areas, and in fact, the
very conservative segments of the youth sample.
Issues of Gender
Some family values strengthen gender differences.
Although the percentage of those who state that boys
should be given priority over girls in university educa-
tion is small, 58% of youth believe that men are better
than women in work (Figure 5.15). Naturally enough,
the percentage of supporters of this view is higher
among males than females, though the difference is
limited to 3 percent. Further, 87% of the sample said
that in case of scarce employment opportunities, pri-
ority should be given to men who are, it appears, con-
sidered the principal breadwinners. In line with these
findings, 66% of the sample believed that a woman’s

Egypt Human Development Report 2010 { 71 }
role as a housewife can give her the same satisfaction
as work outside home. Most who support this view
are females. Data also indicate that 70% of the sam-
ple support male supremacy over women as political
leaders. All these results suggest that a male-domi-
nated patriarchy is prevalent, at least in the view of
many women.
As confirmation of prevalent patriarchal values, the
ratio of male supporters of male superiority politically
is four percent higher than females (68%). Further,
the percentage of supporters of this view among older
people is 74%, which is three percent higher than the
advocates of the same view among youth, at 71%. The
patriarchal bias against women among youth also cuts
across the social values system in general, even among
the educated. Visibly, education has not had an impact
on the existing social perception of gender inequality.
Paradoxically, there is a convergence of trends among
young males and females in accepting gender discrim-
ination. Young females, like older women, play a piv-
otal role in reproducing this perception.
Amazingly, international comparisons show that
Egypt ranks first in the world in regard to gender dif-
ferences in work with a difference of more than 41%
above the world percentage of 17%. Egypt thus leads
the list of countries with a heavy patriarchal legacy,
among which include Jordan, India, Morocco and
Iran. On the other hand, the gender divide over work
is small in a varied group of other countries includ-
ing the USA, Sweden, Britain, China, Japan, Argen-
tina and Poland. This strongly suggests that gender
discrimination against women has specific inherited
cultural and historical dimensions. This trend may
change as a result of social and economic variables
that reflect on family welfare. At present, the strength
and influence of such values continue to impact the
lives of youth in Egypt despite the waves of social
change and modernization that have extended for
over 50 years. It seems that conservative values,
possibly based on religious precepts, still dominate
among youth and indeed among most other social
segments in Egypt.
the centraLity of reLigionConcerning religion and its importance in life, the
data show overwhelming religious sentiments among
youth at 96% (Figure 5.16). Although there are no
significant social differences among youth categories
on this question, there are relatively stronger reli-
gious feelings among females, urban dwellers and the
middle class. International comparisons rank Egypt
first in the world in this respect with 38% percentage
points above the international 58%. Egypt is among
a group of Islamic countries with several religious
orientations and which includes Indonesia, Jordan,
Morocco, Iran and Turkey, but whose activities by
Islamic movements during the past two decades has
had a marked impact on deepening religious trends
among youth. Countries where religious sentiments
are at their lowest are Japan, China, Sweden, Viet-
nam and Russia.
There is also a strong belief in the divine presence in
everyday life among Egyptian youth. Ninety percent
of the respondents identified themselves as religious
in this respect. The percentage increases significantly
among females given that girls are now a major target
of religious advocacy by Islamic movements on the
one hand, and the fact that women play an effective
role in preserving the values of religiosity on the other.
Religiosity increases among persons with higher
Figure 5.13: Concern for Parent’s Pride by Country
Total according to 56 countriesTotal according to 19 countries
MoroccoEgypt
JordanIndonesia
South AfricaIndia
TurkeyVietnam
RussiaIran
BrazilPolandBritain
South KoreaUSA
ArgentinaChinaJapan
Sweden
Source: Ibid
38
48
78
74
70
62
61
56
49
40
40
40
37
36
28
26
25
21
12
11
6
0 10 20 30 40 50 60 70 80 90

Egypt Human Development Report 2010{ 72 }
education, which suggests that currently, education
has a fundamental role in spreading religious values.
Approximately 82% of the sample stressed the impor-
tance of preserving customs and traditions rooted
in religion and family as characteristics that apply
to them completely. Despite the high percentage of
females in this respect, the figures among groups of
different ages and levels of education are close, imply-
ing that young people are generally primarily conser-
vative. The religious influence in the lives of youth
is complemented by a firm belief in fatalism. In this
respect, 69% of the respondents said that they could
not determine their fate because everything is pre-
ordained and unavoidable. Only 7% professed that
they determined their own fate. The remaining 25%
adopted a neutral stand between fatalism and free
choice. It is clear that fatalistic tendencies are higher
among women and among the less educated at 7.9%
of the sample, with a majority of females having a uni-
versity level education and being residents of urban
areas.
The survey revealed that only one fifth of the sample
were keen to go to places of worship every day and
a quarter of the sample went once a week, the bal-
ance going less frequently and ranging from once a
month to only on special occasions. About 26% were
not keen on the performance of rituals in the places of
worship. It is clear that religious tendencies manifest
themselves more in talk than in actual rituals and are
given momentum by vocal advocates and the media.
This phenomenon has a clear impact on activating
the public domain as a moral channel at a time when
the family and social institutions are perhaps getting
weaker in performing this role.
Religious institutions have four major roles in the
eyes of young people, chief among which are solv-
ing moral problems and meeting psychological needs
at 67% of the sample and fulfilling spiritual needs at
64%. Helping with the family and community prob-
lems did not exceed 60% and 55%, respectively.
attituDes towarDs othersForty seven percent of young people see that their
friends are important. The percentage is higher
among males with higher education. This is consis-
tent with the gender differences accepted by social
norms which give males the right to form many
friendships and the right to spend more leisure time
with their friends.
Figure 5.14: Preference of Men to Women in Work by Country
Total according to 56 countriesTotal according to 19 countries
EgyptJordon
IndiaMorocco
RussiaIran
South AfricaIndonesia
TurkeyVietnam
BrazilSouth Korea
PolandArgentina
JapanChina
BritainUSA
Sweden
13
17
58
39
29
23
20
19
11
9
9
7
7
6
5
5
4
3
3
0
0
Source
Figure 5.15: Importance of Religion in Life by Country
Total according to 56 countriesTotal according to 19 countries
EgyptIndonesia
JordanMorocco
IranTurkey
South AfricaBrazilIndiaUSA
PolandArgentina
South KoreaBritainRussia
SwedenVietnam
ChinaJapan
Source
48
58
96
95
93
87
77
69
67
46
36
43
36
20
19
19
10
7
7
4
2
0 10 20 30 40 50 60 70 0 20 40 60 80 100 120

Egypt Human Development Report 2010 { 73 }
Positive emotions towards the ‘other’ are also mani-
fest in young people’s vision of the values that children
should be encouraged to learn. Chief among these are
tolerance and respect in the eyes of 71% of the sample.
Here, Egypt ranks ninth by more than 5 points above
the global percentage of 66% and is part of a group of
countries which occupy an intermediate place, namely
Jordan, China, Turkey and Argentina. It is worth not-
ing that this trend increases among females and those
with lower education. More than half the sample
stressed the importance of children learning selfless-
ness and altruism. These are all indicators of positive
perceptions and attitudes towards the ‘other’.
However, 44% of the sample of young people saw a
need to put restrictions on the number of foreigners
allowed to come to Egypt, while 24% were for prevent-
ing entry. Those who saw the presence of foreigners
conditional on the availability of employment oppor-
tunities accounted for 28%. The proportion of young
people who do not accept the presence of foreigners
to work in Egypt is higher among males and those
with a university education. This is understandable,
given the high unemployment rate and fear of com-
petition in the labor market of a considerable portion
of males in this category. A huge number (97%) of the
sample agreed that employers should give priority to
Egyptians when there are employment opportunities.
Short-Term Trust
Young people’s trust in others is fragile. Fifty-seven
percent of the sample prefers a safe environment,
adopting some of the values in support of customs
and traditions. Twenty-eight percent of the sample
has misgivings about dealing with foreigners who
might try to take advantage of them. No more than
16% of the sample has any confidence in the ‘other’
– a tiny proportion – reflecting the erosion in the
real level of social capital among young people. Thus,
Egypt is ranked fifth with a difference of less than 7
points from the international rate of 23%. It comes at
the bottom of the list of countries with similar condi-
tions, such as Turkey, Brazil, Iran and Morocco. Swe-
den, China, Vietnam and Japan are, in contrast, close
to the top (Figure 5.17).
However, it is clear that the proportion of confidence
in the ‘other’ at the global level is also low, despite the
global transformations and the openness of youth to
most means of globalized communication that tran-
scends geographical, religious and national borders.
This openness is believed to help extend bridges of
trust, but the massive flow of current communication
can be accompanied by feelings of caution and distrust.
If young people’s trust in others is fragile to this
extent, then who do they think would deserve their
trust? And what are the limits of trust in their lives?
Data indicate that 95% of the sample has total trust in
the family (Figure 5.18). The data also indicate that
confidence in charities and humanitarian organiza-
tions comes in second place after the family at a rate

Egypt Human Development Report 2010{ 74 }
of 45%. It is clear that young people’s degree of confi-
dence is associated with a variety of religious and spir-
itual considerations when it comes to helping others.
Trust also depends on a direct social relation. Forty
four percent of the sample of young people trusts those
they know personally such as friends and acquain-
tances. This is followed by trust in neighbors at a rate
of 43%. It then gradually decreases regarding most of
the institutions and various bodies. The rate of con-
fidence is at its lowest in the case of persons of other
religions, persons one is seeing for the first time, and
those with different nationalities. Once more, consid-
erations related to traditional kinship and family and
to direct personal relationships appear paramount.
In this respect, there is a convergence between males
and females, young and older peoples, and between
various educational levels.
Total of 56 countriesTotal of 19 countries
SwedenChina
VietnamJapan
IndonesiaSouth Korea
USARussiaJordanBritain
IndiaPoland
South AfricaArgentina
EgyptMorocco
IranBrazil
Turkey
Figure 5.16: Trust in Others by Country Figure 5.17: Circles of Trust among Youth
Complete trust in familyHumaritarian/Charitable Institutions
People you personally knowNeighbours
TelevisionPublic service institutions
The Arab LeagueFeminist Organizations
PressEnvironmental Organizations
Multinational CorporationsLabor Unions
Persons met for the first timePeople of different religions
People of different nationalities
Source: Ibid
26
23
68
52
48
42
39
33
32
28
26
25
24
22
19
18
16
11
10
8
5
Source: Ibid
95
45
44
43
20
13
12
11
10
8
6
5
2
2
1
0 10 20 30 40 50 60 70 80
0 20 40 60 80 100
%
Endnotes1 Giddens, A. (1991), and Beck, U. (1992).2 See Brannen, J. and O’Brien, M. (eds) Children in Families: Research and Policy, London: Falmer Press , 1996.3 Hey, V, 1997.4 Back, L., 1997. 5 Miles, S. ‘19976 Heelas, P., Lasch, S. and Morris, P. (eds) Detraditionalisation, Oxford: Blackwell, 1996.7 See Giddens, op cit8 See an extensive review of these studies in سعيد املصري ، ثقافة االستهالك فى اجملتمع املصري ، القاهرة : املركز الدولي للدراسات اإلستراتيجية واملستقبلية ، 2006
: القاهرة ) 17 - 18 9 النامية الدول فى الفكر عن: مراكز األول الدولى املؤمتر فى قدمت ورقة ، مصر فى العامة والسياسة القيم بني الفجوة ، عرفة وخديجة عثمان ماجد يناير ( 2009، ص16
األهرام للنشر ، 2006 10 : مركز القاهرة متقدمة، دولة مصر ، سعيد املنعم .عبد مرجع سابق ، ص 12 11 املصرى، اجملتمع فى االستهالك ثقافة ، املصرى سعيد
referencesBack, L, (1997), New Ethnicities and Urban Culture, London, UCL Press.Beck, U, (1992), Risk Society: Towards a New Modernity, London: Sage. PressGiddens, A, (1991), Modernity and Self Identity: Self and Society in the Late Modern Age, Cambridge: Polity Press.Hey, V. (1997), The Company she Keeps: An Ethnography of Girls’ Friendships, Buckingham: OUP.Miles, S. ‘Towards an Understanding of the Relationship Between Youth Identity and Consumer Culture,’ Youth and Policy, 51
(4), 1997: 35-45.
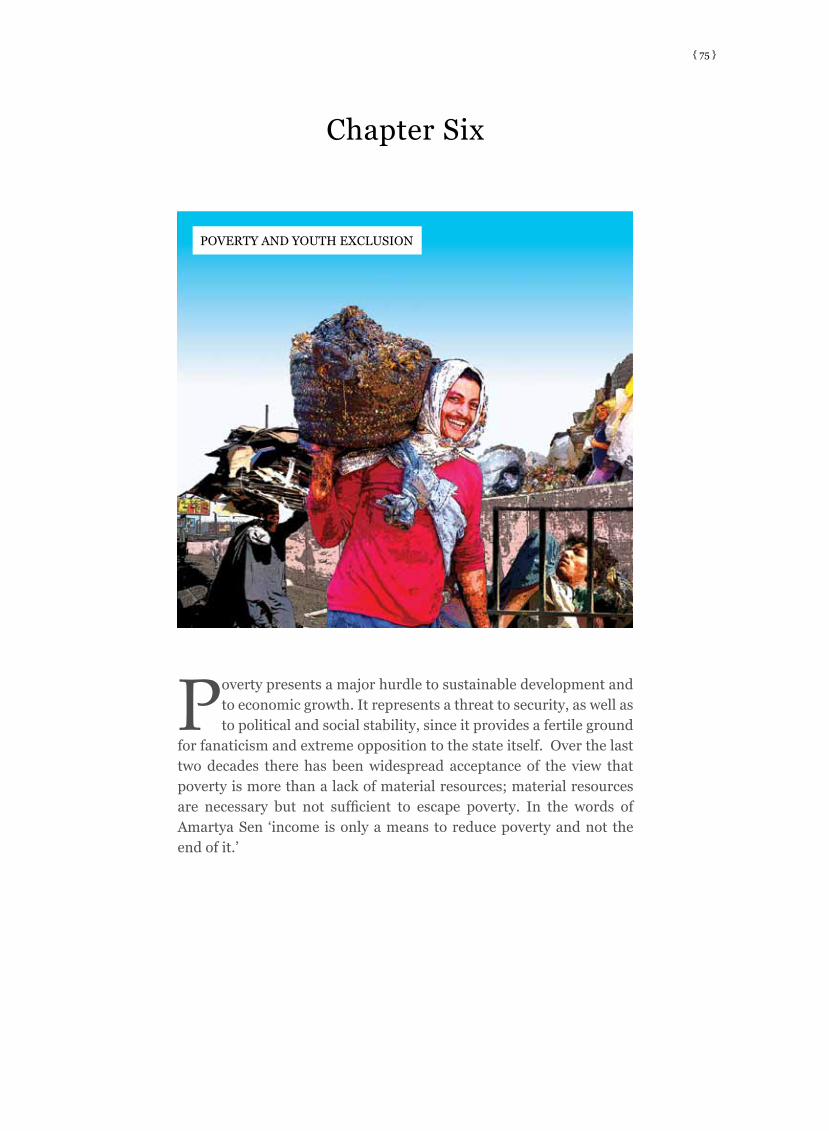
{ 75 }
Chapter Six
Poverty presents a major hurdle to sustainable development and to economic growth. It represents a threat to security, as well as to political and social stability, since it provides a fertile ground
for fanaticism and extreme opposition to the state itself. Over the last two decades there has been widespread acceptance of the view that poverty is more than a lack of material resources; material resources are necessary but not sufficient to escape poverty. In the words of Amartya Sen ‘income is only a means to reduce poverty and not the end of it.’
POVERTY AND YOUTH ExCLUSION

Egypt Human Development Report 2010{ 76 }
Poverty is known for being a state of deprivation
from a decent life that a person or a society hopes
to enjoy. Poverty does not only mean lacking what
is necessary for the material welfare of a person; it
also means deprivation from basic opportunities and
choices such as living a long healthy and creative life,
with a decent income, enjoying freedom, dignity, self-
respect and respect of others. It is clear that income is
but one of the choices that people want to enjoy.
Youth poverty differs from adult poverty in that it
can have different causes and effects. Two main sets
of causes can be identified: First, life-course events
(e.g. leaving school, starting work, getting married,
having children) play a significant role in shaping
vulnerability to poverty. These ‘life events’ are more
likely to occur during the 18-29 age interval. Second,
intergenerational transmission experienced by youth
is often linked to the poverty status of their households
and childhood deprivation, and can in turn affect their
well-being and the well-being of their children. The
impact of youth poverty on long term human capital
accumulation is well recognized because youth capac-
ity for learning is greater than for older ages. Thus,
youth poverty represents missed opportunities to
acquire skills in school or on the job, or good health
habits, and these problems are difficult to remedy.
characteristics of Poor youthHow serious are socio-economic disparities between
the rich and poor? And how are young people
impacted by their differentiated socio-economic
background? This section provides a profile of poor
youth in order to understand the quality of their life
and the levels of deprivation they experience. Section
2 reports on the perception of poor youth and their
aspirations and the third and last section makes pol-
icy relevant recommendations.
The analysis in this section is based on four data
sources: The first is the Household Income and
Expenditure Survey (HIECS) of 2008, the second is
the representative sample Survey of Young People in
Egypt (SYPE) of 2009, the third is the Demographic
and Health Survey (DHS) of 2008, and the fourth is
the set of Human Development Indicators, collected
by the Institute of National Planning (INP) for this
EHDR (see Chapter 2 and Annex Tables). The first
three sources provide age specific results for youth in
the 18 to 29 age interval.
There are a number of different ways in which strong
social stratification discriminates against poor youth,
the most important of which are education and work
conditions as detailed below. Two other striking areas
of exclusion for poor youth can be observed with
respect to overcrowded living arrangements and the
ownership of various assets.2 In terms of asset owner-
ship, SYPE data exposes a huge differential that exists
with regards ownership of cellular phones (mobiles)
and computers. With regards ownership of a mobile,
only 8% in the lowest quintile own a cell phone as
opposed to 31% for the highest wealth quintile. As
to ownership of a computer, for males aged 22-29,
for example, the lowest two quintiles (poorest 40%)
account for less than 1% of computer ownership, and
highest quintile (richest 20%) accounts for 60%.
the various DiMensions of incoMe Poverty
Analysis of the HIECS data set for youth in the age
bracket 18 to 29 confirms a similar pattern to the
results of both the DHS and HIECS in relation to
the study “Child Poverty and Disparities in Egypt”
to the 2010 UNICEF study which shows that more
than 20% of children experience a number of depri-
vations.3 HIECS shows that 5.3% of children aged
6-17 years were employed in 2008/2009. Childhood
poverty ranges from a low of 6.6% in the metropoli-
tan region to 41.4% in rural Upper Egypt; when both
parents do not work, poverty risks are twice the risk
of employed parents.
Table 6.1: Poverty Rates by Region and Age
MetropolitanLower UrbanLower RuralUpper UrbanUpper RuralEgypt
RegionIndividuals 18-29 All Individuals
Percent of individuals aged 18-29
Source: HIECS
Poverty Rate
8.28.8
19.322.744.323.2
6.97.3
16.721.343.721.6
23.322.423.423.523.423.3

Egypt Human Development Report 2010 { 77 }
As shown in Table 6.1, 21.6% of all Egyptians are
poor. Similar to previous poverty measures in 2000
and 2005 (World Bank 2002 and 2007), the results
show large regional disparities with Rural Upper
Egypt being the most deprived (43.7% of its residents
are income poor) and Metropolitan region the least.
The percentage of poor youth is always slightly higher
than the average rate, higher by 1.5 percentage points.
This observation holds for all regions in Egypt.
Youth are more likely to experience poverty than
older age groups and ‘younger young’ are at substan-
tially higher risk of poverty than the ‘older young’. At
the national level, 23% of children under age 15 years
were in poverty in 2008-09. Poverty rates peak dra-
matically for teenagers between 15 to 17 years, ris-
ing to almost 29% and almost 27% for young adults
between 18 and 20 years. The younger working-age
adults between 27 and 29 years (17%) have the lowest
incidence of poverty. Starting from age 27 years and
above, the poverty rate is always below the national
average. This is partly driven by changes in occupa-
tional status among young people (who are less likely
to be studying or unemployed at later ages), but also
by a reduced risk of poverty within groups: For exam-
ple, those with a job are less likely to be poor in their
late twenties than in their teens or early twenties.
However, this is offset by the fact that at later ages,
more of them have had children. The national pattern
persists in urban and rural areas (see Figure 6.1).
The risk of poverty is particularly high among house-
holds with three or more youth members. Our calcula-
tions of poverty are based on the total consumption of
all household members, (which is based on the num-
ber and ages of household members). Because of this,
living arrangements affect a person’s risk of poverty.
In general, if a person lives with other adults who have
jobs, this increases the household’s income relative to
its needs, and the risk of poverty decreases. In con-
trast, living with children or with young adults who
do not have jobs tends to decrease the household’s
income relative to its needs and to increase the risk of
poverty. Because young adults’ incomes are on aver-
age low compared with those of their parents, living
in the family of origin tends to protect young adults
from poverty, and (other things being equal) we may
expect the risk of poverty to be higher in households
with younger adult’s members. For instance, within
households of 5 or 6 children, 22% of those have three
or more persons of age 15-17 were poor in 2008-09,
compared to only 17% of those without young persons
of age 15-17.
the intergenerationaL transMission of Poverty
“My grandparents are responsible. They never sent
their children (here the parents of the subjects) to
school, this led to further poor offspring”, said par-
ticipant in youth focus group discussion.
Youth from poor households suffer from high and
persistent capability deprivation especially during
childhood – poor nutrition, untreated illness, lack of
access to education –limits human development in
ways that are often irreversible. Unhealthy, poorly
educated children can grow into young people with
more limited capacity for learning and working. The
extent to which parent’s poverty is transmitted to
their children is affected by parents’ investment in
children – in terms of education and training, health
Young Adults of Age 15-17
17.120.022.022.3
Young Adults of Age 18-23
15.719.822.325.5
Young Adults of Age 24-29
16.920.819.429.2
Table 6.2: Poverty Rates within Households of 5/6 members, by Number of Young Adults
Source: Authors’ calculations using HEICS, 2008
Source: Authors’ calculations using HEICS, 2008
Figure 6.1 Income Poverty Rate by Age, 2008-09
0123+
Less
than
15
15-1
7
18-2
0
21-2
3
24-2
6
27-2
9
30-4
4
45-5
9
60+
30
25
20
15
10
5
0
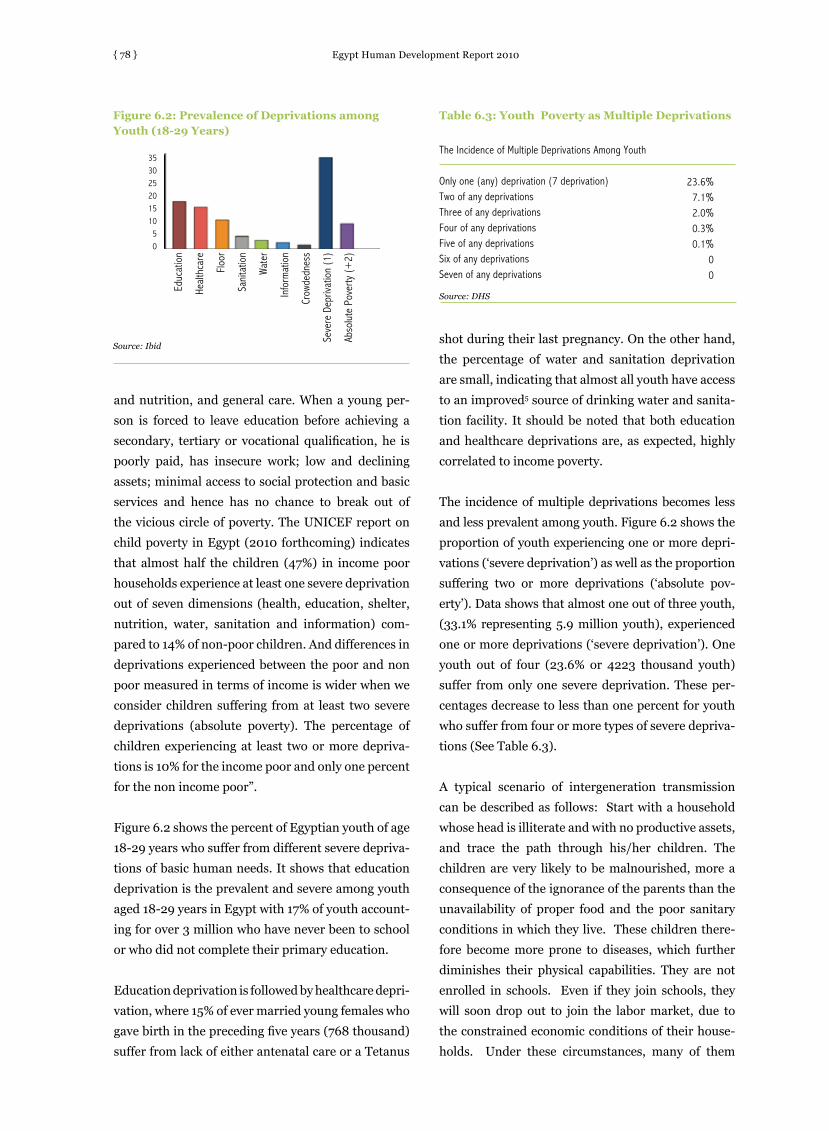
{ 78 }
and nutrition, and general care. When a young per-
son is forced to leave education before achieving a
secondary, tertiary or vocational qualification, he is
poorly paid, has insecure work; low and declining
assets; minimal access to social protection and basic
services and hence has no chance to break out of
the vicious circle of poverty. The UNICEF report on
child poverty in Egypt (2010 forthcoming) indicates
that almost half the children (47%) in income poor
households experience at least one severe deprivation
out of seven dimensions (health, education, shelter,
nutrition, water, sanitation and information) com-
pared to 14% of non-poor children. And differences in
deprivations experienced between the poor and non
poor measured in terms of income is wider when we
consider children suffering from at least two severe
deprivations (absolute poverty). The percentage of
children experiencing at least two or more depriva-
tions is 10% for the income poor and only one percent
for the non income poor”.
Figure 6.2 shows the percent of Egyptian youth of age
18-29 years who suffer from different severe depriva-
tions of basic human needs. It shows that education
deprivation is the prevalent and severe among youth
aged 18-29 years in Egypt with 17% of youth account-
ing for over 3 million who have never been to school
or who did not complete their primary education.
Education deprivation is followed by healthcare depri-
vation, where 15% of ever married young females who
gave birth in the preceding five years (768 thousand)
suffer from lack of either antenatal care or a Tetanus
shot during their last pregnancy. On the other hand,
the percentage of water and sanitation deprivation
are small, indicating that almost all youth have access
to an improved5 source of drinking water and sanita-
tion facility. It should be noted that both education
and healthcare deprivations are, as expected, highly
correlated to income poverty.
The incidence of multiple deprivations becomes less
and less prevalent among youth. Figure 6.2 shows the
proportion of youth experiencing one or more depri-
vations (‘severe deprivation’) as well as the proportion
suffering two or more deprivations (‘absolute pov-
erty’). Data shows that almost one out of three youth,
(33.1% representing 5.9 million youth), experienced
one or more deprivations (‘severe deprivation’). One
youth out of four (23.6% or 4223 thousand youth)
suffer from only one severe deprivation. These per-
centages decrease to less than one percent for youth
who suffer from four or more types of severe depriva-
tions (See Table 6.3).
A typical scenario of intergeneration transmission
can be described as follows: Start with a household
whose head is illiterate and with no productive assets,
and trace the path through his/her children. The
children are very likely to be malnourished, more a
consequence of the ignorance of the parents than the
unavailability of proper food and the poor sanitary
conditions in which they live. These children there-
fore become more prone to diseases, which further
diminishes their physical capabilities. They are not
enrolled in schools. Even if they join schools, they
will soon drop out to join the labor market, due to
the constrained economic conditions of their house-
holds. Under these circumstances, many of them
Figure 6.2: Prevalence of Deprivations among Youth (18-29 Years)
0
5
10
15
20
25
30
35The Incidence of Multiple Deprivations Among Youth
Only one (any) deprivation (7 deprivation)Two of any deprivationsThree of any deprivationsFour of any deprivationsFive of any deprivationsSix of any deprivationsSeven of any deprivations
Table 6.3: Youth Poverty as Multiple Deprivations
23.6%7.1%2.0%0.3%0.1%
00
Source: DHS
Educ
atio
n
Heal
thca
re
Floo
r
Sani
tatio
n
Wate
r
Info
rmat
ion
Crow
dedn
ess
Seve
re D
epriv
atio
n (1
)
Abso
lute
Pov
erty
(+2)
353025201510
50
Source: Ibid
Egypt Human Development Report 2010

Egypt Human Development Report 2010 { 79 }
would be virtually illiterate, and in the absence of
adequate vocational training facilities, these children
enter adolescence with very poor skills and capabili-
ties. The cycle is complete when the spouse is of the
same characteristics, and poverty is thus perpetu-
ated across the different generations. Given such a
scenario, it is clear that education is a very powerful,
though not the only, instrument in enabling individu-
als to break the cycle of poverty.
the Link between weaLth anD youth DePrivation Youth deprivation is obviously linked to child depri-
vation. Children living in rooms with more than five
people per room account for 14.4% of all children.
Overcrowding is seen to continue for youth 18 years
and above as per SYPE results. It is also clear that
income or wealth indicators of poverty are highly
correlated with shelter deprivation. It is estimated
that 17% of children under five years old (1.5 million
children) are severely food deprived according to the
WHO definition. The incidence of food deprivation is
highest in rural Upper Egypt as per DHS 2008, while
the proportion of children between 7 and 18 who
have never been to school is 3.2% at the national level
(490,000 children). The regional disparities in lack
of school attendance range from 1.4% in urban gov-
ernorates to 6.7% in rural Upper Egypt. Moreover,
information deprivation among children more than
two years of age is 2.4%, or 551,000 children, prob-
ably the same children. These children lack access to
television, radio, telephone or newspapers. Many of
these deprivations are carried over from childhood to
adolescence to youth.
Data presented in Table 6.4 shows that the wealth sta-
tus of households represented by the assets approach
has a substantial effect on youth deprivation. In fact,
the HIECES results indicate that the wealth index is
highly correlated with income poverty. Almost half
of youth in the first quintile are income poor, and
prevalence of poverty decreases as the wealth index
Box 6.1: Poor Youth have Irregular Work
Most participants in youth focus group discussions complained of the irregularity of their work, being mostly seasonal. The
youth reported that they are forced to accept whatever jobs are available, in most cases seasonal and irregular, at the
same time low in wages, because of widespread unemployment. The youth, in this way, cannot organize their lives, as their
situation is vulnerable and subject to all sorts of external changes, whether political, economic, and/or global.
All youth in the sample have irregular jobs .It is interesting to note that it is rural youth more than urban youth that feel the
social pressure of this situation. One rural youth said that he tried driving a carriage but he was imprisoned because he
violated a traffic law. He was exposed to all sorts of humiliation---insults, beating, and he was even handcuffed. He tried
working as a cleaner. When it was known that he was educated, he was fired. Another young man reported that he has a
job carrying goods. He wears a “galabeya”. This outfit seems to be stigmatized—in fact it is the stereotype of deviance,
because every now and then, policemen arrest him and he is put in jail. Source: Heba el Laithy, based on youth focus groups for study Living Standards in Egypt (2007) conducted for Environmental Quality International.
Crowdedness
1.24.81.00.30.10.0
material
10.943.212.72.00.20.0
Sanitation
3.77.75.14.31.40.5
Water
2.67.03.21.80.60.9
Information
2.211.10.50.30.00.0
Education
17.240.224.513.77.31.9
Health
15.222.716.614.710.113.4
poverty rate
23.246.135.124.69.32.6
Wealth Index Quintiles
TotalQuintile 1 (poorest)Quintile 2Quintile 3Quintile 4Quintile 5 (richest)
Table 6.4: Percent of Youth Experiencing Different Forms of Deprivation (by Wealth Quintile)
Flooring Income
Source: Authors calculations using Egypt Demographic and Health Survey, 2008 and HEICS, 2008/09

Egypt Human Development Report 2010{ 80 }
increases to reach only 2.6% among youth in the rich-
est quintile.
The risk of experiencing crowdedness deprivation
varies enormously between the quintiles of the wealth
index. Almost 5% of youth in the poorest quintile suf-
fer from crowdedness deprivation, compared to less
than one percent among non-poor youth.
Youth with the least wealth are most likely to experi-
ence deprivations. Household wealth represented by
the assets approach is a strong explanatory factor for
education deprivation. Youth with the least wealth
are most likely to experience deprivation. While 40%
of youth in the poorest quintile are severely educa-
tionally deprived, less than two percent of youth in
the richest quintile suffer from severe educational
deprivation.
Female youth living in wealthiest households are less
likely to be health deprived than those living in poor
households. The percentage of ever married female
youth living in poor households who suffer from
severe health deprivation reached almost 23%, while
this percentage decreased to 10% and 13% among
ever married female youth in the fourth and the fifth
richest quintiles respectively.
The percentage of youth who suffer from floor depri-
vation ranges from 43.2% in the poorest quintile to
0.2% among youth in the fourth quintile and to zero
among the richest quintile.
The wealth status of households has significant effect
on severe sanitation deprivation with almost 8% of
youth in the poorest quintile, down to less than one
percent (0.5%) among youth in the richest quintile.
Disparity patterns for water deprivation are the
same as those for sanitation. Youth in the highest two
wealth quintiles suffer from almost no water depriva-
tion and at the rate of 3.2% for the second poorest
quintile and 7% of youth living in the poorest wealth
quintile.
Youth living in poor households are more likely to be
information deprived, with 11%, amongst the poor-
est as compared to less than one percent among non
poor youth.
eDucationAnother striking result is from the SYPE dataset
which shows that poor youth aged 18-29 have been
the most disadvantaged in terms of access to pre-
school, as seen Figure 6.3. Whereas more than 70%
of Egypt’s youth in the highest quintile have attended
kindergarten, the percentage falls sharply along the
wealth group where it reaches only 11% for the low-
est quintile. This bears witness to the uneven access
to equal opportunity since the correlation is very
high between preschool attendance and better scores
throughout the years of compulsory education.
For the age group 18-29, there are large differentials
in educational enrollment and educational achieve-
ment. SYPE results show stark results whereby 39%
Figure 6.3: Percentage who Attended Preschool (by Wealth Quintile)
Figure 6.4: Distribution of Level of Education (by Wealth Quintile)
Attended Preschool
Post-secondary, University and AboveGeneral High SchoolIlliterate
01020304050607080
0
10
20
30
40
50
Source: SYPE 2009
Perc
enta
ge
Highest QuintileForth QuintileMiddle QuintileSecond QuintileLowest Quintile
HighestQuintile
FourthQuintile
MiddleQuintile
SecondQuintile
LowestQuintile
80706050403020100
50
40
30
20
10
0
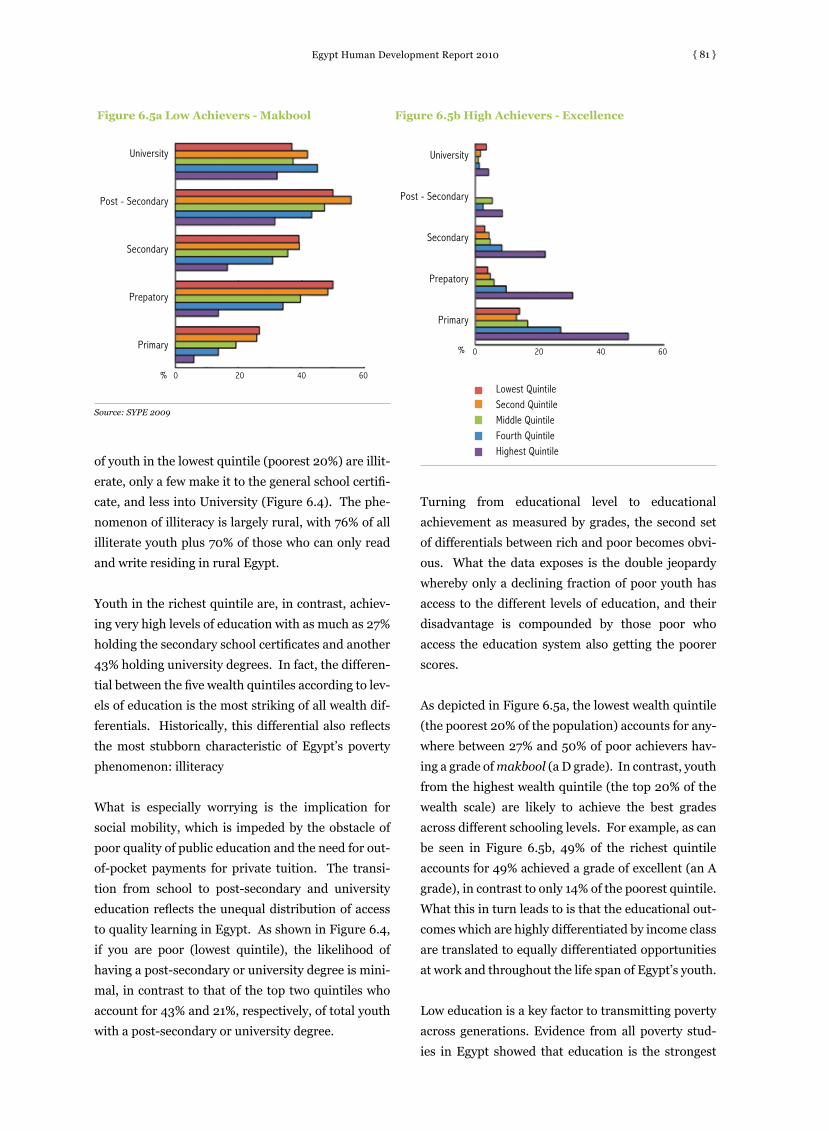
Egypt Human Development Report 2010 { 81 }
of youth in the lowest quintile (poorest 20%) are illit-
erate, only a few make it to the general school certifi-
cate, and less into University (Figure 6.4). The phe-
nomenon of illiteracy is largely rural, with 76% of all
illiterate youth plus 70% of those who can only read
and write residing in rural Egypt.
Youth in the richest quintile are, in contrast, achiev-
ing very high levels of education with as much as 27%
holding the secondary school certificates and another
43% holding university degrees. In fact, the differen-
tial between the five wealth quintiles according to lev-
els of education is the most striking of all wealth dif-
ferentials. Historically, this differential also reflects
the most stubborn characteristic of Egypt’s poverty
phenomenon: illiteracy
What is especially worrying is the implication for
social mobility, which is impeded by the obstacle of
poor quality of public education and the need for out-
of-pocket payments for private tuition. The transi-
tion from school to post-secondary and university
education reflects the unequal distribution of access
to quality learning in Egypt. As shown in Figure 6.4,
if you are poor (lowest quintile), the likelihood of
having a post-secondary or university degree is mini-
mal, in contrast to that of the top two quintiles who
account for 43% and 21%, respectively, of total youth
with a post-secondary or university degree.
Turning from educational level to educational
achievement as measured by grades, the second set
of differentials between rich and poor becomes obvi-
ous. What the data exposes is the double jeopardy
whereby only a declining fraction of poor youth has
access to the different levels of education, and their
disadvantage is compounded by those poor who
access the education system also getting the poorer
scores.
As depicted in Figure 6.5a, the lowest wealth quintile
(the poorest 20% of the population) accounts for any-
where between 27% and 50% of poor achievers hav-
ing a grade of makbool (a D grade). In contrast, youth
from the highest wealth quintile (the top 20% of the
wealth scale) are likely to achieve the best grades
across different schooling levels. For example, as can
be seen in Figure 6.5b, 49% of the richest quintile
accounts for 49% achieved a grade of excellent (an A
grade), in contrast to only 14% of the poorest quintile.
What this in turn leads to is that the educational out-
comes which are highly differentiated by income class
are translated to equally differentiated opportunities
at work and throughout the life span of Egypt’s youth.
Low education is a key factor to transmitting poverty
across generations. Evidence from all poverty stud-
ies in Egypt showed that education is the strongest
Figure 6.5b High Achievers - ExcellenceFigure 6.5a Low Achievers - Makbool
University
Post - Secondary
Secondary
Prepatory
Primary
%
Lowest QuintileSecond QuintileMiddle QuintileFourth QuintileHighest Quintile
Source: SYPE 2009
0 20 40 60
0 20 40 60
%
University
Post - Secondary
Secondary
Prepatory
Primary

Egypt Human Development Report 2010{ 82 }
correlate of poverty, insofar as it determines the com-
mand of individuals over income earning opportuni-
ties through access to employment. Education was
typically found to have a high explanatory power
on observed patterns of poverty. The correlation
between education and welfare has important impli-
cations for policy, particularly in terms of the distri-
butional impact. Poor youth –as will be shown below-
have low educational attainments and their low edu-
cational levels are not enough to escape the poverty
trap, transmitting poverty across generations. Illit-
erate youth of both sexes, (see Box 6.3) emphasized
the importance of education. They saw illiteracy as a
prime cause of poverty.
Poor youth, especially girls, have lower likelihood to
join schools. Net enrollment rate reached 29.7% for
non poor and 13.9% for poor youth aged 18-24 years.
Enrollment rate dropped sharply at tertiary education
age. Enrollment rate for non poor is about double that
of the poor. Further, the gap between poor and non
poor was wider among girls compared to boys, but
poverty gap was wider than the gender gap. At the age
of 20 years, 11.7% of poor females and 13.6% of poor
males were enrolled in education, compared to 31%
of females and 36.7% of males in non-poor house-
holds. There was also a large gap in school enrolment
between urban and rural areas, rural poor being the
most disadvantaged.
Unemployment rate for poor youth is lower than
the non poor, at any age. Poor young people cannot
afford to stay unemployed. Thus, the incidence of
unemployment may be low, although youth are still
in poverty. As indicated by Figure 6.6, unemployment
rate increases with age, peaks at age of 18 and 19 and
declines afterwards. This is true for both poor and
non poor youth, yet unemployment rate for the poor
is always lower than the non poor.
Unemployment rates continue to be high for second-
ary and university graduates, especially for the poor.
As presented in Table 6.5, unemployment was more
pronounced among the poor, where 29% of poor edu-
cated persons of age 18-29 were unemployed and one
out of four educated non poor was unemployed. It
seems that even if a poor person is able to break the
vicious circle of education and poverty, he/she still
cannot compete in the job market as a result of low
quality education, labor market mismatch, or because
of a lack of connections in identifying job opportuni-
ties.
Box 6.2: Work and Education are Closely Correlated
One young man talked about his own experience, when he had to drop out from school, because he was also working and
his grades were therefore low. Given the opportunity, he would have liked to continue his education. Education requires
high grades. Those that earn them are the ones living in comfortable conditions that allow them to study and concentrate
on their lessons. Another young man expressed his regrets as to every minute he spent in school, his anger towards all
his teachers, as well as his father who used to push him to study. He studied and worked hard, but what did he get at the
end? Nothing. He declared that he was willing to accept any job. When asked if he was going to send his children to school,
he answered in the positive, hoping for good quality education that can be useful to them.
Source: Heba el Laithy, based on youth focus groups for the study ‘Living Standards in Egypt’ (2007) conducted for Environmental Quality International.
Table 6.5: Youth Unemployment Rate by Education Level and Poverty Status, 2008-09
Secondary
16.114.314.7
Above Secondary
28.721.322.3
University or Higher Education
29.425.325.6
Source: Authors calculations using HEICS, 2008-09.
PoorNon-PoorAll Youth
PoorNon-poor
Permanent
61.976.4
Temporary
7.210.1
Seasonal
1.10.6
Casual
29.812.9
Table 6.6: Distribution of Employed Youth by Poverty Status
Source: Authors calculations using HIECS, 2008-09.

Egypt Human Development Report 2010 { 83 }
pared to less than a quarter of the non poor. Individ-
uals with permanent jobs are less represented among
the poor compared to non poor (by 14 percentage
points), while casual workers are more represented in
the poor group (by 17 percentage points). The preva-
lence of permanent employment increases with age
for the non poor, while there is no age specific pattern
for the poor.
For both poor and non poor, the share of unpaid
workers decreases with age and the gap becomes
wider. Older youth seek formal employment as wage
workers or establish their own business, and the non
poor are more likely to succeed as they have more
skills, more assets and more connections. The inci-
dence of wage employment is 56.6% for the poor ver-
sus 54.1% for non poor (Table 6.7). Unpaid workers
are more common among the poor than the non poor,
with the shares in total employment at 24.7 and 19%
for the poor and non poor, respectively. This may be
due to the fact that rural residents are engaged pri-
marily in agriculture and poverty is more prevalent in
rural areas (see Figure 6.8).
a ProfiLe of Poor ruraL youthAccording to Egypt’s geography, it is now well estab-
lished that the poor are concentrated in rural areas
and particularly those in Upper Egypt. Egypt’s pov-
erty map also provides ample evidence for high levels
of discrimination across rural areas themselves. The
Youth employment may be considered informal if the
job is unpaid or if the job includes no benefits such as
participation in the country’s social security system.
High rates of informality are a signal that youth are
finding less permanent and low-quality jobs.
Underemployment is more prevalent among
employed youth, with the poor over-represented
among groups with seasonal or casual occupations.
Underemployment is defined as working in tempo-
rary, seasonal or casual work, for lower wages. Over-
all, 84% of employed individuals had permanent
work, 10.8% had casual work, 4.5% have temporary
work, and less than one percent had seasonal work.
Among employed youth, 72% have permanent work,
9.2% have temporary work, 0.8% have seasonal work
and 18% have casual work. More than one third of
poor employed youth have no permanent jobs com-
Source: Authors calculations using HIECS, 2008-09.
Figure 6.7: Percentage of Permanent Employment by Age, 2008-09
Source: Authors calculations using HIECS, 2008-09.
Table 6.7: Distribution of Youth in Labor Force by Employment Categories, 2008-09
Wage Worker
56.654.1
Employer
2.13.8
Self Employed
7.110.9
Unpaid Workers
24.719.1
Unemployed
9.512.1
Figure 6.8: Unpaid Workers’ Share by Age and Poverty Status, 2008-09
Figure 6.6: Unemployment Rate by Age, 2008-09
15 20 25 3015 17 19 20 23 25 27 29
PoorNon-Poor
PoorNon-Poor
18 20 22 24 26 28 30
PoorNon-Poor
Source: Authors calculations using HEICS, 2008-09.
20
15
10
5
0
100
50
0
35
30
25
20
15
10
5
0
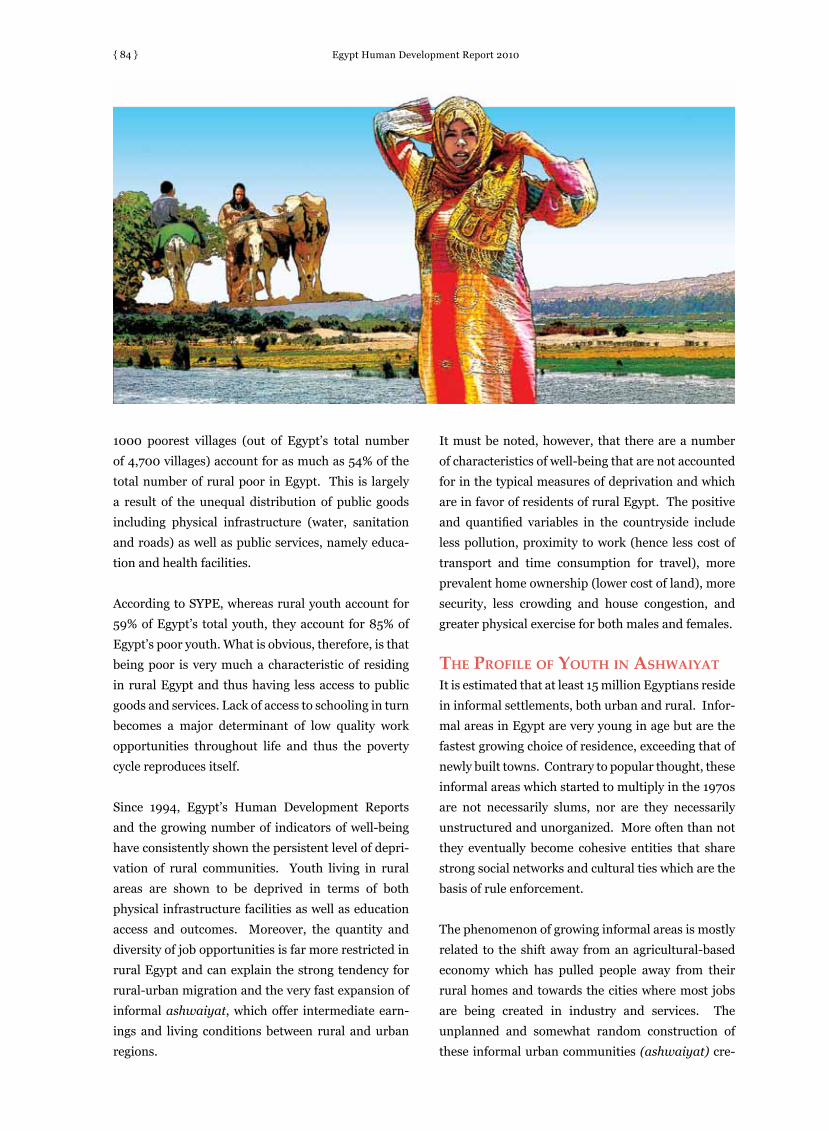
Egypt Human Development Report 2010{ 84 }
It must be noted, however, that there are a number
of characteristics of well-being that are not accounted
for in the typical measures of deprivation and which
are in favor of residents of rural Egypt. The positive
and quantified variables in the countryside include
less pollution, proximity to work (hence less cost of
transport and time consumption for travel), more
prevalent home ownership (lower cost of land), more
security, less crowding and house congestion, and
greater physical exercise for both males and females.
the ProfiLe of youth in ashwaiyatIt is estimated that at least 15 million Egyptians reside
in informal settlements, both urban and rural. Infor-
mal areas in Egypt are very young in age but are the
fastest growing choice of residence, exceeding that of
newly built towns. Contrary to popular thought, these
informal areas which started to multiply in the 1970s
are not necessarily slums, nor are they necessarily
unstructured and unorganized. More often than not
they eventually become cohesive entities that share
strong social networks and cultural ties which are the
basis of rule enforcement.
The phenomenon of growing informal areas is mostly
related to the shift away from an agricultural-based
economy which has pulled people away from their
rural homes and towards the cities where most jobs
are being created in industry and services. The
unplanned and somewhat random construction of
these informal urban communities (ashwaiyat) cre-
1000 poorest villages (out of Egypt’s total number
of 4,700 villages) account for as much as 54% of the
total number of rural poor in Egypt. This is largely
a result of the unequal distribution of public goods
including physical infrastructure (water, sanitation
and roads) as well as public services, namely educa-
tion and health facilities.
According to SYPE, whereas rural youth account for
59% of Egypt’s total youth, they account for 85% of
Egypt’s poor youth. What is obvious, therefore, is that
being poor is very much a characteristic of residing
in rural Egypt and thus having less access to public
goods and services. Lack of access to schooling in turn
becomes a major determinant of low quality work
opportunities throughout life and thus the poverty
cycle reproduces itself.
Since 1994, Egypt’s Human Development Reports
and the growing number of indicators of well-being
have consistently shown the persistent level of depri-
vation of rural communities. Youth living in rural
areas are shown to be deprived in terms of both
physical infrastructure facilities as well as education
access and outcomes. Moreover, the quantity and
diversity of job opportunities is far more restricted in
rural Egypt and can explain the strong tendency for
rural-urban migration and the very fast expansion of
informal ashwaiyat, which offer intermediate earn-
ings and living conditions between rural and urban
regions.

Egypt Human Development Report 2010 { 85 }
the typical forms of deprivation of the poor. In fact,
the prevalence of illiteracy, which stands at 16.7% of
the total sample of youth, is mostly accounted for by
rural Upper Egypt youth.
Overall, the representation of youth from ashwaiyat
in the total sample is very close to their weight in the
sample for all other characteristics, such as job qual-
ity and ownership of assets (mobile phone, room, and
bed). On the social front, married youth in ashwaiyat
have a 40% higher chance of having a nuclear family
living arrangement than the average for all youth in
Egypt.
According to the typical variables used to measure
poverty, it would seem that the quality of life of youth
residing in Egypt’s ashwaiyat areas are not as bad as
assumed by many. However, recent surveys of these
slum areas show that one must be careful and distin-
guish between those that are geographically adjacent
to the better-off urban centers and those that are
remote – the difference being in better work opportu-
nities in the former and hence better living conditions.
DreaMs anD asPirations of youth froM DisaDvantageD faMiLies
The source of data here is a representative sample
survey, Dreams of Egyptians, conducted jointly by
IDSC and the Center for Sociological and Crimino-
logical Research (2009). The sample size is 3000
individuals (each representing a household) aged 18
and above, of which youth were 1,776 in the age group
18-29. There are 68 questions, most of which are
multiple choice.
In order to gauge the difference in attitudes and out-
look between poor and non-poor youth, the sample
was divided into poor and non-poor according to the
response to the following question: To which class
do you consider you belong to? The choice answers
were: Rich, middle class, lower middle class, poor,
and destitute. The two bottom groups were assumed
to constitute the poor, as opposed to the first three
which were assumed to represent the non-poor. The
first interesting observation on our sample of youth
is that only 10% of the total sample consider them-
selves poor (poor plus destitute in the sample), which
ates problems of accessibility, narrow streets, high
density, and insufficient infrastructure. Other nega-
tive attributes include the poor coverage of physical
infrastructure and especially sanitation, the poor
quality of roads, the unsafe modes of public trans-
portation, and the poorly ventilated dwellings (see
Chapter 15). Perhaps the most serious problem that is
faced by informal areas in urban Egypt is the stigma-
tization of their youth residents. The failure to pro-
tect young people from drugs and hustling has caused
these places to attract more illegal activity than other,
better-protected districts. This contributes further to
the marginalization of these areas and their residents.
Moreover, there is a 50% greater chance of drug use
amongst young residents in ashwaiyat versus the
average in Egypt
Those that live in these informal areas – young and
old – must not be assumed as poor, as the profile
of these areas includes a vast array of people from
many socio-economic backgrounds. By examining
the outcomes of the SYPE survey, for youth living
in ashwaiyat, it is surprising to note that only 10%
of the residents belong to the lowest wealth quintile
and another 12% to the second lowest quintile. To
the contrary, as much as 58% of residents belong to
the fourth and fifth quintiles. Another characteristic
of youth in urban ashwaiyat is that their educational
outcomes are far better than the average for Egypt.
Whereas the youth residents of urban ashwaiyat
account for 9.4% of the total youth sample, they are
relatively well-represented amongst post-secondary
and University graduates (12% and 13%, respectively)
and only account for 6% of total illiterate youth. This
confirms that youth in ashwaiyat do not suffer from
Source: Dreams of Egyptians Survey, 2009 – Question 7.
Figure 6.9: Key Fears for the Future
Loss of Security
Poverty
Unemployment
Sickness
Inflation
0 10 20 30 40 50 60
PoorNon Poor
%
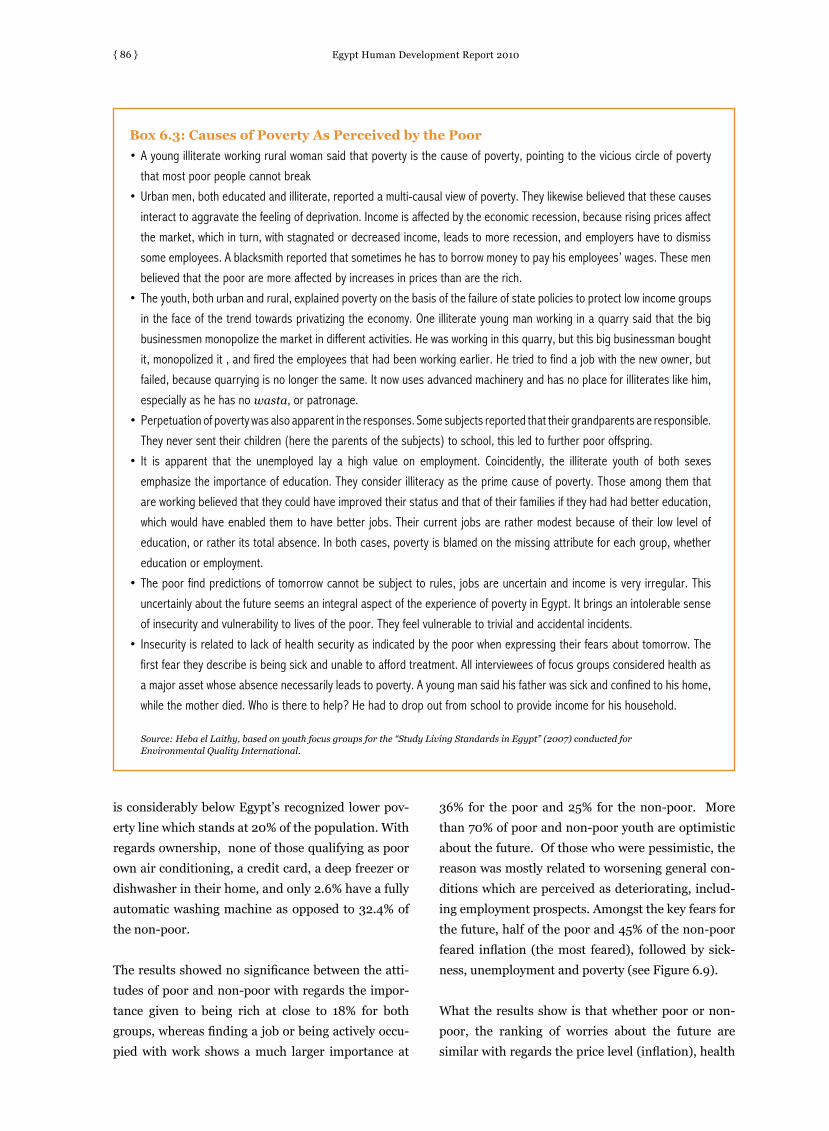
Egypt Human Development Report 2010{ 86 }
is considerably below Egypt’s recognized lower pov-
erty line which stands at 20% of the population. With
regards ownership, none of those qualifying as poor
own air conditioning, a credit card, a deep freezer or
dishwasher in their home, and only 2.6% have a fully
automatic washing machine as opposed to 32.4% of
the non-poor.
The results showed no significance between the atti-
tudes of poor and non-poor with regards the impor-
tance given to being rich at close to 18% for both
groups, whereas finding a job or being actively occu-
pied with work shows a much larger importance at
36% for the poor and 25% for the non-poor. More
than 70% of poor and non-poor youth are optimistic
about the future. Of those who were pessimistic, the
reason was mostly related to worsening general con-
ditions which are perceived as deteriorating, includ-
ing employment prospects. Amongst the key fears for
the future, half of the poor and 45% of the non-poor
feared inflation (the most feared), followed by sick-
ness, unemployment and poverty (see Figure 6.9).
What the results show is that whether poor or non-
poor, the ranking of worries about the future are
similar with regards the price level (inflation), health
Box 6.3: Causes of Poverty As Perceived by the Poor
•Ayoungilliterateworkingruralwomansaidthatpovertyisthecauseofpoverty,pointingtotheviciouscircleofpoverty
that most poor people cannot break
•Urbanmen,botheducatedandilliterate,reportedamulti-causalviewofpoverty.Theylikewisebelievedthatthesecauses
interact to aggravate the feeling of deprivation. Income is affected by the economic recession, because rising prices affect
the market, which in turn, with stagnated or decreased income, leads to more recession, and employers have to dismiss
some employees. A blacksmith reported that sometimes he has to borrow money to pay his employees’ wages. These men
believed that the poor are more affected by increases in prices than are the rich.
•Theyouth,bothurbanandrural,explainedpovertyonthebasisofthefailureofstatepoliciestoprotectlowincomegroups
in the face of the trend towards privatizing the economy. One illiterate young man working in a quarry said that the big
businessmen monopolize the market in different activities. He was working in this quarry, but this big businessman bought
it, monopolized it , and fired the employees that had been working earlier. He tried to find a job with the new owner, but
failed, because quarrying is no longer the same. It now uses advanced machinery and has no place for illiterates like him,
especially as he has no wasta, or patronage.
•Perpetuationofpovertywasalsoapparentintheresponses.Somesubjectsreportedthattheirgrandparentsareresponsible.
They never sent their children (here the parents of the subjects) to school, this led to further poor offspring.
• It is apparent that the unemployed lay a high value on employment. Coincidently, the illiterate youth of both sexes
emphasize the importance of education. They consider illiteracy as the prime cause of poverty. Those among them that
are working believed that they could have improved their status and that of their families if they had had better education,
which would have enabled them to have better jobs. Their current jobs are rather modest because of their low level of
education, or rather its total absence. In both cases, poverty is blamed on the missing attribute for each group, whether
education or employment.
•Thepoorfindpredictionsoftomorrowcannotbesubjecttorules,jobsareuncertainandincomeisveryirregular.This
uncertainly about the future seems an integral aspect of the experience of poverty in Egypt. It brings an intolerable sense
of insecurity and vulnerability to lives of the poor. They feel vulnerable to trivial and accidental incidents.
• Insecurityisrelatedtolackofhealthsecurityasindicatedbythepoorwhenexpressingtheirfearsabouttomorrow.The
first fear they describe is being sick and unable to afford treatment. All interviewees of focus groups considered health as
a major asset whose absence necessarily leads to poverty. A young man said his father was sick and confined to his home,
while the mother died. Who is there to help? He had to drop out from school to provide income for his household.
Source: Heba el Laithy, based on youth focus groups for the “Study Living Standards in Egypt” (2007) conducted for Environmental Quality International.

Egypt Human Development Report 2010 { 87 }
are very close on all except the protection from pov-
erty, where the non-poor response is at 49% versus
the poor at 57%. As to who will fulfill the dreams of
Egyptian youth (Figure 6.11, question 10 of the sur-
vey), the fatalism of youth shows in their overwhelm-
ing response is God, followed by themselves and last
and least by family. It is interesting to note that the
dependence on the state now accounts for only 2% of
the response of the non-poor and 0% for the poor.
With regards time preference, youth would like to
be spending more time on worship (58% of the poor
and 62% of the non-poor). Second in importance is
spending time with family, visiting the extended fam-
ily (at 32-33% of both the poor and non-poor), and
having more leisure time with nuclear family (24%
of the poor and 28% of the non-poor). The glaring
contrast between poor and non-poor youth appears
in the selection by the poor of more time to rest at
32%, which ranks it equal to the second most impor-
tant thing, in contrast to the non-poor at 13%. It thus
seems that the poor are seriously missing out on
physical rest.
In terms of preference for nuclear as opposed to
extended families as a model for Egypt, the prefer-
ence for an extended family was about double that
(63%) of nuclear (31%) for the youth sample as a
whole, and the difference between poor and non-poor
was small. The same is true with regards happiness,
which appears prominently as the choice of poor and
non-poor in relation to hopes for ones family. This
is followed by hope for solidarity (being one hand).
With respect to children, as many as 95% or more
of both poor and non-poor would like their children
to obtain a university or post-university degree, while
73% of the poor hope their children will get positions
and unemployment, but they differ on poverty, where
the poor view the prospect of falling into poverty with
much more apprehension. This shows great aware-
ness among youth in Egypt of economic circum-
stances at the national level having deteriorated for
their particular generation, as compared to that of
their parents and especially with regards the avail-
ability of good jobs (see Box 6.3).
With regards to what factors could provide confidence
in the future, five out of ten optional factors seem to
matter for youth . The most important one was when
the general conditions of the country will improve
(42% for the poor and 41% for the non-poor). The
second most important variable to boost confidence
in the future was finding a good job (21% for the poor
and 28% for the non-poor), the third was when justice
prevails in the country (20% and 22% for poor and
non-poor, respectively), the fourth was when each
one gets his/her opportunity (18% and 17% for poor
and non-poor, respectively) and the fifth was when
one finds good health services (17% and 15% for poor
and non-poor, respectively). See figure 6.10.
OpportunityThose less important variables, for the both the rich
and non-rich, included completing an education, get-
ting an education, and finding housing. This shows
great awareness among youth in Egypt of circum-
stances at the national level having deteriorated for
their particular generation, as compared to that of
their parents with regards economic conditions and
especially the availability of good jobs.
With regards dreams and aspirations of youth, the
study shows that Egyptian youth long for security of
income, health and a good job. Poor and non-poor
Figure 6.10: What Gives Confidence about the Future
Figure 6.11: Who Will Fulfill Your Dreams?
Finding Good Health Services
Opportunity Received
Prevailing Justice in Country
Finding a Good Job
Improvement in Conditions of Country
Source: Dreams of Egyptians Survey, 2009 – Question 8. Source: Dreams of Egyptians Survey, 2009 – Question 10
PoorNon Poor
State
Family
Self
God
0 10 20 30 40 50 0 10 20 30 40 50 60 70 80%%

Egypt Human Development Report 2010{ 88 }
in the government or public sector (63% of the non-
poor).
coPing MechanisMs of the young anD Poor Analysis of the habits and response of poor youth
shows that they are resourceful and take advantage
of both traditional mechanisms of social solidarity
as well as innovative ways of coping with poverty.
With regards tapping social networks, young people
are likely to continue living with their parents and
even form families within the extended family sys-
tem. This is related to the fact that parents in Egyp-
tian society are very likely to support their children
beyond the age of maturity, as has been evidenced in
the literature. The culture in Egypt is supportive of
a system whereby parents are willing to share their
income and savings with their children during the
entire cycle of education, as well as in preparation for
marriage, for both boys and girls. Social protection is
therefore predominantly received by youth from the
family rather than the state, since there are no unem-
ployment benefits and youth are not likely to have
accumulated savings or assets.
SYPE results show no significant difference across
wealth quintiles for age of first marriage. The results
show that for women 18-21 years, the median age
ranges from 17 for the poorest to 18 for the richest,
and for women 22-29 years, the median age ranges
from 18 for the poorest to 21 for the richest.
Another characteristic which is similar across youth
quintiles in SYPE is the intent to travel to another
country to live, work or study. The range moves from
a low of 13% for the second quintile to a high of 19%
for the fourth quintile. In terms of emigration as a
coping mechanisms, the young and poor in Egypt
(aged 18-29) are shown to have equal or almost equal
access to travel and migration in search of job oppor-
tunities in Egypt and abroad. For those who travel to
the Arab countries or abroad, their job opportunities
are mostly in the farming and construction sectors as
unskilled labor. These opportunities have been the
main source of savings in the form of remittances
which are subsequently used to engage in projects as
young entrepreneurs.
Moreover, SYPE results show similar entrepreneurial
behavior with regards youth ownership of business,
which ranges from a low of 5% for the poorest quintile
to 10% for the richest (see Figure 6.12). As to “trying
to establish a new business,” the range moves to a low
of 12% for the poorest to a high of 20% for the fourth
quintile.
What is really missing in the context of coping with
poverty is for youth to be provided by the govern-
ment with a sufficient package of incentives to help
themselves. At present, social and economic schemes
to help youth help themselves are limited to micro-
credit by the Social Fund for Development (SFD): The
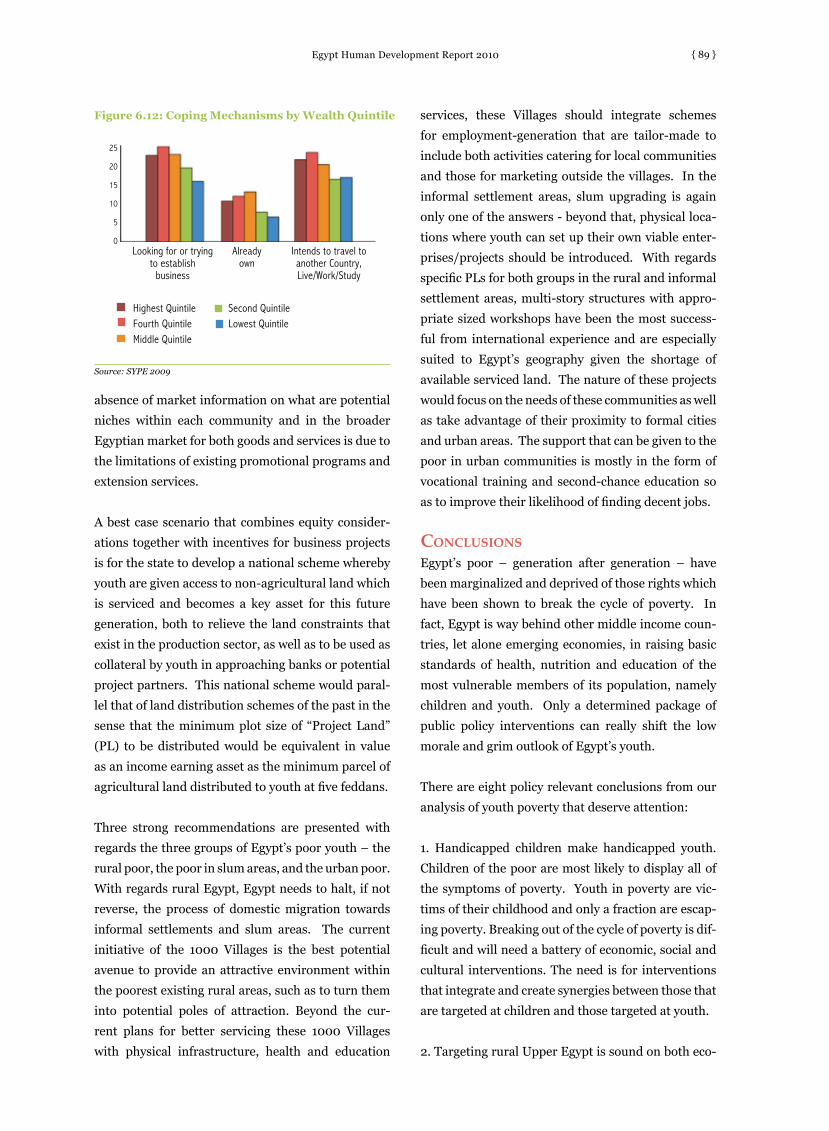
Egypt Human Development Report 2010 { 89 }
services, these Villages should integrate schemes
for employment-generation that are tailor-made to
include both activities catering for local communities
and those for marketing outside the villages. In the
informal settlement areas, slum upgrading is again
only one of the answers - beyond that, physical loca-
tions where youth can set up their own viable enter-
prises/projects should be introduced. With regards
specific PLs for both groups in the rural and informal
settlement areas, multi-story structures with appro-
priate sized workshops have been the most success-
ful from international experience and are especially
suited to Egypt’s geography given the shortage of
available serviced land. The nature of these projects
would focus on the needs of these communities as well
as take advantage of their proximity to formal cities
and urban areas. The support that can be given to the
poor in urban communities is mostly in the form of
vocational training and second-chance education so
as to improve their likelihood of finding decent jobs.
concLusionsEgypt’s poor – generation after generation – have
been marginalized and deprived of those rights which
have been shown to break the cycle of poverty. In
fact, Egypt is way behind other middle income coun-
tries, let alone emerging economies, in raising basic
standards of health, nutrition and education of the
most vulnerable members of its population, namely
children and youth. Only a determined package of
public policy interventions can really shift the low
morale and grim outlook of Egypt’s youth.
There are eight policy relevant conclusions from our
analysis of youth poverty that deserve attention:
1. Handicapped children make handicapped youth.
Children of the poor are most likely to display all of
the symptoms of poverty. Youth in poverty are vic-
tims of their childhood and only a fraction are escap-
ing poverty. Breaking out of the cycle of poverty is dif-
ficult and will need a battery of economic, social and
cultural interventions. The need is for interventions
that integrate and create synergies between those that
are targeted at children and those targeted at youth.
2. Targeting rural Upper Egypt is sound on both eco-
absence of market information on what are potential
niches within each community and in the broader
Egyptian market for both goods and services is due to
the limitations of existing promotional programs and
extension services.
A best case scenario that combines equity consider-
ations together with incentives for business projects
is for the state to develop a national scheme whereby
youth are given access to non-agricultural land which
is serviced and becomes a key asset for this future
generation, both to relieve the land constraints that
exist in the production sector, as well as to be used as
collateral by youth in approaching banks or potential
project partners. This national scheme would paral-
lel that of land distribution schemes of the past in the
sense that the minimum plot size of “Project Land”
(PL) to be distributed would be equivalent in value
as an income earning asset as the minimum parcel of
agricultural land distributed to youth at five feddans.
Three strong recommendations are presented with
regards the three groups of Egypt’s poor youth – the
rural poor, the poor in slum areas, and the urban poor.
With regards rural Egypt, Egypt needs to halt, if not
reverse, the process of domestic migration towards
informal settlements and slum areas. The current
initiative of the 1000 Villages is the best potential
avenue to provide an attractive environment within
the poorest existing rural areas, such as to turn them
into potential poles of attraction. Beyond the cur-
rent plans for better servicing these 1000 Villages
with physical infrastructure, health and education
Figure 6.12: Coping Mechanisms by Wealth Quintile
Highest QuintileFourth QuintileMiddle Quintile
Second QuintileLowest Quintile
25
20
15
10
5
0
Source: SYPE 2009
Looking for or trying to establish
business
Alreadyown
Intends to travel to another Country,Live/Work/Study

Egypt Human Development Report 2010{ 90 }
nomic and social grounds. Egypt’s poverty map as
well as all other exercises monitoring human devel-
opment has confirmed that the poorest communities
and the most deserving are concentrated in three or
four governorates in Upper Egypt. Targeting instru-
ments such as CCTs are effective instruments and
should include such programs as nutritional supple-
ments at school, education and training/re-training.
These reduce leakages to the non-poor while ensuring
that it is the children and youth who are afforded the
opportunity to break out of the poverty cycle.
3. Informal areas and slum conditions breed informal
and risky behavior. The absence of minimum stan-
dards of regulation and safety in informal settlements
provides the breeding ground for drugs and other
forms of crime. Youth in these settlements are not
as much in need of poverty-focused support as they
are of conditions and opportunities to engage in civic
participation and identify with the welfare of their
community.
4. Education is the most obstinate divide that dis-
criminates across society between the haves and the
have-nots. The only way for Egypt to regain its social
strength in terms of merit-based mobility from rags
to riches according to education outcomes is for the
entire system of basic and vocational training to be
overhauled. The strategy of the Ministry of Educa-
tion has been applauded for its comprehensive and
integrated reform agenda which is in process but
needs more resources. On the other hand, the poli-
cies and programs to eradicate illiteracy are falling
short. Moreover, the process whereby the leakage
Box 6.4: Activities to Promote Regular Migration and Positive Alternatives
Building upon noteworthy Egypt-Italy collaboration in the field of migration – in particular, aiming to address Egyptian
unaccompanied minors’ irregular migration to Italy – the Egyptian Minister of Family and Population and the Italian
Ambassador to Egypt signed a landmark agreement on 22 December 2009, kick-starting a 3-year development programme
(funded by the Italian Ministry of Labour and Social Policies for a total of 2 million Euro) which will create new education
and training opportunities for Egyptian youth to enhance their employment prospects in Egypt and abroad. Both parties to
the agreement have stated that they look forward to cooperating closely with the International Organization for Migration,
which has been appointed joint implementing agent alongside the National Council for Childhood and Motherhood (NCCM).
Leading to this, IOM and the NCCM designed and delivered a pilot information campaign to promote safe migration and
positive alternatives in the governorate of Fayoum – a well-known area of high migration-pressure – in late 2009.
Activities were varied. For example, on the 8th and 9th of December, IOM and the NCCM held a successful advocacy and
planning workshop in the village of Tatoun (building the capacity of 38 community and religious leaders to promulgate
the campaign’s central message). Art seminars and football matches were also organized to directly engage vulnerable
Egyptian youth and their families. A celebrity testimonial – notably put forth by prominent Egyptian actor Amr Waked –
played a key role in enhancing the campaign’s appeal amongst target beneficiaries. Further information on the information
campaign is available online (http://www.egypt.iom.int/UAMCampaign.htm).
Over the coming 18 months, under the abovementioned agreement and complementary to pilot phase activities, IOM and the
NCCM will seek to create market-oriented education and training opportunities for vulnerable Egyptian youth to enhance
their employability in Egypt and Italy, through the upgrade and operation of two technical-vocational training centres in the
Fayoum Governorate. Subsequently, comprehensive training will be conducted for centre staff (selected in accordance with
pre-determined criteria) and curricula will be developed – with due consideration to labour market demand in Egypt and
key destination countries. The centre will also offer Italian language courses and provide information on legal pathways
for employment and residence in Italy. To this end, participation of the Egyptian diaspora (through virtual or temporary
return) will be actively encouraged. Alongside this core project component, IOM and the NCCM may identify and implement
other priority activities to promote socio-economic development in Egypt, complementing and profiting from synergies with
the centre. Source: International Organization for Migration, Egypt; prepared for EHDR 2010
Egypt Human Development Report 2010 { 91 }
decent jobs with minimum wages and acceptable
maximum hours of work.
7. Migration has been the most effective equalizer.
Poor youth have had an equal opportunity to tem-
porary jobs abroad as have the rich and highly edu-
cated. Remittance savings have been the most impor-
tant source of private investment in rural as much as
in urban Egypt from lower as much as from higher
skilled occupations for the past 30 years. It is high
time that the government institutionalize the instru-
ments and mechanisms of support to channel migrant
savings into productive investment. The SFD still has
enormous scope to expand its credit and non-finan-
cial services to reach small savers and investors, espe-
cially in the countryside.
8. Access to physical assets and credit for youth entre-
preneurship is the answer to the absence of decent
jobs. Egypt ranks 11th overall out of 43 countries in
the Global Entrepreneurship Monitor (GEM) Survey,
with 20.2% of the working age population (18-64)
involved in entrepreneurial activity. For all countries
in the GEM Survey, the 25-34 age group had the high-
est early-stage entrepreneurial activity, but the group
with the next highest rate in Egypt was the 18-24
years old, which is not common of all other countries.
Egypt’s youth thus give the country a strong entre-
preneurial advantage. Refer to Chapter 10 for more
details on GEM results.
from the basic education system continues at its cur-
rent deplorable levels must be remedied, preferably
via the targeting of rural poor who have been shown
to have the highest rates of attrition from the school
system.
5. The national scheme for “Project Land” (PL) would
be adjusted along the same lines as Egypt’s national
vision for growth and diversification, both across
region and across sectors. The scheme would thus
distribute PL parcels in new regions such as along
the coastline for youth who are willing to settle and
engage in relevant projects in tourism, eco-friendly
agriculture, renewable energy and other viable sec-
tors. PL lands would be distributed to youth in Upper
Egypt along the desert corridor adjacent to the Nile
Valley (Zaheer Sahrawi) to engage in housing proj-
ects, as well as SMEs that cater for goods and services
for the urbanizing communities of Egypt’s southern
region. ICT services will continue to be one of the high
growth activities with potential that can materialize
with sufficient government and big business support.
6. Young people still dream of a university education
followed by a government job, not only for themselves
but also for their children. The state must now bank
on its youth and provide an enabling environment for
high rates of return to education and skills in the pri-
vate sector. The private sector must also reform and
formalize work contracts and social security contri-
butions so as to improve work conditions and offer

Egypt Human Development Report 2010{ 92 }
Endnotes1 Thanks are due to Dina Armanious who co-authored the Background Paper for EHDR 2010 on Poverty and Youth with
Heba el Laithy. Thanks are also due to Defne Abbas for preparing several figures and verifying data.2 SYPE results also show that poor youth have a poor quality of diet, even if not very different from that of higher wealth
quintiles. The percentage of poor youth (lowest quintile) who have not consumed fish, chicken, meat, fruits or eggs during the week previous to the SYPE survey are 47%, 36%, 29%, 24% and 20%, respectively.
3 See 2010 UNICEF and CEFRS Child Poverty and Disparities in Egypt. The age group for children is defined as under 18 years old. The study followed the Bristol University methodology, whereby a multidimensional measure of poverty is based on the subset of seven indicators including shelter, food, education, health, information, water and sanitation
4 It should be noted that the quality of these services is poor.5 The severe deprivation indicator is the proportion of children under five years of age whose height and weight are below
three standard deviations of the WHO’s median Child Growth Standards reference population adopted in 20066 See Chapter 2, section 37 SYPE, 20098 See Chapter 159 Dream of Egyptians Survey, Question 4410 Dreams of Egyptians Survey, Question 6811 Questions of Dreams of Egyptians survey is of a multiple choice nature12 40% of the poor and 33% of the non-poor in the sample have children
reeferencesCentral Agency for Public Mobility and Statistics (CAPMAS). Household Income Expenditure and Consumption Survey (HIECS), 2008.Egypt Demographic and Health Survey, (EDHS), 2008.Egypt Household Education Survey (EDES), 2007.Information and Decision Support Center (IDSC), Dream of Egyptians Survey, 2009.Population Council. Preliminary survey findings of the Survey of Young People in Egypt (SYPE), 2009. Population Council. Survey of Young People in Egypt Preliminary Report. February, 2010.UNICEF and CEFERS. Child Poverty and Disparities in Egypt, 2010.

{ 93 }
In Egypt there have undoubtedly been improvements in gender par-ity over the past decade, especially in education. According to the comprehensive 2010 Survey of Young People in Egypt (SYPE), cur-
rently, more than half of university enrolment is by women, and 74% of female respondents have completed basic education or above (see Chapters 3 and 4). Nevertheless, the same survey reports that 13% of females and 3% of males interviewed, aged 10-29, have never been to school. These figures are consistent with results of the 2006 national census. There is need, then, for a more extensive effort in extending educational services, in particular at the primary stages for poor and often rural young women who suffer most from illiteracy.
Chapter Seven
GENDER EQUALITY AND FREEDOMS

Egypt Human Development Report 2010{ 94 }
On a second front, Egypt has one of the lowest female
labor participation rates in the world1 and ranks 120
out of 128 countries in terms of gender gap.2 There is
little partaking in public or political life. Less than 1%
of young women surveyed in SYPE participate in vol-
unteer work and only 11% of young women voted in
a previous election.3 This confirms reports on youth
exclusion and marginalization.4 It also suggests that
cultural barriers play a part in the segregation of
women from public life.
Boys and girls are socialized to take on different
roles in Egypt. Girls are required to be submissive,
considerate and ready to serve the needs of the fam-
ily, while boys are socialized to interact in the public
arena. SYPE reports that the median number of hours
spent by women aged 22-29 on housework is 3 hours
per day (compared to thirty minutes by their male
counterparts). Further, 40% of females aged 18-24 in
its sample are married and 81% are married5 by the
time they reach the age of 29. Among 2496 married
females surveyed and aged 15-29, all but one had at
least one child. Young women therefore face a num-
ber of obstacles to activities in the public sphere. First
and foremost is the social pressure towards marriage,
at which time family formation and childbearing take
precedence over the relative independence provided
through employment and income generation. Other
common cultural factors suggest a desire to limit
women’s sexuality. While reduction in incidence
of female genital cutting of young women has been
recorded in a number of national and representative
surveys, this practice remains widespread in Egypt.6
The management of this type of social upbringing
generally takes place on the level of the household or
educational and religious institutions, reinforced by
peers, and is governed by the expectations of the com-
munity at large.
Outside of marriage, the public sphere is difficult to
access for many young women. A large fraction of
women never achieve employment, even if this is
desired, as an outcome of cultural as well as labor
market barriers. (see below). For example, the grow-
ing incidence of sexual harassment in public places in
Egypt, and in particular in urban areas where poten-
tial employment is on offer, acts as a disincentive to
participation in activities that might require public
exposure such as travel on public transport, (see Box
7.5). For those in rural areas, cultural restrictions on
travel, or indeed on jobs outside the home or on edu-
cation are widespread. Indeed, these obstacles are
highly correlated with poverty, especially rural pov-
erty and in Upper Egypt in particular.7
In short, if educated, young women have a short win-
dow between school completion, marriage and moth-
erhood while for the uneducated, the window is virtu-
ally non-existent. Recourse to marriage is the sanc-
tioned outlet for most young women. It may not be
the path to greater autonomy or self-determination,
but it does provide a degree of inclusion and social
status. For these reasons, the institution of marriage
in Egypt is worth reviewing.
Marriage the officaL wayFor a Muslim in Egypt, marriage — although governed
by a civil contract involving both the young couple
and their families – is most frequently accompanied
by a short religious service.8 Although arranged mar-
riages are frequent, the bride and her guardian must
both agree on the marriage. Should either the guard-
ian or the girl disagree on the marriage, it may not
legally take place, although young women sometimes
question a guardian’s judgment. The marriage must
officially take place in the presence of witnesses, after
which it may be consummated. Divorce is generally
seen as a male prerogative, although the right to initi-
ate divorce can be added to the marriage contract to
allow women to instigate proceedings. However, this
option is infrequently taken up since it is considered a
slur on the honorable intentions of the groom. There
are other religiously and legally sanctioned provi-
sions to initiate and obtain a divorce by a woman,
such as the newly instituted practice of khul, but these
are complex and costly and used mainly by the upper
income bracket.
For Egypt’s Christians, marriage is both a civil and
religious contract. Matrimony is believed to be a gift
from God, with procreation and family formation as
a major goal, and therefore divorce is rare and avail-
able from the Church only under very specific cir-

Egypt Human Development Report 2010 { 95 }
cumstances. Both Islam and Christianity address the
question of a ‘proper’ role for sexuality and regulate
sexual activity or assign normative values to certain
sexually charged actions or thoughts. Extramari-
tal sexual activity or adultery is strictly forbidden
by Islamic and Coptic law. Anecdotal evidence sug-
gests that penalties are usually much more severe
on women if sexual codes are broken, in some rare
instances leading to ‘honor’ killings.
However, sex is considered a pleasurable, even spiri-
tual activity, and a duty in Islam. At least one hadith
explicitly states that for a married couple to have sex
is a good deed rewarded by God. Another hadith sug-
gests that a man should not leave the proverbial bed
until the woman is satisfied. All shari’a laws regulat-
ing sexual conduct apply to both men and women
equally, apart from those concerning menstruation.
In practice, values and attitudes to marriage tip the
balance in favor of men. SYPE reports that in the large
sample questioned, three quarters of young women
and 86% of young men agreed that a married woman
should obtain her husband’s permission for most
things. Further, more than 70% of the young men and
40% of young women agreed that a girl must obey her
brother, even if he is younger than she is. The gender
dynamics, whether within the family or in marriage,
place young women in a subordinate decision-making
position, exacerbated by the family and male guard-
ianship bias inherent in the initial betrothal process
and the provision that, under certain conditions, a
husband may take on other wives.
The Family Courts in Egypt were established under
Law 10/2004 as the first specialized courts to deal
with disputes among family members, and settle
legal controversy over divorce, custody and alimony
payments. The courts’ major aims are to acceler-
ate legal procedures and processes and to enable
all family members to deal with their problems in a
safe, neutral and helpful environment. The courts,
presided over by a panel of three judges, employ a
sociologist and psychologist, who act as mediators
and counselors. The Ministry of Justice is currently
pilot testing legal aid offices in the Family Courts to
strengthen the capacity of dispute settlement.
However, in a study conducted by the National Coun-
cil for Women Ombudsmen’s Office the following
obstacles and challenges were addressed by the stake-
holders and the participants:
• Family Court Houses are often in unreachable
locations which makes it hard for mothers and
children to access them; they are also unevenly
distributed across the country and some are very
poorly equipped;
• Court workers such as psychologists and social
workers are seen as incompetent or not well-
trained; for this reason, they may misconstrue
evidence and impact on the judge’s rulings.
Poor women are particularly vulnerable in this
respect, since they often lack the skills to present
their case clearly;
• The frequent inclusion of religious bodies inside
the court house is not favored by the judicial sys-
tem; however, it exists and religious opinion is
often conservative and traditional with regard
women. This may be due to the general consti-
tutional stipulation that “Islam is the religion
of State and principles of Shari’a are the main
source of legislation,” so that courts quite often
rule based on Shari’a.
• The settlement offices attached to the courts
often do not keep families out of the courts but
act as a primary procedure to go through to
eventually get into court and their numbers are
often insufficient. Lawyers, for reasons of pay-
ment, intentionally bypass these offices and
advise their clients to go to court instead of try-
ing to settle. Poor women frequently are unable
to cover the costs, given that they mostly have no
independent source of income of their own.
Marriage the unofficaL way9
Given the heightened sexuality of youth, marriage
sometimes takes the form of informal or urfi (custom-
ary) union which provides little of the social advan-
tages of a formal marriage. Recourse to urfi unreg-
istered but religiously acceptable union is, in urban
areas, often prompted by the long period of ‘waithood’
between youth, and the social inclusion of adulthood.
There is no doubt that customary or urfi marriage has
become an increasingly widespread phenomenon in

Egypt Human Development Report 2010{ 96 }
Egypt. Urfi marriage may be seen as one way to avoid
the increasing cost of legal marriage and to permissi-
bly circumvent restrictions on premarital sex at a time
when marriage occurs much later in the life cycle as a
result of numerous social and economic barriers. Its
appeal is therefore at its greatest among young people
whose sexuality is at a high peak, while the legitimate
means through which to express this is mostly barred.
Modern jurisprudence has defined urfi or customary
marriage as a term used to mean that the marriage con-
tract — whether personally or privately documented or
not —is not officially documented and registered.
Urfi marriage is of two kinds: The first is a customary
marriage contract containing all the basic elements of
a fully constructed marriage, meeting all legal condi-
tions and factors but only lacking the official docu-
mentation of the marriage. This type of contract does
not safeguard a woman’s rights. The second is merely
a piece of paper written between a young man and a
young woman without the presence of any witnesses
and is not documented. This cannot be considered
a fully constructed marriage. Different variations of
this form of marriage have appeared such as the ‘cas-
sette marriage’ or the ‘tattoo marriage,’ both of which
are informal urfi arrangements.
However, the legal implications of urfi marriage are
that:
• The wife cannot demand her legal rights if the
husband denies the marriage relationship. She
cannot have access to alimony or obtain the
rights of her children from this marriage;
• The wife cannot inherit her husband or her chil-
dren cannot inherit their father in case of his
death;
• In some cases, especially in a ‘secret’ marriage,
the husband can deny paternity if there is no
proof of marriage;
• The wife cannot obtain her right to her husband’s
pension if he is an employee with a fixed income;
• The husband will lose one of the most important
marital rights which is guardianship or quwama.
Productive and fulfilling public participation beyond
marriage is an important marker in the transi-
tion to full citizenship. However, evidence indicates
that young people in Egypt are socially disengaged.
According to the SYPE report, participation by young
people in youth centers, political parties, unions and
associations is at a low 5%, with only 3% of women
showing any group membership compared to an
equally low 6% for young men.10 This argues strongly
for marginalization and lack of social inclusion.
obstacLes in the PubLic DoMainIf girls and young women are to become increasingly
more active in the community, then an adjustment to
their currently sanctioned role is required, particu-
larly in the public sphere, where their absence is felt
most acutely.11
Based on UNIFEM report findings, gender discrimi-
nation is a worldwide problem and not related to
developing or underdeveloped countries only. There
are vast gaps between national and international
commitments and realities for women globally, espe-
cially in the area of governance and politics.12 Some
examples include the following:
• Women are still outnumbered 4 to 1 on average
in governments worldwide, but as of January
2008, only 6.5% of ministerial positions were
held by women in Egypt according to a report by
the Inter-Parliamentary Union;13
• In Egypt, women members of Parliament were
1.9% in the last election compared to 24.7% in
Afghanistan, 25.5% in Iraq, 18.1 % in Sudan, 19
% in Tunisia, and a high of 47% in Sweden;
• For 18 of the 22 countries that boast 30% or
more women in national assemblies, quotas were
applied in some form. Egypt has also recently
adopted a quota system (Box 7.1);
• Globally, women represent only about 19% of
trade union members. In Egypt, evidence sug-
gests that the figure is 7%.
An enabling environment for democratic participa-
tion in Egypt is limited by polling belligerence, faulty
electoral lists, and limited access to resources for
election campaigning. This discourages women —
and indeed, many men — from taking part in what
is perceived to be a flawed and potentially rough
activity. Conservative social frameworks also dis-

Egypt Human Development Report 2010 { 97 }
courage women’s participation in what is seen as a
male domain and deprives women of needed family
support to be able to combine public ambition with
domestic roles. Decision-making positions such as
state governor, head of a syndicate, or president of a
university are largely seen as strictly male territory,
although some progress has been made in appointing
women to supporting roles, such as university dean-
ships and university vice presidencies.
Further, in 2003, the first woman in Egypt was elected
as judge to the Supreme Constitutional Court, a
precedent that paved the way for the appointment
of 30 other Egyptian women judges to date. Women
as lawyers constitute about one sixth of all gradu-
ates from law faculties. Membership of political
parties range from around 13% in the government’s
National Democratic Party to 9% in the opposition
Wafd Party. The main issue here is not only low rep-
resentation, but age: It is the older and more experi-
enced women who aspire to a parliament seat, with
high levels of non-participation among the younger
generation. This can be called an intergenerational
gap, and it affects both genders.
Enhancing women’s participation in public life is an
essential part and parcel of gender reform. Based
on the 2005 elections, women’s representation in
the Lower House of Parliament was less than 2%,
an insignificant figure. Similarly, in the municipal
elections of 2002, women’s representation in local
popular councils was at a low 2%, but by 2007, there
was a increase to almost 6%, which is still low but an
improvement. The percentage of women in public
office increased from 7% in 1988 to 23.5% in 2005,
perhaps reflecting the fact that these women were
appointed rather than elected. To date, women in
Egypt represent almost 38% of electoral lists and
the figure reaches almost 41% in some governorates,
according to data from the Ministry of Interior for
2007-2008. There has been a noticeable increase in
the participation of women in the political process
as voters. As of 2008, Egyptian women constituted
40% of the electorate as opposed to only 18% percent
in 1986. This represents real progress, and the newly
introduced quota system guaranteeing representa-
tion in Parliament by women is likely to promote
further participation in the public political sphere by
women (see Box 7.1).
If participation in political life is taken as an entry
point to greater empowerment, then a first step would
be to reduce the gap between public and private
spheres by promoting registration to vote, increasing
the range of electable women and enabling them to
enter a career in politics. This may first require affir-
mative action, such as the currently endorsed quota
system. It would also require explicitly encouraging
young women to stand for election, possibly through
a system of incentives to join political parties. Con-
tact with experienced women politicians would help
young women to overcome their reservations and
introduce them to the skills required to be candidates
for positions of responsibility, The focus might also
be on women who are candidates in local elections,
as the holding of elected office at local level is often
Box 7.1: Progress on the Political Front?
In 2009 the Egyptian Cabinet adopted a bill amending People’s Assembly Law 38/1972, providing a quota of 64 seats for
women in the national legislature. The amendment introduced 32 new constituencies in which nominations will be eligible
for women only. The government bill allocates two seats for women in each governorate, where two female candidates
(one each to represent workers or farmers) will be elected in each constituency. This amendment is also in line with
Article 62 of the Egyptian Constitution, amended in 2007 to give legislators flexibility to adopt an electoral system that
guarantees a minimum representation for women in parliament. The quota in Egypt will be around 11%.
In 2006 the percentage of women in Egypt’s trade unions on the level of the Executive Committee reached 7% with 104
elected women members out of 18,292. At a higher level of the National Trade Union, 32 elected women members won
their seats out of 481, compared to the previous session where there were only 10 elected seats out of 478.
Source: Ministry of Manpower and Immigration, 2006

Egypt Human Development Report 2010{ 98 }
ism and parity. Lessons learnt in school life could
have impact through increased participation in vol-
untary activities inside or outside the classroom, in
the community, or in voluntary associations, such as
NGOs and youth organizations. In this respect, Egypt
has created very few public youth clubs for girls (see
Chapter 18).
young woMen in the workPLaceAs shown in Chapter 11, one of the most striking fea-
tures of Egypt’s labor force is the very poor represen-
tation of women. Whereas women have fast caught up
in education at all levels in the period 1980 to the pres-
ent, the closing of this education gender divide was
not accompanied by a parallel improvement in the
representation of women at all ages in the labor force.
Moreover, the data provides evidence that the absence
of women in the labor force cannot be explained by
marriage alone or by preference for not working. The
evidence for unequal opportunities in the labor mar-
ket can be found by analyzing employment data for
young women as compared to young men according
to age and according to educational status.
As shown from a series of data sources in Chapter
11, unemployment rates are very similar for both
females and males until age 19 at which secondary
school graduates are seeking employment. By age
21, however, the unemployment rate for women rises
up to twice the rate for men of the same age. This is
evidence that the problem is not due simply to mar-
riage but more to the culture of family and employer.
In fact, a significant number of young women marry
after the age of 21.
Analyzing employment trends according to sex reveals
very different paths into the labor market for young
men and young women. As shown in Figure 7.1, the
vast majority of young men end up in some type of
employment by age 29, with employment rates in the
vicinity of 92% at that age. For women, the maximum
employment rate of 15% is reached at 24 and then it
stops rising, as women increasingly transition into
marriage. Maximum participation rates for women
are as high as 23%, also reached at age 24.
This suggests that while most unemployed men
the starting point for a successful political career at
national level.
The importance of networks cannot be underesti-
mated, not only for women who are already in public
life but also for those who do not hold a representative
mandate. Networks and alliances of women, amongst
themselves, with political leaders, and between youth
organizations and the authorities at national, regional
and local level are a pre-requisite for the creation of
political caucuses, lobbies, and interest-group repre-
sentation, leading to increased voice and influence.
However, skills such as learning how to present one’s
ideas in public and to gain a hearing, on how to listen
to others and learn with them, on how to participate,
exercise one’s rights, obtain and share information,
express one’s opinions, take decisions, debate, com-
municate, and manage conflicts, are needed by both
young women and men to create a space for them-
selves in the public sphere.
Administrative structures are usually typified by a
male setting operating in a formal way and using the
language of power. Addressing this obstacle would
require the adoption of styles in male-dominated form
that are more welcoming to women. Equality is an inte-
gral part of the social contract as expressed in Egypt’s
Constitution. This right, if reaffirmed, could be helped
by the formal creation of vocal ‘equality’ bodies or units
within government departments, ministries, political
parties, and parliaments. Women’s participation is
often confined to the less visible fields and their rel-
egation to lower skilled subordinate positions needs to
be addressed. A closer look at the budgets allocated to
equality issues would provide a more accurate assess-
ment of commitment to upgrading their participation.
Finally, education for girls must be such that it trans-
lates into social achievement. Education for equita-
ble citizenship, if incorporated into school curricula,
could stimulate an interest in public life, familiarize
girls with public and political decision-making and
promote democratic participation in terms of gen-
der partnership. For this to materialize, teaching
resources and gender-friendly instruments need to
become available to create a culture of egalitarian-
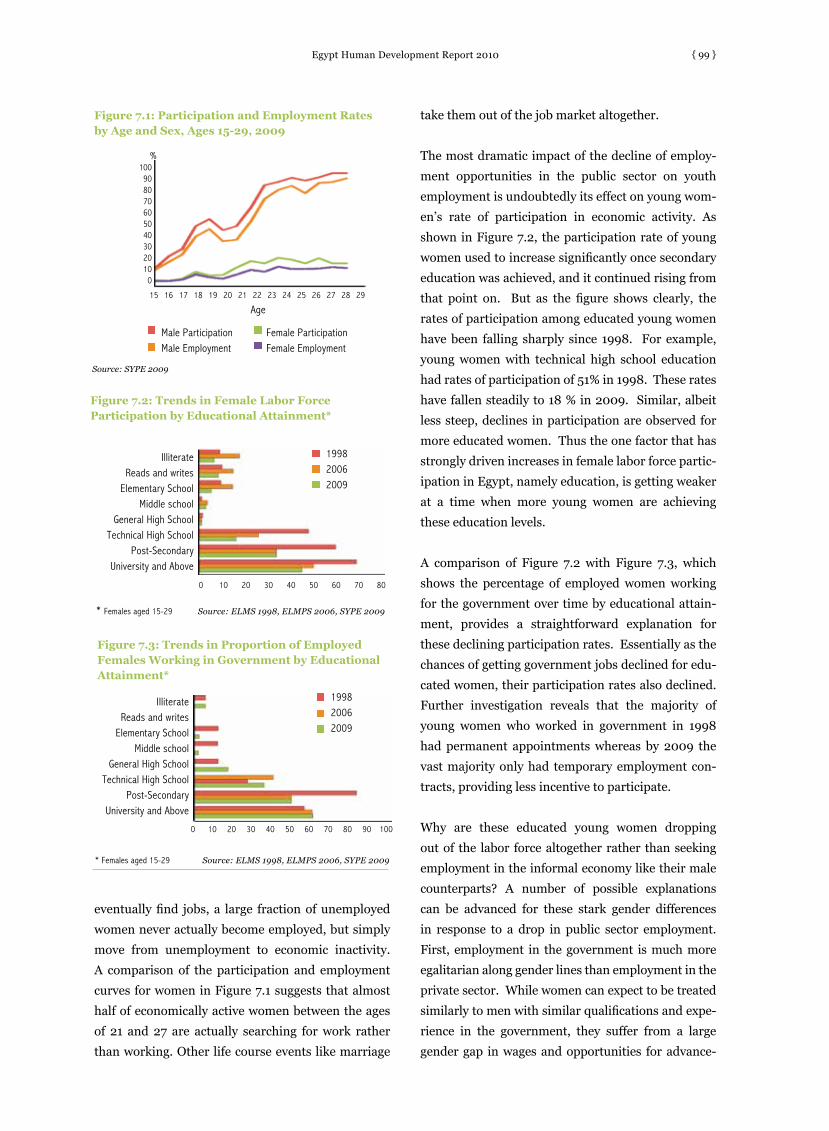
Egypt Human Development Report 2010 { 99 }
eventually find jobs, a large fraction of unemployed
women never actually become employed, but simply
move from unemployment to economic inactivity.
A comparison of the participation and employment
curves for women in Figure 7.1 suggests that almost
half of economically active women between the ages
of 21 and 27 are actually searching for work rather
than working. Other life course events like marriage
take them out of the job market altogether.
The most dramatic impact of the decline of employ-
ment opportunities in the public sector on youth
employment is undoubtedly its effect on young wom-
en’s rate of participation in economic activity. As
shown in Figure 7.2, the participation rate of young
women used to increase significantly once secondary
education was achieved, and it continued rising from
that point on. But as the figure shows clearly, the
rates of participation among educated young women
have been falling sharply since 1998. For example,
young women with technical high school education
had rates of participation of 51% in 1998. These rates
have fallen steadily to 18 % in 2009. Similar, albeit
less steep, declines in participation are observed for
more educated women. Thus the one factor that has
strongly driven increases in female labor force partic-
ipation in Egypt, namely education, is getting weaker
at a time when more young women are achieving
these education levels.
A comparison of Figure 7.2 with Figure 7.3, which
shows the percentage of employed women working
for the government over time by educational attain-
ment, provides a straightforward explanation for
these declining participation rates. Essentially as the
chances of getting government jobs declined for edu-
cated women, their participation rates also declined.
Further investigation reveals that the majority of
young women who worked in government in 1998
had permanent appointments whereas by 2009 the
vast majority only had temporary employment con-
tracts, providing less incentive to participate.
Why are these educated young women dropping
out of the labor force altogether rather than seeking
employment in the informal economy like their male
counterparts? A number of possible explanations
can be advanced for these stark gender differences
in response to a drop in public sector employment.
First, employment in the government is much more
egalitarian along gender lines than employment in the
private sector. While women can expect to be treated
similarly to men with similar qualifications and expe-
rience in the government, they suffer from a large
gender gap in wages and opportunities for advance-
* Females aged 15-29 Source: ELMS 1998, ELMPS 2006, SYPE 2009
* Females aged 15-29 Source: ELMS 1998, ELMPS 2006, SYPE 2009
Figure 7.2: Trends in Female Labor Force Participation by Educational Attainment*
Figure 7.3: Trends in Proportion of Employed Females Working in Government by Educational Attainment*
Figure 7.1: Participation and Employment Rates by Age and Sex, Ages 15-29, 2009
0 10 20 30 40 50 60 70 80
0 10 20 30 40 50 60 70 80 90 100
Illiterate Reads and writes
Elementary SchoolMiddle school
General High SchoolTechnical High School
Post-SecondaryUniversity and Above
Illiterate Reads and writes
Elementary SchoolMiddle school
General High SchoolTechnical High School
Post-SecondaryUniversity and Above
199820062009
199820062009
15 16 17 18 19 20 21 22 23 24 25 26 27 28 29
100908070605040302010
0
Male ParticipationMale Employment
Female ParticipationFemale Employment
Age
%
Source: SYPE 2009

Egypt Human Development Report 2010{ 100 }
Box 7.4: Incidence of Sexual Harassment in Egypt
Among the questions addressed to young people aged 10 to 24 by the Survey of Young People in Egypt, a special section
was focused on questions related to sexual harassment:
•50%ofthefemalerespondentshadbeensubjectedtosomeformofsexualharassment;
•98.9%ofthefemalerespondentssaidthattheyhadbeensubjectedtoverbalharassment;
• •4.57%ofthefemalerespondentssaidthattheyhadbeentouchedorforcedtotouchothersinsensitiveareas;
• •97.9%ofthefemalerespondentssaidthattheywereharassedbyastranger;
• •43.2%ofthefemalerespondentssaidthattheyweresubjectedtoharassmentinpublictransportation;
•10%ofthefemalerespondentssaidthattheyweresubjectedtoharassmentinadarkstreet;
•Almost55%ofthefemalerespondentshadnottoldanyoneaboutbeingharassed,while45%toldsomeone;
•Oneofthosewhotold‘someone’neverreportedtothepolice;
•8.7%offemalerespondentswithintheagegroupof22-29saidthattheyhadencounteredharassmentfromtheirbosses
or colleagues at work;
• 6.6% of the female respondents within the age group of 22-29 said that they had encountered harassment from
customers;
• 4%of the female respondents in theagegroup22-29said that theyhadencounteredharassmentwhengoingand
coming back from work. Source: SYPE 2010
Box 7.3: Work-Related Discrimination
Despite the continuous and fruitful cooperation between the Ombudsman’s Office of the National Council for Women and the
different government and non-government bodies, there still exist recurrent complaints that concern work-related issues.
For example, especially the inability to enjoy transfers or secondments has negative implications on the stability of the
family and the performance of women in their jobs. Refusing requests to be transferred or seconded deprives many women
from keeping their jobs especially if they get married and have to move to other governorates with their husbands. Young
women are obliged to leave work if their requests for transfers or secondments are refused.
Women also face explicit forms of discrimination. A collective complaint was received from the employees in Broadcast
Engineering of Channel Eight stating that women received monthly benefits far less than that received by their male
colleagues despite the fact that they performed exactly the same type of work with the same level of effort. Moreover, there
was discrimination against women in granting the incentive allowance.
Another complainant faced a case of discrimination when she was transferred from her job as a manager of the Department
of Quarries by order of the governor who considered this a man’s job, unsuitable for women, totally disregarding her
academic specialization and her desire to continue her career in this field.
Unmarried women lawyers also face other forms of discrimination. The regulations of the Lawyers Syndicate do not grant
the parents of an unmarried women lawyer the right to her syndicate pension in case of her death as they are not her
dependents, whereas this pension is paid in case of male lawyers. Moreover, women lawyers are not allowed to combine
the syndicate pension with the pension of one of their parents despite the fact that all syndicates allow combining both
syndicate pension with other pensions to males. Source: Ombudsmen The National Council For Women Newsletter (2009)
Box 7.2: The Figures behind Employment
•56%ofthefemalerespondentswithintheagegroupof22-29saidthattheirwageswerelow;
•38.5%ofthefemalerespondentswithintheagegroupof22-29saidthattheysufferedfromlongworkinghours.
•19%ofthefemalerespondentswithintheagegroupof22-29saidthattheysufferedfromharshtreatmentatwork.
Source: SYPE 2010

Egypt Human Development Report 2010 { 101 }
• Well being of women and girls
• Equal access to health care, quality education at all
levels, to community, sports and local activities
• Equal access to justice and public safety
• Equal access to participation and decision making of
women in social decisions
• Skills and opportunities for women and girls to organize
and use their collective power to advocate for justice,
fairness and equity on behalf of themselves and others.
• Make their own choices with regard to traditional beliefs
and cultural practices
• Share power equally and change opportunity structure
• Negotiate gender relations
• Develop a common understanding on vision and
approaches (between women-men) to change societal
attitudes
• Provide choices for young women
• Create a social mechanism and a popular discourse
• Proactive/preventive measures to eliminate all forms of
violence against women and girls
• Equal access to women in career and vocational
guidance, employment, equal remuneration, occupational
health and safety, social security
• Equal access to participation and decision making
in economic decisions
• Self employment /entrepreneurship
• Ability to generate income
• Access to resources
• Access and use credit.
• Access to information
• Own and control assets
• Provide choices for young women
• Realize greater choices in jobs and occupations and
demand access to essential services for themselves,
their families and their communities
• Supportive family policies for working mothers
• Quality and affordable childcare
• Creative incentives to the private sector for gender
equity policies.
Box 7.5: Young Women and Girls Call For Action18
Education
Well-Being
Work-Life Balance
Health (Life Cycle Approach)
Proactive/Preventive measures for VAW
Safety in the Private and Public Domain
Access to Justice
Bridge Generational Gap
Positive Social Policies
Access to Labor Market
Gender Equity Capacity Development
Child Care Service
Family Support Services
Safety at Work
Safety in the Public Space
Access to LandAccess to ResourcesAccess to Credit
Anti-Poverty measures
Work Life Balance
WomenSocial
Empowerment
Women Economic
Empowerment
• Equal access to participation
and decision making
• Equal opportunities
• Develop a civic education
curricula that starts from the
early years in the school
• Build trust
• Temporary affirmative action
• Encourage young women to
participate
• Promote women in political
parties
• Be attentive to young women’s
needs
• Ensure that educational
achievements for girls
are translated into social
achievement
• Ensure allocation of resources
for capacity development
• Engage as equal citizens
• Foster active participation
• Create a strong voice
• Bridge the intergenerational gap
• Conduct budget analysis for
political parties to assess their
commitment to equality and
women’s issues
Equal Access to Decision Making
Equal Access to Participation
Build Trust
Engage as Equal Citizen
Temporary Affirmative
Action
Strong Voice
Encourage Young Women
Equal Opportunities
Bridging of the Intergenerational Gap
Women Political
Empowerment
Egypt Human Development Report 2010{ 102 }
ment in the private sector.14 Secondly, while women
can expect to have lifetime careers in the public sec-
tor, women employed in the private sector tend to quit
such employment at marriage, giving them a relatively
short employment horizon. Finally, high levels of
occupational segregation in the Egyptian labor mar-
ket essentially mean that women face large barriers to
entry to both wage and self-employment even in the
informal economy.15
vioLence against woMen Very little research is available on this sensitive issue
and little is known on the prevalence of beatings or
marital rape, beyond anecdotal evidence. It is clear
that in some traditional families these are condoned
as part of a husband’s rights over his spouse. In this
respect, violence in the home might be called a cul-
tural issue. Cases of serious injury are reported to the
police, if at all, but rarely is a man prosecuted for this
behavior, the preferred mode being some form of rec-
onciliation. Shelters for battered women exist in the
NGO movement, but these are few and far between,
and their presence is not widely known. With regard
the violence of female genital mutilation, SYPE
reports that four in five girls still undergo genital cut-
ting in Egypt, although this is more evident among
older cohorts, suggesting that recent legislation by
the state and in amendments to Child Law (2008)
have borne fruit.16 These impose punishments and
fines on those medical or non-medical persons who
apply this practice.
Cases of public rape are now being reported in the
Egyptian press. To avoid the ‘shame’ and circumvent
public embarrassment, victims were, until recent
reform, often married to their rapist, thereby ‘legal-
izing’ the offence. Rape in Egypt is now considered
a serious criminal offence subject to the Penal Code.
Lesser offences such as the widespread public occur-
rences of harassment, have also led to demands for a
stricter application of Article 306 of the Penal Code
(see below). This is after a number of reported inci-
dents created public outrage, particularly when
repeated molestations of girls by gangs of young men
occurred on busy streets and in front of numerous wit-
nesses. These acts are a new phenomenon to Egypt,
and are often ascribed to a breakdown in traditional
values (see Chapter 13).
LegisLating against sexuaL offenses17
Sexual harassment is a phenomenon common
enough to cause young women to fear for their safety.
Although it must be addressed in its broader context,
in the absence of social means to control to this form
of behavior, the response has been a recourse to strict
legislation and a criminalization of the act. In Chap-
ter Four of the Penal Code, all forms of sexual harass-
ment are addressed, either in the form of criminal-
izing intercourse with a female without her consent
in Article 267 of the Penal Code; or sexual assault in
Articles 267 and 269; or insulting and lewd behav-
ior, whether verbal or nonverbal, which offends a
woman’s modesty in public in Article 306; or inciting
debauchery in Article 269, or obscene acts and inde-
cent exposure that offend modesty in Article 278, or
anyone who commits an indecent act with a woman,
even in private in Article 279 of the Penal Code.
With regard to public offences against modesty, Arti-
cle 306 of the penal code appended to Law 617/1953
and amended by Law 169/1981 and Law 93/1995
states that: Everyone who molests a female, whether
verbally or nonverbally, in a way that offends her mod-
esty in a public road or in a much-frequented place is
to be punished by a term of imprisonment and a fine
or with either of these two punishments. Molestation
does not necessarily have to be committed openly.
The crime is established even if the offending words
are whispered as long as they have been uttered in a
public street or much-frequented location.
There has to be an act of “molestation” that can be
broadly defined, such as obstructing her path, and
pursuing her in public. It also includes commit-
ting verbal or nonverbal acts in a café. Molestation
includes all of the above whatever the means used by
the perpetrator to commit his crime such as touching,
telephone calls, love letters, sms’s, mobile phones,
e-mails and other means.
Some courts have taken the view that the crime is not
established unless the offender’s action offends the
modesty of a particular female. The objective crite-
rion, on the other hand, means that the act committed

Egypt Human Development Report 2010 { 103 }
by the perpetrator should be offensive to any female
even if it is committed against a female of the type
whose modesty may not be offended by such an act
such as a prostitute. This can be a crime in itself or
can be a multiple crime perpetrated with other crimes
such as words with intent to incite prostitution (Arti-
cle 1 of Law 10/1961), or an act that offends modesty
that can be considered an act of obscenity or indecent
exposure (Article 278 of the Penal Code).
The problem of harassment does not necessarily lie
in further criminalizing such behavior through new
legislative intervention or even stricter penalties. It
appears enough that the perpetrator will be stigma-
tized and punished by criminal law as a deterrent to
committing sexual harassment again. However, an
effective socialization process to discourage such
behavior is more difficult to apply than the firm and
strict application of existing legal provisions.
a DreaM for genDer equaLity for egyPt’s youth
There are numerous laws protecting and promoting
equality between men and women but actual imple-
mentation still limits or contradicts this right, even
though it may be granted constitutionally. This is
especially true in Egypt with regard the personal sta-
tus law that organizes family relations during mar-
riage, divorce and the related economic implications,
and custody of children.
Any limitations placed on women in the private
sphere will undoubtedly affect their ability to fully
participate in the public sphere as well. Despite the
great effort exerted in Egypt both by government and
by national women’s organizations, more is needed to
resolve areas of contradiction between shari’a, cus-
tom, legislation and reality. The religious and patriar-
chal culture and social environment in Egypt is some-
times used to justify discrimination against women
and legal protection for women is not enforced by
government officials, preventing women from expe-
riencing equal treatment and equal opportunities
under the law. Thus, the actual observance of exist-
ing laws by all stakeholders is also necessary. In par-
ticular, violence against women, whether occurring in
the home, at the work place, or in the public sphere
is a serious concern. There is a need for a ‘Violence
against Women Act’ with a strong mechanism for
enforcement and monitoring.
The prevailing cultural norms affect the execution
of the law at the local level, leading to discrimina-
tory practices, particularly in rural areas and among
young women, whose lack of awareness concerning
their legal rights is a real concern. This is especially
true with regard lack of proper guarantees to ensure
the legitimate transfer of property and inheritance
rights, and the facilitation of personal legal proce-
dures, including divorce or registration to obtain an
identity card or to vote. Traditional and conservative
social frameworks discourage women’s participation

Egypt Human Development Report 2010{ 104 }
in the public and political spheres, and impede the
provision of needed family support to allow women
to combine work with their domestic roles. Poor
representation of women in political parties hinders
women from playing a public role other than that
provided through benevolence or NGO channels.
the way forwarDAn ‘agency approach’ is needed to enhance young
women’s status as agents of development, as part-
ners, and movers and shapers of change to benefit
society at large. At the individual level, agency is an
assessment of what young women can do in line with
their conception of what is good for them in respect
to their well being. Women might be disempowered
in the work force, unable to reach a decision making
position, unable to move around in the community
freely, yet they might be able to decide on children’s
level of education, able to make health decisions on
behalf of themselves and other family members. The
domains in which individuals can and cannot exert
agency are important issues to grasp, study and pres-
ent solutions for.19
The aim would be to translate ‘women’s issues’ into
a matter of ‘public interest’ such that it promotes
the appropriate affirmative administrative as well
as socio-economic public policies and ensures gen-
der sensitive services and public spending. Efforts
to guarantee greater political participation, engage
women in voice-based (demand) to choice-based
(supply) to improve accountability of public service
providers, will benefit society at large, as will assur-
ing public safety and security for women and girls. A
monitoring, evaluation and accountability framework
for gender equality policies, procedures, processes
would need to be developed.
Endnotes1 Barsoum et al., 20092 Housemann et al., 20083 SYPE Preliminary Report, February 20104 Assaad and Barsoum, 20095 SYPE 20106 Data from the 2010 preliminary results of SYPE indicates that among girls aged 10-14 the prevalence rate is 66% down from
82% of females aged 10-297 See Chapter 118 A family status law applies to all Egyptians, covering marriage amongst other issues. While considered part of the “civil”
code of law, it still has religious elements, referring to the Shari’a as a basis for Muslims, and to the corresponding religious principles or regulations for each of the non-Muslim communities
9 Material provided by Maya Morsy in her background paper to this chapter of the EHDR 201010 SYPE Preliminary Report, February 201011 The World Bank (2007). “Development and the Next Generation”. World Development Report 2007. Washington D.C. .page 1512 The listing and its figures are taken from UNIFEM. “Progress of the World’s Women 2008/2009. Who Answers to Women?”
Gender and Accountability. 200913 International Herald Tribune, 13 February, 201014 Ragui Assaad and Melanie Arntz (2005). “Constrained Geographical Mobility and Gendered Labor Market Outcomes under
Structural Adjustment: Evidence from Egypt. World Development 33(3): 431-454.15 Ragui Assaad and Fatma El-Hamidi (2009) ““Women in the Egyptian Labor Market: An Analysis of Developments, 1988-
2006. In The Egyptian Labor Market Revisited. Ragui Assaad (ed.). Cairo: American University in Cairo Press, pp. 219-25716 SYPE (2010) reports that prevalence among girls aged 10-14 is 66%, while that for females aged 10-29 is 93%17 This section is based on notes from Maged El Shirbini, provided as backgound material for the EHDR 201018 Adapted from the National Women’s Strategy 2007-2016. Government of Ireland Department of Justice, Equality and Law
Reform under the direction of an Inter-Departmental Committee. 2007, and the Development and the next Generation . World Development Report . World Bank . 2007, and United Nations Fund For Women. Progress of the World’s Women 2008/2009. Who Answers to Women? Gender and Accountability. New York. 2008
19 Pillain, Vijayamohanan and Alkire, Sabina (2007), “Measuring Individual Agency or Empowerment: A Study in Kerala”, Centre for Development Studies, Trivandrum, Kerala, India
referencesAssaad, Ragui and Barsoum, Ghada, 2009, “Rising Expectations and Diminishing Opportunities for Egypt’s Youth”. In Navteej
Dhillon and Tarek Yousef (eds) Generation in Waiting: Unfulfilled Promise of Young People in the Middle East, Brookings Institute, Washington DC.
Barsoum, Ghada, Ali Rashed and Dalia Hassanein, 2009, At Work When There is No Respect: Job Quality Issues for Young Women in Egypt, The Population Council, MENA Gender and Work Working Papers, Cairo
Population Council and IDSC, 2010, Survey of Young People in Egypt: Preliminary Report, Cairo.Ricardo Hausemann, Laura Tyson and Saadia Zahidi, 2008, The Global Gender Gap Report, World Economic Forum, Geneva.
{ 105 }
Chapter Eight
Research cited elsewhere in this report indicates young citizens in Egypt are those least likely to engage in any kind of formal political behavior. Their high level of indifference to civic affairs
in general raises the question as to why this should be, and whether youth have developed channels for alternative means of engagement in public life. For the purposes of this chapter, two studies were under-taken, the first to gauge perceptions and attitudes to political participa-tion of young Egyptians, and the second to determine the extent of suc-cess of so called ‘electronic democracy’ since youth in Egypt constitute the largest number of current Internet users. In either case, an informal approach was used. The authors recognize that their results cannot be interpreted as scientific since they are not the outcome of the rigorous methods of standard research practice. Nevertheless, while generaliza-tions cannot be made, results provide a valuable glimpse into the think-ing of a segment of young Egyptians at university level or with access to the Internet.1
YOUTH AND PARTICIPATION IN SOCIETY

Egypt Human Development Report 2010{ 106 }
the concerns of youth: an inforMaL exPLoration
2
At the lowest level is indifference to public affairs; at
the second level, there is engagement in the mecha-
nisms and processes of participation; and at the peak
is seeking leadership and governance. The three lev-
els feed into each other and are not disconnected.
Nevertheless, this classification helps to assess the
overall level of participation in society and among a
given segment or group, for the purposes of analysis
and study.
For the purposes of this chapter, discussions and
interviews were conducted with over 400 young
university students. These encounters were closer
to conversations and were informal in nature, the
purpose being to put young people at their ease in
order to identify their true concerns. Eventually, this
allowed the interviewer to locate their attitudes to
political and public affairs within their range of inter-
ests.
Because of the emphasis placed on lack of formal-
ity, the size and specifications of the sample were not
determined by the methods of standard academic
practice. These did not take religious affiliation into
account, nor did they divide among rural and urban,
educated and uneducated, the poor and rich. In short,
exchanges were not conducted in accordance with
field research procedures, and cannot be cited for
generalization or comparative purposes.
Nevertheless, the interviews are a rich and direct
source to spontaneous and personal responses since
the methodology guaranteed the element of trust and
openness without embarrassment. Respondents were
required to give only one response to the following
two questions: ‘What is the most important thing to
young people?’, and ‘what do young people need most
today?’ The questions were asked of different groups
of young people who, in turn, were asked to address
the same questions to their friends and acquaintances
but without prior preparation or special arrange-
ments for the interview. The groups extended from
freshman to graduation class university students or
to those recently graduated.
In response to the first question on priorities of
importance, the main responses from young men
were ‘sexual curiosity,’ ‘cell phones’ and ‘football’
(72%) Young women said “personal safety”, “gradu-
ation” and “marriage”(89%) To the second question
on needs, the answers showed that young men were
looking for role models or ‘good examples’ (62%)
while girls wanted ‘insurance and protection’ (73%).
At this stage, no mention was made on the role of
politics in their lives.
Most young people do not care about politics. Our
education - at all stages -does not leave us any
chance to pay attention to anything else. After
graduation, we are preoccupied with job seeking
and then with starting a family.
Young male respondent
A Preoccupation with Sex
In answer to their main preoccupation, it is no sur-
prise that the answer is ‘sex’ including its psychologi-
cal aspect and related physical needs. Precedence is
given to sex over almost everything else. There were
numerous expressions of this concern, given that the
social taboo over sexual matters pushes young people
to explore the world of sexual relations by themselves
and by trial and error at a time when they face rapid
psychological and physical changes in the absence of
information or guidance.
Most young men respond to this drive by seeking to
participate in online ‘chat’ sites in general, and Face-
book in particular, to form friendships, especially
with girls. Among themselves, young men brag of
the number of girls they know through this virtual
medium. Sex- related topics dominate their talk as
they review the hottest movies, and exchange infor-
mation and jokes with sexual connotations. They also
argue whether a certain behavior is haram or halal
(religiously permissible or not).
Frowning, shouting, obscene talk and vulgar
words are believed by some young men to be
‘manly’ and command the respect of others. Oth-
ers join gangs, taking strength in their numbers.
Young female student

Egypt Human Development Report 2010 { 107 }
Personal Appearance as Indicative of Status
Appearance and gadgetry are important reflections of
personal status. The veil in its many manifestations
is one example. Type of mobile telephone, that is, cell
phone brand or model is seen as an indicator of the
status and personality of the young holder. Numerous
young people evaluate a person on the basis of his/
her car model and his/her computer brand so that a
young person may accept to be penniless, but insist
on having a recent model. A sophisticated brand gives
the impression that the holder is well off. This in turn
boosts confidence among peers.
An Interest in Sports, Recreation and Travel
An important preoccupation for young men is with
soccer, news about football clubs and players’ move-
ment from one club to another, and analysis of games.
Not only does interest revolve round watching soccer
matches, but it also focuses on sports issues such as
sports club elections, players’ fees and cost, as well
as miscellaneous items on newspaper sports pages in
general.
For young women, and often for men too, there is an
interest in latest news about artists, singers, movies,
songs, and in downloading the latest of such features
on computers or mobile phones. Talk about a new
film, for example, may continue for several hours. The
person who had seen it would narrate it to others with
all the details about what a star actor or singer was
wearing and his/her hairstyle — which soon becomes
a fashion statement.
Other interviewees had more practical interests, dis-
tributed as follows: ‘completion’ of study (11%), get-
ting work or a visa to travel (10%), and political par-
ticipation (7%).
For Girls, Safety Comes First
It is remarkable that girls attach such great impor-
tance to safety considerations. By safety, they appear
to mean worry about their own safety and about
safety-related matters. These include harassment and
assault in the street, violation of their private space
in shopping areas, and even kidnapping. Many com-
ments referred either to incidents that had happened
to people they knew, had read about or that they
themselves faced or could potentially face.
People are merciless. They don’t leave you alone
whether you’re wearing a veil or covered from
head to toe, even if you are out with your mother
or family. Today the most important thing for a
girl is to protect herself from the moment she sets
foot outside her home till she’s back.
A female respondent
Graduation as Highly Desirabe
Some young students say “Play all the year round, and
capture whatever you can of the syllabus in the last
month.” This attitude is less common among girls.
Young women generally felt that education armed
them with a weapon in life, namely in the certificates
or degrees they obtained. Holding a degree could
allow the choice of a better partner in life and also
allow them to become financially independent. A fre-
quent remark was that a girl without education had
Figure 8.1: Youth Concerns (Males)
Source: Ali el Sawy, Background Paper to the EHDR 2010
Curio
usity
CelL
Pho
nes
Foot
ball
Stud
y
Work
/Mig
ratio
n
Parti
cipat
ion
42
1712
11 107
Figure 8.2: Youth Concerns (Females)
Pers
onal
Saf
ety
Educ
atio
n
Mar
riage
Trai
ning
pro
gram
s
66
13 104
Source: Ali el Sawy, Background Paper to the EHDR 2010
7
Parti
cipat
ion/
Volu
ntee
ring
50
40
30
20
10
0
Sexu
al80706050403020100

Egypt Human Development Report 2010{ 108 }
Box 8.1: What Dreams Are Made Of
A study by the Cabinet Information and Decision Support Center (2009) entitled ‘What Do Egyptians Dream Of?’ shows how
young people (under 35 years) responded to questions on their needs as follows:
nothing but her looks to count on. Most girls were
therefore very concerned with doing well academi-
cally and passing their exams without problems.
Getting Married
Matrimony was often cited as a concern, with secu-
rity and stability seen to be the most important objec-
tives in marriage. A concern about marriage is not
groundless, given the pressures that drive young
people to aspire to this socially sanctioned condition
where sex is permissible. However, it poses a prob-
lem for both young men and women students, given
their transitional economic, social and psychological
circumstances. These place a limit on the necessary
and appropriate setting for marriage, economic inde-
pendence, starting a family and achieving a degree
of ‘adult’ social status. One comment is by a girl who
said “perhaps a way out is through marriage to an
important or established person as a substitute for
other means of getting one’s rights in society.”
Passion and love are among the strongest ele-
ments that dominate our lives. But the concept of
love varies from one young man to another. There
Figure 8.3: Dreams of Youth (Under age 35)
Figure 8.5 What Do You Wish for Yourself and Your Family?
Source: Cabinet Information and Decision Support Center (2009)
OtherWars End
Egypt Be StrongI Work
Become Rich
Figure 8.4: On Whom Do You Depend to Make Dreams Come True?
MyselfMy Family
Connections and AcquaintanceThe StateUp to God
Other
United and Close to EachotherLead Happy Stable LifeHigher Living StandardBigger Role in Society
Prestige and PowerOther
36
9
14
23
18
37
18.6
0.6
1.5
70.8
3.2
48.5
76.2
33.6
6.9
9.1
3
O 10 20 30 40 50 60 70 80
0 10 20 30 40 50 60 70 80
0 10 20 30 40
Egypt Human Development Report 2010 { 109 }
On the other hand, political parties also attempt to
polarize. Reference to parties basically means to the
official National Democratic Party (NDP). This uses
a strategy similar to that of the Muslim Brotherhood
in delivering services and organizing outings, offer-
ing grants for the study of languages, computers and
the ICDL license, as well as sponsoring sports events.
However, NDP services are provided within the
context of propagating the party, its leadership and
achievements, and it discourages critical thinking,
unlike the Muslim Brotherhood, which encourages
political criticism.
The moderate category represents a minority of
young people who avoid seclusion or polarization and
participate effectively in society, often turning to civil
society activities and the Internet.
The reason for non-participating is the absence of
a role for the family or the school in political up-
bringing. The role of the family is reduced to mak-
ing a living and of the school to giving a certifi-
cate. The value of concern with collective welfare,
public affairs and sense of responsibility ranks
last among the concerns of the family, and - natu-
rally enough - of the youth too, while priority is
given to economic values.
Cabinet Information and Decision Support Center (2009)
The general implication is that young peoples’ preoc-
cupations are more closely associated to qualms than
to political aspirations. By a large majority, they see
political activities as useless and incapable of mak-
ing a difference to their more immediate problems
or addressing their real concerns.3 A question in a
recent survey conducted by the Cabinet Information
and Decision Support Center reveals young people’s
aspirations as shown in figure 8.6
Political comments had a clear significance. One of
the young women said: “I would not mind partici-
pating and voting in the elections if there was a truly
free choice and no electoral bribery. But how can I
guarantee my safety (at the polling booths…) and my
return home in dignity after engaging in that hassle?”
A young man said,” My family is always telling me to
are young men who look for a touch of the hand
or a kiss while others see it as attracting the larg-
est number of girls possible. There are also young
men who see love as a pastime. A common factor
is the desire to be in love.
Comment by a young man
Politics: Isolation or Polarization
In politics, and according to responses, young people
may be divided into several categories. The largest
categories are either pushed to exclusion or attracted
by polarization, while the (fewer) moderates fall
between these two responses.
Some religious fundamentalists polarize young peo-
ple by raising the slogan: “We are all equal and we all
face the same problems arising from the practices of
the present regime.” Muslim Brotherhood members
attract youth by the services they offer, particularly
to expatriate students, such as providing books and
other curricula-related material and by organizing
religious functions and exhibitions on religious occa-
sions. They also make a point of expressing public
moral support to youth, such as congratulating them
on certain occasions and attracting them under the
slogan “Through God I love you”. This gives youth a
feeling of psychological security.
Figure 8.6: What is the Post You Dream of Occupying?
Source: Cabinet Information and Decision Support Center (2009)
Pres
iden
t of R
epub
lic
Inte
rnat
iona
l Pos
t
Min
ister
Unde
rsec
reta
ry
Mem
ber o
f Par
liam
ent
Loca
l Cou
ncil
Min
ister
Unive
rsity
Pre
siden
t
Foot
ball
Play
er
May
or
None
Othe
r
80
70
60
50
40
30
20
10
0
Egypt Human Development Report 2010{ 110 }
engage in anything but politics. Keep away from poli-
tics to live in peace... “ A third young person said “The
school taught us that the right policy is to fear Allah,
abide by religion and keep away from the political par-
ties’ hypocrisy and the government’s lies”. A fourth
said, “One may approach a political party only if there
is an opportunity to work, and that’s it.” Another girl
said “At home there are lectures, at university more
lectures, and in politics, again more lectures. Words,
words, words! It’s mind-numbing and futile.” Other
comments are similar to those expressed in youth
blogs and the Internet in general (see elsewhere in
this Chapter).
Why Non-Participation?
The family must be like a mesh, not a hierarchi-
cal structure. The dominant language in the fam-
ily should be the language of dialogue, not loud
voices. There is need for stepping up media cam-
paigns designed to alert families to cultivate hon-
est dialogue and reject the culture of hostility to
their children’s values.
Comment by a young man.
The significant lack of participation in public affairs
— evidenced in interviewee responses — may be
attributed to several factors:4
• Cultural and social factors include family values
that do not cultivate a desire to unity. Families
Box 8.2: Y-PEER (Youth Peer Education Network)
Y-PEER Egypt was established in 2005 with the support of the United Nations Population Fund (UNFPA). Y-PEER is led
by young people and is a live illustration of youth-adult partnership where initiatives are taken by young people and
supported by adults. The network is established in over 45 countries worldwide.
The philosophy of Y-PEER Egypt is built on providing NGO’s with their own cadre of trainers. Y-PEER builds the capacity of
its member NGO’s through trainings of trainers who then conduct trainings of peer educators locally and through theatre
based peer education trainings on a myriad of topics. By creating a network, constituting of NGO’s, Governmental and
Academic Institutions, it also provides a platform for sharing experience between its members and links the members with
potential partners. The network is coordinated by a group of young people who undergo extensive training on Y-PEER
methodology at Regional and Global levels. They are responsible for planning, implementing and monitoring the activities
of the network. UNFPA provides ongoing technical and financial support to the network and the planned activities.
Y-PEER also provides its members with a comprehensive toolkit including training manuals and programmatic toolkits in peer
education. Examples include theater based peer education training; Youth Friendly Services; Youth Adult Partnership and
combating HIV among most at risk populations. One of the unique tools is the Standards in Peer Education Programming.
Y-PEER has always been keen on maintaining the quality of its tools and trainings and has established partnerships with
venerable universities and institutes. Through these partnerships, standards of peer education programming have been
developed to be a guide to institutes working in peer education in different aspects of the program and to set a quality
standard. YPEER and UNFPA Egypt are working to initiate a process of institutionalizing these standards in national peer
education program in Egypt.
The network in Egypt currently consists of 40 NGOs in 16 governorates.
Examples of the work done by Y-PEER Egypt include:
• More than 100 trainers of peer educators trained, 3000 peer educators and 80 theater based peer education trainees.
• Working with celebrities and journalists, including Ms. Howayda Abou Heif and Mr. Khaled Abol Naga, to promote health
messages.
• Establishment of a Youth Advisory Panel with UNFPA and UNICEF.
• Working with Universities to establish an educational campaign on SRH and population issues.
• Working with the NCCM in its adolescent’s health project.
• Translation of MTV’s stayingalive.org-website in Arabic to provide information on SRH and HIV/AIDS to young people.
For more information, visit www.ypeeregypt.com Source: UNFPA, Egypt

Egypt Human Development Report 2010 { 111 }
in Egypt generally advocate individual rather
than collective dealings with the community.
The absence of a culture of voluntary coopera-
tion among youth and the growing phenomenon
of “me first” is therefore not surprising.
• Young people have a preconceived ideal model of
society but when actually involved in real life, the
day-to-day horse-trading, bickering and corrup-
tion indicates that real politics are far from ideal.
This leads to alienation and withdrawal, and in
extreme cases, to a desire to escape or to migrate.
• Youth do not feel that the state extends any
services to them. They perceive that the qual-
ity of their education is poor, their employment
opportunities modest to non-existent, and the
standard of living they can look forward to unex-
ceptional. This reduces attachment to the state
and its regime.
• Youth fear that the only means for social mobil-
ity is bribery, favoritism and bypassing the law.
This breeds a feeling of hopelessness and some
seek refuge in drugs, sex, crime or violence.
• Economic factors manifest themselves in the
state’s weakened employment role and increas-
ing reliance on the private sector. Respondents
said that economic problems are not resolved
through seminars and awareness campaigns but
through a significant role for government on the
ground, that is, by providing a decent education,
the conditions necessary for suitable employ-
ment and salaries, by combating nepotism and
ensuring equal opportunities.
• Political factors, especially the lack of channels
of communication between young people and
the ruling and intellectual elite are a factor that
creates paralysis and an inability to act through
(missing) legitimate channels.
Society seems schizophrenic. Despite citizens’ re-
jection and distrust of the government, they do
not move except through the government. Within
this relationship there is a missing link, namely
the lack of trust, because the government gives
us ‘hypnotics’ to have its way and do whatever it
wants.
Comment by a young man
Why Join Religious Groups?
Anecdotal evidence indicates that the involvement
of young people in religious movements (Muslim
or Christian), both formal and informal, is the most
significant phenomenon in contemporary political
affairs. These movements differ, have varying back-
grounds and references, adopt diverse approaches
with assorted objectives, but nevertheless manage
to attract young people for many reasons, chief
among which are:
Disillusionment with Formal Politics
Young people in the sample appear to see no connec-
tion between the content of the leadership’s political
discourse and what they expect of the leadership. In
this respect, there is a failure of the Egyptian politi-
cal discourse to convince young people of its tenets,
thereby leading to a loss of credibility. There is also
the perceived weakness of the state’s developmental
role, the limitations of state and party institutions, in
particular with regard their role in political education
and real representation. On the other hand, religious
movements are seen to be striving to represent the
people and defend their interests. It is this sensitivity
to the grassroots that gives precedence to a religious
subset allegiance over a national allegiance.
Why do officials extensively use ‘my’ and ‘mine’
consciously or unconsciously and repeatedly say
‘my ministry/department/party did so and so’?
Why don’t they say ‘Egypt achieved this or that’?
Comment by a young woman
Loss of credibility of the electoral process and distrust
of political maneuvering together raise the attraction
of religion. Most young people who were questioned
believe there is no corruption within religious organi-
zations and that they uphold the principles of justice
and equality in contrast to state institutions. Further,
the state, in marginalizing and containing the role of
traditional religious institutions such as Al Azhar, and
in dissolving the private religious endowments (wakf)
mechanism, has cast doubt among many young peo-
ple on the impartiality of Al-Azhar scholars and their
way of thinking.

Egypt Human Development Report 2010{ 112 }
Economic Reasons
Many respondents said that growing unemployment
has led to insecurity over the future. It leaves them
with time on their hands, little to do and much frus-
tration. The vacuum is often filled either by leisure
activities or religious duties. Unemployment also
affects allegiance to the state which is perceived as a
root cause of the lack of work. This, potentially, could
intensify the rebellion against what is perceived as a
dysfunctional system of governance, expressed either
through violence against that reality or by withdrawal
into a ‘purer’ spiritual sphere.
Social and Cultural Factors
The problem with the official mosque sermons is
that they are seasonal and that preachers wait for
any religious occasion to review its history... But
people need to do what is right in their daily lives...
As for the unofficial mosques in which ordinary
people preach, they are often not convincing or ef-
fective. The sermons and discourse of the Muslim
Brotherhood have an effective approach.
Comment by a young man
A World Values Survey appears to indicate that reli-
gious values rank first for Egyptian youth (see Chapter
5). Added to this dimension is the fact that religious
movements address phenomena such as inequality,
class distinction, rampant corruption and the regres-
sion of education as key parameters of social dysfunc-
tion. Rapid urbanization, the growth of unstable fam-
ily ties as an outcome of social change and the widen-
ing gap between youths’ values and vision and what
they see around them are given as reasons for the
attraction to faith-bound behavior as a form of psy-
chological reassurance.
As we grew up, we found everybody around us
talking about the failure of the state and of society.
At home, insults of the government, and at school,
denial of what the state promises. We are sur-
rounded by the non-stop cursing of officials and
everything — but there is no hope except in getting
out of this frustrating environment.
Comment by young woman
Box 8.3: Joining Political Parties Requires an Enabling Environment
What conditions are necessary to energize young people and provide the incentive for more participation in political life?
Some basic questions expressed by youth indicate their areas of concern:
• Isthereencouragementorwelcomeastheyenterthepartyheadquartersorwilltheyfacethesamesuspicioustreatment
they get from bureaucratic government bodies?
• Istherecredibleinformationonthepartyanditsprinciples,ideas,membership,therightsanddutiesofamemberandthe
party Plan of Action, or just the usual posters of the party leader and his activities?
•Doanypartyofficialsdiscussayouth’saspirationsandorientationsinpublicworkandpartyactivitybeforeaskinghim/her
to fill in the membership application?
• Is there a real institutional network of contacts between the party and its branches and bodies? Is there a directory
identifying party units, committees, leaders and the addresses of its offices and branches?
•Canayoungpersonturntothe Internet togetenough informationabout thepartiesandtheiractivities,statutesand
objectives in order to make an informed decision? This is provided by some of the banned groups or figures.
• Istheredialogueorexchangebetweenparty leadersandyouth,oraretheaudienceandspeakersatmeetingssenior
members only?
•Canyouthheararealdiscussionabouttheneedsandcapacitiesofthedistrictorvillagewheretheyliveandwherethe
party is located? Or are they simply exposed to debates, rumors and insinuations about the corridors of power?
•Shouldyoungnewcomersbesubjecttoawell-establishedhierarchywhere‘HisExcellency’orotherobsoletegrandtitles
accord a senior member VIP treatment?
• Isanentrenchedpeckingorderwithinapartyanenablingenvironmentforthedynamicparticipationofayounggraduate
seeking respect and voice within a democratic association? Source: Ali el Sawy, Background Paper to the EHDR 2010
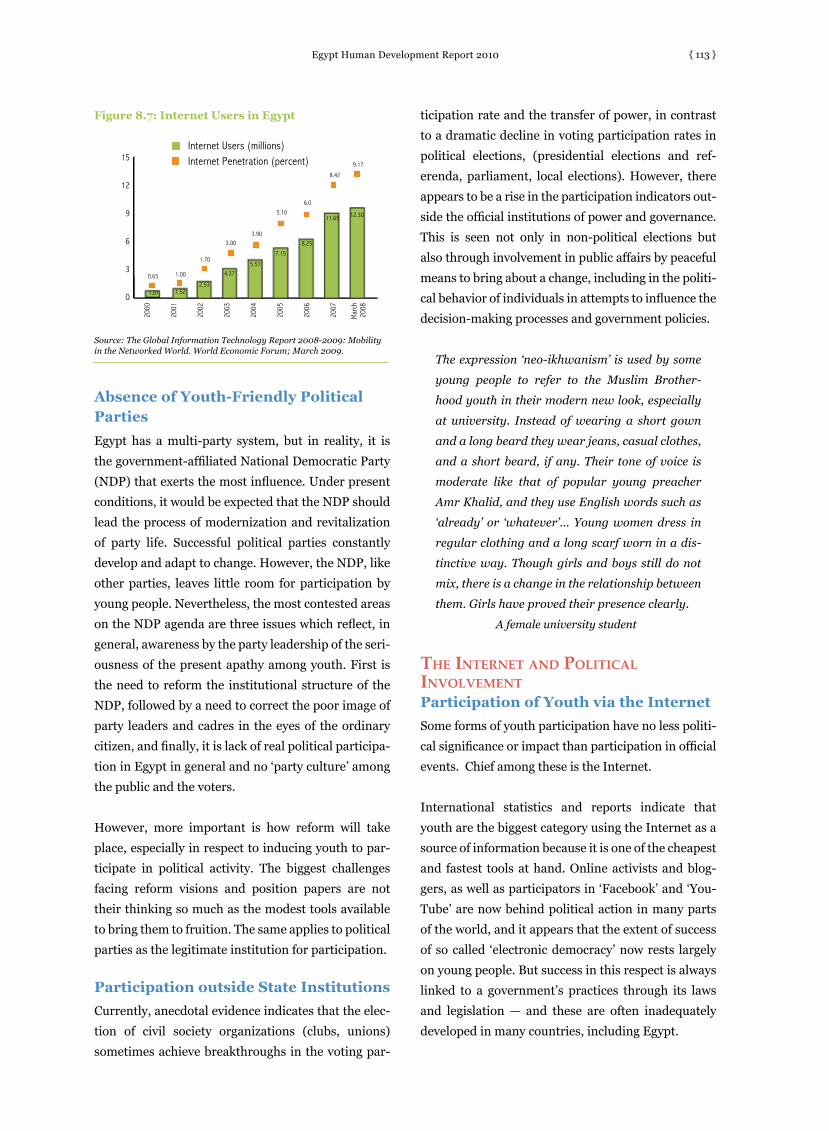
Egypt Human Development Report 2010 { 113 }
Figure 8.7: Internet Users in Egypt
2000
2001
2002
2003
2004
2005
2006
2007
Internet Users (millions)Internet Penetration (percent)
0.65
1.70
1.00
3.003.90
5.10
8.42
9.1715
12
9
6
3
0 1.01 1.522.53
4.375.57
7.15
8.25
11.65 12.30
Source: The Global Information Technology Report 2008-2009: Mobility in the Networked World. World Economic Forum; March 2009.
Absence of Youth-Friendly Political Parties
Egypt has a multi-party system, but in reality, it is
the government-affiliated National Democratic Party
(NDP) that exerts the most influence. Under present
conditions, it would be expected that the NDP should
lead the process of modernization and revitalization
of party life. Successful political parties constantly
develop and adapt to change. However, the NDP, like
other parties, leaves little room for participation by
young people. Nevertheless, the most contested areas
on the NDP agenda are three issues which reflect, in
general, awareness by the party leadership of the seri-
ousness of the present apathy among youth. First is
the need to reform the institutional structure of the
NDP, followed by a need to correct the poor image of
party leaders and cadres in the eyes of the ordinary
citizen, and finally, it is lack of real political participa-
tion in Egypt in general and no ‘party culture’ among
the public and the voters.
However, more important is how reform will take
place, especially in respect to inducing youth to par-
ticipate in political activity. The biggest challenges
facing reform visions and position papers are not
their thinking so much as the modest tools available
to bring them to fruition. The same applies to political
parties as the legitimate institution for participation.
Participation outside State Institutions
Currently, anecdotal evidence indicates that the elec-
tion of civil society organizations (clubs, unions)
sometimes achieve breakthroughs in the voting par-
ticipation rate and the transfer of power, in contrast
to a dramatic decline in voting participation rates in
political elections, (presidential elections and ref-
erenda, parliament, local elections). However, there
appears to be a rise in the participation indicators out-
side the official institutions of power and governance.
This is seen not only in non-political elections but
also through involvement in public affairs by peaceful
means to bring about a change, including in the politi-
cal behavior of individuals in attempts to influence the
decision-making processes and government policies.
The expression ‘neo-ikhwanism’ is used by some
young people to refer to the Muslim Brother-
hood youth in their modern new look, especially
at university. Instead of wearing a short gown
and a long beard they wear jeans, casual clothes,
and a short beard, if any. Their tone of voice is
moderate like that of popular young preacher
Amr Khalid, and they use English words such as
‘already’ or ‘whatever’… Young women dress in
regular clothing and a long scarf worn in a dis-
tinctive way. Though girls and boys still do not
mix, there is a change in the relationship between
them. Girls have proved their presence clearly.
A female university student
the internet anD PoLiticaL invoLveMentParticipation of Youth via the Internet
Some forms of youth participation have no less politi-
cal significance or impact than participation in official
events. Chief among these is the Internet.
International statistics and reports indicate that
youth are the biggest category using the Internet as a
source of information because it is one of the cheapest
and fastest tools at hand. Online activists and blog-
gers, as well as participators in ‘Facebook’ and ‘You-
Tube’ are now behind political action in many parts
of the world, and it appears that the extent of success
of so called ‘electronic democracy’ now rests largely
on young people. But success in this respect is always
linked to a government’s practices through its laws
and legislation — and these are often inadequately
developed in many countries, including Egypt.
6.0
Mar
ch
2008

Egypt Human Development Report 2010{ 114 }
Nevertheless, the Internet – under a variety of
regimes, including Egypt - has significantly contrib-
uted to expanding the scope of freedom of personal
and individual expression and to breaking official
organizations’ monopoly of channels of communica-
tion.
The Internet in Egypt
The number of Internet users in Egypt is estimated at
about 13 million to date, according to available 2009
statistics. That is, almost two out of eight citizens go
to the Internet for information, business and personal
usage. This is an increase of almost threefold com-
pared to 2005 — and for many, ‘logging in’ has become
a daily practice. It means, for example, that the num-
ber of daily Internet users in Egypt is much higher than
that of newspaper readers.
These figures are expected to rise to cover more than
50% of Egypt’s population in the coming ten years.
This suggests that the State must face the technical
and legal implications of this new revolution in citi-
zen self-expression — and do so in a timely manner.5
youth internet PoLiticaL ParticiPation: the risks in anaLysis
There are a number of factors that can color any anal-
ysis of youthful Internet political participation. For
this reason, one must tread with caution when ana-
lyzing the results of any given study. First, the virtual
information world can give a picture of reality that
may be different from the facts on the ground or chal-
lenge time-honored precepts. Second, constant tech-
nological and legal developments may allow official
censorship of certain types of content. Third, Internet
users must be educated, by necessity, and as such are
by no means fully representative of the population at
large, let alone of all young people.
Thus, while the Internet may be an important tool for
measuring political, social and economic trends, the
picture it presents of young people’s views or activities
is partial and limited, and must be considered as such.
Given these provisos, the importance of the Internet
lies in the fact that it is the only online means available
for measuring youth’s political participation. In Egypt,
it has become a tool with huge weight in calling for any
activity, as the events on 6th April 2006 demonstrate.
At that time calls for specific civic action were made
almost exclusively online, with tremendous impact,
drawing maximum attention, a response by civil soci-
ety never faced before by the State.
A number of questions need to be addressed in this
respect. For example, are there differences between
the conventional and the virtual worlds in youths’
political allegiances? What political behavior on the
Internet is revealed by youth regarding faith issues or
affiliations? Does the State help activate youth politi-
cal participation via the Internet? Should the State
have a greater or lesser presence in directing youths’
points of national or political reference as expressed
on the Internet? Answers to these questions are likely
to indicate to what extent Egypt’s youth are enabled
to operate in a virtual environment. A background
study for this report attempts to answer these ques-
tions.6 But first, we look at other studies in place.
Does Government Promote Internet Use?
A number of studies have been conducted by State
agencies in Egypt, notably by the Information and
Decision Support Center (IDSC) attached to the Cabi-
net, the Ministry of Information and Technology, the
Central Agency for Public Mobilization and Statistics
(CAPMAS) and the National Center for Social and
Criminology Research (NCSCR). In a report pub-
lished by the IDSC, a section titled ‘Internet Mania’
deals with the relation between youth and Internet.
Results were as follows:7
• More than 80% of Internet Café clients in Egypt
were young people. This is attributed to unem-
ployment and leisure, on the one hand, and the
familiarity of this age group with information
technology, on the other;
• Sixty percent of the youth surveyed spent their
time chatting, 20% browsing pornography sites,
12% conducting business or scientific work and
8% visiting political sites;
• The report also examines new Internet jargon
that is largely drawn from technology and uses
abbreviations extensively, as well as Latin let-
ters. The report suggests that this may affect
standard Arabic or even English language usage.

Egypt Human Development Report 2010 { 115 }
A statistical survey on ICT among youth conducted by
CAPMAS at the end of 2008 provides a more general
picture:8
• The number of computer users among youth was
over six million, of which 57% were male and
43% female;
• 2.4 million young persons used the Internet, of
which 61% were male and 39% female;
• Internet use for academic purposes by youth was
at about one fourth of total youth users (1. 398
million), of which 55.4% were male compared to
44.6% female;
• The number of Internet users having a university
degree was at a low 356,000, of whom 61% were
male and 39% were female;
• Young Internet users who were employed num-
bered 443,000, of whom 75.25 % were male;
• Young people who have mobile phones was close
to the number using computers, at 5. 656 mil-
lion, of whom 69% were male and 31% female.
Additionally, the Ministry of Communication and
Information has issued a guidebook for parents,
entitled ‘Parents’ Working Group for Safe Cyber Use’.
The two-page pamphlet explains methods for ‘safe’
use of the Internet by sons and daughters, and it is an
expression of the apprehension of State bodies on the
power of the Internet.9 It illustrates the caution with
which the Government of Egypt approaches issues of
freedom of speech.
A Study Tailored for this Report
A 2009 informal Internet study was conducted for
this report. It relied on the measurement of a number
of indicators relating to youth’s political participa-
tion in the virtual world by analyzing the content of
195 sites representing youth segments to-date on the
Worldwide Web. These consist of blogs, group elec-
tronic magazines and personal pages on Facebook.10
Categories included independents, persons with
party affiliations and different political groups. The
study also depended on a number of indicators that
have been verified by different content analysis meth-
ods and also on information approaches. These mea-
sure the frequency of specific words in texts on web-
sites and the popularity of a site through number of
links, as well as a determination of how sites impact
on youth political participation and an assessment of
how far youth interact with the sites. Several signifi-
cant details emerge from the study, from which the
following selection is based:
Degree of Allegiance
An indicator for the title of each site was used to pro-
vide knowledge on the degree of commitment to alle-
giance to Egypt (the homeland) in its various forms,
or to a political party or group. The surveyed sample
of 195 sites showed middling interest in allegiance to
the homeland, while party or political allegiance came
out on top. In other words, each of 35 sites scored
three points for national allegiance, as commitment
was evidenced in their names. One hundred and five
scored two points because the title expressed the
viewpoint of a specific party or political or religious
group. The remaining 52 sites got one point and rep-
resent about one quarter of the selected sample.
Responsibility and Transparency
A. Sites’ Responsibility and Distribution per
Editors’ Gender
Distribution of males and females was explored, both
ideologically as well as for administrative responsibil-
ity, for postings on the site. It was observed that gen-
der distribution in the sample demonstrated a bias
against females, with the exception of about 5% of
the sites. There may be cultural or other reasons why
young Egyptian women are not inclined to take on a
leadership role or to use the Internet as a means of
expressing their opinion, compared to males. None-
theless, there were some examples of young Egyptian
women whose writings often put them in confron-
tation with different political trends and State poli-
cies. In addition, the nature of some cyber magazines
expresses women’s views, notably Blog Bent Mas-
reyah (The Blog of an Egyptian Girl), Wahda Mas-
reyah (An Egyptian Woman) and Masreyah Giddan
(A Very Egyptian Woman).
B. Degree of Transparency
Most young people were extremely reserved when
it came to putting their names and personal details
explicitly on the Internet. This is perhaps out of fear
of legal accountability, or because what is said may

Egypt Human Development Report 2010{ 116 }
run counter to State policies and practices. There
have been cases in Egypt when young bloggers have
faced prosecution and imprisonment for their views.
Another possibility is that the sites are backed by
particular interest groups that wish to remain anony-
mous. Sites that mention the person or group respon-
sible for them or provide any full details did not
exceed 2.6% of the sample, while 60% of the sample
sites gave names but did not designate the task of
each person mentioned. However, 37% of the sites
were entirely without names or provided initials only.
Besides, there is no verification that names men-
tioned are those of the persons in actual fact respon-
sible for the sites.
C. Degree of Risk
The date of construction of a site reflects the interest
in professing views. There were no regulations gov-
erning the treatment of the Internet up until 2003
when Egypt recognized the principles stated in the
Information and Internet Community in Geneva. This
appears to have coincided with a growing interest in
constructing personal websites and creating elec-
tronic magazines as well as with the mushrooming of
blogs, first launched largely by international and Arab
companies, prompted by economic and technological
considerations. Nevertheless, they helped raise inter-
est in self expression and writing, and from there to
political participation via the Internet.
D. Language of Political Discourse
on Websites
No doubt, the use of the Egyptian Arabic colloquial
dialect on websites is a characteristic of Internet use
in Egypt. Many electronic magazines, personal web-
sites, forums and Facebook pages have become the
arena for breaking colloquial/classical language bar-
riers. Young people are shedding off national, party
or even the independent press language criteria,
namely the language and grammar of the educated
elite — constraints which are believed to hinder or
complicate the communication of political concepts
and contents for the rest of the community.
The analysis indicates that there is a growing choice
of colloquial Arabic (specifically the Cairene dialect)
Figure 8.8: Allegiance on the Site
Source: Zain Abdel Hady, 2009
Table 8.1: Allegiance on the Site
Source: Ibid
%
17.90%
55.40%
26.70%
No. of Sites
35
108
52
Item
Title expressing allegiance to nation as a wholeTitle expressing allegiance to specific party or political trend Unspecific title
Category
A
B
C
Title Expresses Specific Party or Political Trend 55.4
Title Unspecific 26.7 Title Expresses Allegiance to Homeland as a Whole 18.9
Table 8.2: Gender Distribution in Websites
%
5.10%57.40%37.40%
Score
321
No. of sites
1011273
Item
Fair gender distributionNo fair gender distributionSite does not include names
Category
ABC
Source: Ibid
Figure 8.9: Degree of Responsibility for Site
Source: Ibid
Figure 8.10: Degree of Transparency
Source: Ibid
57.4 % No Fair Gender Distrubution
5.1 % Fair Gender DistrIbution
37.4 % Does Not Include Names
Names Given, Tasks Unspecified 60%Editor’s Names and
Tasks Given 2.6%
Names Not Given or in Initials 37.4

Egypt Human Development Report 2010 { 117 }
for discourse, and it confirms that there have been
gains in wider readership by youth. About 79% of the
sample sites range between exclusive use of colloquial
Arabic or use a mix of both the colloquial and the clas-
sical language. This development deserves further
study in view of its potential implications, including
the ease and acceptability of the State’s formal lan-
guage in political discourse.
E. Interaction with Browsing
Community
It is possible to both give and receive views and com-
ments on websites. This is a democratic feature that
may not be found in other means of written com-
munication. Measuring this feature can indicate
the growth of democratic practices and interaction
among youth. More than 95% of the sample made
available their comments and emails to invite contin-
ued feedback and discussion on all the many subjects
and issues raised. However, it is possible that some
sites censor comments that challenge their political
persuasion, or that run counter to prevailing morals.
This aspect requires further assessment and could be
examined in a separate study.
F. Figures Hosted by Websites
Electronic magazines and other sites often host
guests representing different political currents such
as members of the Muslim Brotherhood, Christians,
independents, radicals or even conservative rightists.
The more varied the guests hosted by a site, the more
indicative this is of a liberal approach. The fact that
many youth sites do not host leading writers or intel-
lectuals may be interpreted as a lack of belief in these
figures’ ideologies or possibly a difficulty in persuad-
ing these more conventional figures to participate in
Table 8.3: Degree of Transparency in Mentioning Names of Site Editors
%
2.60%60%37.40%
No. of sites
511773
Scores
321
Item
Editors’ names mentioned, and their tasks specifiedEditors’ names mentioned, but their tasks not specifiedNames not mentioned in full or initials.
Category
ABC
Source: Zain Abdel Hady, 2009
Source: Ibid
Table 8.4: Date of Appearance in Youth Internet Sites
%
12.30%71.80%15.90%
No. of sites
2414031
Item
From the appearance of Internet in Egypt till 2005From 2005 to 2008After 2008
Category
ABC
Table 8.5: Language Used on Youth Websites
%
53.80%26.10%20%
No. of sites
1055139
Item
Use classical and colloquialUse colloquial onlyUse classical only
Category
ABC
Source: Ibid
Table 8.6: Interaction on Youth Sites
%
85.10%11.30%3.60%
No. of Sites
166227
Item
Comments, names/emails are availableOnly comments availableNo comments available
Category
ABC
Source: Ibid
Source: Ibid
Figure 8.11: Degree of Risk from Introduction to Internet
From 2005- 2008 71.8%
After 2008 15.9%
From Introductionup to 2005 12.3%
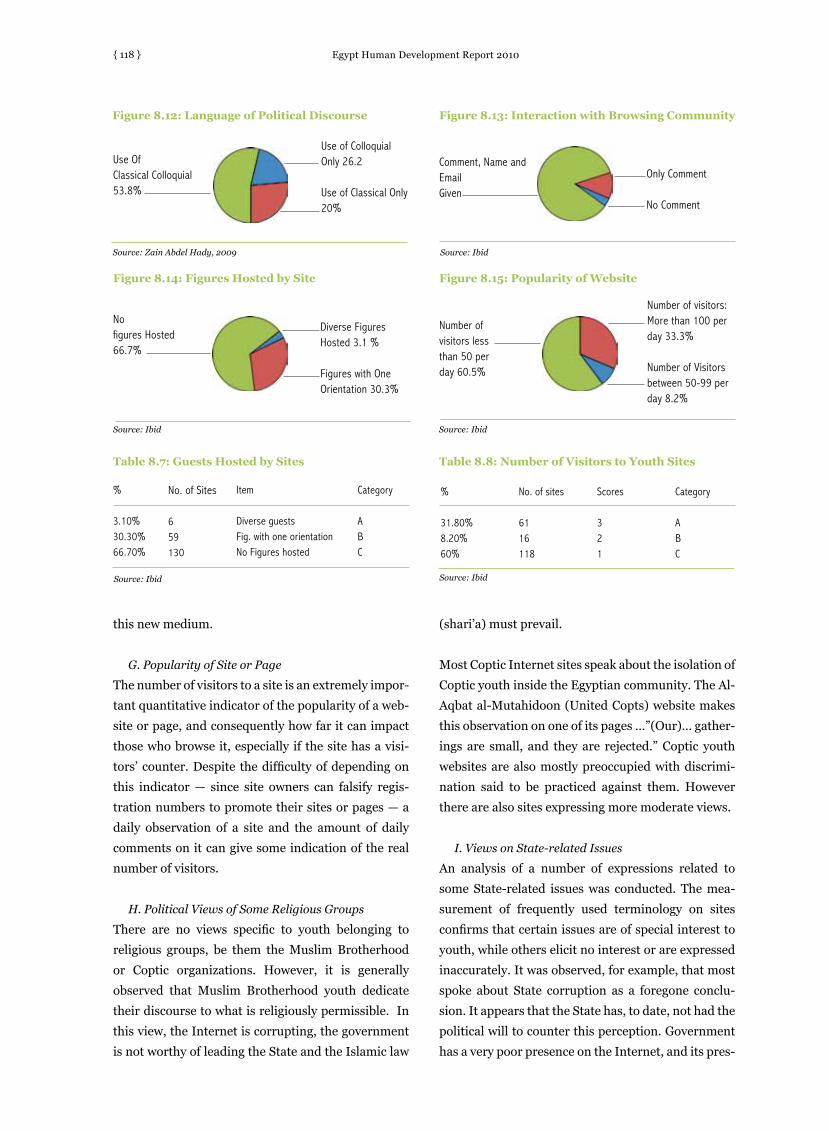
Egypt Human Development Report 2010{ 118 }
this new medium.
G. Popularity of Site or Page
The number of visitors to a site is an extremely impor-
tant quantitative indicator of the popularity of a web-
site or page, and consequently how far it can impact
those who browse it, especially if the site has a visi-
tors’ counter. Despite the difficulty of depending on
this indicator — since site owners can falsify regis-
tration numbers to promote their sites or pages — a
daily observation of a site and the amount of daily
comments on it can give some indication of the real
number of visitors.
H. Political Views of Some Religious Groups
There are no views specific to youth belonging to
religious groups, be them the Muslim Brotherhood
or Coptic organizations. However, it is generally
observed that Muslim Brotherhood youth dedicate
their discourse to what is religiously permissible. In
this view, the Internet is corrupting, the government
is not worthy of leading the State and the Islamic law
(shari’a) must prevail.
Most Coptic Internet sites speak about the isolation of
Coptic youth inside the Egyptian community. The Al-
Aqbat al-Mutahidoon (United Copts) website makes
this observation on one of its pages …”(Our)… gather-
ings are small, and they are rejected.” Coptic youth
websites are also mostly preoccupied with discrimi-
nation said to be practiced against them. However
there are also sites expressing more moderate views.
I. Views on State-related Issues
An analysis of a number of expressions related to
some State-related issues was conducted. The mea-
surement of frequently used terminology on sites
confirms that certain issues are of special interest to
youth, while others elicit no interest or are expressed
inaccurately. It was observed, for example, that most
spoke about State corruption as a foregone conclu-
sion. It appears that the State has, to date, not had the
political will to counter this perception. Government
has a very poor presence on the Internet, and its pres-
Category
ABC
Table 8.7: Guests Hosted by Sites
%
3.10%30.30%66.70%
No. of Sites
659130
Item
Diverse guestsFig. with one orientationNo Figures hosted
Source: Ibid
Figure 8.12: Language of Political Discourse
Source: Zain Abdel Hady, 2009
Use Of Classical Colloquial 53.8%
Use of Colloquial Only 26.2
Use of Classical Only 20%
Figure 8.13: Interaction with Browsing Community
Source: Ibid
Comment, Name and Email Given
Only Comment
No Comment
Figure 8.14: Figures Hosted by Site
No figures Hosted 66.7%
Diverse Figures Hosted 3.1 %
Figures with One Orientation 30.3%
Figure 8.15: Popularity of Website
Source: IbidSource: Ibid
Number of visitors less than 50 per day 60.5%
Number of visitors: More than 100 per day 33.3%
Number of Visitors between 50-99 per day 8.2%
Table 8.8: Number of Visitors to Youth Sites
%
31.80%8.20%60%
No. of sites
6116118
Scores
321
Category
ABC
Source: Ibid

Egypt Human Development Report 2010 { 119 }
ence is not interactive. This is an issue that requires
review and serious improvement if the State wishes to
engage in democratic dialogue.
Addressing Specific Political Issues Decentralization
A large number of youth align themselves with decen-
tralization. Sixteen sites voted for State decentraliza-
tion, one objected, four sites appeared neutral, while
four others ridiculed the question of decentraliza-
tion, maintaining that conditions would not change
whether the State is centralized or decentralized.
These views appear to represent individual opinions
and it was not possible to confirm that they were rep-
resentative of any one group. The issue needs further
study.
Overall, views on decentralization could be grouped
under the following topics:
• There was much discussion of decentraliza-
tion from a pan-Arab national perspective. This
stressed the need for the independence of the
ruling authority without any patronage from
abroad, as in the case of the Hamas government
in Gaza. Some ideas revolved around reviving
Arab and Islamic nationalism, that is, an Arab–
Iranian alliance;
• Many of the electronic forums, groups and online
magazines presented discussions that were full
of frustration, sarcasm and resentment against
the government, centralized authority and the
one party rule in Egypt. They also saw no hope
of change;
• Numerous views dealt with economic monopoly
in Egypt and the support given to businessmen
of one political party. In some cases, names of
businessmen were cited as monopolizing specific
industries. Their concentration in one specific
party suggested the idea of party corruption and
the centralization of such corruption;
• Several sites called on the State to remove its
grip on the media and stressed the importance of
media independence;
• Some sites also requested autonomy for local
administrative bodies and the decentralization
of decision making at that level;
• There were some suggestions to move some min-
istries to Alexandria in view of its historical and
cultural heritage.
Authorities and People’s Councils
• Many youth sites expressed the belief that the
executive authority was primarily and exclusively
responsible for ruling in Egypt. They questioned
the role of the legislative and judicial authorities
since their independence and effectiveness are
seen to have receded significantly. The need for
reform is clearly expressed on many sites.
• It appears that the relationship between the
people’s councils and youth is almost totally sev-
ered. There are no specific mechanisms to insure
youth participation in them. Participation is gen-
erally tied to belonging to the National Demo-
cratic Party.
Political Parties
• There was a high percentage of opponents to the
ruling National Democratic Party (NDP) and
its orientation among youth. The number of its
supporters was less than the number of its oppo-
nents. Opponents based their opinions on per-
ceptions of corruption and centralization and on
disagreements with NDP’s political vision;
• Those that were neutral on the NDP nevertheless
had questions about its national strategy. Ques-
tions were raised, for example, on what could
be expected from the next National Democratic
Party following elections. There were also ques-
tions on the policies that the NDP should adopt
with the emergence of youth with a socialist and
secular orientation, and towards supporters of
strikes;
• The political discourse among youth also
included calls for the creation of new parties,
which implies a lack of trust in existing parties
and their programs.
Religious Groups
• Religious parties are banned from politics in
Egypt. The idea of legalizing religious parties is
therefore raised with the aim of enabling certain
groups — even if they include followers of dif-
ferent religions — to strengthen their presence.
This idea is expressed in some youth contribu-
Egypt Human Development Report 2010{ 120 }
tions. However, in other messages, a warning is
given. One young person said “you do not know
what it means for Egypt to become an Islamic
State and the Islamic law to be applied. Most
Egyptians do not know that. Believe me if mat-
ters were to remain as they are at present, Egypt
will be heading to an Islamic State, to more dark-
ness and more backwardness than it is witness-
ing at present.”
• Youth consciousness of religious diversity in
Egypt is also observed. One of the youth mes-
sages says “when we apply Islamic law in a coun-
try where there are 13 million Christians, will
God be satisfied with this? I do not believe that
the application of the law of a certain religion
on individuals who do not follow it is any form
of justice. Imagine it happening the other way
around, and matters will be clearer… “
Elections
• There was general agreement that political par-
ticipation by youth in elections was weak, use-
less, or non-existent as a result of electoral rig-
ging and lack of candidates’ care for citizen’s and
young people’s real needs;
• Many sites also stressed the need for a multi-
party system that allows equal opportunities and
prevents the domination by one party;
• Some youth also expressed the desire for an
easing of the security grip on the elections, the
presence of international observers, and a more
organized elections process.
ProPosaLs for reforMA large number of Internet proposals — presented
by youth as solutions to the problems facing them or
the State — were reviewed. The focus was on practical
proposals, since many suggestions have been neces-
sarily excluded as unrealistic, individualistic, lack-
ing an underlying vision, lacking a social resolution,
or because they were irrelevant to issues related to
Egypt.
Proposals on the Internet included the following:
• Guaranteeing different forms of democracy in
education and restoring class and university
elections;
• Promoting a multi-party system, and paying
attention to women, equality and religious toler-
ance in all State-owned media;
• Raising the presence of the State and its orga-
nizations on the Internet and intensifying it,
as well as dealing with the Internet as a strong
media influence, not simply as a means of free-
dom of expression;
• Presenting State excerpts of success stories on
YouTube rather than taking a defensive role
against charges leveled against it;
• Highlighting the State’s moral and material
achievements and investments regularly on
State-owned websites, establishing realistic
achievement indicators, focusing on how far the
government is fighting institutional corruption
and publishing related news;
• Strengthening the role of legislative and judi-
cial institutions and diminishing the executive
authority as responsible for laws and regula-
tions;
• According State attention to the proper imple-
mentation of the law and applying it to offi-
cials even before applying it to citizens, as well
as transparently publishing related news in the
press;
• Disseminating religious, political and sex educa-
tion on State-owned websites and assessing the
impact on youth segments;
• Boosting the State role in training youth on the
effective use of the Internet and its economic
benefits to open up job opportunities;
• Providing job opportunities for youth in the
media and giving them an opportunity to pres-
ent programs that meet their dreams and aspira-
tions and boost democratic practices;
• Featuring examples of youth excellence as role
models, as well giving them responsible posi-
tions in institutions to lend credibility to the
State’s concern with youth;
• Arranging visits by youth and their leadership to
civilization sites, historic institutions and model
communities to build up national allegiance and
loyalty;
• Promoting Egypt and its civilizations on every
Internet site owned, supervised or affiliated to
non-governmental organizations and the private

Egypt Human Development Report 2010 { 121 }
sector, to support national duty and obligation;
• Turning villages into small towns and paying
attention to their utilities and service institutions
to prevent migration to cities or abroad.
The current interest of a large segment of youth on
the Internet makes it imperative for the State to set
up an authority or body in charge of supporting and
promoting Egyptian Internet sites. The aim of this
body would be to provide support and training for
youth sites, surveys of sites, analysis of their political
discourse, and respond to these and boost State pres-
ence on the Internet. Its aims would include identify-
ing standards and components for setting up websites
by ministries and other institutions. It is suggested
that this would be a body independent from estab-
lished State-related organizations so as to ensure its
autonomy.
The Internet also renders it imperative to recon-
struct the information, communication and politi-
cal content of State websites in a manner that cor-
rects erroneous concepts, how the State manages
its actions and its political position on major issues.
State institution websites should cover achievements
for the benefit of citizens by setting up a list of indi-
cators on developments and tasks accomplished.
This would introduce transparency and counter
malicious propaganda.
State support could be given to the creation of NGOs
concerned with promoting better use of the Internet
and to preventing its social abuse; organized training
courses by the State, NGOs or private organizations
on designing and constructing websites in Arabic
and English could raise standards and raise Egypt’s
image, on the one hand, and give the feeling that all
actors back these activities, on the other hand.
Youth role models play an important part in chan-
neling the energies and goals of youth communi-
ties and demonstrate that success is possible. Use of
this mechanism should be frequent. Trends can be
identified through independent studies of opinion
and analysis of political activity among groups, par-
ticularly those Coptic youth who feel marginalized,
to address the issues of interest to them and inform
suitable solutions. The phenomenon of isolation in
the face of active Islamic groups — as expressed in
websites —requires serious and urgent study.
Awareness-raising for tolerance and open-minded-
ness to and by men of religion through modern dis-
course and Internet sites appears a prerequisite to
national unity.
what Does the future offer? There are three schools of thought in this respect. The
first endeavors to raise awareness and believes that
the premises should precede results. In other words,
young people should start to participate first. This
school is seen as conventional and conservative. The
second school seeks to re-construct young people’s
thoughts, and direct them towards ideological/reli-
gious orientations or towards political pragmatism.
This can imply rational pragmatic political content,
such as a focus on the needs of the era of globaliza-
tion. It can also mean — through religious channels
— to provide the opportunity to do things with wide
community impact (advocacy, reform, justice, setting
an example).
The third school can be considered reformist. For
example, it calls for reforming school education,
improving the quality of school performance,
enhancing teacher skills and overseeing teachers. It
Box 8.4: President Mubarak
on Youth
What Is Needed For Young People?
•Makewayforthem.
•Removetheobstaclesfromtheirpath.
•Liftguardianshipontheirthoughtandmovement.
• Do not underestimate their abilities and potential
capacity to play pioneering and effective roles.
What Is Needed From Young People?
•Donotwait for an invitation fromanyone toenter
the arena of national action.
•Takeinitiativetoshoulderresponsibility.
•Prepareforsuccess.
Source: Speech to university youth, Alexandria, August 27, 2002.
Egypt Human Development Report 2010{ 122 }
appears that this tendency is gaining more ground
among the wealthy and influential elite. However,
the conservative and patriarchal school of thought
remains predominant, followed by that of a ‘revolu-
tionary’ ideology.
However, fundamental questions in the formulation
of youth policies remain. These raise the following
questions:
• 1. Is the State primarily responsible for main-
streaming and achieving harmony between the
programs of governmental and private insti-
tutions, both public and private, in the area of
youth empowerment? It is here that a number of
practical questions arise:
• 2. Are we talking about State services or poli-
cies for young people? It is important to have a
national policy for youth developed in a consul-
tative manner and with clear, announced and
stable objectives and methods of assessment.
Whether accomplished via a coordinating Minis-
try for Youth, a National Council or State institu-
tions in partnership with civil society, this need
is apparent.
• 3. There is no doubt that a central issue in youth
policy is employment. It involves expansion in
job creation, rehabilitation activities and train-
ing for work, equal employment opportunities,
attention to developing the innovativeness and
linkages of small business owners, environ-
ment preservation, and reaching the excluded by
empowering them with voice.
• 4. Is the generation factor marginal, with no sub-
stantial impact on the behavior of individuals, so
much so that there is no need to talk about the
specificity of young people? It appears better to
trusting young people’s choice, leaving them to
determine priorities, convincing them that expe-
rience comes with practice and patience. It is
necessary to give youth a chance to experiment
and learn from mistakes.
• 5. The key question is, “What do young people
want for themselves?” This requires commu-
nication with young people by direct means to
identify their priorities, assess their abilities
and develop their skills. There is a deficiency
of the information necessary to determine their
realities, identify target segments and plan for
the development of capabilities. Here, research
departments of appropriate ministries could
step in to set up databases. A youth research unit
at the National Center for Social and Criminolog-
ical Research is also needed. Field research and
sounding out young people’s views through pub-
lic opinion surveys, such as those carried out by
the Cabinet-related IDSC, are also of immense
value.
Endnotes1 Ali el Sawy and Zain Abdel Hady, Background Papers to the EHDR 20102 Ali el Sawy, Background Study for the EHDR 20103 Ali el Sawy, Background Paper to the EHDR 20104 ibid5 Zain Abdel Hady (2010)6 Zain Abdel Hady, Background Paper to the EHDR 20107 IDSC, 2006, Internet Mania8 CAPMAS, 20089 MCIT, 200810 Zain Abdel Hady, 2009
referencesAssaad, Ragui and Barsoum, Ghada, 2009, “Rising Expectations and Diminishing Opportunities for Egypt’s Youth”. In Navteej
Dhillon and Tarek Yousef (eds) Generation in Waiting: Unfulfilled Promise of Young People in the Middle East, Brookings Institute, Washington DC.
Barsoum, Ghada, Ali Rashed and Dalia Hassanein, 2009, At Work When There is No Respect: Job Quality Issues for Young Women in Egypt, The Population Council, MENA Gender and Work Working Papers, Cairo
Population Council and IDSC, 2010, Survey of Young People in Egypt: Preliminary Report, Cairo.Ricardo Hausemann, Laura Tyson and Saadia Zahidi, 2008, The Global Gender Gap Report, World Economic Forum, Geneva.

{ 123 }
Chapter Nine
This chapter investigates the status and role of Egyptian youth in achieving good governance in Egypt with a specific focus on their role in ensuring a better performing government apparatus
that is more efficient, effective and responsive. There are many reasons why it is essential to enhance youth participation in achieving good gov-ernance, perhaps the three most important of which are the following:• When youth participate early on in policy making and in the decision making
process, this prepares the next generation of leaders to take on responsibility
for running state affairs;
• Participation allows the opportunity for this large fraction of society to express
its particular needs and expectations and make sure that these are well repre-
sented in the body politic;
• By partnering with youth rather than excluding them, society capitalizes on
their resources and capabilities, adding a new perspective to how problems are
perceived, thereby contributing to better quality outcomes in the long run.
THE ROLE OF YOUTH IN ACHIEVING GOOD GOVERNANCE
Egypt Human Development Report 2010{ 124 }
Good governance entails interlinkages and partner-
ships between the three main actors in any soci-
ety: civil society organizations, the private sector,
and government. In each of these there is a role for
youth to play and this can take a number of forms.
As young people become involved in their communi-
ties, through volunteerism for example, they benefit
the surrounding social environment as well as profit
both personally and professionally, building trust and
confidence in their own capacities to impact on devel-
opment. The private sector offers opportunities to
hone skills, demonstrate innovative approaches, and
achieve financial independence.
But it is government that must play a leading role
in providing an enabling environment for the social
gains of youth inclusion to take place. In this respect,
the perspective of ‘responsive governance’ is useful as
a tool for reform of government performance and in
envisaging an active role for youth in reform.1
From this perspective, there are three main vehicles
for reform:
• First, internal improvement of government
rules, procedures and operations, where youth
can play a more significant role through, for
example, implementing a competency based
human resource management system, imple-
menting pay for performance and investing
more heavily in the training of the available
human capabilities;
• Second, by enhancing the role of the private sec-
tor and enabling the private sector to compete
with government in providing goods and ser-
vices to citizens, and by forcing the government
to meet competition, the quality of goods and
services will be improved. Here youth can play
a role through working in the private sector and
managing private sector organizations that act as
competitors to government and drivers of qual-
ity improvement;
• Third, civil society organizations and the media
can push for the government sector reform by
holding it accountable, and here, youth can defi-
nitely help in monitoring government perfor-
mance through traditional and non-traditional
media channels.
status quo in reLation to the governMent sectorYouth Currently Represented in the Egyptian Civil Service
Youth, as defined by the EHDR 2010 as 18-29 years of
age, is practically non-existent in any top level mana-
gerial position in the Egyptian government, whether
First Undersecretary, Undersecretary or General
Manager, nor in central or local Government, the ser-
vice authorities or public economic authorities (See
Table 9.1). Distribution of government employees in
the higher level jobs does not include anybody below
the age of thirty-five. The average age of the Egyptian
government employee falls within the age bracket
41-45 years.2
Other data from the Central Agency for Organization
and Administration show that the total percentage of
youth in the Egyptian bureaucracy (age group 20-35)
amounts to approximately 18.15%, among which
51.3% are males and 48.7% are females (See Table
9.2).
Although approximately 18.5% of government
employees are in the age group 20-35, the majority
tend to be in the uppermost echelon of this age cat-
egory, with nearly 64.3% of them falling in the age
bracket 31-35 years of age (See Figure 9.1).
It is noteworthy that for the majority of the youth
aged 20-35 who are employed in the government
bureaucracy, 77% are working in local administration
agencies, 8% in the economic agencies and 7% in the
administrative agency (See Table 9.3 and Figure 9.2).
The total number of youth in the government sec-
tor amounted to 567,468 individuals on the first of
January, 2009. The education sector holds the largest
share of youth in the government sector, amounting
to 303,325 employees and representing 53.5% of the
total number of youth employed. The health sector
represents the second largest share, reaching 30.1%
of total youth employed (See Table 9.4)
The number of youth in the economic authorities
totaled 48,512 on the first of January, 2009. The
Transport, Communications and Civil Aviation sector

Egypt Human Development Report 2010 { 125 }
Table 9.1: Number of Employees in the Egyptian Government Higher Echelons and Age Distribution per Grade in 01/01/08
Government Grade/ Age Group
Central GovernmentFirst Under SecretaryUnder SecretaryGeneral ManagerSubtotal (1)Local GovernmentFirst Under SecretaryUnder SecretaryGeneral ManagerSubtotal (2)Service AuthoritiesFirst Under SecretaryUnder SecretaryGeneral ManagerSubtotal (3)Public Economic AuthoritiesFirst Under SecretaryUnder SecretaryGeneral ManagerSubtotal (4)Grand Total (nos. for all grades=Subtotals
(1)+(2)+(3)+(4))Grand Total (no.by grade)First Under SecretaryUnder SecretaryGeneral ManagerPercent concentrationto total of each grade:First Under SecretaryUnder SecretaryGeneral Manager
Percent to total age groups
35-40
23
4651
033
11
2830
22
1418
102
56
91
1.361.631.73
1.22
40-45
529
332366
12627
63
112121
512
135152666
1745
605
4.632.72
11.50
7.95
45-50
32173
12031408
3137140
857
360425
1395
438546
2519
53328
1038
14.4419.8119.72
30.07
50-55
132688
17132533
9353362
42147569758
57278545880
4533
23111223180
62.9467.7560.42
54.11
55-60
2587
121233
12627
107
84101
6261749
410
41121248
11.177.314.71
4.89
60-65
0134
000
0123
00007
025
00.120.09
0.08
10185987
777
74
2637
334
10141
203296
5.451.931.82
1.68
206999
34774682
21552566
74220
11811475
86416
115316558378
36716565263
Source: CAOA 2008 as quoted in Doha Abdel Hamid and Laila El Baradei (2009), “How to Reform the Pay System of Egyptian Government Employees”, ECES, Working Paper Series # 155, forthcoming, p.16.
UnknownBirthDate
Total Grade
represents the largest share of youth in the economic
authorities, making up 64.2% of the total number of
young employees. Meanwhile, the health and reli-
gious services and labor force sector represents the
second largest share and amounts to 18.2% of the
total employed youth (See Table 9.5 and Figure 9.3)
Meanwhile, if we consider the distribution of youth
employed in the government sector according to
financial grades, including both those employed
according to public and special cadres, the data
points out that the majority of youth in the govern-
ment sector belong to the third grade, amounting to
361,415 employees and making up 59.7% of the total
number of youth employed. The General Manager
grade represents the smallest share of youth in the
government sector and has a total of 2,187 employ-
ees, making up 0.2% of total youth employed (See
Table 9.6 and Figure 9.4).
If we focus on the distribution of youth employed
according to the special cadres, we find that the
majority of youth are working as Teaching Assis-
tants (81.9%) with a total number of 8,369. Next fol-
lows the position of Assistant Teacher in the second
rank, making up 10.3% of the total number of youth
employed according to special cadres (See Table 9.7
and Figure 9.5).

Egypt Human Development Report 2010{ 126 }
Figures for new government appointments over the
past years (Table 9.8) show that the greatest number
of appointments took place in 2002, reaching a total
of 120,839 new employees (Figure 9.6). These are all
tenured appointments.
Meanwhile, data derived from the Ministry of Finance
records showing various government expenditures on
youth related activities indicate an increasing spending
trend over the past decade. Table 9.9 shows funds allo-
cated to youth according to the budget expenditures
side. Figure 9.7 compares between year 2005/2006
and year 2009/2010 and shows the relative increase
in expenditures during that five year period. Figure
9.8 shows that the funds allocated to the wages and
labor compensation for youth represented the biggest
share at 56% of the total youth related expenditures.
Overall, youth in the government sector do not get
enough opportunity in leading or implementing
reform since they are concentrated mostly in the
lower echelons of the hierarchy. Despite govern-
ment expenditures on youth related activities and
initiatives, much remains to be done and the supply
does not yet meet the demand by youth for better
services.
Does The Civil Service Provide Opportunities for Youth Promotion and Training?
• The training budget is very low. The average
training budget available per capita in the Egyp-
tian government service amounts to approxi-
mately LE 10 per year.3
• Performance appraisal is ineffective: The
problem in many government organizations is
that almost all get a grade of excellent in their
appraisal. Superiors’ justification for the overrat-
ing of their subordinates’ performance and for
the exaggerated grades is that Egyptian govern-
ment employees are underpaid and they should
not be deprived of any chance for an increase in
pay.
• Promotion is based on seniority: According to
law 47/1978, promotion in the civil service is
mostly based on seniority (Law 47/1978, Chap-
ter 4) with the exception of leadership positions
where law 5/1991 applies and allows room for
the promotion of the most qualified and the
higher performer. However, in reality, even
when deciding on the promotion of leaders in
the government sector, the seniority criterion
dominates.
Table 9.2: Distribution of Youth by Age Category and Gender in the Egyptian Bureaucracy (Data From a sample of 557 units out of a total of 671 units)
Male
14,03383,475
218,496316,004
2,159,55014.60%
Female
25,38996,953
177,634299,976
1,234,74024.29%
Total
39,422180,428396,130615,9803,394,2918.15%
Percentage
1.16%5.32%
11.67%18.15%
100%
Age/Gender
From 20 - 25 years From 26- 30 years From 31-35 yearsTotal Youth Group from 20-35 yearsTotal No. of Employees% Youth to Total
Source: CAOA,Central Information Department, 2009
Figure: 9.1: Distribution of Youth by Age Category and Gender in the Egyptian Bureaucracy
20-25 yrs 26-3 yrs 31-35 yrs
Male Female
Source: CAOA, Central Information Department, 2009
250,000
200,000
150,000
50,000
0
No. o
f Em
ploy
ees Governmental Sector
Administrative AgencyLocal AdministrationService AgenciesEconomic AgenciesTotal
Number of Youth
44,305472,65550,50848,512615,980
Table 9.3: Distribution of Youth Age Bracket 20-35 in the Egyptian Governmental Sector on January 1st 2009
Egypt Human Development Report 2010 { 127 }
The challenges in a transition to a merit-based system
in employment face a number of obstacles, including
cultural barriers visible in the widespread practices
of nepotism and patronage. Lack of a strong govern-
ment has also resulted in the over-ruling of merit-
based appointments to appease interest groups dur-
ing election times and for political gain.
Available Niches in the Government Sector for Competent Youth
A few niches are available in the government sector
for competent youth, mainly represented in the tech-
nical offices of ministries, government agencies and
authorities where highly qualified youth are employed
Sector
Agriculture and Irrigation SectorIndustry, Petroleum/Mineral ResourcesElectricity and Energy SectorTransport, Communication/Civil Aviation Supply and Internal Trade SectorFinancial and Economic SectorHousing, Construction/New CommunitiesHealth/Religious Services/ Labor ForceCulture and Media SectorTourism SectorInsurance and Social Affairs SectorTotal
Numbers
310970
1,04231,140
7177
1,0198,8241,576
23,481
48,512
%
0.62.02.1
64.20.10.22.1
18.23.20.07.2
100
Table 9.5: Number of Youth in the Government Sector as stated in the budgets of The Economic Authorities
Until Age 35 year (1st January 2009)
Source: CAOA, Central Information Department, 2009
on a contractual basis and paid high salaries through
international donors’ support. These technical offices,
which represent a parallel system to the traditional
government bureaucracy, are usually responsible for
providing policy advice and supporting the ministers
or top level officials. Over the past two decades, tech-
nical offices have been established in the majority of
Egyptian ministries. Since they are funded by donor
agencies, they implement a different compensation
scheme and do not abide by the civil employees’ rules
Sector
General Public Services SectorDefense, Security and Justice Sectors Public Order and Public Safety Affairs SectorEconomic Affairs SectorEnvironmental Protection SectorHousing and Community Utilities SectorHealth SectorYouth, Culture and Religious Affairs SectorEducation SectorSocial Protection SectorTotal
Numbers
30,75583
4,58224,344
1,0744,220
170,75722,035
303,3256,293
567,468
%
5.40.00.84.30.20.7
30.13.9
53.51.1
100
Table 9.4: Number of Youth in the Government Sector According to the Budgets of the Administrative Agency, Local Administration and Service Agencies
Source: CAOA, Central Information Department, 2009
Grade
General ManagerG-1G-2G-3G-4G-5G-6Total
Numbers
9462,187
23,795361,415154,044
35,65227,725
605,764
%
0.20.43.9
59.725.4
5.94.6100
Table 9.6: Number of Youth in the Government Sector Distributed according to the Financial Grades (Including Public Cadres and Special Regulation)
Until Age 35 year on the 1st of January 2009
Grade
ConsultantAssistant Research ProfessorAssistant ProfessorResearcher (Teacher)First Researcher /Research ProfessorAssistant ResearcherResearcher /Teacher ResearcherTeacherAssistant TeacherAssistant ResearcherArtist Third/ Beginner under TestAssist. Researcher /Teaching Assist.Teaching AssistantTotal
Numbers
527
192
2421739
1,053201
63197
8,36910,216
%
0.00.00.10.20.02.40.20.4
10.32.00.61.9
81.9100
Table 9.7: Number of Youth in the Government Sector Distributed according to the Financial Grades (Special Regulation)
Youth up to Age 35 on the 1st of January 2009
Source: CAOA, Central Information Department, 2009
Until Age 35 year (1st January 2009)
Source: CAOA, Central Information Department, 2009
Number of Youth
44,305472,65550,50848,512615,980

Egypt Human Development Report 2010{ 128 }
Source: CAOA, Central Information Department, 2009.
Source: CAOA, Central Information Department, 2009
and regulations. Technical offices represent niches in
the Egyptian bureaucracy for a small number of youth,
especially with high language and computer skills.
An accurate number of youth employed in Egyptian
technical offices has not been determined, though
the average is to have about 20-30 employees in each
ministry through this parallel system. A more trans-
parent system in recruitment and hiring for technical
offices needs to be developed and implemented.
Positive youth initiatives for better quaLity governance
A number of selected positive initiatives by Egyptian
youth seek more participation and better quality gov-
ernance in their country despite the present obstacles
and barriers. The selection of different initiatives is to
demonstrate that youth can act as change agents and
change is possible through different means and ways.
The Sixth of April Movement
The Sixth of April youth define themselves on their
website as: “a group of Egyptian youth brought
together for the love of Egypt and the desire for
reform….the vast majority … do not belong to any
political trend … we are convinced of our ability and
our right to change.”4
Until Age 35 on the 1st of January 2009
GradeYouth appointed During 2004Youth appointed During 2002Appointed Outstanding Graduates 2001/02Appointed Outstanding Graduates 2000Appointed Outstanding Graduates1998/99Total
Table 9.8: Number of Appointed Youth In the Government Sector during the Last Ten Years
Source: CAOA, Central Information Department, 2009.
No.s
112,019120,839
6,7504,9764,465
249,049
Figure 9.2: Distribution of Youth Age Bracket 20-35 among the Different Types of Government Agencies in 2009
Administrative Agencies 7%Service Agencies 8%Economic Agencies 8%
Local Administration 77%
Figure 9.4: Distribution According to the Financial Grades (Public and Special Regulation)
G-1 0%General Manager 0.2%G-6 5%G-5 6% G-4 25%
The Sixth of April Movement was started by a young
woman and a colleague in 2008. This initiated a page
on Facebook and called for a unified protest against
the Egyptian government. Word spread through
mobile messaging and blogs. In the town of El-
Mehalla, textile workers demonstrated on the 6th of
April, 2008 and were joined by other citizens from
different walks and affiliations, leading to a signifi-
cant confrontation with the police force. Three people
were shot dead and several were injured.
On the same date in 2009, word spread around
through Facebook and various blogs to organize a
national ‘Anger Day’. Some sources estimate that
Figure 9.3: Distribution of Youth in the Government Sectors According to the Economic Authorities
Transport and Communications and Civil Aviation 64%
The Health Services, Religious/Labor Force 18%Tourism 0%Culture and Information 4%Insurance and Social Affairs 7%
Other 29%
G-3 60%
Source: CAOA, Central Information Department, 2009
Industry, Petroleum and Mineral 2%The Housing Construction 2%Energy and Electricity 2%Agriculture and Irrigation 1%Financial and Economic Sector O%Supply and Internal Trade Sector 0%

Egypt Human Development Report 2010 { 129 }
75,000 young Egyptians signed up to the Facebook
site calling for the Day of Anger. Several lawful
demands were made, including a minimum wage of
LE 1200 a month, improved pension schemes, better
health and education services, ending police repres-
sion, ending rigged elections and stopping the expor-
tation of cheap natural gas to Israel. However, prior to
the event taking place, two young girls who were dis-
tributing leaflets calling for the event were arrested,
and on the scheduled day there was intensive police
deployment on all streets of Cairo. As a result, the
2009 6th of April activities were relatively quiet with
only dispersed citizen gatherings in a number of syn-
dicates and public universities.
An important lesson can be drawn from the 6th of
April Youth Movement. Although the movement was
repressed by government, it caught the attention of
the local and international media and drew atten-
tion to how ICT can be used, especially by youth, in
organizing political opposition movements and expos-
ing autocratic governments’ ‘unsatisfactory’ perfor-
mance.
The Shayfenkom Movement
The literal translation of shayfenkom in Arabic is “we
can see you”. This is another example of a grassroots
political movement in Egypt that intensively uses the
internet for coordination and organization of its activ-
ities. The main purpose of the movement is to moni-
tor election processes by sending representatives to
election committees and booths, and observing and
documenting what is happening. The movement was
active during the presidential elections of 2005. The
general call by the Shayfenkom during this election
was to become proactive and to report election viola-
tions by citizens to their website directly or through
cell phones.5
The Wael Abbas Blog
This blog, created by a young man named Wael
Abbas,6 is a place where Abbas critically records his
thoughts and comments on diverse incidents tak-
ing place in Egypt, particularly those having to do
with torture in police stations. He also posts photos
and video clips in the belief that a picture speaks a
thousand words. Abbas claims that his blog attracts
approximately 30,000 visits each day. As a result of
his video clips of police brutality in a rare incidence,
Figure 9.6: Number of Appointed Youth in the Government Sector during the Last 10 Years
The Appointed Outstanding Graduates 1998/1999The Appointed Outstanding Graduates 2000
The Appointed Outstanding Graduates 2001/2002Youth Appointed during 2002Youth Appointed during 2004
4465
4976
6750
120839
112019
Figure 9.5: Number of Youths in the Government Sector, Distributed according to Financial Grades (Special Regulation)
Teaching AssistantAssustant Researcher/Teaching Assistant
Artist Third/Beginner Under TestResearch AssistantAssistant Teacher
TeacherResearcher/Teacher Researcher
Assistant ResearcherFirest Researcher/Reseracher Professional
Researcher(Teacher)Assistant Professor
Assistant Research ProfessorConsultant
8369
197
63
201
1053
39
17
42
2
19
7
2
5
Egypt Human Development Report 2010{ 130 }
two police officers received a prison sentence.
Initially, the government of Egypt did not pay much
attention to the activities of youth blogs in Egypt on
the assumption that they had little impact. Beginning
in 2006, when the international media started report-
ing on Egyptian blogs, the situation changed. Since
then, most blogs (including that by Wael Abbas)
became the target of repetitive hacking by govern-
ment authorities.
Blogging activities in Egypt have been described by
the UK’s The Economist magazine as having evolved
dramatically over the past couple of years from being
“a narcissistic parlor sport to a shaper of the political
agenda.” Bloggers continue posting news supported
by photos and video clips concerning a number of
issues sensitive to the Egyptian government, such as
torture in police stations, harassment of women on
the streets, and elections rigging.7
Alashank Ya Balady Association
Alshanek Ya Balady translates to ‘for you my country’.
Wages & Labor CompensationsPurchasing Goods & ServicesInterestsSubsides, GrantsOther Expenditures Purchasing None Financial Assets (Investments)Total
2005/2006
4370515588099
17070426743
217314688006873400
2006/2007
4933811982857
15935546344197959
23126008989506
2007/2008
5504132989860
19427698400
435203045500
10300839
2008/2009
59651061064591
17714708500
733392898900
10728150
2009/2010
69795981167046
11666721007
584343430400
12368151
Table 9.9: Funds Allocated by the Government for Youth Related Activities Based on Ministry of Finance Estimations
Figures in Thousand LE
Source: Ministry of Finance, 2009
Figure 9.7: Funds Allocated for Youth 2005/06 and 2009/10
Wages and Labor Compensations
Purchasing /GoodsInterests
Subsides and Grants
Other Expenditures
Purchasing NoneFinancial Assets
Figure 9.8: Funds Allocated for Youth 2009/2010
Wages & Labor Compensations
The association is a success story on how Egyptian
youth can effectively organize through NGOs and can
have a positive impact on the development of their
country. The mission is to empower marginalized
youth and women economically and socially. What is
significant is that it is an Egyptian NGO run totally
by enthusiastic youth who believe in the need to be
proactive and make a difference in their community’s
development.
Initially established as a student club at the American
University in Cairo in 2002, with only two programs
– one for illiteracy eradication and one for micro-
credit – the association has now expanded and scaled
up its operations. In 2003 and 2004, new branches
were opened in Ain Shams University, Cairo Univer-
sity, the German and the French universities. Activi-
ties were expanded in all universities to six other pro-
grams: English classes, human development for chil-
dren and teens, art expression for children and teens,
vocational training, health awareness, and tutoring
for teens. By 2005, the association was registered as
a legal NGO with the Ministry of Social Solidarity.
Currently, the NGO is still expanding its operations
to other universities through a creative franchise sys-
tem.
Purchasing None Financial Assets (Investments) 28%
Other Expenditures 1%Subsides, Grants 6%Purchasing Goods & Services 9%Interests 0%
Ten Thousands
2005/06200/9/10
10 20 30 40 50 60 70 80
Egypt Human Development Report 2010 { 131 }
The founder and chairperson is one of four Arab youth
winners of the King Abdullah II Award for Youth
Innovation and Achievement, selected from over
500 applicants. Other awards won include the Social
Entrepreneurship Award in Malaysia, the Social
Entrepreneurship Award in London, the Synergos
Arab World Social Innovator and the Youth Action
Net Global Fellows Award in the United States.8
recoMenDations: enhancing youth ParticiPation in quaLity governanceGovernment’s Role
Implementation of Competency Based Human
Resources Management involves identifying the
skills, abilities, attitudes and personality traits that
distinguish high performers from average performers
and use these as the basis for performing the various
human resources management functions, including
recruitment, selection, training, development and
compensation. For example, competency-based hir-
ing is hiring to the public organizations based on the
degree of fit between needed competencies for suc-
cessfully performing a job and the availability of these
competencies in employees applying. Competencies
would no longer focus on educational degrees and
certificates, but the important factor would be the
skills possessed by the employee and how they may
enable him/her to excel on the job.
This provides a good chance for exclusion of age as a
basic selection criterion and provides greater oppor-
tunity for qualified youth to apply to any government
position they may be fit for. On another note, the
shift from the educational degree as a basis for hiring
would eventually pressure educational institutions to
give more weight to developing their students’ needs
and considering labor market requirements. 9
Competency Based Human Resource Management
(CBHRM) has been borrowed from the private sec-
tor and implemented in government organizations
since the early 1990s. Examples for positive impact
of CBHRM on overall organizational performance
abound in the British civil service and in Korea, as
examples of both a developed and a developing coun-
try. In Korea, starting the 1990s, the Korean govern-
ment decided to shift from education-based selection
methods to performance and skill-based selection
methods. To operationalize such a system, selection
will not only depend on standard testing methods,
but will also include a new ‘blind interview’ system.
In such a blind interview, a panel of interviewers
composed of both government officials and academi-
cians conduct the interview without being given any
information about the interviewee; they are rather
left to assess his/her performance based on the ability
to deal with a discussion topic that requires a certain
degree of creativity in its resolving. 10
• Implementation of Pay for Performance,
whereby a ratio of compensation, aside from
basic pay, would be linked to employee’s perfor-
mance on the job and not only linked to seniority
and number of years. This will provide hope to

Egypt Human Development Report 2010{ 132 }
youth and an incentive for them to try to improve
performance.
• Intensive Training and Capacity Building:
More investments should be allocated to train-
ing of youth in government organizations. They
should be given preference when government
decides on allocation of training opportuni-
ties. Currently, in many situations when there
are valuable training opportunities, they may
be allocated to top level managers who may not
continue with their work in government except
for a few years. A more logical alternative would
be to invest in young people and build their
capacities since they are the ones who are likely
to remain for a longer period of time within the
government bureaucracy — assuming the neces-
sary precautions are taken to minimize potential
brain drain after the training investment.
• Development of Second Tier of Young Manag-
ers: One possible mechanism to achieve short
term results would be making the development
of a second tier of government leaders obligatory
in all central and local government organiza-
tions, whereby they have to identify and develop
their young leaders and report on performance
achieved.
• Utilizing E-Government to Fight Corruption.
Much can be learnt from the Indian experience
with e-government. In all the different applica-
tions of e-government, youth will have a major
role to play since the younger generations are
more capable of dealing with the new technol-
ogy:11
° E-Shame: The Central Vigilance Commis-
sion responsible for fighting corruption
started to post on its website a large amount
of information about officials who have
either been accused or prosecuted because
of committing corrupt acts. Newsweek
referred to this experiment as ‘e-shame’.
Although it had its drawbacks in that it
mentioned officials’ names even when they
were just accused of corruption and some-
times before a verdict had been made, it
led to increased public awareness about the
need to control and fight corruption.
° Vijaywada Online Information Center
(VOICE) is an example of the computeriza-
tion of service centers for municipal ser-
vices where building approvals and birth
and death certificates are issued. Through
opening kiosks in areas near citizens, and
linking those kiosks to the back offices in
the municipality through a wide area net-
work, corruption has been reduced, and
services have been provided more conve-
niently to citizens.
• Changing the psychological contract: The
younger generations have different needs and
expectations. They want a better resolution for
work/life issues, flexi-time and telecommuting
options, and they want more discretion, more
decision making powers, and a chance for pro-
gressing in their career paths based on their
competencies and performance. In order to be
able to attract competent youth to work in the
government sector, the Government of Egypt
has to take into consideration the changes in
the needs and expectations of the new genera-
tions. Recently, some of the youth expectations
and needs have being considered by the govern-
ment, with examples including the allowance of
part-time work and the recent announcement of
allowing some employees to work through tele-
commuting.12
• Hiring of Cadres: More transparency should be
introduced to the recruitment and hiring process
in technical offices. Youth who have the required
competencies may thus have a chance to apply to
the available jobs.
Youth’s Role
• Whistle Blowing: Youth should be encouraged
to report on any corruption taking place in gov-
ernment organizations on the condition that
they are given sufficient protection by the Egyp-
tian government.
• Using the Internet and ICT to Organize Actions:
Youth can cleverly use the internet and ICT to
organize their monitoring of government perfor-
mance. Some actions by active bloggers in Egypt
are examples of proactive use of the internet to
monitor government accountable.
• Upgrading Skill: Youth should work on upgrad-

Egypt Human Development Report 2010 { 133 }
ing their competencies and skills to meet the
demands of the labor market and realize that the
new trend of competency based human resource
management requires a continuous updating of
skills – Learning is a continuous process.
• Working through the Private Sector: Working
in the private sector would provide competi-
tion to services provided by government, such
as health and educational services, and it would
raise standards.
• Engaging in Developmental Activities: Youth
can adopt a more developmental objective and
engage more in volunteer work through non-
governmental organizations partnering with
government to achieve sustainable development.
Endnotes1 For further elaboration on responsive governance as a tool for reform see World Bank, 2003 2 CAPMAS, 20093 Nahas S, 20064 http://shabab6april.wordpress.com5 The Independent Website.“Fraud claims prompt demands for Egyptian election monitors”. http://license.icopyright.net/
user/viewFreeUse.act?fuid Accessed on 3 May 2009.6 misrdidgital.blogspirit.com7 Egypt Today. “Wael Abbas: One of Egypt’s most vocal bloggers is candid about his past, his present and his hopes for the
future”. http://www.egypttoday.com/printerfriendly.aspx?ArticleID=8089 Accessed on 3 May 2009.8 Alshanek Ya Balady website. General Background and History. http://www.ayb-sd.org/successful.html Accessed on 7 June
2009. 9 Hughes, 200110 Kim, 200011 Bhatnagar, 200412 Ahram newspaper, 2009
references “6 April Day of Anger – Call from activist for jobs and democratic rights”. Website of the Committee for a Workers’ International
(2009), 24 April. http://socialistworld.ne“Shabab 6 April Youth Movement, About us in English”. http://shabab6april.wordpress.com/shabab-6-april-youth-movement-about.
us-in-english Accessed on 5 May 2009. Bhatnagar, Subhash (2004). E-Government: From Vision to Implementation A Practical Guide with Case Studies. New Delhi: Sage
Publications. CAOA (2009). Data from the Central Information Department at the Egyptian Central Agency for Organization and Administration. CAPMAS, 2009Committee to Protect Bloggers (2007). http://committeetoprotectbloggers.org/2007/12/01/wael-abbass-youtube-account-restored/
Accessed on 10 June 2009.Horton, Sylvia (2000). “Competency Management in the British Civil Service”. The International Journal of Public Sector
Management, Vol. 13, No. 4, pp. 354-368. Hughes, R. Eugene (2001). “Skill or Diploma? The Potential Influence of Skill-based Pay Systems on Sources of Skills Acquisition and
Degree Programs”. Work Study, Vol. 52, Number 4, pp. 179-183. Kim, Pan S. (2000). “Human Resource Management Reform In the Korean Civil Service”. Administrative Theory & Praxis, Vol. 22,
No. 2, pp. 326-344. Law Number 47 for 1978 Concerning the State Civil Employees. Cairo: Al Amiria Press, Edition 23, 2005. Nahas, S. (2006) ‘Director of the Egyptian Central Agency for Organisation and Administration’, Public Policy Workshop, Cairo
University: Faculty of Economics and Political Science, Public Administration Research and Consultation Center, 12 December (in Arabic).
The Economist (2007). “Bloggers may be the real opposition”, Vol. 383, Issue 8524, p.54, dated 14 April. World Bank (2003), Reforming Public Institutions and Strengthening Governance: A World Bank Strategy Implementation Update,
Washington, DC: Public Sector Group, Poverty Reduction and Economic Management Network.

Egypt Human Development Report 2010{ 134 }

{ 135 }
Chapter Ten
Youth Entrepreneurship is a term which describes the involve-ment of Egypt’s youth in pursuing business opportunities in the market place, whether through self-employment or by estab-
lishing a business which employs others. Entrepreneurship in that sense is a reflection and an expression of the capacity of the youth to take risk, to look for opportunities outside of the traditional channels, and to have the optimism and audacity to venture into a promising world. In that sense, entrepreneurship is not merely a function of laws, regulations, and procedures, but more importantly, of the existence of a risk appetite, and of the confidence that it is possible to achieve success based on merit, effort and business acumen.
YOUTH AND ENTREPRENEURSHIP
Egypt Human Development Report 2010{ 136 }
The legal environment for business transactions —
and therefore for entrepreneurship — has improved
significantly in Egypt. Over the last few years, Egypt
has seen a marked improvement in the legal and pro-
cedural environment for doing business. Starting in
the second half of 2004 (with the appointment of a
new government), a concerted effort was undertaken
to improve the overall environment for doing busi-
ness on a number of fronts, especially by the newly
revamped General Authority for Investment and Free
Zones (more commonly known as GAFI). The imple-
mented reform aimed at creating a responsive and
enabling business environment that tackled major
investment impediments and streamlined proce-
dures required to facilitates the market entry process.
PrevaLence of entrePreneurshiP aMong young PeoPLe in egyPt1 Nevertheless, entrepreneurship is not very common
among young people in Egypt. According to SYPE,
only 1% of youth between the ages of 15 and 29 are
either employers or self-employed. Although the rate
of engagement in independent activity among young
women is significantly lower than among young men
(0.3% as compared to 1.9%), the difference is almost
entirely due to their different rates of participation
in employment. Among employed youth, an equal
proportion of young men and women are either
employers or self-employed (3.6%). As expected,
the proportion of entrepreneurs increases steadily
with age, within the population at large and among
the employed. The proportion of young men engaged
in entrepreneurship increases from very low levels
at ages 15-18, to over 4% when they are in their late
twenties. The maximum proportion among young
women is also reached in their late twenties, but is
still less than 1% of all young women at those ages and
about 5% of the employed.
The prevalence of independent workers in either
the population or among the employed is highest in
urban slum areas, followed by rural areas, and then
by urban non-slum areas. It is clearly easier for one
to set up one’s own activity in informal settlements
or villages than it is in a more planned and regulated
urban environment. It is also notable that the preva-
lence of independent activity is highest in the middle
of the wealth distribution, with the middle household
wealth quintile having the highest prevalence. How-
ever, this differs by gender. While the prevalence of
independent activity is highest in the middle of the
wealth distribution among males, it is highest in the
lowest wealth quintile among females. While there is
no strong relationship, participation in independent
activity does seem to decline somewhat at higher lev-
els of education.
Attitudes Towards Entrepreneurship
All young people were asked who they thought was
responsible to provide them with employment
opportunities. More than 80% said that it was the
responsibility of the government or policymakers.
Only 9% said “myself” and 3% said “my family”.
However, when asked if they had the choice between
wage and salary employment and independent work,
53% said they would prefer independent work, with
little variation in this proportion by sex, education,
urban/rural residency, and household wealth quin-
tile. When asked for the reason for their preference,
66% of those who said they preferred independent
work mentioned the desire for more independence,
and only 9% mentioned the absence of other employ-
ment opportunities. Of those who said they preferred
wage or salary employment, 61% justified their choice
by a desire for more stability and 26% mentioned the
lower responsibility involved.
All youths were asked if they had thought about or
attempted to undertake a project of their own. While
15% of all youths answered in the affirmative, only
19% of those who expressed a preference for indepen-
dent work either thought about or attempted to start
their own project, as compared to 10% of those who
said they preferred wage or salary employment. Even
more surprisingly, only 65% of those who are actu-
ally working in independent activity said they had
thought about or attempted to undertake their own
project. It is most likely that the rest acquired their
project by taking over a family business. As expected,
more young men (23%) than young women (8%) had
thought of or attempted to undertake their own proj-
ects, but surprisingly, the proportion among them
that actually succeeded in undertaking a project is
only slightly higher for young men (7.8%) than it is
Egypt Human Development Report 2010 { 137 }
for young women (7.1%). Actually, among employed
young people, young women who thought about
doing their own projects were twice as likely to under-
take these projects as young men. This suggests that
there are fewer barriers for young women to under-
take independent projects than there are for them to
obtain wage and salary employment. This interpreta-
tion is further buttressed by the fact that more women
than men who implemented their own project said
that their main motivation was their inability to find a
paid job (41% for women versus 35% for men).
Like the actual prevalence of independent activity,
which peaks at the third quintile, the proportion who
thought about undertaking their own project first goes
up with wealth, reaches a peak at the fourth wealth
quintile and then declines. However, the gender
pattern is much more similar now that it was in the
actual prevalence of independent activity. Similarly,
the proportion of those actually realizing their plans
and setting up a project peaks at the third wealth
quintiles, but again with no gender differences. This
suggests that the high rates of independent activity
noted earlier for very poor young women is the result
of the absence of other employment options rather
than from a well-thought out strategy to set up entre-
preneurial activity. It is highly likely that many of the
poor young women observed in independent activity
are simply engaged in marginal activities related to
their traditional roles in raising poultry and livestock
and selling their by-products.
The fact that young people’s desire to start their own
projects goes up with wealth is not surprising. The
more surprising part is why it declines at the top of
the wealth distribution. The most likely explanation
Box 10.1: Entities Involved in the Investment Process in Egypt
The current investment framework in Egypt — which reflects an investment facilitation approach — includes a number of
players, each with specific roles and functions. The role of each entity is not confined to specific investment needs, except
for a few which focus on specific investment sizes such as the Social Fund for Development (SFD), and the Small and
Medium Enterprises (SME) Unit at the Ministry of Trade and Industry.
The key player in this setup is GAFI. As the sole entity responsible for investment, GAFI expanded its role in the direction of
investment promotion and facilitation in addition to its traditional regulatory and supervisory roles. The new role stressed
two main themes:
• First the procedures simplification program which resulted in cutting time, effort and cost of starting a business through
its ‘One-Stop-Shops’.
• Second, the investment facilitation concept where GAFI became the coordinator between the investor and other relevant
government bodies. Complementing GAFI’s role, the Industrial Development Authority (IDA) developed its role to be
responsible for Egypt’s industrial strategy and embarked on promoting industrial parks. As the sole owner of new
industrial land, IDA developed a national industrial map that reflected its industrial policy and provided the basis for a
land allocation process. IDA is responsible for coordinating with relevant entities to ensure offering investors industrial
land with the proper infrastructure. But whereas GAFI and IDA deal with investors irrespective of their size, the Social
Fund for Development deals primarily with SMEs.
The Industrial Modernization Center (IMC) assumes a different role in providing the required technical assistance to develop
and upgrade existing industries that are in line with the government’s national industrial policy. It provides financial
support accompanied by technical help to maintain the required level of performance that would allow firms to compete
in the global environment. The IMC provides financial support to the HR training carried out by new or existing industries
for the sake of maintaining a proper workforce that is in shape and capable of taking the industry steps forward. Other
entities that could be part of this investment setup are the Investment Offices in governorates all over Egypt, which should
act as windows for micro, small and medium-size investments in places not covered by the authorities mentioned above.
In reality, however, their role has been extremely limited and is in need in fact of serious strategic review.
Source: Ziad Bahaa el Din, Background Paper, EHDR 2010
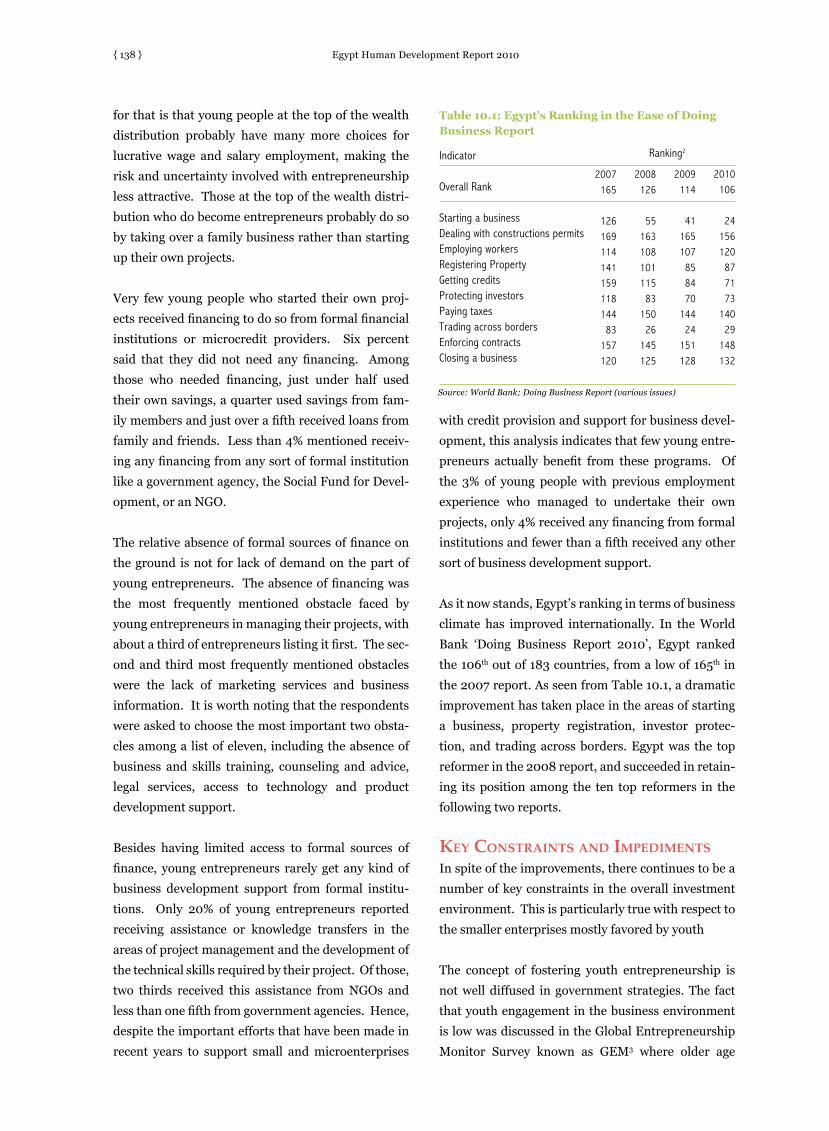
Egypt Human Development Report 2010{ 138 }
for that is that young people at the top of the wealth
distribution probably have many more choices for
lucrative wage and salary employment, making the
risk and uncertainty involved with entrepreneurship
less attractive. Those at the top of the wealth distri-
bution who do become entrepreneurs probably do so
by taking over a family business rather than starting
up their own projects.
Very few young people who started their own proj-
ects received financing to do so from formal financial
institutions or microcredit providers. Six percent
said that they did not need any financing. Among
those who needed financing, just under half used
their own savings, a quarter used savings from fam-
ily members and just over a fifth received loans from
family and friends. Less than 4% mentioned receiv-
ing any financing from any sort of formal institution
like a government agency, the Social Fund for Devel-
opment, or an NGO.
The relative absence of formal sources of finance on
the ground is not for lack of demand on the part of
young entrepreneurs. The absence of financing was
the most frequently mentioned obstacle faced by
young entrepreneurs in managing their projects, with
about a third of entrepreneurs listing it first. The sec-
ond and third most frequently mentioned obstacles
were the lack of marketing services and business
information. It is worth noting that the respondents
were asked to choose the most important two obsta-
cles among a list of eleven, including the absence of
business and skills training, counseling and advice,
legal services, access to technology and product
development support.
Besides having limited access to formal sources of
finance, young entrepreneurs rarely get any kind of
business development support from formal institu-
tions. Only 20% of young entrepreneurs reported
receiving assistance or knowledge transfers in the
areas of project management and the development of
the technical skills required by their project. Of those,
two thirds received this assistance from NGOs and
less than one fifth from government agencies. Hence,
despite the important efforts that have been made in
recent years to support small and microenterprises
with credit provision and support for business devel-
opment, this analysis indicates that few young entre-
preneurs actually benefit from these programs. Of
the 3% of young people with previous employment
experience who managed to undertake their own
projects, only 4% received any financing from formal
institutions and fewer than a fifth received any other
sort of business development support.
As it now stands, Egypt’s ranking in terms of business
climate has improved internationally. In the World
Bank ‘Doing Business Report 2010’, Egypt ranked
the 106th out of 183 countries, from a low of 165th in
the 2007 report. As seen from Table 10.1, a dramatic
improvement has taken place in the areas of starting
a business, property registration, investor protec-
tion, and trading across borders. Egypt was the top
reformer in the 2008 report, and succeeded in retain-
ing its position among the ten top reformers in the
following two reports.
key constraints anD iMPeDiMents In spite of the improvements, there continues to be a
number of key constraints in the overall investment
environment. This is particularly true with respect to
the smaller enterprises mostly favored by youth
The concept of fostering youth entrepreneurship is
not well diffused in government strategies. The fact
that youth engagement in the business environment
is low was discussed in the Global Entrepreneurship
Monitor Survey known as GEM3 where older age
Table 10.1: Egypt’s Ranking in the Ease of Doing Business Report
Indicator
Overall Rank
Starting a businessDealing with constructions permitsEmploying workersRegistering PropertyGetting creditsProtecting investorsPaying taxesTrading across bordersEnforcing contractsClosing a business
2007165
126169114141159118144
83157120
2008126
55163108101115
83150
26145125
2009114
41165107
858470
14424
151128
2010106
24156120
877173
14029
148132
Ranking2
Source: World Bank; Doing Business Report (various issues)

Egypt Human Development Report 2010 { 139 }
groups (45-54 years) were found to have a higher level
of involvement as established business owners, and
the younger age groups a higher level of involvement
in early stage entrepreneurial activity, particularly as
nascent entrepreneurs. The high level of involvement
in early stage entrepreneurial activity is still lower
than the average for factor driven economies, where
an average of just over 15% of the 25-34 age group
were engaged and 11.6% of the 35-44 age group.
However, the big picture shows Egypt to be doing
better than the majority of countries in the GEM Sur-
vey. In terms of overall ranking, Egypt places 11th
out of 43 countries, with 20.2% of the working age
population (18-64) involved in entrepreneurial activ-
ity. 13.1% of this figure is comprised of early-stage
entrepreneurs (7.9% and 5.5% being nascent activ-
ity and new business owners, respectively), while the
remaining 8% are established owners with businesses
older than 42 months. For all countries in the GEM
Survey, the 25-34 age group had the highest early-
stage entrepreneurial activity (regardless of type of
economy), but the group with the next highest rate in
Egypt was the 18-24 years old, which is not common
of all other countries.
Thus, Egypt’s young population gives it a strong
entrepreneurial advantage. Furthermore, 62% of
early stage entrepreneurs in Egypt are between the
ages of 18 and 35, whereas only 53% of the adult
population is in that group. Finally, the fact that 81%
of Egyptian reported their motive for pursuing early
stage entrepreneurial activity as ‘opportunity’ rather
than ‘necessity’ makes the country appear more like a
developed, rather than factor driven, economy.
A number of surveys have investigated the main
bottlenecks in the investment environment. There is
some consensus gradually appearing, albeit with vari-
ous weights and different areas of emphasis. Accord-
ing to the findings of the 2006 survey conducted by the
World Bank for assessing Egypt’s investment climate
(ICA report) the key impediments were: Macroeco-
nomic instability, informal practices and illegal com-
petition, corruption, regulatory policy uncertainty,
tax rates, cost of financing, tax administration, lack of
skilled and well educated workers, and labor regula-
tions. Access to land, business licensing and permits,
transportation, water, electricity and telecommunica-
tions came at a lower level of priority to the surveyed
firms. This, however, differs from the point of view
of investors as reported in a recent publication by
GAFI’s Board of Trustees entitled ‘Towards an Equal
Distribution of the Proceeds of Growth’. The latter
came up with the following list of impediments; the
absence of government support, high interest rates,
the instability of inputs of production prices, access
to finance, corruption, lack of skilled workers. A lower
priority was given to each of scarcity of inputs of pro-
duction, unsuccessful planning, high labor wages,
lack of distribution channels and lack of demand.

Egypt Human Development Report 2010{ 140 }
The fact that there is some discrepancy in the inves-
tors’ response is normal and reflects various meth-
odologies and samples as well as overall approach.
The World Bank approach tends to direct its research
towards excessively quantifiable and measurable
issues – mainly for the purpose of comparison with
other countries – and accordingly emphasizes num-
ber of procedures, cost of conducting a formal trans-
Box 10.2: Canada’s Second Chance Route: A Model to Emulate
The Centre for Entrepreneurship Education & Development (CEED) Second Chance Program assists youth in conflict with the
law to become productive citizens by using entrepreneurship as a vehicle for learning. In the ten years since the program’s
inception, more than 100 young people have benefitted from the development of the skills and attributes necessary in
becoming productive, engaged and contributing members of society. The program is unique in that it recognizes that
youth in conflict with the law often possess misdirected entrepreneurial qualities. The strengths of the program lie in the
incorporation of mentoring as part of the program’s development strategy, the inclusion of social competency and life
skills, and the emphasis placed on the value of experiential learning. Second Chance facilitators work with participants on
an individual basis to guide them through a process of professional and personal growth, which has resulted in a program
with annually low rates of recidivism among past participants.
The X Factor
The program’s success relies on involving participants in the development of community projects, personal goal setting
and skill building activities in the development of activities to positively contribute, and give back to their communities.
Each youth is encouraged to use his or her skills and talents towards an improved, self-fulfilling lifestyle. Enrolling in the
Program gives these young people a valuable ‘second chance’ to turn their lives around and work towards achieving their
goals. All of the above activities are conducted using a business planning model. Ultimately, Second Chance teaches the
‘business of life’ – teaching participants how to run their live as successful businesses. Graduates of the Program leave
with strong leadership skills, life skills important to their personal development, and the entrepreneurial mindset vital to
being successful and engaged members of society and in some cases, even small business owners. Many successful
graduates enroll in post secondary programs, find employment and begin the process of increasing and building extensive
skill sets to add to their resumes.
Program Metrics
In the summer of 2009, CEED commissioned a review of the Program by Dr. Stephen Schneider, Professor of Sociology and
Criminology, Saint Mary’s University in Halifax, Nova Scotia, Canada. This review highlighted the strengths and success of
the Program, as well as several recommendations on how to better meet the needs of Program participants. The timing of
this review was especially relevant given the recent expansion of the Program to additional provincial centers (the Program
had previously operated from CEED’s offices in Halifax, Nova Scotia).
The report identified several strengths, including the value of including the mentoring component as part of the Program’s
development strategy, CEED’s work in developing networks of support for participants, the individualized nature of
participant programming (the self-identification of goals, skill sets, and personal experiences along the progression of the
program), the effectiveness of including the development of social competency and life skills development for youth at risk,
and the diverse, holistic, and experiential nature of program delivery and the learning environment
As a result of the report, CEED will incorporate changes to the program, including:
• The continuous incorporation of research to keep Program content relevant
• Increasing the depth of participant assessments prior to starting the Program
• Further capitalizing on the success of the individualization of the Program
• Working to increase supports to participants when they successfully complete the Program
• Development of a formalized pool of mentors to increase the ease at which participants find their mentors
• Formalizing the structure of Program evaluation
For more information visit http://www.ceed.ca Source: Annette St. Onge, CEED

Egypt Human Development Report 2010 { 141 }
action and the time associated therewith. This often
misses the point of what the true impediments are,
especially for small businesses, that is, why entre-
preneurs are driven to invest and take risk, and why
they end up succeeding or failing. For the picture to
be completed more qualitative research is needed
and in-depth analysis of specific examples. This
was attempted by the GAFI Report which used as a
case study a distressed industrial zone in the Upper
Egypt governorate of Sohag (Kawthar District) it is
considered as a classical example of an SMEs zone,
where most of investors lack awareness of; dealing
with financial institutions, investment information
and the right planning for business continuity. The
conclusions of the Report on this matter may not be
more conclusive as those of the World Bank (at least
by virtue of the limited sample), but the combination
of large scale quantitative research with such tailored
reports could lead to investing different dimensions
of the problem.
In another survey conducted by Gallup on youth in
different Arab countries4, youth considered starting a
new business a real problem. About 70% of the sur-
veyed sample pointed out to government bureaucracy
as a real impediment, while only 30% considered it
easy to carry out paperwork and permits necessary to
start a business. Bureaucracy is a particular disincen-
tive to young people starting a business and can put
an unsustainable burden on their new businesses. On
the other side, the GEM report, mentioned earlier,
points to other investment impediments as follows;
lack of financial support, inadequate government
policies, lack of governmental programs that assist
entrepreneurs, problems with education and train-
ing, lack of R&D transfer, weakness of commercial
and professional service infrastructure, insufficient
internal market openness, lack of accessibility of
physical infrastructure, and social cultural norms.
Overall, obstacles that youth entrepreneurs face
include the following impediments: Lack of aware-
ness and the proper training required for starting up a
business and maintaining it, as well as lack of govern-
ment support and the absence of a focused attention
to the needs of this category of entrepreneurs. The
concept of youth entrepreneurs is not fully spread in
the Egyptian culture; the youth employment concept
is still prevailing. Ways to communicate the impor-
tance of youth entrepreneurship that are supported
by effective mechanisms still do not exist. The lack
of guidance and opportunities provided by the gov-
ernment is another concern. Access to finance is
an equally important issue, as is the absence of the
required guarantees thus depriving potential busi-
nesses from entering the market, and there is a need
for institutions that are willing to financially support
youth entrepreneurs. That role is being played now
by a small number of NGOs that facilitate the access
to the finance process, but a more institutionalized
framework is needed, whereby young entrepreneurs
could get the necessary financial support to enter the
business environment.
On another front, an ineffective competition law
can close markets to new start-up businesses par-
ticularly young people who are outside local business
networks. Informality continues to be a major con-
cern; young entrepreneurs might operate under the
umbrella of the informal economy evading taxes and
other constraints, but they are unable to grow due to
the lack of access to reasonable sources of finance and
fear of regulation and taxation.
towarDs an enabLing enviroMentThere is — on the whole — no specific treatment or
special track accorded for young entrepreneurs to
start a business in Egypt. Youth per say is not a fac-
tor in law or in practice that brings about any spe-
cial privileges or benefits when it comes to starting
a business. (It does, however, bring some benefits in
other areas such as qualifying for ownership of land
designated for reclamation or of subsidized housing).
The law is perhaps the right approach. It is difficult to
imagine specific benefits or advantages which could
be accorded to young entrepreneurs which should not
be available to all those seeking to start a business.
Improving the overall environment for doing busi-
ness and for self-employment is thus the best way to
encourage and empower the youth to become entre-
preneurs.
There continues, however, to be some scope for
youth-sensitive measures which, albeit of a general

Egypt Human Development Report 2010{ 142 }
applicability, will likely benefit the young more signif-
icantly than other age groups. The following consider
the first elements that are part of the overall business
environment and are followed by a more specific dis-
cussion of youth sensitive measures.
Priorities for Reform
Most of the following recommendations for the over-
all improvement of the business environment have
been proposed, discussed and seriously debated on
various occasions and in numerous events and pub-
lications over the last few years. There is little novelty
or innovation in this domain and the focus is broad
with no specific emphasis on youth. However, pool-
ing together the key elements should be the basis for
consensus, in addition to providing some practical
guidelines as to the application of the proposed mea-
sures. The hope is for a ‘trickle-down’ effect to impact
on greater youthful entrepreneurship.
• 1. Legislative Reform: In this area, the most
urgent and pressing need is to introduce new leg-
islation to deal with bankruptcy and protection
from creditors so as to reduce the risk attached
to starting a business. This has long been consid-
ered an essential part of improving the business
climate in Egypt because it would allow easier
exit from the market, more efficient recycling of
resources and productive capacities, and better
protection for lending therefore easier access to
finance.
• 2. Institutional Reform: Here the single most
important element would be the formalization of
real estate ownership in Egypt. This would per-
mit real estate owners to sell, lease, exchange,
and secure the ownership of their real estate
assets. It would also permit mortgage lending
and represent a major collateral asset. This is
not a matter that can be achieved by law only; it
requires major institutional building and a mas-
sive on-the-ground registration program.
• 3. Access to Land: This refers to the continuous
need by investors, particularly smaller start-up
businesses, to find suitable, affordable and ser-
viced land. It is not the lack of land in Egypt that
is the cause of trouble. It is the fact that such land
needs to be (i) legally available, (ii) affordable to a
start-up business, (iii) serviced with the required
utilities such as water, power, roads and waste
disposal, and (iv) relatively close to housing, mar-
kets and sources of inputs.
• 4. Licensing of Activities: Over the last few
years, the establishment of companies was radi-
cally improved. However, the same did not occur
with respect to the licensing of various activi-
ties, arguably many of which could be under-
taken by youth. Overlapping jurisdictions, lack
of clear rules and requirements, and the inability
to change the mindset in line with the national
vision have been the culprits.
• 5. Access to Finance: Again, introducing a new
framework for resolving bankruptcies is prob-

Egypt Human Development Report 2010 { 143 }
ably the most needed measure to improve access
to finance for start-up businesses. In addition
widening the scope of credit scoring could have
a significant effect. Allowing the establishment
and licensing of specialized institutions that pro-
vide micro as well as small scale funding would
also have a positive impact, especially for youth.
Finally, the continuous growth of non-bank
financial services – financial leasing, mortgage
finance, and factoring – will benefit smaller com-
panies and allow for easier funding.
• 6. Access to Information: Here a nationally
coordinated effort is required in order to ensure
that enough information is made available for
potential investors and entrepreneurs about all
aspect of doing business; demographic informa-
tion, market information, prices, changes in laws
and regulations, availability of land, etc. Only
this would permit a level playing field capable
of drawing and encouraging new entrants to the
market.
• 7. Improving the Competitive Environment:
This refers simply to the need to extend the
interest of the authorities in charge of protecting
the competitive environment and of the public
at large to reduce barriers to entry, and elimi-
nate restrictions and requirements that limit the
capacity of new players to enter the market.
Empowering the Young
To specifically identify youth sensitive measures to
improve the investment environment is not a straight-
forward matter. An easy option would be to recom-
mend specific benefits and privileges to those within a
certain age bracket (loans, guarantees, cheaper land,
credit, better tax treatment, etc). But to fulfill such a
formalistic requirement risks introducing unneces-
sary distortions, opportunities for corruption, and
result in no specific gains. A better approach would
be to adopt a ‘National Youth Entrepreneurship
Strategy’ that embarks on a number of pillars and
addresses all the required issues.
This ‘National Strategy’ would provide all incentives
required for establishing a youth entrepreneurship
community. Major issues that should be covered by
the suggested strategy are as follows:
• A comprehensive awareness/PR campaigns to
diffuse the concept of youth entrepreneurship,
reduce the fear of failure and boost perception
of the value of entrepreneurs to society, using
case studies, identify heroes and champions
from among young people and successful entre-
preneurs, getting experienced business people
to promote self-employment as a genuine career
option for young people and creating prestigious
awards to celebrate the success of entrepreneurs,
make heroes of entrepreneurs. The campaign
can capitalize on existing efforts by other institu-
tions (i.e. ILO “Know About Business” Program);
• Establishing enterprises and support agencies
that provide accessible ongoing technical advice
and training on subjects such as marketing,
taxation, sales, HR, accountancy, laws and regu-
lations, project evaluation, dealing with credit
institutions… etc;
• Provide incubator units where youth businesses
can find accessible services, shared office space
and mutual support from other new businesses;
• Vocational and skills training requirements;
• The ease of access to information;
• Access to credit and the creation of new channels
of financing including the possibility of using
financial leasing as a means of financing busi-
nesses;
• Supplying opportunities that could engage youth
in the businesses Special incentives in terms of
access to land and infrastructure;
• Building social networks and youth institutions
and Chambers;
• Engaging small producers in the value chain of
certain products.
the Many faces of oPPortunityEvery new business is a goldmine opportunity for
Egyptians; a new business means a new set of jobs
created, more investments poured into the market,
and higher possibilities for innovation and develop-
ment that contribute to the overall economy. Small
and Medium Enterprises (SMEs) provide the solu-
tion to many problems of the market economy, whose
big enterprises are forced to adopt — for example —
strict policies regarding spending and employment.
In other words, big enterprises are less flexible and
Egypt Human Development Report 2010{ 144 }
immobile, and although contributing large amounts
of both money and employment opportunities to the
economy, they are still limited in terms of initiating
new ideas, and thus new businesses.
SMEs, on the other hand, are mobile, flexible, and
‘slim’. They are much more prone to change, more
than receptive to growth, and can create clusters and
partnerships at a much higher frequency than their
bigger siblings. In Egypt, Small and Medium Enter-
prises are defined as companies with less than LE 5
Million in capital (with Small Enterprises ranging
from 50, 000 to 500, 000), and having a less than
50 employees labor force.5 According to the 2008
Egypt Human Development Report, SMEs account
for 75% of employment and around 80% of GDP in
Egypt.6 Furthermore, these SMEs depend on youth
as a major pool for employment, in addition to the
fact that a significant amount of SMEs are founded by
youth entrepreneurs as well.7
An ‘in-between’ option that has recently emerged is
the choice of franchising as a business model that has
much to offer in terms of developing SMEs, promot-
ing entrepreneurship and creating employment.8
The greatest strength of franchising as an SME strat-
egy is its proven success when compared to indepen-
dent businesses. Most conservative statistics show
that franchisees rate of success is higher than that of
independently-owned small business. In Australia,
franchising is 2.5 times more successful than other
small businesses. According to the Joint Africa Insti-
tute (2004) the USA claims that 90% of its franchised
units succeed whilst in South Africa the success is
generally acknowledged at about 85% in franchised
businesses over a 3 to 5 year period.
What makes franchising more successful than inde-
pendent businesses is the transfer of know-how
between the franchisor and franchisee. For instance,
established franchisors usually have operating manu-
als that detail pre-opening, operation and market-
ing of a franchise. Franchisees also benefit from a
complete business plan, training, the use of the sys-
tem’s trademark and signs, architectural design and
advertising and marketing support. There are also
instances where the franchisor can help the franchi-
see find funding sources.
It remains that, like any other business model, finan-
cial constraints to starting up a franchising business
exist, and can be inhibitive in the light of a deficient
micro-finance system. The same holds true for youth
who face difficulty accessing formal channels of
finance. Nevertheless, service based or home-based
franchised businesses have proven to be more afford-
able and offer great flexibility as they can be run from
an inexpensive office space or home. Cleaning ser-
vices, in-home care services, personal security and
alarm systems, personnel placement services, maga-
zine publishing, trademarked product distribution,
interior decorating, business planning, accounting
and tax services are some examples of labor intensive
low investment franchises.
Given the success record of small franchised busi-
nesses, public policy in Egypt should focus on creat-
ing the regulatory environment conducive for fran-
chise practices, as well as raise awareness and provide
the financial programs necessary for the creation and
growth of such businesses, possibly through the for-
mal banking system.
• REMOVE THS AT OUR OWN PERIL.
• Everytime I try the file crashes.
• Good luck
•
• Make a back up fiirst.

Egypt Human Development Report 2010 { 145 }
Box 10.3 Potential for Growth of Franchising in Egypt
In Egypt, there are notable efforts undertaken by the Egyptian Franchise Development Association (EFDA) to encourage and
promote entrepreneurship through franchising. The awareness raising, training and consulting services offered by the
EFDA on franchising issues to members and non-members alike are a distinct service offered by this NGO. Nevertheless,
reaching out to small and medium enterprises (SMEs) that include franchises is one major challenging that the EFDA
currently faces, as does the Government of Egypt (GOE).
So far, the bulk of franchising activity in Egypt has been in retail services followed by food franchises (48.9% and 22.53%
respectively). There are now a limited number of franchise companies in hotel management, car rental, language education,
health and fitness, electronics, and computer training.
The growth of home grown franchises is also encouraging. For example, Mohamed Mo’men opened his first fast food restaurant in
1988, which eventually was followed by the expansion of the Mo’men chain across Egypt. Today Mo’men has become a name
in the market and has succeeded to franchise its chain in Jordan, Libya and Sudan, with plans to expand into the GCC market.
That being said, it has become necessary to create an overall business environment where franchising can flourish. Existing
obstacles include the still limited awareness about the concept of franchising and how it functions among public, private
sector, professionals and academia. Another related problem is the limited information about viable market opportunities.
As a first step towards an overall policy framework by the GOE the African Development Bank’s significant contribution
towards a franchising program, with a US$40 million loan is to be managed through the Social Fund for Development
(up to 70% of cost of capital setting up the business). The fund aims to encourage the establishment and expansion of
primarily local franchising concepts, with money going to raising awareness about franchising and developing financial
instruments in Egypt.
Figures on the distribution of franchising activity by age the shows that it is skewed to those above 35 years of age, while
franchisors that are younger represent only 6.6% according to census figures for 2004. In this respect, it is probably
financing that is the problem faced particularly by young entrepreneurs. Lack of collateral and sources of capital do pose
an obstacle. Cash flow based lending presents a potential solution, so do government guarantees to encourage the
banking sector to lend to small business.
Another serious impediment is the general limited creativity and marketing capacity of small and medium enterprises in
Table 10.2: Franchising Activity By Sector
Sector
Automotive Products/ServicesBuilding Office/Home Services Business to Business Services Car Sales Education/Training Entertainment/LeisureHair/Beauty Petroleum RetailingPrinting/Photocopying ServicesReal Estate ServicesRetailHospitalsMedical/Pharmaceutical ServicesFood OthersTotal
No. of Systems
5112121169211782168236364
% of Total
1.370.270.270.553.303.021.652.470.550.2748.900.554.4022.539.89100
Source: EFDA compilation from the Franchising Census Egypt 2004
Egypt Human Development Report 2010{ 146 }
Box 10.3 continued...
Egypt. However, this is not solely an SME problem but it is manifested in poor R&D and educational outcomes. According to
a GEM study (2008), Egypt ranks last among 31 countries on R&D and technology support provided to new and growing
firms.
Further, while a study shows that the existence of institutions such as trademark protection and labor regulation can have a
positive impact on franchising activity within a country, the enforcement of trademark protection is quite effective in Egypt,
it is the long dispute resolution system that can act as a disincentive for franchising and entrepreneurial activity in general.
It therefore becomes all the more necessary to develop the capacity of recently established economic dispute courts.
On a positive note, Egypt is now in the process of developing an overall policy and legislation regarding franchising. The
purpose of the legislation should be to protect the right of franchisee, protect the economy from franchising monopolies,
and ensure that rules and safeguards regarding franchising are effectively enforced. Franchise regulations would be
most beneficial if they include a definition of franchising, a requirement for pre-sale disclosure and a stipulation that the
franchisors and franchisees act in good faith towards each other in complying with the spirit and content of the contract.Source: Heba Abu Shnief, Background Paper, EHDR 2010
Endnotes1. Ragui Assaad, Background Notes to the EHDR 20102 Number of countries increased between 2007 and 2010 as follows: 175 country in 2007, 178 country in 2008, 181 in 2009
and 183 in 2010.3 GEM is an international research initiative conducted by the Global Entrepreneurship Research Association (GERA),
a consortium that includes each of London Business School and Babson college, that established an independent non-profit company. The GEM measures the level of entrepreneurial activity by assembling harmonized data from several participating countries on an annual basis.
4 Silatech in partnership with Gallup, June 2009.5 Business Today Magazine, February 20096 EHDR, 2008.7 Seif Abu Zeid, Backround Notes on EHDR 20108 Section on franchising by Heba Abu Schnief, Backround Notes on EHDR 2010
referencesSilatech, 2009, “The Silatech Index : Voices of Young Arabs,” in partnership with Gallup.L. Martin, Roger and Sally Osberg. “Social Entrepreneurship: The Case for Definition.” Stanford Social Innovation Review 2007,
30/03/2009.Langlois, Richard N. Schumpeter and the Obsolescence of the Entrepreneurhttp://langlois.uconn.edu/SCHUMPET.HTML Pfister et al. (2006) “Institutions and Contracts: Franchising.” European J Law Econ,
21: 53–78.The study was conducted on 546 franchise chains in 9 developed countries.Schumpeter, Joseph A. 1934. The Theory of Economic Development. Cambridge: Harvard University Press. (New York: Oxford
University Press, 1961.) First published in German, 1912.

{ 147 }
Chapter Eleven
Among the five transitions that make up a young person’s tran-sition to adulthood — identified in Chapter Three — the transi-tion from school to work is probably the one that has attracted
the greatest degree of public concern. High youth unemployment does not only result in much anxiety for many Egyptian families, but is undoubtedly one of the major policy priorities of the Egyptian politi-cal system. Compounded by the youth bulge, the significant restructur-ing that occurred in the Egyptian economy in recent decades toward a more market-oriented system has greatly complicated young people’s transition to the labor market. While the demographic pressures are beginning to subside, as the youth bulge moves to higher ages, the restructuring of the economy and the institutional transformation that must accompany it is still largely incomplete.
HUMAN DEVELOPMENT AND LABOR MARKETS
Egypt Human Development Report 2010{ 148 }
Government hiring of secondary school and univer-
sity graduates has been severely curtailed in recent
years, but the formal private sector has not suffi-
ciently expanded its employment to absorb the large
number of educated new entrants streaming onto the
job market every year. More importantly, the edu-
cation system continues to produce credentials that
are good to qualify people for government employ-
ment rather than skills that are valued in a market
economy. Faced with poor prospects of getting for-
mal jobs in either the public or private sectors, young
people are either forced to accept any jobs they can
get in the informal economy or, as is increasingly the
case for young women, to abandon the idea of partici-
pating in the labor market altogether.
These trends amount to a complex picture of labor
market developments for young people that can-
not be ascertained by a few simple indicators. For
instance, the unemployment rate, which has captured
a great deal of attention in policy circles and in the
mass media in recent years, is, on its own, an inad-
equate measure of how well youth are faring in the
labor market. Very high youth unemployment rates
have been used to sound the alarm about the extent
of the youth employment problem for some time, but
now that there is evidence that these rates are falling,
does this mean that the problem is being resolved?
The unemployment rate is a very partial measure of
the health of the labor market that depends as much on
the level of expectations about getting formal employ-
ment as it does about the rate at which such employ-
ment is being created. The unemployment rate can
decline simply as a result of people giving up on the
prospects of formal employment and either taking up
any job in the informal economy, creating one’s own
job, or dropping out of the labor force altogether. This
can happen without any real improvements in employ-
ment conditions in the economy. Thus, to ascertain
what a decline in unemployment rates means, one
has to examine a number of other labor market indi-
cators including alternative definitions of unemploy-
ment, the labor force participation rate, and the newly
introduced indicator called the “jobless rate”, as well
as information about the type of jobs young people
are actually getting. In what follows, that is precisely
what is done to get a more complete picture of labor
market development for young people in Egypt.
The discussion that follows relies on a number of
data sources. Comparable surveys for 1998, 2006
and 2009 are used to trace changes in the situation
of youth over a period of just over a decade.1 These
surveys use the same definitions and methodologies,
making it safe to compare across them. In some anal-
yses, data from the official Labor Force Survey, car-
ried out by CAPMAS on a quarterly basis, are used.
These data are somewhat more problematic to use
because the micro-data are not available to research-
ers, making it difficult to carry out the special tabula-
tions necessary to look at the situation of youth. The
methodologies of CAPMAS surveys also changed at
the end of 2006, making it complicated to reach reli-
able comparisons over time.
the transition to eMPLoyMentYouth unemployment is the dominant form of unem-
ployment in Egypt. In 2006, well over 80% of the
unemployed were under the age of 29 and 82% of the
unemployed had never worked before. Unemploy-
ment is therefore essentially an indicator of labor
market insertion problems experienced by young peo-
ple as they negotiate their transition from school to
work.2
Because of different expectations about gender
roles in Egyptian society and a highly gendered labor
market structure, these transitions are highly differ-
entiated by gender. While nearly all young men even-
tually transition into employment, less than a fifth of
young women do, a figure that has unfortunately been
declining with time as employment opportunities for
women in the government dry up.
Youth unemployment in Egypt is high by any mea-
sure, but there are some indications that it had begun
to decline, notwithstanding the recent financial cri-
sis. The unemployment rate for youth 15-24 in Egypt
in 2007 was 24.5%. This compares to world average
of 11.9% in 2007 and an average of 23.8% for North
Africa, the world region with the highest unemploy-
ment rates in the world.3 The following discussion of
trends in the unemployment rate is based on two alter-
native definitions of unemployment, namely the stan-
dard and the broad definitions. Both definitions are

Egypt Human Development Report 2010 { 149 }
based on recommendations by the International Con-
ference of Labor Statisticians that takes place under
the auspices of the International Labor Organization.
• The standard definition of unemployment
requires that a person not have worked a single
hour during a reference week, be desiring to
work, ready and available to start work within
two weeks, and to have actively searched for
work during some past reference period, typi-
cally the past month.
• In cases where labor markets are less structured
or where searching for work appears futile, inter-
national recommendations allow for a broader
definition that drops the active search criterion.
Thus the broad definition of unemployment
includes — within the ranks of the unemployed
— individuals who are not working, are ready
and available for work, but have not engaged in
any search activity. That group is often referred
to as the discouraged unemployed.
• Neither definition includes individuals who have
worked an hour or more during the reference
week, but who wish to work more hours. The lat-
ter are considered employed but are considered
visibly underemployed.
The Egypt Labor Market Surveys (ELMS) of 1998
and 2006 and the Survey of Young People in Egypt
(SYPE) of 2009 suggest that there was a significant
decline in the youth unemployment rate from 1998
to 2006 and then relative stability from 2006 to
2009, if the standard definition is used. According
to this measure, the unemployment rate for those 15
to 29 year olds has declined from 25.6% in 1998 to
16.9% in 2006 to 16.7% in 2009 (Table 11.1). How-
ever, the comparison of the estimates from the stan-
dard and broad definitions suggests that much of the
decline in the standard unemployment rate is due to
discouragement rather than an increase in employ-
ment rates.
In fact, broad unemployment increased from 2006
to 2009 at a time when standard unemployment
declined slightly. A broad unemployment rate of
22.9% in 2009 suggests that 6.2% of the youth labor
force was made up of discouraged workers who quit
searching for work. This is up from less than 3% dis-
couraged unemployment in both 1998 and 2006. The
fact that broad unemployment declined from 1998 to
2006 suggests that there was some improvement in
youth employment prospects during the period pre-
ceding the world financial crisis.
It has been well known for some time that unemploy-
ment rates are much higher among young women
than young men. In fact, by either measures of
unemployment, more than one in two economically
active young women were unemployed rather than
employed in 2009. Depending on the year, young
women are between two and a half and four times
as likely to be unemployed as are young men. To the
extent that there was an improvement in the employ-

Egypt Human Development Report 2010{ 150 }
Males Females All
ment outlook from 1998 to 2006, that improvement
was much more pronounced for young men, who saw
their unemployment rate (according to the broad
definition) decline by 42% (from 18.4% to 10.6%),
compared to a decline of only 26% for women (from
55.7% to 40.8%). Both men and women saw dete-
rioration in their employment prospects from 2006
to 2009, a period that corresponds to the onset of the
world financial crisis, but the relative deterioration
was worse for men.
The unemployment data also indicate that unem-
ployment for young people peaks at age 21 and then
declines significantly thereafter (see Figure 11.1).
Unemployment rates are fairly similar for males and
females until about age 19, the age at which most sec-
AllBy SexMalesFemalesBy Age Group15-1920-2425-29By Sex & Age GroupMales 15-19Females 15-19Males 20-24Females 20-24Males 25-29Females 25-29By ResidencyUrbanRuralBy Household Wealth QuintileLowestSecondMiddleFourthHighest
Table 11.1: Standard and Broad Youth Unemployment Rates by Selected Characteristics, 1998, 2006, 2009, ages 15-29
1998
25.6
15.951.9
26.333.616.5
17.954.719.961.610.735.3
26.625.0
17.526.325.928.929.5
2006
16.9
9.736.7
14.622.912.8
10.227.014.342.6
5.934.4
21.513.9
9.513.318.321.624.8
2009
16.7
12.432.0
16.720.612.9
16.419.015.038.2
7.530.2
17.915.8
12.515.216.520.418.6
1998
28.8
18.455.7
31.236.918.0
21.461.022.764.612.037.3
30.227.9
22.429.728.231.832.2
2006
19.1
10.640.8
18.425.613.6
12.234.715.347.4
6.336.0
24.215.5
11.715.620.323.926.6
2009
22.6
16.142.8
23.328.016.7
21.433.319.750.1
9.338.3
23.022.2
19.821.522.025.923.6
Source: ELMS 1998, ELMPS 2006 and SYPE 2009.
Figure 11.1: Standard Unemployment Rates by Age & Sex, Ages, 15-29, 2009
Source: SYPE 2009 Source: SYPE 2009
Figure 11.2: Participation and Employment Rates by Age and Sex, Ages 15-29, 2009
Standard Broad
1009080706050403020100
Male ParticipationMale Employment
Female ParticipationFemale Employment
Age15 16 17 18 19 20 21 22 23 24 25 26 27 28 29
45
40
30
25
20
15
10
5
015 16 17 18 19 20 21 22 23 24 25 26 27 28 29
Age
Pece
nt
Pece
nt

Egypt Human Development Report 2010 { 151 }
ondary school graduates start looking for work. Rates
shoot up for women at that age, reaching a peak at age
21, where they are twice as high as those of men of the
same age. Both male and female unemployment rates
decline after that age, but the decline for men is much
more rapid.
These trends by sex reveal very different paths into
the labor market for young men and young women.
As shown in Figure 11.2, the vast majority of young
men end up in some type of employment by age 29,
with employment rates in the vicinity of 92% at that
age. For women, the maximum employment rate
of 15% is reached at 24 and then it stops rising, as
women increasingly transition into marriage. Maxi-
mum participation rates for women are as high as
23%, also reached at age 24. This suggests that while
most unemployed men eventually find jobs, a large
fraction of unemployed women never actually become
employed, but simply move from unemployment to
economic inactivity. A comparison of the participa-
tion and employment curves for women in Figure
11.2 suggests that almost half of economically active
women between the ages of 21 and 27 are actually
searching for work rather than working. Thus young
women have a short window between school comple-
tion and marriage in which at least some of them are
available for employment, and often unable to get it.
This window closes when other life course events like
marriage take them out of the job market altogether.
The jobless rate shows the consequences of low
employment rates among the out-of-school popu-
lation irrespective of the individual’s desire to par-
ticipate in the labor force. As such the jobless rate
captures how much of the not-in-school population
is either unemployed or inactive.4 As shown in Table
11.2, like the broad unemployment rate, the youth
jobless rate declined from about 59% in 1998 to 53%
in 2006 and then climbed back to just over 60%
in 2009. While the jobless rate among young men
exhibited the same U-shaped curve, the increase from
2006 to 2009 was much more limited than for young
women. The male jobless rate declined by a third
from 32% in 1998 to 21% in 2006, and then increased
by only 3 percentage points to 24% in 2009. In con-
trast, female joblessness declined much more mod-
estly in the 1998 to 2006 period from about 86% to
81%, and then rose during the crisis period to reach
87% in 2009, a level that exceeds where it was in
1998. As shown in Figure 11.3, joblessness for men,
like unemployment reaches a peak at age 21 and then
declines rapidly after that. Female joblessness peaks
at age 20, but the subsequent decline is very gradual,
with the jobless rate never going below 85%.
Figure 11.3: Jobless Rates by Age and Sex, Ages 15-29, 2009
100908070605040302010
0
Source: SYPE 2009
AllBy SexMalesFemalesBy Age15-1920-2425-29By Age and SexMales 15-19Females 15-19Males 20-24Females 20-24Males 25-29Females 25-29By ResidencyUrbanRuralBy Household Wealth QuintileLowestSecondMiddleFourthHighest
1998
58.6 32.385.5 61.664.049.7 31.789.544.185.718.281.6 57.059.6
59.158.559.358.956.7
2006
52.7
21.281.4
55.660.043.3
23.982.132.683.19.079.1
53.352.3
47.951.254.256.355.0
2009
60.1 23.787.5 58.763.956.9 28.588.430.488.313.286.3 56.262.3 64.762.159.058.154.2
Jobless Rate
Table 11.2: Youth Jobless Rates by Selected Characteristics, 1998, 2006, 2009, Ages 15-29
Source: ELMS 1998, ELMPS 2006, SYPE 2009
Males Females
15 16 17 18 19 20 21 22 23 24 25 26 27 28 29
Age
Perc
ent

Egypt Human Development Report 2010{ 152 }
Unlike unemployment, which appears to increase
with increasing levels of wealth, joblessness does
not exhibit a clear relationship with household
wealth. As shown in Table 11.2, the jobless rate does
not exhibit a clear relationship with wealth in 1998,
increases with wealth in 2006 and decreases with
wealth in 2009. There is also stable rural-urban dif-
ferential in joblessness
Besides being strongly differentiated along gender
lines, the transition to employment is also differen-
tiated along educational lines. Another well-known
feature of open unemployment in Egypt is that it is
a phenomenon that primarily affects educated youth.
As shown in Figure 11.4, unemployment rates are very
low for less educated young men and women. At the
secondary level, they jump up for both sexes, with the
highest unemployment rates in 2009 being recorded
for post-secondary institute graduates followed by
university graduates for men and by technical second-
ary graduates for women. Unemployment rates for
males at all education levels except university gradu-
ates fell significantly from 1998 to 2006 and then
increased from 2006 to 2009. Surprisingly, male
university graduates experienced a decline in unem-
ployment from 2006 to 2009. Unemployment rates
among all educated females actually fell from 2006 to
2009, but this is almost surely due to discouragement
Illiterate
Reads and Writes
Elementary School
Middle School
General High School
Technical High School
Post -Secondary Institute
University and Above
Males
Figure 11.4: Standard Unemployment Rates by Educational Attainment and Sex, Ages 15-29, 1998, 2006, 2009
Females
Illiterate
Reads and Writes
Elementary School
Middle School
General High School
Technical High School
Post -Secondary Institute
University and Above
Illiterate
Reads and Writes
Elementary School
Middle School
General High School
Technical High School
Post -Secondary Institute
University and Above
Source: ELMS 1998, ELMPS 2006, SYPE 2009
Figure 11.5: Jobless Rates by Educational Attainment and Sex, Ages 15-29, 1998, 2006, 2009
Source: ELMS 1998, ELMPS 2006, SYPE 2009
Illiterate
Reads and Writes
Elementary School
Middle School
General High School
Technical High School
Post -Secondary Institute
University and Above
FemalesMales
Educ
atio
nal A
ttain
men
tEd
ucat
iona
l Atta
inm
ent
0 20 40 60 80 1000 20 40 60 80 100
0 20 40 60 80 1000 20 40 60 80 100
199820062009
199820062009

Egypt Human Development Report 2010 { 153 }
rather than increased employment creation.
Why are unemployment rates so much higher for
educated young people than they are for the less edu-
cated, who are presumably less skilled, and why is
there such a sharp break at the secondary level? The
answer lies in the type of jobs each group expects to
get. Because of a history of being eligible for public
sector employment, new entrants with secondary
education and above expect to obtain formal jobs and
are therefore willing to remain jobless while search-
ing for such jobs. They are thus the ones captured
among the ranks of the unemployed. The less edu-
cated have virtually no history of formal employment
in Egypt and therefore little expectation of it. Less
educated men transition relatively quickly into the
informal economy right after or even before they drop
out of school, whereas few less educated women seek
paid employment in the first place. It is the prospect
of finding formal employment that leads educated
young people to join the ranks of the unemployed.
This insight can be used to advance an explanation
for why unemployment rates among educated youth
have been falling recently. With the prospects of pub-
lic sector employment declining significantly in recent
years and opportunities in the formal private sector
remaining limited, the chances of obtaining formal
employment declined significantly. The initial reac-
tion to these developments on the part of educated
young people was probably to search harder and
longer, leading to rising unemployment rates. How-
ever, as it became clear that the government was no
longer hiring and that formal private sector jobs are
even harder to get, the main response on the part of
educated men was to increasingly curtail their search
and take up jobs in the informal economy. Educated
women, on the other hand, responded to the drying
up of opportunities in the public sector by increas-
ingly withdrawing from or not entering the labor
force altogether. Both of these responses would have
the ultimate effect of reducing the unemployment
rate for educated workers.
Examining the data on joblessness rates provides
some support for this hypothesis. First male jobless
rates, like unemployment rates, increase with educa-
tional attainment, but the difference between more
educated and less educated workers is not as large.
Note also that jobless rates declined for young males
from 1998 to 2006 for all educational categories, but
most noticeably for those with technical secondary and
post-secondary education. This decline most probably
reflects the realization on the part of young educated
males that formal sector work is not forthcoming and
that it is best to take up informal employment rather
than remain jobless. The slowing economy resulting
from the onset of the world financial crisis in 2008 led
to an increase in male joblessness for all educational
categories except university graduates, which is the
same trend observed for unemployment.
In the case of females the patterns of joblessness dif-
fers significantly from the pattern of unemployment.
Whereas unemployment increases significantly with
education, joblessness declines with education, start-
ing with the achievement of secondary education.
Again, unlike unemployment rates for educated
young women, which tended to decline from 1998
to 2009, jobless rates tended to increase, suggesting
greater discouragement as more women opt not to
participate.
To provide evidence in favor of the hypothesis that
unemployment reflects in part young people’s expec-
tations for getting a formal job, the types of jobs that
educated young people have been getting upon entry
into the labor market over time are examined. To do
that, first jobs are subdivided into five classes:
(i) public sector jobs;
(ii) formal private sector wage and salary work;
(iii) informal but regular private sector wage and
salary work;
(iv) irregular private sector wage work, and
(v) self-employment and unpaid family work.5
The distribution of educated new entrants by sex and
by year of birth and type of first job is shown in Figure
11.6. The figures starts with those born in 1978 and
who would therefore have entered the labor market
around 2000, well after the major slowdown in gov-
ernment hiring had occurred. Despite this, a decline
in the probability of public sector work can be clearly
seen for both males and females. Almost one fifth of
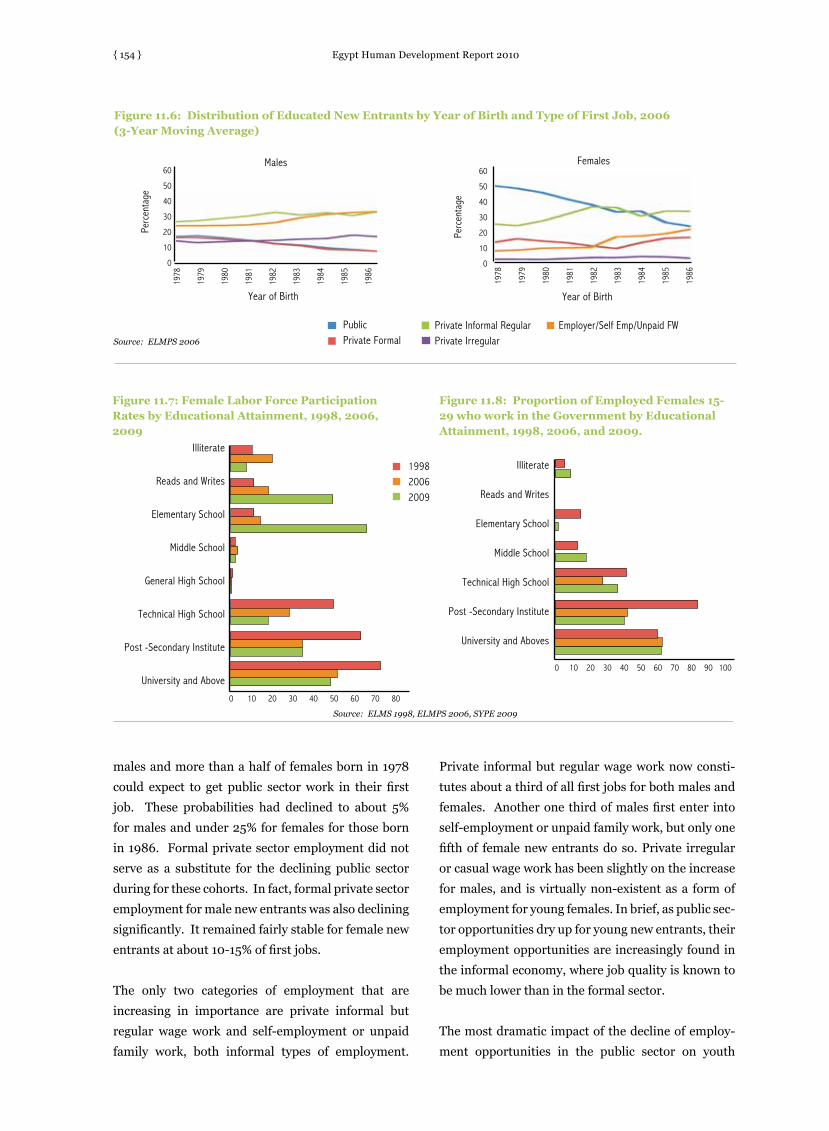
Egypt Human Development Report 2010{ 154 }
males and more than a half of females born in 1978
could expect to get public sector work in their first
job. These probabilities had declined to about 5%
for males and under 25% for females for those born
in 1986. Formal private sector employment did not
serve as a substitute for the declining public sector
during for these cohorts. In fact, formal private sector
employment for male new entrants was also declining
significantly. It remained fairly stable for female new
entrants at about 10-15% of first jobs.
The only two categories of employment that are
increasing in importance are private informal but
regular wage work and self-employment or unpaid
family work, both informal types of employment.
Private informal but regular wage work now consti-
tutes about a third of all first jobs for both males and
females. Another one third of males first enter into
self-employment or unpaid family work, but only one
fifth of female new entrants do so. Private irregular
or casual wage work has been slightly on the increase
for males, and is virtually non-existent as a form of
employment for young females. In brief, as public sec-
tor opportunities dry up for young new entrants, their
employment opportunities are increasingly found in
the informal economy, where job quality is known to
be much lower than in the formal sector.
The most dramatic impact of the decline of employ-
ment opportunities in the public sector on youth
Figure 11.7: Female Labor Force Participation Rates by Educational Attainment, 1998, 2006, 2009
Illiterate
Reads and Writes
Elementary School
Middle School
General High School
Technical High School
Post -Secondary Institute
University and Above
Figure 11.8: Proportion of Employed Females 15-29 who work in the Government by Educational Attainment, 1998, 2006, and 2009.
Source: ELMS 1998, ELMPS 2006, SYPE 2009
Figure 11.6: Distribution of Educated New Entrants by Year of Birth and Type of First Job, 2006 (3-Year Moving Average)
Source: ELMPS 2006
1978
1979
1980
1981
1982
1983
1984
1985
1986
60
50
40
30
20
10
0
Perc
enta
ge
Private Informal RegularPrivate Irregular
Employer/Self Emp/Unpaid FW
1978
1979
1980
1981
1982
1983
1984
1985
1986
60
50
40
30
20
10
0
Males Females
199820062009
0 10 20 30 40 50 60 70 80
Illiterate
Reads and Writes
Elementary School
Middle School
Technical High School
Post -Secondary Institute
University and Aboves
0 10 20 30 40 50 60 70 80 90 100
Perc
enta
ge
Year of Birth Year of Birth
PublicPrivate Formal

Egypt Human Development Report 2010 { 155 }
employment is undoubtedly its effect on young wom-
en’s rate of participation in economic activity. As
shown in Figure 11.7, the participation rate of young
women used to increase significantly once secondary
education was achieved, and it continued rising from
that point on. But as the figure shows clearly, the
rates of participation among educated young women
have been falling sharply since 1998. For example,
young women with technical high school education
had rates of participation of 51% in 1998. These rates
have fallen steadily to 18 % in 2009. Similar, albeit
less steep, declines in participation are observed for
more educated women. Thus the one factor that has
strongly driven increases in female labor force partic-
ipation in Egypt, namely education, is getting weaker
at a time when more young women are achieving
these education levels.
A comparison of Figure 11.7 with Figure 11.8, which
shows the percentage of employed women working
for the government over time by educational attain-
ment, provides a straightforward explanation for
these declining participation rates. Essentially as the
chances of getting government jobs declined for edu-
cated women, their participation rates also declined.
Further investigation reveals that the majority of
young women who worked in government in 1998
had permanent appointments whereas by 2009 the
vast majority only had temporary employment con-
tracts, providing less incentive to participate.
Why are these educated young women dropping
out of the labor force altogether rather than seek-
ing employment in the informal economy like their
male counterparts? A number of possible explana-
tions can be advanced for these stark gender differ-
ences in response to a drop in public sector employ-
ment. First, employment in the government is much
more egalitarian along gender lines than employment
in the private sector. While women can expect to be
treated similarly to men with similar qualifications
and experience in the government, they suffer from
a large gender gap in wages and opportunities for
advancement in the private sector.6 Secondly, while
women can expect to have lifetime careers in the pub-
lic sector, women employed in the private sector tend
to quit such employment at marriage, giving them a
relatively short employment horizon. Finally, high
levels of occupational segregation in the Egyptian
labor market essentially mean that women face large
barriers to entry to both wage and self-employment
even in the informal economy.7
why is eDucation not Paying off for young PeoPLe any More?There is no question that there have been significant
gains in levels of educational attainment for young
people in recent years. As shown in Figure 11.9, aver-
age years of schooling increased steadily in Egypt in
recent years. Egyptians born in 1985 has on average
over 10 years of education, as compared to only 4
years of education for those born in 1950. We can
also notice a considerable narrowing of the gender
gap as educational attainment increased, with the dif-
ference in the male and female means going from 3
years for those born in 1950 to one and a half years
for those born in 1985.
Figure 11.9: Average Years of Schooling by Year of Birth and Sex, Four-Year Moving Average
Source: ELMPS 2006
MalesFemalesAll
Year of Birth
Aver
age
Year
s of
Sch
oolin
g
121110
9876543210
1940 1950 1960 1970 1980 1990

Egypt Human Development Report 2010{ 156 }
Despite these significant achievements in educational
attainment, there is growing concern among young
people and their families that the returns they get
for their education in the labor market are declining
rapidly. The falling returns to education take many
forms, including lower monetary returns in the form
of earnings, lower likelihood of obtaining formal
employment for a given level of education, and gener-
ally lower job quality. Some argue that falling returns
are inevitable as more people acquire education and
the supply of educated workers rises. Greater com-
petition among these workers is bound to reduce the
premium workers get for their education. This argu-
ment implicitly assumes that demand for education
and skills grows more slowly than the supply of edu-
cation, which is not necessarily the case in a growing
globalizing economy. Other parts of the world have
experienced significant increases in return to school-
ing as skill-intensive technical progress has raised
demand for educated labor, notwithstanding the
increase in the supply of educated labor. The ques-
tion is why is such a dynamic not occurring in Egypt?
One obvious answer to this question is that it is not
simply an issue of the quantity of education supplied
and demanded, but of the type and quality of educa-
tion. The demand for skills is probably increasingly
as rapidly in Egypt as it is elsewhere in the world in
response to globalization and technological change,
but the question is whether the Egyptian education
system is supplying these skills to the labor market.
For decades the majority of educated workers in Egypt
were headed for employment in the public sector
where what mattered to get a job was not one’s skill
level but one’s formal credentials. Responding to the
signals they obtained from the labor market, parents
strove to obtain these credentials for their children by
investing in their ability to pass official exams and get
degrees.8 The educational system in turn was shaped
over many years by the same goal of maximizing the
number of students it graduates at all levels, with little
emphasis on what skills are actually learned and how
useful these skills are to the private job market. Now
that government employment has been curtailed,
Egypt continues to be saddled by an educational sys-
tem that produces large number of degrees with lim-
ited value in the private sector labor market.
Returns to education have not only declined in terms
of monetary remuneration, but also in terms of the
type and quality of job a young person is able to
obtain. As seen in Figure 11.6, there has been a sig-
nificant decline in the probability of obtaining either
public or private formal employment for young peo-
ple. The trend is even sharper for educated young
people who were highly dependent on government
employment in the past. Educated young people
are now relegated to jobs in the informal economy,
jobs they could have probably obtained with much
lower levels of education. For women, the returns
to education manifest themselves in their very abil-
ity to enter the paid labor market. Figure 11.7 shows
that participation rates increase sharply once women
complete secondary education. However, this pattern
of increasing participation with education is being
eroded as participation rates fall for educated women
in response to declining opportunities in government.
This implies that the declines in returns to education
Figure 11.10: Mean Job Quality by Education Attainment for Wage and Non-Wage Workers, 1998–2006
Source: Assaad, Roushdy and Rashed (2009)
No SchoolBasic EducationSecondaryPost SecondaryUniversity and Above
0.80
0.60
040
0.20
0.00
-0.20
-0.40
-0.60
-080
-1.001998 2006 1998 2006
Wage Workers Non Wage Worker
Egypt Human Development Report 2010 { 157 }
Box 11.1: Egyptian Youth Migration: Patterns, Aspirations and Motivations
Although many Egyptian youths aspire to migrate, few actually succeed to do so. According to SYPE, 15% of Egyptian youth
18-29 aspire to go live or work abroad, but only 1.6% had managed to do so (It should be kept in mind that the survey
covers young people currently living in Egypt at the time of the survey and thus only includes information on non-migrants
and return migrants.) It is by now well established that migration from Egypt is mostly made up of temporary migration
to other Arab countries, whereas the proportion of return youth migrants from European destination countries is almost
negligible, perhaps because those who go there do not return.
Gender is the most important determining factor for both migration and migration aspirations. The proportion aspiring to
migrate varies from 27% for men to 6% for women. Education appears to be another powerful motivator for migration
for both young men and young women. The proportion aspiring to migrate increases steadily with education and ranges
from 4.5% for those with no formal school certificates to 20.9% for those with university education. The difference across
educational levels is more pronounced for women than for men, ranging from 1% for those without certificates to 12.5%
for those with university education. Younger youths tend to have somewhat higher migration aspirations than older
youths. Urban slum residents have higher migration aspirations than either rural or urban non-slum residents, but the
differences are not large. Finally, there is no systematic variation in migration aspirations by household wealth for young
men, though they do increase steadily with wealth for young women.
Like migration aspirations, actual migration rates also vary strongly by gender, with 2.5% of men 18-29 having migrated and
returned but only 0.9% of women. Like migration aspirations, actual migration rates increase significantly with education.
University-educated young men are nearly 3.5 times as likely to migrate as men with no school certificate, and university
educated women are more than 8 times as likely to migrate than their counterparts with no school certificate. However, in
contrast to migration aspirations, the ability to migrate also depends strongly on age, place of residency and household
wealth, and this dependence differs significantly by gender. Men 24 and older are much more likely to migrate than
younger men, but there is practically no difference in migration rates by age for women. Similarly, men from urban slums
and from rural areas are much more likely to migrate than men from urban non-slum areas, but women from urban non-
slum areas are more likely to migrate than women from either urban slums or rural areas. In fact, migration rates from the
urban non-slum milieu are practically equal for men and women. Finally, both men and women from richer households are
more likely to migrate than their counterparts from poorer households, with differences being much larger for women.
The increase in both migration aspirations as well as actual migration with educational attainment reflects the role of
education in raising young people’s professional expectations and aspirations besides its enabling role in facilitating
migration. Whereas the fact that migration aspirations don’t depend strongly on wealth and urban-rural residency, but that
migration does, suggests that, unlike education, these factors contribute more to young people’s ability to realize their
aspirations rather than to shaping these aspirations themselves.
Turning to the motivations for migration that both aspiring and actual migrants report, the distinction must be made between
push factors relating to conditions in Egypt and pull factors relating to countries of destination. Again, the most striking
finding is the very different motivations reported by young men and women who actually migrated and returned. With
respect to motivations related to conditions in Egypt, male return migrants mention the absence of job opportunities
(51%), poor living conditions (33.9%), the relatively low income in Egypt compared to other countries (33.0%), the need
to assist their families financially (14.7%), and the need to earn money (12.7%) - The figures don’t add up to 100%
because each individual can report more than one motivation. Female return migrants almost always mention family
related reasons for migrating, including migrating with family (62.9%) and family reunification (40.4%). With regards to
motivations relating to destination countries, male migrants are more likely to mention job-related reasons, like having a
job offer (70.9%), whereas female return migrants mention having relatives there (77.1%). Equal proportions (10%)
mention wanting to live abroad.
Aspiring male migrants are also driven primarily by economic motivations. When asked about what pull factors motivate them
to migrate, almost 95% mentioned making money. The motivations of female aspirants were much more diverse.
Egypt Human Development Report 2010{ 158 }
for women are even sharper than would be ascer-
tained from wage data.
A recent research project implemented by the Popu-
lation Council has attempted to operationalize the
concept of job quality in the Egyptian economy by
incorporating various dimensions associated with the
quality of jobs in a single index of job quality The
index includes aspects of jobs such as formality, earn-
ings, the quality of the workplace, overemployment
and underemployment.9 One of the most important
results of this research is that although job quality in
the Egyptian economy as a whole remained fairly con-
stant over time, it has not kept up with the increasing
levels of education of the workforce. Consequently,
there has been a significant deterioration in job qual-
ity over time correcting for level of education. As
shown in Figure 11.10, job quality has deteriorated
from 1998 to 2006 for workers at all education levels
except illiterates and post-secondary graduates for
wage and salary workers, and all but post-secondary
graduates for non-wage workers. The worst deterio-
ration in job quality was experienced by workers with
basic education and technical secondary degrees.
Faced with such falling returns to education in Egypt,
is there a risk that young people and their parents will
reduce their investments in education in the future?
With declining rates of participation for educated
women, are investments in girls’ education in par-
ticular threatened? While such a risk is present, it is
not very likely given the large social value the Egyp-
tian population places on education. This social value
is clearly manifested in the marriage market, where
both sides strongly value a more educated spouse.10
The risk of reduced investment in education is also
belied by the large out-of-pocket expenditures Egyp-
tian families make in private tutoring to ensure the
success of their children in the educational system.
Given this reality, how can public policy ensure
that the important public and private investments
Egyptian society makes in education produce bet-
ter returns in the labor market and in the economy
in general? The answer almost certainly lies in the
need for significant institutional reforms in the edu-
cation system. The aim of these institutional reforms
would be to better align the outputs of the educational
system with the skills demanded by the labor market.
This can be done in a number of ways:
• First, parents must get the right signals from the
labor market as to what skills are in demand and
Box 11.1: continued...
They include learning new things and increasing knowledge and experiences (44%), making money (35%), desire to see
other countries (26%)and wanting to live abroad (14%). Regarding push factors, two thirds of aspiring males migrants
mentioned the lack of job opportunities in Egypt and 44% mentioned the lowness of income. As such the motivating push
factors for aspiring migrants are almost identical to those of males who actually migrated. This is not the case for females.
Females aspiring migrants look very much like their male counterparts in terms of their motivating push factors, but, as
we saw above, male and female actual migrants look very different. This suggests that female aspiring migrants are much
less able to act on their own motivations, but that their migration is highly dependent on the migration decisions of male
family members.
Studies on the impact of international migration have shown that migration can have significant welfare implications for the
households left behind as well as for the migrant him or herself. Roushdy et al. have shown that migration contributes
to a significant reduction in poverty for the migrant sending household. Elbadawy and Assaad show that migration and
remittances contribute to increased schooling and reduction of child labor. Assaad et al. show that migration enables
unmarried young men to significantly reduce their age of marriage, contributing as much as a good job in Egypt.
To conclude, note that youth migration from Egypt is a highly differentiated phenomenon along gender, education, and class
lines. It is still quite a rare phenomenon although a fairly large fraction of youth, especially young men, aspire to migrate.
Migration aspirations are strongly driven by the higher professional expectations that come with education, but being to
realize these aspirations depends on social class and the social, economic and informational resources that come with it. Source: Ragui Assaad, Backgound Paper to EHDR 2010

Egypt Human Development Report 2010 { 159 }
• well rewarded. For years these signals have been
confused by widespread public sector involve-
ment that encouraged parents to invest in cre-
dentials rather than skills;
• Second, parents need to be able to translate these
signals into the appropriate education choices
for their children. Currently this ability is con-
strained by a limited set of choices in a centrally
controlled system of public schools;
• Third, schools and other education providers
must have the incentive, flexibility and account-
ability mechanisms to respond effectively to
parental demand and market forces. This can be
done by tying their rewards to their performance
in some way. Nowhere is this structure of incen-
tives and accountability more necessary than
in the technical secondary school system that
graduates in excess of 600,000 students per year
with skills of dubious utility in the job market.
the occuPationaL outLook facing young PeoPLe toDay
There is no question that young people in Egypt today
are facing severe challenges in making the transition
from school to work, with an increasing number fac-
ing uncertain prospects in the informal economy and
others simply opting out of the workforce altogether.
Although they are increasingly educated, the returns
to this education are falling in the face of serious
questions about the quality of education they receive.
However, are there bright spots in the labor market
in the form of occupations that are growing rapidly
and have the potential to absorb more new entrants?
An evaluation of the occupational outlook facing
young people in Egypt today analyzes occupational
data from three years of the official Labor Force Sur-
vey, namely 2000, 2004 and 2007. The advantage of
using these surveys over the sources of data used ear-
lier is that they have much larger sample sizes, allow-
ing for a more accurate and detailed classification
of occupations over time. 130 different occupational
classes in each of the three years for which there is
data are considered.11 In the analysis, occupations are
ranked based on their rate of growth from 2000 to
2007 and then classified in four categories along this
criterion, namely high relative growth, medium high
relative growth, medium low relative growth, and low
relative growth.12
In order to highlight numerically important occupa-
tions that are contributing a large number of jobs in
absolute terms, ranked occupations are also ranked
along their absolute growth from 2000 to 2007 and
that ranking is broken down in the same four catego-
ries used for relative growth. To compare the growth
in the 2000-04 period with that of the 2004-07
period, occupations are identified that (i) accelerated
their relative growth from 2000-04, (ii) those than
remained in the same relative growth category and
(iii) those that decelerated. The summary results are
shown in Table 11.3.

Egypt Human Development Report 2010{ 160 }
The fastest growing occupations that also contrib-
uted high levels of absolute growth from 2000 to
2007 include construction workers (building frame
and building finishing workers), street vendors, crop
and animal producers, non-specialized farmers,
and somewhat surprisingly, a class of government
employees, customs and tax collectors. These occu-
pations grew at faster than five percent per annum
and each of them added more than 20,000 workers
per year. Two other occupations that grew a bit more
slowly but also added significant numbers of workers
are drivers of motor vehicles and specialized farm-
ers. Of all of these occupations, the growth of street
vendors, crop and animal producers, and farmers
has slowed from 2000-04 to 2004-07, but the other
occupations have accelerated their growth or at least
remained stable.
The pattern of fast growing occupations is somewhat
predictable given the construction boom that Egypt
experienced in the 2000 to 2007 period. Building
trade workers are the twenty-first and twenty-second
fastest growing occupations among the 130 being
considered. The growth in the ranks of tax collectors
may seem surprising given the virtual freeze on gov-
ernment hiring, but it may have something to do with
the tax reform that the Ministry of Finance has intro-
duced recently. The data indicate that the growth
has clearly occurred between 2004 and 2007. Such
growth is undoubtedly a one-off affair and is unlikely
to be reproduced in the future. The growth of street
vendors, crop and animal producers and even farm-
ers may indicate the growth of marginal occupations
where surplus labor tends to accumulate when it does
not find outlets elsewhere in the economy. Interest-
ingly, the only group of professionals or associate
professionals included in this high absolute growth
category is the tax collectors.
To move to a group of occupations that grew rapidly
or moderately and had medium high absolute growth
(the second row of Table 11.3). Each of these occupa-
tions added something between five and 20,000 jobs
per year from 2000 to 2007. The fast growing group
includes potters and glassmakers, carpenters, per-
sonal service workers, textile machine operators, food
machine operators, security workers. The medium
high relative growth group includes painters, direc-
tors and chief executives in government, food pro-
cessing workers, housekeeping and restaurant work-
ers, building caretakers, and primary and pre-primary
teachers. This set of fast growing occupations thus
includes some craft occupations, like potters, paint-
ers and carpenters, some manufacturing workers like
food processing and textile workers, some profession-
als like teachers, and some service workers.
Finally, there is a fairly large group of fast growing
occupations that are adding fewer than five thou-
sand jobs per year. These include some of the pro-
fessional occupations, like computer associates, sales
occupations and a number of manufacturing work-
ers and machine operators. One category of profes-
sional occupations that appears in a number of places
as being fast growing or moderately fast growing is
teachers at the primary and pre-primary levels. In an
indication of the expansion of the private economy,
the third fastest growing occupation is general man-
agers in the private sector.
There appears to be a positive relationship between
unemployment (by either the standard or broad mea-
sures) and household wealth quintiles (Table 11.1).
For example, the standard unemployment rate rises
from about 12.5% for young people in the lowest
wealth quintile in 2009 to nearly 20% for people in
the two highest wealth quintiles. A similar increase
is clear in other years and in the broad unemploy-
ment measure. This may appear paradoxical at first
as many associate high unemployment with poverty.
However, it is entirely consistent with the interpre-
tation provided here relating unemployment to the
expectation of obtaining formal employment. Poor
youth can ill afford to remain unemployed for long and
therefore give up on the idea of getting formal employ-
ment sooner and take up whatever employment they
can find. As a result, their unemployment rates are
lower than young people from richer households.
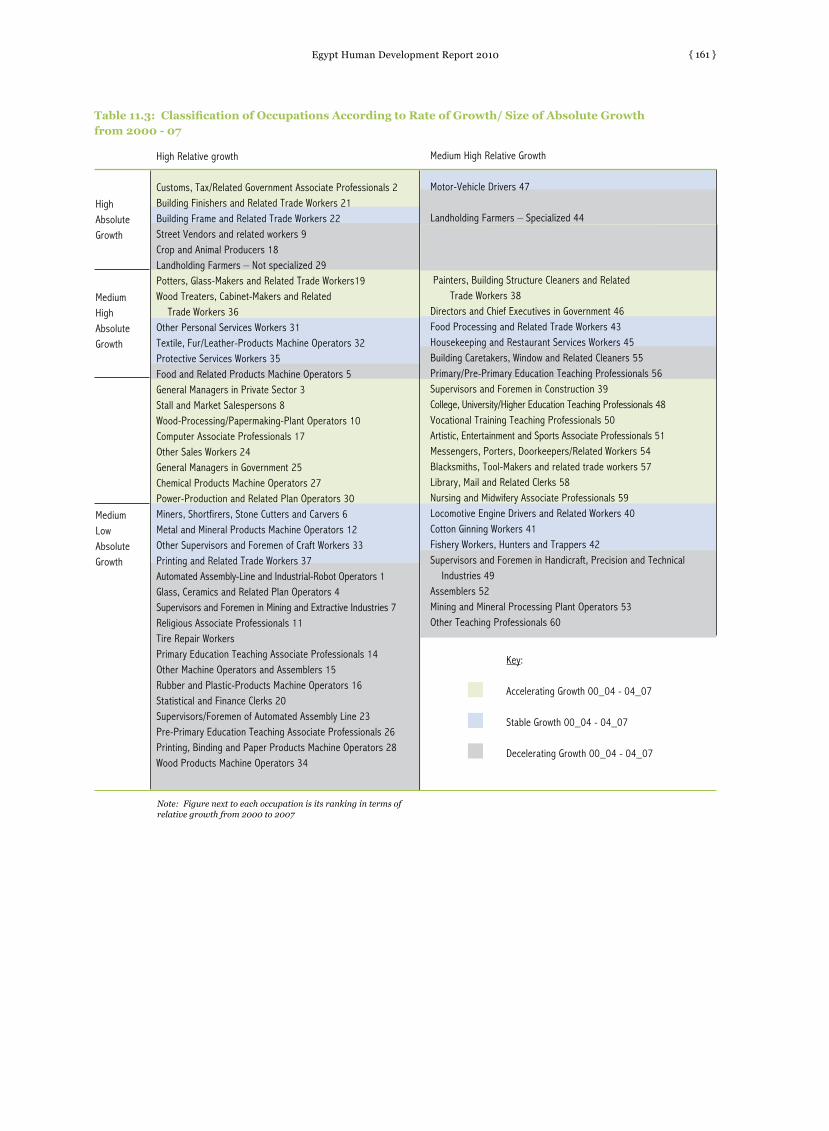
Egypt Human Development Report 2010 { 161 }
Table 11.3: Classification of Occupations According to Rate of Growth/ Size of Absolute Growth from 2000 - 07
High Relative growth Customs, Tax/Related Government Associate Professionals 2Building Finishers and Related Trade Workers 21Building Frame and Related Trade Workers 22Street Vendors and related workers 9Crop and Animal Producers 18Landholding Farmers – Not specialized 29Potters, Glass-Makers and Related Trade Workers19Wood Treaters, Cabinet-Makers and Related Trade Workers 36Other Personal Services Workers 31Textile, Fur/Leather-Products Machine Operators 32Protective Services Workers 35Food and Related Products Machine Operators 5General Managers in Private Sector 3Stall and Market Salespersons 8Wood-Processing/Papermaking-Plant Operators 10Computer Associate Professionals 17Other Sales Workers 24General Managers in Government 25Chemical Products Machine Operators 27Power-Production and Related Plan Operators 30Miners, Shortfirers, Stone Cutters and Carvers 6Metal and Mineral Products Machine Operators 12Other Supervisors and Foremen of Craft Workers 33Printing and Related Trade Workers 37Automated Assembly-Line and Industrial-Robot Operators 1Glass, Ceramics and Related Plan Operators 4Supervisors and Foremen in Mining and Extractive Industries 7Religious Associate Professionals 11Tire Repair WorkersPrimary Education Teaching Associate Professionals 14Other Machine Operators and Assemblers 15Rubber and Plastic-Products Machine Operators 16Statistical and Finance Clerks 20Supervisors/Foremen of Automated Assembly Line 23Pre-Primary Education Teaching Associate Professionals 26Printing, Binding and Paper Products Machine Operators 28Wood Products Machine Operators 34
HighAbsoluteGrowth Medium HighAbsoluteGrowth
Medium LowAbsoluteGrowth
Key:
Accelerating Growth 00_04 - 04_07
Stable Growth 00_04 - 04_07
Decelerating Growth 00_04 - 04_07
Note: Figure next to each occupation is its ranking in terms of relative growth from 2000 to 2007
Medium High Relative Growth
Motor-Vehicle Drivers 47
Landholding Farmers – Specialized 44 Painters, Building Structure Cleaners and Related Trade Workers 38Directors and Chief Executives in Government 46Food Processing and Related Trade Workers 43Housekeeping and Restaurant Services Workers 45Building Caretakers, Window and Related Cleaners 55Primary/Pre-Primary Education Teaching Professionals 56Supervisors and Foremen in Construction 39College, University/Higher Education Teaching Professionals 48Vocational Training Teaching Professionals 50Artistic, Entertainment and Sports Associate Professionals 51Messengers, Porters, Doorkeepers/Related Workers 54Blacksmiths, Tool-Makers and related trade workers 57Library, Mail and Related Clerks 58Nursing and Midwifery Associate Professionals 59Locomotive Engine Drivers and Related Workers 40Cotton Ginning Workers 41Fishery Workers, Hunters and Trappers 42Supervisors and Foremen in Handicraft, Precision and Technical
Industries 49Assemblers 52Mining and Mineral Processing Plant Operators 53Other Teaching Professionals 60

Egypt Human Development Report 2010{ 162 }
Endnotes1 The three surveys used are the Egypt Labor Market Survey of 1998 (ELMS 98) and the Egypt Labor Market Panel Survey
of 2006 (ELMPS 06), carried out by the Economic Research Forum in cooperation with CAPMAS, and the Survey of Young People in Egypt of 2009 (SYPE 09), carried out by the Population Council in cooperation with the Information and Decision Support Center of the Council of Ministers.
2 There is still a small proportion of young people in Egypt (about 11 percent in 2006) who have never gone to school. These young people are almost never unemployed. If they enter the labor force at all, they usually transition to work early and generally work either in agriculture or in the informal economy.
3 International Labour Office (2008). Global Employment Trends for Youth, October 2008. Geneva: ILO. The figure for Egypt is from the Egyptian Labor Force Sample Survey. The UN uses a 15-24 age range to define youth, as compared to the 15-29 age range used throughout this chapter.
4 Defined in this way, joblessness includes all forms of non-participation other than studying. It therefore could include mandatory military service for males.
5 A wage and salary job in the private sector is considered formal if the job holder has either a legal contract or social insurance coverage. It is considered regular if the job is either permanent or temporary and irregular if it is intermittent or seasonal. Another term used to describe irregular job is “casual”.
6 Ragui Assaad and Melanie Arntz (2005). “Constrained Geographical Mobility and and gendered labor market outcomes under structural adjustment: Evidence from Egypt. World Development 33(3): 431-454.
7 Ragui Assaad and Fatma El-Hamidi (2009) ““Women in the Egyptian Labor Market: An Analysis of Developments, 1988-2006. In The Egyptian Labor Market Revisited. Ragui Assaad (ed.). Cairo: American University in Cairo Press, pp. 219-257.
8 Djavad Salehi Isfahani and Navtej Dhillon (2008) “Stalled Youth Transition in the Middle East: A Framework for Policy Reform.” Middle East Youth Initiative Working Paper No. 8. Wolfensohn Center for Development at Brookings and Dubai School of Government.
9 See Ragui Assaad, Rania Roushdy and Ali Rashed 2009. “Measuring and Operationalizing Job Quality in Egypt.” The Population Council. Gender and Work in the MENA Region Working Papers Series. Number 1, Cairo. Egypt.
10 Asmaa Elbadawy 2008.11 We use the three-digit level of the Occupational Classification System developed by CAPMAS in 1996. This is the
classification that CAPMAS used in the 2000, 2004 and 2007 Labor Force Surveys. This is a variant of the International System of Occupational Classification (ISOC -88). To the extent possible, we used the same labels as in ISOC 88.
12 Occupations that grew faster than the mean growth rate plus one half a standard deviation in 2000 to 2007 are classified in the high growth rate category. Those whose growth was between the mean and the mean plus one half standard deviation were classified as medium high. Those with growth rates between the mean and the mean minus one half standard deviations were classified as medium low. Finally those with growth rates below the mean minus one half a standard deviation were classified in the low relative growth category. The simple average growth rate for the 130 occupations from 2000 to 2007 was 1 percent per annum. The high growth category grew faster than 5 percent per annum and the slow growth category grew slower than -4 percent per annum.

{ 163 }
Chapter Twelve
It is estimated that 600,000 new entrants seek to join the labor market annually. Given the current level of skill sets made avail-able by the education system in Egypt, the formal private and ser-
vices sectors may not be encouraged to absorb the numbers required to reduce unemployment, especially among young people, although some recent evidence suggests a decline in youth unemployment (see Chapter Eleven). Nevertheless, there is evidently a skills mismatch that has yet to be fully addressed. The reality is that neither higher education nor technical and vocational education and training (TVET) have offered a critical level of skill enhancement that qualifies young people in the search for jobs in the formal economy. The informal sector is perhaps a larger-scale employer that is more tolerant to the relatively poorer skills of those who frequently resort to TVET — the lower income brackets with lower academic abilities — but it generally offers lesser quality jobs that come with low salaries, greater job instability, and more often than not, dated techniques limited to ill-equipped on-the-job training.
TECHNICAL AND VOCATIONAL EDUCATION AND TRAINING FOR YOUTH

Egypt Human Development Report 2010{ 164 }
examples are illustrative of the potential range of
proficiency gaps present in other sectors and sub-
sectors.
The labor market then lacks technical and skilled
workers in terms not only of number but also compe-
tence. This forces employers to either turn down pro-
duction orders at the level of the local and the export
markets or to refrain from expanding the business
scale. In either case, productivity is reduced while
potential manpower remains dormant, untrained and
untapped.
the vocationaL anD training Path There does exist a technical and vocational education
and training system for youth in Egypt. This public
system is disaggregated among a number of minis-
tries and government agencies that operate largely in
isolation of each other. Generally, skill output is poor
although some sporadic islands of excellence do exist,
notably in those courses offered by the armed forces.
However, this poor record is slowly changing due to
the creation of the ‘Industrial Training Council’ (ITC)
in 2006 in the Ministry of Trade and Industry (MOTI)
with a mandate to improve coordination and direc-
tion of all training-related entities, projects, and poli-
cies in the Ministry. More recently, two other councils
have already been created: The ‘Tourism Training
Council’ and the ‘Construction Training Council’.
Since the establishment of specialized councils, there
is the view that the existing but limited Supreme
Council of Human Resources Development should be
operationalized as the platform for the three councils
to provide policy directives and to assess overall TVET
system performance. Meanwhile, a ministerial com-
mittee established by the Prime Minister is developing
a TVET strategy which essentially builds on previous
studies, interventions, and an influential TVET policy
statement in 2002 (see below). It revolves around
the key elements of international best practice, inter
alia, adopting an integrated approach towards TVET
policy directives, funding of training delivery, and
inter-linkages between employers and TVET service
providers. The blueprint was endorsed by the Prime
Minister in late August of 2009. The committee is in
the process of formulating its ‘Action Plan’.
Unless Egyptian workers’ skills are upgraded in a
relevant and demand driven form, the national econ-
omy, notably in the industrial sector, will continue to
suffer from lack of appropriate technical skills and
adequate levels of productivity, thereby contribut-
ing to the paradox of unemployment in the midst of
unfilled job vacancies
The Egyptian education system offers two main edu-
cational tracks: One that is academic and the other
that is technical. The former leads typically to univer-
sity and the vocational route usually ends at the tech-
nical secondary school level, with a few exceptions
for those that manage to score above 70% to qualify
for higher education. Key challenges to the system
include the lack of enough linkages between the two
tracks in addition to the social stigma that comes with
the technical route and its label as a poor second-
chance option.
However, with globalization and the current pace of
technological development and market shifts, TVET
ceases to be an educational tool that targets youth
associated with relatively lower academic perfor-
mance or low socio-economic status. It has become
a cornerstone for development. International experi-
ence indicates that TVET lies at the core of the life-
long learning approach that is so necessary in volatile
economies and in a complex and competitive special-
ized environment. Technical and vocational train-
ing can also contribute to closing the gap between
an unproductive traditional curriculum and school
dropouts, and the increasingly technological skills
necessary for market-driven youth employment.
However, to date, the opportunity to make the most
of the large number of young people who would ben-
efit both themselves and the economy by acquiring
non-academic vocational proficiency has not been
grasped fully. The outcome of a survey illustrates
these problems within some sub-sectors of manufac-
turing in Egypt. Here, vocations gaps are reflected
primarily in electrical maintenance, mechanical
maintenance, electronic maintenance technicians,
electronic control process technicians, workshops
equipments’ operators, electrical welding techni-
cians, and boiler maintenance technicians.1 These

Egypt Human Development Report 2010 { 165 }
Table 12.1: TVET Systems and Providers
Source: ETES Report (2000). Note: All certificates are based on attendance and diplomas are only provided for training systems marked with an asterix.
Under the new labor legislation, which was passed
in Egypt in 2003, the law now includes the creation
of a training fund to be financed by a 1% levy on net
profits applicable to establishments employing 10
or more workers. It is housed within the Ministry of
Manpower and Migration. But the fund has not been
operational, as a number of firms have now debated
its constitutionality in courts of law.
the current tvet systeMAt present, basic technical and vocational education
is provided through the Ministry of Education (about
1584 technical and vocational schools) and the Min-
istry of Higher Education (47 Middle Technical Insti-
tutes/Technical Colleges). Additional ministries are
engaged in TVET provision with around 1200 voca-
tional centers belonging to the Ministries of Trade
and Industry2, Social Solidarity, Housing, Manpower
and Emigration, Agriculture, Health, and Culture.
Ministry/ Organization
Ministry of Manpower
Social Solidarity
TOMOHAR Ministry of Housing & Reconstruction
Agriculture
Localities
Industry
Military factories
Transportation &Communication
Awkaf
Training System1
Pre-vocational (juvenile)
Accelerated
Vocational GradingPre-vocational (juvenile)Vocational formationAccelerated &Productive FamiliesRehabilitationPre-vocational (companies)
Accelerated
RetrainingUpgradingUpgrading
Pre-vocationalAcceleratedPre-vocational AcceleratedApprenticeship*
AcceleratedPre-vocational UpgradingVoc. gradingRetrainingApprenticeship*
Voc. gradingApprenticeship*
Pre-vocationalAcceleratedUpgradingRetrainingVoc. gradingPre-vocational
Graduate Skill Level
Semi-skilled
Semi-skilled
Semi-skilledSemi-skilled
Semi-skilled
Semi-skilledSemi-skilled
Semi-skilled
Semi-skilledSkilled TechnicianDifferent levels acc. to the courseSemi-skilledSemi-skilledSemi-skilledSemi-skilledSkilled
Semi-skilledSemi-skilledacc to the courseSemi-skilledSemi-skilledSkilled
Semi-skilledSkilled
Semi-skilledSemi-skilledacc to the courseSemi-skilledSemi-skilledSemi-skilled
Duration (months)3
7m centre-based2m OJT14m centre based4m OJT12-24m OJT7-24m centre-based
6-10m centre-based
12-24 centre-based6-9 centre-based
4m centre-based2m OJT6m centre-based1-8m centre & OJT2-4m centre & OJT
9m centre-based4m centre-based9m centre-based2-9m centre-based11m centre-based21m OJT beside 1-2days in the centre4-6m centre-based6m centre-based1-3m centre-based6m enterprise-based6m centre-based12m centre-based24m enterprise-based24m enterprise-based12m centre-based + 2 years OJT24m enterprise-based7m centre-based4m centre based1-4m centre-based4-10m centre-based24m OJT24m centre-based
Egypt Human Development Report 2010{ 166 }
The system therefore includes technical secondary
schools and technical and vocational entities — as
presented in Table 12.1 —a few of which offer 3 and
up to 5 year diplomas, but most of which offer short-
term courses, such as technical colleges (previously
middle technical institutes and currently placed
within universities) and institutes. Although various
ministries target different groups or have different
focus areas, technical and vocational delivery often
overlaps with little if any common ground in train-
ing standards or certification requirements. Further,
the quality of the education offered is generally poor.
Although TVET providers cover a wide scope of spe-
cialties, the focus has been on industry as it is the
main sector that provides formal technical educa-
tional through an apprenticeship system. It also holds
the prospect of serving the vast majority of non-agri-
cultural private sector employers.
Failings of the Public Sector Programs
Several rounds of surveys have evaluated the current
TVET system in Egypt and arrived at similar conclu-
sions. Most TVET institutions have the following pro-
file:3
• They are publicly funded with no clear lines of
accountability as annual budgets are a factor of
the previous year’s expenditure rather than a
reflection of overall performance or enrollment
rates or even drop-out rates during study years/
training;
• They are disaggregated and lack clear standards
for curriculum development and training deliv-
ery as illustrated in the obsolete equipment used,
and neglect of the use of modern equipment that
might be available;
• They lack practical ‘hands on’ training require-
ments and the few practical training workshops
available are overcrowded and render such prac-
tical training virtually useless;
• They are supply- rather than demand-driven,
thereby often presenting a mismatch with actual
market needs. For example, there is a clear dis-
connect between the TVET system and industry,
the major market place for the system’s outputs.
• They are characterized by a failure of the edu-
cational and training programs to keep up with
prerequisites of ongoing technological develop-
ment, and excessive dependence on the theoreti-
cal parts of the curricula.
• They exhibit shortages of modern and advanced
specializations, discrepancies and disparities in
the qualifications and in the use of trainers lack-
ing proper technical, vocational and pedagogical
qualifications;
• Budget allocations are rarely sufficient for
equipment upgrade, for example, or in regard to
upgrade of overall quality;
• Frequently, compulsory military service disrupts
the training program of individuals at recruit-
ment age, but there are some exceptions if the
military assignment is to technical units aligned
with a specialization.
Private Sector Contributions
There are a limited number of private sector techni-
cal and vocational training centers, which typically
offer short-term training courses. Most of these cen-
ters offer courses that qualify firms for quality related
certification. The centers tend to be relatively well
organized, with market driven curricula, trainers
with reasonable technical and pedagogical capacity,
and modular training courses. Clear rules govern the
arrangements, with transparent criteria for those who
should get such training and what should comprise
such training courses as well as the expected outcome
of receiving such training beyond the certification, in
terms of tangible growth of profitability.
Employers and Training
Though most small and medium enterprises (SMEs)
claim to have a positive attitude towards TVET, they
generally offer on-the-job technical training using
internal sources/senior staff or supervisors with no
real pedagogical experience, but who are believed
able to adequately train other workers. They also con-
sider brief orientation sessions offered to new recruits
as internal training. The result is frequently ad hoc
and unstructured, with no recognized certification.
SMEs tend to act differently when it comes to man-
agement, or marketing, or other types of ‘desk’ skills
where they would be willing to send employees for
professional training. Lack of awareness on available
technical training providers is a clear illustration of

Egypt Human Development Report 2010 { 167 }
serious market information asymmetry.
Small or medium operations frequently overlook the
value added from training, which is reflected in the
lack of a dedicated training budget line. Employers
who complain about their capacity to recruit com-
petent workers are generally reluctant to invest in
their human capital for fear of higher rates of pay,
high rates of labor turnover, migration, or other
behavior that would impact on the bottom profit line.
Similarly, owners/managers rarely offer promotion/
financial awards/salary incentives to workers because
of a short-term low expenditure strategy. The fre-
quent absence of clear-cut contractual arrangements
opens such firms to poaching by competitors ready
to exploit skills provided by others. A tightening of
workers’ formal contractual arrangements would be a
possible factor to break this vicious circle, as would a
system of rewards for good performance.4
The Perspective of Prospective Workers
Though access to basic education has notably
improved in Egypt in recent years, as reflected in
rising primary education rates, repetition rates and
school drop-out rates remain high. A significant num-
ber of young people then turn to traditional appren-
ticeships when ‘pushed out’ of general education.
Typically, a new worker becomes the responsibility of
a more senior worker to get acquainted with the tools,
equipment and techniques. Apprentices are given
increasing ‘hands on’ responsibility as they climb
Box 12.1: The Private Sector’s Don Bosco Experience
One successful private fee-paying model is that of the Don Bosco Institute, run by the Italian Silesian Brothers. Rather than
turn out old fashioned/second-chance diplomas, its three and five year diploma courses provide a path to employment,
decent pay, and career progression, which are the very same elements lacking in the majority of the public TVET institutions.
Don Bosco’s credibility lies in its consistency to produce decent quality workers that can actually “do” the list of activities
that are indicated by their certificate, which makes the institute’s credentials trustworthy and a ‘seal’ of quality. This is not
just because of the relevant curricula taught, but due to the recruitment criteria for the institute’s trainers, based on the
technical and pedagogical instruction and practice they have received.
This is not the case for the vast majority of other TVET institutions where previous hands-on industrial experience is not
a pre-condition for hiring. What also positions the Institute so uniquely among other TVET institutions in Egypt is that it
issues final certification that is recognized by both the Italian and Egyptian governments. This is reflected in the eligibility
of students attending the five-year courses to enroll in universities within Europe.
Source: Italian Cooperation for Development Institute
the learning curve, and it is exposure and experience
rather than formal learning that matters. This system
is prevalent among many illiterate low-income fami-
lies who often must pay the master craftsman for the
privilege of teaching a useful trade to their offspring.
Those who have achieved preparatory education, but
with low scores, enter into technical secondary edu-
cation as a stepping stone into the higher education
track. Indeed, 70% of technical secondary school
students who pass the higher education bar prefer
to enter university rather than move into the labor
market. A negligible percentage of graduates choose
to work within their specialization – the majority gets
their first job within a period of three months from
graduation, but they do not keep the job for long
because of the low salary, problems with the owners,
or a return to school.5
There is evidence that youth are discouraged from
working in the industrial sector and would rather be
civil servants or bureaucrats.6 This is because this
type of employment provides long-term stability, is
better viewed among peers, removes the prospect of
getting fired for low-performance, and because the
relatively low pay is acceptable, considering the level
of effort required and the long-term security pro-
vided.7 This option is becoming scarcer as the govern-
ment of Egypt continues to cut down on recruitment
to the public sector (see Chapter Eleven).

Egypt Human Development Report 2010{ 168 }
When faced with significantly high drop-out rates
from workers shortly after basic training or during
training, the World Bank Skills Development Project
in Egypt survey attempted to understand the ratio-
nale behind this behavior among trainees. The sur-
vey interviewees indicated that there was a need for
employers to do the following: Create an encouraging
work environment; create a follow-up committee to
track work conditions; develop a better contractual
set-up; improve salaries; improve supervisors’ skills
in managing subordinates; and introduce shorter
working hours. It should be noted that the basic train-
ing was offered to prospective workers for real jobs
within a recruiting readymade garments factory.8
a PoLicy fraMeworkAs early as 2002, the Government of Egypt endorsed a
TVET Policy Statement that was jointly developed by
the World Bank and the European Training Founda-
tion of the European Union (EU), as a framework for
various types of interventions — as presented in Table
12.2 — including those that are donor supported.
This framework includes the following four provi-
sions:
• Establishing a Quality Qualification System fos-
tering the principle of Lifelong Learning;
• Creating a TVET system responding to labor
market needs;
• Establishing new legal, institutional and gover-
nance frameworks for TVET institutions;
• Developing labor market policies that improve
the mobility of labor.
Four key initiatives are involved in relation to this
framework:
• Raising private sector demand for technical
training;
• Piloting a demand-driven training funding
mechanism;
• Introducing a bottom-up approach to create
partnership among stakeholders while upgrad-
ing training delivery capacity; and
• Establishing a national qualifications frame-
work.
Box 12.2: Government-led Technical Interventions
The Mubarak-Kohl Initiative (MKI) is considered the first initiative that links technical education with industry/labor market
requirements and is perceived as a successful model for cost-efficient and labor-market-oriented TVET in Egypt. The
initiative has aimed to enhance the market relevance of Technical Secondary School graduates’ qualifications, through
a dual system model of cooperative technical education, with extensive technical cooperation via the German GTZ.9 The
dual system typically allows students the opportunity to study theoretical material in schools and to practice in workplace/
production line. More than 20,000 students have graduated from MKI. Around 85% of these receive immediate job offers.
The MKI-Dual System has been handed over to the Egyptian partners from the MOE and the private sector and is now
successfully managed and implemented. As of May 2009, the system has been adopted by 76 MKI technical secondary
schools, in cooperation with 1,900 companies, to train about 24,000 students.
A recent tracer study of past graduates (2008) indicates that the co-operative dual system seems to have positively affected
the perceptions and aspirations of young Egyptians. The dual experience gave graduates an early firsthand taste of the
world of work and introduced them to the discipline of the workplace. It equipped them both with the confidence to make
informed choices and the judgment to make appropriate job search and career choices.10
The Mubarak Kohl Initiative- MKI-vetEP, which started in July 2007, is a continuation of Egyptian-German development
cooperation on MKI. Youth employment is the program’s primary goal as it aims to improve the interactive employability
of youths and employers, thus contributing to gainful employment. MKI-vetEP’s approach goes beyond educating and
training young people to equip them with labor market oriented qualifications — skills, knowledge and attitude —
required for performing a job. Interactive employability covers job seekers becoming and staying employable and potential
employers being able to employ.11 To date, the program has managed to match and place the first batch of young job
seekers. It has agreed to develop and pilot a regional labor market monitoring and forecasting system within the Sixth of
October governorate.12 Source: Vocational Education, Training and Employment Programme – Mubarak-Kohl Initiative
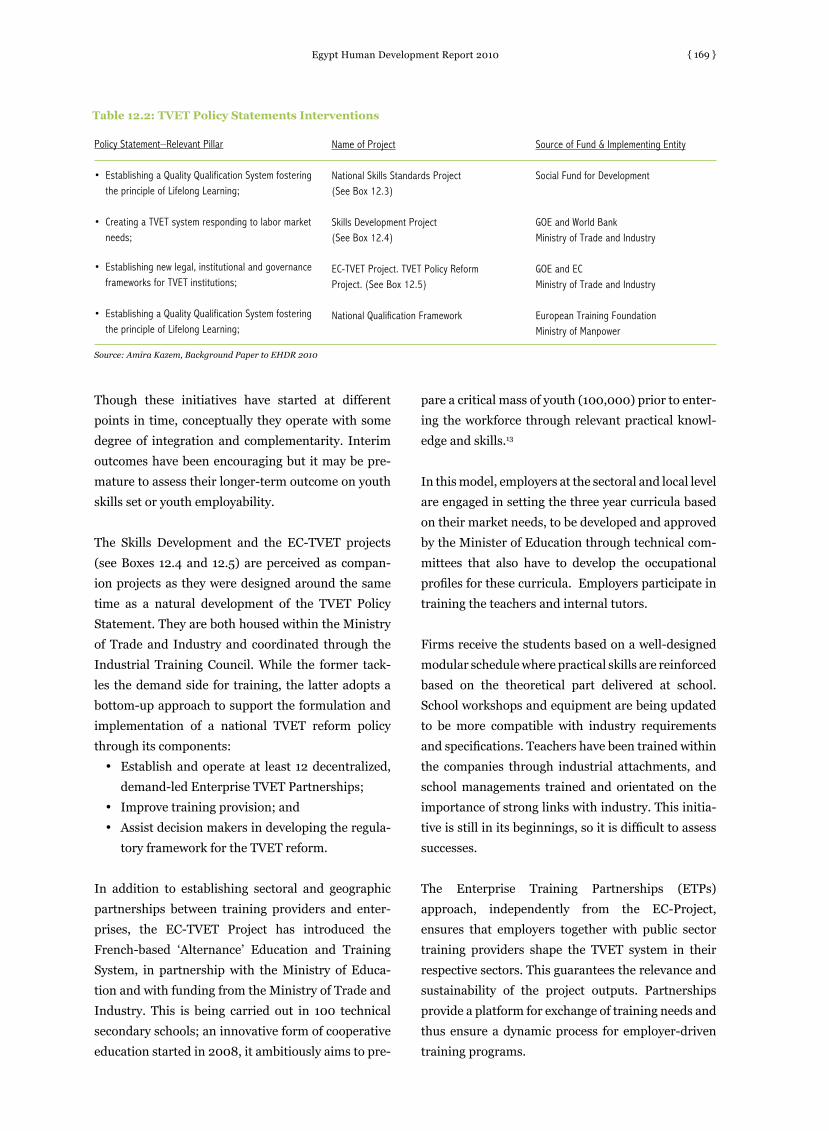
Egypt Human Development Report 2010 { 169 }
Though these initiatives have started at different
points in time, conceptually they operate with some
degree of integration and complementarity. Interim
outcomes have been encouraging but it may be pre-
mature to assess their longer-term outcome on youth
skills set or youth employability.
The Skills Development and the EC-TVET projects
(see Boxes 12.4 and 12.5) are perceived as compan-
ion projects as they were designed around the same
time as a natural development of the TVET Policy
Statement. They are both housed within the Ministry
of Trade and Industry and coordinated through the
Industrial Training Council. While the former tack-
les the demand side for training, the latter adopts a
bottom-up approach to support the formulation and
implementation of a national TVET reform policy
through its components:
• Establish and operate at least 12 decentralized,
demand-led Enterprise TVET Partnerships;
• Improve training provision; and
• Assist decision makers in developing the regula-
tory framework for the TVET reform.
In addition to establishing sectoral and geographic
partnerships between training providers and enter-
prises, the EC-TVET Project has introduced the
French-based ‘Alternance’ Education and Training
System, in partnership with the Ministry of Educa-
tion and with funding from the Ministry of Trade and
Industry. This is being carried out in 100 technical
secondary schools; an innovative form of cooperative
education started in 2008, it ambitiously aims to pre-
pare a critical mass of youth (100,000) prior to enter-
ing the workforce through relevant practical knowl-
edge and skills.13
In this model, employers at the sectoral and local level
are engaged in setting the three year curricula based
on their market needs, to be developed and approved
by the Minister of Education through technical com-
mittees that also have to develop the occupational
profiles for these curricula. Employers participate in
training the teachers and internal tutors.
Firms receive the students based on a well-designed
modular schedule where practical skills are reinforced
based on the theoretical part delivered at school.
School workshops and equipment are being updated
to be more compatible with industry requirements
and specifications. Teachers have been trained within
the companies through industrial attachments, and
school managements trained and orientated on the
importance of strong links with industry. This initia-
tive is still in its beginnings, so it is difficult to assess
successes.
The Enterprise Training Partnerships (ETPs)
approach, independently from the EC-Project,
ensures that employers together with public sector
training providers shape the TVET system in their
respective sectors. This guarantees the relevance and
sustainability of the project outputs. Partnerships
provide a platform for exchange of training needs and
thus ensure a dynamic process for employer-driven
training programs.
Table 12.2: TVET Policy Statements Interventions
Policy Statement–Relevant Pillar
• EstablishingaQualityQualificationSystemfosteringthe principle of Lifelong Learning;
• CreatingaTVETsystemrespondingtolabormarketneeds;
• Establishingnewlegal,institutionalandgovernance
frameworks for TVET institutions;
• EstablishingaQualityQualificationSystemfosteringthe principle of Lifelong Learning;
Source: Amira Kazem, Background Paper to EHDR 2010
Name of Project
National Skills Standards Project(See Box 12.3)
Skills Development Project(See Box 12.4)
EC-TVET Project. TVET Policy Reform Project. (See Box 12.5)
National Qualification Framework
Source of Fund & Implementing Entity
Social Fund for Development
GOE and World BankMinistry of Trade and Industry
GOE and ECMinistry of Trade and Industry
European Training FoundationMinistry of Manpower

Egypt Human Development Report 2010{ 170 }
nationaL efforts towarDs an uPgraDeD quaLifications fraMework An Orderly Formal Qualifications Framework
More recently, the national qualifications framework
has also attempted to tackle the current suboptimal
set-up of TVETs and to address ad-hoc activities, lack
of clarity in roles, irrelevance of credentials vis-à-vis
labor market needs, and lack of a transparent flow/
smooth transition between the education system,
lifelong learning and professional/practical experi-
ence.
Support is being provided through the European
Training Foundation under the auspices of the Min-
ister of Manpower, as chairperson of the Supreme
Council for Human Resources Development. Such
a framework may assist in developing clearer and
comparable qualifications, greater access to qualifica-
tions and to skills development, improved relevance
of qualifications to employers, enterprises and indi-
viduals, and benchmarking and quality assurance of
Egyptian qualifications against national and interna-
tional standards, thus facilitating labor mobility.
Supporting Training Centers
Alternatively, there has been another type of inter-
vention with a more grassroots orientation and on a
rather sporadic basis. Over the past ten years or so,
a number of current training centers either affiliated
to the productivity and vocational training depart-
ment or TOMOHAR/Training Centers at the Ministry
of Housing and Reconstruction have received exten-
sive upgrading support through a number of bilateral
sources, such as the Mubarak-Kohl project, JICA,
and the French government at a time when some of
the TOMOHAR training centers were still under the
NSSP curriculum and testing material, which is based
on the Egyptian Vocational Qualifications (EVQs).
The real value added offered to such training centers’
renovation does not only lie in procurement of more
advanced equipment but in the matching capacity to
develop curriculum and to some extent tailor such
curriculum in a market-responsive manner. In addi-
tion, both trainers and centers’ management receive
technical and pedagogical training, as well as indus-
trial hands-on experience, locally and internation-
ally. Within some of these projects, trainees get the
opportunity to travel to other countries for more
advanced levels of training. This is also accompanied
by an internationally acknowledged certification.
Tackling Labor Market Information Assymetry
Government Initiatives
In an attempt to tackle information asymmetry, the
Information and Decision Support Center (IDSC) of
Egypt’s Cabinet hosts the Egypt Observatory for Edu-
cation, Training and Employment, (previously sup-
ported technically by the European Training Founda-
tion). The observatory is a multilateral network that
includes organizations involved in the labor market
and training in the government, private and civil sec-
tors: CAPMAS, Ministry of Education, Ministry of
Trade and Industry, Ministry of Manpower; NGOs,
and the private sector.
The centre operates as a focal point of support
between two main parties: The data producers on
the one hand, and the beneficiaries who use this data
on the other. The main objectives are to establish a
dynamic labor market information system and train-
ing structure in Egypt through generating accurate
and up-to-date data and information regarding both
supply and demand; this is to support the policy mak-
ers in relation to education, training and labor market
performance system, as well as to forecast labor mar-
ket needs and labor market assessment needs surveys
at the sectoral level.
Non-government-led Initiatives
Leading private sector firms such as Siemens have
been engaged in upgrading a number of training
centers. In coordination with the Industrial Training
Council, a contract, mostly funded through the ITC, is
agreed to upgrade 50 training centers in the fields of
programmable logic control and computer numerical
control affiliated to universities and technical schools
nationwide, whereby Siemens provides the equip-
ment for those centers and trains the trainers. There
has been a similar protocol between the ITC, Heidel-
berg Academy14 and the Productivity and Vocational

Egypt Human Development Report 2010 { 171 }
Box 12.3: The National Skills Standards Project of Egypt’s Social Fund for Development
Within the TVET Policy Statement’s first pillar, the National Skills Standards Project does not only establish skill standards but
also the procedures for testing and certifying trainees. The framework has been envisaged to be supported by a training
providers’ accreditation entity, which in turn will lead to a register of “accredited training providers” and their specialities,
which is yet to be established.
The National Skills Standards Project (NSSP) was originally funded through Egypt’s Social Fund for Development (SFD) and
supported by a team of local and international consultants (led by the British Council) in cooperation with employers. It
works in three industries (manufacturing, tourism, and building & construction) to develop standards, catering for workers’
certification as per their abilities and competencies; transferable credits that carry students across education/training
routes; and objective independent assessment mechanisms and accreditation procedures. It covers post-primary school
qualifications (broadly equivalent to Levels 1, 2 and 3 of the International Standard Classification of Education – semi-
skilled, skilled and supervisor).
The NSSP has developed standards for around 106 trades within the construction, manufacturing and tourism sectors. NSSP
has also upgraded around 50 vocational training centers that adopt the developed standards in training delivery.
For sustainability, and further to an Industrial Training Council/SFD protocol, the manufacturing sector’s skills standards
have been handed over to Egypt’s Industrial Training Council (ITC) in early 2007, while those related to Tourism and
Construction were handed over to the respective federations. ITC has also managed to attract NSSP’s project staff to
pursue work on further standards, approaching the Scottish Qualification Agency (SQA) — involved in the earlier stages
of NSSP — to further benchmark the standards developed during the early stages and to educate sectoral committees
formed within the respective industrial chambers on how to develop Egyptian Vocational Qualifications (EVQs) based on
SQA’s revised methodologies. Source: Industrial Training Council, May 2009
Training Development training center in the Cairo
district of Imbaba.
This interaction among a leading manufacturer, train-
ing facility, and public funding through the Industrial
Training Council provides a magic ‘co-branding’ and
‘accredited’ type of training, and it acts as a tangible
incentive for youth as it facilitates trainees’ certifica-
tion and employability prospects.15
There are other ad-hoc community-based initiatives
either at the level of individual private sector business-
men or of local NGOs, with the objective of upgrad-
ing the local population’s basic skills to enhance their
employability, coupled with some efforts to arrange
for their recruitment within the geographic proxim-
ity of their district or village. Considering that such
initiatives are limited in scope and scale, they may
nevertheless be effective.
the way forwarDResolving the training and labor market failures is
a shared responsibility among stakeholders, which
include youth, employers, federations/chambers, as
well as government. There are two basic concepts that
lie behind the paradigm shift necessary to turn around
the current failures: Incentives and accountability. At
every level of intervention, a clear set of incentives —
be it upgraded curricula and equipment, cost-sharing
for training and tax incentives to employers, or job
openings — must be put in place to enable technical
and vocational education and training to become a via-
ble option for youth. Accountability goes hand in hand
with the introduction of proper certification, based on
recognized and preferably internationally-based stan-
dards of performance. Such certification carries its
own rewards in terms of promotion and mobility.
Despite the extensive efforts to support TVET in
Egypt over the past years, the Egyptian economy still
lacks the critical mass of skilled workers with the
necessary training and enhanced skills. The various
on-going programs and projects do contain elements
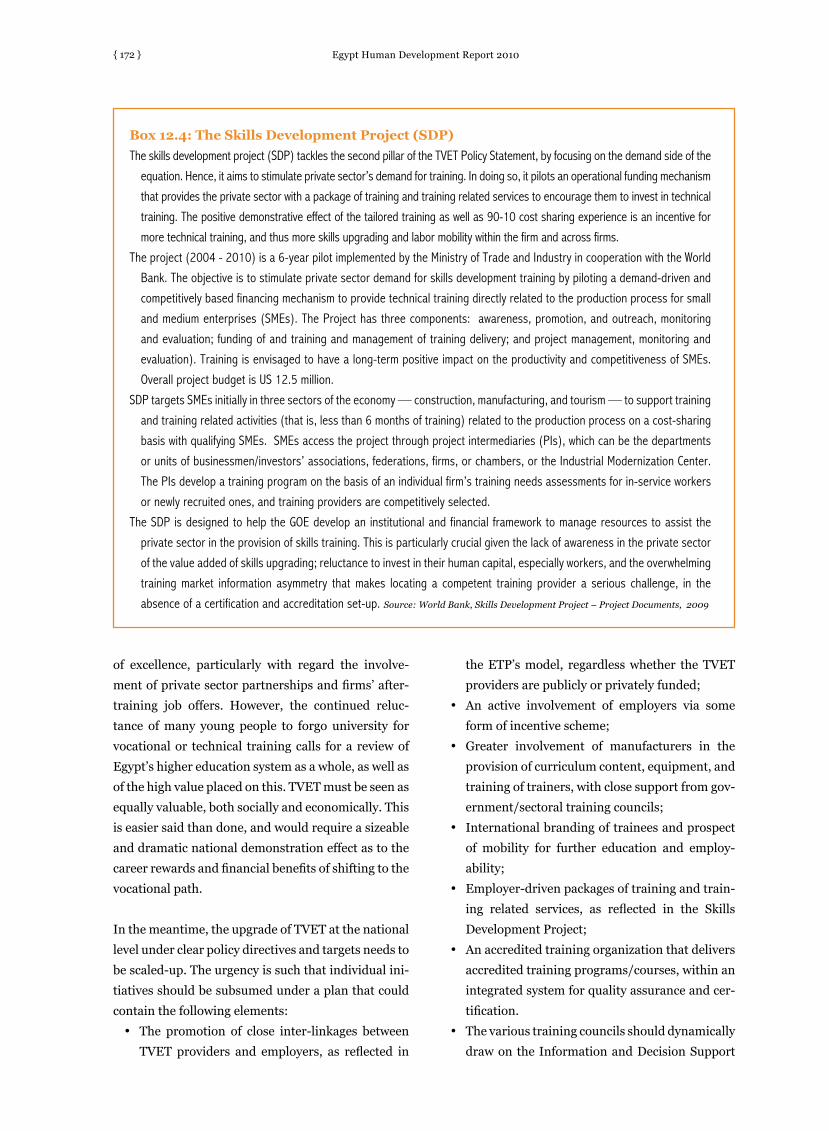
Egypt Human Development Report 2010{ 172 }
Box 12.4: The Skills Development Project (SDP)
The skills development project (SDP) tackles the second pillar of the TVET Policy Statement, by focusing on the demand side of the
equation. Hence, it aims to stimulate private sector’s demand for training. In doing so, it pilots an operational funding mechanism
that provides the private sector with a package of training and training related services to encourage them to invest in technical
training. The positive demonstrative effect of the tailored training as well as 90-10 cost sharing experience is an incentive for
more technical training, and thus more skills upgrading and labor mobility within the firm and across firms.
The project (2004 - 2010) is a 6-year pilot implemented by the Ministry of Trade and Industry in cooperation with the World
Bank. The objective is to stimulate private sector demand for skills development training by piloting a demand-driven and
competitively based financing mechanism to provide technical training directly related to the production process for small
and medium enterprises (SMEs). The Project has three components: awareness, promotion, and outreach, monitoring
and evaluation; funding of and training and management of training delivery; and project management, monitoring and
evaluation). Training is envisaged to have a long-term positive impact on the productivity and competitiveness of SMEs.
Overall project budget is US 12.5 million.
SDP targets SMEs initially in three sectors of the economy — construction, manufacturing, and tourism — to support training
and training related activities (that is, less than 6 months of training) related to the production process on a cost-sharing
basis with qualifying SMEs. SMEs access the project through project intermediaries (PIs), which can be the departments
or units of businessmen/investors’ associations, federations, firms, or chambers, or the Industrial Modernization Center.
The PIs develop a training program on the basis of an individual firm’s training needs assessments for in-service workers
or newly recruited ones, and training providers are competitively selected.
The SDP is designed to help the GOE develop an institutional and financial framework to manage resources to assist the
private sector in the provision of skills training. This is particularly crucial given the lack of awareness in the private sector
of the value added of skills upgrading; reluctance to invest in their human capital, especially workers, and the overwhelming
training market information asymmetry that makes locating a competent training provider a serious challenge, in the
absence of a certification and accreditation set-up. Source: World Bank, Skills Development Project – Project Documents, 2009
of excellence, particularly with regard the involve-
ment of private sector partnerships and firms’ after-
training job offers. However, the continued reluc-
tance of many young people to forgo university for
vocational or technical training calls for a review of
Egypt’s higher education system as a whole, as well as
of the high value placed on this. TVET must be seen as
equally valuable, both socially and economically. This
is easier said than done, and would require a sizeable
and dramatic national demonstration effect as to the
career rewards and financial benefits of shifting to the
vocational path.
In the meantime, the upgrade of TVET at the national
level under clear policy directives and targets needs to
be scaled-up. The urgency is such that individual ini-
tiatives should be subsumed under a plan that could
contain the following elements:
• The promotion of close inter-linkages between
TVET providers and employers, as reflected in
the ETP’s model, regardless whether the TVET
providers are publicly or privately funded;
• An active involvement of employers via some
form of incentive scheme;
• Greater involvement of manufacturers in the
provision of curriculum content, equipment, and
training of trainers, with close support from gov-
ernment/sectoral training councils;
• International branding of trainees and prospect
of mobility for further education and employ-
ability;
• Employer-driven packages of training and train-
ing related services, as reflected in the Skills
Development Project;
• An accredited training organization that delivers
accredited training programs/courses, within an
integrated system for quality assurance and cer-
tification.
• The various training councils should dynamically
draw on the Information and Decision Support

Egypt Human Development Report 2010 { 173 }
Box 12.5: The EC Project: Assistance to the Reform of the TVET System
This EC project falls on the supply side in the context of the first pillar of the TVET Policy Statement. Here, Enterprise
Training Partnerships (ETPs) were set up under the TVET Policy Reform Project, (with a contribution from the GOE of
Euro 33 million, matched by the EC). Activities started 2005 with the goal of developing decentralized quality technical
and vocational training institutes that depend on market demand. The ongoing project also aimed to develop key building
blocks for a model TVET system by introducing national regulating bodies as a basis for a decentralized system of
demand-driven TVET.
To date, the EC-TVET project has established 12 partnerships/ETPs across a range of sectors — from textiles to tourism
— and in addition, six local ETPs out of a total target of 12 in industrial zones, to support local partnerships and training
providers. The project has also contributed to capacity building as follows:
• (i) Training Providers: Through curriculum development, upgraded workshops and pre-qualified trainers and teachers,
it has improved around 140 training centers and around 100 in–company training facilities in the ready-made garments
sector;
• (ii) Trainers: To date, around 1,680 trainers have been trained in the ready-made garments, food, building material,
engineering, wood and furniture industries;
• (iii) Training Packages: the project has developed a wide range of training packages based on industry needs, and
developed curricula for 16 occupations (based on the technical secondary schools and vocational training centers) with
close support from sectoral and local ETPs;
• (iv) Training Sessions: to develop qualified human resources infrastructure as Trainers and Master of Trainers in the
different sectors; with an end of project target of 4000;
• (v) Study Visits: to create common understanding, awareness and exchange experience between the local training
specialists and their counterparts in EU countries; and
• (vi) Twining Arrangement: an institutional capacity building mechanism in relation to the regulatory framework. The
project also contributes to developing a system of quality in the field of industrial training include standardization,
accreditation, and certification. Source: EC-TVET Project Management Unit, 2009
Center (IDSC) Observatory in providing market
information and directives, as well as prosperous
vocations that not only fill a labor market gap but
move the links within the TVET market itself in a
productive manner.
There have been recent efforts to reactivate the
Supreme Council of Human Resources Develop-
ment within the Ministry of Manpower, as well as
the better organization of the Industrial Training,
the Tourism Training, and the Construction Training
Councils. Yet, clarity of roles among these entities in
terms of policy directives and priority setting is yet
to be firmed up. This may require a series of legisla-
tive and operational procedures to fulfill a nationwide
breakthrough, with reduced youth unemployment as
a goal.
an action PLan Avail Stakeholders with InformationInformation provides directives for adjustments and
change. There is a critical need for a ‘Labor Mar-
ket Information System.’ This would provide youth
with the job market needs to encourage enrollment
in vocations on the rise. It would also provide TVET
institutions and trainers with directives towards a
frequently revised set of specializations in demand,
and allow for TVET diplomas, courses and programs
to follow suit with a dynamic revision of curricula to
match market projections.
The Cabinet related IDSC Observatory may be con-
sidered a nucleus for such a labor market information
system, with its network of organizations involved in
the labor market and training in the government, pri-
vate and civil sectors.

Egypt Human Development Report 2010{ 174 }
Adopt a Market-Driven Approach
As a first step, TVET institutions should be given a
clear role by:
• Providing students and trainees with skills and
know-how demanded by the marketplace;
• Adopting elements of success in those training
centers that have been rebranded as different
but successful;
• Appointing a board of trustees to set priorities
and to ensure linkages to each vocational spe-
cialization/labor market;
• Developing an own annual plan and annual bud-
get based on market requirements;
• Responding to market needs in terms of courses/
programs, curriculum-design, development and
tailoring;
• Recruiting industry based trainers to ensure pro-
vision of hands-on industrial expertise;
• Creating an ‘Accreditation Body’ to which all
TVET institutions will be held accountable.
• Making it mandatory for TVET institutions to
adopt accredited standards while developing
curriculum and testing material for approved
certification.
TVET will likely remain mostly public-funded, which
does not mean that the government must continue to
fund a non-performing body, nor that TVET deliv-
ery is confined within the public sector domain.16
But TVET institutions need to receive technical and
financial support to develop their business model
while giving them to authority to make financial and
administrative decisions related to fulfilling their
mandates. This will most likely trigger a legislative
change to allow for income generation, and income
retention at the level of the training center, accep-
tance criteria for students, recruitment policies, etc.
With regard private sector TVET providers, these are
yet to a see a viable business opportunity similar to
that operating in sectors such as tourism or ‘quality’
training for the food industries. Unless some form of
incentive is provided, they are likely to offer short-
term training courses on-site to avoid significant
capital investment and to minimize market entry and
exit barriers.
The model whereby leading manufacturers such
as Siemens and Heidelberg enter into a contractual
commitment to provide their equipment, curriculum
and training of trainers seems a viable mechanism
that would not only provide the missing incentive for
both youth and employers in terms of quality assur-
ance, but it would also allow the market more time
until an accreditation system is in place and function-
ing effectively. Further incentives could be offered to
excelling students in the form of internship within
these manufacturers’ production lines, either locally
or in their respective head offices.

Egypt Human Development Report 2010 { 175 }
Private Sector Training Incentive
Employers should be given more time to build a criti-
cal mass of awareness as well as to develop confidence
between themselves and employees. A set of precon-
ditions would include an enriching work environ-
ment, fair pay, and investment in upgrading worker
skills and responding to career aspirations. These are
the very elements that would attract youth towards
some vocations versus others.
To date, most employers are more tempted to receive
training related technical and financial services for
a selection of vocations that have a tangible ‘value’
such as technical quality certification (ISO, TQM,
HAACP) or even basic sewing machine operation, as
it cuts their own cost of pre-employment training.17
This readiness is a viable entry point, prior to enforc-
ing a training levy law, whereby employers are asked
for an additional tax or levy to finance a training fund.
What is needed is a review of appropriate conditions
for applying training-related taxes.
Two pre-conditions to law enforcement could include:
(i) pursuing a service-based/cost-share payment vis-
à-vis a tax levy, so as to establish a broader base of
demand for technical and vocational training and to
allow for TVET delivery capacity to rise up to stan-
dards; and (ii) legislative revision to be based on the
payroll, to replace the controversial net profitability-
base training levy that requires firms to pay 1% of
their net profitability to finance a training fund. This
training levy/tax in Egypt has been challenged as
unconstitutional.
Stakeholders within any set-up tend to respond most
readily once they can spot a tangible gain or at least a
clear path of progression that leads to a concrete ben-
efit. The above sets of recommendations attempt to
provide stakeholders with clear incentives while
holding them accountable in case they fail to fulfill
their part of the bargain.18 holding them accountable
in case they fail to fulfill their part of the bargain.18
Box 12.6: The Media-based Employment Initiative
Youth are reluctant to be employed as production workers and they indicate obvious preference towards working in the civil
service, given the benefits, security and hours. In the meantime, industry suffers from a lack of semi-skilled and skilled
workers. The Ministry of Finance, for this reason, sponsored a massive media campaign during the high viewership season
of Ramadan 2007 to create a positive attitude towards industrial employment.
This initiative was complemented by the Industrial Training Council’s offer of pre-employment training to match available
vacancies in private sector firms committed to employ youth who complete ITC’s training. The campaign was accompanied
by monitoring and evaluation to track progress and youth reactions. The outcome of the pre-implementation survey
indicated that youth’s acceptance of vocational training did not exceed 2%, irrespective of educational background.
As the campaign rolled in, 10% of enquiries (out of a total number of 1,100,000 callers) stated a willingness to be
employed on production lines Of these 110,000 went for interviews, and 87,000 (or 8%) became employed.
Source: Industrial Training Council, May 2009
Endnotes1 JICA, 20062 MOTI’s Productivity and Vocational Training Department offers 3-years apprenticeships. 3 ECES – World Bank, Cairo Office (2000)4 MOTI, 20085 JICA (2006).6 Data from the Ministry of Trade and Industry in coordination with EC-funded TVET project “Assistance to the Reform
of the Technical and Vocational Education and Training System in the Arab Republic of Egypt” (and from the World Bank supported Skills Development Project). Seen in the joint efforts by the Ministry of Finance, Federation of Egyptian Industries and the Industrial Training Council to provide training and employment.
7 MOTI, 2006 8 ibid9 GTZ- Mubarak Kohl Initiative (2009)10 From: Graduate Tracer Study and Attitudes of Youth towards the Labor Market in the Context of the Wider Landscape of

Egypt Human Development Report 2010{ 176 }
TVET in Egypt, CID Consulting, Cairo, March 200911 Op.Cit., Mubarak Kohl Initiative12 Ibid13 EC-TVET, Assistance to the Reform of the Technical and Vocational Education and Training System in the Arab Republic
of Egypt, (May 2009), Project Documents.14 Heidelberg is a leading German company in the field of printing and is an internationally renowned training provider in the
field of printing15 Industrial Training Council,(May 2009) Council Documents.16 Skills Framework Conference-British Council, European Training Foundation, ITC, March 200917 International Standards Organization/ISO, Total Quality Management/ TQM, Hazards Analysis and Critical Control
Points/HAACP18 The author would like to express sincere appreciation to the key TVET sector stakeholder for reviewing earlier drafts of the
chapter and providing their feedback.
referencesAbrahart, Alan (2000), “Education, Training and, Employment Sub-committee Report (ETES)”, Unpublished, World Bank, Cairo,
EgyptAbrahart, Alan (2003), “Egypt: Review of Technical and Vocational Education and Training.”, Unpublished, World Bank, Washington
D.C. Abrahart, Alan (2000), “Report of the Employment, Education and Training Sub-committee”, Unpublished, World Bank Office, Cairo,
Egypt. Carrero-Perez, Elena and Hakim, Guillermo (2006), “Reforming technical and vocational education and training in the Middle East
and North Africa: experiences and challenges”, ETF and the World Bank.Graduate Tracer Study and Attitudes of Youth towards the Labor Market in the Context of the wider Landscape of TVET in Egypt,
(March 2009), Unpublished, CID Consulting Cairo- EgyptJICA - Allied Corporation Egypt (2006), “Job Opportunity Survey”, Report developed by JICA to Ministry of Trade and Industry.
Unpublished, JICA, Cairo, Egypt.Ministry of Trade and Industry - Skills Development Project – Drop-out study (2006), Unpublished, Skills Development Project -
PMU, Cairo, EgyptMinistry of Trade and Industry - Skills Development Project – Market Research Surveys, (2008), Unpublished, Skills Development
Project PMU, Cairo, Egypt

{ 177 }
The interdependence of factors influencing health outcomes in a vision of sustainable human development was exemplified in the Millennium Development Goals (MDGs) that place health at the
heart of development with health-related aspects in each of the eight Goals. The MDGs are designed in a manner where the realization of each goal can have positive returns on health outcomes. It is the present challenge of global changes and crises to recognize that health is ulti-mately dependent on the vitality of nature’s life-supporting processes and that investment in stronger multi-sectoral public health and pri-mary preventive capacities within national policies can provide quick and positive health returns.
Chapter Thirteen
TOWARDS HEALTH, NUTRITION AND ENVIRONMENTAL SECURITY OF YOUTH

Egypt Human Development Report 2010{ 178 }
Using nutrition as an example to illustrate the seg-
mentation and specialization in the medical sciences
— breaking them up into calories, macro and micro
nutrients, or neonatology, pediatrics, adolescent
health, adult and geriatrics and so forth — has been a
barrier to connecting the dots for progress in human
health.1 The common denominator for linkages is a
systematic ‘life course’ approach taking nutrition as
an example (Figure 13.1). This provides the goals
and informs of the interdependence. Health action is
seen as a coordinated effort that necessarily extends
beyond the boundaries of the health sector alone. 2
Youth Health and its Measurement
Health, nutrition and the environment are presented
together as they relate to adolescents and youth in
Egypt through a holistic integrated ‘life cycle’ vision.
Validated nationally representative information is
provided by the recent census of November 2006
and the 2005 and 2008 Egypt Demographic Surveys.
Advance information on the results of the 2009 Sur-
vey on Young People in Egypt (SYPE) undertaken by
the Population Council was made available to EHDR
authors. SYPE is a knowledge, attitudes and practices
type of survey that provides the respondents’ opin-
ions, and perceptions of their own health and health
problems, thereby allowing for comparison with sci-
entific findings on the same issue. Other sources of
information from researches and studies that may
not always qualify as nationally representative or
validated were taken as indicative or to illustrate a
trend in the evolution of a given health problem. In
the absence of country specific information, regional
type data from international data-bases are included
to support the argument of the importance of risk
identification, communication and management of a
given issue.
heaLth ProfiLe of youth in egyPtThe age group of adolescents and youth is consid-
ered a period of risk when health problems with
potentially serious consequences occur and problem
behaviors which have potentially serious adverse
effects on health are initiated. The profile of prob-
lems and risks faced during adolescence can start in
childhood and merge into that of young adult life,
according to the life cycle approach. Although most
adolescents make the transition into adulthood in
good health, many do not. Some of the health prob-
lems faced by adolescents and youth affect them
during adolescence itself, such as death caused by
suicide or interpersonal violence, or from the conse-
quences of an unsafe abortion or unattended child-
birth. Others manifest themselves later in life, for
example chronic non-communicable diseases that
are nutrition related, or lung cancer resulting from
tobacco use initiated early in life, or other types of
cancer resulting from exposure to carcinogenic
Source: Prepared for the ACC/SCN Commission on Nutrition Challenges of the 21st Century, Jan 2000, cited in ACC/SCN 4th Report on ” The Nutrition Situation: Nutrition throughout the Life Cycle”.
Figure 13.1: Nutrition through the Life Cycle
Pregancy. Low
Weight Gain
Inadequate Foetal
Nutrition
Inadequate Catch up
Growth
Child Stunted
Adult Stunted
Reduced Mental Capacity
Inadequate Food, Health and Care
Eldery StuntedBaby
Low BirthRate
High Mortaity Rate Impaired Mental
Development
Increased Risk of Chronic Disease
Untimely/Inadequate Weaning Frequent Infections Inadequate Food and Health Care
Inadequate Food, Health and Care
Inadequate Food, Health and Care
Reduced Capacity to Care for Baby
Woman
Malnourished
Reduced Mental Capacity
Higher Maternal Mortality
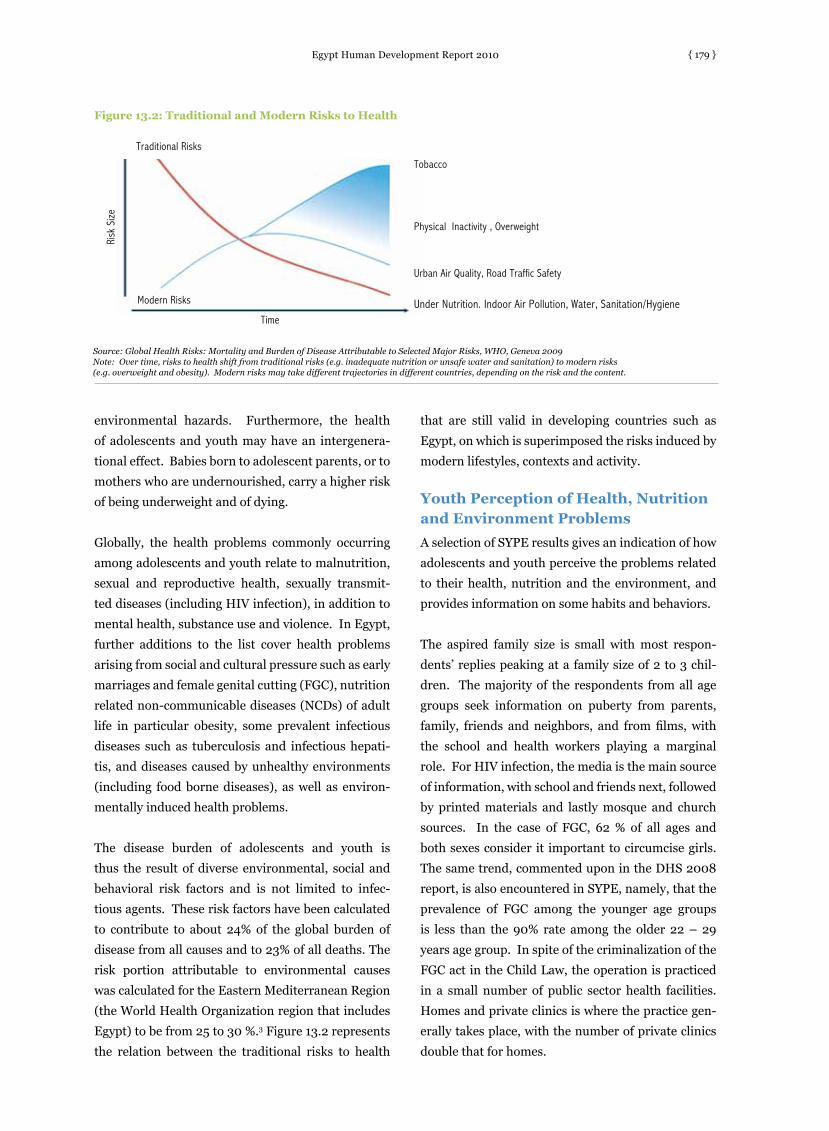
Egypt Human Development Report 2010 { 179 }
environmental hazards. Furthermore, the health
of adolescents and youth may have an intergenera-
tional effect. Babies born to adolescent parents, or to
mothers who are undernourished, carry a higher risk
of being underweight and of dying.
Globally, the health problems commonly occurring
among adolescents and youth relate to malnutrition,
sexual and reproductive health, sexually transmit-
ted diseases (including HIV infection), in addition to
mental health, substance use and violence. In Egypt,
further additions to the list cover health problems
arising from social and cultural pressure such as early
marriages and female genital cutting (FGC), nutrition
related non-communicable diseases (NCDs) of adult
life in particular obesity, some prevalent infectious
diseases such as tuberculosis and infectious hepati-
tis, and diseases caused by unhealthy environments
(including food borne diseases), as well as environ-
mentally induced health problems.
The disease burden of adolescents and youth is
thus the result of diverse environmental, social and
behavioral risk factors and is not limited to infec-
tious agents. These risk factors have been calculated
to contribute to about 24% of the global burden of
disease from all causes and to 23% of all deaths. The
risk portion attributable to environmental causes
was calculated for the Eastern Mediterranean Region
(the World Health Organization region that includes
Egypt) to be from 25 to 30 %.3 Figure 13.2 represents
the relation between the traditional risks to health
that are still valid in developing countries such as
Egypt, on which is superimposed the risks induced by
modern lifestyles, contexts and activity.
Youth Perception of Health, Nutrition and Environment Problems
A selection of SYPE results gives an indication of how
adolescents and youth perceive the problems related
to their health, nutrition and the environment, and
provides information on some habits and behaviors.
The aspired family size is small with most respon-
dents’ replies peaking at a family size of 2 to 3 chil-
dren. The majority of the respondents from all age
groups seek information on puberty from parents,
family, friends and neighbors, and from films, with
the school and health workers playing a marginal
role. For HIV infection, the media is the main source
of information, with school and friends next, followed
by printed materials and lastly mosque and church
sources. In the case of FGC, 62 % of all ages and
both sexes consider it important to circumcise girls.
The same trend, commented upon in the DHS 2008
report, is also encountered in SYPE, namely, that the
prevalence of FGC among the younger age groups
is less than the 90% rate among the older 22 – 29
years age group. In spite of the criminalization of the
FGC act in the Child Law, the operation is practiced
in a small number of public sector health facilities.
Homes and private clinics is where the practice gen-
erally takes place, with the number of private clinics
double that for homes.
Figure 13.2: Traditional and Modern Risks to Health
Source: Global Health Risks: Mortality and Burden of Disease Attributable to Selected Major Risks, WHO, Geneva 2009Note: Over time, risks to health shift from traditional risks (e.g. inadequate nutrition or unsafe water and sanitation) to modern risks (e.g. overweight and obesity). Modern risks may take different trajectories in different countries, depending on the risk and the content.
Traditional Risks
Risk
Siz
e
Time
Tobacco
Physical Inactivity , Overweight
Urban Air Quality, Road Traffic Safety
Under Nutrition. Indoor Air Pollution, Water, Sanitation/HygieneModern Risks

Egypt Human Development Report 2010{ 180 }
Medically attended childbirths account for 76% of
deliveries, with the Daya or Traditional Birth Atten-
dant (TBA) sharing equally the remaining deliveries
with the mother or mother-in-law, with obvious mar-
ginalization of the services of the qualified midwife.
Breastfeeding for the first six months of life was con-
firmed by 86% of the women. The use of contracep-
tives follows the usual trend of low utilization before
the first pregnancy, hence only 50% report their use
among the 15-21 years’ age group while only 20 % do
not use contraceptives among the older 22 to 29 year
olds. Radio and television head the list of sources of
information on contraceptives followed by the health
worker and the parents. The school plays a minor
role in family planning education. Young males gave
the highest score for the inability to identify a source
of information on contraceptives.
The majority of the respondents, about 95%, consider
themselves free of any ailments. Anemia leads the
list of diseases and complaints of the remaining 5%
claiming ill health. Respiratory diseases and asthma,
rheumatic disease, heart disease and high blood pres-
sure closely follow. Smaller numbers are reported for
headaches and migraine, kidney and skin diseases,
diabetes, stomach ulcer, liver disease, epilepsy, bil-
harziasis, acne and malignant tumors. Cataract and
elevated cholesterol levels are at the tail of the list.
Diabetes appears more in the older age groups and is
reported more by males than females. The data does
not provide information on association between the
reported disease conditions which commonly occurs
in real life situations. The high ranking of undefined
rheumatic disease on the list of declared reasons for
ill health may need further investigation.
It is to be remembered that the information is that
reported by the respondent and not necessarily veri-
fied. The health seeking behavior is nearly equally
BOX: 13.1. Developing a Physical Exercise Habit for Youth
The importance of physical exercise to maintaining the acquired health capital throughout adulthood and to healthy aging is
now well established. Physical inactivity is estimated by the World Health Organization (2009) to cause around 21-25% of
the breast and colon cancer burden, 27% of diabetes and about 30% of the ischemic heart disease burden. The practice
of various forms of physical exercise is a habit that needs to be developed during the early formative years.
However, in spite of the benefits for health and wellbeing offered by the practice of physical activities a progressive decrease
in physical activities and physical education programs in schools has taken place over the past decades in Egypt and
across the world at large. The phenomenon is more pronounced in poor areas and in densely populated urban collectivities.
There is an urgent need to provide children and youth of both sexes (whether in or out of school) with access to physical
education programs and with opportunities to practice physical activities. Frequently, these are not available in schools in
Egypt, even though participation in a variety of physical activities early in life is essential for acquiring the willingness and
necessary skills and experiences to maintain a regular physical exercise habit throughout life.
The provision of opportunities for physical activity for children and youth is the collective responsibility of parents, the local
community, the educational system and society as a whole. The 6 years of compulsory basic education in Egypt represent
a population of several millions of children across the whole country. This means that introduction of physical education
programs in primary schools can lay the foundation for lifelong active living and enhance youth health and wellbeing,
preventing and reducing future health problems.
The first step towards the introduction of physical education activities in schools is to bridge the knowledge gap of the policy
and decision makers, teachers, parents, and other professionals and concerned groups and organizations. Concomitant
community-based programs need to be initiated to guarantee equitable access to physical activities by out of school
children. Though the commendable competitive performance of Egyptian girls in many types of sports at the world level is
a witness of the absence of any reservations against the practice of physical activities by girls, certain measures may be
needed to overcome any culture-bound traditions that may stand in the way of full participation of girls in physical activities
at that young age and later as young adults. Source: Habiba Hassan-Wassef, Background Paper for EHDR 2010
Egypt Human Development Report 2010 { 181 }
divided between private practitioners and public hos-
pitals and clinics with preference for private practi-
tioners which increases for females of the older age
group of 22-29 years. The younger age groups do
not seek health care in non-profit clinics. Medication
purchased without a prescription involved mainly
painkillers. Antibiotics followed to a lesser extent,
with anti-colic and drugs for stomach complaints
closely following.
The perception of the presence of pollution was
reported positive by 41% of respondents. The symp-
toms or complaints attributed to pollution were
mainly respiratory, followed by digestive system
symptoms, skin rashes, kidney disease and lastly liver
disease. About 15% of respondents of all ages and
both sexes reported having had an accident, with falls
ranking first, followed by burns and deep cuts and
physical violence and electric shocks. Males seem to
be more accident prone reporting more street fights
and physical violence, while females are subject to
assault more often than men.
On the issue of bread consumed, it was surprising
to note that a little over a quarter of the respondents
mentioned that they eat home-baked bread. This is a
higher percentage than that encountered in real life
situations where home baking is not a regular custom
and is often limited to feasts and special festive occa-
sions. The local subsidized baladi bread is consumed
by only half the sample. White bread is consumed in
the form of shami bread by about 10% of the sample.
The low consumption rate reported by the respon-
dents for the subsidized bread that is iron fortified
means that the targeted iron deficient child and ado-
lescent population is only half covered.
The one week food consumption recall list reflects the
basic features of the traditional composition of the
Egyptian dietary system. With bread as the staple
diet, Egyptians rely on cereals, legumes and on dairy
products for their sources of protein, with poultry,
eggs and fish (more than meat) as a source of ani-
mal protein. The reduced animal protein intake is
understandable as an outcome of the avian influenza
epidemic and of the current price of meat, fish and
chicken, unaffordable to many.
resuLts of the 2008 egyPt DeMograPhic anD heaLth survey
In addition to the usual demographic, reproductive
health, fertility, female genital cutting, mother and
child health and nutrition sections of a Demographic
and Health Survey (DHS) report, the 2008 report
investigated a number of special issues.
There is an observed substantial increase in age at
first marriage for Egyptian women. With the increase
of the legal age for marriage of girls to 18 years in the
new Child Law, it is expected that there will be less
exposure of girls to the risk of early marriages.4 On
the use of contraceptives, in line with the universal
attitude among women in Egypt, less that one percent
of the married women who had not yet had a child
used family planning methods (FPMs). The issue sig-
naled by the DHS was the number of women who dis-
continued the use of FPMs. The percentage of medi-
cally assisted deliveries was given as 79% with Dayas
assisting in most of the remaining deliveries. This
raises the issue which was often encountered in rural
areas, of the marginalization of the qualified mid-
wives. The findings on breast feeding showed that
though the habit is nearly universal in Egypt, breast
feeding practices applied to the new born immedi-
ately following birth are not optimal with the babies
receiving some type of liquid (often under doubtful
hygienic conditions) while awaiting the mother’s milk
flow to start.
Investigation of the extent and correctness of the
knowledge about AIDS shows that only 7% of women
and 18% of men were classified as having compre-
hensive correct knowledge about the disease. This
indicates that serious efforts will need to be initiated
to bridge this knowledge gap. A similar information
gap exists about injection safety. Only 27% of women
and 19% of men in the age bracket of 15-59 years had
received information on injection safety. Findings
about the smoking habits among the 15-59 age group
showed that 1% of women are smokers compared to
44% of men. Only 39% of women and 37% of men
had information on the adverse effects of second-
hand smoke in the six months preceding the survey.
Results of testing the prevalence of the hepatitis C

Egypt Human Development Report 2010{ 182 }
viral infection (HCV) among the 15-29 age group
showed that it started to rise at an older age, and
that men seen to be slightly more exposed to infec-
tion. HCV infection was higher among rural resi-
dents and lowest in Frontier and Urban Governor-
ates. It was found that the higher the education
and the wealth, the less the risk of exposure to the
HCV infection. In the case of HIV/AIDS, there
seems to be a serious knowledge gap that needs to
be urgently bridged, with very few of the 15-24 age
group having comprehensive knowledge about the
disease, or where to obtain it from, or even knowl-
edge of a source for HIV testing. Anemia was not
investigated in the 2008 survey, and the findings of
the 2005 DHS reported high prevalence of anemia
reaching 26% among never married males and 35%
among never married females in the 10-19 years age
bracket. At least half of the children were consid-
ered as mildly anemic. What was important in these
results was the fact that childhood anemia in Egypt
was shown to cross socioeconomic barriers.
PoLicy iMPLications anD recoMMenDationsPolicy Framework
Though there may not be a specific policy framework
for youth and young adults as an identifiable age
group of the population, significant advances have
been gained for the cause of child health, develop-
ment and well-being in Egypt based on a rights-based
approach to satisfy children’s needs. The two Child
Development Decades that followed ratification of
the Convention of the Rights of the Child (CRC) in
1999 have culminated with the adoption of the Child
Law and its revised version of 2008 and the creation
of a ministerial portfolio for the Family and Popula-
tion. The leadership role and the coordination func-
tion of the latter will be much in demand to mobilize
the different sectors and promote the formulation of
integrated policy and strategy formulation to attain
shared youth-related objectives.
No program for improving the health and social
function of youth can overlook the preventive and
curative interventions directed at the first years
of life, from gestation to 24 months of age, recog-
nized as most critical to the health and well being of
young adults. The Child Observatory, created by the
National Council for Childhood and Motherhood in
partnership with the Information and Decision Sup-
port Center (IDSC) and with UNICEF, is expected to
provide — through its Under Three Years’ initiative
— data that can be used to guide interventions during
this period.
The potential contribution of the National Council for
Youth and Sports can be very valuable. The policy for
creation of youth centers and community based play-
grounds across the country for practice of sports and
physical activities in all Governorates may need to be
revisited to increase their use by the girls as well as
the boys, and at a younger age. Schools without play-
grounds should be able to negotiate an agreement for
the use of the local Youth Center playgrounds (munic-

Egypt Human Development Report 2010 { 183 }
ipal playgrounds, or even a neighboring sports club)
for conducting a sports or physical education class.
This is a practice adopted by many European schools
that lack playground space.
Institutional Considerations
Experience and lessons learnt from the success story
of the management model of the Population Program
with the specially created supra-sectoral Population
Council could serve as a model for a National Nutri-
tion Program. Much can be gained by broadening the
sectoral base of actions for improving food security
and nutritional status in the country. The recent cre-
ation (December 2008) of inter-ministerial Nutri-
tion Committee for accelerating the implementation
of the national nutrition policy and strategy is a step
in the right direction. The Committee can serve as
a policy coordination body as it brings together the
main ministries concerned with food and nutrition,
namely: the Ministries of Health, Agriculture, Family
and Population, Social Solidarity, Trade and Indus-
try, and Environment. However, experience has
shown that a number of basic prerequisites have to be
in place to prepare for this high level policy dialogue
and support implementation of the resultant inte-
grated policies in a manner that can generate synergy
and complementarity between the sectors.
Social Protection
Equitable access to programs and services and equal
opportunities are appreciably enhanced by social pro-
tection programs in Egypt where pockets of poverty
exist in spite of the progress made in economic devel-
opment and growth. The extensive social reforms ini-
tiated over the past few years provide a much needed
safety net for the families with limited incomes. A
review of the social reform and of the policies and
strategies impacting on children and adolescents has
been made in the recently completed study of multi-
dimensional child poverty in Egypt (Child Poverty
and Disparities Study, in press). Better targeting of
those families in need, and controlled conditional
cash transfer to improve the health, nutrition and
educational outcomes of their young children, is an
important adjunct to efforts for enhancing the health
and well being of youth.
Effective Coordination
The breaking up of youth related issues and prob-
lems into sector related fragments managed by the
“mandated” sector, whether health, education, sports
or other, brings to the fore the need for coordina-
tion between their respective programs. The desired
impact and outcome requires addressing an inter-
dependent problem facing youth and young adults.
Successful outcomes depend primarily on team spirit
and the mobilization around shared objectives. The
presence of information systems that are accessible
to all partners and that allow the timely sharing of the
data between them is a basic requirement for good
intersectoral coordination. Formulation of integrated
policies, good governance and accountability are the
backbone of successful implementation of programs
that cut across different sectors. Other contributing
factors include:
• Information that is generated and shared among
all sectors to support joint policy/strategy for-
mulation and monitoring and evaluation;
• A continuous sustained policy level dialogue
between the partners/sectors;
• Institutional design that can allow effective
trans-sectoral collaboration at all stages of a pro-
gram and at all levels, central, regional and local;
• Joint conception, design and planning of inte-
grated strategies;
• A program implementation management model
that defines responsibilities and can track
accountability;
• A financial management model that can allow
respect of the financial accounting rules and reg-
ulations of each partner; and
• Adoption of population-based approaches to
identified problems with participation of youth
as beneficiaries as well as actors for implemen-
tation of strategies developed in function of the
imperatives of local contexts.
Strengthening The Youth Dimension
It is proposed to adopt a policy to revisit current
national programs targeting (or potentially target-
ing) youth health and well being for strengthening of
their youth dimensions. This may be opportune tim-
ing since three sectors, namely, health, education and

Egypt Human Development Report 2010{ 184 }
social solidarity, are in the midst of a reform process.
The coordination role awaited from the Family and
Population Ministry is expected to benefit from the
design of the aforementioned information sharing
systems, of a financial management model to facili-
tate accounting and accountability in jointly imple-
mented programs, and a management model for
multi-partner interventions.
UN system programs being implemented in Egypt
and that target adolescents, youth and young adults
should also be revisited. Initiation of activities for
accelerating progress towards the realization of the
MDGs will benefit the health and well being of youth,
as well as programs specifically targeting adoles-
cents and youth, whether World Health Organization
programs for adolescents’ health, drug dependence,
reproductive health, sexually transmitted diseases,
environmental risk assessment, nutrition and nutri-
tion related non-communicable diseases (and obe-
sity), water and sanitation, as well as UN HIV/AIDS
program and UNICEF’s adolescent development
and participation, and communication for devel-
opment programs. Now that the report has been
issued, there may be a unique opportunity to analyze
and strengthen the youth dimensions in the country
action plan for implementation of the recommenda-
tions of the WHO Commission on the Social Deter-
minants of Health (2008). The contribution of youth
to the implementation of such a plan would be both
as partners and as beneficiaries. The membership of
Egypt in the Commission is an advantage.
MentaL heaLth anD MentaL DisorDers Mental health is a state of well-being whereby the
individual recognizes his/her abilities, is able to cope
with normal stresses of life, works productively and
fruitfully, and makes a contribution to the commu-
nity or society.
The existing mental healthcare system in Egypt is
focused rather on mental disorders typically evident
across age groups. These are disorders that affect the
behavior, thinking, emotions, perception and voli-
tion of human beings and are due to various biologi-
cal, social and psychological stressors, and they need
medical attention with a psychiatrist and/or mental
health professional.
While a limited number of youth may suffer from seri-
ous disorders requiring medical aid, the vast majority
of young people in Egypt will not need to refer to the
existing health care system. They might, on the other
hand, benefit from some form of counseling, but for
cultural reasons, prefer to turn to family, mentors or
friends for help. Indeed, professional help at that level
is missing. There are, at present, few if any trained
counselors in Egypt, let alone practitioners specialized
in youth services.
The Broad Picture
In Egypt, there are 29 governorates that have psychi-
atric and mental health services. There are four main
governmental hospitals: Abbassia (opened in 1883)
with a capacity of 2171 beds, El-Khanka (opened in
1913) with a capacity of 2109 beds, El-Mamoura
(opened in 1967) with a capacity of 948 beds and
Helwan (opened in 1979) with a capacity of 600 beds.
There are also 10 smaller hospitals in different gover-
norates. Psychiatric services are found in all 17 medi-
cal and university hospitals in Egypt. Psychiatric hos-
pitals and services are also found in the private sector
and military hospitals.5
a MentaL weLL-being ProfiLe for egyPt’s youth
At present, information available on youth mental
well-being relies on observation, as statistical data
obtainable from research in Egypt rarely distinguish-
ing between age groups and focuses generally on the
more serious mental disorders. Nevertheless, what
information there is suggests that a predominant
problem is social exclusion. For example, research on
various aspects of social behavior has shown that lev-
els of youth volunteerism are very low, and participa-
tion in elections remains dismal.6
Additionally, unemployment among youth is at an
all-time high, already at 11% of the total labor force
for the period of 1996-2005. Migration is a com-
mon goal, and freedom to express opinion is a desire
expressed in numerous websites on the Internet.7 A
swell in sexual harassment, rape, and secret marriage
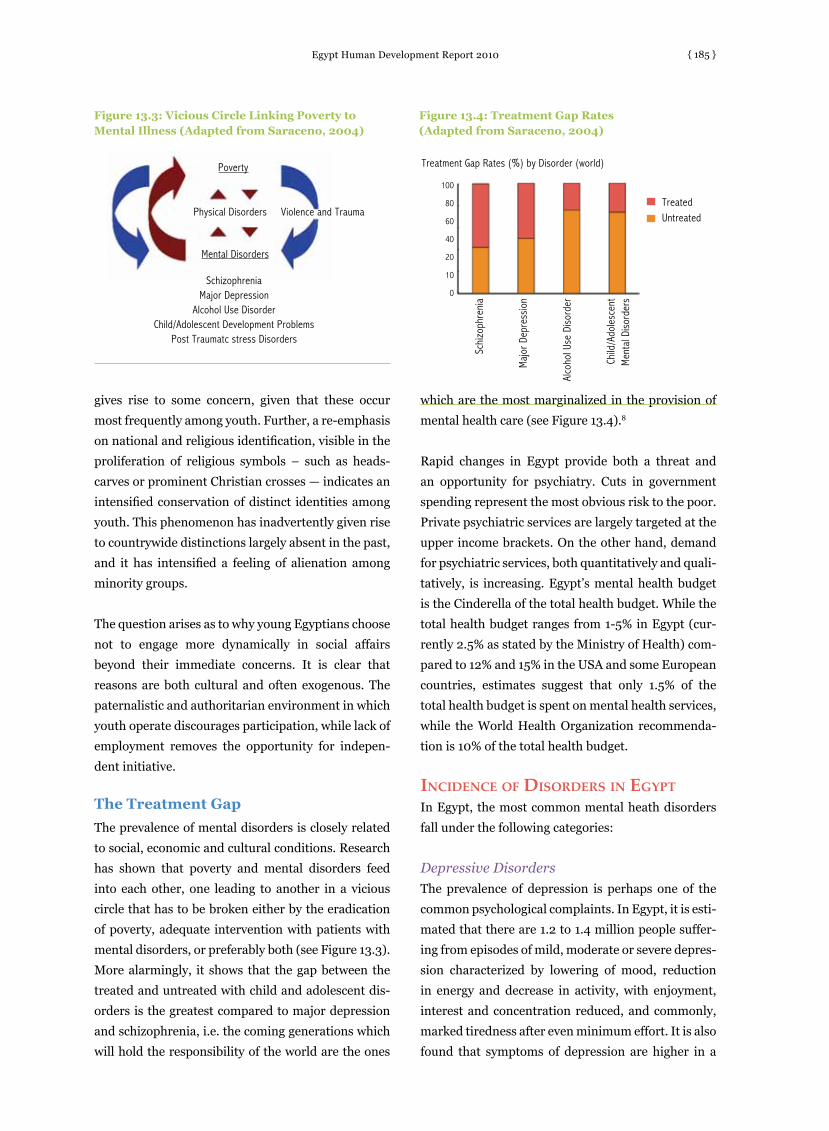
Egypt Human Development Report 2010 { 185 }
gives rise to some concern, given that these occur
most frequently among youth. Further, a re-emphasis
on national and religious identification, visible in the
proliferation of religious symbols – such as heads-
carves or prominent Christian crosses — indicates an
intensified conservation of distinct identities among
youth. This phenomenon has inadvertently given rise
to countrywide distinctions largely absent in the past,
and it has intensified a feeling of alienation among
minority groups.
The question arises as to why young Egyptians choose
not to engage more dynamically in social affairs
beyond their immediate concerns. It is clear that
reasons are both cultural and often exogenous. The
paternalistic and authoritarian environment in which
youth operate discourages participation, while lack of
employment removes the opportunity for indepen-
dent initiative.
The Treatment Gap
The prevalence of mental disorders is closely related
to social, economic and cultural conditions. Research
has shown that poverty and mental disorders feed
into each other, one leading to another in a vicious
circle that has to be broken either by the eradication
of poverty, adequate intervention with patients with
mental disorders, or preferably both (see Figure 13.3).
More alarmingly, it shows that the gap between the
treated and untreated with child and adolescent dis-
orders is the greatest compared to major depression
and schizophrenia, i.e. the coming generations which
will hold the responsibility of the world are the ones
which are the most marginalized in the provision of
mental health care (see Figure 13.4).8
Rapid changes in Egypt provide both a threat and
an opportunity for psychiatry. Cuts in government
spending represent the most obvious risk to the poor.
Private psychiatric services are largely targeted at the
upper income brackets. On the other hand, demand
for psychiatric services, both quantitatively and quali-
tatively, is increasing. Egypt’s mental health budget
is the Cinderella of the total health budget. While the
total health budget ranges from 1-5% in Egypt (cur-
rently 2.5% as stated by the Ministry of Health) com-
pared to 12% and 15% in the USA and some European
countries, estimates suggest that only 1.5% of the
total health budget is spent on mental health services,
while the World Health Organization recommenda-
tion is 10% of the total health budget.
inciDence of DisorDers in egyPtIn Egypt, the most common mental heath disorders
fall under the following categories:
Depressive Disorders
The prevalence of depression is perhaps one of the
common psychological complaints. In Egypt, it is esti-
mated that there are 1.2 to 1.4 million people suffer-
ing from episodes of mild, moderate or severe depres-
sion characterized by lowering of mood, reduction
in energy and decrease in activity, with enjoyment,
interest and concentration reduced, and commonly,
marked tiredness after even minimum effort. It is also
found that symptoms of depression are higher in a
Figure 13.3: Vicious Circle Linking Poverty to Mental Illness (Adapted from Saraceno, 2004)
Figure 13.4: Treatment Gap Rates (Adapted from Saraceno, 2004)
Schi
zoph
reni
a
Maj
or D
epre
ssio
n
Alco
hol U
se D
isord
er
Child
/Ado
lesc
ent
Men
tal D
isord
ers
Treated Untreated
Treatment Gap Rates (%) by Disorder (world)
SchizophreniaMajor Depression
Alcohol Use DisorderChild/Adolescent Development Problems
Post Traumatc stress Disorders
Physical Disorders Violence and Trauma
Poverty
Mental Disorders
100
80
60
40
20
10
0

Egypt Human Development Report 2010{ 186 }
rural than in an urban population, which is attributed
to the vast difference in services and opportunities for
youth in rural and urban areas.9
Similarly, there is an increase in cases of adjustment
disorders arising in the period of adaptation to a sig-
nificant life change or a stressful life event, whether
at work or at home. Interestingly, it was found that in
Europe, cases of adjustment disorder are usually sec-
ondary to work stress, while in Egypt it was found to
be secondary to home and family stress. These results
can be interpreted optimistically in that in Egypt,
family comes first, or pessimistically, in that work is
not a priority in a person’s life.
Somatization disorder — or multiple, recurrent and
frequently changing physical symptoms of at least
two years duration — is a common characteristic of
depression. Somatic presentation seems to render
mental ill-health more acceptable, since psychologi-
cal symptoms, as in Egypt, may frequently be cultur-
ally perceived as a sign of lack of faith and religiosity,
weak personality or predominantly inflicting females.
Anxiety Disorders
The first attempt to study the socio-demographic
aspects of anxiety disorders in Egypt and to apply
the Arabic version of the Present State Examina-
tion in evaluating the profiles of clusters and symp-
toms of anxiety was in a sample of 120 patients with
anxiety. The findings revealed that the most common
symptoms were worrying (82%), irritability (73%),
free-floating anxiety (70%), depressed mood (65%),
tiredness (64%), restlessness (63%), and anergia and
retardation (61%). The rarest were alcohol abuse (2%)
and drug abuse (5%).10
An early study on psychiatric morbidity among uni-
versity students in Egypt showed that anxiety states
were diagnosed in 36% of the total sample. By 1993,
anxiety states represented about 22% of the psychiat-
ric out-patient clinic in a selective Egyptian sample.11
Recently, it has been noted that some anxiety dis-
orders are on the rise, such as social phobia, which
has symptoms such as palpitations, sweating, dry-
ness of the mouth, and blushing that occur in social
situations or interactions. Interestingly, it was found
to be equal among males and females in Egypt com-
pared to other Arab countries in which there is a
marked gender difference, males having a higher
incidence. This has been attributed to segregation
between sexes at schools and activities, as well as
religious influences and the demand in some soci-
eties that males be more dominant and responsible
while females can be passive.
A crude estimate of suicide in Egypt would be about
3.5/100,000, assuming that one in ten suicide
attempts ends with actual suicide. There are no exact
figures on suicide as it is not reported in many cases
by the families of the deceased for religious, social
and cultural reasons.
A recent study attempted to find the current preva-
lence of attempted suicide by ingestion in a repre-
sentative Egyptian sample. It showed that 64.2% of
the sample was female with emotional problems,
while males attempted suicide because of studies/
work problems; 38.6 % of the attempters were stu-
dents with emotional problems and 27 % were unem-
ployed.12
Obsessive-Compulsive Disorder
Obsessive-Compulsive Disorders (OCD) are recur-
rent obsessive thoughts that enter the patient’s mind
again and again in a stereotyped form or compulsive
acts or rituals that are repeated again and again. This
was once believed to be a rare condition. An early
study in 1991 conducted in Cairo of 1,000 psychiatric
patients attending a university clinic showed an inci-
dence of OCD of 2.3%, indicating the stability of the
prevalence of the disorder over time.13
A study was conducted to determine the prevalence
of obsessive-compulsive symptoms among Egyptian
students. Prevalence rates for psychiatric morbidity,
obsessive traits and symptoms were 51.7%, 26.2% and
43.1 %, respectively. Obsessive-compulsive symp-
toms were more prevalent among younger students,
females and first-born participants. Aggressive, con-
tamination and religious obsessions and cleaning
compulsions were the most common.14
In the Arab World and in Egypt, people with OCD

Egypt Human Development Report 2010 { 187 }
wait an average of 10 years before seeking help since
most of the obsessions and compulsions are of a reli-
gious nature and are believed to be because of poor
faith. In Islam, weswas or compulsive thoughts and
behavior are attributed to the devil (OCD also uses
the Arabic word weswas to describe obsessions). As
a result, many patients refer to religious scholars and
sheikhs before turning to psychiatric help.15
Substance Abuse
Heroin abuse is traced to 1985 and peaked in 1988,
where 1335 kilograms were seized. The average
amount of heroin seized annually is about 50 kilo-
grams. This represents about 10% of the consump-
tion. If we calculate that the average daily intake is 1/4
to 1/2 gram per addict, we would therefore estimate
about 7-10,000 heroin abusers in Egypt in a popu-
lation of 70 million. For the last 5 years, opium and
cannabis plants have been locally planted, especially
in Sinai. Cocaine is rarely used where the amounts
seized annually range from 500-1000 grams.
An integral part of the work of the National Council
for Addressing Narcotics in Egypt is an assessment
of the national size of the problem. Surveys were
conducted as early as 1998 among secondary school
pupils, male and female university students and
industrial workers regarding their drug habits. The
results revealed that, on average, the most abused
substance was nicotine, followed by alcohol, hashish,
stimulant drugs, tranquilizers, hypnotics and finally
opium. Female university students abused fewer sub-
stances than male university students, except in the
case of tranquilizers and hypnotics, where the preva-
lence was similar.
Understanding the pattern of abuse is crucial for
developing any strategy that claims to address the
issue. Why is it that people abuse substances in the
Egyptian context? A study reports different rea-
sons for the different user categories. For secondary
school students, the main reason was entertainment
on social occasions and socializing with friends –
the substance mostly used being hashish. Sedatives
and hypnotics were the next most frequently abused
substances in situations of physical exhaustion and
fatigue, as well as to cope with psychosocial problems
or difficult working conditions as well as at times of
studying and exams.16 For university students, the
pattern was relatively similar with a greater tendency
to use hard drugs. Industrial workers tended to use
hashish and opium for recreation and psychoactive
substances to overcome exhaustion and to cope with
psychosocial problems.
Egyptian surveys have found a gradual increase in the
consumption of alcohol among Egyptians with a pre-
diction that it will become the most common abuse
in the next few years. It is interesting to note that
although alcohol is religiously prohibited in Islamic
countries and despite its availability in Egypt com-
pared to the Gulf countries, the incidence of alcohol
abuse is much higher in the Gulf states, where its sale
is prohibited.17
A comparative study on drug abuse among youth in
general secondary school and technical education
was part of a series of studies of the Permanent Pro-
gram for Research on Drug Abuse. The sample was
comprised of 12,969 students (4 percent of the total
population) from general secondary education and
11,966 students (2 percent of the total population)
from technical secondary education. The study iden-
tifies the reasons behind the continued use of drugs.
Youth in the less prestigious technical education
stream experience far more drug abuse (i.e. drugs,
cigarettes and alcohol) than those in general second-
ary education.18
Availability of drugs may be a large driver behind
these findings. In the case of cigarettes, for instance,
youth in technical education identify failure in educa-
tion, experiencing pain and availability of cigarettes
as the main factors driving them to smoke. Fortu-
nately, the figures show that only a quarter of those
who continue to use drugs from both groups experi-
ence addiction or dependence on drugs. The major-
ity of the sample use drugs occasionally, with a small
minority using them on a regular basis.
In a more recent study on the lifetime prevalence of
substance misuse in Egypt, a community survey as a
multistage study in 8 governorates, found the life time
prevalence of substance abuse to be 9.6%, including
Egypt Human Development Report 2010{ 188 }
3.3% experimental and social use and 4.64% regular
use; 1.6% of the sample was diagnosed with substance
dependence and the prevalence of substance use in
males was 13.2% and 1.1% in females. The study also
stated that the age range from 16 – 19 showed the
highest onset of substance use, with cannabis being
the drug mostly misused in the study, followed by
alcohol, pharmaceuticals, opiates and stimulants.19
Women: A Special Case
Several studies have indicated that women are dis-
proportionately affected by mental health problems
and that their vulnerability is closely associated with
marital status, work and roles in society.20 These find-
ings have been widely replicated worldwide. The aim
here is to shed light on some social elements that con-
tribute to women’s psychological distress. However,
since those elements constitute part of a woman’s
everyday life, they are often overlooked together with
the psychological ailments they may produce.
Depressive disorders account for close to 30% of the
disability from neuropsychiatric disorders among
women, but only 12.6% of that among men. Sev-
eral studies suggest that anxiety in women tends to
increase with age and with decreasing socioeconomic
status. Anxiety has been described as fear of antici-
pated future loss; depression is described as a reaction
to perceived loss. Fear of loss of face, esteem, respect,
status, love, income, attachment, being fired and
retiring all reinforce insecurity and create a perceived
inability to predict or control outcome.21 Described
that way, anxiety may not be an altogether inappropri-
ate response, given the life situation of many women
in our country and region – women, young and old.
Factors that have been found to put women at risk of
depression include infertility, domestic isolation, an
unhappy marriage, physical or sexual abuse, power-
lessness and poverty, all being associated with higher
prevalence of psychiatric morbidity (exclusive of sub-
stance disorder) in women. Other factors include sex-
ual and reproductive problems and domestic violence.
Gender Roles and Psychological Distress22
A Passive Life Partner to the Man
It is one of the basic principles of Arab and Egyptian
culture that the man has the major responsibilities in
making important decisions. Decisions like getting
married or obtaining a divorce must be endorsed by
the father or the husband. Giving away vital personal
and life detrimental decisions to another person puts
Egyptian woman in a passive, observant position to
events happening to her and her person. The position
of being passive observant to painful events is simi-
lar in many ways to the learned helplessness model
described as one of the dynamics of depression.
Forced Dependency
In the Arab culture, a woman cannot chose to be inde-
pendent even if she is able to. There is a simple rule
stating that no woman is expected to live alone. The
sense of entrapment can be a source of much stress
contributing to the state of helplessness. An unmar-
ried woman is so uncomfortable in her single status
that she might accept any offer of marriage. That
would especially be the case when she is facing a cruel
father or a rejecting brother. But even when this is not
the case, a divorced Egyptian woman is stigmatized
among her family and neighbors, and no matter what
the reason for the divorce she always has to live the
guilt that it was her fault she could not maintain that
marriage.
The Less Privileged Partner
There is a common but equally erroneous belief that
traditions and social norms in the Arab world and
Egypt are derived from the religious teachings of
Islam. Prohibition of sexual freedom and the extreme
punishment for it is, however, an Islamic tradition
that equally treats both males and females. Extramar-
ital sex is just as prohibited for males as for females;
however, the culture does not frown on male’s extra-
marital sex but considers the same action by a female
often deserving of no less than death. This double
standard is the core dynamic to many issues that are
dealt with in psychotherapy.
The spectrum of violence, of which women are either
directly or indirectly the victims, extends from the
private to the public. Violence against women may
originate in symbolic cultural practices with long
standing traditions or as an expression of the existing

Egypt Human Development Report 2010 { 189 }
gender relations, which allow for this violence with-
out major social condemnation.
Culturally Determined Gender Violence
One of the most contested cultural traditions is female
circumcision or female genital mutilation performed
by mothers and adult women upon female children
as part of ritual initiation into the status of woman-
hood in Egypt and elsewhere. Negative health conse-
quences of circumcision are said to range from high
rates of urinary tract infections to vaginal tearing, fis-
tulas and damage to the vagina and urinary tact dur-
ing childbirth and sexual intercourse.
Most of the attention given to health problems
related to female genital mutilation concentrates on
the physical aspect, with little attention to the psy-
chological problems. Psychological problems include
nightmares, shock, passivity and feelings of betrayal.
These emotional disturbances lead the way to some
psychiatric disorders like Post Traumatic Stress Dis-
order, with an estimated high rate of up to 30% of
cases. There are no exact figures for the incidence of
emotional or psychological effects, but it is probable
that this would be small in communities where social
pressures are strongly in favor of female circumci-
sion. Conversely, in such circumstances, the uncir-
cumcised girl may be the object of disapproval and
derision.23
No studies have been conducted In Egypt to measure
the effect of the trauma. The psychological complica-
tions of female genital mutilation may be submerged
deeply in the girl’s unconscious. In light of this, pub-
lic health departments and women’s movements in
Egypt have recently sought ways to curtail the prac-
tice and have brought about changes. New laws have
prohibited the practice of female circumcision, but
will that be enough to change the cultural traditions?
Domestic Violence
The vast majority of victims of domestic violence are
women. When the violence is between spouses, 98%
of the time, it is the wife who is assaulted. The pri-
vate nature of this form of violence, and the shame,
guilt and social taboos associated with it means that
much remains hidden, not only from the public but
from family, friends and health care practitioners.
This makes accurate information on the prevalence of
domestic violence difficult to obtain.
An early Egyptian study revealed that 32% of a sam-
ple of 500 women of low and middle social class,
some of whom were university graduates, was beaten
by their husbands.24 Half of them were beaten hard
enough to require medical help. The Egyptian Demo-
graphic Health Survey of 1995 reported that one out
of three married Egyptian women has been beaten
at least once since marriage and one-third of those
were beaten during pregnancy.25 Domestic violence
remains a serious public health problem and is a
major contributor to psychiatric symptomatology. A
study carried out by the Egyptian Centre for Women’s
Rights Health Demographic Survey in 2000 found
that one out of three women were subjected to vio-
lence, 40% of them during pregnancy.
Rape
Rape is a masculine predilection, an act of violence
in which women figure not as victims but as objects.
The psychological consequences of rape in societies
where a young woman’s worth is equated with her
virginity are particularly ruinous. Women who are
raped are socially wasted. Their ruined reputation
cannot be amended. A pre-marital sexual relation
is said to spoil something intrinsic in their physi-
cal and moral person. Until recently, Egyptian law
allowed rapists to marry their victims, in which case
their punishment would be withdrawn. Fortunately,
this provision has been removed from Egyptian law
upon advocacy work of women’s organizations in
Egypt. The attitude behind such legislation focuses
on virginity and physical trauma, overlooking the
considerable mental trauma for a woman. The strong
cultural stigma attached to rape means that women
survivors of sexual violence are often reluctant to
seek medical assistance or to file police reports. Even
when incidents are reported, effective responses may
not be forthcoming, since many people hold women
responsible for being raped.
Sexual Harassment26
A recent study of 2000 Egyptian participants (50%
males and 50% females) as well as 109 foreign women

Egypt Human Development Report 2010{ 190 }
living in Egypt, conducted in the three governorates
of Cairo, Giza and Qualyubia, found that 48% of
Egyptian, whether veiled or not, and 51.4% of foreign
women of all ages were subjected to sexual harass-
ment. However, 62.2% of the male sample indicated
that women in the age group 19-25 years old were
more susceptible to sexual harassment.
The study showed that 90% of Egyptian women, 78%
of foreign women and 59% of males reported that
the harasser did not distinguish between victims in
regards to economic class. The study concluded that
working women are most likely to be subject to sexual
harassment, followed by female tourists, housewives
and the mentally disabled.
Sexuality, Delayed and Secret Marriages
Sexuality is a central aspect of being human through-
out life and it encompasses sex, gender identities
and roles, sexual orientation, eroticism, pleasure,
intimacy and reproduction. Sexuality is experienced
and expressed in thoughts, fantasies, desires, beliefs,
attitudes, values, behaviors, practices, roles and rela-
tionships. While sexuality can include all of these
dimensions, not all of them are always experienced or
expressed. Sexuality is influenced by the interaction
of biological, psychological, social, economic, politi-
cal, cultural, ethical, legal, historical and religious and
spiritual factors.27
A study in Egypt on youth28 found that one third of the
females and half of the males were unmarried, and
while most single women were economically depen-
dent on parents, single men exhibited varying degrees
of dependence that could even include support and
contribution to the family. Sixty-four percent of
all males and 35% of all females surveyed reported
the reason to marry was love, while 31% of females
reported that the marriage occurred because it was
arranged, (more acceptable for females than males).
Single females found 21.7 years to be an appropri-
ate age for marriage while engaged/married females
found 17.7 to be appropriate; single males found 25
years to be an appropriate age for marriage while
engaged/married males found 22.6 to be appropri-
ate. It is worth noting that 37% and 18% of males and
females, respectively, were likely to remain unmar-
ried beyond the age of 30, and those figures jumped
to 60% and 47% for those with post secondary educa-
tion. Insufficient financial resources and the desire for
career success were the most common impediments
for young males to marry, while the desire for further
education and the lack of opportunity for introduc-
tions were most common for females.
The incidence of marrying too young — that is, below
the age of 14 years — was found to be concentrated
mainly among females who had low education attain-
ment levels and/or were residents of rural Upper
Egypt. Those married at young ages were also most
likely to reside in the same house as the parents.
Relationships outside of an official marriage appear
to be on the rise, with a third of males and a quarter
of females reporting such relationships, and 13% of
males and 3% of females reporting knowing someone
whose relationship involved sexual relations. Secret,
or urfi, marriages (undeclared, unregistered) were
found to be subject to social stigmatization. Neverthe-
less, 4% of youth had a secret marriage, with the fig-
ure rising to 6% of university students. This phenom-
enon is often found to be a compromise solution to the
financial impediments to marriage as well as to the
religious and cultural stigma of sex before marriage.
Aggression in Youth
Aggression refers to behavior that is intended to cause
pain or harm to another. Violence, on the other hand,
is the expression of physical force against the self or
other, such as in the destruction of property or goods.
There are several determinants of aggression and vio-
lence:
• Social factors, which include frustration. In
Egypt, this can be frustration in not receiving a
decent education or job, being unable to get mar-
ried, and the perceived inequality in the provi-
sion of justice. Direct provocation from others,
as well as exposure to aggressive models, are also
important determinants of aggression.29
• Situational factors, which include increased
physiological arousal as seen at demonstrations,

Egypt Human Development Report 2010 { 191 }
soccer matches and competitive activities. Group
and crowd dynamics can play a part. Exposure to
sexual arousal through films or pornography can
increase aggressive behavior.
• Environmental factors which include increased
pollution, noise and overcrowding, poor trans-
portation, and Egypt’s hot climate are all factors
present in most of the cities of Egypt.
Language and Culture
Our cognitive schemata and thinking are dependant
on language which gives us the ability to communi-
cate, update our knowledge, appreciate abstract ideas,
build up logical sequences and develop aesthetic val-
ues. Language is also an essential component in the
formation of a person’s national identity. Currently in
Egypt, language takes many shapes: As a base, there
is the high classical Arabic of the Quran, which dif-
fers from the everyday vernacular spoken at home
or school, modified and simplified in the press, or
juggled around in songs and popular culture; added
to these usages is the new hybrid cyber language of
the computer, mixing Arabic with new technical ter-
minology, often in Latin script. There is concern that
this chaotic combination affects youth’s ability to
clearly express thoughts and ideas in some form of
collective shared language.
This trend has been exacerbated by the choice of the
upper and upper middle classes in Egypt to move
children’s education from the national to private
foreign education provided by, for example, British,
American, French, German, and Canadian schools.
These teach at all levels in a foreign language and
their qualifying exams for higher education are not
in Arabic. This, in turn, has lead to a dilemma. Mas-
tering languages other than Arabic, while practical in
a globalizing world, can also distance young people
from their own culture and from large segments of
their own population by reducing their mastery of
their mother tongue.
Further, deterioration in the teaching of the Ara-
bic language has created a generation of students
who are unable to use the Arabic language properly.
Numerous studies have confirmed that the use of a
mother language during the years of education has
a marked influence on the sense of pride in belong-
ing to a society or a country. The question arises as
to what extent the evolution or transformation of tra-
ditional Arabic usage can be seen as a drawback or a
loss to the awareness of national identity, or whether
it indicates, rather, an expansion of such an identity.
Spirituality and Mental Health
The spiritual dimension is often overlooked as an
aspect of health, particularly mental health. Spiritu-
ality and religion are often used interchangeably. A
working definition of both could argue that religion
is the outward practice of a spiritual system of beliefs,
values, codes of conduct and rituals. These provide a
context and a framework to socially accepted behavior.
Unfortunately, cultural and religious approaches now
appear to have become a part of what goes on in the
name of mental health practice in many countries.
But there are two lurking dangers in this approach:
The first is that of ethnocentricity or the belief that
“my culture is the best” and the second is the danger
that mental health procedures might move away from
their scientific roots, which are the basis on which
medical practice is built. The rise in religiosity and
ritual behavior observed across Egypt today points
to the need for a set of values that make sense of the
world. Science and technology have made our lives
easier, but they do not teach us how to live. The strug-
gle between traditional faith and modernity has yet to
play itself out, but it is clear that for young people, a
spiritual framework can be an added asset to mental
well-being.

Egypt Human Development Report 2010{ 192 }
Endnotes1 Uauy and Solomon, 20062 McMichael et al (2009). 3 WHO, 20094 DHS, 20085 Okasha and Okasha, 20096 SYPE, 20097 Arab Human Development Report, 20098 Saraceno, 20049 Estimates given by Dr. Tarek Okasha, practicing
psychiatrirst10 Okasha and Ashour, 198111 Okasha et al, 199312 Okasha, A., Bassim, R., Okasha, T. (2008):13 Okasha and Raafat, 199114 Okasha et al, 200115 Observation from clinical experience, Tarek Okasha
(2009)
16 Soueif, 199417 Okasha, 199618 Soueif et al, 200319 Hamdi et al, 2009b20 Desjarlais et al, 199521 ibid22 El Dawla, 200123 Seif el Din, (2009), ‘Female Mutilation’24 New Woman Research Center, 199525 National Population Council, 199626 Hassan et al, 200827 WHO (2002).28 El Tawila and Khadr 200429 Dr. Tarek Okasha, clinical observation
referencesArab Human Development Report (2009): Challenges to Human Security in the Arab Countries, United Nations Development
Programme (UNDP), Regional Bureau of Arab States (RBAS) New YorkCom mission on Social Determinants of Health (2008) Closing the gap in a generation: health equity through action on the determinants
of health. Final report of the CSDH. WHO Geneva. Desjarlais R, Eisenberg L, Good B and Kleinman A. (1995): World Mental Health: Problems and priorities in low income countries.
New York, Oxford, Oxford University Press.El Tawila, S and Khadr, Z. (2004):. The Center for Information and Computer Systems, Faculty of Economics and Political Science,
Cairo University, and the National Population Council, Institutional Development Project, Research Management Unit.El-Zanaty, Fatma and Ann Way (2009) Egypt Demographic and Health Survey 2008. Cairo, Egypt: Ministry of Health, El-Zanaty and
Associates, and Macro International.Grantham-McGregor, S. et al, and the International Child Development Steering Group, (2007) Developmental potential in the first 5
years for children in developing countries. Lancet 369: 60–70.Hamdi, E., Losa, N., Mamdouh, R. Edward, A. and Fathi, H. (2009): Lifetime prevalence of substance misuse in Egypt: A community
survey (in press).Hassan, R., Shoukry, a. and Aboul-Komsan, N. (2008): Clouds in Egypt’s Sky; Sexual Harassment: from Verbal Harassment to Rape:
A Sociological Study. The Egyptian Centre for Women’s RightsMcMichael A.J. et al (2009) Climate change: A time of need and opportunity for the health sector. www.thelancet.com Published
online under “VIEWPOINT” on November 25, 2009National Population Council (1996): Demographic Health Survey Cairo, September 1996.National Population Council (2010) Personal communication of preliminary results of the of the SYPE survey.Okasha, A. (1996): Combat and Management of Drug Abuse: Means and Challenges. An Egyptian Perspective. Addressed as a plenary
lecture in the first international conference on addiction and Drug Dependence, Cairo, March.Okasha, A. & Ashour, A. (1981) Psycho-demographic study of anxiety in Egypt: the PSE in its Arabic version. British Journal of
Psychiatry, 139, 70-73Okasha, A., Bassim, R., Okasha, T. (2008): Epidemiology and Psychiatric morbidity in suicide attempters at the poison control centre.
Current Psychiatry, 15, 231-238 Okasha A, Raafat M (1991): The biology of obses¬sive compulsive disorder, evidence from topo¬graphic EEG. Arab Journal of
Psychiatry 2(2):106-117.Okasha A, Ragheb K, Attia AH et al. (2001). Prevalence of obsessive compulsive symptoms (OCS) in a sample of Egyptian adolescents.
Encephale 27(1):8-14.Okasha-A, Seif El Dawla-A, Khalil-AH, and Saad-A (1993): Presentation of Acute Psychosis in an Egyptian Sample: A Transcultural
Comparison, Comprehensive Psychiatry, Vol. 34, No.1, 4-9.Saraceno, B. (2004): Why Should Nations Invest in Mental Health? Presented at the Okasha Annual Lecture. Cairo, Egypt.Seif El Dawla, A. (2001): Social Factors Affecting Women’s Mental Health in the Arab Region. In Okasha A and Maj M. (eds.) Images
in Psychiatry: An Arab Perspective. World Psychiatric Association. Scientific Book House, Cairo. Sief Eldin, A. (2009): Female mutilation. In Contemporary Topics in Women’s Mental Health. Chandra, P., Herman, H., Fisher, J.,
Kastrup, M., Niaz, U., Rondon, M. And Okasha, A. (eds.) World Psychiatric Association. Wiley-Blackwell pp 485-498 Soueif, MI (1994) Extent and patterns of Drug use among students and working class men in Egypt. The national Center for Social and
Criminological Research, Cairo.Uauy, R. and Solomon, NW (2006) The role of the internationaln community: Forging a common agenda in tackling the double
burden of malnutrition. UN SCN News No. 32, ISSN 1564-3743.UN SCN News (2006). Adolescence: A Pivototal Stage in the Life Cycle. No. 31, 2006, ISSN 1564-3743World Health Organization (2002): World Health Organization’s Statement on sexual health. Geneva. World Health Organization. World Health Organization (2008) World Health Report, WHO Geneva.World Health Organization (2009) Global Health Risks. Mortality and burden of disease attributable to selected major risks. WHO,
Geneva.World Health Organization (2006) Preventing Disease through Healthy environments – Towards an estimation of the environmental
burden of disease, WHO Geneva, أحمد عكاشه و طارق عكاشه (الطب النفسي املعاصر) مكتبة األجنلو املصرية الطبعة اخلامسة عشر 2010 مصطفى سويف، هند طه ومايسه جمعه (تعاطى املواد املؤثرة فى األعصاب بني تالميذ الثانوى العام وتالميذ الثانوى الفنى : دراسه مقارنه على اسس ميدانية). القاهرة، البرنامج الدائم لألبحاث
(على تعاطى اخملدرات واجمللس القومى للبحوث اإلجتماعيه واجلنائيه (2003
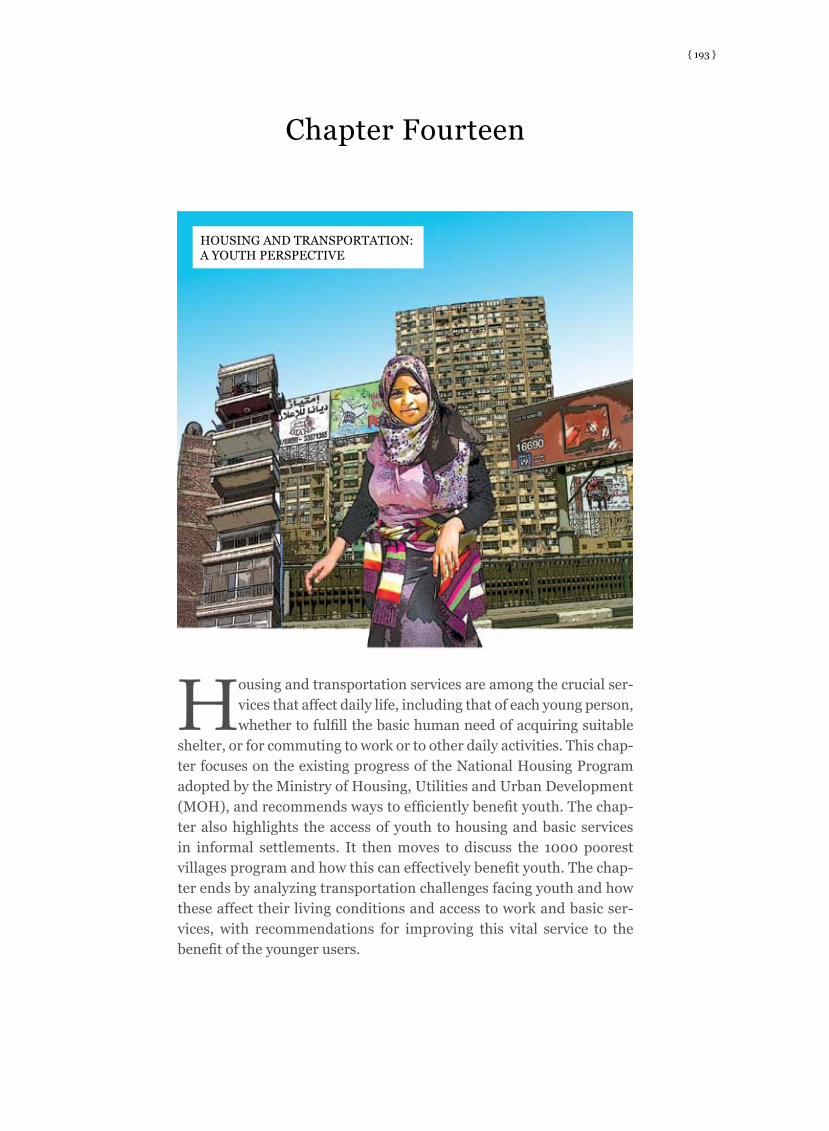
{ 193 }
Housing and transportation services are among the crucial ser-vices that affect daily life, including that of each young person, whether to fulfill the basic human need of acquiring suitable
shelter, or for commuting to work or to other daily activities. This chap-ter focuses on the existing progress of the National Housing Program adopted by the Ministry of Housing, Utilities and Urban Development (MOH), and recommends ways to efficiently benefit youth. The chap-ter also highlights the access of youth to housing and basic services in informal settlements. It then moves to discuss the 1000 poorest villages program and how this can effectively benefit youth. The chap-ter ends by analyzing transportation challenges facing youth and how these affect their living conditions and access to work and basic ser-vices, with recommendations for improving this vital service to the benefit of the younger users.
HOUSING AND TRANSPORTATION: A YOUTH PERSPECTIVE
Chapter Fourteen

Egypt Human Development Report 2010{ 194 }
status of the nationaL sociaL housing PrograM Four years from the beginning of implementation,
the National Housing Program is moving towards
realizing its target of 500,000 units within a six year
period. As of end of December 2009, 235,000 units
and land plots have been built or delivered to benefi-
ciaries, while some 190,000 units are under construc-
tion. The program has been implemented through
seven axes — among which three axes are Ibni Beitak
land blots, rental and owned housing units, and pri-
vate developers — are considered the most important
and widely applied. Table 14.1 shows the distribution
of units built according to each axis.
This sites-and-services model initiated by the Min-
istry of Housing (MOH) in 2006 is to be developed
in the 18 new cities and urban communities. Each
household is allowed to build a maximum of a ground
plus two floors on 50% of the 150 square meters land
plot. The serviced land price asked of households is
LE70 per m2 (compared to an average of LE150 per
m2 as indicated by the Ministry, for infrastructure
cost recovery). The land price is payable over 10 years,
with a 10% down-payment, a 3-year grace period, and
the balance in annual instalments over 7 years with-
out interest. The LE 15,000 upfront subsidy is dis-
bursed in three stages, tied to construction progress.1
By the end of the fourth year of the National Demo-
cratic Party (NDP) electoral program, the Ministry
of Housing had delivered 89,000 land plots within
the new cities, distributed as shown in Table 14.2. In
addition, the Ministry has been keen to provide those
new communities with basic social services such as
schools and health care units, constructed in paral-
lel with the development of the housing units in two
main phases. The distribution of those services is
shown in Table 14.3.
Rental and Owned Housing Units in Governorates
The total number of units built so far has reached
89,000 units in addition to 95,000 units under con-
struction. The selection of sites, tendering, manage-
ment of construction and units allocation are the
No. (1000s)
39.715.92.31.63.71.55.6
City
New MeniaNew AsyoutNew SalhiaNew FayoumNew SohagNew Aswan New Valley
No.(1000s)
5.75.20.62.32.41.5
1
Table 14.2: location of Ibni Beitak Units
Axis
Owned units in Governorates/cities (Tamleek)Providing small land plots for individuals in cities (Ibni Beitak)Providing land for private developers to build 63sq.m. housing unitsUnits with 30-40 sq.m. for mostly deprived groupsRental units of 63 sq.m. in Governorates, new cities and Awkaf landOwned rural housing units in Governorates and villages in desert hinterland (Tamleek)Owned family houses in 6th October City (Tamleek)
Total
Table 14.1: Distribution of Housing Units According to Seven Axes of National Housing Program
No. of units built (1000s)
1178916
44
41
235
No. of units under construction (1000s)
1100
204312
32
190
Source: Ministry of Housing, 2009
City
6th October10th RamadanBadrNew NubariaSadatNew Burg El-ArabNew Beni Suef
Total 89.000 units
Source: Ministry of Housing, 2009
First Phase
17264218
3
106
Second Phase
26311417
0
88
Total
43575635
3
194
Table 14.3: Distribution of Ibni Beitak Units
Type of Services
SchoolsHealth units centersShopping mallsKindergartens Sports Centers
Total
Source: Ministry of Housing, 2009
Egypt Human Development Report 2010 { 195 }
responsibilities of the governorate, while the Minis-
try of Housing is basically the financier of the process
through allocating the nominated grant for each unit
(LE 20,000) based on real evidence of construction
delivered by the governorates.
Private Investors Housing Projects
The Ministry of Housing has allocated about 6300
feddans through this axis, of which 5300 feddans have
been used for the construction of 63 m2 units, while
the remaining area has been utilized for the construc-
tion of units with an area less than 120 square meters.
Currently, 66 private companies are building 21,000
units in several new urban communities with the
expectation that this will provide more than 263,000
units within the coming five years. In addition, the
Ministry of Housing in 2008 started the allocation of
land plots to be used for middle-income housing to
be developed by housing cooperatives, syndicates and
government bodies.2
Evaluation of the National Housing Program as it Impacts Youth
The introduction of new housing options has enhanced
housing market diversification for low income youth
households. The smaller 35m2 rental units give an
affordable option for the lowest income groups who
do not have enough savings for a down-payment on
a homeownership unit and are very income-con-
strained. The larger 63m2 rental units attract mod-
erate income youth households with a preference for
a starter home, with a 5-10 year lease duration, and
do not have the required down-payment for owner-
ship. Moderate-income youth households with a
preference for homeownership and with the ability
to provide a down-payment have options in the new
urban communities and governorates 63m2 owner-
ship units. Finally, middle-income youth households
with the ability to afford higher down-payments and
secure larger loans would represent the best target
group for the Ibni Beitak option or could acquire
existing units developed by the private sector.
Another innovative step, offered by the Ministry of
Housing for the owners of Ibni Beitak land, has been
to enable those who are willing to build a second unit
for a qualifying household to access a second National
Housing subsidy.3
Despite the innovative approaches adopted by the
government and the significant efforts to enhance the
subsidy mechanisms in order to reach the targeted
groups, especially young people, there are major con-
cerns over the sustainability of such efforts:
• The National Housing Program (NHP) is prov-
ing to be very expensive for the government. The
total direct subsidy for each single unit within
the original 500,000 units is estimated at LE
32,500. This subsidy includes the direct upfront
grant allocated for the unit (15,000LE), the dif-
ference between the actual price of land served
with infrastructure (150LE/m2) to the sold price
(70LE/m2), in addition to differences in total
construction cost of the unit due to increases
in building materials prices. This is apart from
the indirect subsidies, such as the opportunity
cost of unserviced land and below-market rate
financing. Adding those indirect subsidies brings
the overall bearable cost by the government for
each unit to LE 52,000. This subsidy can exceed
LE 70,000 for the 63m2 rental unit.
• The decision to extend an equal LE15,000 upfront
grant for all NHP qualifying households contra-
dicts the progressive subsidy policy approach in
which governments would provide a higher sub-
sidy share of unit cost for lower-income house-
holds, in line with their affordability, versus a
lower subsidy share for products targeted at
households with relatively higher incomes. Yet,
the reality after accounting for other subsidies
extended under the program is that the benefi-
ciary of a product such as Ibni Beitak, receives
the largest direct subsidy amount per unit.
• The current global economic crisis has con-
tributed to slowing down the unprecedented
increase in the price of building materials that
took place before the crisis. However, the fore-
casted increase in construction costs will likely
pose a great budgetary challenge for any hous-
ing program in the coming years given that most
subsidy programs within it are tied to specific
income levels and unit price targets. Accord-
ingly, pressure is likely to build on the govern-
ment to fill the gap with additional subsidies.
Egypt Human Development Report 2010{ 196 }
Another concern is affordability, since some axes
of the NHP (such as the private sector axis) require
a contribution by young people that is beyond their
financial means. This is coupled with the fact that
the mortgage loan, a main channel to acquire finan-
cial support apart from a government direct grant,
is constrained by a stipulation in the Mortgage Law
that restricts monthly repayment to 25% of household
income.
With a maximum loan amount still ranging from LE
30,000 to LE 45,000, youth beneficiaries are obliged
to make down-payments of between LE 23,000 to LE
40,000, significantly above the LE 5,000 envisioned
in the NHP. Unless the affordability constraint is
resolved, it is likely that there will be leakage of units
to higher income households. There would definitely
be growing pressure to increase subsidies to keep the
units affordable to the less affluent target group in any
future housing program adopted by the government.4
iMProving the efficiency of subsiDies to reach target grouPsGiven the remarkable success of the ongoing National
Housing Program so far, the Ministry of Housing has
adopted plans to support this innovative program by:
• Increasing the contribution of the private sec-
tor in the various social housing schemes; in
this respect, ‘base of the pyramid’ housing for
the poor have been developed by private sector
companies in Egypt, notably by Orascom and
ADAPT;
• Moving towards a more efficient mortgage-
linked finance system with the government in
providing housing for the most deprived groups;
• Developing the institutional framework for the
policy of subsidized housing which complies
with and reflects the subsidy mechanisms and its
annual budget on the national level;
• Enabling more decentralized management
within governorates or new urban communities
according to general guidelines set by the Minis-
try of Housing;
Box 14.1: The Housing Market and Youth
The housing market in Egypt had seen a number of market-oriented reforms started by President Sadat in 1974. This was
crowned by Law No. 4 of 1996 which allows landlords to sign definite duration contracts, and known in the housing market
as “ the new law rent” compared to the traditional unlimited period contracts known as “old law rent.” Both SYPE (2009)
and ELMPS (2006) surveys have indicated the significance of this law and the overall set of reforms in the housing market.
While the share of old rent housing in the housing market dropped from 14.2% in 2006 to 7.5% in 2009 among married
males aged 18-29 years, the share of new rent housing rose from 4.5% in 2006 to 10.7% in 2009.
The growth in new rent housing in 2009 is tangent to a wide and different variety of young groups. This pattern of housing is
gaining increased attention in rural areas. SYPE shows that it seized 5.5% of the housing market in rural areas, compared
to only 2.4% measured in the ELMPS. In addition, the new rent contract is becoming more attractive to all classes. The
survey showed that the middle class benefited the most from this law as its members account for 47% of new rent housing.
However, SYPE also shows that other classes, even the rich, utilize this law, as the richest 40% of married males aged
18-29 accounted for about 50% of new housing contracts.
This suggests that young people find this new pattern of housing contracts a satisfactory solution to overcome the largest
bulk of marriage costs. According to ELMPS, one-third of the total cost of marriage is allotted to initial housing costs.
Assaad and Ramadan (2008) based on the 2006 ELMPS prove that the marked decline in age of first marriage is partly
due to the increased availability of new rent housing since the 1996 housing reforms. This reflects the importance of these
reforms on length of the ‘waithood’ period, specifically for marriage formation.
The other marked change in the housing market is the increase in housing ownership. The share of owned housing among
married young males aged 18-29 years rose in the period 2006-2009 by 60%. The share of owned housing is now 78% in
the total housing market in 2009. The national housing project cannot explain this growing demand because beneficiaries
do not exceed 1.5% of ownerships among married young males aged 18-29 years. Source: Mohamed Ramadan, IDSC

Egypt Human Development Report 2010 { 197 }
• The National Democratic Party in its 2009 hous-
ing working paper has emphasized the need to
adopt subsidy reform to better reach the real
beneficiaries and avoid current distortions, in
addition to providing flexible and various sub-
sidy packages that are affordable to different
income groups.
Strengthening the mortgage-linked finance scheme
appears therefore crucial for a future subsidy pro-
gram. A new scheme of upfront household subsi-
dies should be part of a comprehensive package to
finance a unit including a mortgage credit and house-
hold down-payment. Increasing access to housing
finance will increase the ability of lower-middle and
middle-income households to purchase housing and
thus allow the government to focus on implementing
housing programs for the low-income.5 This is criti-
cal because there is potential for the private mort-
gage market to serve a large portion of the middle
and lower-middle income households with much less
subsidy (and with the ability for segmentation among
beneficiary groups) than in the traditional, supply-
side government housing programs.
Such measures would enable the government to con-
centrate its limited resources on those who need them
most. The advantages of such a program are that:
• The subsidy benefits the consumer directly,
rather than indirectly through a subsidy to devel-
opers – this generally improves the efficiency
and transparency of household subsidies;
• It increases the ability of middle and lower-mid-
dle income groups to access credit and hence
lowers the amount of needed subsidy; and
• It allows expanding mortgage markets to play a
pivotal role in increasing the housing supply.
However, mortgage-linked subsidies are only feasible
for households that are creditworthy and for proper-
ties trusted as collateral by lenders. In the Egyptian
housing market, this means that a large proportion of
households deserving of a subsidy cannot be served
through such a program. Consequently, it needs to be
complemented by alternative subsidy programs that
cater to those households excluded from mortgage
lending — for example, sites-and-services projects
that combine a serviced land with a subsidy, self-help
construction with access to micro-loans, subsidized
rental housing, as well as such instruments as guar-
antees and contractual savings schemes for access
to mortgage finance by qualifying households with
undocumented/irregular income.6
Finally, there is a need to promote an improved sys-
tem for private sector development of subsidized
housing. The ongoing private sector scheme has
drawn several lessons. Among them are introducing
pre-determined unit sales price targets, sharing com-
mercial risk with private developers, improving land
and subsidy disposition, and improving the monitor-
ing of project outcomes by the Ministry of Housing.
the nationaL PrograM for iMProving the Poorest 1000 viLLages
In a concerted effort to eradicate poverty in rural
areas and enable youth to acquire their basic needs
of housing and social services, the government in
2008 launched a national program to improve liv-
ing conditions of the most deprived families in the
poorest 1000 villages in Egypt by providing access
to basic urban services. The program is being imple-
mented by several ministries (Ministries of Housing,
Local Development, Education, Social Solidarity,
Environment, Transportation, Health, Family and
Population, and Higher Education), as well as cen-
tral authorities (Social Development Fund, National
Councils for Sports and Youth, National Post Author-
ity and National Authority for Illiteracy Eradication).7
The Program includes 14 different aspects with the
objective of reaching higher standards of infrastruc-
ture and social services, including:8
• Improving the water supply and sanitation;
• Upgrading of health services and emergency and
ambulance facilities;
• Improving the quality of basic education and
raising the standard of other education levels;
• Widening social support and services for critical
cases;
• Housing the most deprived groups;
• Upgrading of youth and sports services;
• Eradicating illiteracy in groups between 15-35

Egypt Human Development Report 2010{ 198 }
years of age;
• Providing civic protection services;
• Providing job opportunities through small loans
facilities;
• Improving environmental conditions and deal-
ing with solid waste;
• Upgrading local road networks connecting vil-
lages;
• Upgrading the postal services;
• Preparing detailed development plans for these
villages; and
• Enabling the participation of NGOs in imple-
menting the program.
A total of1141 villages will benefit from the program,
with a total population of 12 million. They are placed
as a top priority in the investment plans of all minis-
tries involved. 151 villages in 24 local units in six gov-
ernorates, with a total of 1.5 million inhabitants, have
been selected as the first phase of the program to be
implemented in a three-year period.
Several implementation steps have been achieved or
are underway. For instance, the Ministry of Housing
has allocated LE 4.2 billion for improving the water
supply in these villages and a few poorest urban areas
in the fiscal year 2009/2010. The project will end in
two years. In addition, 102 projects for sanitation are
planned to be finished in these villages in the coming
two years, with a total investment of LE 1.2 billion.9
Under the National Social Housing Program, the Min-
istry of Housing plans to construct about 42,000 new
housing units within these poorest villages, mainly
for young families. Construction of 27,000 units with
a total cost of LE 1.4 billion will be implemented in
the coming three years. The units enjoy the same
privileges as the housing program.
The Ministry of Health has covered the 151 villages
with ambulance and emergency services in addition
to constructing or upgrading 40 health care units
together with 153 units under implementation. The
program will extend to cover a total of 576 health
units within the poorest villages with a total budget
of LE 1.1 billion.
The Ministry of Education has now finished 100
schooling projects in addition to another 123 projects
to be finished by 2010, with a total budget of LE 500
million. The Social Fund for Development has allo-
cated LE 128 million for small-scale projects in addi-
tion to LE 63.2 million in form of grants for public
works and community development projects.
Finally, the program concentrates on creating job
opportunities for youth through a small loans facility.
In 2008, LE 10.7 million was allocated for 270 small
projects which have generated 755 new jobs. In addi-
tion, LE 22.2 million for 6647 very small projects cre-
ated 7,975 new jobs. By 2009, the numbers increased
to LE 54 million for small and very small projects.10
Already, an analysis of households within the pioneer
151 villages has revealed that there are more than
22,000 women-headed families, who in all probabil-
ity are suffering from gender-related unemployment
and absence of economic security. These loan facili-
ties should help alleviate poverty by creating income-
generating opportunities.
This innovative 1000 villages program is considered
to be one of the most effective national attempts
to target the poor by combining and integrating
the efforts of all concerned ministries and central
authorities. However, given its large size and multiple
dimensions, the program requires an efficient project
management setup with a continuous monitoring and
evaluation mechanism to ensure objectives are met in
a timely manner and that obstacles are overcome on
the way. It is anticipated that this ambitious under-
taking will cover the total number of 1141 villages over
a period of 10-12 years.
housing status of youth in inforMaL settLeMents or aashawiyat
It is estimated that at least 45-50% of the urban hous-
ing stock in Egypt faces problems such as vacancy,
rent control, and informality. Informal housing stock
represents great potential for providing affordable
and flexible alternatives for low and middle income
groups, especially among youth and newly estab-
lished families, since it offers a wide variety of finan-
cial models starting from an upfront down payment

Egypt Human Development Report 2010 { 199 }
linked with long term monthly instalments, to rental
units for a limited period that could extend up to
10-12 years.11
It is also estimated that within the informal sector,
there are thousands of existing units on the market.
Construction continues to be strong, and there are
a considerable number of semi-finished and vacant
units. Greater Cairo alone has at least 500,000 such
units out of a total of one million units in urban areas.
El-Khosous in Qalyubia Governorate (north of the
Greater Cairo region) represents one of the largest
informal settlements in Egypt with a population of
more than 300,000 inhabitants, and has more than
65,000 vacant units that are expected to be occupied
mainly by those young and newly established families
who cannot afford the price of units within the Cairo
and Giza Governorates.12 Accordingly, the largest
potential stream of affordable housing supply, espe-
cially for the young, lies through this existing stock.
Many individuals and small developers operate
within the informal sector to meet the growing hous-
ing demand of lower income households. While the
majority of units are of relatively good quality, a
large number do not have access to adequate pub-
lic infrastructure. Constrained by high building and
zoning standards, as well as a bureaucratic and costly
permitting process, informal settlements represent
the de facto housing choice of poor and sometimes
middle income groups. Unable to access the housing
units or lands offered by the National Housing Pro-
gram, many young people find that informal housing
is the only available option that meets their financial
means. However, since they are officially illegal with
no ownership documents, the informal housing stock
cannot benefit from any official subsidy or privilege
offered, whether by the Ministry of Housing through
the National Housing Program or by financial institu-
tions such as banks or mortgage companies.
If a new national housing policy is to have wider cov-
erage and lead to more affordable housing solutions,
more focus is needed on addressing the constraints
facing the vast private informal housing market and
on how to integrate it into the formal housing mecha-
nism in order to open up more channels of housing
supply for youth.
Allowing the use of the proposed mortgage-linked
subsidies for existing units in informal areas would
drastically increase the number of units on the mar-
ket within the income band targeted under the com-
ing phase of the National Housing Program and
introduce a product that could compete with the new
construction of private sector units, thereby also serv-
ing as an efficient way of ensuring timely delivery and
competitive unit pricing by developers. Consequently,
in the next phase of the NHP, the government should
consider incorporating informal settlement upgrad-
ing into the range of subsidy products for low-income
households.13

Egypt Human Development Report 2010{ 200 }
This proposed upgrading scheme to integrate the
existing housing stock in informal areas within the
formal market should be combined with improving
the living conditions within those deprived areas and
improving the quality of life for citizens by overcom-
ing problems such as solid waste disposal, lack of basic
social services, inefficient infrastructure, accessibility
to, from and within the area, and pollution.
A survey among two thousands households living in
Greater Cairo conducted in 2009, focusing especially
on those living in informal and deteriorated areas such
as Nazlet El-Samman, Old Cairo, Boulaq El-Dakrour
and Matariyah, highlighted the problems facing those
families and priority of intervention required from
government according to citizens.14 Figures 14.1 and
14.2 illustrate the result of the survey.
Citizens expressed their expectations of govern-
ment towards their neighborhoods, as shown in
Figure 14.3. They suggested that the main role of
the government should be providing infrastructure,
solid waste disposal, public transportation, securing
unsafe areas and removing pollution, such as that
from uncollected garbage. The survey indicated that
the citizens do not see any existing activity from the
non-governmental/communal sector, but the vast
majority believed that this sector could play a crucial
role in social services, job creation and environmen-
tal development activities.15
The government has recently taken an important step
towards institutionalizing the upgrading of infor-
mal settlements in Egypt through the creation of
the Informal Settlements Development Fund (ISDF)
Box 14.2: Life in Informal Districts of Cairo
Informal areas are not inhabited only by the poor. Authorities declare that almost 17 million Egyptians live in informal areas
around cities. That figure includes many more than just the very poor. Studies reveal the profile of informal areas to
include a wide spectrum of socio-economic groups; its resident could include street vendors as well as judges. Residents
of informal areas include government employees, workshop owners, and artisans, as well as professionals such as doctors
and lawyers. A common pattern is the family-owned apartment building, with may be one or two poorer tenants renting
on the ground floor. Who else lives in informal areas? Those with low car ownership (in many areas only 10% of residents
own a private car); those who use mass transportation for their main means of transport; people many Egyptians meet
on the street; the waiter, the taxi driver, a colleague at work or the fellow next to you at university. In short, almost any
Egyptian may live in an informal area.
Housing research since the 1980s in Egypt has focused on the problems of informal areas, hardly attempting to explicitly
address the advantages that have made this sector grow faster than any other housing sector in the country. Informal
areas are a 100% self-financed, self-help housing mechanism. They are demand-driven, incremental in growth, compact
in form, low-energy-consuming, with an efficient mixture of uses allowing work-home proximity and district self-sufficiency
in terms of daily and seasonal needs. Advantages of these areas include the ‘walkability,’ the convenience, safety, social
solidarity, and resident participation. Outcomes of such things have great significance, where for example, the non-chaotic
distribution of commercial uses allows people to walk where they need to (decreasing pollution from vehicles, saving
money spent in transportation costs, and increasing social inclusion/co-existence of various groups in the public domain
which is the seed for community building). Consequently, safety comes in the form of social solidarity, appropriation of
space and self-policing (which saves the government money in the decreased need for administration), and resident
participation gives rise to feelings of ownership, self-empowerment, and purpose. Inhabitants of these informal areas
also describe them as ‘popular districts’ that are lively and friendly, however they are not oblivion to the want in quality of
self-provided services such as private un-regulated collective transportation means. What they want from the government
is acknowledgement (of those private initiatives) and partnership in domains where they cannot help themselves, such as
solid waste management and infrastructure maintenance; “pick up where I leave” sort of partnership. What are missing are
regulations that respect such private initiatives, that enable those working solutions to continue yet with improvements,
instead of abolishing them in the name of modernity and development.
Source: Dina Shehayab, Housing and Building National Research Center

Egypt Human Development Report 2010 { 201 }
headed by the Minister of Local Development. A lump
sum of LE 500 million has been allocated to the ISDF
in a revolving fund to be utilized for the development
of those areas on a cost recovery basis. This would
come through improvement of those areas especially
in prime locations within cities, as well as making use
of part of the land after upgrading in covering the
total expense of improvement activities.
Two different groups of informal settlements has been
identified by ISDF, insecure areas which represent
a danger to the life of their citizens, and unplanned
areas which represent the vast majority of informal
settlements in Egypt – these contain well constructed
buildings in non-hazardous locations but lack basic
services and efficient road networks. The ISDF has
set the improvement of the insecure areas as an inter-
vention priority with the objective of developing them
over 10 years. It has finished a national map identi-
fying the location, size and population of all insecure
areas in all Egyptian governorates together with a pro-
posal for priority of intervention. A total of 404 areas
with a total of 212,000 units have been classified as
insecure areas, among which 154 areas with a total of
66,000 units have been identified for the first phase of
intervention in the coming five years. However, such a
massive program will require an efficient communica-
tion strategy to raise the awareness of the public and
to offer flexible alternatives for allocating those fami-
lies living in dangerous areas.
access to transPortation anD the iMPact on Living anD eMPLoyMent
Urban transport represents one of the most critical
challenges facing urban development in Egypt. Citi-
zen’s mobility within the major urban centres is one
of the daily problems contributing to traffic conges-
tion, especially in Greater Cairo and Alexandria. On
both the national and regional levels, the railway
system remains the main means of public transporta-
tion and provides daily service for millions of citizens.
However, due to long dereliction, this important ser-
vice has reached a critical stage that has forced the
government to place it on the top of the development
agenda within the last four years. Despite this atten-
tion, a substantial improvement in this sector will not
be realized before five years due to lack of required
financial and human resources.
While highly diversified, in terms of supply and
related infrastructure and facilities, Greater Cairo
Urban Transport System suffers major inefficiencies
which can be described as follows:
• Aggravated traffic congestion: Cairo is experi-
encing traffic congestion that places it among
the worst in the world. It is estimated that the
average speed of vehicles in peak hours in central
areas does not exceed 12 km/hr. This has seri-
ous economic consequences, given poor mobil-
ity, especially among youth in their trips to/from
work, and contributes to air pollution.
Figure 14.1: Main Problems Facing Households in GCR
Figure 14.3: Envisioned Role for Government in Improving Informal Settlements
Source: GOPP, 2009-2
Solid Waste-Enviromental Degradation High Residental Densities
Lack of Low-Income HousingLack of Efficient Public Transportation
Informal SettlementsPollute Users within Residental areas
Cement factories
76 78 80 82 84 86 88 90 92 94
Figure 14.2 Priorities for Improvement According to Citizens’ Preference
Social ServicesHousing for Low Income
Pubic TransportationProvision of Infrastructure
Cleaning
9.2
21.4
23.3
29
47.5
0 10 20 30 40 50
Improvision of Infrastructure/Social Services Solid Waste Management
Provision of Job Opportunities/Youth HousingPublic Transport
Removing Insecure/Polluted Areas
92.6
92.5
89.1
85.7
84.3
82.8
0 5 10 15 20 25 30 35 40 45 50
43.7
32.6
20
13.4
9.5

Egypt Human Development Report 2010{ 202 }
• Poor public transport system: Cairo relies on
underdeveloped, overcrowded and unreliable
public transport services. The only acceptable
facilities are the two underground metro lines.
Other public transport systems such as buses
and omnibuses are totally outdated and do not
meet the actual demand both qualitatively and
quantitatively. Public buses are poorly main-
tained and many are out of service. This has left
room for private operators of mini and micro
buses to dominate the public transport system
all over Cairo, as in other major Egyptian cit-
ies. In addition, the large number of operators
and the lack of an institutional or organizational
framework to properly manage and regulate the
system have led to a lack of integration among
passenger transport modes and the rapid devel-
opment of very low quality and unsafe supply.16
• Transport conditions are worse when related to
new urban communities around Cairo such as 6th
October, Obour and New Cairo cities. Based on
the experience of several young people from these
outlying cities, it costs each individual about LE
150-200 more in transport per month than those
living in areas within Greater Cairo. This is as a
result of the need for at least two additional trips
per destination, usually by the more expensive
private micro-buses. This significantly affects the
accessibility of higher education or job opportuni-
ties to young people living in these new cities. The
situation is even more complicated for women
who are frequently reluctant to apply for jobs due
to difficult mobility to/from new cities. Although
several private universities and factories have
offered means of transportation to their students,
staff and workers, the majority still must rely on
private transport modes such as micro buses.
• A high accident rate: The road transport death
rate in Cairo is very high. According to a World
Bank study, at least 1,000 persons die each year
in motor vehicle accidents, more than half of
them pedestrians, and over 4,000 are injured.17
• Air and noise pollution: Air pollution in Cairo is
serious. Noise levels are high and aggravated by
a large proportion of old cars and taxis. Vehicle
inspections that should limit exhaust gas pollu-
tion are mostly ineffective.18
• Institutional weaknesses and fragmentation:
Cairo currently suffers from highly fragmented,
largely uncoordinated and inadequately staffed
institutions to deal with urban transport prob-
lems of this magnitude. Several ministries and
public authorities are responsible directly or
indirectly on different transportation, roads and
traffic management. Mostly, there is hardly any
coordination between those bodies.
• Inadequate financial arrangements: Inadequate
financial arrangements lead to under investment
in transport facilities, especially in public trans-
port capacity which suffers major shortages, in
inadequate cost recovery and consequent exces-
sive subsidies for urban public transport, and
in little participation of formal private sector in
financing and/or managing urban transporta-
tion infrastructure and services.19
After several decades of dereliction, public transpor-
tation became a priority on the government agenda
within the last five years. Huge investments have
been pumped in to improve the national railway sys-
tem and highways. However, the road to satisfactory
status is still very long. In Greater Cairo, following
the Urban Transport Master Plan of 2002, the gov-
ernment is currently engaged in implementing sev-
eral mega projects such as the third underground
metro line, improvement of the ring road, together
with starting the construction of the regional ring
road and other corridors to connect new urban com-
munities with the urban agglomeration. Further, sev-
eral studies are underway to connect new communi-
ties with rapid public transportation means such as
the ‘supertram’, ‘bus rapid transit’ and electric trains
within the coming ten years.
However, recent experience gained since 2002 sug-
gests that there is need to put an even greater empha-
sis on people’s mobility through public transport sys-
tems, as well as on traffic and demand management
and that their successful implementation requires
even more efforts on institutional restructuring and
human resource development. The resources required
for infrastructure development, proposed in the
Urban Transportation 2009 Adapted Plan for Greater
Cairo, exceed LE 70 billion. This calls for more rigor-

Egypt Human Development Report 2010 { 203 }
nities within newly established companies. It is
also suggested that an upgrading program of bus
dedicated facilities (bus stops, dedicated lanes,
priority at selected intersections, bus informa-
tion system) be implemented to increase the
productivity of the overall system, improve the
quality of bus services and encourage a modal
shift toward increased use of the public transport
system at the expense of private cars.
• Finally, the provision of priority bus rapid transit
is proposed as a cost-effective solution to provid-
ing capacity in corridors that connect Cairo with
new cities, such as 6th October, and New Cairo,
possibly to be upgraded later to a fixed rail sys-
tem with more capacity. These new projects of
high capacity mass transit systems can be struc-
tured to attract the private sector through appro-
priate concession/leasing arrangements.
• Improving transportation and traffic manage-
ment. The government of Egypt has recently
decided to establish the Greater Cairo Regional
Transport Management Authority under the
direct supervision of the Cabinet to be the main
body responsible for managing traffic all over
the region. This covers, among other responsi-
bilities, setting the tariff for different modes of
public transportation, issuing a unified ticket
between different modes, approving the routes
of all modes and their connections, monitoring
and evaluation of traffic flow, and suggesting
mega projects required for traffic improvement
within the region.
• Embarking on an efficient parking program. The
government should carry out a wide program for
establishing multi-story off-street garages linked
to the on-street paid parking program. This pro-
gram can be implemented with an enhanced role
for the private investment and operation under
public-private-participationarrangements. Well-
located parking garages could be provided by the
private sector at little cost to government if an
adequate parking management framework is in
place as well as a transparent competitive bid-
ding process for provision and operation of these
facilities. Such a wide scheme can provide large
numbers of jobs for youth in managing, operat-
ing and maintaining those facilities.
ous investment prioritization on the basis of objective
economic criteria and cost effectiveness.20
There is, therefore, an urgent need for the government
to develop and implement a more sustainable financ-
ing framework for the urban transport sector. This
should include application of adequate user charges
policies to reflect, to the extent possible, actual trans-
port costs for all transport modes. Although, the social
objective of making public transport affordable hin-
ders the revisiting of public transport fares, it can be
better achieved at lower cost by using more effective
public transport modes (high capacity and mass trans-
port systems), efficient transport operators (conces-
sions/lease to private operators) and more appropri-
ate subsidy schemes to those who really need them.21
It is believed that the transportation problem in
Greater Cairo will substantially be improved by
increasing the current share of Cairene citizens of
underground metro lines – in Cairo the share is 4 km/
million inhabitants compared with cities like Bangkok
(20 km/million inhabitants), Sao Paulo (31 km/million
inhabitants), Moscow (30 km/million inhabitants),
and Paris (150 km/million inhabitants). Although the
government is currently focussing on implementing
the third line of the underground metro to be finished
by 2017, in addition to starting the implementation of
the fourth line in 2011 to be finished by 2020, more
rapid action is required to improve the existing critical
situation of transportation in Greater Cairo such as:
• Improving public and large-capacity bus facili-
ties. There is an urgent need to develop a compet-
itive, well organized, mostly formal high capacity
bus-based transport supply. The restructuring
of this sector should concern private mini-buses
and the large public bus companies in particu-
lar. The proposed restructuring has to consist
of gradual ‘formalization’ of the informal sector
(through an adequate regulatory and incentive
framework) and rapid commercialization of the
public sector bus operations (concession and
contracting out of reorganized parts of the bus
network).22
• This would directly benefit the many young peo-
ple represented in the ownership or operations of
informal micro-buses and offer new job opportu-
Egypt Human Development Report 2010{ 204 }
Endnotes1 NDP,20092 ibid3 Ministry of Housing, 20094 World Bank,20085 ibid6 ibid7 NDP, 2009-18 Ibid9 Ibid10 Op.cit.11 World Bank, 2009
12 GOPP, 200913 World Bank, 200814 GOPP, 2009-115 GOPP, 2009-216 World Bank, 2006-117 World Bank, 200618 Ibid19 Ibid20 GOPP,200921 World Bank, 200622 Ibid
referencesGeneral Organization for Physical Planning “GOPP”, (2009), “El-Khosous Strategic Urban Plan- First Report: Analysis of Existing
Situation”, GOPP, (2009-1), “Greater Cairo Urban Transportation Plan 2020”, Unpublished Report, CairoGOPP, (2009-2), “Citizens Opinion on Greater Cairo Future Vision 2050”, Unpublished report prepared by Zanati and Partners for
GOPP, Cairo. JICA, (2003), “Transportation Master Plan and Feasibility Study of Greater Cairo Region in the Arab Republic of Egypt, Phase II Final
Report, Volume II”, December 2003.Ministry of Housing, Utilities and Urban Development, (2009), “Ministry of Housing, Utilities and Urban Development Annual
Book,” Cairo.National Democratic Party, (2009), “Housing, Utilities and Urban Development Policy Paper”, Sixth Annual Conference, Cairo,
November 2009World Bank, (2006), “Greater Cairo: A Proposed Urban Transport Strategy, Urban & Transport Unit,” Middle East and North Africa
Region, World Bank. World Bank (2006-1), “Transport Sector Strategy Note”, Unpublished Report, Cairo.World Bank, (2008), “Next Step Recommendations For Affordable Housing Policy And The National Housing Program: Mortgaged-
Linked Subsidies And Housing Supply Considerations”, World Bank: Sustainable Development Department, Middle East And North Africa.

{ 205 }
Chapter Fifteen
CONSTRUCTING A YOUTH WELL-BEING INDEx
The culmination of a country’s awareness of the importance of progress in human development can be considered as the time when it is ready to design and reach consensus on a broad set
of indicators that measure the well-being of society or a subset of soci-ety and that can be summarized in a single index. The UNDP Human Development Index first appeared in 1990 as a single number that cap-tured elements of income, health and education indicators and was hailed as introducing a more complete measure of human welfare than the income indicator of GDP per capita could alone. Today, many coun-tries and organizations including UNDP are still striving to formulate new, more integrated and comprehensive measures of well-being. Over time, the process has moved from having the HDI, which integrates three variables, to having indices for multidimensional poverty, gen-der welfare, child welfare and many others. The process has reached a stage where more and more of the components used in measurement try to capture the non-material aspects of well-being.

Egypt Human Development Report 2010{ 206 }
In this chapter, a first attempt is made to identify
and quantify indicators of youth well-being and to
then aggregate them into a proposed Youth Well-
Being Index. The purpose is to move beyond those
variables and indicators which are available for such
dimensions as education, health, income, gender,
political participation, access to ICT, and so on. What
will be more difficult and yet very important will be
the measurement of such things as leisure and well-
being, employment and the quality of jobs, and even
the dynamics of the family including social capital
and cohesiveness.1
objectives anD PrioritiesThere are three objectives in preparing a Youth Well-
Being Index (YWBI) for Egypt. The first is to provide
a mapping of levels and severity of youth deprivation
from basic rights and basic needs; the second is to sit-
uate Egypt’s youth in a time and space perspective so
as to measure progress over time as well as compare
the status of Egypt’s youth with youth in other coun-
tries; and the third is to disseminate the results and
raise awareness among all social actors of the rele-
vance of each indicator and encourage public debate.
The first objective is to collect and process all relevant
information and variables so as to provide a profile
of youth in the chosen age bracket (18-29) and their
status in terms of key human rights and basic needs.
The most important of these which are recognized
and already available are selected from among the 48
indicators related to the MDGs, mainly on poverty,
education, health, gender and environment. Implic-
itly, this aspect of the index is a judgment on the level
of deprivation affecting youth of both sexes. This also
helps identify and select what the most important pri-
orities and options are for policy making.
The second objective is to provide a benchmark from
which to measure progress over time as well as make
comparisons between Egypt and other countries. This
would mean answering three key questions which are
germane to the inquiry on any Human Development
Index: Is Egypt making progress with regards to the
well-being of its youth citizens? Which elements of
the Index are responsible for that progress and which
are responsible for impeding progress and deserve
increased action? And where does Egypt rank among
other developed and developing countries overall and
with regards specific indicators?
The third objective is to raise awareness among policy
makers, civil society, and the general public about the
meaning and relevance of each element in the index
as well as its overall magnitude. For policy makers,
benchmarking indicators provide a measuring stick
by which to set targets for improvement. For civil
society, these indicators become the focus whereby
activism is used to pressure for attention to various
issues and problems. As to the general public and
the media as opinion-makers, the Well-Being Index,
domains and indicators become a tool to sensitize all
segments of society of such problems as gender dis-
crimination, drugs, crime, obesity and others.
The adoption of a multidimensional concept of youth
well-being presumes two things: The first is that an
equitable distribution of capabilities and opportuni-
ties should be attained for all of Egypt’s youth, and
the second is that both older and younger generations
alike must bear an equal responsibility for preserva-
tion of the environment, citizen safety, community
values, positive aspects of culture, good governance
and agency.
Defining anD Measuring PovertyPoverty measurements discussed in this study include
both economic measures of poverty based on mone-
tary measures as well as a range of outcome measures
reflecting the health and survival and the education
and personal development of youth. Monetary and
non-monetary approaches of defining poverty are
complementary rather than competing approaches,
and both are considered. It is true that income alone
is not sufficient to provide children or youth with the
education and health care they need, but it is also true
that adequate provision of such services alone cannot
guarantee that they will utilize such services. Utiliz-
ing public social services is not costless; households
should have enough income to use these services.
For instance, there are transportation costs as well
as time off work that are involved in going to obtain
health care services. There are also obviously close
links between shelter deprivation and low income.
On the other hand, ignoring income deprivation may

Egypt Human Development Report 2010 { 207 }
lead to the exclusion of income enhancing policies
and programs which are essential for poverty reduc-
tion, whatever the definition of poverty.
Measuring youth poverty (see Chapter 6) is not only
done within the context of lack of income, since some
non-poor households – according to the financial
measurement – can suffer from deprivation of some
services and capabilities. Therefore, youth poverty
measurement is related to deprivation measurement,
by which a series of basic services and capabilities can
be determined and the number of youth with no access
to these services and capabilities is then measured.
A rights-based approach to addressing the needs of
young people in poverty is particularly valuable for
four reasons. First, a rights perspective provides a
greater focus on the root causes of poverty by high-
lighting the importance of specific rights and the
obstacles to realizing those rights. Second, using a
rights-based approach makes it easier to specify the
criteria for measuring outcomes rather than mere out-
puts. Third, governments and other agencies under a
rights-based approach need to give attention to the
processes involved in working out priorities for action
– this usually means involving the poorest, as far as
practicable, in the development and implementation
of public policy to give effect to their rights. Finally,
the rights-based approach can encourage govern-
ments and NGOs to monitor the delivery of basic ser-
vices to see whether they are reaching the poor.
Youth living in poverty face deprivations of many of
their rights: Rights to survive, learn, work, partici-
pate, and be protected (Tables 15.1 and 15.2). In order
to operationalize this rights-based approach to youth
poverty, and analogous to the UNICEF approach of
child poverty, the study uses a series of indicators to
measure youth’s access to seven rights (water, sani-
tation, healthcare, flooring, crowdedness, education,
and information). Where a young person does not
have access to one of these rights, it is described as
a severe deprivation. The term ‘absolute poverty’ is
used for cases when an individual has been exposed
to two or more severe deprivations. The dimensions
and indicators employed in this study are as follows:
• Water deprivation: Youth 18-29 using water
from an unimproved source such as an unpro-
tected well, unprotected spring, surface water
(for example, rivers, streams and dams), tanker
truck or cart with small tank or who it takes 30
minutes or more to get water and come back.
• Sanitation deprivation: Youth 18-29 who live in
households with pit latrine, bucket toilet or no
facility, or, used modern flush toilet, traditional
tank or traditional bucket flush and in the same
time the drainage system is piped connected to
canal, or to ground water or no drainage system.
• Floor deprivation: Youth 18-29 who live in
dwellings with no flooring material (for example,
a mud floor).
• Crowdedness deprivation: Youth 18-29 who live
in dwellings with five or more people per room
(severe overcrowding).
• Information deprivation: Youth 18-29 with no
access to radio, television, telephone, or com-
puter at home.
• Education deprivation: Youth 18-29 who had
never been to school or who dropped out before
completing their primary education.
• Health deprivation: Ever married women aged
18-29 who gave birth during the preceding five
years before the survey (EDHS, 2008) and did
not receive antenatal care during their last preg-
nancy from a doctor or nurse or midwife, or who
did not receive any tetanus injection during that
pregnancy (last pregnancy).
Income Measures of Poverty
Income is universally an important element, even
while most agree that money metrics are too narrow
to capture all relevant aspects of poverty. Income pov-
erty is known as the material incapability of securing
a decent standard of living (providing basic needs)
based on which an individual’s status is defined as
poor or not. Determining who is poor requires a defi-
nition of poverty and the poor. In order to do this, two
questions must be answered: First, what living stan-
dard indicator should be used to measure the stan-
dard of living, and second, how can one differentiate
between the poor and the non-poor? In other words,
the definition of poverty calls for choosing a crite-
rion to measure the standard of living and defining
the poverty line that divides the society into the poor

Egypt Human Development Report 2010{ 208 }
Table 15.2: Correlates of Severe Youth Deprivations
25%-50% worse than the average 50%-100% worse than the average Over 100% worse than the average
Table 15.1: Most Deprived Youths by Youth Characteristics
Total (%)(Average)
Individual Dimension
Household Dimension, Household size
Household Dimension, Head’s education
Geographic Dimension, Region
Residence
Source: Calculations based on DHS 2008
Region
Urban governoratesUrban LERural LEUrban UERural UEFrontier governorates
Residence
UrbanRural
Sex and Age
Total
Male18-22 Years23-24 Years25-29 YearsFemale18-22 Years23-24 Years25-29 Years
Severe Deprivation
15.514.333.522.259.632.8
Severe Deprivation
17.344.9
Severe Deprivation
33.1
27.025.927.728.239.031.638.648.6
Absolute Poverty
2.11.37.44.923.711.8
Absolute Poverty
2.814.5
Absolute Poverty
9.5
5.85.56.16.013.210.113.516.9
Income Poverty
8.28.819.322.744.319.4
Income Poverty
12.430.6
Income Poverty
23.2
25.528.524.721.320.824.019.117.4
Source: Calculations based on DHS 2008 and HIECS 2008
and the non-poor. In this regard, the classification of
individuals as poor and non-poor must not depend on
the individual’s class. According to Ravallion, 1991,2
the diagnosis of poverty and the poor characteris-
tics must be coherent, meaning that the poverty line
must have a fixed value over time, between regions
or between different social categories. Therefore, the
coherent comparison between individuals means that
any two persons of the same real consumption level
are being classified as poor or non-poor regardless of
time or space.
The poverty line in Egypt was constructed using a
cost-of-basic-needs methodology. This method yields
poverty lines that are household-specific, objective,
regionally consistent, and use unbiased absolute
poverty lines (World Bank, 2007). A food bundle is
constructed such that it is consistent with the con-
sumption of poor households and reaches the calo-
rie requirements. A bundle is defined for individuals
in different age brackets, gender, and activity levels
(using tables from the World Health Organization).
The cost of these food bundles is then established.
This is known in Egypt as the Food Poverty Line
(FPL). Households whose expenditure is below the
Crowdedness
1.2
F 25-29 Yrs
7+
None
Rural UE
Floor
10.9
M 18-22 Yrs
7+
None
Rural UE
Rural
Sanitation
3.7
M 23-24 Yrs
7+
Some Primary
Rural LE
Rural
Water
2.6
M 25-29 YrsF 18-22 Yrs
Less than 3
None
Frontier governorates
Rural
Information
2.2
M 25-29 YrsF 25-29 Yrs
Less than 3
None
Rural UE
Rural
Education
17.2
F 25-29 Yrs
7+
None
Rural UE
Rural
Health
15.2
F 25-29 Yrs
3-4 members
Secondary +
Rural UE
Income Poverty
23.2
M 18-22 Yrs
7+
None
Rural UE
Rural

Egypt Human Development Report 2010 { 209 }
FPL are referred to as “extremely poor”. A second
poverty line was also constructed by augmenting the
FPL with an allowance for expenditure on essential
non-food goods. This results in what is called the
Total Poverty Line (TPL). Households spending less
than the TPL are considered “poor”. The extremely
poor are thus a sub-group of the poor.
On average, a person who spent less than LE1,648 per
year (LE134 per month) in Egypt in 2008 was consid-
ered extremely poor and those who spent less than
LE2,223 (LE185 per month) were poor. Poverty lines
vary by the number of persons in a household, the age
of household members, as well as regional differences
in relative prices. Children living in households whose
consumption is below one of the poverty lines are also
considered poor or extremely poor. Table 15.3 shows
the consumption levels of food and total poverty lines
for different regions in Egypt.
internationaL aPProaches to the weLL-being inDex
This section of the chapter reviews a number of
approaches, frameworks and methodologies that
are in use internationally and which have been con-
sidered when preparing Egypt’s Youth Well-Being
Index. The United Nations has a large Programme
on Youth that began in 2005 as well as a work-in-
progress set of indicators (Box 15.1). Another inter-
esting and comprehensive multidimensional poverty
index is that of the Oxford Poverty & Human Devel-
opment Initiative. Further, Ireland, Canada, Brazil
and Bhutan are among some of the countries that
provided valuable frameworks and approaches for
consultation.
Oxford Poverty & Human Development Initiative
The Oxford Poverty and Human Development Ini-
tiative (OPHI) is a research center at the University
of Oxford. OPHI aims to build a more systematic,
methodological and economic framework for poverty
reduction. Essentially, OPHI’s purpose is to build a
multidimensional framework for reducing poverty,
one that is grounded in the experiences and values
of individuals. Two current research themes at OPHI
are: Identifying missing dimensions for poverty mea-
surement and developing survey modules in various
countries, and examining issues relating to compari-
sons of multidimensional poverty and applying new
methodologies in various countries. The ultimate goal
at OPHI is to allow decision makers and policy advo-
cates to most effectively make advances in the field of
human development.
The focus on missing dimensions of poverty data is
one particularly impressive research area at OPHI.
They have found that while there exists a great deal
of data for the measure of human development, there
are still gaps related to internationally comparable
indicators of rather important dimensions. The goal
at OPHI in this regard is to advocate for collection
of data for indicators on the missing dimensions of
development that in fact matter most for the poor.
Thus far, five dimensions have been identified, includ-
ing employment (both formal and informal employ-
ment, and with particular attention to the quality of
employment), empowerment, physical safety, the
ability to go without shame (emphasizing the impor-
tance of freedom from humiliation), and psychologi-
cal and subjective wellbeing.
Ireland’s Child Well-Being Index: A Comprehensive and Valuable Source
A key objective for Ireland’s National Children’s Strat-
egy of the year 2000 was the identification of a set
of child well-being indicators which would form the
basis of their State of the Nation’s Children report.
The compilation of the inventory of existing domains
and indicators helped define priorities for the national
set of child well-being indicators; the results were
later published in the 2005 Report on the Develop-
ment of a National Set of Child Well-Being Indicators
Table 15.3: Estimated Average per Capita Food & Total Poverty Line (LE per year), by region, 2008-09
Region
MetropolitanLower UrbanLower RuralUpper UrbanUpper RuralEgypt
Food Poverty Line
1,715 1,6131,6871,5811,6021,648
Total Poverty Line
2,2842,1772,2782,1582,1702,223

Egypt Human Development Report 2010{ 210 }
Box 15.1: Youth and the United Nations
The UN Programme on Youth (UNPY) aims to build an awareness of the global situation of young people (youth are defined
by the United Nations as those between the ages of 15 and 24) and promote their rights and aspirations; UNPY also aims
to achieve greater participation of youth in decision making, primarily for the achievement of peace and development.
In 1985, the UN General Assembly observed International Youth Year, drawing attention to the importance of recognizing
the potential contributions of youth to the goals of the UN Charter. Ten years later in 1995, the UN strengthened its
commitment by adopting an international strategy, namely the World Programme of Action for Youth to the Year 2000 and
Beyond (WPAY). Yet another ten years later in 2005, UNPY organized a meeting of experts with the goal of developing
a set of Youth Development Indicators. The group (consisting of representatives from youth organizations, UN agencies,
intergovernmental organizations, academia, and policy advisers) provided input for the draft set of indicators aimed at
measuring the development of youth over time.
The group defined a set of indicators for the 15 areas outlined in the WPAY – these indicators measure the development of
youth, compare the progress in and between countries, identify areas that need greater attention, encourage the collection
of data related to youth, enhance advocacy efforts for more investments in youth, and advance the possibility of developing
a comprehensive Youth Development Index (YDI). As such, the group of experts provided a set of proposed indicators
which culminated in the work-in-progress set discussed here. The 15 areas of priority are grouped into three clusters:
Youth in a Global Economy, Youth in Civil Society, and Youth at Risk. The YDI is as follows:
General Demographic InfoTotal population 15-24 years Youth as % of populationPercent of youth ever married
EducationYouth literacy ratesGross enrolment ratio sec. edu. Net enrolment rate sec. edu. Gross enrol. rates tertiary. edu. Transition rate to gen. sec. edu.
EmploymentYouth unemployment ratesRatio youth:adult unemp rates Youth emp-to-population ratiosYouth labor force participation
Hunger and Poverty% severely underweight youth % of underweight youth% youth in absolute poverty% youth in poverty
Drug AbuseLifetime prevalence of drug abuse among youth
Leisure
HealthAdolescent fertility as % of total fertility % in-union young women using contraception Maternal mortality ratio Top 3 reported deaths by cause for youth Probability, for a 15-year old, of dying before age 25
EnvironmentPercentage of youth severely deprived of water Percentage of youth severely deprived of sanitation Percentage of youth severely deprived of shelter
Juvenile DelinquencyRate of children admitted to closed institutions Age people are held liable as adults for transgression of law
ParticipationVoting age Legal min. age of marriage without parent consent Existence of National Youth Council
Girls and Young Women% of women undergone FMG
GlobalizationRatio of international youth to adult migrants Internationally mobile students in ter. edu.
ICTProportion of young used computer in last 12 months Proportion of young used the Internet in last 12 months
HIV/AIDS HIV prevalence rate in youth % youth with full, correct knowledge HIV/AIDS % youth who used a condom at last high-risk sex
Armed Conflict Est # of youth refugees
Intergenerational RelationsMedian age of population
Box prepared by Defne Abbas for the EHDR 2010Source: www.un.org/youth

Egypt Human Development Report 2010 { 211 }
and subsequently followed by updated information
in the State of the Nation’s Children Reports of 2006
and 2008.
Initially, many widely used measures of child well-
being were identified, including infant and child mor-
tality rates, mental health problems, teenage fertility
and sexual behavior, tobacco, alcohol and drug use,
child poverty, children as perpetrators and victims
of crime, and participation in education. The key
domains for conceptualizing child well-being, namely
demographic characteristics, economic status, educa-
tion, family, school and community context, health
and safety, and social, emotional and behavioral
development, were highlighted. Furthermore, several
challenges to developing the national set of child well-
being indicators were identified in the review, includ-
ing the difficulties in identifying indicators allowing
for international comparisons, the different under-
standings or focus on single specific phenomenon,
and the imbalance in the availability of data for all
periods of childhood from infancy to adolescence.
The national set of child well-being indicators in Ire-
land allows for assessment and description of the
condition of children growing up in Ireland, identi-
fication of children who are at risk (and require pre-
ventative services) or have avoided risk (and thus
provide an example of what does work), monitoring
child outcomes over time, implementation of policies
and programs, and evaluation of the success or fail-
ure of policies, as well as the resource investments
in selected programs. Ireland’s well-being index for
children took the perspective of the child being an
active participant in shaping his or her own life and
nine dimensions were identified, as follows: Physi-
cal and mental well-being, emotional and behavioral
well-being, intellectual capacity, spiritual and moral
well-being, identity, self care, family relationships,
social and peer relationships, and social presenta-
tion. Further, the indicators4 cover such specific
areas as abuse and maltreatment, accessibility of
basic health services, attendance at school, availabil-
ity of housing for families with children, community
characteristics, crimes committed by children, eco-
nomic security, environment, infant health, mental
health, nutrition, participation in decision making,
pets and animals, public expenditure on services for
children, relationship with parents, family and peers,
self-esteem, self-reported happiness, sexual health
and behavior, things to do, and values and respect.
The Canadian Index of Well-Being
The Canadian Index of Well-Being (CIW) is another
useful example that was consulted when develop-
ing the proposed Index for Egypt. The CIW goes far
beyond the usual economic measures to cover such
areas as standard of living, health, quality of the envi-
ronment, education and skill levels, time use, vital-
ity of communities, participation in the democratic
process, and the state of arts, culture and recreation.
Moreover, the Index highlights connections among
the important areas and draws linkages between
domains. At present, the CIW provides three detailed
research reports on different categories of wellbe-
ing, namely living standards, healthy populations,
and community vitality; it also provides a first report
that connects the three specific reports to include
highlights and summaries. Furthermore, the Index
includes domains related to arts, culture and recre-
ation, civic engagement, education, environment, and
time use; the related reports were still to be developed
at publication and will be used in the composite CIW.
The Case of Brazil
Brazil has also created a General Youth Well-Being
Index (GYWI) comprised of three sub-indices, namely
the General Well-Being Index, the Child-Youth Well-
Being Index, and the Youth Well-Being Index. Bra-
zil’s Well-Being Index aims to measure how well the
youth of Brazil are transitioning into adulthood, a
task deemed difficult due to the multi-dimensional-
ity of youth behavior and the complexity of tracking
progress over time. The goal of such an undertaking
was that the methodology would be used in Brazil to
estimate the indices every year, allowing policy mak-
ers and society at large to track the well-being of its
youth. Brazil’s General Well-Being Index includes
all the indicators that were deemed valuable and the
Youth Well-Being Index includes only indicators that
pertain to youth aged 15-24. All three indices are the
Brazilian adaptation of the US-based Child-Youth
Well-Being Index.5 Brazil used five broad categories
in its Well-Being Index: Health, Behavior, School
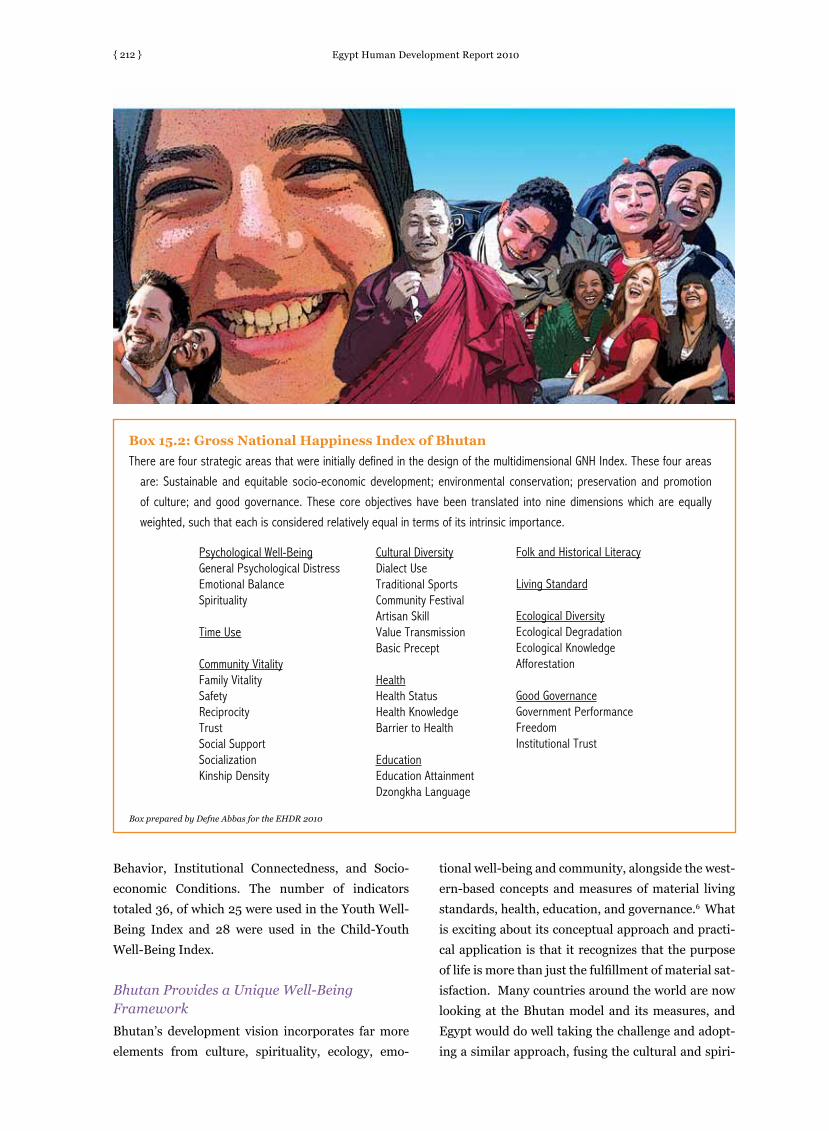
Egypt Human Development Report 2010{ 212 }
Behavior, Institutional Connectedness, and Socio-
economic Conditions. The number of indicators
totaled 36, of which 25 were used in the Youth Well-
Being Index and 28 were used in the Child-Youth
Well-Being Index.
Bhutan Provides a Unique Well-Being Framework
Bhutan’s development vision incorporates far more
elements from culture, spirituality, ecology, emo-
tional well-being and community, alongside the west-
ern-based concepts and measures of material living
standards, health, education, and governance.6 What
is exciting about its conceptual approach and practi-
cal application is that it recognizes that the purpose
of life is more than just the fulfillment of material sat-
isfaction. Many countries around the world are now
looking at the Bhutan model and its measures, and
Egypt would do well taking the challenge and adopt-
ing a similar approach, fusing the cultural and spiri-
Box 15.2: Gross National Happiness Index of Bhutan
There are four strategic areas that were initially defined in the design of the multidimensional GNH Index. These four areas
are: Sustainable and equitable socio-economic development; environmental conservation; preservation and promotion
of culture; and good governance. These core objectives have been translated into nine dimensions which are equally
weighted, such that each is considered relatively equal in terms of its intrinsic importance.
Psychological Well-BeingGeneral Psychological DistressEmotional BalanceSpirituality
Time Use
Community VitalityFamily VitalitySafetyReciprocityTrustSocial SupportSocializationKinship Density
Cultural DiversityDialect UseTraditional SportsCommunity FestivalArtisan SkillValue TransmissionBasic Precept
HealthHealth StatusHealth KnowledgeBarrier to Health
EducationEducation AttainmentDzongkha Language
Folk and Historical Literacy
Living Standard
Ecological DiversityEcological DegradationEcological KnowledgeAfforestation
Good GovernanceGovernment PerformanceFreedomInstitutional Trust
Box prepared by Defne Abbas for the EHDR 2010

Egypt Human Development Report 2010 { 213 }
tual alongside the material aspects of well-being.
The term gross national happiness (GNH) was coined
as far back as 1972 by the King of Bhutan, and it has
obviously been consistently followed, such that the
country had improved on all of its human develop-
ment outcomes to now stand as a middle income
country. Bhutan’s overarching goal of gross national
happiness appears in its Five Year Plans as ‘the sin-
gle unifying idea that guides the nation’s long-term
development.’ The goal of GNH was first articulated
in Bhutan’s Constitution as a key principle. Along
with happiness, poverty reduction is also considered
a primary goal in the country’s tenth Five Year Plan
(2008-2013). It has taken several years to identify the
measures used in calculating the GNH Index and to
quantify those variables, many of which require citi-
zens’ introspection and personal value judgment. In
parallel, Bhutan has designed a holistic framework
of development and system of prioritization that can
also serve as a guide for allocating resources accord-
ing to GNH screening tools and targets (Box 15.2).
Whereas some dimensions of Bhutan’s GNH Index
are common with well-being measures from around
the world, such as living standard, health, educa-
tion and good governance, what is new and inter-
esting are the dimensions pertaining to emotional
well-being, which includes indicators of emotional
balance and distress as well as spirituality (which is
deemed valuable for an individual’s happiness). The
second interesting dimension is that of community
vitality, which includes indicators on the family as
well as the neighborhood. Family-related indicators
relate to the individual’s access to a direct support
system, with – for example – value being attached
to the proximity of relatives living in ones neighbor-
hood. Community-related indicators measure the
extent to which community values, such as trust,
social support and socialization, are enjoyed by the
individual. The dimension of cultural diversity is
especially important for countries that enjoy mul-
tiple ethnicities, such as the use of different dialects
in Bhutan, and yet it also captures the importance
of traditional artisanal skills and cultural expres-
sion which are important to all countries, including
Egypt. Finally, the ecological diversity dimension
covers environmental awareness as well as physical
measures of ecological degradation.
iDentifying DoMains anD inDicators for egyPt’s youth weLL -being inDex The choice of domains for Egypt’s proposed Youth
Well-Being Index is based on a review of the lim-
ited number of similar exercises that are being con-
ducted or have been completed and are in use across
the world. Those models that were closely studied
include UNDP’s work-in-process as well as the mod-
els utilized in Ireland, Canada and Brazil. In terms of
the number of domains, the framework is such that
each should represent a cluster of indicators or ele-
ments that are homogenous and that together pro-
vide as faithful a profile of youth as possible for that
domain. As to the indicators themselves, they are
selected according to their significance while ensur-
ing that there is little overlap between them.
Although it is possible to take account of many dozen
elements, indicators and domains, experience sug-
gests that it is safest not to over-extend the total
number in order to make the exercise manageable.
At the other extreme, it is also recommended that
there should be a sufficient number of domains and
related indicators so as to cater for the needs of vari-
ous stakeholders in the policy-making and civil soci-
ety spheres. For example, the Ministry of Education
would feel responsible and able to identify problems
and issues as reflected in the education domain and
all its elements/indicators for communicating to the
general public the how and why of levels or progress
of these entries. On the other hand, human rights
organizations would feel responsible to keep a close
eye on the indicators pertaining to the political par-
ticipation and security domains.
Table 15.4 provides the proposed Youth Well-Being
Index for Egypt as of the time of publication. There
are 10 domains, each of which covers a cluster of indi-
cators that belong to that domain, and the total num-
ber of indicators is 54. For each domain, the infor-
mation and data necessary is either readily available
(such as educational enrollment) or will have to rely
on regular surveys of Egyptian youth (such as SYPE).
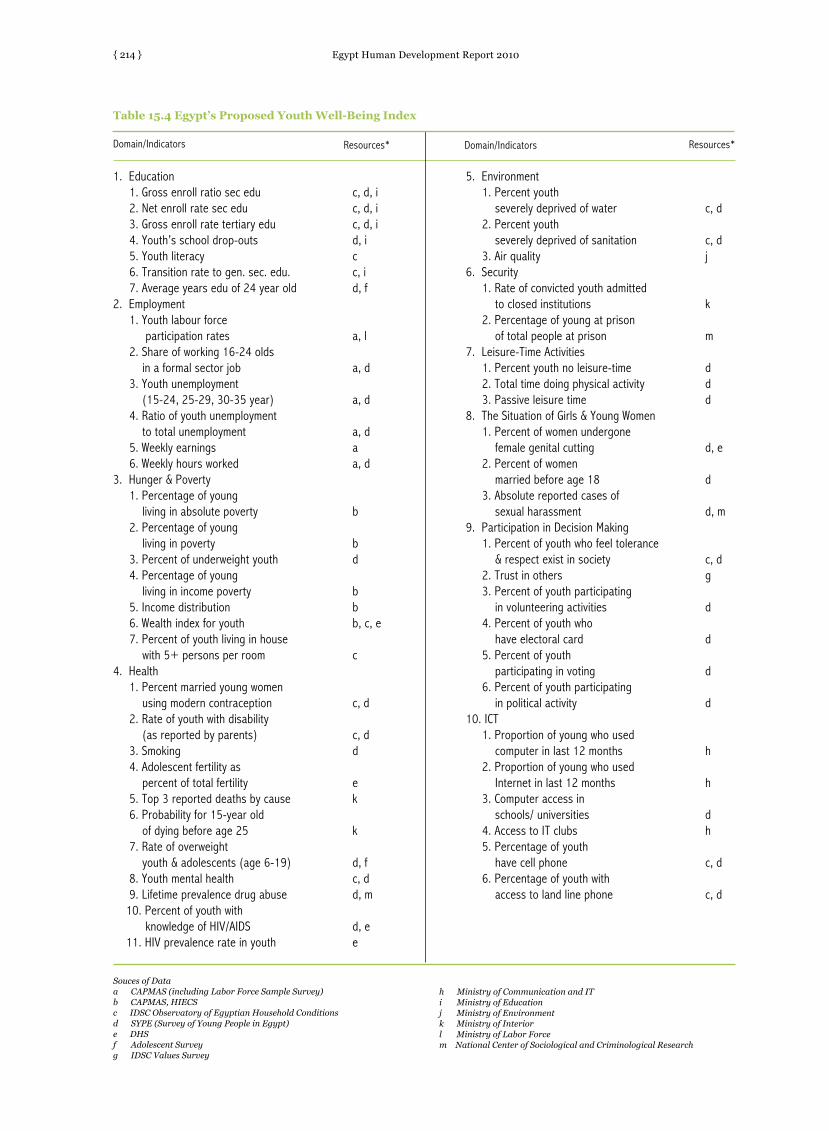
Egypt Human Development Report 2010{ 214 }
Table 15.4 Egypt’s Proposed Youth Well-Being Index
1. Education 1. Gross enroll ratio sec edu c, d, i 2. Net enroll rate sec edu c, d, i 3. Gross enroll rate tertiary edu c, d, i 4. Youth’s school drop-outs d, i 5. Youth literacy c 6. Transition rate to gen. sec. edu. c, i 7. Average years edu of 24 year old d, f 2. Employment 1. Youth labour force participation rates a, l 2. Share of working 16-24 olds in a formal sector job a, d 3. Youth unemployment (15-24, 25-29, 30-35 year) a, d 4. Ratio of youth unemployment to total unemployment a, d 5. Weekly earnings a 6. Weekly hours worked a, d3. Hunger & Poverty 1. Percentage of young living in absolute poverty b 2. Percentage of young living in poverty b 3. Percent of underweight youth d 4. Percentage of young living in income poverty b 5. Income distribution b 6. Wealth index for youth b, c, e 7. Percent of youth living in house with 5+ persons per room c4. Health 1. Percent married young women using modern contraception c, d 2. Rate of youth with disability (as reported by parents) c, d 3. Smoking d 4. Adolescent fertility as percent of total fertility e 5. Top 3 reported deaths by cause k 6. Probability for 15-year old of dying before age 25 k 7. Rate of overweight youth & adolescents (age 6-19) d, f 8. Youth mental health c, d 9. Lifetime prevalence drug abuse d, m 10. Percent of youth with knowledge of HIV/AIDS d, e 11. HIV prevalence rate in youth e
5. Environment 1. Percent youth severely deprived of water c, d 2. Percent youth severely deprived of sanitation c, d 3. Air quality j6. Security 1. Rate of convicted youth admitted to closed institutions k 2. Percentage of young at prison of total people at prison m7. Leisure-Time Activities 1. Percent youth no leisure-time d 2. Total time doing physical activity d 3. Passive leisure time d8. The Situation of Girls & Young Women 1. Percent of women undergone female genital cutting d, e 2. Percent of women married before age 18 d 3. Absolute reported cases of sexual harassment d, m9. Participation in Decision Making 1. Percent of youth who feel tolerance & respect exist in society c, d 2. Trust in others g 3. Percent of youth participating in volunteering activities d 4. Percent of youth who have electoral card d 5. Percent of youth participating in voting d 6. Percent of youth participating in political activity d10. ICT 1. Proportion of young who used computer in last 12 months h 2. Proportion of young who used Internet in last 12 months h 3. Computer access in schools/ universities d 4. Access to IT clubs h 5. Percentage of youth have cell phone c, d 6. Percentage of youth with access to land line phone c, d
Domain/Indicators Resources* Domain/Indicators Resources*
Souces of Data a CAPMAS (including Labor Force Sample Survey) b CAPMAS, HIECS c IDSC Observatory of Egyptian Household Conditions d SYPE (Survey of Young People in Egypt) e DHS f Adolescent Survey g IDSC Values Survey
h Ministry of Communication and ITi Ministry of Education j Ministry of Environment k Ministry of Interior l Ministry of Labor Forcem National Center of Sociological and Criminological Research

Egypt Human Development Report 2010 { 215 }
Domains
1. Education
2. Employment
3. Hunger & Poverty
4. Health
Indicators
1. Gross enrolment ratio for secondary education
2. Net enrolment rate for secondary education3. Gross enrolment rates for tertiary education4. Youth’s school drop-outs5. Youth literacy rates6. Transition rate to general secondary
education7. Average years of education of 24 years old
population
1. Youth labor force participation rates 18-292. Share of working 16-24 year olds in formal
sector jobs3.A. Youth unemployment rates (15-24 years old )3.B. Youth unemployment rates (25-29 years old )3.C. Youth unemployment rates (18-29 years old )4. Ratio of youth unemployment to total
unemployment5. Weekly earnings for youth
6. Weekly hours worked for youth
1. Percentage of young people living in absolute poverty
2. Percentage of young people living in poverty
3. Percentage of underweight youth4. Percentage of young living in income
poverty5. Income distribution6. Wealth index for youth7. Percentage of youth living in housing units
with 5 or more persons per room “Severe overcrowding”.
1. Percentage of married young women using modern contraception
2. Rate of youth with disability (as reported by parents)
3. Smoking4. Adolescent fertility as a percentage of total
fertility5. Top 3 reported deaths by cause for youth6. Probability, for a 15-year old, of dying
before age 257. Rate of overweight youth and adolescents
(Ages 6-19)8. Youth mental health9. Lifetime prevalence rates of drug abuse
among youth10. Per. of youth with comprehensive correct
knowledge of HIV/AIDS11. HIV prevalence rate among youth
Table 15.5: Calculating Egypt’s Youth Well-Being Index
Calculated
Average yrs of schooling among youth 18-24
Average youth annual income LE, poor to non-poor
Absolute poverty by deprivation criterionPoverty by deprivation criterion
Gini CoefficientRatio of the richest 20%/ poorest 20% =
Percentage of overweight youth 18-19 years
Data
42.239.710.229.884.0
9.6
54.9
42.8
15.1
5.8
11.4
88.9
147.648.2
9.5
33.12.023.229.5
2.4
1.2
47.8
1.516.8
20.418.3
1.7
85.2
Unit
%%%%%
years
%
%
%
%
%
%
ratiohours
%
%%%%
up to 1
%
%
%%
%%-Index
%
%
Year
20092009200920092009
2008
2009
2009
2009
2009
2009
2009
2009
2009
2008200820082009
2009
2008
2008200820092008
20082009
2009
2008
Source
HIECSHIECSHIECSSYPEHIECS
DHS
HIECS
HIECS
HIECS
HIECS
HIECS
HIECS
HIECS
SYPE
DHSDHSDHSHIECS
HIECS
DHS
DHSDHSSYPEDHS
DHSSYPE
SYPE
DHS
Domain Value
51.1
78.1
81.7
82.0

Egypt Human Development Report 2010{ 216 }
caLcuLating egyPt’s youthweLL-being inDex 7
Egypt’s Youth Well-Being Index (YWBI) consists of
ten dimensions which are equally weighted – both for
the sake of simplicity and making necessary adjust-
ments over time, and because each dimension is in
fact considered relatively equal in terms of impor-
tance in the YWBI. The YWBI is a composite index
in which the ten domains support different aspects of
the youth life cycle (education, employment, hunger
Indicators
1. Percentage of youth severely deprived of water
2. Percentage of youth severely deprived of sanitation
3. Air Quality
1. Rate of convicted Youth admitted to closed institutions(by gender)
2. Percentage of young people at prison of total people at prison
1. Percentage of youth with no leisure-time2. Total time doing Physical activities (Sport)3. Passive Leisure Time
1. Percentage of women who have undergone female genital cutting
2. Percentage of women who get married before the age of 18
3. Absolute reported cases of sexual harassment
1. Volunteering - “Pecentage of youth participating in volunteering activities”
2. Percentage of youth who have Electoral card (by gender)
3. Percentage of Youth participating in voting4. Percentage of Youth participating in
Political Activities (18-29 age)5. Per. of youth feeling that tolerance and
respect exists in society6. Trust in others
1. Proportion of young people who used a computer in last 12 months
2. Proportion of young people who used the Internet in last 12 months
3. Computer access in schools/ universities4. Access to IT clubs5. Percentage of youth who have cell phone6. Percentage of youth who have access to
land line phone
Domains
5. Environment
6. Security
7. Leisure-Time Activities
8. The Situation of Girls/Young Women
9. Participation inDecisionMaking
10. ICT
Calculated
7 days
YWBI
Data
2.6
3.7
0.40.28.8
89.6
29.9
50.3
3.1
12.228.4
9.1
70.515.8
9.717.2
45.2
51.0
Unit
%
%
%%%
%
%
%
%
%%
%
%%
%%
%
%
Year
2008
2008
200920092009
2008
2008
2009
2009
20092009
2009
20092009
20092009
2009
2009
Source
DHS
DHS
SYPESYPESYPE
DHS
DHS
SYPE
SYPE
SYPEWVS
WVS
WVSWVS
SYPESYPE
SYPE
SYPE
Domain Value
96.9
---
63.7
43.4
23.2
30.8
61.2
& poverty, health, environment, security, leisure-time
activities, the situation of girls and young women,
participation in decision making, and ICT).
Each dimension in the YWBI is based on a list of
selected variables that describe the situation and vari-
ations in that respective dimension. The whole set of
variables includes 54 estimated statistics, calculated
from four nationally representative surveys, namely
the Household Income & Consumption Survey, the

Egypt Human Development Report 2010 { 217 }
Endnotes1. Special thanks are due to Defne Abbas for researching the various approaches and frameworks utilized in measuring well-
being indicators. Thanks are also due to Iman Refaat for her excellent statistical analysis and preparation of the draft results of the Egypt Youth Well-Being Index.
2. Ravallion, M., 1992. Poverty Comparisons - A Guide to Concepts and Methods, World Bank Paper 88.3. http://www.ophi.org.uk/index.php4. A small number of indicators were identified as being optimal for project management and focus, chance of acceptance
among.policy makers and politicians, and overall general understanding.5. Dell’Aglio, Debora, Cunningham, Wendy, Koller, Silvia, Borges, Vicente Cassepp and Leon, Joana Severo, Youth Well-
Being in Brazil: An Index for Cross-Regional Comparisons (April 1, 2007). World Bank Policy Research Working Paper No. 4189.
6. Alkire, Sabina, Santos, Maria Emma, Ura, Karma (November 2008). Gross National Happiness and Poverty in Bhutan: Applying the GNH Index Methodology to Explore Poverty.
7. This first exercise at calculating the Youth Well-Being Index was conducted by Mohamed Ramadan, at IDSC
World Value Survey, the Demographic and Health
Survey and the Survey of Young People in Egypt; in
all the surveys, the sampling weights were used to
retrieve the country representation. The 54 indicators
were selected after careful consideration and they are
believed to remain informative over time. Of the 54,
only 10 could not be calculated due to data limitations
(Table 15.5).
In each domain, the selected variables were defined
as per international literature and they were adjusted
to cope with the direction of good wellbeing at 100%;
most of the variables target the age group 18-29
years. The first step in the calculations is to produce
the 10 sub-indices, carried out as unweighted aver-
ages, and the second step is then to produce the final
composite index as an unweighted average of the 10
sub-indices.
The resulting composite YWBI for Egypt was calcu-
lated to be 61.2%, which can serve as the base from
which progress can be followed-up in the future. This
index, presented in Table 15.5, is not differentiated by
gender, but the available and disaggregated data from
HIECS and DHS did provide striking differences
between some of the indicator values for men and
women. This was particularly true for such indicators
as labor force participation and unemployment rates,
as also clear throughout the report. Absolute poverty
figures and average annual income are also found to
place women at a clear disadvantage, with the poverty
rate at twice as high for young women as young men,
probably a function of women-headed households.
The following presents the construction of the Youth
Well-Being Index.
1) Adjust the variables:
The adjustment process aims to unify all variables to
put their maximum at a level of 1 or 100% well-being.
Therefore, there are some variables whose value
should be restructured in the opposite direction, e.g.
unemployment rate is adjusted to be employment
rate.
ifi max (X) means wellbeing ... Xi = Xv
otherwise Xi = (max (Xi ) - Xi ) (i = 1, ..., 54)
In other variables, a specific target value rather than
the theoretical ceiling is used, and thus the variables
are treated as follows:
2) Build the 10 dimension sub-indices:
3) The YWI is:
Notations:
Xi : is the i-th variable, i=1,…,54.
Dk : is the k-th dimension k=1,…,10.
YWI : Youth Well Being Index.
Xi : is the adjusted variables toward good
well being.
Egypt Human Development Report 2010{ 218 }
annex
Annex 15.1: An Explanation of Domains and Their Related Indicators1. Education: The gross enrolment ratio is the total number of pupils or students enrolled in a given level of education, regardless
of age, expressed as a percentage of the population in the theoretical age group for the same level of education. For the tertiary level, the population used is the five-year age group following on from the secondary school leaving age. The net enrolment ratio is the number of pupils of the theoretical school-age group for a given level of education who are enrolled in that level, expressed as a percentage of the total population in that age group. Youth school drop-outs show the number of those aged 20-24 who are not attending school and who have not graduated from high school and is expressed as a percentage of Egyptians aged 20-24. The youth literacy rate is the percentage of young people who can, with understanding, both read and write a short, simple statement related to their everyday life. The transition rate to general secondary education measures the degree of access to a given level of education from the previous level of education.
2. Employment: Labor force participation rate is the measure of the proportion of a country’s working-age population that engages actively in the labor market, either by working or actively looking for work, and it is calculated by expressing the number of persons in the labor force as a percentage of the working-age population. The unemployment rate is calculated as the unemployed as a fraction of the labor force, and the youth unemployment rate refers to those in the specified youth age range. Weekly earnings show the average weekly earnings for an employed person (wages before taxes and other deductions); this indicator had been changed by average of the annual youth income. Weekly hours worked is the average number of hours spent at work per week.
3. Hunger and Poverty: The percent of youth living in absolute poverty refers to those who experience at least two severe deprivations of basic human needs (food, safe drinking water, sanitation facilities, health, shelter, education and information). The percent of young people living in poverty refers to the percentage of those that experience any deprivation of basic human needs. The percentage of youth living in income poverty is based on a national poverty line. The percent of underweight youth measures the percentage of young people that are underweight. The income distribution indicator measures the differences in after-tax income among families, which is based on the Gini coefficient. The wealth index for youth follows the Egypt DHS methodology and the percentage of youth living in housing units with more than five persons per room is known as severe overcrowding.
4. Health: Contraceptive prevalence among married women is the percentage who are using, or whose partners are using, a modern form of contraception. Smoking refers to the percentage of men and women who smoke cigarettes. The fertility rate is the number of children that would be born to each woman if she were to live to the end of her child-bearing years and bear children at each age in accordance with prevailing age-specific fertility rates in a given period. The top three reported deaths by cause for youth provides insight into the specific health risks for young people, the probability at birth of not surviving to a specified age is calculated as 100 minus the probability (expressed as a percentage) of not surviving to a specified age for a given cohort, the rate of overweight youth refers to obesity, and mental health measure the mental health score based on WHO methodology. Lifetime prevalence of abuse (used at least once in a lifetime) is an appropriate measure, in particular regarding youth, as it indicates the potential for development of more frequent and problematic patterns of drug abuse. A large proportion of the “users” among the youth population have used an illicit drug only once or twice in their lifetime. HIV prevalence is the percentage of people aged 15-49 who are infected with HIV.
5. Environment: Water deprivation refers to youth using water from an unimproved source such as an unprotected well, an unprotected spring, surface water, a tanker truck or cart with small tank or who it takes 15 minutes to retrieve water. Sanitation deprivation refers to youth who live in households with a pit latrine, bucket toilet or no facility at all, or use modern systems where the drainage is connected to a canal, groundwater, or there is no drainage system. The air quality indicator reflects the potential population exposure to ground-level ozone and fine particulate matter, two key components of smog that are harmful to human health.
6. Security: The rate of convicted youth admitted to closed institutions measures the response of the criminal justice systems to illegal behaviors, rather than juvenile delinquency.
7. Leisure-Time Activities: Time use generally refers to time spent on activities such as household maintenance, management and shopping for own household, care for children, the sick and the elderly, and community services; physical activity is meant to refer to sports, and passive leisure time is meant to measure the amount of time per day that youth watch television, play video games and chat on the phone with friends
8. The Situation of Girls and Young Women: Indicators include FGM rates, age of marriage and reported cases of sexual harassment.9. Participation in Decision Making: Volunteering refers to the extent to which young people volunteer their time to charitable and
non-profit organizations. Tolerance, respect, and trust refer to the proportion of young people who feel that these values exist in society.
10. ICT: ICT indicators include access to computers, the internet, IT clubs, cell phones and landlines.
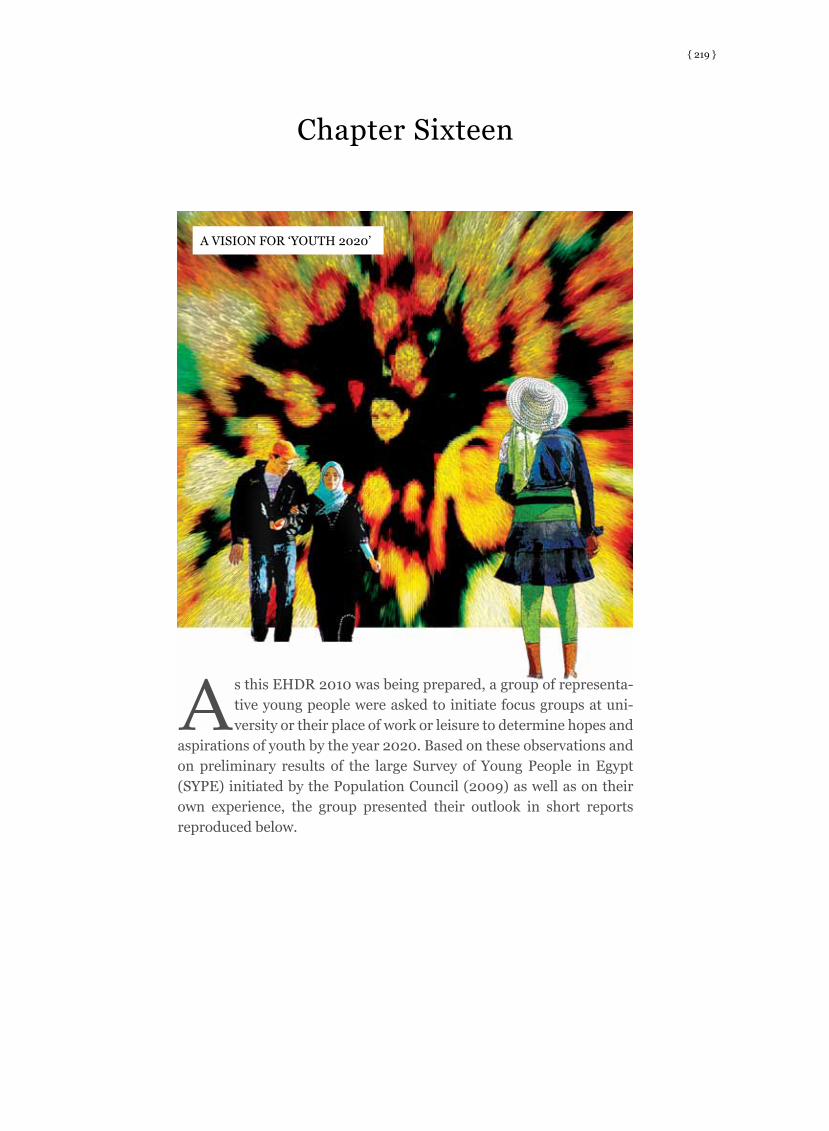
{ 219 }
As this EHDR 2010 was being prepared, a group of representa-tive young people were asked to initiate focus groups at uni-versity or their place of work or leisure to determine hopes and
aspirations of youth by the year 2020. Based on these observations and on preliminary results of the large Survey of Young People in Egypt (SYPE) initiated by the Population Council (2009) as well as on their own experience, the group presented their outlook in short reports reproduced below.
Chapter Sixteen
A VISION FOR ‘YOUTH 2020’

Egypt Human Development Report 2010{ 220 }
saLLy: an overviewWith nearly 34% of the population under 30 years
of age, to talk about youth’s inclusion in social and
political affairs raises questions not only about pos-
sible channels for participation and approaches of
inclusion but about the existence of an enabling envi-
ronment necessary to create and trigger these mecha-
nisms. In Egypt, the discourse has been centered on
the apathy and reluctance of youth to be engaged in
civic activities and to participate politically. On the
other hand, very little attention has been given to the
current socio-political environment and whether this
actually enables participation, voluntarism and civic
engagement from youth.
In this respect, a large portion of the blame for mod-
est participation and little civic engagement from
youth should be placed on the present social, cultural,
political and economic environment in Egypt rather
than on the youth themselves. The potential for the
creation of an enabling environment also appears to
be greatly undermined by the country’s poor record
of democracy and respect for human rights, as well as
by a malfunctioning educational system, increasing
unemployment rates, high levels of corruption, wors-
ening individual and community values, and prevail-
ing religious extremism.
In the SYPE survey on youth opinions and attitudes
in Egypt, , as well as in focus group discussions con-
ducted by the authors of this chapter, the fact that
youth are interested in discussing the ills of their
society and dream about better living conditions was
clearly expressed. Youth aspirations revolved around
better education, suitable job opportunities, decent
wages, and family encouragement for civic and politi-
cal engagement. These opinions were a result of the
conviction amongst youth of the current futility of
participation, the perception that opportunities were
unequally distributed, the presence of nepotism and
favoritism, and the many economic hardships faced,
largely as a result of unemployment.
Despite the pessimism that underlined this critique,
youth in Egypt remain to some extent optimistic
that venues of positive change are possible. This
was expressed enthusiastically in their “vision” for
youth equity and socio-political inclusion, believed
to be realistic and attainable. This vision, achievable
by 2020, explored possible solutions as well as new
approaches to the problems inherent in the system
itself, to enable youth to integrate and to effectively
play their aspired role in society. The basis of the
vision would lie in creating an enabling environment
and in allowing youth dreams and ambitions to be
both expressed and addressed.
As a first step, the prevailing conviction that youth are
incapable of making decisions for themselves must
be contested. In a paternalistic society such as in
Egypt, there is the belief that adults must care for and
watch over young people until a relatively advanced
age. This attitude is responsible for prolonging the
years of dependency and can be said to contribute
significantly to apathy. A potential way out would be
to encourage young people to participate at all levels
of the decision-making processes which affect them,
both inside and outside of the home. This could be
best applied in schools, at universities, and in youth
centers where the habits of responsible participation
could be instilled from the earliest stages.
The poor and often counterproductive role per-
formed by secular institutions (schools, universities
and youth centers) — where authoritarian super-
vision is the rule — has resulted in paving the way
for religious-based associations to take the lead
in attracting youth and in shaping their attitudes.
This, in part, is due to the fact that these groupings
are well-organized and present an opportunity, not
available elsewhere, to give voice and to address mat-
ters of concern. Statistics demonstrate that the per-
centage of youth that participate in civic activities is
estimated at approximately 2%, 65% of which do so
through religious channels. Islamic CSOs formed by
and targeting youth represent a growing part of Egyp-
tian civil society and in the past decade the majority
of them began through student initiatives, such as
the case of Resala, which today has over 25 branches
and more than 50,000 volunteers. Similarly, Coptic
Christian youth appear increasingly to turn inwards
to their churches and communities where voluntary
civic activities are concerned, thereby becoming
more excluded from the mainstream.

Egypt Human Development Report 2010 { 221 }
These developments indicate that the secular chan-
nels of the state and civil society organizations have
not succeeded in integrating youth into socio-political
life, but have allowed a vigorous role and space for
faith-based CSO movements. As a consequence, the
question becomes how to enhance youth secular civic
engagement that is derived out of a sense of belonging
and citizenship rather than from religious affiliation.
Mechanisms to do so are available and could be
divided along three dimensions: The first is to
empower youth and encourage them to realize their
capabilities and their usefulness to their communi-
ties. This could be best performed through family,
educational institutions and religious establishments.
The second is to enable and empower government and
non-government secular institutions to attract youth,
for instance, by creating and activating relevant youth
forums, summer civic activities, and awareness pro-
grams. The third is facilitating and advocating youth
civic engagement and volunteerism in schools, uni-
versities, and youth centers through public awareness
campaigns.
Youth themselves can also be considered a catalyst
for change. A considerable portion of Egypt’s edu-
cated youth is now involved in what is known as “vir-
tual activism”. Youth have created/participated in
blogs and e-forum discussions to freely express their
views about pressing political, cultural, social and
economic issues in Egypt. However, according to a
recent study by the Central Agency for Public Mobili-
zation and Statistics (CAPMAS), only 19% of the esti-
mated 160,000 Egyptian blogs are of political nature.
Moreover, according to the Population Council’s
Survey of Young People in Egypt (SYPE), only 23%
of Egypt’s youth are internet users and 13% of these
use the internet to be informed about or participate
in discussions on socio- political issues. These figures
indicate that although effective, virtual activism has
to be further enhanced.
It is equally important to address negative trends in
community values. The most effective way to do so
is to concentrate on youth — since it is young people
who are most influenced by negative values. From
the viewpoint of youth — and noting the diversity
among young people themselves — the predominant
harmful trends in community values are intolerance
to others’ beliefs/opinions, individualism and selfish-
ness, passivism, religious extremism, and a growing
inclination to adopt male-dominated attitudes and
gender inequality.
To correct these unaccommodating trends is to work
on those constituencies responsible for shaping them.
That is, family, educational institutions, religious
establishments, and the media. Parallel to this is the
urgent need to highlight the accomplishments of role-
models in a variety of fields so as to create a sense of
pride and of belonging, thereby promoting the confi-
dence that comes with success.
There is a predominant tendency among scholars to
describe the major swings that the Egyptian socio-
political environment has been undergoing ever
since the advent of the Mubarak Presidency in 1981
as a process of liberalization of society rather than
democratization of the state. Nevertheless, youth can
still take advantage of the space offered through the
process of liberalization in pushing for democratiza-
tion. Youth enthusiasm and persistence could ener-
gize them to assume vigorous roles in the quest for
democratization and the enforcement of the rule of
law. From youth perspective, major obstacles to an
effective rule of law are corruption, favoritism and
autocratic rule.
With the Egyptian government’s ongoing plans to
implement decentralization, which entails empow-
ering local popular councils (LPCs) on village, dis-
trict/town and governorate levels, a new platform
for youth participation can be seen, particularly that
the percentage of youth elements in LPCs — in which
membership starts at the age 25 — has increased
in the 2008 local elections from less than 0.8% to
4.1% Although, the percentage remains low, and the
implementation of decentralization will give youth a
greater chance to participate in guiding the choices of
their local communities whether through participa-
tory planning in the formulation of local policies or
through representation in LPCs.

Egypt Human Development Report 2010{ 222 }
shaheer: the PoLitics of ParticiPation
For youth to integrate in social and political life in
Egypt, early beginnings start with school. Youth
cannot feel that they are citizens — with rights and
responsibilities — unless they practice these values in
an enabling educational environment. But although
Ministerial Decree 203 for 1990 states that student
unions must be set up in each school in Egypt, with
the participation of all levels, in practice, elections
do not take place at schools. There appears to be no
awareness of the importance of this process to civic
participation and no serious intent in instilling the
principles of democracy among students. The budget
allocations for student unions are persistently allo-
cated to other activities, with no say from students,
although the law states otherwise. An aspiration for
2020 is that while minimal changes are needed in the
legal context, enforcement and integrity in applying
Decree 203 should take place.
The question is whether there should be some form of
administrative oversight over any school’s attempts to
raise awareness on student rights and roles in student
unions, and whether regulations should be made pub-
lic to all? The answer must be a strong ‘yes’. A further
improvement could also be to incorporate students’
voice in school decisions, even at the national student
union level, as well as in any change that affects the
school education system in Egypt since it is through
collective work and participation in decision making
that the foundations of citizenship are developed. By
2020, it is hoped that credible student unions would
have created good citizens with the right to argue and
defend opinions, willing to engage with their realities
and be critical of these.
Young people in Egypt, currently in common with
other citizens, share an excluded status in respect to
public concerns and political socialization. This mar-
ginalization undermines any feeling of group identity
and engagement. The recent SYPE survey indicates
that almost 90% of Egyptian youth between the ages
of 15-29 do not trust each other as a group. This is
understandable given that the outlets that enable
young people to come together are minimal, especially
those that promote civic awareness and public inter-
est. Delayed marriage, unemployment, and lack of
voice have also led to apathy so that that young people
chose rather to mingle socially in cafés and distance
themselves from the daily frustrations of exclusion.
The sanctioned contribution to youth activities has
been the official creation of youth clubs across Egypt,
the focus of which has been on sports alone, despite
the fact that the National Council of Youth classifies
sports as just one part of their activities. On the offi-
cial Council website, successes of this initiative cover
mainly physical accomplishments: for example, that
four swimming pools have been built and that four
are under construction, 56 open playgrounds have
been developed, 157 closed playgrounds established,
106 gym halls in operation and 54 wrestling mats
newly purchased.
However, according to the National Youth Council
decision 120/2010 that newly restructured the main
statute of all youth centers in Egypt these centers are
aimed at training youth in leadership and life skills ,
civically educate them and help them discover their
talents and foster their creations. This does not occur
and centers play no role in recruiting youth volun-
teers for public services and national projects such as
illiteracy eradication and family planning. The SYPE
survey not surprisingly indicates then that only 0.01
of youth surveyed actively participate in youth cen-
ters.
The refocus of youth centers on social and cultural
activities by 2020 could reorient and reemphasize
feelings of citizenship. It would give room for girls
— at present largely excluded, especially in Upper
Egypt — to engage in enriching pursuits outside of
the home. Volunteer work, educational and artistic
activities could allow girls and boys to interact, under
socially acceptable conditions, although, in conser-
vative areas, it would not preclude regular hours for
girls alone to socialize and practice sports.
For the minority Coptic community, whose churches
are nowadays filled with social and cultural activi-
ties, well-run national youth centers could become
a stimulus to bring Copts outside of churches and
integrate more fully with the larger community. Cen-

Egypt Human Development Report 2010 { 223 }
ters provide an enormous opportunity that should be
consciously seized to attract all youth — Muslim and
Christian alike — and reinforce their allegiance to a
larger identity, which is that of the nation to which
they belong.
At present, however, most youth engaging in socially
productive work act through religious institutions. A
large 67% of youth look for volunteering opportuni-
ties in religious institutions against only 23% in non-
government organizations. For example, 47.7 % of
those working with the deaf are in religious institu-
tions in comparison to only about 19% in civil society
organizations (CSOs); 38% help in teaching educa-
tional and computer skills in comparison to 17.7% in
CSOs.
The potential activation of youth centers in trans-
forming their activities cannot be overlooked. It
would be good if young people by 2020 were much
more vigorous in centers’ general assemblies, where
they could elect board members and help decide on
important issues such as budget allocations. Pres-
ently, these are rights guaranteed by law but not
reflected in the norm.
The legal system covering youth centers appears at
variance and is often stifled by laws that need more
precision. Such is the case of Law 77 for 1975. This
concerns youth and sports institutions, and clarity is
especially needed given the current division between
the National Council of Youth and National Coun-
cils of Sports. In addition, in relation to the National
Youth Council decision 120/2010 that tackled many
of the problems of the old statues, some amendments
are yet required and their application ensured. For
example, Article 46 should be amended for no board
member is to be assigned by the government but must
be elected by the general assembly. Also the right of
the minister in article 60 to dissolve the board can be
maintained but not for a year and immediate call for
general assembly has to take place for a new board
election. And finally aside from enacting article 46
that states 50% of the board should be less than 30, of
which two are females, the managing director of the
center in article 56 should never exceed 35.
For a vision where youth are educated on citizen-
ship and enjoy the social space to formulate opinions
and be politically socialized, there is first the need to
establish the right to practice politics. Two domains
are important where this is applicable:
1. University Campuses
An uncensored university life has been a rich source
of political socialization and for stimulating a sense
of concern over public issues, and has, until recently,
been traditional among Egyptian youth (see Box 16.1).
University independence has once more to be
respected by 2020, starting with the removal of secu-
rity officers affiliated to the Ministry of Interior and
Egypt Human Development Report 2010{ 224 }
replaced by security officers under the supervision of
each university dean, as stated in Article 317 in the
Executive Statute for Universities Administration.
This independence should also be reflected in stu-
dent unions, which must be created and managed
by students in consultation with faculty members,
even with regard their financial resources. The right
of students to express their political views should be
liberated from university administrative domination
and political committees in student unions should be
reinstated. Allocation of time for student activities
should be freed up, and there should be no obstruc-
tion to students choosing the activities they prefer.
By 2020 it is hoped that the university administration
would have revoked the clause that bars member-
ship to unions councils of students whose freedoms
were previously restricted — or at least amended to
include the exception of exposure to the same penalty
for political reasons. Also, an umbrella student union
representing all universities could be created to work
on strengthening the relationship between diverse
universities, and help break the present fragmenta-
tion of students.Regulations for student union elec-
tions should be widely publicized with adequate time
for students to nominate candidates. At least 50% per-
cent of registered students should take part for elec-
tions to be valid. They should never be scheduled to
take place on holidays. Finally all students should pay
3% of the fees for union activities, to increase union
revenues and act as an incentive for greater participa-
tion in activities. Within ten years, it is hoped that the
perception that student unions ‘do nothing’ — as was
found in focus groups — will have disappeared.
2. The Public Space
A public space ought to be free from an emergency
law that restricts political parties’ ability to orga-
nize and campaign freely. Focus groups and the
SYPE survey indicate that young people seem not to
approve of the current political actors, and secular
actors are missing. The secular need is also impor-
tant for Coptic youth’s integration into society. Less
than 25% of eligible voters participated in the 2005
elections and the percentage of youth taking part was
very low according to the SYPE survey.13 This shows
that a very large segment of the electorate is still not
reached. Coptic youth in focus groups felt they were
rarely approached by political parties so that they
would rather seek church and parents for trustwor-
thy opinions on political issues. However, by 2020,
it is hoped that genuinely open non-sectarian parties
have learnt to identify potential new constituencies
among all Egyptian youth and bring them into the
organization.
Virtual space should also be promoted, with less sur-
veillance. According to the Open Net Initiative and
Freedom House reports of 2009, internet filtering is
not taking place. However, arresting bloggers should
cease to take place for youth to feel secure enough
to participate and engage. In 2020, articles of the
penal code and the Emergency Law which give secu-
rity agencies broad authority to monitor and censor
all communications should hopefully be removed.
Amendments to the Press Law passed in 2006 with
provisions that criminalize ‘false news’ and apply to
online writings should be reviewed.And finally Con-
stitutional amendments passed in 2007 that paved
the way for future counterterrorism legislation
Box 16.1: Recollections from a Freer University Era
An account by a former student at the University of Menia recounts how he started university with no interest in politics and
the extent to which that changed. His description of his first day was as follows;
“I walked through the university gates, and everywhere, the wall magazines surrounded me. They were posted all over the
walls so that there was little space for anything else, and they hung off pegs from ropes stretching from one end of the
courtyard to the other. They spoke of politics, poetry, holy scripts, and swayed as they did in the air, confronting and
challenging each other …
The university was charged with life, energy and ideas, it was as if I had just stepped into the world!”
*An extract from M.A. thesis, ‘Youth Movements in Egypt’ by Alia M. Mossalam

Egypt Human Development Report 2010 { 225 }
should be amended to still uphold freedom of speech
enshrined in the Constitution and not affect citizens’
right to privacy stated in the 2003 Law on Telecom-
munications.
A vision for reform by 2020 stands complete when
an enabling environment for youth to vote is guaran
teed. This environment should ensure no vote rigging
and genuine competition among different parties to
encourage young people to feel their vote makes a
difference. More importantly are the dealings of the
police in the shape of bullying and harassment. This
discourages any kind of participation and engage-
ment in the public space.
Youth by 2020 should have become enabled to base
their opinions on facts rather than on the experience
of exclusion, or on family and narrow allegiances.
Transparent facts present opportunities to integrate
socially and politically, replacing the current focus
on grievances. But youth integration is not a linear
path in Egypt or elsewhere. It entails the struggle
to be heard and respected against a background of
authoritarian values and vested interests. Therein lies
the challenge.
nihaL: thoughts on eDucation“Going to school is biggest waste of time of all. Teach-
ers are only concerned with giving private tutoring
classes, nothing gets done inside school, it’s useless.”
With remarks such as this from a young man in a
focus group in Beni Suef, the question of how effec-
tive the education system is in Egypt is bound to come
up. Egypt still suffers from low enrollment rates with
almost 20% of young boys and girls never having
been to school. Young people end up dropping out of
schools at alarming rates and those who drop out, do
so at as young as ten years of age.
Box 16.2: What is Missing in the Education Curriculum in Egypt
Many courses (including electives) are taught at schools in some countries like the United States; these types of courses
are not present in the Egyptian Thanaweya Amma. Important examples include “national security” and “ethics.” An
introduction of “national security” as a course would be a challenging step to do, and it seems necessary even if by force.
It is more than likely that Egyptian students are not fully aware of the significance of introducing such a subject, and while
it has technically always been a part of the social studies curriculum, its focus has been simply chronological and episodic
with major attention given to wars, especially in the United States. As for Egypt, little attention has been given to the
evolution and structural arrangements of the nation’s security, the underlying global and national premises for maintaining
security, and the basic context in which security has been achieved. Egyptian students should be exposed to more specific
criteria, not currently directly taught in social studies, such as worldwide threats that include monetary instability, global
inflation, ecological disturbances, and nuclear weapons. Education about national security has an important and distinct
contribution to make to education for full and competent citizenship, the supposed primary goal of social studies education
in Egypt. As for “ethics,” it should be introduced as a subject apart from religion and should definitely be a mandatory
course for all students.
The Ministry of Education seems to be making promises that results in no changes. Even the changes in the curriculum are
proving superficial and ineffective within a system that is highly resistant to change. It is not enough to adopt a system
without reforming the schools and having qualified teachers. If the English system was adopted, schools and teachers
would first need to be at the same level of professionalism as they are in schools in the UK. Internet availability in schools
is a must, and while it is present in Egypt, what can be said about the efficiency? Are there qualified teachers that are
properly trained to serve these students or not? A serious increase must be made on the emphasis placed on the teaching
of foreign languages and on computer skills, and most importantly, on teacher’s pay. These reforms could be financed by
increased taxation or by investment. In an interview with a Thanawya Amma student, he cited wondering why he had to take
a course by force – one that would not be in any way beneficial; he himself proposed the idea of having electives instead.
Source: Engy El Rafaee, prepared for the EHDR 2010

Egypt Human Development Report 2010{ 226 }
The national school curriculum remains one of the
system’s biggest challenges. According to inter-
viewed students “…the curriculum diminishes cre-
ativity. There needs to be more attention given to
foreign languages, we need to learn English phoneti-
cally not just read and write”. The content taught at
national schools needs to undergo a thorough process
of reviewing and revamping to equip students with
relevant skills rather than obsolete ideas. New sub-
jects need to be introduced to the curriculum such as
financial education (accounting, cost-benefit analy-
sis, saving, and so forth), and ICT. Schools do house
computers (indeed, 90% of students in the SYPE sur-
vey reported their schools housing computer labs),
but school administrators regard the devices as an
endowment. Computers are often left in boxes, to
come out only upon Ministry of Education (MOE)
inspections. Students are often not allowed to use or
touch the PCs.
Most teachers are not adept PC users themselves and
are therefore unable to impart practical skills. Most
young people cannot afford to own computers While
internet cafes abound even in rural areas, young peo-
ple use them only to access the internet and chat web-
sites rather than getting basic knowledge of software
programs (Word, Excel, etc).
Many NGOs have been delivering life skills education
through their local organizations. Such programs are
particularly successful among young girls without
alternative sources of information, restricted mobil-
ity and limited exposure. Indeed, SYPE states that at
least 24% of young rural girls of ages ranging from 10
to 29 years said they attended literacy classes at local
NGOs. But popular and useful as they are, stand-alone
Box 16.3: Turkey’s Student Selection Exam (OSS)
What is the sense in having thick books, a huge number of courses, and unnecessary subjects?
When using Turkey as a case study, we find that at the end of high school (following the 12th grade), students should
take a “high school finishing exam,” namely the OSS (Ogrenci Secme Sinavi, translated as the Student Selection Exam);
this system was applied in the country in the late 1960s. Students take the “high school finishing examination” as a
prerequisite, and they are required to pass this exam in order to take the OSS and continue on to the university level. The
benefit of OSS is that the exam scores are weighted to provide students in each track with different opportunities when
entering higher education, as follows:
• Mathematics: International Relations, Law, Education, Psychology, Economy, and Business Management.
• Science: Engineering, Computer Science, Medicine, and other science related professions.
• Social Sciences: History, Geography, Education.
• Languages: Language, Linguistics, and Language Teaching.
The OSS exam simply tests the students’ analytical thinking, and problem solving abilities, as well as the knowledge of the
high school curriculum in all areas. Each student must answer all questions on the test regardless of his/her department.
Seemingly, it is more of an advisory exam, where students can see what fields are more appealing to them based the
weighted average score. Allocation of the students takes place according to the scores obtained from the OSS, students’
average high school scores, and priority ranking of field of study.
Comparing the Turkish educational system to the Egyptian Thanaweya Amma shows the former to be far more efficient and
specific for students themselves than the latter, specifically the “Matktab El-Tansee,” which has actually proven a failure
year after year. The problem with the Thanaweya Amma is that student must literally shut off mental functions to score
high and immediately apply for the “Tansee,” which randomly chooses the destiny of the student based on scores from
high school. In Turkey, the “dershane” system allows for students to be drilled on various aspects of the OSS, and students
typically participate on the weekends and after school hours (especially in their last year). Interestingly enough, the unified
university entrance test exam system has transformed these schools into intense test tutoring centers where students are
trained for four years on taking the OSS test. More information can be found at http://www.euroeducation.net/prof/turkco.
htm Source: Engy El Rafaee, prepared for the EHDR 2010

Egypt Human Development Report 2010 { 227 }
NGO efforts are insufficient to meet the informational
needs of poorer young men and women.
The formal curriculum needs to include a life skills
component in order to address young people’s needs.
Basic health and hygiene are essential components of
life skills education; however, providing youth with
‘psychological education’ is of equal importance.
Notions of acceptance of ‘the other’, social integra-
tion, reinforcement of the national rather than reli-
gious identity and acceptance of other cultures are
more relevant than ever in our fragmented society.
The majority of Egyptian schools suffer from poor
quality staff. Low financial remuneration, weak train-
ing, limited exposure all combine to create lower levels
of motivation among school teachers who display the
same apathy and disinterest that plagues the coun-
try. Interviewed students reveal there are no teach-
ing standards, instructors receive no training and
deliver information according to their whims. There
is a desperate need to breathe life into the teaching
body and/or create an alternative pool of motivated
educators. One idea would be for the MOE to create
a competitive system whereby teachers are evaluated
by students. In the case of positive feedback, teach-
ers would receive financial bonuses, or benefits to
their families. It is possible to explore partnerships
between the MOE and the private sector to create
such a scheme.
An alternative path is to mould a different ‘type’ of
educator. Motivated young individuals should be
recruited and trained to become teachers in their
local setting. There are several possible mechanisms
of cooperation between the MOE and civil society to
create ‘new’ teachers. For example, local school grad-
uates are an untapped resource, but they are ideal
candidates to work as teachers for younger children
in their local areas – particularly in the case of non-
formal education. This group should be recruited sys-
tematically and trained to teach at local NGOs. This
is particularly suitable for many young women who
find it difficult to find a job due to cultural restric-
tions on their mobility. Some programs have suc-
ceeded on capitalizing on such young women and use
them to deliver their literacy, life-skills and sports
curricula to out-of-school girls. Being closer in age
to their students, these young women become role
models and often act as mediators between them and
their families.
Various vocational systems have been implemented
in Egypt, but all leave room for improvement. One
student who was interviewed said “…the lack of
attention to crafts has made craftsmanship the job of
those who are jobless!” It is critical therefore to alter
this perception, nurturing a more dignified status to
craftsmen and workers. To this end, several nation-
wide awareness campaigns should be launched in
cooperation between the Ministry of Education, the
Ministry of Manpower and major civil society orga-
nizations.
Local business owners could offer students the
opportunity to become trainees and apprentices of
their businesses while they are still attending school.
Trainings and apprenticeships could take place dur-
ing the summer vacation or, alternatively, after daily
classes. Eventually, upon graduation, students would
be hired as full time employees at the factory/busi-
ness where they were trained. This mechanism offers
students both the chance to receive an education and
secure employment in their local area.
seif: entrePreneurshiP anD youthYoung entrepreneurs in Egypt face plenty of chal-
lenges, such as — but not limited to — problems of
funding, hiring and sustaining skilled labor, poor
access to information due to limited resources, poor
support system for sustainability and risk manage-
ment, inability to mobilize funds to support functions
related to technology, training, or office operations.
Any vision for youth has to give significant atten-
tion to these factors. This part of the vision needs the
effective participation of all the stakeholders in order
to deliver strong results.
Skilled Labor Force
Building a skilled labor force is one of the most impor-
tant tasks of the government and the political leader-
ship in Egypt. However, the formula is more than just
a matter of supply and demand. The demand from
employers has to be matched by a supply of employ-

Egypt Human Development Report 2010{ 228 }
ees in sufficient numbers who have adequate skills.
In addition, the growing public rhetoric focuses on
matching the needs of the big players, whether local
or international, disregarding that SMEs consti-
tute the biggest portion of employment rates in the
country. Therefore, the needs of the SMEs have to
be matched, through educating Egypt’s students on
entrepreneurship, small business management, and
equipping them with the competencies necessary to
be innovative, risk-taking, and proactive.
A newly founded not-for-profit higher-education
institution in Egypt has taken the initiative on this
issue through introducing an undergraduate program
on small business management and entrepreneur-
ship. Several other initiatives have also been started
— at least at the level of introductory courses — in
other private universities. These efforts have yet to
develop more into fully-built programs and university
majors with the aim of graduating alumni capable of
starting and managing businesses.
Business Development Through Government Spending
As government is always required to spend in order
to create job opportunities in times of crises, it is now
required to allocate its spending to favor its SMEs.
According to the Business Development Services
Support Project (BDSSP), there are 318 items that the
government already buys that can be purchased from
the SMEs registered in the Social Fund for Devel-
opment.18 Directing this amount of money to SMEs
would have a remarkable impact on its growth and
generate a positive domino effect by increasing SMEs
capabilities of investing, hiring, and developing.
Moreover, the government should increasingly
develop the support system for SMEs as organiza-
tions, and entrepreneurs as individuals. This sup-
port system can take place in many forms, such as
– but not limited to – incubators, venture capital-
ists, apprenticeship, investors networks, financing
institutions, and even a stock market for SMEs. The
government has already taken steps in this regards,
by introducing Nilex; a stock market exchange for
Middle-Sized Companies (starting LE 500,000 in
Capital). The Social Fund for Development provides
financial, training, and marketing services for start-
up and existing businesses.
Support Services
The Industrial Modernization Center (IMC), provides
subsidized training and consulting services (with sub-
sidies reaching up to 90%) for its member Egyptian
industrial companies. The IMC, however, works with
large enterprises in the industry/manufacturing busi-
ness, but nonetheless, it acts as a model that the gov-
ernment can pursue for developing a similar institu-
tion for subsidized training and consulting, also sub-
sidized services for consulting, market research, and
major marketing services (such as branding, strategic
planning, etc.).
In addition, decision makers should be encouraged
to enact laws that facilitate the establishment of incu-
bators, venture capital, and investor networks. They
could also initiate public-private partnerships as an
implementing body of those institutions aimed at
funding and transferring the know-how to young
Egyptian entrepreneurs and SMEs. Those bodies can
also take the form of private equity or angel invest-
ment funds on a smaller level per investment, in order
to utilize the savings from remittances of those young
Egyptians in the villages and/or those who come back
from the Gulf, as providing an alternative to saving
remittances in a bank or spending them on housing.
However, this requires a level of awareness and risk-
taking that has to be promoted as well as protected by
the government through legislation and fiscal guaran-
tees.
One more important aspect is the need of Egyptian
youth to be inspired. This vast potential of youth —
to be untapped — needs more than legal systems and
governmental structure. Large-scale awareness cam-
paigns about success stories must be circulated in all
types of media in order to encourage young Egyp-
tians to become entrepreneurs and start their ven-
tures. In a research project undertaken by the Agency
for Development and Advancement (ADAA’) that
involved in-depth interviewing of 30 young Egyptian
entrepreneurs, almost all the entrepreneurs cited the
existence of a role model in their lives that inspired
them to become entrepreneurs.

Egypt Human Development Report 2010 { 229 }
Another level of awareness can be created among
youth with simpler educational backgrounds, who
do not have the know-how or the skill set to start an
SME. Microenterprises act as a viable self-employ-
ment solution for those who cannot be employed due
to the lack of skill set. The government can promote
microenterprises through facilitating and guiding
the very small investors towards certain projects.
For example, it can facilitate loans and training for
those who want to start micro-businesses in a certain
favored industry, such as transportation, etc.
On another level, angel investors’ networks and funds
are integral to promote entrepreneurship among the
people who reside at the both ends of the spectrum;
those who have the capital but not the ideas, and those
who have the ideas but not the capital. With youth
constituting the majority of the former, it is a much
needed service for creating a generation of entrepre-
neurs who have the ability to start and grow their
enterprises with protection and support from those
who have the know-how and the money. Other gov-
ernment support systems could be mentorship pro-
grams from senior/retired citizens and experienced
entrepreneurs, who transfer their years of experience
to the young businessmen, thus saving the money and
time that others have to carry due to practicing their
businesses by trial-and-error.
Another challenge posed to entrepreneurs is the
ability to hire and retain high caliber employees. As
expressed by the majority of entrepreneurs inter-
viewed by the Agency for Development and Advance-
ment, the turnover rate of employees is significantly
high, because of the inability of SMEs to provide
attractive packages with medical and social insurance
to their employees, and the tendency of young gradu-
ates — who constitute the majority of the SME labor
force — to shift to multinationals after they acquire
the necessary experience from the SMEs. Govern-
ment can have some influence on the former weak-
ness, through providing low-priced/subsidized medi-
cal and social insurance packages for SME employees.
Last but not least, the role of the decision makers
to devise policies should be based on comparatively
studying the best practices of other countries. Many
rising or strong economies have depended on SMEs
as the driving force of their markets, achieving high
success rates in Asia, Europe, and the Americas. One
example is the successful model of Italy, the 7th big-
gest economy in the world, where SMEs constitute
more than 98% of its economy.
The Legal Framework
Laws in Egypt have to spare the entrepreneurs going
through legal risks, which they could suffer as a result
of not being able to pay loans or improper cash flow
management. Lawmakers, therefore, should enact
a package of laws that give protection for entrepre-
neurs if their businesses fail, if they go bankrupt, etc.
in addition to providing guarantees for loan-givers,
whether they are banks, investors’ funds, or even
individual investors to protect them from bad debts.
Also, the lawmaking body can encourage the private
sector to finance start-ups through structural changes
in the legal instruments pertaining to corporate social
responsibility. This can be achieved through more
tax exemptions directed towards angel investment or
zero-interest loaning to the SMEs sector on the part of
the large enterprises’ CSR programs and departments.
The Role of Civil Society
There are existing civil society models in Egypt now
that are working hard to support individual entre-
preneurs, their enterprises, and even to create a cul-
ture of entrepreneurship. For example, a foundation
called Endeavor Egypt — a branch of Endeavor Inter-
national — focuses on supporting high impact entre-
preneurs, defined as those entrepreneurs who have
the biggest ideas and most ambitious plans. And they
have the power to inspire countless others. Another
model is the NGO Nahdet El Mahrousa (Renaisance
of Beloved Country) which has an incubator for inno-
vative social enterprises. This acts as a hub for social
entrepreneurs who devise a program catering for a
social need/gap, yet in a self-sustainable (i.e. revenue
generating) manner. Developing social ventures/
enterprises is also evident through another NGO that
has a pioneering experience. Alashanek Ya Balady
(For You My Country) has started social ventures that
create revenues for the operations and development
projects of the NGO.
Egypt Human Development Report 2010{ 230 }
Social enterprises and ventures are organizations
whose core function is a type of social impact. For
example, social enterprises could be built solely to
employ more people, not to generate revenues. Fur-
thermore, and in addition to internships and job
shadowing, CSOs can provide experiential learning
programs for youngsters to initiate business start-ups
at a younger age. In addition, training and mentor-
ship programs for entrepreneurs, entrepreneurship
services centers and apprenticeship (whether tradi-
tional or professional) services can be additional pro-
grams with remarkable effects from the CSOs. Last
but not least, CSO should develop the mechanisms of
their microfinance programs to entail the transfer of
the know-how of the micro-business to the borrower
as an added-value.
Social and Cultural Characteristics
The mindset of young Egyptians favors working for
already established corporations, and looking for
a stable source of income. This culture cripples the
progress and innovation provided by entrepreneur-
ship, which requires risk-taking as a prerequisite
for positive change. Those social and cultural char-
acteristics can change through promotional efforts
by the government and private media. On another
level, education and training could play a major role
in gearing the mentality of young Egyptians towards
entrepreneurship as a viable and rewarding career
option.
With every new business created there are more
employment opportunities, more sales volumes for
other businesses, more investment opportunities,
and arguably, more linkages with other sectors of
the economy. It has been reported that the return
on investment to government of every $1 invested in
SMEs is $25, in the form of taxes, increased sales and
job creation, among other benefits. These claims are
based on statistics provided by the Small Business
Administration in the United States. This multiple
return should provide the incentive for government,
the private sector and civil society to promote entre-
preneurship as a dynamic tool for economic develop-
ment in Egypt.
abeer: faMiLy forMationEgypt has promulgated many laws related to forming
families, starting with the Personal Status Law and
the Family Court and Child Laws.
In June 2008 Egypt’s People’s Assembly approved
a law raising the minimum marriage age to over 18
years. It included obliging couples to undergo medi-
cal checkups prior to marriage as a condition to reg-
ister marriage contracts. The new law has caused
problems, the most prominent of which is the spread
of urfi marriage due to the high cost legal marriages
incur. Bribes are widespread to avoid medical exams,
and certificates are forged to conclude marriage con-
tracts. This is a problem that must be addressed in the
immediate future.
Most personal status problems in Egypt are restricted
to women’s desire to get a divorce. Law 10/2004
established Family Courts with the aim of peacefully
settling disputes, if possible, before referring them to
court. However, when human relations experience
conflicts, there is a need for integrated bodies con-
cerned with the successful enforcement of the law.
For example, Law 10/2004 requires that the parties
to the conflict resort to the Family Conflict Resolu-
tion Bureau.
This prolongs conflicts, when some cases need to be
quickly settled, including, for example, cases of ali-
mony. Investigating a husband’s income until the
adjudication of the claim will affect the alimony claim-
ant who, in most cases, is the weaker party in need of
financial support. Egyptian lawmakers are expected
to address such procedures and others by rendering
Family Court decisions final, thus ending all marital
disputes and consequent rights, but in reality this is
not the case and procedures can take as long as 15
years to resolve a case.
The Khula’ procedure facilitates divorce for women
as it reduces litigation and protects them from the
intransigence of husbands. However, this right is only
valid when the wife files a lawsuit asking for Khula’,
giving up all her legitimate rights, as well as returning
the dowry the husband had given her. This may be a
successful alternative to resorting to the Family Court
Egypt Human Development Report 2010 { 231 }
as it reduces the duration of the family dispute, but it
is affordable only to the better off. More women need
to accept the divorce clause they are entitled to in the
standard marriage contract, rather than decline this
option as a result of social pressure.
According to the Census Bureau (2008) 34.5% of
divorces fell in the first year of marriage, 40% occurred
in couples under thirty, and the highest divorce rates
were at the ages of 20 to 30 years. Figures of the Jus-
tice Department match these alarming statistics that
indicate that a significant proportion of divorces take
place among young couples. One of the main reasons
for early divorce is the increasing liabilities and costs
of marriage, rendering the young husband tangled
in a mesh of debt premiums and mortgages. There is
also the possibility that the young wife would choose
not to participate in family expenses claiming it is the
man’s responsibility according to tradition.
The media can also play a negative role; couples
appear unrealistic in TV dramas, making marriage a
rosy fantasy, where a handsome young man leading
a stylish life lavishes his wife with gifts. The wife is
featured as beautiful, attractive, always wanting to be
pampered, knowing nothing about childbirth, breast-
feeding, bringing up children or house-care skills. The
young wife, in short, is a creature for pleasure and lust.
Many working mothers are compelled to take on the
responsibility of the house and children regardless of
the fact that they exert the same effort as the father.
Society lacks awareness of the necessity of equality
between men and women, not only in political rights
and democratic practices, but in family duties and
social rights as well. This short-sighted vision leads to
an unbalanced relationship.
nerMine: the centraLity of sexuaLity
Islam is among the most explicit religious texts
that recognize sexuality as an intrinsic part of being
human. The Quran uses beautiful lyrics to describe
the joys of paradise, granted to men and woman
equally. Islamic tradition acknowledges the right of
both man and woman to pleasure, and it commands
in many instances that both the wife and the husband
be aware of each other’s urges and needs. Islam rec-
ognizes the interdependent nature of the soul and the
body: A person who is aware of his/her body’s capac-
ity and drives is more likely to respond effectively to
his/her needs and lead a healthy mental and physical
life, pursue a righteous path and contribute positively
to society.
Sexuality can be described as emotional and physical
well-being. All human beings are sexual whether or
not they engage in sexual acts or behaviors. Our sexu-
ality is expressed through an extensive web of social
roles, behaviors, relationships, thoughts and feel-
ings. The expressions of sexuality are further influ-
enced by various factors including social, economic,
spiritual, cultural, and moral concerns. For most of
young Egyptians, sexuality is an issue layered with
several unanswered questions, little and sometimes
inaccurate information, mixed expectations, and feel-
ings ranging from fear, shame and guilt to pleasure.
What is mostly needed in guaranteeing that sexuality
is expressed positively, through consensual, mutually
respectful and protected relationships that enhance
well-being, health and the quality of life.
In Egypt, however, societal attitude and cultural
practices impede adolescents from tackling the issue
overtly and does not allow them access to unbi-
ased information. The emerging conservative wing,
which is increasingly spreading throughout Egypt
and influencing youth, makes the issue of sexuality
a conflicting topic to religion putting more liability
over the adolescent, particularly the girl. Societal atti-
tudes over adolescent sexuality range from extreme
practices like imposing on young girls to wear the
headscarf at a very young age, preventing them from
playing sports, or undergoing genital mutilation
operation. Society has instituted a code of conduct
that impede adolescents from learning about their
bodies and being safe expressing their sexual needs
and urges, particularly those which come with the
puberty cycle, the shapes and functions of genitals,
how to engage in concessional relationships and to
gain clarity about one’s values and respect of others’
values. The absence of parents, school teachers and
religious figures responding directly and effectively
to adolescents’ sexual concerns has led to the existing

Egypt Human Development Report 2010{ 232 }
sexual frustration and ignorance that we are witness-
ing among Egyptian youth.
In Egypt, the transition to adulthood comes with mar-
riage and parenthood, but it would be blind to believe
that sexuality begins in the confinement of marriage
or is the privilege of adulthood. Childhood and ado-
lescence are stages where the self, the body, and iden-
tity are constantly positioned and re-positioned. The
religious discourse in Egypt over sexuality is still con-
fined to the parameters of adulthood and married life,
and does not tackle the needs and concerns of youth
of both genders.
Further, censorship and prohibition do not resolve
the problem. On the contrary, it increases frustra-
tion and perplexity over what should be tackled as a
basic human right. Only recently Egyptian sexologists
have openly spoken over Egyptian cable television on
issues of sexuality for married couples, but still the use
of the term ‘sexuality’ in Egypt is uncommon and the
concept is shaded with skepticism and misinterpreta-
tion. This unfortunate taboo has direct repercussions
over young people’s physical and mental health and
keeps them trapped within the stereotypes of vulner-
ability, recklessness and danger. What is needed is
a discourse that addresses the needs of both women
and men for sexuality and recognizes that informa-
tion and services on sexuality evolve and move with
the times and apply throughout the life cycle.
The existing cultural and institutional framework,
within the family, in the school, in state institutions
and among peers, does not give the adolescent or
the young adult the entitlement to the appropriate
space to learn, share and access accurate and unbi-
ased information. Further, youth in Egypt who are
poor and inadequately educated often bear the physi-
cal and physiological strain of adulthood before they
are fully equipped to deal with their sexuality, and
are often subject to sexual violence, exploitation and
abuse, which diminish their dignity and self worth,
and may cause long-term harm.
There is a pressing need to rethink youth sexuality
in Egypt from a rights based approach and extend
beyond religious conservatism and social norms that
repress youth well-being. The formulation of effec-
tive programs and services that are susceptible to cul-
tural and religious sensitivities is needed. Programs
that can be translated into non-judgmental services
that encourage youth and adolescents from both gen-
ders to discuss their concerns in safe environments
such as schools, health care clinics, and through for-
mal and informal channels (family, school, youth
centers, clubs, the internet, associations, religious
organizations) are also essential.
For parents to be able to provide accurate advice to
their kids and protect them from all forms of abuse
or subjection to any form of exploitation, they them-
selves need to be well informed and readily open to
discuss sexually related matters safely and without
shame or fear. Creating an enabling environment is
what we need, providing educational and pedagogical
programs on reproductive health issues, disease pre-
vention models, and so forth. Further, bringing the
religious discourse closer to the needs and demands
of youth will ensure that sexuality does not oppose
religion or faith. These programs should be designed
on evidence, provide ‘value-free’ information and
rely on core values based on informed choice and
decision making.
saLMa: youth as vehicLes of sociaL change
We are young only for a short time. For many, the
issues faced while young will fade with adulthood,
and perspectives and priorities will change. However,
youth does involve a transition toward greater social
responsibility. As we venture into adulthood, the
opinions, attitudes, and beliefs of new generations
will affect visions of the future, how communities
organize, and how institutions operate.
As youth then, we occupy a paradoxical position.
Opportunity stretches in front of us; change is always
a possibility. We have the energy and time to pursue
dreams and hopes, yet our eagerness and passion
are at times blocked by older generations. It is not
uncommon for us to be perceived as troublemakers
and potential sources of disruption, rather than pro-
ductive and constructive social actors. Nevertheless,
the past several decades have seen an opposing view:

Egypt Human Development Report 2010 { 233 }
Youth’s combination of vision, determination and
vigor has led, in many parts of the world, to effective
initiatives, campaigns and movements through which
we young people have voiced our ideals and changed
the course of our societies.
There are a wide range of definitions as to what con-
stitutes participation. For example, the Save the Chil-
dren ‘re-action toolkit’ defines participation as “peo-
ple sharing ideas, thinking for themselves, express-
ing their views effectively, planning, prioritizing and
being involved in the decision-making process.” In
Egypt, however, it seems that youth do not partici-
pate because they believe that their engagement and
activism do not count, according to the 2004 UNDP/
NCCM Youth Aspirations Survey. This belief may
have been precipitated by a social understanding that
places us as passive recipients of goods and services
and which rewards passivity but gives no benefits for
innovation and activism. A lack of channels through
which dissent can be expressed or remedies provided
may also be a contributing factor.
However, experiences from abroad demonstrate that
given the right conditions and the proper incentives,
young people can and do contribute to their societies.
There is every hope that many more youth in today’s
Egypt will transfer their need for inclusion into actual
demonstrations of social competence, if given the
opportunity and the cultural space to do so. The onus
lies with their elders to provide the environment that
would enable them to transition to maturity as par-
ticipating members of a community.
Naturally, importing schemes based on the social and
economic peculiarities of other countries could sim-
ply be ineffective in Egypt and require much adapta-
tion to local circumstances. Nevertheless, the impulse
remains constant: Young people participating to help
each other in an enabling environment. As an ‘alter-
Box 16.4: The Operation of Turkey’s Youth Councils
Youth Councils in Turkey, and under the auspices of the local agenda LA21 program were envisaged to include the following:
•The representativesofassociationsand foundations,aswellascivil initiativesconductingactivitiesgeared toward the
youth in the target age group;
•RepresentativesofStudentCouncilsofUniversities;
•RepresentativesofStudentCouncilsofSecondarySchools;
•Representativesofyouthclubs,studentclubs,andstudentboardsinschools;
•Representativesof unorganized youth (representativesof theworking, unemployed, disabled, etc. youth identified via
working groups and/or from neighborhoods);
Common principles endorsed by all Youth Councils encompass the following: the opposition to all kinds of discrimination;
the protection and enhancement of the rights of the youth at local level within the framework of national and international
conventions; not being vertically involved with any political affiliation; targeting gender balance; being transparent and
collaborative; sharing of information on an unbiased, unconditional and equal manner; avoiding the utilization of activities
for personal profits; working on the basis of “voluntarism”; publicizing all activities; and consulting with the members and
ensuring their participation.
Furthermore, the multi-faceted functions of the Youth Council include increasing the participation of the youth in the planning,
decision-making and implementation processes, promoting the development of youth-related programs and facilitating their
realization, and contributing to the development of integrated youth policies at the national level and to the establishment
of a National Youth Council.
The Turkish experience was highlighted as a global “best practice” during the 2002 World Summit on Sustainable Development
in Johannesburg, and more than 21 countries from Europe and the CIS region traveled to Turkey to learn more about the
process and its benefits. It has emerged as a civil society movement that has demonstrated its potential to trigger social
transformation, accelerating the decentralization and democratization process in the country. Source: UNDP, Turkey Online

Egypt Human Development Report 2010{ 234 }
native’ community with credibility among their peers,
they are best equipped not only to make appropriate
choices, but also benefit in the outcome in terms of
responsibilities taken and successes achieved.
One example of effective participation by young
people comes from Turkey. In 1997, several cities
throughout Turkey joined the global network “Local
Agenda 21” (LA-21), aiming at establishing local
agendas for their own future.Public institutions, local
authorities and civil society organizations formed a
triangle of the local decision-making process. City
Councils aimed to provide equal opportunity for the
representation of all local stakeholders. The central
government and municipal representation consti-
tuted only one third of the councils, with the remain-
ing two-thirds consisting of representatives of foun-
dations and associations, professional chambers,
private sector organizations, trade unions, academic
institutions, and, most importantly, youth groups.
The establishment of Youth Councils was therefore
necessary in order to help young people get organized
and focus on the issues that directly concern them.
According to the Turkey HDR for 2008, 73 youth
councils and 35 youth centers have been established
under the LA-21 program. Through a series of projects
youth councils have manifested a remarkable progress
in promoting local governance, and have culminated
in the establishment of the LA-21 National Youth Par-
liament in 2004, which was adopted as the organi-
zational model for the nation-wide network of Youth
Councils established in LA-21 cities. Parliament has
also been working toward building the capacities of
local youth platforms, as well as contributing to the
development of national youth policies and a model
for the National Youth Council.
Youth Councils and participation In Egypt should not
be just a dream. In 2005, the National Youth Council
of Egypt (NYC) was established following a presiden-
tial decree, with the main objectives of building the
capacities of young people and promoting their active
involvement in public life. The NYC 2006-2010 work
plan primarily focuses on three aspects, which are:
• Political Empowerment Programs include an
annual youth conference with over 1000 young
outstanding participants, a number of lectures,
workshops and seminars, public awareness cam-
paigns, and a youth parliament model, among
others;
• Economic Empowerment Programs include
the “Youth Villages” project, SME funding in
partnership with Egypt’s Social Fund for Devel-
opment, and employment programs at youth
nationwide centers;
• Social Empowerment Programs mainly consist-
ing of youth service centers that facilitate the
provision of government services and the estab-
lishment of youth clubs and youth centers in all
governorates.
There are 4302 youth centers throughout Egypt, and
more, we are told, are being established. However,
although youth centers, under the supervision of the
National Youth Council in Egypt offer a wide range of
beneficial activities to young people, it can be argued
that they do not necessarily contribute to genuine
youth participation in decision-making, or promote
legitimate youth representation. This is probably due
to poor central and local management.
Nevertheless, the NYC and its 4302 youth centers do
provide the infrastructure for replicating a success-
ful Turkish experience in Egypt (see Box 16.2). The
governance, however, of these structures needs to
be radically altered. Young people have to be offered
the opportunity to be part of the NYC Board through
democratic elections by other young people. They
have to be given the space to represent the interests
of these youths and to be involved in the planning,
decision-making and implementation processes of all
youth-related programs.
Furthermore, the NYC can act as the coordinating
body for the numerous youth centers operating in all
governorates, which are to include representatives
of all youth groups residing in the respective city/
village, such as student councils, youth clubs, youth
associations, as well as random and marginalized
youth groups. By developing their own local agendas,
prioritizing their needs and proposing developmental
projects, these youth centers can effectively contrib-
ute to the promotion of local governance and decen-
tralization efforts in Egypt.

{ 235 }
Technical Notes and Sources of Data
a. huMan DeveLoPMent inDex (hDi)
T he National Human Development Report for 2010 presents a summary on the average achievements that have been realized for Egypt of three key human development dimensions:
Longevity, measured by life expectancy at birth. Education, measured by the weighted average of literacy rate (15+) (two-thirds) and combined basic, secondary and tertiary gross enrolment ratio (one-third). Standard of living, measured by GDP per capita in US$ according to the purchasing power parity ( US$ PPP).
1. 2.
3.
This flat
is perfect. But can
we afford the down-
payment?My parents
could help....

Egypt Human Development Report 2010{ 236 }
giving a weight of two-thirds to literacy rate (15+) and one third to the combined gross enrolment ratio as follows:
• Literacy index for the population of Port Said governorate
(15+) = (83.6-0) / (100 -0) = 0.836.
• Combined gross enrolment index = (70.1- 0) / (100- 0) =
0.701
• Education index = 2/3 (0.836) + 1/3 (0.701) = 0.791
3. Calculating GDP Per Capita IndexGDP per capita for Egypt is estimated from the National Income Accounts of 2006/2007. The estimated GDP per capita in local currency (LE) is transformed to its value in US$ using an appropriate exchange rate (taking into consideration the estimations of the Ministry of State for Economic Development .Then the real GDP per capita (ppp US$) is calculated by applying a suitable factor to the estimated GDP per capita in US$ (the factor used in the International Human Development Report for 2008). This resulted in a national GDP per capita index for Egypt of 0.727 in 2008.
For income per capita at the governorate level, the report has benefited from the latest Household Income, Expenditure and Consumption Survey (HIEC) conducted by CAPMAS in 2008/2009. In the HDI, income (GDP per capita) is a substitute for all other dimensions of human development that are not reflected in education or life expectancy at birth. Income per capita is adjusted because achieving a suitable level of development does not require a specific level of income. Therefore, the logarithm of the income (GDP per capita) is used as follows:
GDP per capita index for Port Said governorate = log (9590.6) – log (100) / log (40000) – log (100) = 0.762
4. Calculating HDI, using the results of the three indicesHDI is calculated as a simple average of the three indices. HDI for Port Said governorate = 1/3 (0.795+0.791 + 0.762) = 1/3 (2.348) = 0.783.
b. DeMograPhic asPectsThe main sources of demographic data are population censuses, vital statistics and special national surveys. CAPMAS is the official national agency responsible for carrying out and/ or publishing the results of some of these sources (such as the population censuses and the vital registration). CAPMAS is also a partner or consultant in carrying out other surveys and sources of data. Indicators derived from these sources reflect the population situation and its trends. Some of these indicators are used in other fields (e.g. health). In addition, population figures (total, or for specific categories or groups) are necessary for calculating many indicators in different fields. CAPMAS provided all data related to the demographic aspects for 2006 from the 2006 Population and Establishments Census.
The present report includes the following demographic indicators:
• Population counts (thousands);
• Population annual growth rate (%);
• Rural population as % of total;
• Urban population as % of total;
• Annual growth rate of urban population (%);
• Population of the largest city as % of total urban
Calculation of HDIBefore the calculation of HDI an index for each key dimension is calculated separately.To calculate the indices of these dimensions: (longevity, education and GDP per capita), maximum and minimum values (posted goals) of the indicators are determined internationally as follows:
Indicator Maximum Value Minimum ValueLife expectancy at birth 85 25Literacy (%) 100 0Combined gross enrolment ratio % 100 0 GDP per capita ($PPP) 40,000 100
The index for any component of HDI can be computed as follows:
• ( the actual value - the minimum value) / (the maximum
value - the minimum value)
• HDI is then calculated as the simple average of the three
indices.
The HDI value indicates the level of development. When the HDI value is below the value of one, this shows how far the country or the governorate is from the maximum achieved by any country. In this case, the development plan should explore the gaps that hinder the enhancement of the development level and set up the policies and programs to accelerate achievement of the goals, which are more inclusive and comprehensive than just increasing the income level.
The benefit of ranking the governorates in descending order is limited, as it does not indicate areas in which differences between governorates exist. Are the differences due to economic, health, environmental or educational factors? The differences might be related to all these factors, and perhaps what is more important is speeding up the development process.
CAPMAS has been the major source of data for calculating the HDI measures throughout the period since the first HDI was produced in 1994. IT must be noted however that the data produced by CAPMAS for this year’s HDR are those of the 2006 census and may therefore be more reliable but also show significant gaps with the inter-census period.
The following example of Port Said governorate may illustrate steps for calculating the human development index:
1. Calculating the Longevity IndexLife expectancy at birth in the governorates is estimated using the detailed data on mortality and population by age groups. Life expectancy at birth for Port Said governorate in 2007 is estimated at 72.7 years, therefore, the life expectancy index = ( 72.7 – 25)/ (85-25) = 0.795
2. Calculating the Education IndexThe education index measures the relative achievement of Port Said governorate in literacy rate (15+) and the combined gross enrolment ratio (basic, secondary and tertiary). The literacy index (15+) and the gross enrolment index are calculated separately and added together to form the education index,

Egypt Human Development Report 2010 { 237 }
population in the governorate;
• Demographic dependency rate (%);
• Net lifetime internal migration as % of total population;
• Population density per km2;
• Population doubling date at current growth rate;
• Crude birth rate (per 1000 population);
• Total fertility rate;
• Ratio of 1960 fertility to 2005;
• Contraceptive prevalence rate (%);
• Average age at first marriage;
• Crude death rate (per 1000 population);
• Infant mortality rate (per 1000 live births);
• Under five mortality rate (per 1000 live births);
• Under five mortality (thousands);
• Maternal mortality rate (per 100,000 live births);
• Life expectancy at birth.
The first ten indicators listed above are derived from the final data of the 2006 Population and Establishments Census, in addition to data included in the statistical Year Book 2008, except for population doubling date, which is calculated at the national level only. The latter indicator is calculated by the exponential function using the annual growth rate for the period 1996 – 2006.
Mortality measures and crude birth rates rely on data from the National Center for Health and Population Information (Ministry of Health for 2008). The average age at the first marriage relies on the data of the Demographic and Health Survey 2008 (DHS).
Life expectancies at birth for 1976 and 2007 at the national and different governorate levels are computed from the detailed data on population and deaths by age and gender. Motherhood and childhood mortality rates are available from data of the National Center for Health and Population Information (Ministry of Health) for 2008. Data on contraceptive prevalence rate are taken from the Demographic and Health Survey.
c. Labor force anD uneMPLoyMent (15+)Labor force and unemployment indicators in this report rely on CAPMAS data on labor force and its various distribution (by gender, age, economic activity, occupation, employment status, etc) for rural and urban areas of each governorate in 2007. This report includes the following labor force and unemployment indicators:• Labor force (15+) as % of total population;• % of females in the total labor force (15+);
• Labor force (15+) in agriculture, industry and services %;
• Wage earner (i.e. employees) as % of total labor force (15+);
• Employees in scientific and technical professions as % of
• labor force (15+);
• % of females in legislation and organization professions;
• % of females in scientific and technical professions;
• Employees in government, public sector and public business
sector as % of total labor force (15+);
• Unemployment rate % (total and female);
• Urban and rural unemployment rates (15+);
• Unemployment rate by education level (15+);
• Absolute numbers of unemployed (15+);
• Future labor force replacement ratio (%), i.e. population
under 15 years divided by one third of population (15 – 64).
D. eDucation anD LiteracyEducation and literacy indicators require three types of data:1. Standard educational data, i.e. number of students (enrolled
or graduate), teachers, classes, etc. The primary sources of this type of data are the annual bulletins of the Ministry of Education and Al- Azhar Education Administration. These data are disaggregated by gender for each governorate and for all pre-university levels. The Information Center of the Ministry of Education and Al- Azhar Education Administration provide these data at the governorate level for 2007/2008.
Data on university and tertiary education are published annually by the Information and Documentation Center at the Ministry of Higher Education for government, private and Al- Azhar universities and faculties and for government or private intermediate or high institutes.
The Supreme Council of Universities also publishes data on government university education at the university and faculty levels.
2. Literacy data (15+). This data is published through population censuses. CAPMAS provided data on the illiterate population in 2007.
3. Economic data required to derive indicators of public expenditure on education. The State budget, published annually by the Ministry of Finance, is the primary source of this data on expenditure on education. However, this data is not available at the governorate level.
Based on these different types of data, the report includes the following indicators on education and literacy:
• Apparent primary intake rate (%).
• Primary gross enrolment ratio (%);
• Preparatory gross enrolment ratio (%);
• Basic gross enrolment ratio (%);
• Secondary gross enrolment ratio (%);
• Combined basic and secondary gross enrolment ratio (%);
• Tertiary enrolment ratio (university and high institutes);
• Combined first, second and third level gross enrolment
ratio (%);
• Primary repeaters as % of primary enrolment;
• Preparatory repeaters as % of preparatory enrolment;
• Secondary repeaters as % of secondary enrolment;
• Transition to preparatory education as % of enrolment in
the final grade
• of primary education in the preceding year;
• Transition to secondary education as % of preparatory
completers;
• Primary students /teacher ratio( i.e. average number of
students per teacher);
• Preparatory students/teacher ratio;
• Class density(average number of students per class) at the
primary level;
• Class density at the preparatory level;
• Secondary technical enrolment as % of total secondary;
• Tertiary enrolment in science as % of total tertiary
enrolment;
• Public expenditure on education as % of total;
• Public expenditure on education as % of GDP;
• % of basic and secondary enrolment in government, private
and El-Azhar schools (%);
• % of unfit school buildings (total, completely unfit, badly
maintained);

Egypt Human Development Report 2010{ 238 }
• Literacy rate (15+) %;
• Secondary or university graduates as % of total population
(15+);
• Tertiary science graduates as % of total graduates;
• Numbers of illiterate (15+).
•
These indicators are calculated by gender at the national and governorate levels. Literacy rates for rural and urban areas are also derived. However, indicators of public expenditure on education and those for tertiary education are calculated at the national level only.
The following are notes pertain to indicators listed above:1. Because data on enrolment by age are not available,
especially for primary education, gross enrolment ratios are calculated for all educational levels.
2. The number of people in the age groups corresponding to different educational level is estimated by applying “Sprague Multipliers” to the number of population by age groups in 1960 and 1/1/2008. Estimation issued by CAPMAS are used.
3. Some of the enrolment and transition ratios exceed 100% due to the number of students above (or below) the age limits of the education level.
4. Enrolment in university and higher education by governorate is not available. The combined first, second and third level gross enrolment ratios for various governorates are derived after distributing total tertiary enrolment at the national level according to the relative shares of the governorates in pre-university (basic and secondary) enrolment.
e. nutrition anD fooD securityThe report includes the following nutrition and food security indicators:
• Daily calorie intake per capita;
• Shares in daily calorie intake per capita (vegetables, animal
products and fish) (%);
• Children ever breastfed (%);
• Underweight children below the age of five (%);
• Food production per capita index (1999 – 2001 = 100);
• Agricultural product as % of GDP;
• Cereal imports (1000 metric tons);
• Food exports as % of food imports;
• Food imports as % of merchandise exports;
• Food self- sufficiency ratio (%);
• Food import dependency ratio (%).
The first two indicators are based on the Food Balance Sheet (FBS) published by the Ministry of Agriculture and Land Reclamation. The next two indicators on children are taken from the Demographic and Health Survey for 2008 at the national, rural and urban levels as a whole and according to governorates groups (urban – Lower Egypt – Upper Egypt and frontiers governorates). The data are derived at the governorates level.
Food production per capita index is taken from the web site of the Food and Agriculture Organization (FAO).
The agricultural product as % of GDP is derived from the web site of the Ministry of State for Economic Development. Data on cereal imports, food imports and food and merchandize exports are taken from the Ministry of Agriculture and Land Reclamation (Study on Foreign Trade Indicators of Major Crops and Food Products, 2007).
As for food self- sufficiency, the quantity of consumption of food commodities is taken from the Agricultural Income Bulletin issued by the Ministry of Agriculture and Land Reclamation in 2007 and the domestic prices are derived from the same bulletin. Data on quantities and prices of exports and imports are taken from the Bulletin of Statistics of Foreign Trade of Major Crops and Agricultural Commodities issued by the Ministry of Agriculture and Land Reclamation in 2007.The food self- sufficiency ratio is computed by estimating the values of both the domestic production and consumption of food commodities according to the Free on Board (FOB) prices of export commodities, the Cost Insurance Freight (CIF) of food imports and the domestic prices of the non-tradable commodities
The overall food self – sufficiency ratio and the corresponding ratios of the commodity groups are derived by dividing the value of the local food production by the value of food consumption. The food import dependency ratio was computed by dividing the value of food imports by the value of food consumption.
f. heaLth anD utiLitiesIn addition to health – related indicators covered in other sections, this report includes the following indicators on health and public utilities:
• Children dying before age of five (thousands);
• Malnourished children under age of five (thousands);
• Maternal mortality rate per 100,000 live births;
• Pregnant women with prenatal care (%);
• Infant mortality rate per 1000 live births;
• Under five mortality rate per 1000 live births;
• Children ever breastfed (%);
• Births attended by health personnel (%);
• Children (12-23 months) fully immunized (%);
• Underweight below age of five (%);
• Doctors (MOH) per 10,000 people;
• Nurses (MOH) per 10,000 people;
• Nurses / doctors ratio (MOH);
• Beds per 10,000 people (total and MOH);
• Health units with beds per 10,000 people;
• Contraceptive prevalence rate (%);
• Crude birth rate (per 1000 population);
• Crude death rate (per 1000 population);
• Public expenditure on health as % of total;
• Public expenditure on health as % of GDP;
• Population or households with access to piped water (%);
• Population or households with access to sanitation (%);
The Demographic and Health Survey for 2008 provided the indicators 2, 4, 7, 8, 9, 10, 16 at the national, urban and rural levels as a whole and for main groups of governorates. Data are derived for each governorate separately.
The National Center for Health and Population Information provided indicators 1,3,5,6,11,15,17,18 at the national level as whole, for the main groups of governorates and for each governorate separately.
Data for public expenditure on health indicators relied on the Statistical Year Book for 2008. GDP data are taken from the National Income Accounts provided by the Ministry of State for Economic Development.The following notes pertain to the indicators listed above:1. Children (12 – 23) months fully immunized are those who

Egypt Human Development Report 2010 { 239 }
receive DCG, Measles, German Measles, the Parotid Gland , three dozes of DPT and Polio vaccine.
2. The contraceptive prevalence indicator (%) is taken from data of the Demographic and Health Survey for 2008. Rates for the five frontier governorates are not included because the sample of the households in these governorates is small, so a separate estimation of contraceptive prevalence rates could not be calculated.
3. Indicator of underweight children below five (%) is the ratio of children under five years who are classified as underweight, according to weight/age measure provided by the Demographic and Health Survey for 2008.The indicator is expressed in the standard deviation units (-2) from the median of the WHO Child Growth Standards reference population adopted in 2006.Thus, the indicator is not comparable to that based on the previously used by the USA National Center for Health Statistics( NCHS) / Center of Disease Control (CDC) / WHO.
4. Percentage of pregnant women who received pre-natal care is the percentage of all births whose mothers received, during pregnancy, any medical care (pregnancy care, pregnancy related care, or a tetanus injection).
5. The indicators of the public expenditure on health rely on the State budget data issued annually by the Ministry of Finance, in addition to GDP data taken from the National Income Accounts provided by the Ministry of State for Economic development.
These indicators are computed by gender at the national and governorates levels. However, the indicators of public expenditure on health are computed at the national level only.
6. Data on total health personnel are not accurate because there is no effective system for updating their number, taking into consideration factors such as migration, retirement, on-leave periods and duplication in the statistics of these personnel in private or government institutions. The relevant indicators in this report include only health personnel in the Ministry of Health. Therefore, they do not accurately reflect the regional disparities in this respect.
7. It should be noted that health personnel attending births include doctors, nurses and trained midwives. The traditional birth attendants (dayas) play an important role, especially in rural areas. This is reflected in the high rate of births attended by health personnel at the national and governorate levels.
8. The indicator of the households with access to sanitation reflects the percentage of population that use a proper sanitation system such as a connection to a sink, under ground sanitation tank, a toilet linked to public network, a simple pit latrine or an improved pit latrine. According to the concept of health science, any private or joint (but not public) disposal system is considered healthy if it separates human excreta from contact with people, in spite of the reservations connected with this concept.
g. naturaL resources anD energy consuMPtion:
The report includes the following indicators on natural resources and energy consumption.
• Land area (thousand km2);
• Cultivated area (thousand feddans):
• As %of total land area;
• Persons per feddan.
• Irrigated land as % of arable land area;
• Crop area in thousand feddans;
• Crop area as % of cultivated land;
• Total water resources ( billion m3) ;
• Water consumption as % of total water resources;
• Internal renewable water as % of total water resources;
• Per capita internal renewable water (m3 /year);
• % of water withdrawal for:
• Agriculture;
• Localities;
• Industry;
• Navigation
• Total fish catch( thousand tons);
• % of fish catch from:
• Fresh water (Nile , its branches and Naser Lake);
• Marine( Mediterranean , Red Sea );
• Lakes;
• Fish farming;
• Total electricity consumption (billions of k.w.h);
• Electricity consumption per capita (k.w.h);
• Total consumption of primary energy (million tons of oil
equivalent);
• Consumption of primary energy per capita (kg of oil
equivalent);
• % of primary energy consumption from:
• Crude oil;
• Natural gas;
• Hydro-power;
• Coal.
• Primary energy consumption ( in kg of oil equivalent per
L.E 1000 of GDP);
• Net primary energy imports (% of energy consumption);
• Total final energy consumption (million tons of oil
equivalent);
• % of final energy consumption from:
• Oil products;
• Gas;
• Electricity;
• % of final energy consumption by:
• Industry;
• Transportation and communications;
• Agriculture;
• Households and commercial;
• Others.
Data on land area at governorate level is available from CAPMAS. Data on arable and crop areas at governorate level are taken from publications of the Ministry of Agriculture and Land Reclamation concerning agricultural statistics.
Indicators of water resources, consumption and withdrawals pattern are derived from data of Planning Sector at the Ministry of Water Resources and Irrigation. Fish catch indicators are calculated from the Fish Production Statistics for 2007, issued by the General Authority for Development of Fish Resources.
Indicators on energy consumption for 2007 /2008 are derived from: data of Ministry of State for Economic Development, the 2007/2008 Follow Up Report of the Economic and Social Development Plan; Report of the Work Results of the Petroleum Affairs Sector at the Ministry of Petroleum in 2007/2008, unpublished , July 2008 and the unpublished data of the Egyptian General Petroleum Authority. It is worth nothing that the final energy consumption is calculated by
Egypt Human Development Report 2010{ 240 }
excluding the quantity of energy sources consumed as inputs for producing another source of energy (e.g. the use of natural gas or oil products in the production of energy). Net import of primary energy is computed by subtracting exports from imports. This includes foreign partner’s exports of oil and natural gas and the pay back of the surplus of the crude oil. Imports do not include crude oil and natural gas purchased by Egypt in foreign currency from the foreign partner’s share.
h. coMMunicationsThe communications profile is presented by a number of indicators. The major sources of data required for deriving these indicators are population census and the annual bulletins issued by CAPMAS in cooperation with the concerned ministries, authorities and institutions.
The report includes the following communications indicators:• Households with television (%);
• Households radio cassette (%);
• Telephones per 1000 households;
• Number of cell phones subscribers annually per 1000
people;
• Number of internet subscribers annually per 1000 people;
The first two indicators are taken from the Egypt Demographic and Health Survey for 2008.
The other indicators are derived from the data of the Population and Establishments Census provided by CAPMAS.
i. econoMic asPects The report includes the following economic indicators:
• Real GDP per capita in LE and at market prices (2001/2002
prices) at the national and governorate levels for
2007/2008;
• GDP per capita (US$ ppp ) as per estimations of Ministry of
State for Economic Development;
• Income share of poorest 40% of population (total and
rural);
• Ratio of riches 20% to poorest 40%;
• Gini coefficient (total and rural);
• Total poor persons as% of total population;
• Ultra poor persons as% of total population;
• Total poor and ultra poor (thousands);
• Wages of poor households as % of their incomes;
• Wages of poor households as % of total wages;
• % of total pubic expenditure on social security;
• % of total pubic expenditure on defense, security and justice
(in addition to % of total public expenditure on education
and health referred to earlier);
• Pubic expenditure on social security as % of GDP;
• Pubic expenditure on defense, security and justice as %
0f GDP (in addition to % of total public expenditure on
education and health as % 0f GDP referred to earlier);
• GDP at current market prices (LE billion);
• Agricultural product as % of GDP at factor cost;
• Industrial product as % of GDP at factor cost;
• Services as % of GDP at factor cost;
• Household consumption as % of GDP;
• Government consumption as % of GDP at market prices;• Gross domestic investment as % of GDP at market prices;• Gross domestic saving as % of GDP at market prices;• Tax revenues as % of GDP at market prices;• Exports as % of GDP at market prices;
• Imports as % of GDP at market prices;
• Civil external debt as% of GDP at market prices;
• Civil external debt service ratio ( as % of exports);
• Workers` remittances from abroad (US $ million);
• Export/ import ratio (merchandise only);
• Trade dependency (merchandise exports + merchandise
imports) as % of GDP;
• Current account balance (LE billion);
• Net international reserves .( US$ billion);
• Months of merchandise imports coverage;
• GDP at constant factor cost (US $ billion);
• Average annual growth rate of real GDP (%), during the
period1998/1999 - 2007/2008) at 1981/1982 prices;
• Average annual growth rate of GDP per capita (%) at
market prices during the period (1998/1999 – 2007/2008)
at 1981/1982 prices;
• Consumer price index (January 2007= 100);
• Producer price index (2004/2005= 100);
• Average annual growth rate of exports (merchandise and
services) during the period (1998/1999-2007/2008);
• Average annual growth rate of tax revenues during the
period (1998/1999 -2007/2008);
• Direct taxes as % of total taxes ;
• Overall budget surplus (deficit ) as % of GDP at market
prices ;•
GDP per capita in( LE and US$ PPP) at the national and governorate levels are derived from national income accounts , provided by the Ministry of State for Economic Development and from the results of the Income, Expenditure and Consumption Survey conducted by CAPMAS in 2008/2009 as shown earlier in section (A-3)
Physical poverty is known as the material inability of securing a decent living standard (that provides basic needs), based on which individuals status is defined as poor or non-poor. The poverty line is used to differentiate between these two categories. The most common method in this regard is the basic needs approach which is used in this report. Poverty line – via this approach – is determined by the cost of the goods and services basket that represents the basic needs. This cost comprises the cost of the basic food needs, known as the food poverty line. If non-food basic needs costs are added, we determine what is known as the absolute poverty line and the used poverty line. The used poverty line takes into consideration the disparities in prices of goods and services between various regions. It also reflects differences in “basic needs” of different family members: children versus adults and males versus females. In addition it takes account of “economics of scale” within the household – such as non-food items that can be shared among all family members, (i.e. electricity or rent value which are considered “as non-competitive items” within each household – because any member uses these items does not reduce the consumption of the other members). For that reason, living in large households can reduce the mean per capita expenditure to maintain a certain standard of living. The basic needs method is used to assess the household and regional poverty lines. The food poverty line varies between households and regions. Therefore, poverty lines reflect the disparities in prices of food and non-food commodities between different regions. They also reflect household’s size, age and gender structures and their food and non-food expenditure patterns. The poor person (or household) is defined as that whose expenditure (or

Egypt Human Development Report 2010 { 241 }
income) is below the poverty line).
The results of Income, Expenditure and Consumption Survey conducted by Capmas in 2008/2009 is used in calculating the poverty line and other poverty indicators. This methodology can be summarized as follows:The basic step upon defining the food poverty line is to choose the food basket that meets the basic food needs agreed upon. It should be noted that each household has a minimum level of caloric needs, depending on its age and gender structure.
Based on individuals’ height, weight, age and gender, we can identify what is known as Basel Metabolic Rate (BMR). Therefore, caloric needs of each age and gender category can be determined. Caloric needs set by WHO states that males in urban areas need 1.78 fold the mean metabolic rate, while females need 1.64 fold. The corresponding figure in rural areas is 2.1 for males and 1.82 for females. Accordingly, we can identify the individuals’ or household’s caloric needs based on his place of residence and on the age and gender of the family members. It is worthy noting that this has been applied upon calculating poverty lines in some Arab countries
The cost of obtaining the minimum level of calories is estimated by using the current prices in each region in Egypt . The cost of obtaining 1000 calories per day in different regions ranges between LE 1.935 in big cities and LE 1.77 in Upper Egypt rural areas.
The non-food expenditure for the households, who can hardly meet their food needs but choose to displace them to obtain the essential non-food needs , is estimated . Average non-food expenditure for these households is added to the poverty line which is based on food basket to obtain the poverty line that takes into consideration differences in location, age, gender and economies of scale of the households. Therefore, the minimum poverty line is specified at LE 2223, at the level of all geographical regions, and the food poverty lines at LE 1648. Poverty lines for each region is specified separately . Indicators of public expenditure on various sectors are calculated from the financial report of the Plan and Budget Committee, at the People’s Assembly, on the Final Accountof the State budget for 2007/2008.
The Ministry of State for Economic Development provided the data required for deriving national income accounts. These data are regularly included in the successive Follow- Up reports and on the Ministry web site : www.mop.gov.eg.Indicators of GDP (growth rates and GDP per capita growth rates) as well as growth rates of exports and international reserves are calculated from data provided by the Ministry of State for Economic Development included in the successive Follow Up reports and in the Basic Data Series : Output, Investment, Employment and wages, during the period 1981/82-2006-2007. The data on consumer price index and producer price index, (as indicators of inflation) are taken from the monthly bulletin issued by CAPMAS.
Finally, indicators of taxes and the State budget surplus/ deficit are calculated from data of the financial report of the Plan and Budget Committee, at the People’s Assembly, on the Final Account of the State budget for 2007/2008 . The average annual growth rate of tax revenues is calculated from data included in the annual reports of the Plan and Budget Committee, at the People’s assembly, on the draft State budgets and the Final Accounts for many fiscal years.
The data on external debts, international reserves, workers’ remittances and some data on exports, imports and, US$ exchange rate versus the Egyptian pound are obtained from the Central Bank of Egypt’s reports available on its web site : www.cbe.org.eg
j ParticiPation Observing that indicators can reflect some aspect of
participation, the report focuses on calculating the following indicators.
1. Employees in scientific and technical profession as % of total employees (+15).
2. Ratio of gross enrolment in private education.3. Government, public sector and public business sector
employees as (%) of labor force.4. Participation in economic activities through:
A.Workers in crafts occupations as (%) of labor force (+15). B.Workers in the informal sector as % of labor force (+15).

Egypt Human Development Report 2010{ 242 }
{ 243 }
National Indicators
n.1 huMan DeveLoPMent inDex
Life Expectancy at birth (years
Adult Literacy rate (%) (15+)
Combined 1st. 2nd & 3rd-level gross enrolment ratio
Real GDP per Capita (ppp) $
Life Expectancy Index
Education Index
GDP Index
Human Development Index
2007
2007
2007/2008
2007/2008
2007
2007/2008
2007/2008
2007/2008
71.7
70.4
66.0
7787.0
0.778
0.689
0.727
0.731
Egypt Human Development Report 2010{ 244 }
n.2 ProfiLe of huMan DeveLoPMent
Life Expectancy at birth (years)
Households with access to: Piped Water (%) Total
Rural
sanitation (%) Total
RuraL
Daily Calorie Supply per Capita
Adult Literacy rate (15+) (%)
Combined Basic and Secondary enrolment ratio
Daily newspaper circulation per 1000 households)
Households with television (%)
GDP per capita ( LE)
n.3 ProfiLe of huMan DePrevation
Populations without acccess to: Piped Water
sanitation
Children dying before age five
Malnourished children under five
Children not in basic or secondary school
Illiterates (15 +)
Unemployed Persons (15+) Total
Female
Poor persons Total
Ultra
n.4 trenDs in huMan DeveLoPMent
Life Expectancy At birth (years)
Infant mortality rate ( per 1000 live births)
Households with acess to piped water (%)
Daily calorie supply per capita
Literacy + (15 %)
Combined basic and secondary enrolment ratio
2007
2008
2008
2008
2008
2007
2007
2007/2008
2007
2008
2007/2008
2008
2008
2008
2008
2007/2008
2007
2007
2007
2008/2009
2008/2009
71.7
98
96.7
56.5
37
4126
70.4
77.6
36.7
94.7
10246.1
thousands
341.3
6964.3
44.2
435.1
4706.80
17023.5
2135
1057
16191.0
4543.4
1976
2007
2008
2004
2008
2004
2007
2007
2007/08
55.0
71.7
18.0
91.3
98
4192
4126
70.4
77.6
Egypt Human Development Report 2010 { 245 }
n.5 huMan caPitaL forMation
Literacy (15+)(%)
Basic and secondary enrolment ratio (%)*
Professionals and technicians (% of labor force )
Population (15+) with secondary or higher education
Tertiary graduate ratio (% of corresponding age)
Science graduates (% of total graduates)
include El Azhar *
n.6 status of woMen
Life Expectancy At birth (years)
Maternal Mortality Rate (per 100000 live births)
Average age at first marriage*
Gross Enrolment Ratio Basic education
Primary
Preparatory
Secondary education
Tertiary education
Tertiary Science Enrolment (%)
Females with Secondary or Higher Education (15+) (%)
Professional & Technical staff (%)
Women in the Labor Force (%)
2007
2007/08
2008
2008
2007/08
2007/08
Total
70.4
77.6
20.5
37.9
6.3
31.6
2007
2008
2008
2007/08
2007/08
2007/08
2007/08
2007/08
2007/08
2007
2007
2007
Female
72.7
87.1
31.0
33.5
6.5
29.5
74.0
55.0
20.6
92.99
104.75
89.62
66.78
29.57
8.09
33.6
32.3
23.9
n.7 feMaLe - MaLe gaPs
Life Expectancy At birth (years)
Population
literacy (15+) (%)
Primary Enolment
Preparatory Enrolment
Secondary Enrolment
Tertiary Enrolment & Posgraduate
Labor Force
2007
2008
2008
2007/2008
2007/2008
2007/2008
2007/2008
2007
106.5
95.6
80.7
98.9
100.9
97.40
69.80
31.3
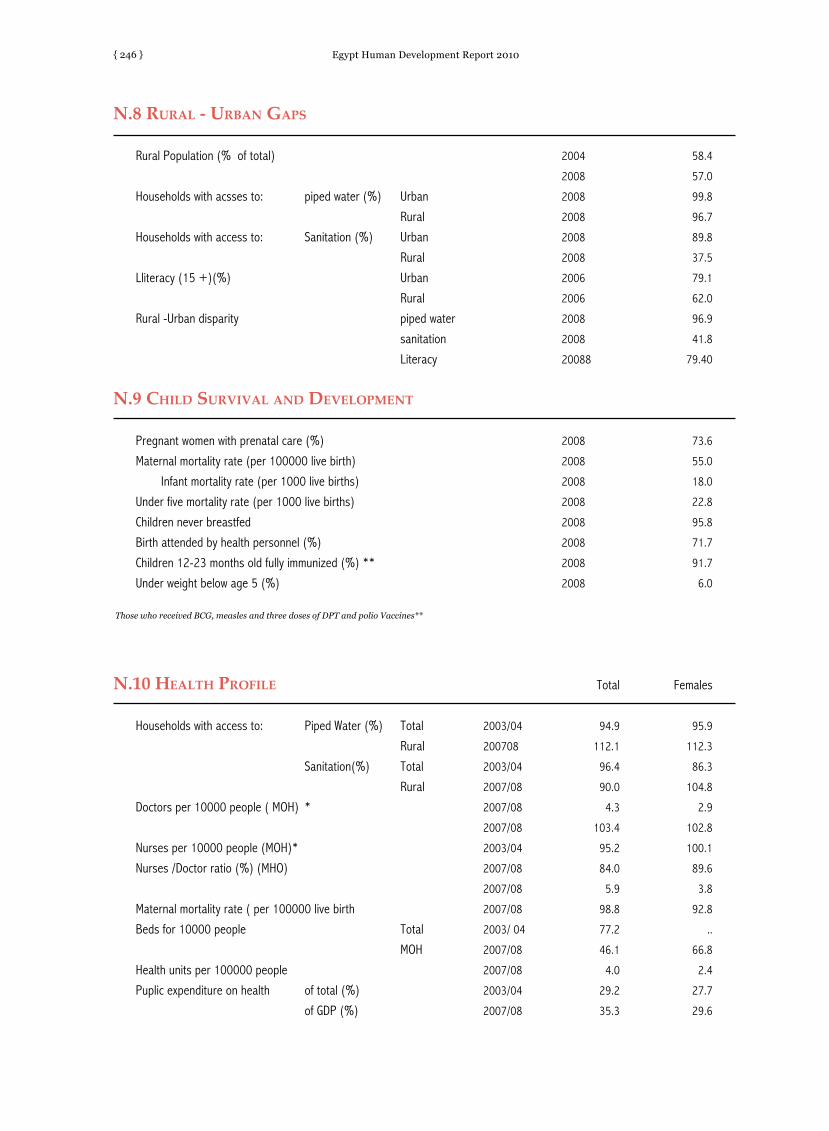
Egypt Human Development Report 2010{ 246 }
n.8 ruraL - urban gaPs
Rural Population (% of total)
Households with acsses to: piped water (%) Urban
Rural
Households with access to: Sanitation (%) Urban
Rural
Lliteracy (15 +)(%) Urban
Rural
Rural -Urban disparity piped water
sanitation
Literacy
n.9 chiLD survivaL anD DeveLoPMent
Pregnant women with prenatal care (%)
Maternal mortality rate (per 100000 live birth)
Infant mortality rate (per 1000 live births)
Under five mortality rate (per 1000 live births)
Children never breastfed
Birth attended by health personnel (%)
Children 12-23 months old fully immunized (%) **
Under weight below age 5 (%)
Those who received BCG, measles and three doses of DPT and polio Vaccines**
2004
2008
2008
2008
2008
2008
2006
2006
2008
2008
20088
2008
2008
2008
2008
2008
2008
2008
2008
58.4
57.0
99.8
96.7
89.8
37.5
79.1
62.0
96.9
41.8
79.40
73.6
55.0
18.0
22.8
95.8
71.7
91.7
6.0
n.10 heaLth ProfiLe
Households with access to: Piped Water (%) Total
Rural
Sanitation(%) Total
Rural
Doctors per 10000 people ( MOH) *
Nurses per 10000 people (MOH)*
Nurses /Doctor ratio (%) (MHO)
Maternal mortality rate ( per 100000 live birth
Beds for 10000 people Total
MOH
Health units per 100000 people
Puplic expenditure on health of total (%)
of GDP (%)
2003/04
200708
2003/04
2007/08
2007/08
2007/08
2003/04
2007/08
2007/08
2007/08
2003/ 04
2007/08
2007/08
2003/04
2007/08
Total
94.9
112.1
96.4
90.0
4.3
103.4
95.2
84.0
5.9
98.8
77.2
46.1
4.0
29.2
35.3
Females
95.9
112.3
86.3
104.8
2.9
102.8
100.1
89.6
3.8
92.8
..
66.8
2.4
27.7
29.6

Egypt Human Development Report 2010 { 247 }
n.11 eDucation fLow
Primary repeaters (% of primary enrolment)*
Gross Primary enrolment ratio
Primary repeaters (% of primary enrolment)*
Transition to completers **
Gross Preparatory enrolment ratio
Preparatory repeaters (% of preparatory enrolment)
Transition to completers
Gross Secondary enrolment ratio
Secondary repeaters (% of Secondary enrolment)
Tertiary enrolment ratio (%)
2003/04
200708
2003/04
2007/08
2007/08
2007/08
2003/ 04
2007/08
2007/08
2007/08
2003/ 04
2007/08
2007/08
2003/04
2007/08
94.9
112.1
96.4
90.0
4.3
103.4
95.2
84.0
5.9
98.8
77.2
46.1
4.0
29.2
35.3
Females
95.9
112.3
86.3
104.8
2.9
102.8
100.1
89.6
3.8
92.8
..
66.8
2.4
27.7
29.6
n.12 eDucation iMbaLances
Primary pupil/ teacher rate
Preparatory pupil/ teacher rate
Class density: Primary
Preparatory
Secondary technical enrollment (% of total Secondary )
Tertiary science (% of total Tertiary)
Puplic expenditure on education (% of total expenditure)
(% of GDP )
Puplic expenditure on pre-university education (% of all levels)
Puplic expenditure on higher education (% of all levels)
Basic and secondary enrolment( % )in: Government school
Private school
El azhar school
Unfit school buildings (%) Completely unfit
Maintance
(*) without El Azhar (**) The source of percentage of transition to preparatory without El Azhar is Ministry of Education
2007/2008
2007/2008
2007/2008
2007/2008
2007/2008
2007/2008
Budget 2007/08
Budget 2007/08
2007/2008
2007/2008
2007/2008
2007/2008
2007/2008
2009
2009
21.95
13.41
42.54
39.26
63.44
37.77
11.9
3.8
72.8
27.2
85.57
3.44
10.99
1.51
1.5
Total
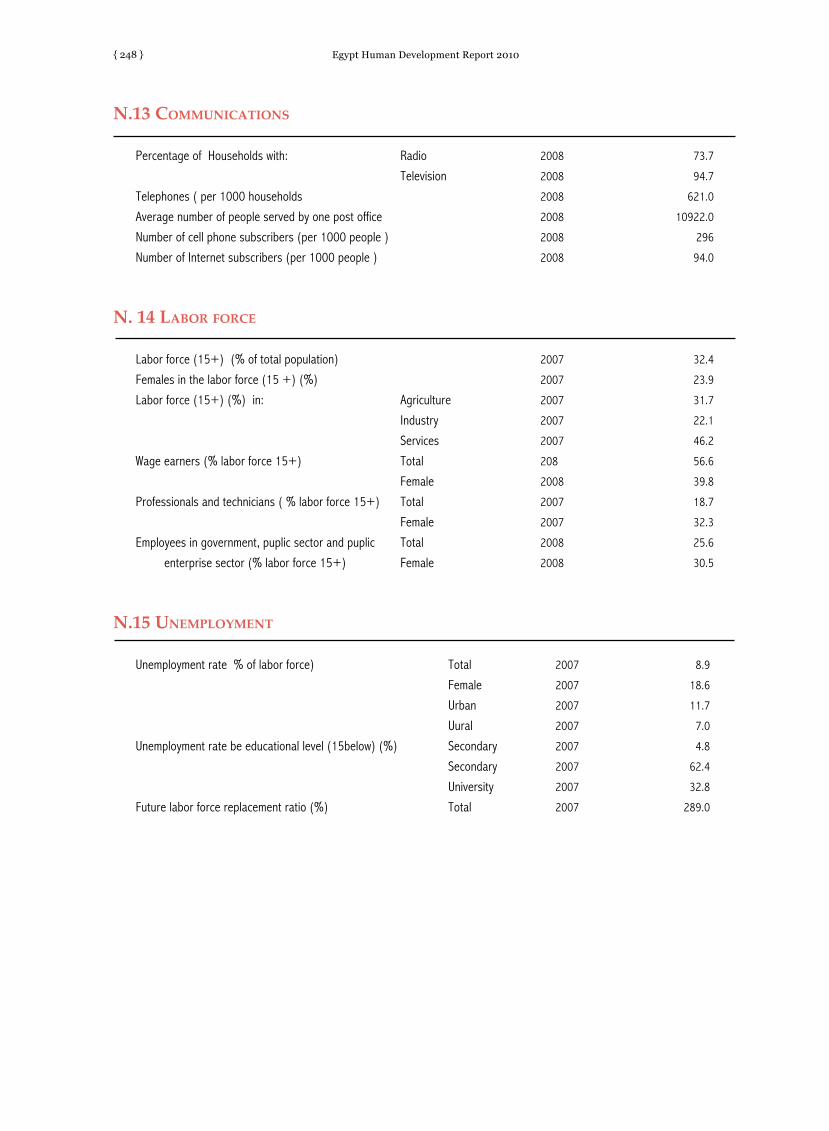
Egypt Human Development Report 2010{ 248 }
n.13 coMMunications
Percentage of Households with: Radio
Television
Telephones ( per 1000 households
Average number of people served by one post office
Number of cell phone subscribers (per 1000 people )
Number of Internet subscribers (per 1000 people )
n. 14 Labor force
Labor force (15+) (% of total population)
Females in the labor force (15 +) (%)
Labor force (15+) (%) in: Agriculture
Industry
Services
Wage earners (% labor force 15+) Total
Female
Professionals and technicians ( % labor force 15+) Total
Female
Employees in government, puplic sector and puplic Total
enterprise sector (% labor force 15+) Female
n.15 uneMPLoyMent
Unemployment rate % of labor force) Total
Female
Urban
Uural
Unemployment rate be educational level (15below) (%) Secondary
Secondary
University
Future labor force replacement ratio (%) Total
2008
2008
2008
2008
2008
2008
2007
2007
2007
2007
2007
208
2008
2007
2007
2008
2008
73.7
94.7
621.0
10922.0
296
94.0
32.4
23.9
31.7
22.1
46.2
56.6
39.8
18.7
32.3
25.6
30.5
2007
2007
2007
2007
2007
2007
2007
2007
8.9
18.6
11.7
7.0
4.8
62.4
32.8
289.0
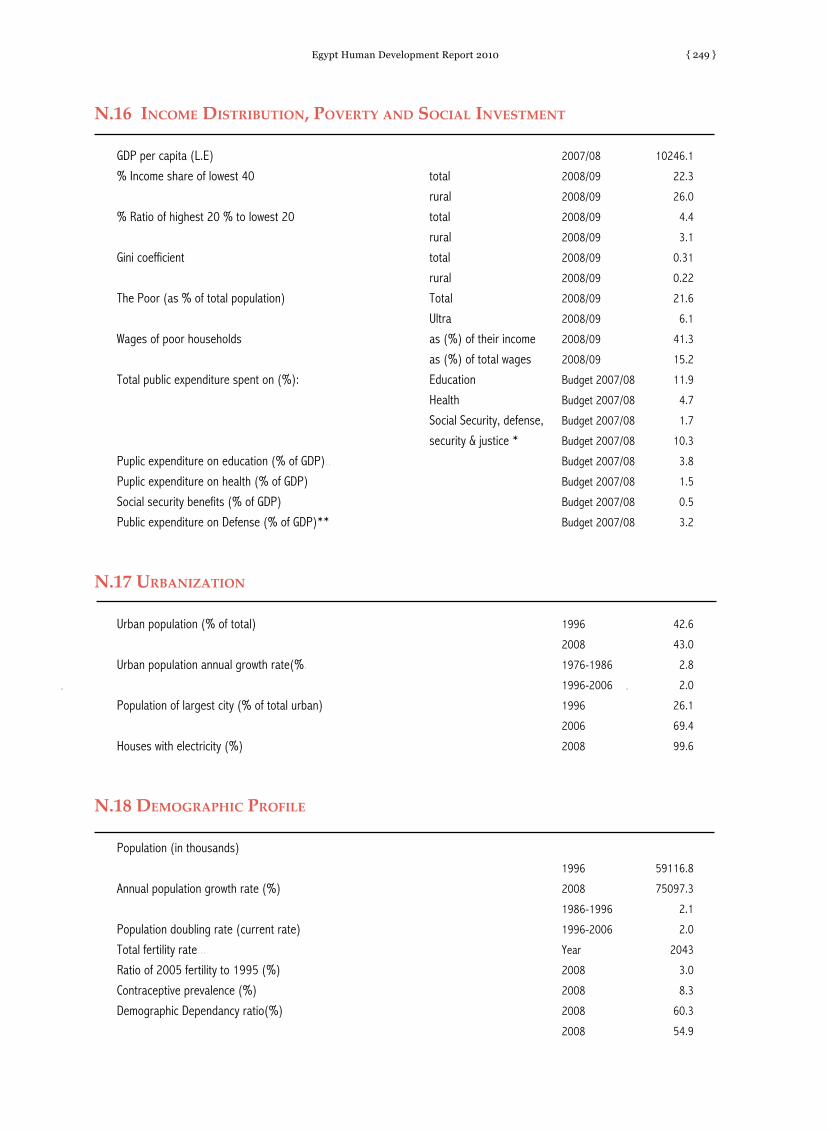
Egypt Human Development Report 2010 { 249 }
n.16 incoMe Distribution, Poverty anD sociaL investMent
GDP per capita (L.E)
% Income share of lowest 40 total
rural
% Ratio of highest 20 % to lowest 20 total
rural
Gini coefficient total
rural
The Poor (as % of total population) Total
Ultra
Wages of poor households as (%) of their income
as (%) of total wages
Total public expenditure spent on (%): Education
Health
Social Security, defense,
security & justice *
Puplic expenditure on education (% of GDP)..
Puplic expenditure on health (% of GDP)
Social security benefits (% of GDP)
Public expenditure on Defense (% of GDP)**
n.17 urbanization
Urban population (% of total)
Urban population annual growth rate(%.
Population of largest city (% of total urban)
Houses with electricity (%)
n.18 DeMograPhic ProfiLe
Population (in thousands)
Annual population growth rate (%)
Population doubling rate (current rate)
Total fertility rate...
Ratio of 2005 fertility to 1995 (%)
Contraceptive prevalence (%)
Demographic Dependancy ratio(%)
2007/08
2008/09
2008/09
2008/09
2008/09
2008/09
2008/09
2008/09
2008/09
2008/09
2008/09
Budget 2007/08
Budget 2007/08
Budget 2007/08
Budget 2007/08
Budget 2007/08
Budget 2007/08
Budget 2007/08
Budget 2007/08
1996
2008
1976-1986
1996-2006
1996
2006
2008
1996
2008
1986-1996
1996-2006
Year
2008
2008
2008
2008
10246.1
22.3
26.0
4.4
3.1
0.31
0.22
21.6
6.1
41.3
15.2
11.9
4.7
1.7
10.3
3.8
1.5
0.5
3.2
42.6
43.0
2.8
2.0
26.1
69.4
99.6
59116.8
75097.3
2.1
2.0
2043
3.0
8.3
60.3
54.9
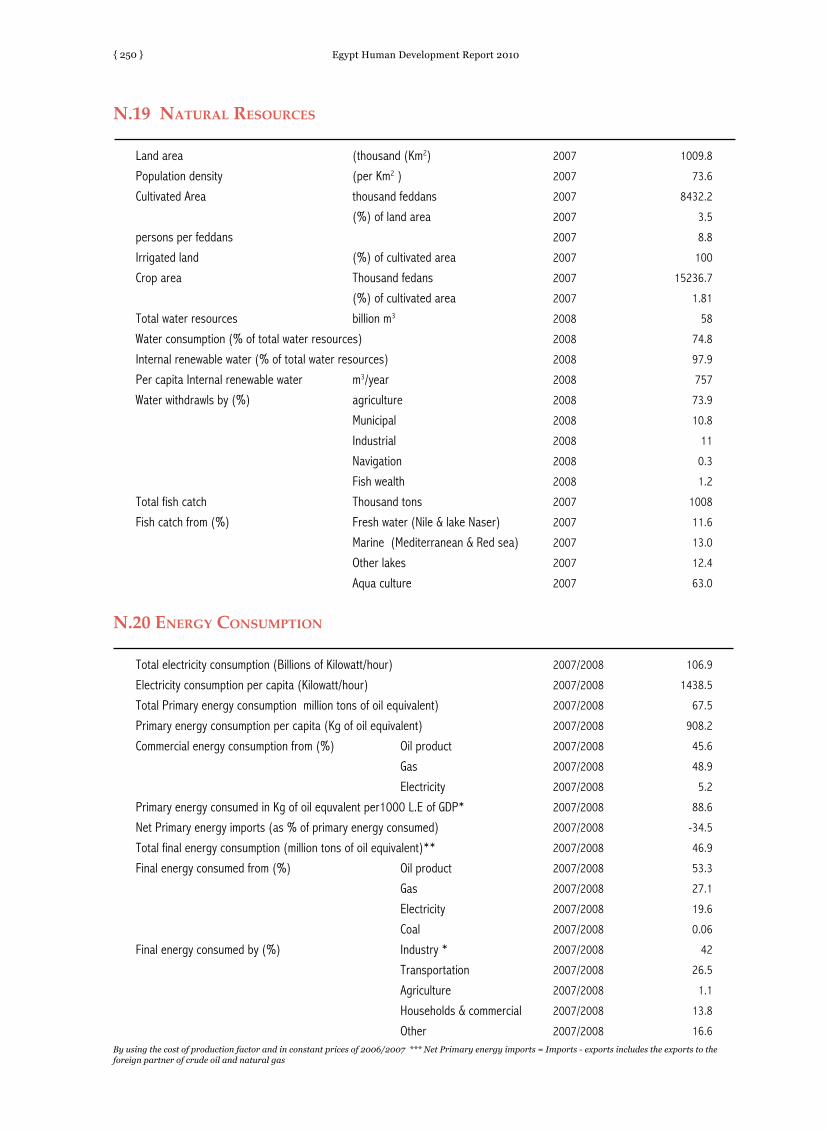
Egypt Human Development Report 2010{ 250 }
n.19 naturaL resources
Land area (thousand (Km2)
Population density (per Km2 )
Cultivated Area thousand feddans
(%) of land area
persons per feddans
Irrigated land (%) of cultivated area
Crop area Thousand fedans
(%) of cultivated area
Total water resources billion m3
Water consumption (% of total water resources)
Internal renewable water (% of total water resources)
Per capita Internal renewable water m3/year
Water withdrawls by (%) agriculture
Municipal
Industrial
Navigation
Fish wealth
Total fish catch Thousand tons
Fish catch from (%) Fresh water (Nile & lake Naser)
Marine (Mediterranean & Red sea)
Other lakes
Aqua culture
n.20 energy consuMPtion
Total electricity consumption (Billions of Kilowatt/hour)
Electricity consumption per capita (Kilowatt/hour)
Total Primary energy consumption million tons of oil equivalent)
Primary energy consumption per capita (Kg of oil equivalent)
Commercial energy consumption from (%) Oil product
Gas
Electricity
Primary energy consumed in Kg of oil equvalent per1000 L.E of GDP*
Net Primary energy imports (as % of primary energy consumed)
Total final energy consumption (million tons of oil equivalent)**
Final energy consumed from (%) Oil product
Gas
Electricity
Coal
Final energy consumed by (%) Industry *
Transportation
Agriculture
Households & commercial
Other
2007
2007
2007
2007
2007
2007
2007
2007
2008
2008
2008
2008
2008
2008
2008
2008
2008
2007
2007
2007
2007
2007
2007/2008
2007/2008
2007/2008
2007/2008
2007/2008
2007/2008
2007/2008
2007/2008
2007/2008
2007/2008
2007/2008
2007/2008
2007/2008
2007/2008
2007/2008
2007/2008
2007/2008
2007/2008
2007/2008
1009.8
73.6
8432.2
3.5
8.8
100
15236.7
1.81
58
74.8
97.9
757
73.9
10.8
11
0.3
1.2
1008
11.6
13.0
12.4
63.0
106.9
1438.5
67.5
908.2
45.6
48.9
5.2
88.6
-34.5
46.9
53.3
27.1
19.6
0.06
42
26.5
1.1
13.8
16.6By using the cost of production factor and in constant prices of 2006/2007 *** Net Primary energy imports = Imports - exports includes the exports to the foreign partner of crude oil and natural gas
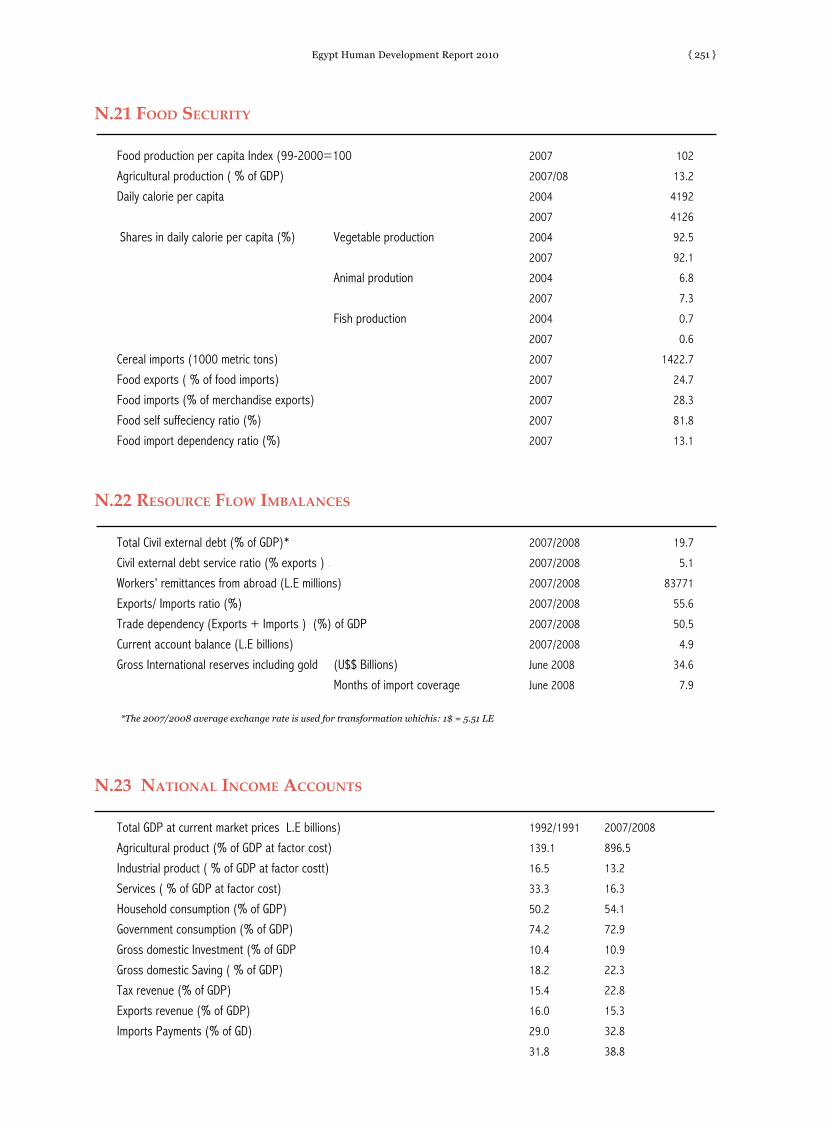
Egypt Human Development Report 2010 { 251 }
n.21 fooD security
Food production per capita Index (99-2000=100
Agricultural production ( % of GDP)
Daily calorie per capita
Shares in daily calorie per capita (%) Vegetable production
Animal prodution
Fish production
Cereal imports (1000 metric tons)
Food exports ( % of food imports)
Food imports (% of merchandise exports)
Food self suffeciency ratio (%)
Food import dependency ratio (%)
n.22 resource fLow iMbaLances
Total Civil external debt (% of GDP)*
Civil external debt service ratio (% exports ) .
Workers’ remittances from abroad (L.E millions)
Exports/ Imports ratio (%)
Trade dependency (Exports + Imports ) (%) of GDP
Current account balance (L.E billions)
Gross International reserves including gold (U$$ Billions)
Months of import coverage
*The 2007/2008 average exchange rate is used for transformation whichis: 1$ = 5.51 LE
n.23 nationaL incoMe accounts
Total GDP at current market prices L.E billions)
Agricultural product (% of GDP at factor cost).
Industrial product ( % of GDP at factor costt)
Services ( % of GDP at factor cost).
Household consumption (% of GDP)
Government consumption (% of GDP)
Gross domestic Investment (% of GDP
Gross domestic Saving ( % of GDP)
Tax revenue (% of GDP)
Exports revenue (% of GDP)
Imports Payments (% of GD).
2007
2007/08
2004
2007
2004
2007
2004
2007
2004
2007
2007
2007
2007
2007
2007
2007/2008
2007/2008
2007/2008
2007/2008
2007/2008
2007/2008
June 2008
June 2008
1992/1991
139.1
16.5
33.3
50.2
74.2
10.4
18.2
15.4
16.0
29.0
31.8
102
13.2
4192
4126
92.5
92.1
6.8
7.3
0.7
0.6
1422.7
24.7
28.3
81.8
13.1
19.7
5.1
83771
55.6
50.5
4.9
34.6
7.9
2007/2008
896.5
13.2
16.3
54.1
72.9
10.9
22.3
22.8
15.3
32.8
38.8

Egypt Human Development Report 2010{ 252 }
n.24 econoMic PerforMance
GDP at a constant factor cost ( L.E billions
Annual growth rate of real GDP (%)
Annual growth rate of real per capita GDP ( % )
Consumer price index (1995/1996 =100) Urban
Wholesale price index( 1986/1987 = 100)
Annual growth rate of exports (%)
Annual growth rate of Tax revenue (%)
Direct Taxes (% total taxes).
Overall budget surpls/deficit (% of GDP at market prices)
n.25 ParticiPation in DeveLoPMent
Professionals and technicians (% of labor force) Total
Female
Basic & Secondary enrolment in private schools (%)
Employees in government, puplic sector and Total
puplic enterprise sector (% labor force 15+) Female
Employees in hand craftsmen activities Total
% of labore force(15+) Female
Employees in informal sectors Total
(% of labore force) Female
1997/1998
2007/2008
1981/82-91/1992
1998/99 -2007/08
1981/82-1991/92
1998/99 -2005/2006
39600
39600
81/1982-91/1992
1997/98 -2007/08
81/1982-91/1992
97/1998 -2007/2008
2007/2008
1996/97
2007/08
2008
2008
2007
2008
2008
2006
2006
2008
2008
253.1
761.4
6.0
5.0
3.6
3.0
121.5
168.5
( - 10.8 )
16.3
2.6
12.3
50.4
(-0.9)
( -6.8 )
20.5
31.0
3.4
25.6
30.5
13.7
1.7
45.4
37.6

{ 253 }
Governorate Indicators

Egypt Human Development Report 2010{ 254 }
CairoAlexandriaPort Said SuezUrban GovsDamiettaDakahliaShrkiaKalyoubiaKafr El SheikhGharbiaMenoufiaBeheraIsmailiaLower EgyptUrbanRuralGizaBeni SuefFayoumMeniaAssiutSuhagQenaLuxorAswanUpper EgyptUrbanRuralRed sea New valley MatrouhNorth SinaiSouth SinaiFrontier GovsUrbanRuralEGYPTUrbanRural
71.372.072.772.372.272.671.871.272.770.672.371.571.570.971.5
0000
69.571.669.569.370.770.570.569.871.270.2
0000
71.271.271.171.271.171.1
0000
71.70000
80.780.583.682.981.577.672.167.872.565.774.172.663.477.270.3
0000
80.359.559.158.760.961.565.272.277.064.4
0000
87.381.864.975.888.477.2
0000
70.40000
63.171.770.177.558.580.576.478.172.678.675.174.977.677.867.5
0000
77.573.770.874.273.579.578.883.576.667.6
0000
72.382.373.178.856.566.5
0000
66.00000
7024.08162.19590.67950.77529.57166.88283.27909.57394.98116.37999.68958.28592.48154.78122.5
0000
7493.48052.27667.07869.07290.66663.45806.88277.86415.87253.6
0000
7691.511529.3
9405.58076.3
11322.39196.4
0000
7787.00000
0.7720.7830.7950.7880.7870.7930.7800.7700.7950.7600.7880.7750.7750.7650.775
0000
0.7420.7770.7420.7380.7620.7580.7580.7470.7700.753
0000
0.7700.7700.7680.7700.7680.768
0000
0.7780000
0.7480.7760.7910.8110.7380.7860.7350.7120.7250.7000.7440.7340.6810.7740.694
0000
0.7940.6420.6300.6390.6510.6750.6970.7600.7690.655
0000
0.8230.8200.6760.7680.7780.736
0000
0.6890000
0.7480.7760.7910.8110.7380.7860.7350.7120.7250.7000.7440.7340.6810.7740.694
0000
0.7940.6420.6300.6390.6510.6750.6970.7600.7690.655
0000
0.8230.8200.6760.7680.7780.736
0000
0.6890000
0.7430.7650.7830.7760.7940.7640.7510.7370.7460.7310.7540.7530.7330.7580.734
0000
0.7520.7170.6990.7020.7100.7110.7110.7480.7450.708
0000
0.7730.7940.7340.7570.7780.753
0000
0.7310000
13312
0049
141116
67
155
000000
817222120181810120000000000000000000000
0.00000
g.1 huMan DeveLoPMent inDex
Lifeexpectancy
at birth(years)
Adultlitecracy
rate(+15)
Combinedlst, 2nd & 3rd level
grossenrolment
ratio
Real GDP
per capita(ppps)
Lifeexpectancy
IndexEducation
IndexGDPIndex
HumanDev.Index
Rankof Gov.
2007 2007 2007/08 2007/08 2007 2007/08 2007/08 2007/08 2007/08
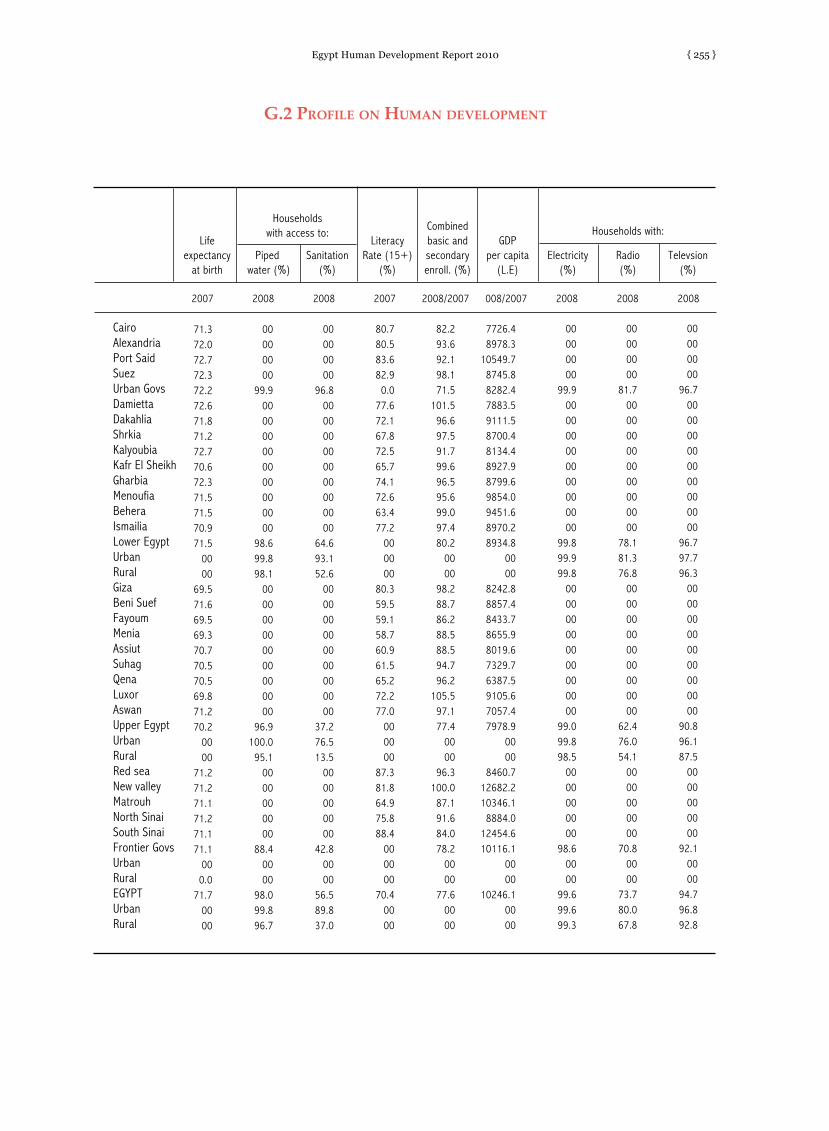
Egypt Human Development Report 2010 { 255 }
71.372.072.772.372.272.671.871.272.770.672.371.571.570.971.5
0000
69.571.669.569.370.770.570.569.871.270.2
0000
71.271.271.171.271.171.1
000.0
71.70000
00000000
99.9000000000000000000
98.699.898.1
000000000000000000
96.9100.0
95.10000000000
88.40000
98.099.896.7
00000000
96.8000000000000000000
64.693.152.6
000000000000000000
37.276.513.5
0000000000
42.80000
56.589.837.0
80.780.583.682.9
0.077.672.167.872.565.774.172.663.477.2
000000
80.359.559.158.760.961.565.272.277.0
000000
87.381.864.975.888.4
000000
70.40000
82.293.692.198.171.5
101.596.697.591.799.696.595.699.097.480.2
0000
98.288.786.288.588.594.796.2
105.597.177.4
0000
96.3100.0
87.191.684.078.2
0000
77.60000
7726.48978.3
10549.78745.88282.47883.59111.58700.48134.48927.98799.69854.09451.68970.28934.8
0000
8242.88857.48433.78655.98019.67329.76387.59105.67057.47978.9
0000
8460.712682.210346.1
8884.012454.610116.1
0000
10246.10000
00000000
99.9000000000000000000
99.899.999.8
000000000000000000
99.099.898.5
0000000000
98.60000
99.699.699.3
00000000
81.7000000000000000000
78.181.376.8
000000000000000000
62.476.054.1
0000000000
70.80000
73.780.067.8
00000000
96.7000000000000000000
96.797.796.3
000000000000000000
90.896.187.5
0000000000
92.10000
94.796.892.8
g.2 ProfiLe on huMan DeveLoPMent
CairoAlexandriaPort Said SuezUrban GovsDamiettaDakahliaShrkiaKalyoubiaKafr El SheikhGharbiaMenoufiaBeheraIsmailiaLower EgyptUrbanRuralGizaBeni SuefFayoumMeniaAssiutSuhagQenaLuxorAswanUpper EgyptUrbanRuralRed sea New valley MatrouhNorth SinaiSouth SinaiFrontier GovsUrbanRuralEGYPTUrbanRural
2007 2008 2008 2007 2008/2007 008/2007 2008 2008 2008
Lifeexpectancy
at birthPiped
water (%)Sanitation
(%)
LiteracyRate (15+)
(%)
Combinedbasic and secondary enroll. (%)
GDPper capita
(L.E)Electricity
(%)Radio(%)
Televsion(%)
Householdswith access to: Households with:

Egypt Human Development Report 2010{ 256 }
00000000
3.5000000000000000000
108.50000000000000000000000
194.200000000000000
35.10000
341.30000
00000000
111.9000000000000000000
2744.70000000000000000000000
3934.800000000000000
172.90000
6964.30000
6.52.20.30.30.00.42.22.81.90.81.71.51.70.50.000002.72.01.73.84.53.02.00.60.40.000000.10.10.30.3
0.030.00000
44.20000
315.153.9
9.52.2
984.9-3.739.632.881.9
2.531.533.410.9
6.01758.0
0000
24.271.493.8
131.8110.3
55.031.1-6.08.3
1887.000001.90.0
11.77.83.3
76.80000
4706.800000
1085.7664.9
76.969.4
00194.8
1106.81342.5
913.3717.8834.0708.1
1388.51703.6
0.00000
505.3707.1781.0
1304.71013.11091.7
808.8102.4217.2
000000
29.926.484.961.415.2
000000
17023.50000
619.4271.2
25.910.3
927.012.6
478.01058.9
497.0303.0315.2605.0
1152.2186.2
4575.10000
1490.9982.8748.0
1332.62170.61841.71208.4
192.1225.4
10339.800000000000000
387.10000
16191.00000
134.150.810.1
1.7196.7
2.050.9
105.676.857.633.8
105.6183.8
42.0658.7
0000
492.7272.9154.2302.9
1117.2716.7355.2
67.348.5
3572.600000000000000
113.00000
4543.40000
00000000
79.7000000000000000000
175.50000000000000000000000
187.2000000000000005.60000
435.10000
283.1162.7
22.815.9
0.024.4
208.6220.0105.4
95.0166.3
75.1124.2
34.8000000
124.229.425.582.182.098.661.223.454.4
0000001.8
10.63.53.74.6000000
2135.00000
109.651.911.610.6
0.013.8
136.795.064.248.699.039.176.917.5
000000
37.313.617.642.044.656.927.110.617.1
0000001.09.71.52.60.9000000
1057.00000
g.3 ProfiLe on huMan DePrivation
* Total may not equal the sum of the governorates due to excluding the governorates of Helwan, 6 October (the final results of Census 2006).
CairoAlexandriaPort Said SuezUrban GovsDamiettaDakahliaShrkiaKalyoubiaKafr El SheikhGharbiaMenoufiaBeheraIsmailiaLower EgyptUrbanRuralGizaBeni SuefFayoumMeniaAssiutSuhagQenaLuxorAswanUpper EgyptUrbanRuralRed sea New valley MatrouhNorth SinaiSouth SinaiFrontier GovsUrbanRuralEGYPTUrbanRural
2008 2008 2007 2007/2008 2007 2008/2009 2008/2009 2008 2007 2007
pipedwater Sanitation
Childrendying beforeage 5
Children not in
basic or sec.schools
Illiterates(15+) Total Ultra
Mal-nourishedchildren
below age 5 Total Female
Householdswithout access to
Thousands
Unemployed personsPoor Persons
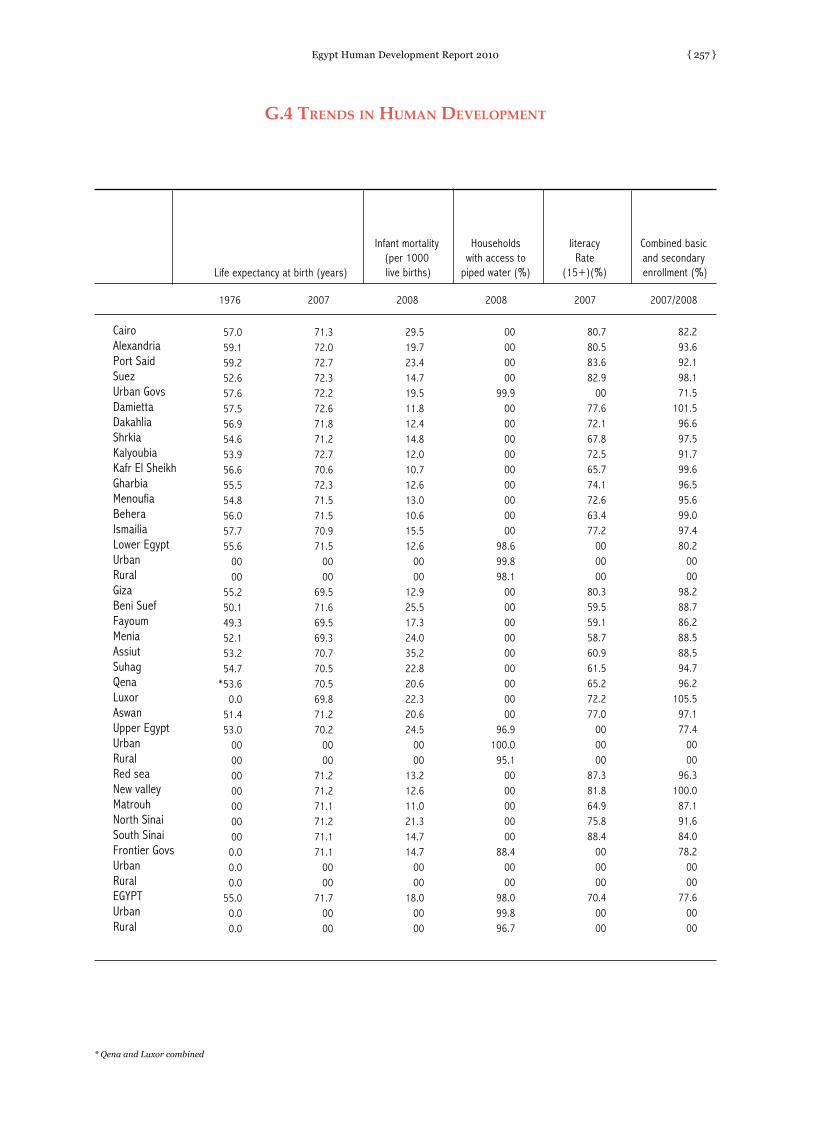
Egypt Human Development Report 2010 { 257 }
57.059.159.252.657.657.556.954.653.956.655.554.856.057.755.6
0000
55.250.149.352.153.254.7
*53.60.0
51.453.0
000000000000000.00.00.0
55.00.00.0
71.372.072.772.372.272.671.871.272.770.672.371.571.570.971.5
0000
69.571.669.569.370.770.570.569.871.270.2
0000
71.271.271.171.271.171.1
0000
71.70000
29.519.723.414.719.511.812.414.812.010.712.613.010.615.512.6
0000
12.925.517.324.035.222.820.622.320.624.5
0000
13.212.611.021.314.714.7
0000
18.00000
00000000
99.9000000000000000000
98.699.898.1
000000000000000000
96.9100.0
95.10000000000
88.40000
98.099.896.7
80.780.583.682.9
0077.672.167.872.565.774.172.663.477.2
000000
80.359.559.158.760.961.565.272.277.0
000000
87.381.864.975.888.4
000000
70.40000
82.293.692.198.171.5
101.596.697.591.799.696.595.699.097.480.2
0000
98.288.786.288.588.594.796.2
105.597.177.4
0000
96.3100.0
87.191.684.078.2
0000
77.60000
Infant mortality(per 1000 live births)
Households with access to
piped water (%)
literacy Rate
(15+)(%)
Combined basic and secondary enrollment (%)
g.4 trenDs in huMan DeveLoPMent
* Qena and Luxor combined
CairoAlexandriaPort Said SuezUrban GovsDamiettaDakahliaShrkiaKalyoubiaKafr El SheikhGharbiaMenoufiaBeheraIsmailiaLower EgyptUrbanRuralGizaBeni SuefFayoumMeniaAssiutSuhagQenaLuxorAswanUpper EgyptUrbanRuralRed sea New valley MatrouhNorth SinaiSouth SinaiFrontier GovsUrbanRuralEGYPTUrbanRural
1976 2007 2008 2008 2007 2007/2008
Life expectancy at birth (years)

Egypt Human Development Report 2010{ 258 }
80.780.583.682.9
0077.672.167.872.565.774.172.663.477.2
000000
80.359.559.158.760.961.565.272.277.0
000000
87.381.864.975.888.4
000000
70.40000
76.876.580.578.3
0075.966.260.465.457.366.463.954.271.0
000000
76.147.849.947.151.050.054.664.269.7
000000
81.375.651.166.080.6
000000
62.70000
82.293.692.198.171.5
101.596.697.591.799.696.595.699.097.480.2
0000
98.288.786.288.588.594.796.2
105.597.177.4
0000
96.3100.0
87.191.684.078.2
0000
77.60000
83.094.691.898.087.4
104.298.798.692.3
101.097.496.298.596.597.7
0000
98.986.384.985.285.691.392.9
105.896.190.5
0000
99.199.077.088.386.888.2
0000
93.00000
51.746.053.747.549.738.640.236.538.935.641.940.531.640.737.9
0000
50.326.928.027.129.126.330.638.440.431.9
0000
53.746.522.438.247.340.4
0000
37.90000
48.943.652.144.547.041.138.633.035.631.838.836.726.837.834.8
0000
47.220.722.520.023.119.321.731.133.025.5
0000
39.041.415.631.124.429.7
0000
33.50000
31.525.824.427.3
0018.519.118.622.515.523.522.412.223.9
000000
16.713.011.7
9.617.816.917.827.223.6
000000
28.633.412.528.724.2
000000
20.50000
59.340.151.356.9
0053.335.221.444.823.340.831.213.740.5
000000
38.513.217.010.132.722.328.843.965.8
000000
20.336.721.352.868.3
000000
31.00000
2007 2007 2007/2008 2007/2008 2008 2008 2008 2008
g.5 huMan caPitaL forMation
CairoAlexandriaPort Said SuezUrban GovsDamiettaDakahliaShrkiaKalyoubiaKafr El SheikhGharbiaMenoufiaBeheraIsmailiaLower EgyptUrbanRuralGizaBeni SuefFayoumMeniaAssiutSuhagQenaLuxorAswanUpper EgyptUrbanRuralRed sea New valley MatrouhNorth SinaiSouth SinaiFrontier GovsUrbanRuralEGYPTUrbanRural
Literacy(15+) (%)
Basic & secondaryenrollment (%)
Population (15+)with secondary or
higher education (%)
Professional &technical staff (% of labor force) (15+)
Total Female Total Female Total Female Total Female
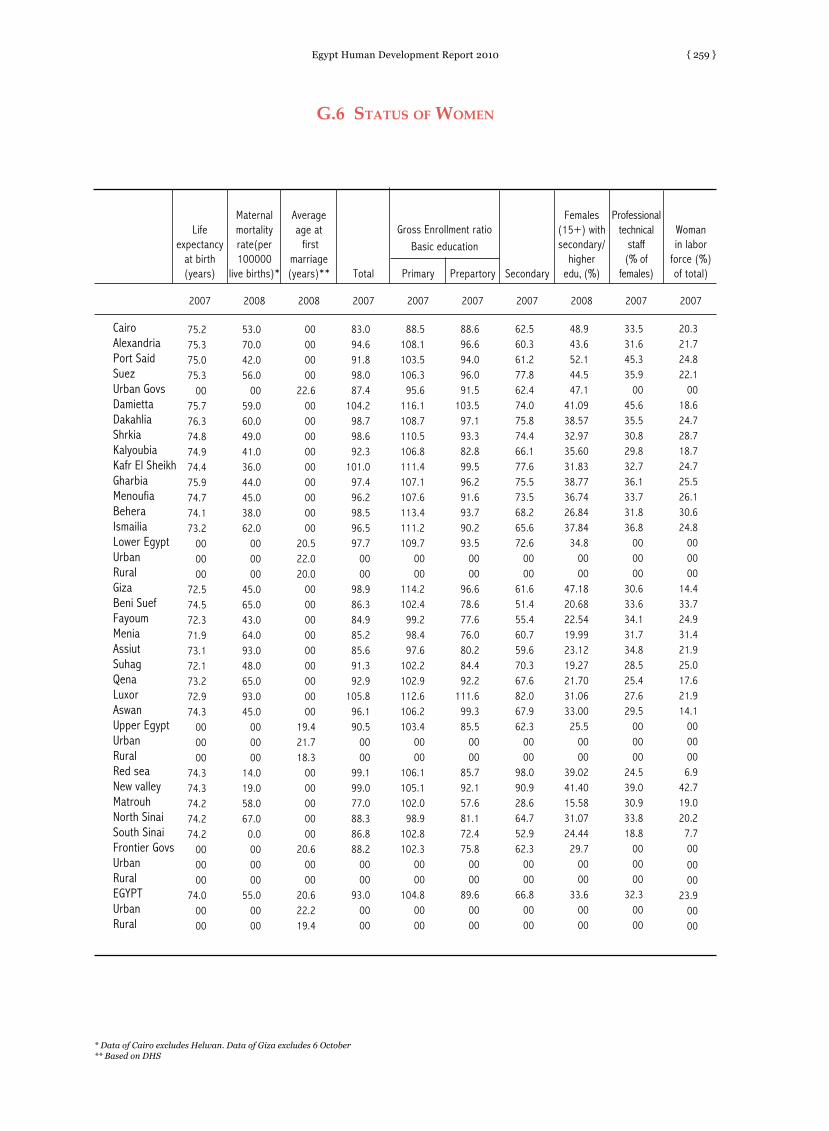
Egypt Human Development Report 2010 { 259 }
75.275.375.075.3
0075.776.374.874.974.475.974.774.173.2
000000
72.574.572.371.973.172.173.272.974.3
000000
74.374.374.274.274.2
000000
74.00000
53.070.042.056.0
0059.060.049.041.036.044.045.038.062.0
000000
45.065.043.064.093.048.065.093.045.0
000000
14.019.058.067.0
0.0000000
55.00000
00000000
22.6000000000000000000
20.522.020.0
000000000000000000
19.421.718.3
0000000000
20.60000
20.622.219.4
83.094.691.898.087.4
104.298.798.692.3
101.097.496.298.596.597.7
0000
98.986.384.985.285.691.392.9
105.896.190.5
0000
99.199.077.088.386.888.2
0000
93.00000
88.5108.1103.5106.3
95.6116.1108.7110.5106.8111.4107.1107.6113.4111.2109.7
0000
114.2102.4
99.298.497.6
102.2102.9112.6106.2103.4
0000
106.1105.1102.0
98.9102.8102.3
0000
104.80000
88.696.694.096.091.5
103.597.193.382.899.596.291.693.790.293.5
0000
96.678.677.676.080.284.492.2
111.699.385.5
0000
85.792.157.681.172.475.8
0000
89.60000
62.560.361.277.862.474.075.874.466.177.675.573.568.265.672.6
0000
61.651.455.460.759.670.367.682.067.962.3
0000
98.090.928.664.752.962.3
0000
66.80000
48.943.652.144.547.1
41.0938.5732.9735.6031.8338.7736.7426.8437.84
34.80000
47.1820.6822.5419.9923.1219.2721.7031.0633.00
25.50000
39.0241.4015.5831.0724.44
29.70000
33.60000
33.531.645.335.9
0045.635.530.829.832.736.133.731.836.8
000000
30.633.634.131.734.828.525.427.629.5
000000
24.539.030.933.818.8
000000
32.30000
20.321.724.822.1
0018.624.728.718.724.725.526.130.624.8
000000
14.433.724.931.421.925.017.621.914.1
0000006.9
42.719.020.2
7.7000000
23.90000
2007 2008 2008 2007 2007 2007 2007 2008 2007 2007
g.6 status of woMen
* Data of Cairo excludes Helwan. Data of Giza excludes 6 October ** Based on DHS
CairoAlexandriaPort Said SuezUrban GovsDamiettaDakahliaShrkiaKalyoubiaKafr El SheikhGharbiaMenoufiaBeheraIsmailiaLower EgyptUrbanRuralGizaBeni SuefFayoumMeniaAssiutSuhagQenaLuxorAswanUpper EgyptUrbanRuralRed sea New valley MatrouhNorth SinaiSouth SinaiFrontier GovsUrbanRuralEGYPTUrbanRural
Lifeexpectancy
at birth(years)
Maternalmortalityrate(per100000
live births)*
Averageage at first
marriage(years)** Total Primary Prepartory Secondary
Females(15+) withsecondary/
higheredu, (%)
Professionaltechnical
staff (% of
females)
Womanin labor
force (%)of total)
Gross Enrollment ratioBasic education
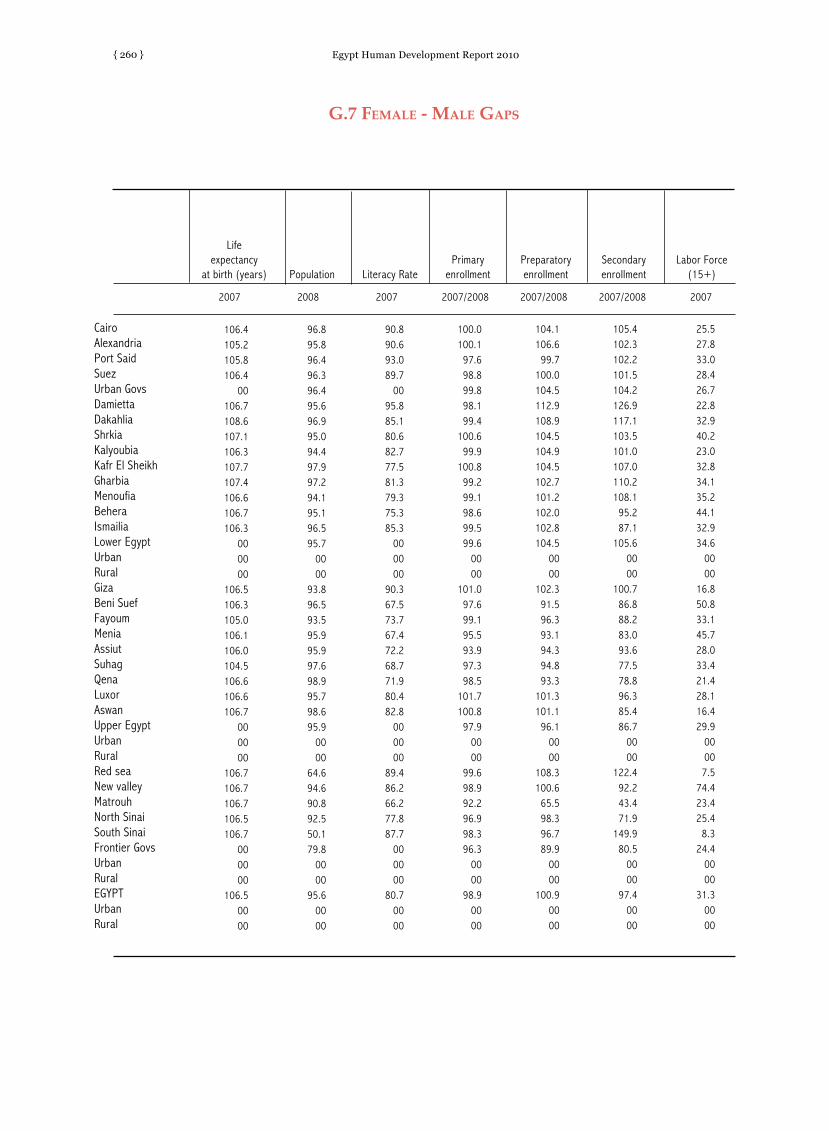
Egypt Human Development Report 2010{ 260 }
106.4105.2105.8106.4
00106.7108.6107.1106.3107.7107.4106.6106.7106.3
000000
106.5106.3105.0106.1106.0104.5106.6106.6106.7
000000
106.7106.7106.7106.5106.7
000000
106.50000
96.895.896.496.396.495.696.995.094.497.997.294.195.196.595.7
0000
93.896.593.595.995.997.698.995.798.695.9
0000
64.694.690.892.550.179.8
0000
95.60000
90.890.693.089.7
0095.885.180.682.777.581.379.375.385.3
000000
90.367.573.767.472.268.771.980.482.8
000000
89.486.266.277.887.7
000000
80.70000
100.0100.1
97.698.899.898.199.4
100.699.9
100.899.299.198.699.599.6
0000
101.097.699.195.593.997.398.5
101.7100.8
97.90000
99.698.992.296.998.396.3
0000
98.90000
104.1106.6
99.7100.0104.5112.9108.9104.5104.9104.5102.7101.2102.0102.8104.5
0000
102.391.596.393.194.394.893.3
101.3101.1
96.10000
108.3100.6
65.598.396.789.9
0000
100.90000
105.4102.3102.2101.5104.2126.9117.1103.5101.0107.0110.2108.1
95.287.1
105.60000
100.786.888.283.093.677.578.896.385.486.7
0000
122.492.243.471.9
149.980.5
0000
97.40000
25.527.833.028.426.722.832.940.223.032.834.135.244.132.934.6
0000
16.850.833.145.728.033.421.428.116.429.9
00007.5
74.423.425.4
8.324.4
0000
31.30000
Life expectancy
at birth (years) Population Literacy RatePrimary
enrollmentPreparatoryenrollment
Secondaryenrollment
Labor Force(15+)
g.7 feMaLe - MaLe gaPs
CairoAlexandriaPort Said SuezUrban GovsDamiettaDakahliaShrkiaKalyoubiaKafr El SheikhGharbiaMenoufiaBeheraIsmailiaLower EgyptUrbanRuralGizaBeni SuefFayoumMeniaAssiutSuhagQenaLuxorAswanUpper EgyptUrbanRuralRed sea New valley MatrouhNorth SinaiSouth SinaiFrontier GovsUrbanRuralEGYPTUrbanRural
2007 2008 2007 2007/2008 2007/2008 2007/2008 2007

Egypt Human Development Report 2010 { 261 }
0000000000
61.072.076.955.376.970.179.580.954.772.0
0000
41.376.877.581.173.578.678.752.257.5
000000
4.5051.9029.6039.6049.10
000000
57.000000
00000000
99.9000000000000000000
99.80000000000000000000000
100.000000000000000000000
99.80000
0000000000000000000000000000
98.10000000000000000000000
95.100000000000000000000
96.70000
00000000
96.8000000000000000000
93.10000000000000000000000
76.500000000000000000000
89.80000
000000000.0000000000000000000
52.60000000000000000000000
13.500000000000000000000
37.50000
80.779.781.981.480.581.378.179.377.374.781.779.976.383.078.8
0000
79.472.169.375.775.572.877.678.380.576.9
0000
87.686.668.382.293.382.2
0000
79.10000
0000000000
72.168.463.768.561.669.669.559.168.865.8
0000
62.653.653.652.454.457.060.364.272.757.1
0000
52.671.748.059.974.862.5
0000
62.00000
0000000000000000000000000000
98.00000000000000000000000
95.200000000000000000000
96.90000
0000000000000000000000000000
56.50000000000000000000000
17.600000000000000000000
41.80000
0000000000
89.988.681.489.683.686.288.178.583.984.6
0000
79.975.378.370.172.979.378.783.191.675.2
0000
60.883.971.273.881.277.0
0000
79.40000
2008 2008 2008 2008 2008 2006 2006 20O8 2008 2008
g.8 ruraL - urban gaPs
CairoAlexandriaPort Said SuezUrban GovsDamiettaDakahliaShrkiaKalyoubiaKafr El SheikhGharbiaMenoufiaBeheraIsmailiaLower EgyptUrbanRuralGizaBeni SuefFayoumMeniaAssiutSuhagQenaLuxorAswanUpper EgyptUrbanRuralRed sea New valley MatrouhNorth SinaiSouth SinaiFrontier GovsUrbanRuralEGYPTUrbanRural
Rural Population(% of total) Urban Rural Urban Rural Urban Rural Piped Water Sanitation Literacy
Piped water (%) Sanitation (%) Litcracy (15+) (%)
Households with access to:
Rural-Urban disparity

Egypt Human Development Report 2010{ 262 }
00000000
89.2000000000000000000
75.082.872.8
000000000000000000
65.981.859.9
0000000000
71.00000
73.685.066.9
53.070.042.056.0
0059.060.049.041.036.044.045.038.062.0
000000
45.065.043.064.093.048.065.093.045.0
000000
14.019.058.067.0
0.0000000
55.00000
151.0139.0108.0163.0147.0
82.071.072.0
133.060.0
107.0130.0
77.099.093.0
0000
126.0106.0151.0108.0107.0
86.0*8000
109.0102.0
0000
191.0181.0
98.094.0
00124.0
0000
108.00000
29.519.723.414.719.511.812.414.812.010.712.613.010.615.512.6
0000
12.925.517.324.035.222.820.622.320.624.5
0000
13.212.611.021.314.714.7
0000
18.00000
24.0216.0147.0236.0231.0136.0179.0159.0297.0125.0215.0275.0158.0161.0194.0
0000
254.0196.0290.0213.0207.0173.0*154
00191.0199.0
0000
266.0334.0176.0136.0
00210.0
0000
204.00000
35.524.225.817.423.614.416.619.715.514.214.317.315.320.713.7
0000
16.230.522.030.343.528.925.928.914.829.9
0000
16.617.214.226.822.519.0
0000
22.80000
00000000
95.2000000000000000000
96.10000000000000000000000
95.600000000000000
95.70000
95.895.296.1
00000000
89.4000000000000000000
78.10000000000000000000000
57.500000000000000
72.90000
71.785.563.6
00000000
94.3000000000000000000
93.70000000000000000000000
88.400000000000000
86.20000
91.793.790.5
00000000
5.9000000000000000000
5.50000000000000000000000
6.700000000000000
4.20000
6.06.06.0
2008 2008 1961 2008 1961 2008 2008 2008 2008 2008
g.9 chiLD survivaL anD DeveLoPMent
* Calculated for urban govs without governorates of Cairo, and for Lower Egypt, govs without governorates of Qalyubia and for Upper Egypt govs without governorates of Giza. ** A child is considered to be fully immunized if the child has received BCG, a measles or MMR vaccination, three DPT vaccinations, and three polio vaccinations.
CairoAlexandriaPort Said SuezUrban GovsDamiettaDakahliaShrkiaKalyoubiaKafr El SheikhGharbiaMenoufiaBeheraIsmailiaLower EgyptUrbanRuralGizaBeni SuefFayoumMeniaAssiutSuhagQenaLuxorAswanUpper EgyptUrbanRuralRed sea New valley MatrouhNorth SinaiSouth SinaiFrontier GovsUrbanRuralEGYPTUrbanRural
Pregnantwomen with
prenatalcare (%)
Maternalmortalityrate (per100000
live births
Childrenever
breastfed(%)
Birthsattendedby healthpersonnel
(%)
Children**12-23
month, fullyimmunized
(%)
Underweight(belowage 5)
(%)
Infant mortalityrate (per 1000
live births)*
Under five mortality rate
(per 1000 live births)*
Registered Adjusted Registered Adjusted
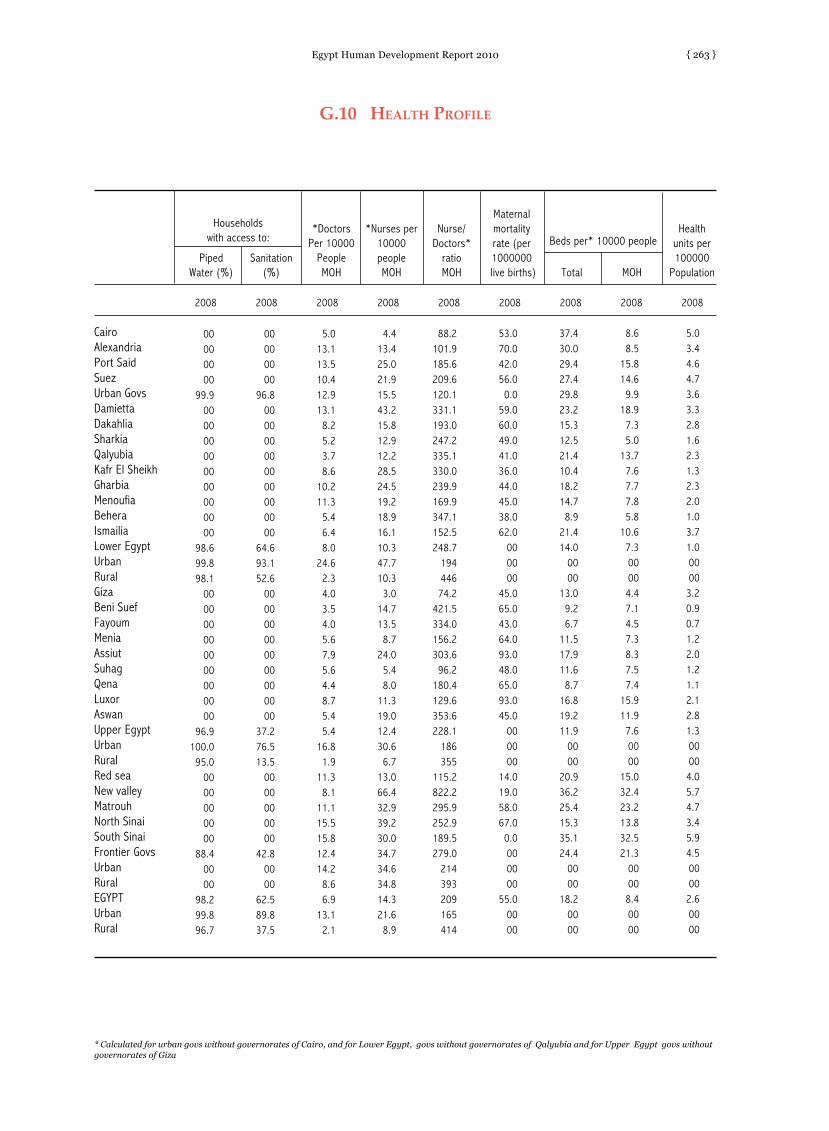
Egypt Human Development Report 2010 { 263 }
00000000
99.9000000000000000000
98.699.898.1
000000000000000000
96.9100.0
95.00000000000
88.40000
98.299.896.7
00000000
96.8000000000000000000
64.693.152.6
000000000000000000
37.276.513.5
0000000000
42.80000
62.589.837.5
5.013.113.510.412.913.1
8.25.23.78.6
10.211.3
5.46.48.0
24.62.34.03.54.05.67.95.64.48.75.45.4
16.81.9
11.38.1
11.115.515.812.414.2
8.66.9
13.12.1
4.413.425.021.915.543.215.812.912.228.524.519.218.916.110.347.710.3
3.014.713.5
8.724.0
5.48.0
11.319.012.430.6
6.713.066.432.939.230.034.734.634.814.321.6
8.9
88.2101.9185.6209.6120.1331.1193.0247.2335.1330.0239.9169.9347.1152.5248.7
19444674.2
421.5334.0156.2303.6
96.2180.4129.6353.6228.1
186355
115.2822.2295.9252.9189.5279.0
214393209165414
53.070.042.056.0
0.059.060.049.041.036.044.045.038.062.0
000000
45.065.043.064.093.048.065.093.045.0
000000
14.019.058.067.0
0.0000000
55.00000
37.430.029.427.429.823.215.312.521.410.418.214.7
8.921.414.0
0000
13.09.26.7
11.517.911.6
8.716.819.211.9
0000
20.936.225.415.335.124.4
0000
18.20000
8.68.5
15.814.6
9.918.9
7.35.0
13.77.67.77.85.8
10.67.300004.47.14.57.38.37.57.4
15.911.9
7.60000
15.032.423.213.832.521.3
00008.40000
5.03.44.64.73.63.32.81.62.31.32.32.01.03.71.000003.20.90.71.22.01.21.12.12.81.300004.05.74.73.45.94.500002.60000
2008 2008 2008 2008 2008 2008 2008 2008 2008
g.10 heaLth ProfiLe
* Calculated for urban govs without governorates of Cairo, and for Lower Egypt, govs without governorates of Qalyubia and for Upper Egypt govs without governorates of Giza
CairoAlexandriaPort Said SuezUrban GovsDamiettaDakahliaSharkiaQalyubiaKafr El SheikhGharbiaMenoufiaBeheraIsmailiaLower EgyptUrbanRuralGizaBeni SuefFayoumMeniaAssiutSuhagQenaLuxorAswanUpper EgyptUrbanRuralRed sea New valley MatrouhNorth SinaiSouth SinaiFrontier GovsUrbanRuralEGYPTUrbanRural
PipedWater (%)
Sanitation(%)
*DoctorsPer 10000
PeopleMOH
*Nurses per10000peopleMOH
Nurse/Doctors*
ratioMOH
Maternalmortalityrate (per1000000
live births) Total MOH
Healthunits per100000
Population
Beds per* 10000 people
Householdswith access to:
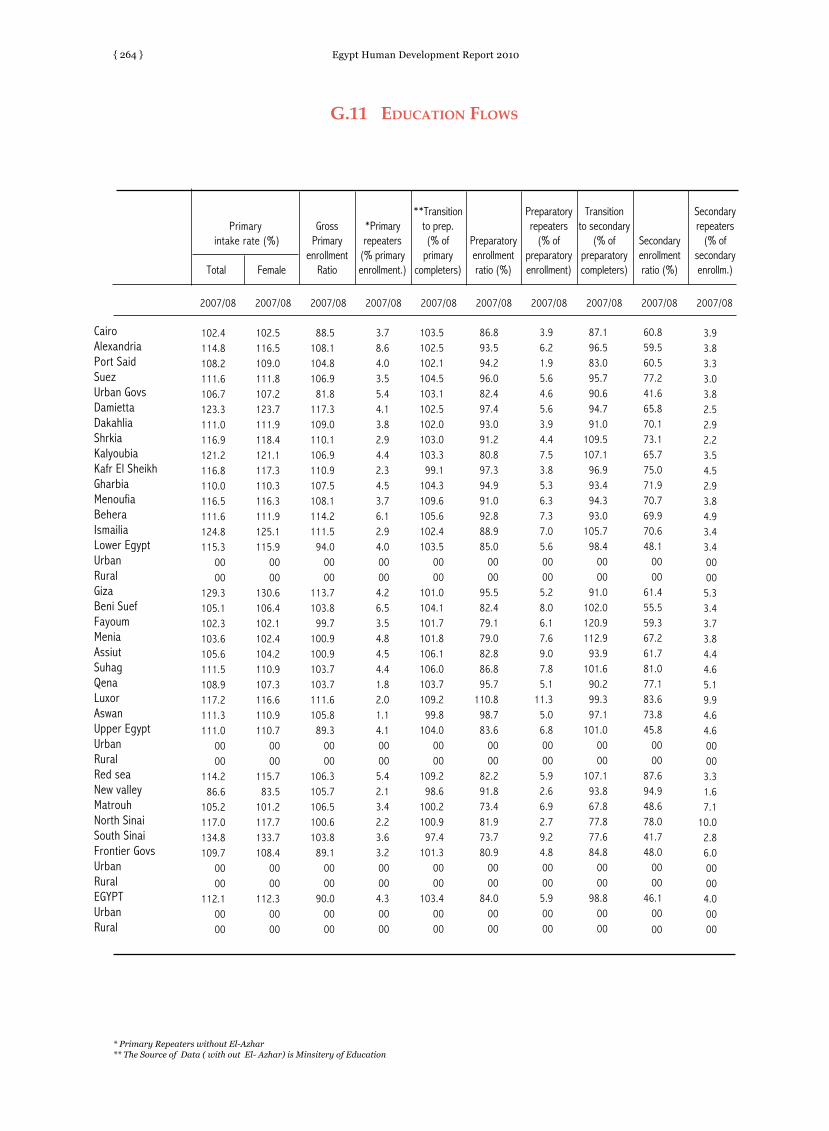
Egypt Human Development Report 2010{ 264 }
Total Female
GrossPrimary
enrollmentRatio
*Primaryrepeaters
(% primaryenrollment.)
**Transition to prep. (% of
primarycompleters)
Preparatoryenrollmentratio (%)
Preparatoryrepeaters
(% ofpreparatoryenrollment)
Transitionto secondary
(% of preparatorycompleters)
Secondaryenrollmentratio (%)
Secondaryrepeaters
(% ofsecondaryenrollm.)
102.4114.8108.2111.6106.7123.3111.0116.9121.2116.8110.0116.5111.6124.8115.3
0000
129.3105.1102.3103.6105.6111.5108.9117.2111.3111.0
0000
114.286.6
105.2117.0134.8109.7
0000
112.10000
102.5116.5109.0111.8107.2123.7111.9118.4121.1117.3110.3116.3111.9125.1115.9
0000
130.6106.4102.1102.4104.2110.9107.3116.6110.9110.7
0000
115.783.5
101.2117.7133.7108.4
0000
112.30000
88.5108.1104.8106.9
81.8117.3109.0110.1106.9110.9107.5108.1114.2111.5
94.00000
113.7103.8
99.7100.9100.9103.7103.7111.6105.8
89.30000
106.3105.7106.5100.6103.8
89.10000
90.00000
3.78.64.03.55.44.13.82.94.42.34.53.76.12.94.000004.26.53.54.84.54.41.82.01.14.100005.42.13.42.23.63.200004.30000
103.5102.5102.1104.5103.1102.5102.0103.0103.3
99.1104.3109.6105.6102.4103.5
0000
101.0104.1101.7101.8106.1106.0103.7109.2
99.8104.0
0000
109.298.6
100.2100.9
97.4101.3
0000
103.40000
86.893.594.296.082.497.493.091.280.897.394.991.092.888.985.0
0000
95.582.479.179.082.886.895.7
110.898.783.6
0000
82.291.873.481.973.780.9
0000
84.00000
3.96.21.95.64.65.63.94.47.53.85.36.37.37.05.600005.28.06.17.69.07.85.1
11.35.06.800005.92.66.92.79.24.800005.90000
87.196.583.095.790.694.791.0
109.5107.1
96.993.494.393.0
105.798.4
0000
91.0102.0120.9112.9
93.9101.6
90.299.397.1
101.00000
107.193.867.877.877.684.8
0000
98.80000
60.859.560.577.241.665.870.173.165.775.071.970.769.970.648.1
0000
61.455.559.367.261.781.077.183.673.845.8
0000
87.694.948.678.041.748.0
0000
46.10000
3.93.83.33.03.82.52.92.23.54.52.93.84.93.43.40000
5.33.43.73.84.44.65.19.94.64.60000
3.31.67.1
10.02.86.00000
4.00000
2007/08 2007/08 2007/08 2007/08 2007/08 2007/08 2007/08 2007/08 2007/08 2007/08
g.11 eDucation fLows
CairoAlexandriaPort Said SuezUrban GovsDamiettaDakahliaShrkiaKalyoubiaKafr El SheikhGharbiaMenoufiaBeheraIsmailiaLower EgyptUrbanRuralGizaBeni SuefFayoumMeniaAssiutSuhagQenaLuxorAswanUpper EgyptUrbanRuralRed sea New valley MatrouhNorth SinaiSouth SinaiFrontier GovsUrbanRuralEGYPTUrbanRural
* Primary Repeaters without El-Azhar** The Source of Data ( with out El- Azhar) is Minsitery of Education
Primary intake rate (%)
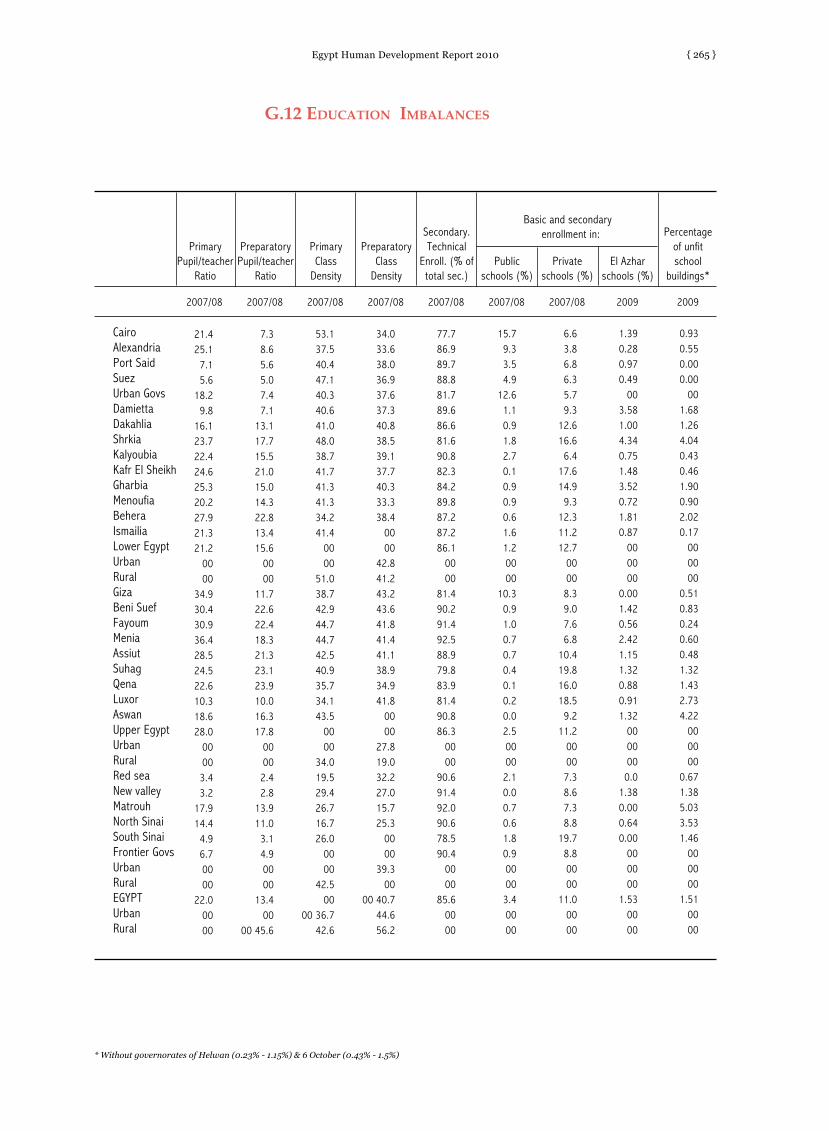
Egypt Human Development Report 2010 { 265 }
21.425.1
7.15.6
18.29.8
16.123.722.424.625.320.227.921.321.2
0000
34.930.430.936.428.524.522.610.318.628.0
00003.43.2
17.914.4
4.96.70000
22.00000
7.38.65.65.07.47.1
13.117.715.521.015.014.322.813.415.6
0000
11.722.622.418.321.323.123.910.016.317.8
00002.42.8
13.911.0
3.14.90000
13.400
00 45.6
53.137.540.447.140.340.641.048.038.741.741.341.334.241.4
0000
51.038.742.944.744.742.540.935.734.143.5
0000
34.019.529.426.716.726.0
0000
42.500
00 36.742.6
34.033.638.036.937.637.340.838.539.137.740.333.338.4
0000
42.841.243.243.641.841.441.138.934.941.8
0000
27.819.032.227.015.725.3
0000
39.300
00 40.744.656.2
77.786.989.788.881.789.686.681.690.882.384.289.887.287.286.1
0000
81.490.291.492.588.979.883.981.490.886.3
0000
90.691.492.090.678.590.4
0000
85.60000
15.79.33.54.9
12.61.10.91.82.70.10.90.90.61.61.20000
10.30.91.00.70.70.40.10.20.02.500002.10.00.70.61.80.900003.40000
6.63.86.86.35.79.3
12.616.6
6.417.614.9
9.312.311.212.7
00008.39.07.66.8
10.419.816.018.5
9.211.2
00007.38.67.38.8
19.78.80000
11.00000
1.390.280.970.49
003.581.004.340.751.483.520.721.810.87
000000
0.001.420.562.421.151.320.880.911.32
0000000.0
1.380.000.640.00
000000
1.530000
0.930.550.000.00
001.681.264.040.430.461.900.902.020.17
000000
0.510.830.240.600.481.321.432.734.22
000000
0.671.385.033.531.46
000000
1.510000
2007/08 2007/08 2007/08 2007/08 2007/08 2007/08 2007/08 2009 2009
g.12 eDucation iMbaLances
PrimaryPupil/teacher
Ratio
Preparatory
Pupil/teacher Ratio
PrimaryClass
Density
PreparatoryClass
Density
Secondary.Technical
Enroll. (% of total sec.)
Public schools (%)
Private schools (%)
El Azharschools (%)
Percentageof unfitschool
buildings*
CairoAlexandriaPort Said SuezUrban GovsDamiettaDakahliaShrkiaKalyoubiaKafr El SheikhGharbiaMenoufiaBeheraIsmailiaLower EgyptUrbanRuralGizaBeni SuefFayoumMeniaAssiutSuhagQenaLuxorAswanUpper EgyptUrbanRuralRed sea New valley MatrouhNorth SinaiSouth SinaiFrontier GovsUrbanRuralEGYPTUrbanRural
Basic and secondary enrollment in:
* Without governorates of Helwan (0.23% - 1.15%) & 6 October (0.43% - 1.5%)
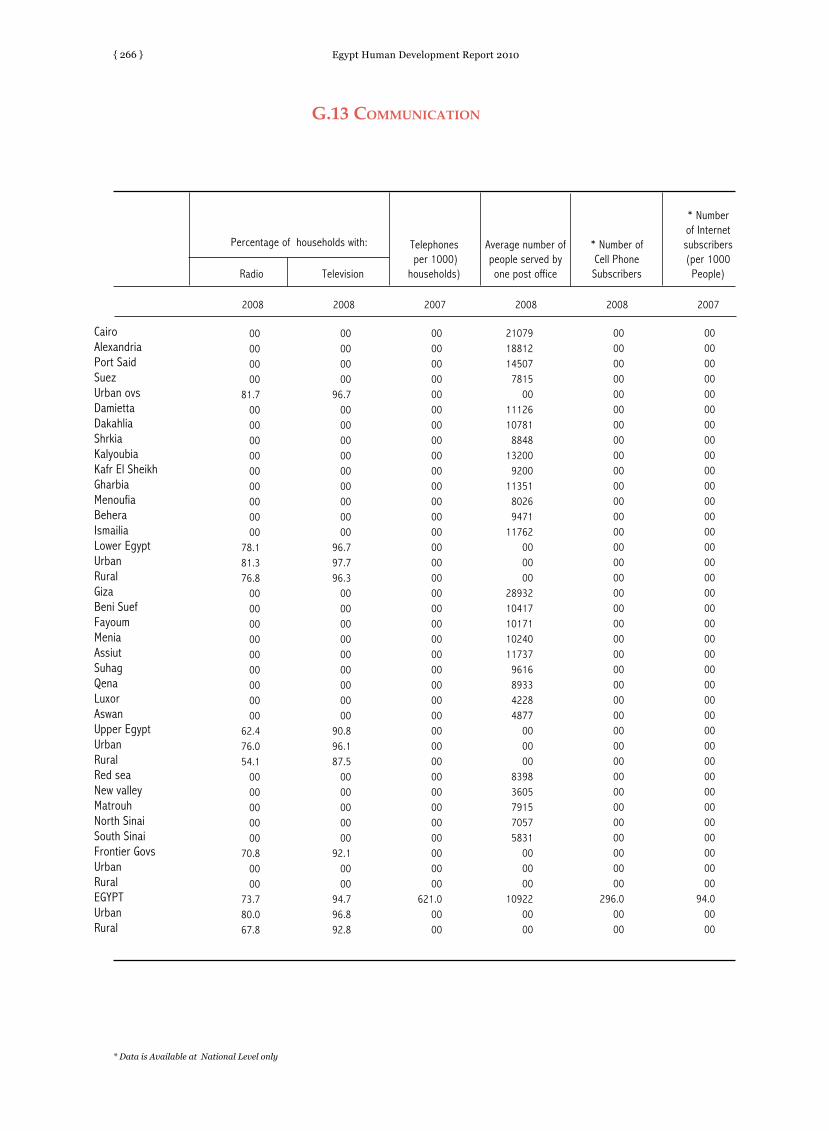
Egypt Human Development Report 2010{ 266 }
00000000
81.7000000000000000000
78.181.376.8
000000000000000000
62.476.054.1
0000000000
70.80000
73.780.067.8
00000000
96.7000000000000000000
96.797.796.3
000000000000000000
90.896.187.5
0000000000
92.10000
94.796.892.8
00000000000000000000000000000000000000000000000000000000000000000000000000
621.00000
210791881214507
781500
1112610781
884813200
920011351
80269471
11762000000
2893210417101711024011737
9616893342284877
000000
83983605791570575831
000000
109220000
00000000000000000000000000000000000000000000000000000000000000000000000000
296.00000
00000000000000000000000000000000000000000000000000000000000000000000000000
94.00000
g.13 coMMunication
CairoAlexandriaPort Said SuezUrban ovsDamiettaDakahliaShrkiaKalyoubiaKafr El SheikhGharbiaMenoufiaBeheraIsmailiaLower EgyptUrbanRuralGizaBeni SuefFayoumMeniaAssiutSuhagQenaLuxorAswanUpper EgyptUrbanRuralRed sea New valley MatrouhNorth SinaiSouth SinaiFrontier GovsUrbanRuralEGYPTUrbanRural
2008 2008 2007 2008 2008 2007
Radio Television
Telephones per 1000)households)
Average number of people served byone post office
* Number of Cell Phone Subscribers
* Number of Internet subscribers(per 1000
People)
Percentage of households with:
* Data is Available at National Level only
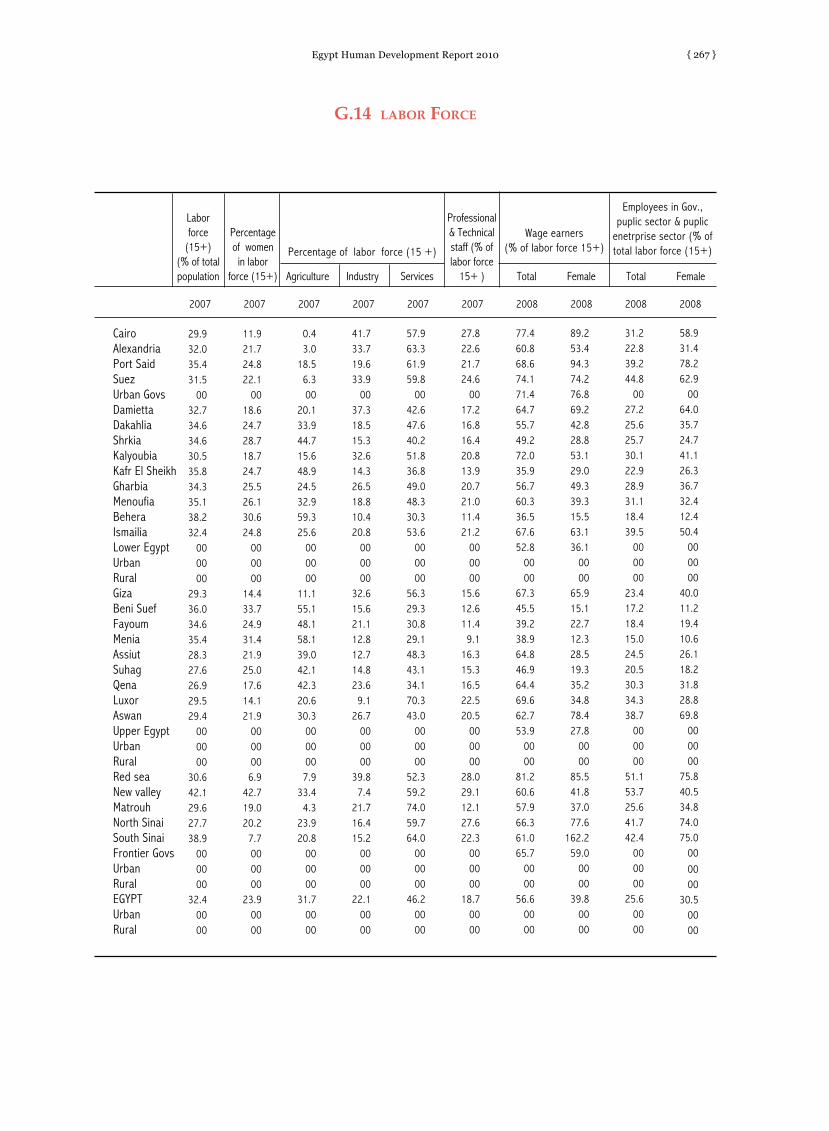
Egypt Human Development Report 2010 { 267 }
29.932.035.431.5
0032.734.634.630.535.834.335.138.232.4
000000
29.336.034.635.428.327.626.929.529.4
000000
30.642.129.627.738.9
000000
32.40000
11.921.724.822.1
0018.624.728.718.724.725.526.130.624.8
000000
14.433.724.931.421.925.017.614.121.9
000000
6.942.719.020.2
7.7000000
23.90000
0.43.0
18.56.300
20.133.944.715.648.924.532.959.325.6
000000
11.155.148.158.139.042.142.320.630.3
000000
7.933.4
4.323.920.8
000000
31.70000
41.733.719.633.9
0037.318.515.332.614.326.518.810.420.8
000000
32.615.621.112.812.714.823.6
9.126.7
000000
39.87.4
21.716.415.2
000000
22.10000
57.963.361.959.8
0042.647.640.251.836.849.048.330.353.6
000000
56.329.330.829.148.343.134.170.343.0
000000
52.359.274.059.764.0
000000
46.20000
27.822.621.724.6
0017.216.816.420.813.920.721.011.421.2
000000
15.612.611.4
9.116.315.316.522.520.5
000000
28.029.112.127.622.3
000000
18.70000
77.460.868.674.171.464.755.749.272.035.956.760.336.567.652.8
0000
67.345.539.238.964.846.964.469.662.753.9
0000
81.260.657.966.361.065.7
0000
56.60000
89.253.494.374.276.869.242.828.853.129.049.339.315.563.136.1
0000
65.915.122.712.328.519.335.234.878.427.8
0000
85.541.837.077.6
162.259.0
0000
39.80000
31.222.839.244.8
0027.225.625.730.122.928.931.118.439.5
000000
23.417.218.415.024.520.530.334.338.7
000000
51.153.725.641.742.4
000000
25.60000
58.931.478.262.9
0064.035.724.741.126.336.732.412.450.4
000000
40.011.219.410.626.118.231.828.869.8
000000
75.840.534.874.075.0
000000
30.50000
2007 2007 2007 2007 2007 2007 2008 2008 2008 2008
g.14 Labor force
CairoAlexandriaPort Said SuezUrban GovsDamiettaDakahliaShrkiaKalyoubiaKafr El SheikhGharbiaMenoufiaBeheraIsmailiaLower EgyptUrbanRuralGizaBeni SuefFayoumMeniaAssiutSuhagQenaLuxorAswanUpper EgyptUrbanRuralRed sea New valley MatrouhNorth SinaiSouth SinaiFrontier GovsUrbanRuralEGYPTUrbanRural
Labor force
(15+)(% of totalpopulation
Percentage of womenin labor
force (15+) Agriculture Industry Services
Professional & Technicalstaff (% of labor force
15+ ) Total Female Total Female
Percentage of labor force (15 +)
Employees in Gov., puplic sector & puplic
enetrprise sector (% of total labor force (15+)
Wage earners (% of labor force 15+)

Egypt Human Development Report 2010{ 268 }
11.912.211.2
9.711.8
6.712.011.7
8.010.012.0
6.56.8
11.19.600006.73.52.95.58.39.47.5
17.212.9
6.800002.0
13.33.63.87.85.700008.90000
22.617.923.029.421.320.431.717.726.220.728.013.013.722.621.0
0000
13.94.88.09.0
20.721.718.835.534.513.8
0000
16.128.5
8.213.320.019.0
0000
18.60000
11.812.211.1
9.900
10.717.813.510.416.114.310.011.813.2
0000008.3
11.45.4
10.413.614.311.721.511.4
000000
216.9
05.79.5000000
11.70000
00000000004.59.6
11.36.68.3
11.05.65.79.20000004.11.42.24.46.17.96.1
11.814.1
0000000.0
10.010.6
0.05.60000007.00000
9.713.511.8
6.3000.81.14.92.80.82.53.91.99.50000009.70.71.61.92.00.60.30.03.10000000.02.8
14.30.04.00000004.80000
44.251.646.164.2
0066.466.563.459.368.166.253.476.968.7
000000
55.968.772.966.871.071.673.476.185.7
000000
100.077.480.054.190.7
000000
62.40000
46.134.942.129.6
0032.832.531.837.931.131.342.721.221.8
000000
34.530.625.531.327.127.826.323.911.2
0000000.0
19.85.7
45.95.3000000
32.80000
200.2239.9221.9283.9
00285.3268.5287.7304.6253.2250.3259.1236.8296.7
000000
139.5297.2307.7308.1386.7396.3378.8300.3307.6
000000
245.3222.4374.3406.3144.1
000000
289.00000
2007 2007 2007 2007 2007 2007 2007 2007
g.15 uneMPLoyMent
CairoAlexandriaPort Said SuezUrban GovsDamiettaDakahliaShrkiaKalyoubiaKafr El SheikhGharbiaMenoufiaBeheraIsmailiaLower EgyptUrbanRuralGizaBeni SuefFayoumMeniaAssiutSuhagQenaLuxorAswanUpper EgyptUrbanRuralRed sea New valley MatrouhNorth SinaiSouth SinaiFrontier GovsUrbanRuralEGYPTUrbanRural
Total Female Urban Rural* Below
Secondary Secondary **University
Future labor force
Replacement ratio
Unemployment rate ( %) Unemployment rate ( %)Unemployment rate by eduction (15+ %)
* Below Secondary include less than secondary ** include more than university education

Egypt Human Development Report 2010 { 269 }
7726.48978.3
10549.78745.8
007883.59111.58700.48134.48927.98799.69854.09451.68970.2
000000
8242.88857.48433.78655.98019.67329.76387.59105.67057.4
000000
8460.712682.210346.1
8884.012454.6
000000
10246.10000
61515139589564855832467837963108375435264057335530393785355643273275396025552778290122202392264627143590291638792501
0000000000
438050163165371248432924
18.822.620.122.620.127.226.628.025.827.125.926.428.224.126.315.132.320.227.027.525.623.825.825.825.423.623.412.831.6
0000000000
22.817.048.222.320.726.0
6.14.25.24.25.42.83.02.63.12.83.23.12.63.73.08.01.85.22.82.83.23.73.13.13.23.64.0
11.01.900000000004.37.80.74.45.13.1
0.380.300.340.290.350.210.220.190.230.210.240.230.190.270.230.270.200.340.210.210.240.270.230.230.240.270.280.330.23
0000000000
0.300.300.230.310.340.22
7.66.44.41.96.91.19.3
19.211.311.2
7.617.923.518.814.2
7.316.723.041.528.730.961.047.539.040.918.436.921.343.7
0000000000
11.14.8
23.221.611.028.9
1.71.21.70.31.50.21.01.91.82.10.83.13.84.32.00.82.57.6
11.55.97.0
31.418.511.514.3
4.012.8
6.315.6
00000000003.81.28.76.12.68.5
4.94.52.41.54.61.26.4
13.09.36.96.9
14.217.813.710.3
4.912.516.533.119.823.748.336.328.530.813.927.714.734.6
00000000009.22.5
23.415.2
7.221.8
43.244.437.043.843.531.840.137.352.639.752.739.039.040.241.038.441.443.244.836.039.440.441.240.242.340.341.041.640.9
0000000000
46.131.351.941.341.441.2
2007/2008 2008/2009 2008/2009 2008/2009 2008/2009 2008/2009 008/2009 2008/2009 2008/2009
g.16 incoMe Distributtion anD Poverty
CairoAlexandriaPort Said SuezUrban GovsDamiettaDakahliaShrkiaKalyoubiaKafr El SheikhGharbiaMenoufiaBeheraIsmailiaLower EgyptUrbanRuralGizaBeni SuefFayoumMeniaAssiutSuhagQenaLuxorAswanUpper EgyptUrbanRuralRed sea New valley MatrouhNorth SinaiSouth SinaiFrontier GovsUrbanRuralEGYPTUrbanRural
GDPper
capita( L.E )
Expenditureper
capita( L.E )
Lowest40% ofPeople
Ratio of highest 20%
to lowest 20%
Ginicoefficient Total Ultra
Total Wages
TheirOncome
Income shareWages of poor
households (%) of Poor persons(of total Population %)
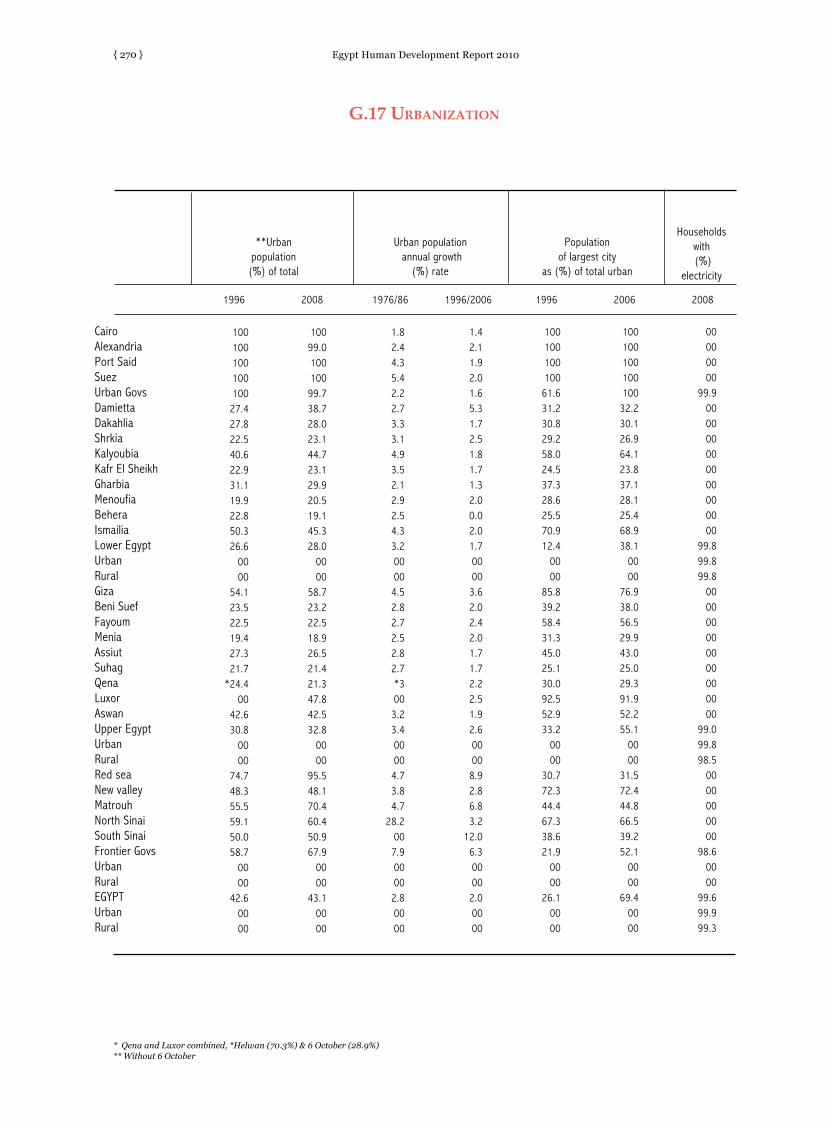
Egypt Human Development Report 2010{ 270 }
10010010010010027.427.822.540.622.931.119.922.850.326.6
0000
54.123.522.519.427.321.7
*24.400
42.630.8
0000
74.748.355.559.150.058.7
0000
42.60000
10099.010010099.738.728.023.144.723.129.920.519.145.328.0
0000
58.723.222.518.926.521.421.347.842.532.8
0000
95.548.170.460.450.967.9
0000
43.10000
1.82.44.35.42.22.73.33.14.93.52.12.92.54.33.200004.52.82.72.52.82.7*3003.23.400004.73.84.7
28.2007.900002.80000
1.42.11.92.01.65.31.72.51.81.71.32.00.02.01.700003.62.02.42.01.71.72.22.51.92.600008.92.86.83.2
12.06.300002.00000
10010010010061.631.230.829.258.024.537.328.625.570.912.4
0000
85.839.258.431.345.025.130.092.552.933.2
0000
30.772.344.467.338.621.9
0000
26.10000
10010010010010032.230.126.964.123.837.128.125.468.938.1
0000
76.938.056.529.943.025.029.391.952.255.1
0000
31.572.444.866.539.252.1
0000
69.40000
00000000
99.9000000000000000000
99.899.899.8
000000000000000000
99.099.898.5
0000000000
98.60000
99.699.999.3
1996 2008 1976/86 1996/2006 1996 2006 2008
g.17 urbanization
CairoAlexandriaPort Said SuezUrban GovsDamiettaDakahliaShrkiaKalyoubiaKafr El SheikhGharbiaMenoufiaBeheraIsmailiaLower EgyptUrbanRuralGizaBeni SuefFayoumMeniaAssiutSuhagQenaLuxorAswanUpper EgyptUrbanRuralRed sea New valley MatrouhNorth SinaiSouth SinaiFrontier GovsUrbanRuralEGYPTUrbanRural
**Urban population(%) of total
Urban population annual growth
(%) rate
Population of largest city
as (%) of total urban
Households with (%)
electricity
* Qena and Luxor combined, *Helwan (70.3%) & 6 October (28.9%)** Without 6 October

Egypt Human Development Report 2010 { 271 }
6813.23339.1
472.3417.5
11042.1913.6
4223.94281.13301.22223.73406.02760.43994.3
714.825819.0
7252.218566.8
4784.11859.21989.83310.12802.32914.92442.0
361.1974.1
21437.66659.3
14778.3157.3141.8212.0252.2
54.8818.1480.2337.9
59116.825433.833683.0
8128.74230.6
585.0529.6
13473.81136.35139.55529.64386.82705.74125.93374.24900.9
988.532287.5
9045.023242.5
6490.82371.02605.24308.43560.13874.03096.9
469.51222.3
27998.48938.0
19060.4296.8193.0337.4357.9152.5
1337.6908.0429.6
75097.332325.042773.0
1.11.31.62.51.32.11.92.32.82.11.72.22.12.82.22.22.22.52.52.52.32.42.52.21.91.92.42.12.55.72.32.84.06.63.83.93.62.11.82.3
1.52.01.82.01.71.81.62.12.41.61.61.71.72.71.91.81.92.52.02.22.22.02.42.02.21.92.22.52.15.32.63.92.98.54.15.32.02.02.02.0
28.726.123.428.927.630.226.827.426.424.025.327.528.530.927.0
0000
27.830.330.130.430.529.326.326.025.528.9
0000
21.925.231.431.314.026.4
0000
27.80000
9.17.76.36.08.46.36.25.44.94.85.86.15.26.05.500005.35.94.86.06.86.15.76.83.85.700003.84.13.34.43.53.900006.10000
66.863.754.765.865.264.264.465.759.962.167.166.366.156.564.3
0000
62.456.955.754.147.436.348.054.553.452.7
00000.00.00.00.00.00.00000
60.30000
11.96.7
34.037.9
005.41.94.6
14.42.61.72.14.1
31.3000000
20.42.20.60.71.20.61.41.33.6000000
28.716.713.514.127.4
0000006.60000
41.443.242.350.142.349.551.556.453.054.451.054.855.552.353.6
0000
52.169.369.567.767.967.267.657.258.163.6
0000
46.554.259.360.446.855.4
0000
54.90000
1996 2008 1986/1996 1996/2008 2008 2008 2008 2007 2008
g.18 DeMograPhic ProfiLe
CairoAlexandriaPort Said SuezUrban GovsDamiettaDakahliaShrkiaKalyoubiaKafr El SheikhGharbiaMenoufiaBeheraIsmailiaLower EgyptUrbanRuralGizaBeni SuefFayoumMeniaAssiutSuhagQenaLuxorAswanUpper EgyptUrbanRuralRed sea New valley MatrouhNorth SinaiSouth SinaiFrontier GovsUrbanRuralEGYPTUrbanRural
Population (thousands)
Crudebirthrate
Crudedeathrate
Contraceptiveprevalence rate (%)
Net Lifetimeinternal
migration* (% of total )
PopulationDemographicdependency
ratioAnnual population(%) growth rate
* Without governorates of Helwan (11.2%) and 6 October (10.5%)
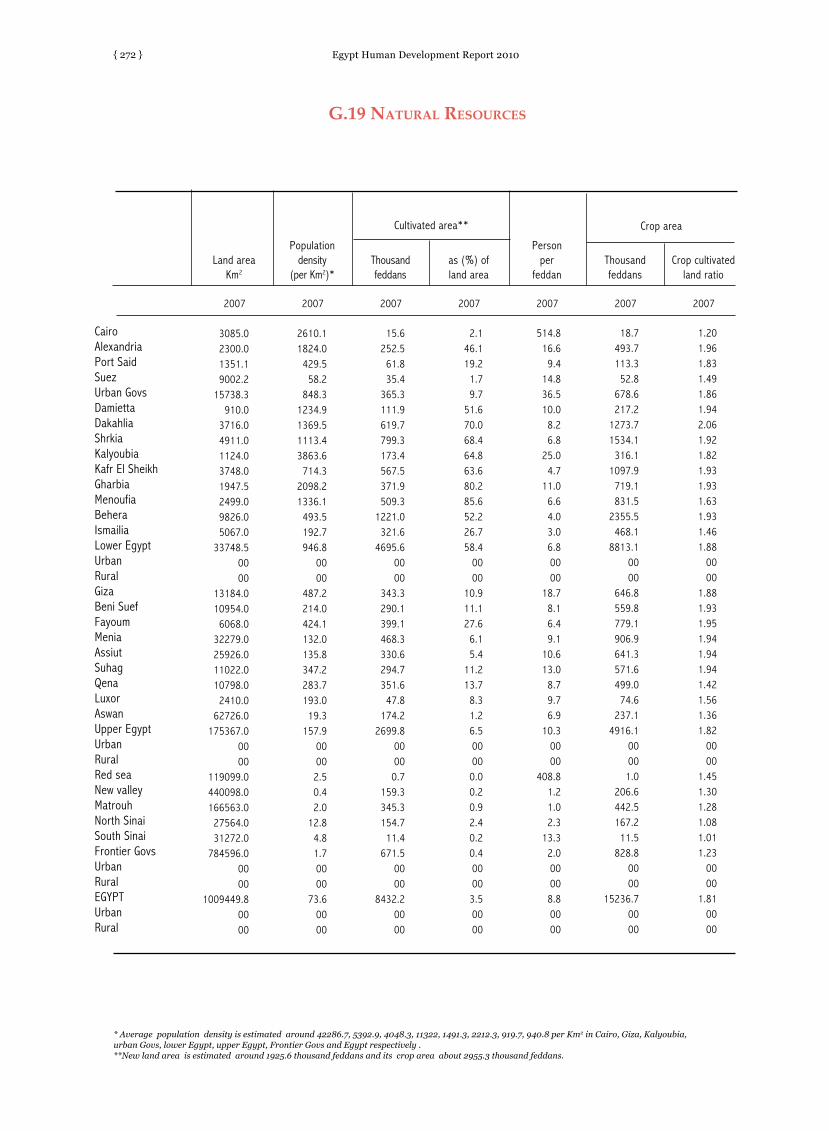
Egypt Human Development Report 2010{ 272 }
3085.02300.01351.19002.2
15738.3910.0
3716.04911.01124.03748.01947.52499.09826.05067.0
33748.50000
13184.010954.0
6068.032279.025926.011022.010798.0
2410.062726.0
175367.00000
119099.0440098.0166563.0
27564.031272.0
784596.00000
1009449.80000
2610.11824.0
429.558.2
848.31234.91369.51113.43863.6
714.32098.21336.1
493.5192.7946.8
0000
487.2214.0424.1132.0135.8347.2283.7193.0
19.3157.9
0000
2.50.42.0
12.84.81.70000
73.60000
15.6252.5
61.835.4
365.3111.9619.7799.3173.4567.5371.9509.3
1221.0321.6
4695.60000
343.3290.1399.1468.3330.6294.7351.6
47.8174.2
2699.800000.7
159.3345.3154.7
11.4671.5
0000
8432.20000
2.146.119.2
1.79.7
51.670.068.464.863.680.285.652.226.758.4
0000
10.911.127.6
6.15.4
11.213.7
8.31.26.500000.00.20.92.40.20.400003.50000
514.816.6
9.414.836.510.0
8.26.8
25.04.7
11.06.64.03.06.80000
18.78.16.49.1
10.613.0
8.79.76.9
10.30000
408.81.21.02.3
13.32.000008.80000
18.7493.7113.3
52.8678.6217.2
1273.71534.1
316.11097.9
719.1831.5
2355.5468.1
8813.10000
646.8559.8779.1906.9641.3571.6499.0
74.6237.1
4916.100001.0
206.6442.5167.2
11.5828.8
0000
15236.70000
1.201.961.831.491.861.942.061.921.821.931.931.631.931.461.88
0000
1.881.931.951.941.941.941.421.561.361.82
0000
1.451.301.281.081.011.23
0000
1.810000
2007 2007 2007 2007 2007 2007 2007
g.19 naturaL resources
CairoAlexandriaPort Said SuezUrban GovsDamiettaDakahliaShrkiaKalyoubiaKafr El SheikhGharbiaMenoufiaBeheraIsmailiaLower EgyptUrbanRuralGizaBeni SuefFayoumMeniaAssiutSuhagQenaLuxorAswanUpper EgyptUrbanRuralRed sea New valley MatrouhNorth SinaiSouth SinaiFrontier GovsUrbanRuralEGYPTUrbanRural
Land areaKm2
Populationdensity
(per Km2)*Thousandfeddans
as (%) of land area
Person per
feddanThousandfeddans
Crop cultivatedland ratio
Crop areaCultivated area**
* Average population density is estimated around 42286.7, 5392.9, 4048.3, 11322, 1491.3, 2212.3, 919.7, 940.8 per Km2 in Cairo, Giza, Kalyoubia, urban Govs, lower Egypt, upper Egypt, Frontier Govs and Egypt respectively . **New land area is estimated around 1925.6 thousand feddans and its crop area about 2955.3 thousand feddans.

Egypt Human Development Report 2010 { 273 }
31.525.824.427.3
0018.519.118.622.515.523.522.412.223.9
000000
16.713.011.7
9.617.816.917.827.223.6
000000
28.633.412.528.724.2
000000
20.50000
59.340.151.356.9
0053.335.221.444.823.340.831.213.740.5
000000
38.513.217.010.132.722.328.843.965.8
000000
20.336.721.352.868.3
000000
31.00000
15.79.33.54.9
12.61.10.91.82.70.10.90.90.61.61.20000
10.30.91.00.70.70.40.10.20.02.50000
2.10.00.70.61.80.90000
3.40000
31.222.839.244.8
0027.225.625.730.122.928.931.118.439.5
000000
23.417.218.415.024.520.530.334.338.7
000000
51.153.725.641.742.4
000000
25.60000
58.931.478.262.9
0064.035.724.741.126.336.732.412.450.4
000000
40.011.219.410.626.118.231.828.869.8
000000
75.840.534.874.075.0
000000
30.50000
15.17.57.2
14.712.233.614.1
9.520.0
9.012.810.7
7.811.312.6
00008.8
12.815.8
8.512.514.615.512.810.111.8
0000
12.84.3
10.57.3
10.29.00000
13.70000
1.31.86.20.81.70.71.01.26.33.40.91.52.11.92.000000.91.51.81.11.91.30.90.50.91.300001.80.41.12.21.01.100001.70000
15.824.119.316.318.728.350.440.134.455.141.545.681.633.049.4
0000
30.678.255.472.552.756.055.225.041.353.5
0000
20.946.239.241.532.036.2
0000
45.40000
2.71.82.00.52.39.0
33.813.716.533.032.652.7
0013.145.4
00008.4
99.419.167.615.621.946.4
4.74.0
42.4000000
57.1005.66.7
25.20000
37.60000
2008 2008 2007 2008 2008 2006 2006 2008 2008
g.20 DeveLoPMent ParticiPation
CairoAlexandriaPort Said SuezUrban GOVsDamiettaDakahliaShrkiaKalyoubiaKafr El SheikhGharbiaMenoufiaBeheraIsmailiaLower EgyptUrbanRuralGizaBeni SuefFayoumMeniaAssiutSuhagQenaLuxorAswanUpper EgyptUrbanRuralRed sea New valley MatrouhNorth SinaiSouth SinaiFrontier GovsUrbanRuralEGYPTUrbanRural
Females
Basic andSecondaryEnroll. in
private sector Total Females Total Females Total Females
Professional & technical staff (% of Labor
force (15+)
Employees in Gov., public sector & puplic entrprise sector (%) of total labor
force (15+)
Participation in Economic ActivitesWorker in Handcraft
activitiesWorker in
Informal sector
(%) of labor force + 15 (%) of labor force + 15
Total

{ 274 } Egypt Human Development Report 2010

{ 275 }Egypt Human Development Report 2010

{ 276 } Egypt Human Development Report 2010

{ 277 }Egypt Human Development Report 2010

{ 278 } Egypt Human Development Report 2010