02.20-21.2014, presentation, china coal market lookout 2014, fenwei energy consulting
TRANSCRIPT

China Coal Market Lookout 2014
Fenwei Energy Consulting
Feb 2014

Overview
2
1. China Coal Market Lookout
2. 2014 Coking Coal Price Movement
3. 2014 Thermal Coal Price Movement
1.1 China’s coal market has been in depression for two years1.2 End 2013 has seen high stockpile on ports1.3 Sluggish Economy drag down coal demand in 20141.4 factors that play roles in coal price movement
2.1 Supply demand fundamentals
2.2 2014 price forecast
3.1 supply demand fundamentals
3.2 2014 price forecast

3
Coal market running weak for 2 years
0
200
400
600
800
1000
1200 Centralized economy The ‘Golden Age’ Depression
1st wave of downturn
2nd wave of downturn
3rd wave
1st wave: ship charterers, middle-men loses profit2nd wave: truck contractor, checkpoints, and mines loses profit3rd wave: free competition sets the tune
Linear correlation
• Since 2003 China has witnessed the ‘golden age’ of coal trading thanks to the rapid economic growth, trade have been flourishing and prices have been elevating. During this period demand has always slightly exceeded supply.
• The ‘golden age’ is now history. Since 2012, coal industry struggled in turbulence, price kept dropping. 2014 will be spent in another wave of downturn.
Fig 1-1 thermal coal price movement (FOB QHD 5500 RMB/t)
Source: Fenwei

4
High stockpile drives prices low
0 100 200 300 400 500 600 700 800 900
1 000 threshold
• Inventory on Qinghuangdao (QHD) surged from 4.82 million tons (MT) of end 2013 to 8.42MT on 2nd Feb. From experience this is above threshold and prices will be driven down in due course
Fig 1-2 QHD stockpile (10,000t)
0
100
200
300
400
2014
0120
2014
0110
2013
1231
2013
1221
2013
1211
2013
1130
2013
1120
2013
1109
2013
1030
2013
1020
2013
1010
2013
0930
2013
0920
2013
0910
2013
0831
2013
0821
2013
0811
2013
0731
2013
0721
2013
0711
2013
0701
2013
0621
2013
0611
2013
0601
2013
0522
2013
0512
2013
0501
2013
0421
2013
0411
2013
0401
2013
0322
2013
0312
2013
0302
2013
0220
2013
0210
2013
0131
2013
0121
2013
0111
2013
0101
Fig 1-3 Jingtang old port stockpile (10,000t)• Inventory on Jingtang port, north China’s largest coking coal terminal, is increasing
Source: Fenwei
5
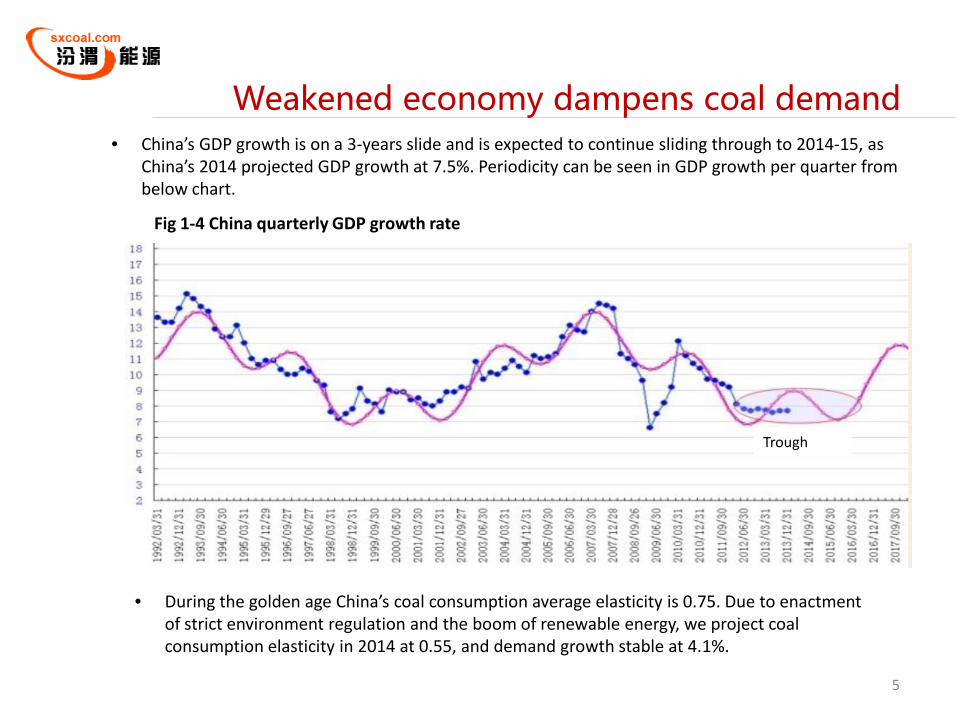
Trough
Fig 1-4 China quarterly GDP growth rate
Weakened economy dampens coal demand• China’s GDP growth is on a 3-years slide and is expected to continue sliding through to 2014-15, as
China’s 2014 projected GDP growth at 7.5%. Periodicity can be seen in GDP growth per quarter from below chart.
• During the golden age China’s coal consumption average elasticity is 0.75. Due to enactment of strict environment regulation and the boom of renewable energy, we project coal consumption elasticity in 2014 at 0.55, and demand growth stable at 4.1%.

6
Factor Matrix
Basis Description Outcome
1 Macro Economy
• Macro continues to gloom, expected GDP retracts• Industry sectors remain unchanged, no significant sign of
recovery
• Downstream demand for coal (i.e. real estate, electricity) stays flat
2 Policy • Tentative resource tax was tossed around but industry had mixed opinion
• Shanxi, Shaanxi and Inner Mongolia introduces stimulus package for coal sale
• Tax reform will be introduced in 2014• Price volatility due to policy changes, lives of
small coal mine becomes more difficult
3 FAI • The golden age is history, decreasing margin means less investment
• Previously invested coal mines enters the market。
• As production capacity increase, capital will move on to find its next target
4 Transport • Multiple railways and highways under construction. As they begins operation the transport bottleneck will be eased in 2014
• Transport cost reduces on average, but long distant transport will still be a large portion of the cost
5 Safety • Spontaneous events • No long-term impact on prices
6 Cost • Cost will continue to reduce as producers strive to do so • About 5yuan/ton cos decrease in Shanxi 2014
7 Import • Policy will encourage import • Low cost, good quality make import ideal for coastal areas of China
8 EnergySector
• Nat Gas, Coal Bed Methane will catch up in energy mix • Coal will dictate as primary energy source

Overview
7
1. China Coal Market Lookout
2. 2014 Coking Coal Price Movement
3. 2014 Thermal Coal Price Movement
1.1 China’s coal market has been in depression for two years1.2 End 2013 has seen high stockpile on ports1.3 Sluggish Economy drag down coal demand in 20141.4 factors that play roles in coal price movement
2.1 Supply demand fundamentals
2.2 2014 price forecast
3.1 supply demand fundamentals
3.2 2014 price forecast

8
Demand Supply Fundamentals
• In 2013, China produced 476MT of coke, equivalent to 620MT of coking coal consumption.
• As China upgrades to a higher grade steel furnace , blend ratio of strong-caking coal increased to cope with relevant coke requirement. in 2013, overall strong-sticking coal blend ratio is 63%.
• We predict coke production in 2014 to be 505MT, correspond to 656MT of coking coal. We also foresee the blend ratio for strong-caking coal increase to 64%.
Source: Fenwei
4000
4200
4400
4600
4800
5000
5200
5400
5600
Jan Feb Mar April May June July Aug Sep Oct Nov Dec
2012 201310,000t
Fig 2-1 2012-13 China Coking Coal Consumption (104)
Table 1-1 2013 China Coking Coal blend ratio
JM FM SM QFM 1/3JM QM Other
Blend Ratio 33% 10.8% 6.5% 6.8% 19% 16% 6.9%
Consumption(104) 20550 6725 4048 4234 11832 9964 4682
Source: Fenwei

9
Demand Supply Fundamentals
Fig 2-2 2008-13 Coking Coal Production by sub-category (104)
• In 2013, China’s coking coal production totaled 564MT, calculated by raw production per sub-class, wash rate and yield rate. Amongst this, Shanxi province alone has produced 177MT, or 31.37%.
• In 2014, China’s output capacity will witness another year of rapid increase as new mines enter production. Fenwei predicts a 60MT capacity increase in 2014, reaching 1.59 billion overall. Raw production will reach 1.49 billion and refined coking coal production estimated at 576MT, or 2% increase.
Source: Fenwei, Bureau of coal safety
44712 44773 48955
53861 54671 56463
0
10000
20000
30000
40000
50000
60000
2008年 2009年 2010年 2011年 2012年 2013年
PSM SM JM FM 1/3 JM QF coal QM Total

10
Demand Supply FundamentalsTable 1-2 2009-13 Coking Coal export and import (104)
• China is now a net importer of coking coal. In 2013, the import number is 75.4MT, meaning a y-o-y increase of 40.78%. This is much higher than the CAGR of 21.59% over the previous 4 years.
• Export however is suppressed. 2013 has seen 1MT of export, leveled with the 2012 number but lowered from 2011’s 3.59MT.
• In complement of ample supply of weak-caking coal, China is importing an increasing volume of strong-caking coal. As domestic supply of strong-caking coal remain shorthanded, this trend is expected to continue, with net import reaching around 95MT or 28% increase in 2014.
Year 2009 2010 2011 2012 2013
Import 3449 4727 4466 5355 7539
Export 64 114 359 131 109
Fig 1-2 2013 China coking coal import by country
Fig 1-3 2013 China Coking coal export by country
Source: NBS
40%
20%
15%
11%
8%
4% 2%Australia
Mongolia
Canada
Russia
USA
Indonesia
Others
41,25%
11,42%
47,02%
0,00% 0,31%
Japan
N. Korea
S. Korea
Canada
Russia

11
Supply vs DemandTable 1-3 2009-13 Coking Coal Supply vs Demand (108)
• In 2013, China’s coking coal supply exceeded 638MT, split between 88% of produced and 12% imported. Demand reached 620MT. This suggests an slightly over-supply situation.
• As of 2014, because of newly operating mines, the supply is growing steadily whereas rate of demand growth is losing speed. Our forecasted gap from its supply is 15MT.
Source: Fenwei
2009 2010 2011 2012 2013 2014E
Supply Side
Production 4.48 4.89 5.39 5.47 5.64 5.76
Net Import 0.334 0.459 0.414 0.527 0.739 0.95
Net availability 4.81 5.35 5.80 5.60 6.38 6.71
Demand Side 4.72 5.37 5.63 5.45 6.20 6.56
Margin 0.09 -0.02 0.17 0.15 0.18 0.15

‹#›

Overview
13
1. China Coal Market Lookout
2. 2014 Coking Coal Price Movement
3. 2014 Thermal Coal Price Movement
1.1 China’s coal market has been in depression for two years1.2 End 2013 has seen high stockpile on ports1.3 Sluggish Economy drag down coal demand in 20141.4 factors that play roles in coal price movement
2.1 Supply demand fundamentals
2.2 2014 price forecast
3.1 supply demand fundamentals
3.2 2014 price forecast

14
Demand Supply FundamentalsFig 3-1 2008-13 thermal coal consumption and growth (108)
• China’s thermal coal consumption has increased from 2008 with CAGR 9.5%.
• In 2013, China’s thermal coal consumption is 3.42BT. Share of electricity is 61%. Building material usage decreased by 1% to 22%. Civil use is also on the down side.
• As economic couldn’t rally in 2014, especially with real estate industry rolling downhill, coal consumption cannot sustain current growth rate. We predict 2014 thermal coal consumption to be 3.54BT, or 3.5% y-o-y increase.
Fig 3-2 2013 coal consumption by industry
Source: Fenwei
Electricity61%
Building Material
22%
Chemical5%
Metallurgy4% Others
8%
21,6924,82
28,7232,09
34,11 34,2214,43% 15,71%
11,73%
6,29%
0,32%0,00%
2,00%
4,00%
6,00%
8,00%
10,00%
12,00%
14,00%
16,00%
18,00%
0
5
10
15
20
25
30
35
40
2008 2009 2010 2011 2012 2013
Consumption Growth Rate
Source: Fenwei

‹#›

16
Demand Supply FundamentalsTable 2-1 2009-13 thermal coal export/import (108)
• According to NBS, China imported thermal coal 252MT in 2013, up 6.8% y-o-y; exported 6.34MT, making China the net importer of 246MT throughout the year.
• China thermal coal import has been inclining since 2009, with CAGR 29%.
• For policy reasons, China’s export has been on the decline each year.
• Fenwei expect China’s GDP growth rate stables at 7.5%, and net import volume up to 265MT.
Year 2009 2010 2011 2012 2013 Import 0.91 1.19 1.82 2.36 2.52 Export 0.22 0.18 0.11 0.08 0.06
5,3% 6,6%5,3%
23,2%
7,6%
48,4%
3,6%
Fig 3-4 2013 China thermal coal import
42,9%
42,1%
14,0%
1,0%
Fig 3-5 2013 China thermal coal export
Source: NBS
South AfricaN. KoreaVietnamAustraliaRussiaIndonesiaOthers
JapanS. KoreaTaiwanOthers

17
Supply vs DemandTable 2-2 2008-13 thermal coal fundamentals (108)
• China’s total 2013 supply was 3.49BT with a 93% to 7% spread between domestic and import. Total demand was 3.32 billion tons. It’s a slightly over-supplied situation.
• As of 2014, because of new mines were put in operation, the supply is growing steadily whereas rate of demand growth is losing speed. Over-supplied situation will be the topic of 2014, with a 62MT margin.
Source: Fenwei
2008 2009 2010 2011 2012 2013 2014E
Supply side
Production 21.8 24.1 27.1 29.9 31.8 32.4 33.38
Net import -0.02 0.69 1.19 1.67 2.27 2.46 2.65
Net availability 21.78 24.79 28.29 31.57 34.07 34.86 36.03
Demand side 21.69 24.82 28.72 32.09 34.11 34.22 35.41
Margin 0.09 -0.03 -0.43 -0.52 -0.44 0.64 0.62

‹#›

19
About Fenwei• Established in 1998, Fenwei is based in Taiyuan, Shanxi. Fenwei is China’s premier expert in coal, coke,
coal bed methane, coal chemical and other forms of energy.
• Consulting: tailored reports on investment valuation, feasibility studies, market studies, and solutions etc.
• Information: China’s largest and quickest go-to platform for any coal related data – www.sxcoal.com
• Outsourcing: management outsource, coke plant outsource, wash plant outsource, mine outsource etc.
• Reports: Weekly, monthly, yearly, tailored etc.
• Mine database: capacity, status, coal quality data on more than 13,000 coal mines nationwide.
• Coal database: coal composition and coal seams data f 98 l t l fi ld i Chi
Fenwei
Information Consulting Outsourcing
Databases
Analysis and maths models
reports
20
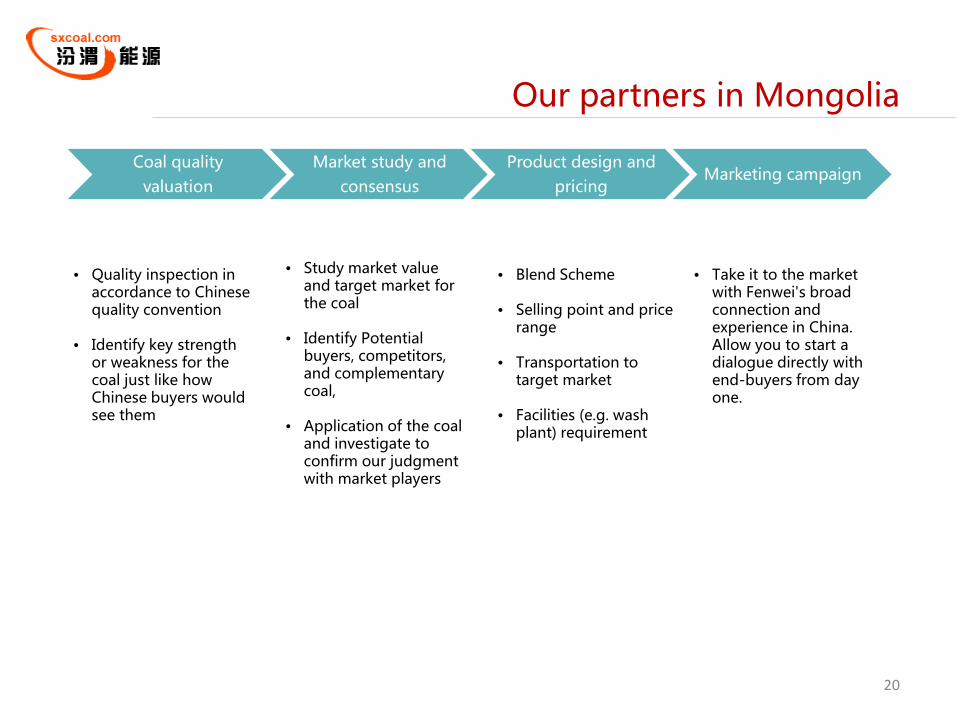
Coal quality valuation
Market study and consensus
Product design and pricing
Marketing campaign
Our partners in Mongolia
• Quality inspection in accordance to Chinese quality convention
• Identify key strength or weakness for the coal just like how Chinese buyers would see them
• Study market value and target market for the coal
• Identify Potential buyers, competitors, and complementary coal,
• Application of the coal and investigate to confirm our judgment with market players
• Blend Scheme
• Selling point and price range
• Transportation to target market
• Facilities (e.g. wash plant) requirement
• Take it to the market with Fenwei's broad connection and experience in China. Allow you to start a dialogue directly with end-buyers from day one.
Building No.4,Forest Park, East Binhe Road
Taiyuan, Shanxi, PRC (030003)
山西省太原市滨河东路 滨河东路森林公园4号楼
(030003)
Tel.: +86 351 3844955 电话:+86 351 3844955
Fax: +86 351 4728543 传真:+86 351 4728543
www.fwenergy.comwww.sxcoal.com
www.fwenergy.comwww.sxcoal.com
The End