0259 cover.indd 1 3/18/14 10:34 am · proposal 4—nonbinding shareholder proposal regarding...
TRANSCRIPT

0259_Cover.indd 1 3/18/14 10:34 AM

In 2013, we celebrated our 20th year the best way we
know how–by growing our brand, both domestically
and internationally. We opened 30 new restaurants
systemwide in 2013, generating growth for our people
and providing solid returns for our shareholders. We
were also named one of the Top 50 Best Places to Work!
By staying true to our proven operating model, we grew
both sales and traffic counts at our existing restaurants
for the fourth straight year. Thanks to our Managing
Partners, sales at existing restaurants increased 3.4% for
the year. This, combined with new restaurant openings
and a little help from having an extra operating week
in 2013, led to double digit growth in both revenues
and earnings. We also continued to return cash to our
shareholders through cash dividends and repurchasing
shares of our stock.
Our 2013 results included:
• Over $1.4 billion in revenue, 13% higher than 2012,
driven by an increase in operating weeks, resulting
from new restaurant openings as well as the additional
week in our fiscal year, along with sales growth at
existing restaurants.
• We opened 26 company restaurants and our franchise
partners opened four restaurants.
• Restaurant margins, as a percentage of restaurant
sales, decreased 52 basis points to 17.9%, primarily
due to 7% food cost inflation.
• Diluted earnings per share grew 13%.
• We paid $46.9 million in dividends.
• We repurchased 461,600 shares of our common stock.
Operationally, we remain committed to our partnership-
based operating model, serving made-from-scratch food,
our value position and growing our brand. Growth is
good for everyone associated with Texas Roadhouse as it
creates new jobs, new opportunities and good returns for
our shareholders.
Heading into 2014, we continue to feel very confident
about the opportunities for the Texas Roadhouse brand.
Domestically, we are targeting 25 to 30 new locations
for the year. On the international front, we expect our
franchise partners to open four to five locations in 2014
and we are excited about a newly signed agreement to
develop restaurants in Taiwan.
We anticipate that food cost inflation in 2014 will
be in the low single-digit range compared to the 6 to 7%
increases we have experienced each of the last
two years. We are optimistic that lower inflation this
year, combined with growth in sales, will help our
restaurants continue to make more money than they
did the year before.
Speaking of making money, we expect to once again
generate enough cash from operations to pay for the
development of new restaurants and the maintenance of
existing ones. As such, we expect to continue paying a
dividend, which our Board of Directors just increased by
25%. We also plan to continue buying back shares of our
own stock. Overall, we plan to maintain a conservative
balance sheet, which at the end of 2013 included $95
million of cash and $51 million of debt.
In conclusion, I want to thank our shareholders for your
continued support and trust in Texas Roadhouse. And, a
huge thanks to the 45,000 plus team members who make
Legendary Food, Legendary Service happen each and
every day, for each and every guest. Their commitment
and passion is second to none, and I am honored to be
their partner. Now, let’s kick some butt and have some
fun in 2014….after all, we are finally legal after turning
21 in February!
W. Kent Taylor
Founder & Chairman, Chief Executive Officer
Support Center (Corporate Office)6040 Dutchmans Lane • Louisville, KY 40205(800) TEX-ROAD (839-7623)
Annual MeetingThursday, May 22, 2014 9am ESTTexas Roadhouse Support Center6040 Dutchmans Lane • Louisville, KY 40205
Stock ListingTexas Roadhouse, Inc. Common Stock is listed on the NASDAQ Stock Exchange under the symbol TXRH.
Transfer AgentComputershareP.O. Box 30170 • College Station, TX 77842-3170Phone (800) 622-6757
Financial InquiriesFor additional financial documents and information, please visit our website at www.texasroadhouse.com. Please contact us by phone at (502) 515-7300 or by sending an e-mail to [email protected].
Media InquiriesFor all media requests please contact Travis Dosterat (502) 638-5457.
Independent AuditorsKPMG LLP400 W. Market Street, Suite 2600 • Louisville, KY 40202Phone (502) 587-0535
Gregory N. Moore Former Senior Vice President, ControllerYum! Brands, Inc.
James F. ParkerFormer Chief Executive Officer, Vice-Chairman of the BoardSouthwest Airlines Co.
James R. RamseyPresidentUniversity of Louisville
Kathleen M. WidmerExecutive Vice President, Chief Marketing OfficerElizabeth Arden, Inc.
James R. ZarleyChief Executive OfficerValueClick, Inc.
W. Kent TaylorFounder & Chairman, Chief Executive OfficerTexas Roadhouse, Inc.
0259_Cover.indd 2 3/18/14 10:35 AM

21APR200520054077
16MAR201217593025
April 11, 2014
To our Shareholders:
You are cordially invited to attend the 2014 Annual Meeting of Shareholders of TexasRoadhouse, Inc. on Thursday, May 22, 2014. The meeting will be held at the Texas Roadhouse SupportCenter, 6040 Dutchmans Lane, Louisville, Kentucky at 9:00 a.m. eastern daylight time.
The official Notice of Annual Meeting, Proxy Statement and Proxy Card are enclosed with thisletter.
Please take the time to read carefully each of the proposals for shareholder action described in theaccompanying proxy materials. Whether or not you plan to attend, you can ensure that your shares arerepresented at the meeting by promptly completing, signing and dating your proxy card and returning itin the enclosed postage-paid envelope. Shareholders of record can also vote by touch-tone telephonefrom the United States, using the toll-free number on the proxy card, or by the Internet, using theinstructions on the proxy card. If you attend the meeting, you may revoke your proxy and vote yourshares in person.
Your interest and participation in the affairs of the Company are greatly appreciated. Thank youfor your continued support.
Sincerely,
W. Kent TaylorChairman, Chief Executive Officer

16MAR201217592224
TEXAS ROADHOUSE, INC.6040 Dutchmans Lane
Louisville, Kentucky 40205
NOTICE OF ANNUAL MEETING OF SHAREHOLDERSTO BE HELD MAY 22, 2014
To the Shareholders:
The Annual Meeting of Shareholders (the ‘‘Annual Meeting’’) of Texas Roadhouse, Inc. (the‘‘Company’’) will be held at the Texas Roadhouse Support Center, 6040 Dutchmans Lane, Louisville,Kentucky on Thursday, May 22, 2014 at 9:00 a.m. eastern daylight time.
At the Annual Meeting you will be asked to:
• elect two Class I directors to the Board of Directors, each for a term of three years;
• ratify the appointment of KPMG LLP as the Company’s independent auditors;
• hold an advisory vote on executive compensation;
• vote on a non-binding shareholder proposal to eliminate the classification of the Board ofDirectors, if properly presented at the meeting; and
• transact such other business as may properly come before the meeting.
A Proxy Statement describing matters to be considered at the Annual Meeting is attached to thisnotice. Only shareholders of record at the close of business on March 24, 2014 are entitled to receivenotice of and to vote at the meeting.
By Order of the Board of Directors,
Celia CatlettGeneral Counsel and Corporate Secretary
Louisville, KentuckyApril 11, 2014
IMPORTANT
WHETHER OR NOT YOU EXPECT TO BE PRESENT AT THE MEETING, PLEASE SUBMITYOUR VOTE USING ONE OF THE VOTING METHODS DESCRIBED IN THE ATTACHED
MATERIALS. IF YOU ATTEND THE MEETING, YOU MAY REVOKE YOUR PROXY AND VOTEYOUR SHARES IN PERSON.
IMPORTANT NOTICE REGARDING THE AVAILABILITY OF PROXY MATERIALS FOR THE 2014ANNUAL MEETING OF SHAREHOLDERS TO BE HELD ON MAY 22, 2014
Our Proxy Statement related to our 2014 Annual Meeting of Shareholders, our Annual Report onForm 10-K for the fiscal year ended on December 31, 2013 and our Annual Report to Shareholders forthe fiscal year ended on December 31, 2013 are available on our website at www.texasroadhouse.com inthe Investors section.

Table of Contents
SUMMARY OF MATTERS REQUIRING SHAREHOLDER ACTION . . . . . . . . . . . . . . . . . . . . . 1Proposal 1—Election of Directors . . . . . . . . . . . . . . . . . . . . . . . . . . . . . . . . . . . . . . . . . . . . . . 1Proposal 2—Ratification of Appointment of Independent Auditors . . . . . . . . . . . . . . . . . . . . . . 1Proposal 3—Advisory Vote on Approval of Executive Compensation . . . . . . . . . . . . . . . . . . . . . 1Proposal 4—Nonbinding Shareholder Proposal Regarding Declassification of the Board of
Directors . . . . . . . . . . . . . . . . . . . . . . . . . . . . . . . . . . . . . . . . . . . . . . . . . . . . . . . . . . . . . . 2Other Matters . . . . . . . . . . . . . . . . . . . . . . . . . . . . . . . . . . . . . . . . . . . . . . . . . . . . . . . . . . . . 2
INFORMATION ABOUT PROXIES AND VOTING . . . . . . . . . . . . . . . . . . . . . . . . . . . . . . . . . . 3Record Date and Voting Securities . . . . . . . . . . . . . . . . . . . . . . . . . . . . . . . . . . . . . . . . . . . . . 3Revocability of Proxies . . . . . . . . . . . . . . . . . . . . . . . . . . . . . . . . . . . . . . . . . . . . . . . . . . . . . . 3Solicitation of Proxies . . . . . . . . . . . . . . . . . . . . . . . . . . . . . . . . . . . . . . . . . . . . . . . . . . . . . . . 3Other Voting Considerations . . . . . . . . . . . . . . . . . . . . . . . . . . . . . . . . . . . . . . . . . . . . . . . . . . 3
CORPORATE GOVERNANCE AND OUR BOARD . . . . . . . . . . . . . . . . . . . . . . . . . . . . . . . . . . . 5Director Biographies . . . . . . . . . . . . . . . . . . . . . . . . . . . . . . . . . . . . . . . . . . . . . . . . . . . . . . . 5Meeting of the Board of Directors . . . . . . . . . . . . . . . . . . . . . . . . . . . . . . . . . . . . . . . . . . . . . 6Leadership Structure of the Board and the Role of the Board in Risk Oversight . . . . . . . . . . . . 7Committees of the Board . . . . . . . . . . . . . . . . . . . . . . . . . . . . . . . . . . . . . . . . . . . . . . . . . . . . 8Policy Regarding Consideration of Candidates for Director . . . . . . . . . . . . . . . . . . . . . . . . . . . . 9Compensation of Directors . . . . . . . . . . . . . . . . . . . . . . . . . . . . . . . . . . . . . . . . . . . . . . . . . . . 10Code of Conduct . . . . . . . . . . . . . . . . . . . . . . . . . . . . . . . . . . . . . . . . . . . . . . . . . . . . . . . . . . 10
STOCK OWNERSHIP INFORMATION . . . . . . . . . . . . . . . . . . . . . . . . . . . . . . . . . . . . . . . . . . . 11Section 16(a) Beneficial Ownership Reporting Compliance . . . . . . . . . . . . . . . . . . . . . . . . . . . . 13
EXECUTIVE COMPENSATION . . . . . . . . . . . . . . . . . . . . . . . . . . . . . . . . . . . . . . . . . . . . . . . . 14Compensation Discussion and Analysis . . . . . . . . . . . . . . . . . . . . . . . . . . . . . . . . . . . . . . . . . . 14Summary Compensation Table . . . . . . . . . . . . . . . . . . . . . . . . . . . . . . . . . . . . . . . . . . . . . . . . 21Grants of Plan-Based Awards in Fiscal Year 2013 . . . . . . . . . . . . . . . . . . . . . . . . . . . . . . . . . . 22Outstanding Equity Awards . . . . . . . . . . . . . . . . . . . . . . . . . . . . . . . . . . . . . . . . . . . . . . . . . . 24Options Exercised and Stock Vested . . . . . . . . . . . . . . . . . . . . . . . . . . . . . . . . . . . . . . . . . . . . 25Termination, Change of Control and Change of Responsibility Payments . . . . . . . . . . . . . . . . . . 25
AUDIT COMMITTEE REPORT . . . . . . . . . . . . . . . . . . . . . . . . . . . . . . . . . . . . . . . . . . . . . . . . 28Related Transactions . . . . . . . . . . . . . . . . . . . . . . . . . . . . . . . . . . . . . . . . . . . . . . . . . . . . . . . 29
PRESENTATION OF PROPOSALS . . . . . . . . . . . . . . . . . . . . . . . . . . . . . . . . . . . . . . . . . . . . . . 32Proposal 1—Election of Directors . . . . . . . . . . . . . . . . . . . . . . . . . . . . . . . . . . . . . . . . . . . . . . 32Proposal 2—Ratification of Appointment of Independent Auditors . . . . . . . . . . . . . . . . . . . . . . 33Proposal 3—Advisory Vote on Approval of Executive Compensation . . . . . . . . . . . . . . . . . . . . . 34Proposal 4—Nonbinding Shareholder Proposal Regarding Declassification of the Board of
Directors . . . . . . . . . . . . . . . . . . . . . . . . . . . . . . . . . . . . . . . . . . . . . . . . . . . . . . . . . . . . . . 35SHAREHOLDER PROPOSALS . . . . . . . . . . . . . . . . . . . . . . . . . . . . . . . . . . . . . . . . . . . . . . . . . 37SHAREHOLDERS’ COMMUNICATIONS WITH THE BOARD . . . . . . . . . . . . . . . . . . . . . . . . . . 37FORM 10-K . . . . . . . . . . . . . . . . . . . . . . . . . . . . . . . . . . . . . . . . . . . . . . . . . . . . . . . . . . . . . . . 37OTHER BUSINESS . . . . . . . . . . . . . . . . . . . . . . . . . . . . . . . . . . . . . . . . . . . . . . . . . . . . . . . . . 38

TEXAS ROADHOUSE, INC.6040 Dutchmans Lane
Louisville, Kentucky 40205
PROXY STATEMENT
ANNUAL MEETING OF SHAREHOLDERSTO BE HELD MAY 22, 2014
This proxy statement and accompanying proxy card are being furnished in connection with thesolicitation of proxies by the board of directors (the ‘‘Board’’) of Texas Roadhouse, Inc., a Delawarecorporation, to be voted at the Annual Meeting of Shareholders (the ‘‘Annual Meeting’’) and anyadjournments thereof. In this proxy statement, references to the ‘‘Company,’’ ‘‘we,’’ ‘‘us’’ or ‘‘our’’ referto Texas Roadhouse, Inc. This proxy statement and accompanying proxy card are first being mailed toshareholders on or about April 11, 2014.
The Annual Meeting will be held at the Texas Roadhouse Support Center, Louisville, Kentucky onThursday, May 22, 2014 at 9:00 a.m. eastern daylight time, for the purposes set forth in this proxystatement and the accompanying notice of Annual Meeting.
SUMMARY OF MATTERS REQUIRING SHAREHOLDER ACTION
Proposal 1—Election of Directors
The affirmative vote of a plurality of the votes entitled to be cast by the holders of the Company’scommon stock present in person or represented by proxy is required to elect each nominee. Election bya plurality means that the director nominees with the most votes for the available slots are elected forthose slots. You may vote ‘‘FOR’’ all of the nominees or you may ‘‘WITHHOLD AUTHORITY’’ tovote for one or more specifically named nominees. Unless you ‘‘WITHHOLD AUTHORITY’’ to votefor one or more nominees, your proxy will be voted ‘‘FOR’’ the election of the individuals nominatedas Class I directors.
Our Board has adopted a majority voting policy for uncontested director elections. Under thispolicy, any nominee who receives fewer ‘‘FOR’’ votes than ‘‘WITHHOLD’’ votes is required to offerhis or her resignation. Our nominating and corporate governance committee would then consider theoffer of resignation and make a recommendation to our independent directors as to the action to betaken with respect to the offer.
The Board recommends that you vote ‘‘FOR’’ all of the nominees.
Proposal 2—Ratification of the Appointment of the Company’s Independent Auditors
The proposal to ratify the appointment of KPMG LLP as the Company’s independent auditors forthe fiscal year ending December 30, 2014 must be approved by the affirmative vote of a majority of theshares present (in person or by proxy) and entitled to vote. You may vote ‘‘FOR’’ or ‘‘AGAINST’’ theratification, or you may ‘‘ABSTAIN’’ from voting on this proposal. A vote to ‘‘ABSTAIN’’ will have thesame effect as a vote ‘‘AGAINST’’ this proposal.
The Board recommends that you vote ‘‘FOR’’ this proposal.
Proposal 3—Advisory Vote on Approval of Executive Compensation
The outcome of the advisory vote on whether to approve the executive compensation detailed inthis proxy statement (including the Compensation Discussion and Analysis, the ExecutiveCompensation section and the other related executive compensation tables and related discussions) will
1

be determined by the affirmative vote of a majority of the shares present (in person or by proxy) andentitled to vote. You may vote ‘‘FOR’’ or ‘‘AGAINST’’ approval of the executive compensation, or youmay ‘‘ABSTAIN’’ from voting on this proposal. A vote to ‘‘ABSTAIN’’ will have the same effect as avote ‘‘AGAINST’’ approval of the executive compensation.
The Board recommends that you vote ‘‘FOR’’ this proposal.
Proposal 4—Nonbinding Shareholder Proposal Regarding Declassification of the Board of Directors
The outcome of the advisory vote on whether to declassify the Board of Directors will bedetermined by the affirmative vote of a majority of the shares present (in person or by proxy) andentitled to vote. You may vote ‘‘FOR’’ or ‘‘AGAINST’’ approval of declassification, or you may‘‘ABSTAIN’’ from voting on this proposal. A vote to ‘‘ABSTAIN’’ will have the same effect as a vote‘‘AGAINST’’ approval of the shareholder proposal.
The Board recommends that you vote ‘‘AGAINST’’ this proposal.
Other Matters
As of the date of this proxy statement, the Board knows of no matters that will be presented forconsideration at the Annual Meeting other than those matters discussed in this proxy statement. If anyother matters should properly come before the Annual Meeting and call for a vote of shareholders,validly executed proxies in the enclosed form returned to us will be voted in accordance with therecommendation of the Board, or, in the absence of such a recommendation, in accordance with thejudgment of the proxy holders. Any such additional matter must be approved by an affirmative vote ofa majority of the shares present (in person or by proxy) and entitled to vote at the Annual Meeting.
2

INFORMATION ABOUT PROXIES AND VOTING
Record Date and Voting Securities
The Board has fixed the record date (the ‘‘Record Date’’) for the Annual Meeting as the close ofbusiness on March 24, 2014. Only shareholders of record at the close of business on the Record Datewill be entitled to vote at the Annual Meeting and at any adjournment or postponement thereof. Atthe close of business on the Record Date, there were outstanding 69,836,493 shares of common stock,each of which is entitled to one vote per share on all matters to be considered at the Annual Meeting.
The presence in person or by proxy of the holders of a majority of the shares of common stockwill constitute a quorum for the transaction of business at the Annual Meeting. Shares of commonstock represented by properly executed proxies received before the close of voting at the AnnualMeeting will be voted as directed by such shareholders, unless revoked as described below.
Revocability of Proxies
A shareholder who completes and returns the proxy card that accompanies this proxy statementmay revoke that proxy at any time before the closing of the polls at the Annual Meeting. Ashareholder may revoke a proxy by voting at a later date by one of the methods described on the proxycard or by filing a written notice of revocation with, or by delivering a duly executed proxy bearing alater date to, the Corporate Secretary of the Company at the Company’s main office address at anytime before the Annual Meeting. Shareholders may also revoke proxies by delivering a duly executedproxy bearing a later date to the inspector of election at the Annual Meeting before the close of votingor by attending the Annual Meeting and voting in person. You may attend the Annual Meeting eventhough you have executed a proxy, but your presence at the Annual Meeting will not automaticallyrevoke your proxy.
Solicitation of Proxies
The cost of solicitation of proxies being solicited on behalf of the Board will be borne by us. Inaddition to solicitation by mail, proxies may be solicited personally, by telephone or other means by ourdirectors, officers or employees, who receive no additional compensation for these solicitation activities.We will, upon request, reimburse brokerage houses and persons holding common stock in the names oftheir nominees for their reasonable out-of-pocket expenses in sending materials to their principals.
Other Voting Considerations
Broker Non-Votes
Under rules of the New York Stock Exchange, matters subject to shareholder vote are classified as‘‘routine’’ or ‘‘non-routine.’’ In the case of routine matters, brokers may vote shares held in ‘‘streetname’’ in their discretion if they have not received voting instructions from the beneficial owner. In thecase of non-routine matters, brokers may not vote shares unless they have received voting instructionsfrom the beneficial owner (‘‘broker non-votes’’); therefore, it is important that you complete and returnyour proxy early so that your vote may be recorded.
The election of directors (Proposal 1) is a non-routine matter under the applicable rules, so brokernon-votes may occur. However, broker non-votes do not count as shares entitled to vote. Because theelection is decided by a plurality of shares present (in person or by proxy) and entitled to vote at theAnnual Meeting, and because our majority voting policy for directors only considers ‘‘FOR’’ votes and‘‘WITHHOLD’’ votes, any broker non-votes will not affect the outcome of this proposal.
The ratification of the appointment of the Company’s independent auditors (Proposal 2) is aroutine matter under the applicable rules, so broker non-votes should not occur. In addition, because
3

this matter is routine and brokers may vote as stated above, the number of votes cast, plus the numberof abstentions, on this Proposal 2 will be used to establish whether a quorum is present.
The advisory vote on the approval of executive compensation (Proposal 3), the advisory vote onboard declassification (Proposal 4), and any other matters that may properly come before the AnnualMeeting are also non-routine matters under the applicable rules, so broker non-votes may occur.Because broker non-votes do not count as shares entitled to vote, they do not affect the outcome ofthe vote on these proposals.
Abstentions
Abstentions will be counted for purposes of calculating whether a quorum is present. The effect ofan abstention on each proposal where ‘‘ABSTAIN’’ is a voting choice is discussed above.
Executed but Unmarked Proxies
If no instructions are given, shares represented by properly executed but unmarked proxies will bevoted in accordance with the recommendation of the Board, or, in the absence of such arecommendation, in accordance with the judgment of the proxy holders.
4

CORPORATE GOVERNANCE AND OUR BOARD
Director Biographies
Class I Directors (Terms Expiring at the 2014 Annual Meeting):
James R. Ramsey. Dr. Ramsey, 65, is the president of the University of Louisville, a position hehas held since September 2002. Before becoming president, he served as senior policy advisor and statebudget director for the Commonwealth of Kentucky as well as senior professor of economics and publicpolicy at the University of Louisville since 1999. Dr. Ramsey has held numerous academic positions,including serving as vice chancellor for finance and administration at both the University of NorthCarolina at Chapel Hill and Western Kentucky University. He has been associate dean, assistant deanand director of public administration in the College of Business Administration at Loyola Universityand a research associate for the University of Kentucky’s Center for Public Affairs. He has served onthe faculties of the University of North Carolina at Chapel Hill, Western Kentucky University, theUniversity of Kentucky, Loyola University and Middle Tennessee State University in addition to theUniversity of Louisville. Dr. Ramsey has also held a number of positions in state government, includinginterim commissioner of the Office of the New Economy and special advisor to the chairman of theKentucky Council on Postsecondary Education. Dr. Ramsey serves on the board of directors and chairsthe audit committee of Community Trust Bancorp, Inc. He also serves on the board of trustees of theAquila Municipal Trust. Dr. Ramsey is being nominated as a director because of his chief executiveexperience, his financial and accounting experience and his government relations experience. As aresult of these and other professional experiences, Dr. Ramsey possesses particular knowledge andexperience that strengthens the Board’s collective qualifications, skills and experience.
James R. Zarley. Mr. Zarley, 69, currently serves as chairman of ValueClick, Inc., a single-sourceprovider of media, technology and services across major interactive marketing channels. He haspreviously served as chief executive officer and chairman of the board, and has been a member of theboard of directors of ValueClick since 1999. Mr. Zarley shaped the company into a global leader inonline marketing solutions. In May 2007, Mr. Zarley stepped down from the chief executive officer roleand became executive chairman to focus on the company’s corporate development program andEuropean operations. In April 2010, Mr. Zarley returned to the chief executive officer role. Prior tojoining ValueClick, Mr. Zarley was chief operating officer of Hiway Technologies, where he was aleading member of the management team that closed the merger with Verio in 1999. Prior to that,Mr. Zarley was chairman and chief executive officer of Best Internet until it merged with HiwayTechnologies in 1998. Mr. Zarley also founded and later sold Quantech Information Services, now anADP company. In addition, he spent 19 years at RCA in various senior management roles. Mr. Zarleyis being nominated as a director because of his chief executive experience in a developing industry, hisinformation technology experience and his experience in acquisitions. As a result of these and otherprofessional experiences, Mr. Zarley possesses particular knowledge and experience that strengthens theBoard’s collective qualifications, skills and experience.
Class II Directors (Terms Expiring at the 2015 Annual Meeting):
W. Kent Taylor. Mr. Taylor, 58, is our founder, Chairman, and Chief Executive Officer, a positionhe resumed in August 2011. Mr. Taylor previously served as Chief Executive Officer from 2000 until2004, at which time Mr. Taylor became Chairman of the Company, an executive position. Before hisfounding of our concept in 1993, Mr. Taylor founded and co-owned Buckhead Bar and Grill inLouisville, Kentucky. Mr. Taylor was appointed to the Board of Directors and the CompensationCommittee of Papa John’s International, Inc., in May 2011. Mr. Taylor was nominated as a directorbecause of his chief executive experience, his knowledge of the restaurant industry and his intimateknowledge of the Company as its founder. As a result of these and other professional experiences,Mr. Taylor possesses particular knowledge and experience that strengthens the Board’s collectivequalifications, skills and experience.
5

Class III Directors (Terms Expiring at the 2016 Annual Meeting):
Gregory N. Moore. Mr. Moore, 64, served as the Senior Vice President and Controller of Yum!Brands, Inc. until he retired in 2005. He is currently a Financial Consultant and private investor. Yum!Brands is the worldwide parent company of Taco Bell, KFC and Pizza Hut. Prior to becoming Yum!Brands’ Controller, Mr. Moore was the Vice President and General Auditor of Yum! Brands. Beforethat, he was with PepsiCo, Inc. and held the position of Vice President, Controller of Taco Bell andController of PepsiCo Wines & Spirits International, a division of PepsiCola International. Beforejoining PepsiCo, he was an Audit Manager with Arthur Young & Company in its New York City andStamford, Connecticut offices. Mr. Moore is a certified public accountant in the States of New Yorkand California. In July 2011, Mr. Moore joined the board of Newegg, Inc., a privately held on-lineretailer specializing in computer and computer-related equipment, and serves as the chair of both thecompensation committee and the audit committee and a member of the nominating committee.Mr. Moore also serves on the board and chairs the audit committee of 3 Day Blinds, a privatecompany, and serves on the board of EF&TRH Restaurants (HK) Holding Limited, a TexasRoadhouse, Inc. joint venture in China. Mr. Moore was nominated as a director because of hisextensive financial and accounting experience in the restaurant industry. As a result of these and otherprofessional experiences, Mr. Moore possesses particular knowledge and experience that strengthensthe Board’s collective qualifications, skills and experience.
James F. Parker. Mr. Parker, 67, retired as Chief Executive Officer and Vice-Chairman of theBoard of Southwest Airlines Co., a position he held from June 2001 through July 2004. Before servingat Southwest Airlines as Chief Executive Officer, Mr. Parker served as General Counsel of thatcompany from 1986 until June 2001, and was previously a shareholder in the San Antonio, Texas lawfirm of Oppenheimer, Rosenberg, Kelleher and Wheatley. Mr. Parker serves as a member of the boardof directors of Sammons Enterprises, Inc., a private company. Mr. Parker was nominated as a directorbecause of his chief executive experience, his knowledge of the value-based service industry and thesimilarity of cultures between Southwest Airlines and the Company. As a result of these and otherprofessional experiences, Mr. Parker possesses particular knowledge and experience that strengthensthe Board’s collective qualifications, skills and experience.
Kathleen M. Widmer. Ms. Widmer, 52, is currently the Executive Vice President and ChiefMarketing Officer of Elizabeth Arden, Inc., where she is responsible for the global growth strategy andmarketing execution of the Elizabeth Arden Brand as well as the company’s extensive portfolio offragrances. She is a graduate of the U.S. Military Academy in West Point, N.Y. and served for 5 yearsas a U.S. Army officer. She held positions of increasing responsibility in the Field Artillery, reachingthe rank of Captain and Battery Commander of a 400-soldier training unit in Fort Sill, Oklahoma.Ms. Widmer was nominated as a director by the Nominating and Corporate Governance Committeebecause of her extensive marketing experience in the retail sector and her knowledge of the globalretail industry. As a result of these and other professional experiences, Ms. Widmer possesses particularknowledge and experience that strengthens the Board’s collective qualifications, skills and experience.
Meetings of the Board of Directors
The Board met on seven occasions and its standing committees (audit committee, compensationcommittee, and nominating and corporate governance committee) met on 23 occasions during our fiscalyear ended December 31, 2013. Each incumbent director attended at least 75% of the aggregatenumber of meetings of the Board and its committees on which such director served during his or herperiod of service. In addition, the Company expects all members of the Board to attend the AnnualMeeting. All incumbent members attended the 2013 Annual Meeting. Four regular Board meetings arecurrently scheduled for the fiscal year 2014. Executive sessions of non-employee directors, withoutmanagement directors or employees present, are typically scheduled in conjunction with each regularlyscheduled Board meeting. The role of each standing committee is more fully discussed below.
6

Leadership Structure of the Board of Directors and Role of the Board of Directors in Risk Oversight
The Board currently includes five independent directors and one employee director, and thepositions of Chairman and Chief Executive Officer are occupied by the same individual. As notedabove, Mr. Taylor was named Chairman of the Board in recognition of his founding and continuingleadership role in the Company, and has held that position since 2004. Mr. Taylor also resumed theposition of Chief Executive Officer in August 2011. Mr. Taylor previously served as Chief ExecutiveOfficer from 2000 until 2004. We believe that the Company and its shareholders are best served byhaving Mr. Taylor serve in both positions because he is the person most familiar with our uniquebusiness model and the challenges we face in the current macro-economic environment. Mr. Taylor’swealth of knowledge regarding Company operations and the industry in which we compete positionshim to best identify matters for Board review and deliberation. Additionally, the combined role ofChairman and Chief Executive Officer unifies the Board with management and eliminates conflictbetween two leaders. We believe that the Company can more effectively execute its current strategy andbusiness plans to maximize shareholder value if our Chairman is also a member of the managementteam.
While the Board considers all of its members equally responsible and accountable for oversightand guidance of its activities, they also have designated an independent Lead Director elected annuallyby a majority of the Board of Directors. Gregory N. Moore currently serves as the independent LeadDirector. The responsibility and authority of the independent Lead Director are delineated in ourCorporate Governance Guidelines, which can be found on the Company’s website atwww.texasroadhouse.com.
The Board is responsible for overseeing the Company’s risk management strategies, including theCompany’s implementation of appropriate processes to administer day-to-day risk management. TheBoard is informed about risk management matters as part of its role in the general oversight andapproval of corporate matters. The Board gives clear guidance to the Company’s management on therisks it believes face the Company, such as the matters disclosed as risk factors in the Company’sAnnual Report on Form 10-K. Furthermore, the Board has delegated certain risk managementresponsibilities to its committees.
Through the audit committee’s charter, the Board has authorized it to oversee the Company’s riskassessment and risk management policies. The audit committee, in fulfilling its oversightresponsibilities, regularly and comprehensively reviews specific risk matters which have been identifiedby management. The Company’s internal auditor regularly reports directly to the audit committee onthe results of internal audits, the scope and frequency of which are based on comprehensive riskassessments which have been approved by the audit committee. Additionally, the Company’s riskcommittee regularly updates the audit committee on the results of their risk management activities,which are based on the company’s prioritized risk map that is updated annually, at a minimum, andreviewed with the audit committee. The audit committee is routinely advised of operational, financialand legal risks both during and outside of regularly scheduled meetings, and the committee reviews andmonitors specific activities to manage these risks, such as insurance plans, hedging strategies andinternal controls.
Through the compensation committee’s charter, the Board has authorized it to oversee officer anddirector compensation programs. The compensation committee, in fulfilling its oversight responsibilities,designs the compensation packages applicable to the executive officers and Board members. Thecompensation committee also consults with management on the payments of bonuses and grants ofstock awards to key employees on a quarterly basis.
The audit committee, in coordination with the compensation committee, performs an annual riskassessment of our compensation programs for all employees to determine whether these programsencourage unnecessary or excessive risk taking. In conducting this review, each of our compensation
7

programs is evaluated on a number of criteria aimed at identifying any incentive programs that deviatefrom our risk management objectives. Based on this review in 2013, the committee concluded that wehave the right combination of rewards and incentives to drive company performance, withoutencouraging unnecessary or excessive risk taking by our employees. Specifically, the audit committeeidentified the following components of our compensation programs that mitigate the likelihood ofexcessive risk taking to meet performance targets: equity incentive compensation in the form ofrestricted stock units which, for the Named Executive Officers and the Board of Directors, vest over aperiod of years; long term contracts and a financial buy-in requirement for restaurant management; aguaranteed base salary within our support center management personnel; minimums and maximums onprofit sharing compensation within our support center management personnel; robust internal controls;operational focus on top line sales growth; and, a business model which focuses on a strong balancesheet, relatively low debt, prudent growth, and sustainable long term profitability. Further, thecommittees believe that issuing restricted stock unit awards to our Named Executive Officers in fixedamounts, as opposed to making equity awards whose ultimate value is determined by achievement ofisolated performance criteria, further serves to discourage unnecessary or excessive risk taking. Becausethe value of restricted stock unit awards varies in response to company performance and shareholderresponse to that performance through stock price fluctuation, the committees believe that the marketprice of our publicly traded common stock itself represents the most appropriate metric fordetermining the long term value of the equity portion of our Named Executive Officers’ compensationpackages. The use of other arbitrarily selected metrics could create the risk of excessive focus on theachievement of isolated subsidiary objectives, to the potential detriment of our ultimate goal ofmaintaining sustained profitability and shareholder returns through Legendary Food and LegendaryService.
The Board’s oversight roles, including the roles of the audit committee and the compensationcommittee, combined with the leadership structure of the Board to include Company management,allow the Board to effectively administer risk management policies while also effectively and efficientlyaddressing Company objectives.
Committees of the Board of Directors
The Board has three standing committees: the audit committee, the compensation committee andthe nominating and corporate governance committee. The Board has adopted a written charter foreach of these committees, which sets out the functions and responsibilities of each committee. Thecharters of these committees are available in their entirety on the Company’s website,www.texasroadhouse.com. Please note, however, that the information contained on the website is notincorporated by reference in, or considered to be a part of, this proxy statement. The Board has alsodesignated one of its members as an international liaison, responsible for overseeing the Corporation’sefforts in international expansion and reporting to the Board on those efforts.
Audit Committee. As described in its charter, the audit committee assists our Board in fulfilling itsoversight responsibility relating to: (i) the integrity of the Company’s financial statements, (ii) theCompany’s compliance with legal and regulatory requirements, (iii) the independence and performanceof the Company’s internal and external auditors, and (iv) the Company’s internal controls and financialreporting practices. The audit committee is also required to pre-approve all audit and permittednon-audit services provided by our independent auditors. The audit committee reviews all of theCompany’s earnings press releases and Quarterly and Annual Reports on Form 10-Q and Form 10-Kprior to filing with the Securities and Exchange Commission (‘‘SEC’’). The audit committee is alsoresponsible for producing an annual report on its activities for inclusion in this proxy statement. All ofthe members of the audit committee are ‘‘independent,’’ as that term is defined in the listing standardsunder NASDAQ Marketplace Rule 5605(a)(2) and meet the criteria for independence under theSarbanes-Oxley Act of 2002 and the rules adopted by the SEC. The audit committee is currentlycomprised of Messrs. Moore, Parker and Ramsey and is chaired by Mr. Moore. The Board evaluated
8

the credentials of and designated Mr. Moore as an ‘‘audit committee financial expert’’ as required bySection 407 of the Sarbanes-Oxley Act of 2002. The audit committee met 15 times during the fiscalyear 2013.
Compensation Committee. As described in its charter, the compensation committee: (i) assists theBoard in fulfilling its responsibilities relating to the design, administration and oversight of employeecompensation programs and benefit plans of the Company’s executive officers, (ii) discharges theBoard’s duties relating to the compensation of the Company’s directors and (iii) reviews theperformance of the Company’s executive officers. The compensation committee is also responsible forreviewing and discussing with management the Compensation Discussion and Analysis in this proxystatement and recommending its inclusion in this proxy statement to the Board. All of the members ofthe compensation committee are ‘‘independent’’ under all applicable rules, including the listingstandards under NASDAQ Marketplace Rule 5605(a)(2) and the requirements of the SEC. The currentmembers of the compensation committee are Ms. Widmer and Messrs. Moore, Parker, Ramsey, andZarley. Mr. Parker chairs the committee. The compensation committee met five times during the fiscalyear 2013.
Nominating and Corporate Governance Committee. As described in its charter, the nominating andcorporate governance committee assists our Board in: (i) identifying individuals qualified to becomeBoard members and recommending nominees to the Board either to be presented at the annualmeeting or to fill any vacancies, (ii) considering and reporting periodically to the Board on mattersrelating to the identification, selection and qualification of director candidates and (iii) developing andrecommending to the Board a set of corporate governance principles. The nominating committeeroutinely evaluates the size and composition of the Board and the variety of professional expertiserepresented by the Board members in relation to the Company’s business. All of the members of thenominating and corporate governance committee are ‘‘independent’’ under all applicable rules,including the listing standards under NASDAQ Marketplace Rule 5605(a)(2) and the requirements ofthe SEC. The current members of the nominating and corporate governance committee areMs. Widmer and Messrs. Moore, Parker, Ramsey, and Zarley. Mr. Moore chairs the committee. Thenominating and corporate governance committee met three times during the fiscal year 2013.
Policy Regarding Consideration of Candidates for Director
Shareholder recommendations for Board membership should include, among other items, thename of the candidate, age, contact information, present principal occupation or employment,qualifications and skills, background, last five years’ employment and business experience, a descriptionof current or previous service as director of any corporation or organization, other relevant biographicalinformation and the nominee’s consent to service on the Board. A shareholder nominee will berequested to complete a detailed questionnaire in the form that current directors and officers complete.
The nominating and corporate governance committee may consider such other factors as it maydeem are in the best interest of the Company and its shareholders. The Board has adopted corporategovernance guidelines that provide that, if and when the Board determines that it is necessary ordesirable to add or replace a director, the nominating and corporate governance committee will seekdiverse candidates, taking into account diversity in all respects (including gender, race, age, boardservice, background, education, skill set, and financial acumen, along with knowledge and experience inareas that are relevant to the Company’s business), when forming the nominee pool. The Nominatingand Corporate Governance Committee has reviewed the process used in the selection of directorcandidates and concluded that the pool contained a diverse group of candidates. The manner in whichthe nominating and corporate governance committee evaluates a potential nominee will not differbased on whether the nominee is recommended by a shareholder of the Company.
9

The Company currently retains a corporate recruiter to assist in identifying candidates for openpositions at the Company. Upon request, this recruiter also assists in identifying and evaluatingcandidates for director, but the Company does not pay an additional fee for such service.
Compensation of Directors
As described more fully below, the following table summarizes the total compensation paid oraccrued for fiscal year 2013 for each of the non-employee directors.
Director Compensation Table
Fees Earned Grant Date Fairor Paid in Value of Stock
Cash Awards TotalName ($) ($)(2) ($)(a) (b) (c) (d)
Martin T. Hart . . . . . . . . . . . . . . . . . . . . . . . . 25,500(1) — 25,500Gregory N. Moore . . . . . . . . . . . . . . . . . . . . . . 81,000(3) — 81,000James F. Parker . . . . . . . . . . . . . . . . . . . . . . . . 47,500(4) — 47,500James R. Ramsey . . . . . . . . . . . . . . . . . . . . . . 38,500 — 38,500Kathleen M. Widmer . . . . . . . . . . . . . . . . . . . . 14,250 — 14,250James R. Zarley . . . . . . . . . . . . . . . . . . . . . . . 30,500 — 30,500
(1) Mr. Hart passed away on January 3, 2014. Upon his death, the previously grantedrestricted stock units attributable to his service for the 2013 fiscal year, which would havevested on January 7, 2014, lapsed. In recognition of and in deep appreciation forMr. Hart’s service to the Company, the Company made a donation to the Martin T. HartScholarship Fund at Regis University in the amount of $225,000, which amount isapproximately equal to the value of the shares underlying the restricted stock units if theyhad vested.
(2) No stock grants or option awards were made during the period of time covered by thistable.
(3) This amount includes a $20,000 annual fee for serving as the chairman of the auditcommittee, and a $20,000 annual fee for serving as the international liaison.
(4) This amount includes a $10,000 annual fee for serving as the chairman of thecompensation committee.
Non-employee directors each receive an annual fee of $12,500. The chairperson of the auditcommittee receives an additional annual fee of $20,000, the chairperson of the compensationcommittee receives an additional annual fee of $10,000, and the international liaison receives anadditional annual fee of $20,000. Each non-employee director receives $2,000 for each Board meetinghe or she attends in person and $500 for each Board meeting he or she participates in telephonically.Additionally, each non-employee director receives $1,000 for each committee meeting he or she attendsin person and $500 for each committee meeting he or she participates in telephonically. Occasionally,board members serve on temporary committees for which they also receive meeting fees and annualfees.
Code of Conduct
The Board has approved and adopted a Code of Conduct that applies to all directors, officers andemployees, including the Company’s principal executive officer and the principal financial officer. TheCode of Conduct is available in its entirety on the Company’s website, www.texasroadhouse.com. TheCompany intends to post amendments to, or waivers from, its Code of Conduct, if any, that apply tothe principal executive officer and the principal financial officer on its website.
10
STOCK OWNERSHIP INFORMATION
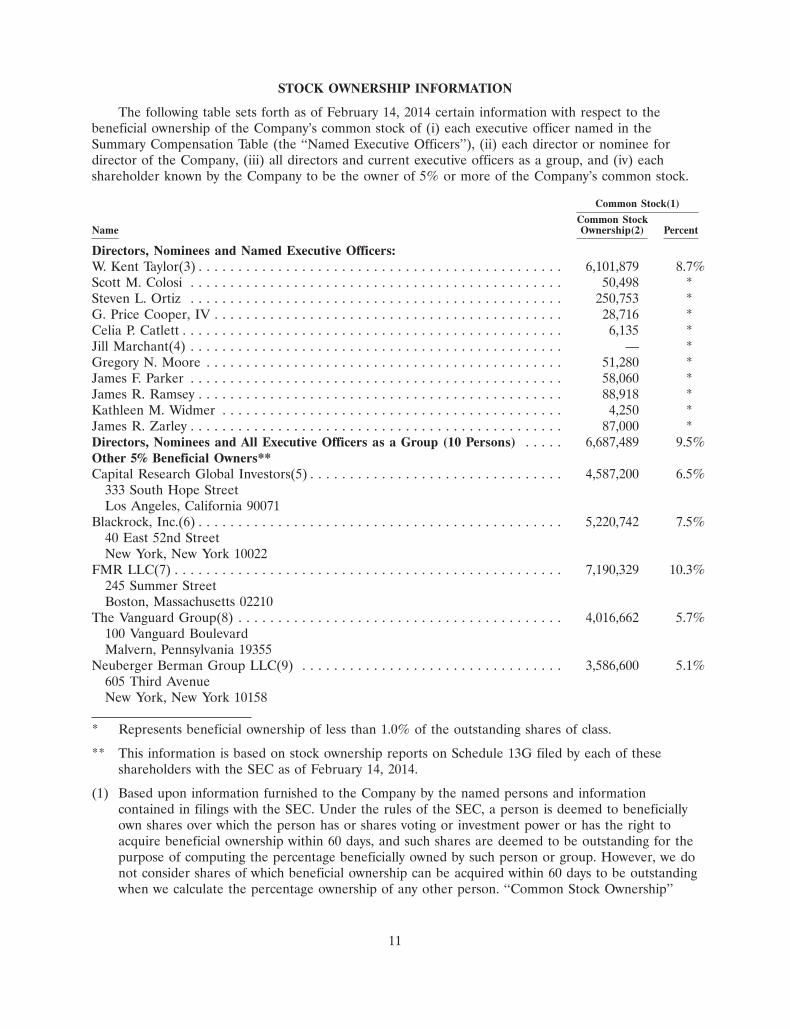
The following table sets forth as of February 14, 2014 certain information with respect to thebeneficial ownership of the Company’s common stock of (i) each executive officer named in theSummary Compensation Table (the ‘‘Named Executive Officers’’), (ii) each director or nominee fordirector of the Company, (iii) all directors and current executive officers as a group, and (iv) eachshareholder known by the Company to be the owner of 5% or more of the Company’s common stock.
Common Stock(1)
Common StockName Ownership(2) Percent
Directors, Nominees and Named Executive Officers:W. Kent Taylor(3) . . . . . . . . . . . . . . . . . . . . . . . . . . . . . . . . . . . . . . . . . . . . . . 6,101,879 8.7%Scott M. Colosi . . . . . . . . . . . . . . . . . . . . . . . . . . . . . . . . . . . . . . . . . . . . . . . 50,498 *Steven L. Ortiz . . . . . . . . . . . . . . . . . . . . . . . . . . . . . . . . . . . . . . . . . . . . . . . 250,753 *G. Price Cooper, IV . . . . . . . . . . . . . . . . . . . . . . . . . . . . . . . . . . . . . . . . . . . . 28,716 *Celia P. Catlett . . . . . . . . . . . . . . . . . . . . . . . . . . . . . . . . . . . . . . . . . . . . . . . . 6,135 *Jill Marchant(4) . . . . . . . . . . . . . . . . . . . . . . . . . . . . . . . . . . . . . . . . . . . . . . . — *Gregory N. Moore . . . . . . . . . . . . . . . . . . . . . . . . . . . . . . . . . . . . . . . . . . . . . 51,280 *James F. Parker . . . . . . . . . . . . . . . . . . . . . . . . . . . . . . . . . . . . . . . . . . . . . . . 58,060 *James R. Ramsey . . . . . . . . . . . . . . . . . . . . . . . . . . . . . . . . . . . . . . . . . . . . . . 88,918 *Kathleen M. Widmer . . . . . . . . . . . . . . . . . . . . . . . . . . . . . . . . . . . . . . . . . . . 4,250 *James R. Zarley . . . . . . . . . . . . . . . . . . . . . . . . . . . . . . . . . . . . . . . . . . . . . . . 87,000 *Directors, Nominees and All Executive Officers as a Group (10 Persons) . . . . . 6,687,489 9.5%Other 5% Beneficial Owners**Capital Research Global Investors(5) . . . . . . . . . . . . . . . . . . . . . . . . . . . . . . . . 4,587,200 6.5%
333 South Hope StreetLos Angeles, California 90071
Blackrock, Inc.(6) . . . . . . . . . . . . . . . . . . . . . . . . . . . . . . . . . . . . . . . . . . . . . . 5,220,742 7.5%40 East 52nd StreetNew York, New York 10022
FMR LLC(7) . . . . . . . . . . . . . . . . . . . . . . . . . . . . . . . . . . . . . . . . . . . . . . . . . 7,190,329 10.3%245 Summer StreetBoston, Massachusetts 02210
The Vanguard Group(8) . . . . . . . . . . . . . . . . . . . . . . . . . . . . . . . . . . . . . . . . . 4,016,662 5.7%100 Vanguard BoulevardMalvern, Pennsylvania 19355
Neuberger Berman Group LLC(9) . . . . . . . . . . . . . . . . . . . . . . . . . . . . . . . . . 3,586,600 5.1%605 Third AvenueNew York, New York 10158
* Represents beneficial ownership of less than 1.0% of the outstanding shares of class.
** This information is based on stock ownership reports on Schedule 13G filed by each of theseshareholders with the SEC as of February 14, 2014.
(1) Based upon information furnished to the Company by the named persons and informationcontained in filings with the SEC. Under the rules of the SEC, a person is deemed to beneficiallyown shares over which the person has or shares voting or investment power or has the right toacquire beneficial ownership within 60 days, and such shares are deemed to be outstanding for thepurpose of computing the percentage beneficially owned by such person or group. However, we donot consider shares of which beneficial ownership can be acquired within 60 days to be outstandingwhen we calculate the percentage ownership of any other person. ‘‘Common Stock Ownership’’
11

includes (a) stock held in joint tenancy, (b) stock owned as tenants in common, (c) stock owned orheld by spouse or other members of the reporting person’s household and (d) stock in which thereporting person either has or shares voting and/or investment power, even though the reportingperson disclaims any beneficial interest in such stock.
(2) The following table lists the shares to which each named person has the right to acquire beneficialownership within 60 days of February 14, 2014 through the exercise of stock options or the vestingof restricted stock units granted pursuant to our long-term incentive plan; these shares areincluded in the totals above as described in footnote (1):
Shares whichmay be acquiredwithin 60 days
pursuant toName stock awards
W. Kent Taylor . . . . . . . . . . . . . . . . . . . . . . . . . . . . . . . . . . . . . . . . —Scott M. Colosi . . . . . . . . . . . . . . . . . . . . . . . . . . . . . . . . . . . . . . . —Steven L. Ortiz . . . . . . . . . . . . . . . . . . . . . . . . . . . . . . . . . . . . . . . . —G. Price Cooper, IV . . . . . . . . . . . . . . . . . . . . . . . . . . . . . . . . . . . . —Celia P. Catlett . . . . . . . . . . . . . . . . . . . . . . . . . . . . . . . . . . . . . . . . 3,953Jill Marchant(i) . . . . . . . . . . . . . . . . . . . . . . . . . . . . . . . . . . . . . . . —Gregory N. Moore . . . . . . . . . . . . . . . . . . . . . . . . . . . . . . . . . . . . . 40,000James F. Parker . . . . . . . . . . . . . . . . . . . . . . . . . . . . . . . . . . . . . . . 40,000James R. Ramsey . . . . . . . . . . . . . . . . . . . . . . . . . . . . . . . . . . . . . . —Kathleen M. Widmer . . . . . . . . . . . . . . . . . . . . . . . . . . . . . . . . . . . —James R. Zarley . . . . . . . . . . . . . . . . . . . . . . . . . . . . . . . . . . . . . . . —Directors, Nominees and All Executive Officers as a Group
(10 Persons) . . . . . . . . . . . . . . . . . . . . . . . . . . . . . . . . . . . . . . . . 122,903
(i) Ms. Marchant relinquished her executive officer position effective as of the close ofbusiness on November 12, 2013, but remained employed under her AmendedEmployment Agreement until the close of business on January 7, 2014.
(3) Mr. Taylor’s address is c/o Texas Roadhouse, Inc., 6040 Dutchmans Lane, Louisville,Kentucky 40205.
(4) Ms. Marchant relinquished her executive officer position effective as of the close of business onNovember 12, 2013, but remained employed under her Amended Employment Agreement untilthe close of business on January 7, 2014. The stock ownership information listed above is as ofFebruary 14, 2014, based on company stock records.
(5) As reported on the Schedule 13G/A filed by Capital Research Group Investors with the SEC onFebruary 13, 2014, it has sole voting and dispositive power with respect to these shares.
(6) As reported on the Schedule 13G/A filed by Blackrock, Inc. with the SEC on January 30, 2014, ithas sole voting power with respect to 5,037,042 shares and sole dispositive power with respect to5,220,742 shares.
(7) As reported on the Schedule 13G/A filed by FMR LLC with the SEC on February 14, 2014, it hassole dispositive power with respect to these shares and sole voting power with respect to 160,080shares.
(8) As reported on the Schedule 13G/A filed by The Vanguard Group with the SEC on February 12,2014, it has sole voting power with respect to 86,271 shares, sole dispositive power with respect to3,934,891 shares, and shared dispositive power with respect to 81,771 shares.
12

(9) As reported on the Schedule 13G filed by Neuberger Berman LLC with the SEC on February 12,2014, it has shared voting power with respect to 3,579,600 shares and shared dispositive power withrespect to 3,586,600 shares.
Section 16(a) Beneficial Ownership Reporting Compliance
Section 16(a) of the Exchange Act requires the Company’s directors and officers, and persons whobeneficially own more than 10% of a registered class of the Company’s equity securities, to file with theSEC initial reports of stock ownership and reports of changes in stock ownership and to provide theCompany with copies of all such filed forms. Based solely on its review of such copies or writtenrepresentations from reporting persons, the Company believes that all reports were filed on a timelybasis during the fiscal year ended December 31, 2013, with the exception of the following: (1) a Form 3for Celia P. Catlett, which should have been filed on or prior to November 22, 2013, but which wasactually filed on November 26, 2013.
13

EXECUTIVE COMPENSATION
Compensation Discussion and Analysis
The Company’s compensation committee reviews and establishes executive compensation inconnection with each Named Executive Officer’s employment agreement. We entered into employmentagreements with W. Kent Taylor, Scott M. Colosi, Steven L. Ortiz, G. Price Cooper, IV, and JillMarchant (former General Counsel), each a Named Executive Officer, on January 6, 2012 (collectively,the ‘‘Original Employment Agreements’’), each of which was amended on November 30, 2012 (the‘‘Amended Employment Agreements’’). Each of Mssrs. Taylor’s, Colosi’s, Ortiz’s, and Cooper’sEmployment Agreement expires on January 7, 2015. On November 1, 2013, we entered into aSeparation Agreement and General Release (the ‘‘Separation Agreement’’) with Ms. Marchant,whereby she agreed to relinquish her executive officer position effective as of the close of business onNovember 12, 2013, but remained employed under her employment agreement until the close ofbusiness on January 7, 2014. We entered into an employment agreement with our new GeneralCounsel, Celia P. Catlett, also a Named Executive Officer, on January 15, 2014, which was effective asof close of business on November 12, 2013, and which expires on January 7, 2015 (the ‘‘2014Employment Agreement’’). As used herein, the Amended Employment Agreements and the 2014Employment Agreement shall be referred to collectively as the ‘‘Current Employment Agreements’’ andindividually as a ‘‘Current Employment Agreement;’’ the discussion of the Amended EmploymentAgreements is qualified by reference to the Separation Agreement, which is more fully described belowunder ‘‘Separation and Change in Control Arrangements.’’
Each officer’s Current Employment Agreement establishes a base salary which is to remainconstant throughout the term of the agreement, and an incentive bonus amount based on theachievement of defined goals to be established by the compensation committee. Each officer’s CurrentEmployment Agreement also provides for the grant of restricted stock units, which grant the officersthe conditional right to receive shares of our common stock upon vesting. Each officer has agreed notto compete with us during the term of his or her employment and for a period of two years followinghis or her termination of employment, unless the officer’s employment is terminated without causefollowing a change in control, in which case the officer has agreed not to compete with us through thedate of the last payment of the officer’s severance payments. The Current Employment Agreementscontain a ‘‘clawback’’ provision that enables the Company to seek reimbursement to the Company ofany compensation paid to any Named Executive Officer which is required to be recovered by any law,governmental regulation or order, or stock exchange listing requirement.
The compensation packages for our Named Executive Officers are somewhat unique in that theyoffer base salaries and target cash bonus amounts on the low end of market within the casual diningrestaurant sector, and feature restricted stock unit awards in fixed amounts, the value of which iswholly dependent upon the price of our common stock. The underlying philosophy reflected by thisapproach is that, because a significant amount of each officer’s compensation lies in the value of therestricted stock units granted, the officers are motivated to continually improve the Company’sperformance in the hope that the performance will be reflected by the stock price on the vesting dateof their restricted stock units and beyond. Overall, we believe this approach provides the NamedExecutive Officers with a compensation package which would promote the sustained profitability of theCompany and align the interests of our executive officers with those of our shareholders. Thecompensation packages also reflect a pragmatic response to external market conditions; that is, totalcompensation that is competitive with comparable positions in similar industries, including the casualdining sector of the restaurant industry, but which is reasonable and in the best interests of ourshareholders.
14

We believe that the overall design of the compensation packages, along with the culture and valuesof our Company, allows us to attract and retain top talent, while also keeping the Named ExecutiveOfficers focused on both long-term business development and short-term financial growth.
The compensation committee did not use a compensation consultant in determining thecompensation packages under the Current Employment Agreements, and did not apply a set formulafor allocating between cash and equity in developing the total compensation packages. Rather, thecompensation committee applied the business judgment of the committee members to designcompensation packages for the Named Executive Officers based on the specific philosophies describedherein taking into account all surrounding facts and circumstances. In deciding to continue with ourexisting executive compensation practices, our compensation committee considered that the holders ofover 83% of the votes cast at our 2013 Annual Meeting on an advisory basis approved thecompensation of our named executive officers as disclosed in the proxy statement for that AnnualMeeting. While the compensation committee consulted with each of the executive officers in advanceof the final approval of the Current Employment Agreements, none of the executive officers, includingMr. Taylor, participated in the creation of the compensation packages contained therein.
Section 162(m) of the Internal Revenue Code imposes a $1 million limit on the amount that apublicly-traded corporation may deduct for compensation paid to the Chief Executive Officer or one ofthe company’s other three most highly compensated executives (other than the Chief Financial Officer)who is employed on the last day of the year. Non-discretionary ‘‘performance-based compensation,’’ asdefined under Internal Revenue Service rules and regulations, is excluded from this $1 millionlimitation. Currently, the incentive bonuses paid to our Named Executive Officers are structured asnon-discretionary ‘‘performance-based compensation,’’ which allows certain amounts in excess of$1 million to be tax deductable. However, the compensation committee has not in the past had, anddoes not currently have, a policy requiring all compensation to be deductible under Section 162(m).Rather, the compensation committee retains discretion in making cash and equity-based awards thatare not deductible under Section 162(m). We seek to preserve the tax deductibility of executivecompensation to the extent practicable and consistent with our overall compensation philosophies.
Elements of Compensation
Base Salary
Base salaries for our Named Executive Officers are designed to provide a secure base ofcompensation which will be effective in motivating and retaining key executives. Each officer’s CurrentEmployment Agreement establishes an annual salary as shown in the table below which is to remainconstant throughout the term of the agreement. The actual amounts paid to each Named ExecutiveOfficer during the fiscal year 2013 are more fully described in ‘‘Executive Compensation.’’
Annual Salary($)
W. Kent Taylor . . . . . . . . . . . . . . . . . . . . . . . . . . . . . . . . . . . . . . . . . 525,000Chairman, Chief Executive Officer
Scott M. Colosi . . . . . . . . . . . . . . . . . . . . . . . . . . . . . . . . . . . . . . . . . 400,000President
Steven L. Ortiz . . . . . . . . . . . . . . . . . . . . . . . . . . . . . . . . . . . . . . . . . 480,000Chief Operating Officer
G. Price Cooper, IV . . . . . . . . . . . . . . . . . . . . . . . . . . . . . . . . . . . . . 250,000Chief Financial Officer
Celia P. Catlett . . . . . . . . . . . . . . . . . . . . . . . . . . . . . . . . . . . . . . . . . 200,000General Counsel and Corporate Secretary
15

Incentive Bonus
Incentive bonuses are designed to reward our Named Executive Officers for the success of theCompany, as measured by growth in the Company’s earnings per diluted share (‘‘EPS’’) and overallpre-tax profit, and for each officer’s individual contribution to that success. It is our belief that asignificant amount of each officer’s compensation should be tied to the performance of the Company.
Pursuant to the terms of the Texas Roadhouse, Inc. Cash Bonus Plan (the ‘‘Cash Bonus Plan’’), thecompensation committee may award an annual cash incentive to the Named Executive Officers, whichis the grant of a right to receive a payment of cash that is subject to targets and maximums, and that iscontingent on achievement of performance objectives during the Company’s fiscal year. These cashincentives are also subject to the terms and conditions of the Current Employment Agreements and, tothe extent that the incentives are intended to constitute ‘‘performance-based compensation’’ forpurposes of section 162(m) of the Internal Revenue Code, are treated as the award of a cash incentiveaward under our long term incentive plan.
Consistent with its approach prior to the adoption of the Cash Bonus Plan, the compensationcommittee established a two-pronged approach to tying the incentive compensation under the CashBonus Plan to Company performance. Under this approach, 50% of the target incentive bonus isawarded based on whether the Company achieves an annual EPS growth target of 10% (the ‘‘EPSPerformance Goal’’). The other 50% is based on a profit sharing pool comprised of 1.5% of theCompany’s pre-tax profits (income before taxes minus income attributable to non-controlling interests,as reported in our audited financial statements), which pool is distributed among our Named ExecutiveOfficers and certain other members of the Company’s director-level management (the ‘‘Profit SharingPool’’) based on a pre-determined percentage interest in the pool and subject to certain pre-determinedmaximum amounts. After the end of the fiscal year, the compensation committee determines whetherand to what extent the EPS Performance Goal has been met, and the portion of the Profit SharingPool to which each officer is entitled. Depending on the level of achievement of the EPS PerformanceGoal each year, 50% of the incentive bonus may be reduced to a minimum of $0 or increased to amaximum of two times the target amount. Each one percent change from the EPS Performance Goalresults in an increase or decrease of ten percent to the portion of the target bonus amount attributableto the achievement of the EPS Performance Goal. For example, if we achieve 11% EPS growth, thebonus payable would be 110% of the portion of the target bonus attributable to the achievement of theEPS Performance Goal. Conversely, if we achieve nine percent the bonus payable would be 90% of theportion of the target bonus attributable to the achievement of the EPS Performance Goal. Theremaining 50% of the officers’ incentive bonus will fluctuate directly with Company pre-tax profits atfixed participation percentages and maximum amounts which are determined within 60 days followingthe commencement of the Company’s fiscal year and while the pre-tax profits are not yet determined.The annual profit sharing component allows the Named Executive Officers to participate in a profitsharing pool with other members of the Company’s director-level management team. By allowing thislevel of participation in the Company’s overall profits, the committee encourages responsible growthand aligns the interests of the officers with those of other management employees in the Company.This portion of the incentive bonus may be reduced to a minimum of $0 if the Company ceases to beprofitable or for other reasons that the compensation committee determines, and may be increased to amaximum of two times the target amount established for each individual participant. Both portions ofthe incentive bonus can be adjusted downward (but not upward) by the compensation committee in itsdiscretion. Cash incentive bonuses with respect to fiscal year 2013 were paid at 120.8% of the totaltarget amount, based on actual EPS growth of 13.2% and pre-tax profits of $114,562,715 during fiscalyear 2013.
The actual amounts earned by each Named Executive Officer for fiscal year 2013 are more fullydescribed in ‘‘Executive Compensation.’’ However, pursuant to the terms of the Amended EmploymentAgreements, the compensation committee elected to pay bonuses applicable to fiscal year 2013 on an
16

annual basis in order to qualify the incentive compensation for certain Named Executive Officers astax-deductible compensation under Section 162(m) of the Internal Revenue Code. The actual cashincentives that were paid to each Named Executive Officer for fiscal year 2013 based on achievementof the performance goals assigned for 2013 under the Cash Bonus Plan were not evaluated for paymentuntil the first quarter of 2014, so the officers did not realize the amounts reported in the ‘‘SummaryCompensation Table’’ during fiscal year 2013.
Executive Incentive Compensation for the Fiscal Year 2013
Target Minimum MaximumName Bonus $ Bonus $ Bonus $
W. Kent Taylor . . . . . . . . . . . . . . . . . . . . . . . . . . . . 525,000 — 1,050,000Scott M. Colosi . . . . . . . . . . . . . . . . . . . . . . . . . . . 300,000 — 600,000Steven L. Ortiz . . . . . . . . . . . . . . . . . . . . . . . . . . . 480,000 — 960,000G. Price Cooper, IV . . . . . . . . . . . . . . . . . . . . . . . . 150,000 — 300,000Celia P. Catlett(1) . . . . . . . . . . . . . . . . . . . . . . . . . . — — —Jill Marchant(2) . . . . . . . . . . . . . . . . . . . . . . . . . . . 100,000 — 200,000
(1) Pursuant to the terms of the 2014 Employment Agreement, Ms. Catlett was not eligibleto receive an incentive bonus as a Named Executive Officer until the commencement ofthe 2014 fiscal year, which began on January 1, 2014.
(2) Ms. Marchant ceased to be a Named Executive Officer on November 12, 2013. Pursuantto the terms of her Separation Agreement, she remained employed under her AmendedEmployment Agreement until January 7, 2014, and was eligible to receive her cashincentive bonus for fiscal year 2013.
Stock Awards
Prior to fiscal year 2008, we made equity awards in the form of stock options, some of whichremain outstanding as noted in the Outstanding Equity Awards table below. Currently, we make equityawards in the form of restricted stock units, which represent the conditional right to receive one shareof our common stock upon satisfaction of the vesting requirements. Restricted stock units offer theNamed Executive Officers a financial interest in the Company and serve to retain the Named ExecutiveOfficers as they vest over a period of time.
We believe that issuing restricted stock unit awards to our Named Executive Officers in fixedamounts, as opposed to making equity awards whose ultimate value is determined by achievement ofisolated performance criteria, aligns their interests with those of our shareholders. We also believe thatthe market price of our publicly traded common stock represents the most appropriate metric fordetermining the value of the equity portion of our Named Executive Officers’ compensation packages.The overall compensation packages for our Named Executive Officers are somewhat unique in thatthey offer base salaries and target cash bonus amounts on the low end of market within the casualdining restaurant sector, and feature restricted stock unit awards in fixed amounts, the value of which iswholly dependent upon the price of our common stock. The underlying philosophy reflected by thisapproach is that, because a significant amount of each officer’s compensation lies in the value of therestricted stock units granted, the officers are motivated to continually improve the Company’sperformance in the hope that the performance will be reflected by the stock price on the vesting dateof their restricted stock units and beyond. Because the restricted stock unit awards for our NamedExecutive Officers vest incrementally over a period of time, and their value varies in response toinvestor sentiment regarding overall Company performance at the time of vesting, we believe that theseawards are inherently performance based.
17

The number of restricted stock units granted to each officer reflects each officer’s jobresponsibilities and individual contribution to the success of the Company.
The number of restricted stock units granted under the Current Employment Agreements, andwith respect to Ms. Marchant, the Amended Employment Agreement, are shown in the table below.Except as noted, the grants vest in one-third increments each January 7 over a three-year periodbeginning on January 7, 2013 and ending on January 7, 2015.
Restricted Stock Restricted Stock Restricted Stock Total RestrictedUnits vesting Units vesting Units vesting Stock Unitson January 7, on January 7, on January 7, granted2013 pursuant 2014 pursuant 2015 pursuant pursuant toto Employment to Employment to Employment Employment
Agreements Agreements Agreements Agreements
W. Kent Taylor . . . . . . 70,000 70,000 70,000 210,000Scott M. Colosi . . . . . 50,000 50,000 50,000 150,000Steven L. Ortiz . . . . . . 60,000 60,000 60,000 180,000G. Price Cooper, IV . . 25,000 25,000 25,000 75,000Celia P. Catlett . . . . . . — — 8,500 8,500Jill Marchant . . . . . . . 15,000 34,250(1) — 49,250
(1) Pursuant to the terms of Ms. Marchant’s Separation Agreement, she remained employedunder her Amended Employment Agreement until January 7, 2014, the date on which15,000 restricted stock units vested in accordance with the Amended EmploymentAgreement. Also pursuant to the terms of the Separation Agreement, Ms. Marchantreceived accelerated vesting on January 7, 2014 of the 15,000 restricted stock unitsscheduled to vest on January 7, 2015 in accordance with the Amended EmploymentAgreement, and the 4,250 restricted stock units scheduled to vest in August 2014 whichwere granted pursuant to her prior employment agreement as Special Counsel to theCompany.
Separation and Change in Control Arrangements
Except in the event of a change in control, the Current Employment Agreements withMessrs. Taylor and Ortiz provide that no severance will be paid to either of them upon termination ofemployment, but each is entitled to receive a gift of a crisp $100 bill if his employment is terminated bythe Company without cause before the end of the term. Except in the event of a change in control, theCurrent Employment Agreements with Mr. Colosi, Mr. Cooper and Ms. Catlett provide that if theCompany terminates their employment without cause before the end of the term, the Company will paya severance payment equal to any bonus for a year already ended (even if not yet paid at termination),plus the officer’s base salary for a period of 180 days, and payment of a fixed sum ($150,000 forMr. Colosi, $75,000 for Mr. Cooper, and $37,500 for Ms. Catlett). Ms. Marchant’s AmendedEmployment Agreement had such a provision, with a provision for a fixed sum payment of $50,000.Similar payments are due to the officers if employment is terminated by reason of death or disabilitybefore the end of the term. The Company provides these severance payments to allow for a period oftransition and in exchange for a full release of claims against the Company. The salary component ofthe severance payments is subject to deductions and withholdings and is to be paid to the officers inperiodic installments in accordance with our normal payroll practices. The fixed sum is paid in a singlelump sum, and any bonus component of the severance payments for a performance period that endedbefore termination is to be paid on the same date as the payment would have been made had his orher employment not been terminated.
The Current Employment Agreements also provide that if the officer’s employment is terminatedother than for cause following a change in control, or if the officer resigns for good reason following a
18

change in control because he or she is required to relocate, the Company’s successor does not agree tobe bound by the agreement, or the officer’s responsibilities, pay or total benefits are reduced, suchofficer will receive severance payments in an amount equal to the officer’s base salary and incentivebonus for a period which is the longer of the remainder of the term of the agreement or one year. Inaddition, the officer’s unvested stock options or other stock awards, if any, will become vested as of thedate of termination. The payments and acceleration of vesting of the stock options or other stockawards are contingent upon the officer signing a full release of claims against the Company. The salarycomponent of the severance payments is subject to deductions and withholdings and is to be paid tothe officers in periodic installments in accordance with our normal payroll practices or in a lump sumat the discretion of the compensation committee and in compliance with Section 409A of the InternalRevenue Code. The bonus component of the severance payments to the officers is to be paid on thesame date as the payment would have been made had his or her employment not been terminated.
According to the terms of the Current Employment Agreements, a change in control means thatone of the following events has taken place: (1) the shareholders of the Company approve (a) a mergeror statutory plan of exchange involving the Company (‘‘Merger’’) in which the Company is not thecontinuing or surviving corporation or pursuant to which the Common Stock, $0.001 par value(‘‘Common Stock’’) would be converted into cash, securities or other property, other than a Mergerinvolving the Company in which the holders of Common Stock immediately prior to the Merger havesubstantially the same proportionate ownership of common stock of the surviving corporation after theMerger, or (b) a sale, lease, exchange, or other transfer (in one transaction or a series of relatedtransactions) of all or substantially all of the assets of the Company or the adoption of any plan orproposal for the liquidation or dissolution; (2) during any period of 12 months or less, individuals whoat the beginning of such period constituted a majority of the Board of Directors cease for any reasonto constitute a majority thereof unless the nomination or election of such new directors was approvedby a vote of at least two-thirds of the directors then still in office who were directors at the beginningof such period; (3) a tender or exchange offer (other than one made by (a) the Company, or(b) W. Kent Taylor or any corporation, limited liability company, partnership, or other entity in whichW. Kent Taylor owns a direct or indirect ownership of 50% or more, or controls 50% or more of thevoting power [collectively, the ‘‘Taylor Parties’’]) is made for the Common Stock (or securitiesconvertible into Common Stock) and such offer results in a portion of those securities being purchasedand the offeror after the consummation of the offer is the beneficial owner (as determined pursuant toSection 13(d) of the Securities Exchange Act of 1934, as amended [the ‘‘Exchange Act’’]), directly orindirectly, of securities representing in excess of the greater of at least 20 percent of the voting powerof outstanding securities of the Company or the percentage of the voting power of the outstandingsecurities of the Company collectively held by all of the Taylor Parties; or (4) any person other than aTaylor Party becomes the beneficial owner of securities representing in excess of the greater of20 percent of the aggregate voting power of the outstanding securities of the Company as disclosed in areport on Schedule 13D of the Exchange Act or the percentage of the voting power of the outstandingsecurities of the Company collectively held by all of the Taylor Parties. Notwithstanding anything in theforegoing to the contrary, no change of control shall be deemed to have occurred for purposes of anindividual Current Employment Agreement by virtue of any transaction which results in the affectedNamed Executive Officer, or a group of persons which includes the affected Named Executive Officer,acquiring, directly or indirectly, securities representing 20 percent or more of the voting power ofoutstanding securities of the Company.
The estimated amounts that would be payable to a Named Executive Officer under thesearrangements are more fully described in ‘‘Termination, Change of Control and Change ofResponsibility Payments.’’
19

On November 1, 2013, the Company and Jill Marchant, General Counsel of the Company,announced that she would no longer serve as General Counsel effective November 12, 2013.Ms. Marchant had been employed by the Company as General Counsel since November 2011.
Also on November 1, 2013, the Company entered into the Separation Agreement withMs. Marchant. Under the Separation Agreement, Ms. Marchant remained an employee of theCompany through January 7, 2014 (the ‘‘Separation Date’’). The Company paid Ms. Marchant herregular salary, benefits and bonus through the Separation Date. In addition, the Company agreed topay Ms. Marchant an aggregate sum of $344,053.85, less applicable withholdings, in four equalinstallment payments beginning on January 15, 2014. This amount is equal to one year base salary,together with base bonus and other benefits. On the Separation Date, the Company paid Ms. Marchant$17,346.47, less applicable withholdings, which reflects the cost of COBRA benefits premium coveragefor one year following the Separation Date. The Company also accelerated the vesting of 19,250restricted stock units upon the Separation Date. The Company also paid $8,000 for outplacementassistance and attorney fees. Under the terms of the Separation Agreement, Ms. Marchant agreed totwo-year non-competition and non-solicitation provisions and provided the Company with a generalrelease of all claims. Moreover, Ms. Marchant agreed make herself reasonably available to theCompany relating to her prior service to the Company, including assisting the Company in connectionwith any pending or threatened litigation or other legal proceedings with respect to which the Companyreasonably determines her participation is necessary. In entering into the Separation Agreement, theCompensation Committee considered the benefits of a smooth transition in the legal department andthe terms and conditions of the non-competition provisions.
Compensation Committee Report
The compensation committee has reviewed and discussed the Compensation Discussion andAnalysis required by Item 402(b) of Regulation S-K with management. Based on such review anddiscussions, the compensation committee recommended to the Board that the Compensation Discussionand Analysis be included in this proxy statement and incorporated by reference into the Company’sAnnual Report on Form 10-K for the year ended December 31, 2013.
All members of the compensation committee concur in this report.
James F. Parker, ChairGregory N. MooreJames R. RamseyKathleen M. WidmerJames R. Zarley
20
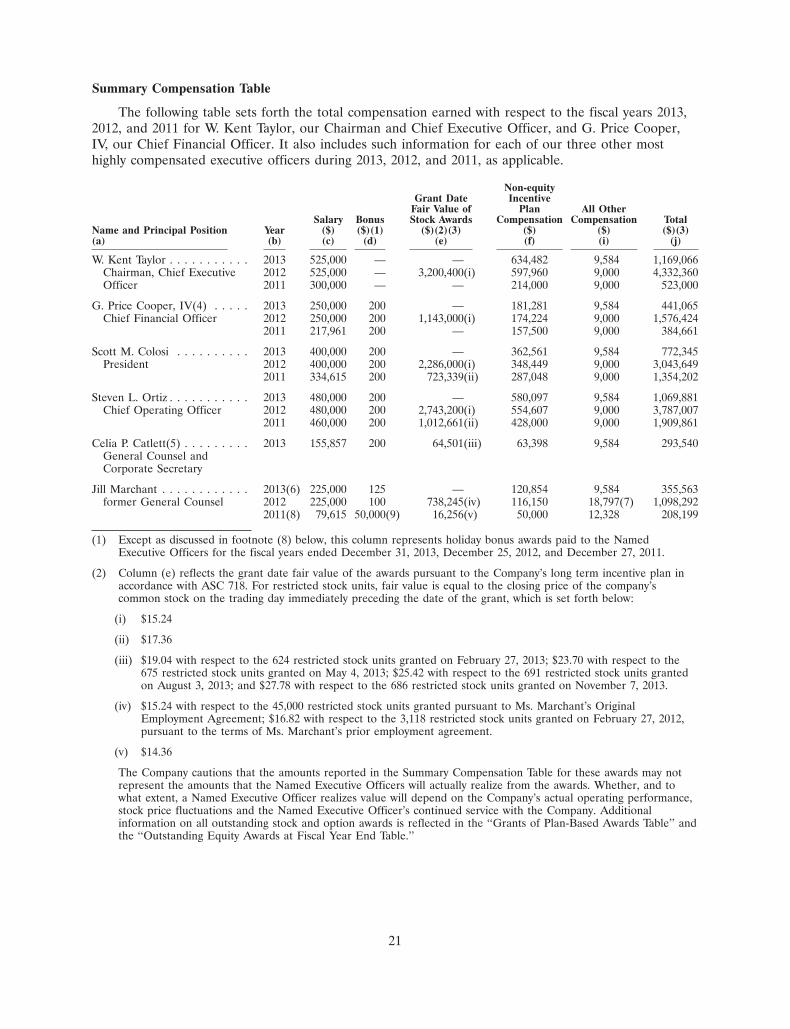
Summary Compensation Table
The following table sets forth the total compensation earned with respect to the fiscal years 2013,2012, and 2011 for W. Kent Taylor, our Chairman and Chief Executive Officer, and G. Price Cooper,IV, our Chief Financial Officer. It also includes such information for each of our three other mosthighly compensated executive officers during 2013, 2012, and 2011, as applicable.
Non-equityGrant Date Incentive
Fair Value of Plan All OtherSalary Bonus Stock Awards Compensation Compensation Total
Name and Principal Position Year ($) ($)(1) ($)(2)(3) ($) ($) ($)(3)(a) (b) (c) (d) (e) (f) (i) (j)
W. Kent Taylor . . . . . . . . . . . 2013 525,000 — — 634,482 9,584 1,169,066Chairman, Chief Executive 2012 525,000 — 3,200,400(i) 597,960 9,000 4,332,360Officer 2011 300,000 — — 214,000 9,000 523,000
G. Price Cooper, IV(4) . . . . . 2013 250,000 200 — 181,281 9,584 441,065Chief Financial Officer 2012 250,000 200 1,143,000(i) 174,224 9,000 1,576,424
2011 217,961 200 — 157,500 9,000 384,661
Scott M. Colosi . . . . . . . . . . 2013 400,000 200 — 362,561 9,584 772,345President 2012 400,000 200 2,286,000(i) 348,449 9,000 3,043,649
2011 334,615 200 723,339(ii) 287,048 9,000 1,354,202
Steven L. Ortiz . . . . . . . . . . . 2013 480,000 200 — 580,097 9,584 1,069,881Chief Operating Officer 2012 480,000 200 2,743,200(i) 554,607 9,000 3,787,007
2011 460,000 200 1,012,661(ii) 428,000 9,000 1,909,861
Celia P. Catlett(5) . . . . . . . . . 2013 155,857 200 64,501(iii) 63,398 9,584 293,540General Counsel andCorporate Secretary
Jill Marchant . . . . . . . . . . . . 2013(6) 225,000 125 — 120,854 9,584 355,563former General Counsel 2012 225,000 100 738,245(iv) 116,150 18,797(7) 1,098,292
2011(8) 79,615 50,000(9) 16,256(v) 50,000 12,328 208,199
(1) Except as discussed in footnote (8) below, this column represents holiday bonus awards paid to the NamedExecutive Officers for the fiscal years ended December 31, 2013, December 25, 2012, and December 27, 2011.
(2) Column (e) reflects the grant date fair value of the awards pursuant to the Company’s long term incentive plan inaccordance with ASC 718. For restricted stock units, fair value is equal to the closing price of the company’scommon stock on the trading day immediately preceding the date of the grant, which is set forth below:
(i) $15.24
(ii) $17.36
(iii) $19.04 with respect to the 624 restricted stock units granted on February 27, 2013; $23.70 with respect to the675 restricted stock units granted on May 4, 2013; $25.42 with respect to the 691 restricted stock units grantedon August 3, 2013; and $27.78 with respect to the 686 restricted stock units granted on November 7, 2013.
(iv) $15.24 with respect to the 45,000 restricted stock units granted pursuant to Ms. Marchant’s OriginalEmployment Agreement; $16.82 with respect to the 3,118 restricted stock units granted on February 27, 2012,pursuant to the terms of Ms. Marchant’s prior employment agreement.
(v) $14.36
The Company cautions that the amounts reported in the Summary Compensation Table for these awards may notrepresent the amounts that the Named Executive Officers will actually realize from the awards. Whether, and towhat extent, a Named Executive Officer realizes value will depend on the Company’s actual operating performance,stock price fluctuations and the Named Executive Officer’s continued service with the Company. Additionalinformation on all outstanding stock and option awards is reflected in the ‘‘Grants of Plan-Based Awards Table’’ andthe ‘‘Outstanding Equity Awards at Fiscal Year End Table.’’
21
(3) The 2012 amounts include the full grant date fair value of the restricted stock units granted to theNamed Executive Officers in their respective Amended Employment Agreements; however, thegrants vest in one-third increments each January 7 over a three-year period beginning onJanuary 7, 2013 and ending on January 7, 2015, subject to continued service to the Company. As aresult the officers did not realize the total amounts reported in columns (e) and (g) in fiscal year2012.
With respect to Ms. Catlett, the grants made during 2013 were not made pursuant to her 2014Employment Agreement. They were made as part of her compensation arrangement in her role asAssociate General Counsel and Corporate Secretary, for which she did not have an employmentagreement. Each grant vests one year from the date of issuance, subject to Ms. Catlett’s continuedservice to the Company. As a result, she did not realize the amounts reported in columns (e) and(g) in fiscal year 2013.
(4) Mr. Cooper assumed the position of Chief Financial Officer on August 17, 2011. Prior to that date,he was employed as Vice President of Finance.
(5) Ms. Catlett assumed the position of General Counsel at the close of business on November 12,2013. Prior to that date, she was employed as Corporate Secretary, a position she held sinceDecember 1, 2011, and as an attorney for the Company, a position she has held since 2005.
(6) Ms. Marchant relinquished her executive officer position effective as of the close of business onNovember 12, 2013, but continued to be employed by the Company through January 7, 2014.
(7) This amount consists of a $7,800 auto allowance and $10,997 in relocation assistance.
(8) Ms. Marchant assumed the position of General Counsel on December 1, 2011. Prior to that date,she was employed as Special Counsel, a position she held since August 15, 2011.
(9) This amount represents a $50,000 one-time relocation bonus.
Grants of Plan-Based Awards in Fiscal Year 2013
The following table presents information with respect to grants of stock awards to the NamedExecutive Officers during fiscal year 2013.
Grants of Plan-Based Awards Table
All Other Stock Grant Date FairAwards: Number Value of
of Shares of Stock Stock and OptionName Grant Date or Units (#)(1) Awards ($)(2)(a) (b) (c) (d)
W. Kent Taylor . . . . . . . . . . . — — —Scott M. Colosi . . . . . . . . . . . — — —Steven L. Ortiz . . . . . . . . . . . — — —G. Price Cooper, IV . . . . . . . . — — —Celia Catlett(3) . . . . . . . . . . . February 27, 2013 624 11,881(i)
May 4, 2013 675 15,998(ii)August 3, 2013 691 17,565(iii)November 7,
2013 686 19,057(iv)Jill Marchant . . . . . . . . . . . . . — — —
(1) Each stock award listed in column (c) consists of restricted stock units, where each unitrepresents the conditional right to receive one share of our common stock upon
22

satisfaction of vesting requirements. See the ‘‘Compensation Discussion and Analysis’’ forthe conditions of accelerated vesting upon termination of employment other than forcause.
(2) Column (d) reflects the grant date fair value of the awards pursuant to the Company’slong term incentive plan in accordance with ASC 718. For restricted stock units, fair valueis equal to the closing price of the company’s common stock on the trading dayimmediately preceding the date of the grant, which was the following:
(i) $19.04 with respect to the 624 restricted stock units granted on February 27, 2013.
(ii) $23.70 with respect to the 675 restricted stock units granted on May 4, 2013.
(iii) $25.42 with respect to the 691 restricted stock units granted on August 3, 2013.
(iv) $27.78 with respect to the 686 restricted stock units granted on November 7, 2013.
The Company cautions that the amounts reported in the Grants of Plan-Based AwardsTable for these awards may not represent the amounts that the Ms. Catlett will actuallyrealize from the awards. Whether, and to what extent, Ms. Catlett realizes value willdepend on the Company’s actual operating performance, stock price fluctuations and hercontinued employment. The Company also notes that each of these grants vests one yearfrom the grant date. As a result Ms. Catlett did not realize the amounts reported incolumns (c) and (d) in fiscal year 2013.
(3) The grants made to Ms. Catlett during 2013 were not made pursuant to her 2014Employment Agreement. They were made as part of her compensation arrangement inher role as Associate General Counsel and Corporate Secretary, for which she did nothave an employment agreement. Each grant vests one year from the date of issuance,subject to Ms. Catlett’s continued service to the Company. As a result, she did not realizethe amounts reported in column (d) in fiscal year 2013.
23

Outstanding Equity Awards
The following table presents information with respect to outstanding stock option and stock awardsas of December 31, 2013 by the Named Executive Officers.
Outstanding Equity Awards at Fiscal Year End Table
Option Awards Stock Awards
Number of Number of Number of Market ValueSecurities Securities Shares or of Shares or
Underlying Underlying Option Units of Units ofUnexercised Unexercised Exercise Option Stock That Stock That
Options Options Price Expiration Have Not Have NotName Exercisable (#) Unexercisable (#) ($) Date Vested (#)(2) Vested ($)(3)(a) (b) (c) (d) (e) (f) (g)
W. Kent Taylor . . . . . — — NA NA 140,000(i) 3,892,000Scott M. Colosi . . . . . — — NA NA 100,000(ii) 2,780,000Steven L. Ortiz . . . . . — — NA NA 120,000(iii) 3,336,000G. Price Cooper, IV . — — NA NA 50,000(iv) 1,390,000Celia P. Catlett(4) . . . 450 — 18.66 08/12/2015(1) 12,700(v) 353,060
450 — 15.23 11/11/2015(1)359 — 15.57 02/27/2016(1)450 — 14.80 05/05/2016(1)437 — 14.66 11/03/2016(1)757 — 15.74 02/26/2017(1)
Jill Marchant(5) . . . . — — NA NA 34,250(vi) 952,150
(1) The option vesting date was 05/23/2008.
See the ‘‘Compensation Discussion and Analysis’’ for the conditions of accelerated vesting upontermination of employment other than for cause.
(2) The vesting schedule is as follows:
(i) 70,000 shares on January 7, 2014; and 70,000 shares on January 7, 2015.
(ii) 50,000 shares on January 7, 2014; and 50,000 shares on January 7, 2015.
(iii) 60,000 shares on January 7, 2014; and 60,000 shares on January 7, 2015.
(iv) 25,000 shares on January 7, 2014; and 25,000 shares on January 7, 2015.
(v) 1,050 shares on February 25, 2014; 1,050 shares on May 3, 2014; 1,050 shares on August 2,2014; 1,050 shares on November 1, 2014; and 8,500 shares on January 7, 2015.
(vi) All shares on January 7, 2014, pursuant to the terms of Ms. Marchant’s Separation Agreementand General Release.
See the Compensation Discussion and Analysis for the conditions of accelerated vesting upontermination of employment other than for cause.
(3) Market value was computed using the Company’s closing stock price on December 31, 2013 of$27.80 per share, which the date the Company’s fiscal year ended.
(4) Ms. Catlett became an executive officer at the close of business on November 12, 2013.
(5) Ms. Marchant relinquished her executive officer position effective as of the close of business onNovember 12, 2013.
24

Options Exercised and Stock Vested
The following table presents information with respect to stock options exercised and stock awardsvested during the fiscal year ended December 31, 2013 by the Named Executive Officers.
Option Exercises and Stock Vested Table
Option Awards Stock Awards
Number of Value Realized Number of Value RealizedShares Acquired on Exercise Shares Acquired on Vesting
Name on Exercise (#) ($)(1) on Vesting (#) ($)(2)(a) (b) (c) (d) (e)
W. Kent Taylor . . . . . . . — NA 70,000 1,260,000(i)Scott M. Colosi . . . . . . . — NA 91,667 1,650,006(i)Steven L. Ortiz . . . . . . . 77,896 788,697 118,333 2,129,994(i)G. Price Cooper, IV . . . — NA 25,000 450,000(i)Celia P. Catlett(3) . . . . . — NA 2,676 64,501(ii)Jill Marchant(4) . . . . . . — NA 15,000 270,000(i)
(1) The value realized upon exercise of options represents the difference between the marketvalue of the underlying securities at exercise and the exercise price of the options.
(2) The value realized upon vesting of restricted stock units represents the fair value of theunderlying shares based on the closing price of the Company’s common stock on thetrading day immediately preceding the vesting date, which is in accordance with thefollowing:
(i) $18.00 with respect to the vesting date of January 7, 2013.
(ii) $19.04 with respect to the vesting date of February 27, 2013; $23.70 with respect tothe vesting date of May 4, 2013; $25.42 with respect to the vesting date of August 3,2013; and $27.78 with respect to the vesting date of November 7, 2013.
(3) Ms. Catlett became an executive officer at the close of business on November 12, 2013.
(4) Ms. Marchant relinquished her executive officer position effective as of the close ofbusiness on November 12, 2013.
Termination, Change of Control and Change of Responsibility Payments
If a Named Executive Officer resigns or is terminated for cause prior to the expiration of the termof his or her Current Employment Agreement, the officer shall receive payment of his or her annualbase salary then in effect through the date of resignation or termination.
If a Named Executive Officer is terminated prior to the expiration of the term of his or herCurrent Employment Agreement as a result of death or disability, such officer’s beneficiary or estateshall be entitled to receive an amount equal to such officer’s annual base salary then in effect throughthe date of termination due to death or disability, plus any earned but unpaid bonus, plus the amountof such officer’s annual base salary then in effect for 180 days following the termination, plus a fixedbonus amount as follows: for Mr. Taylor, $262,500; for Mr. Colosi, $150,000; for Mr. Ortiz, $240,000;for Mr. Cooper, $75,000; and for Ms. Catlett, $37,500.
The following table lists the estimated amounts payable to a Named Executive Officer pursuant tothe Current Employment Agreements if his or her employment had been terminated without causeunrelated to a change of control on December 31, 2013, the last day of our fiscal year, provided thateach officer signed a full release of all claims against us.
25

Termination Payments Table
Estimated Value ofNewly Vested
Estimated Stock AwardsName Payments ($)(1) ($)(2) Total ($)(a) (b) (c) (d)
W. Kent Taylor . . . . . . . . . . . . . . . . . . 100 3,892,000 3,892,100Scott M. Colosi . . . . . . . . . . . . . . . . . . 347,260 2,780,000 3,127,260Steven L. Ortiz . . . . . . . . . . . . . . . . . . 100 3,336,000 3,336,100G. Price Cooper, IV . . . . . . . . . . . . . . . 198,288 1,390,000 1,588,288Celia P. Catlett . . . . . . . . . . . . . . . . . . — — —
(1) Messrs. Taylor and Ortiz were each entitled to a crisp $100 bill upon the termination oftheir employment without cause. If the employment of Mr. Colosi had been terminatedunder those circumstances, he would have received the proportionate share of his annualbase salary then in effect ($400,000) for 180 days, plus $150,000. If the employment ofMr. Cooper had been terminated under those circumstances, he would have received theproportionate share of his annual base salary then in effect ($250,000) for 180 days, plus$75,000. The Company had not entered into an employment agreement with Ms. Catlettas of December 31, 2013.
(2) Each officer’s restricted stock units would have become immediately vested upon atermination of his or her employment without cause. The amounts shown in this columnrepresent the value of the restricted stock units at the closing price of our common stockon December 31, 2013, which was $27.80. The number of restricted stock units whichwould have vested on that date is shown in ‘‘Outstanding Equity Awards.’’ None of theNamed Executive Officers had unvested stock options as of December 31, 2013. TheCompany had not entered into an employment agreement with Ms. Catlett as ofDecember 31, 2013, so her unvested restricted stock units would not have been subject tovesting upon a change in control.
The following table lists the estimated amounts payable to a Named Executive Officer if his or heremployment had been terminated without cause following a change of control, or if any of the officershad resigned his or her position for good reason following a change of control, on December 31, 2013,the last day of our fiscal year, provided that each officer signed a full release of all claims against us.
Change in Control, Change in Responsibilities Payments Table
Estimated Value ofEstimated Newly Vested
Name Payments ($)(1) Stock Awards ($)(2) Total ($)(a) (b) (c) (d)
W. Kent Taylor . . . . . . . . . . . . . . . . . . 1,585,096 3,892,000 5,477,096Scott M. Colosi . . . . . . . . . . . . . . . . . 1,107,692 2,780,000 3,887,692Steven L. Ortiz . . . . . . . . . . . . . . . . . . 1,449,231 3,336,100 4,785,331G. Price Cooper, IV . . . . . . . . . . . . . . 654,808 1,261,500 2,044,808Celia P. Catlett . . . . . . . . . . . . . . . . . . — — —
(1) With the exception of Ms. Catlett, who had not entered into an employment agreementas of December 31, 2013, if the employment of any of the officers had been terminatedwithout cause following a change of control, or if any of the officers had resigned his orher position for good reason following a change of control, the officer would havereceived the amount of his or her then current base salary and incentive bonus through
26

the end of the term of the officer’s employment agreement, but not less than one year.Had an officer’s employment been so terminated on December 31, 2013, each officer,with the exception of Ms. Catlett, would have received payment through January 7, 2015.
The table below details the estimated payment for each officer.
TotalEstimated
Name Salary ($) Bonus ($) Payments ($)(a) (b) (c) (d)
W. Kent Taylor . . . . . . . . . . . . . . . . . . . 1,060,096 525,000 1,585,096Scott M. Colosi . . . . . . . . . . . . . . . . . . 807,692 300,000 1,107,692Steven L. Ortiz . . . . . . . . . . . . . . . . . . . 969,231 480,000 1,449,231G. Price Cooper, IV . . . . . . . . . . . . . . . 504,808 150,000 654,808Celia P. Catlett . . . . . . . . . . . . . . . . . . . — — —
(2) With the exception of Ms. Catlett, each officer’s restricted stock units would have becomeimmediately exercisable upon a termination of his or her employment without causefollowing a change of control, or if any of the officers had resigned his or her position forgood reason following a change of control. The amounts shown in this column representthe value of the restricted stock units at the closing price of our common stock onDecember 31, 2013, which was $27.80. The number of restricted stock units which wouldhave vested on that date are shown in ‘‘Outstanding Equity Awards.’’ None of the NamedExecutive Officers had unvested stock options as of December 31, 2013.
27

AUDIT COMMITTEE REPORT
The audit committee of the Board is composed of three directors, all of whom meet the criteriafor independence under the applicable NASDAQ and SEC rules and the Sarbanes-Oxley Act. Thecommittee acts under a written charter adopted by the Board, a copy of which is available on theCompany’s website at www.texasroadhouse.com.
The audit committee has prepared the following report on its activities and with respect to theCompany’s audited financial statements for the fiscal year ended December 31, 2013 (the ‘‘AuditedFinancial Statements’’).
• The audit committee met 15 times during fiscal year 2013. The committee’s meetings includedprivate sessions with the Company’s independent auditors and internal auditor, as well asexecutive sessions consisting of only committee members. The committee also met periodically inprivate sessions with management, including the Company’s Chief Financial Officer and theCompany’s General Counsel;
• The audit committee reviewed the certification process for the Company’s Code of Conduct, andthe corresponding results.
• The audit committee reviewed the scope, plans and results of the testing performed by theCompany’s internal auditors and independent auditors in their assessments of internal controlover financial reporting;
• The audit committee reviewed the matters submitted to it via the Company’s whistleblowerhotline regarding concerns about allegedly questionable financial, accounting or auditing matters;
• The audit committee reviewed with management, including the internal auditor and the GeneralCounsel, and the independent auditors, the Company’s practices with respect to risk assessmentand risk management. The overall adequacy and effectiveness of the Company’s legal, regulatoryand ethical compliance programs were also reviewed;
• The audit committee reviewed with the General Counsel the Company’s disclosures with respectto current lawsuits;
• The audit committee reviewed any comment letters received from the Securities and ExchangeCommission, together with management’s response to such letters;
• The audit committee pre-approved all audit, audit-related and permissible non-audit servicesprovided to the Company by KPMG LLP, the Company’s independent auditors for the fiscalyear 2013, before management engaged the auditors for those purposes.
• On a quarterly basis, the audit committee discussed with KPMG LLP, the Company’sindependent auditors for the fiscal year 2013, the matters required to be discussed by the PublicCompany Accounting Oversight Board Auditing Standard No. 16, Communications with AuditCommittees;
• The audit committee received from the independent auditors the written disclosures and theletter from KPMG LLP required by applicable requirements of the Public Company AccountingOversight Board regarding the independent auditor’s communications with the audit committeeconcerning independence, and has discussed with the independent auditor the independentauditor’s independence;
• The audit committee reviewed the selection, application and disclosure of critical accountingpolicies;
• The audit committee reviewed the Company’s earnings press releases prior to issuance;
28

• The audit committee reviewed and discussed the Company’s audited financial statements for thefiscal year 2013 with management and the independent auditor;
• The audit committee reviewed the Company’s Quarterly and Annual Reports on Form 10-Q andForm 10-K prior to filing with the SEC; and
• Based on the review and discussion referred to above, and in reliance thereon, the auditcommittee recommended to the Board that the Audited Financial Statements be included in theCompany’s Annual Report on Form 10-K for the fiscal year ended December 31, 2013, for filingwith the SEC.
All members of the audit committee concur in this report.
Gregory N. Moore, ChairJames F. ParkerJames R. Ramsey
Related Transactions
The audit committee’s charter provides that the audit committee will review and approve anytransactions between us and any of our executive officers, directors and 5% shareholders, or anymembers of their immediate families, in which the amount involved exceeds the threshold limitsestablished by the regulations of the SEC. In reviewing a related-party transaction, the audit committeeconsiders the material terms of the transaction, including whether the terms are generally available toan unaffiliated third party under similar circumstances. Unless specifically noted, the transactionsdescribed below were entered into before our initial public offering and the subsequent formation ofthe audit committee.
Grants of Franchise or License Rights
We have licensed or franchised restaurants to companies owned in part by the executive officerslisted below. The licensing or franchise fees paid by these companies to us range from 0.0% to 3.5% ofrestaurant sales, which is less than the amount we typically charge to franchisees. We believe thatallowing certain executive officers with ownership interests in our restaurants that pre-dated our initial
29

public offering to continue to maintain those ownership interests adds an ongoing benefit to theCompany by making the executive officers more invested in the overall success of the brand.
Management orInitial Royalties Paid to Supervision Fees
Franchise Royalty Us in Fiscal Paid to Us inRestaurant Name and Ownership Fee Rate 2013 Fiscal 2013
($ in thousands) ($ in thousands)
Billings, MT . . . . . . . . . W. Kent Taylor (55.0%) — 3.5% 160,277 22,897Scott M. Colosi (2.0%)
Bossier City, LA . . . . . . Steven L. Ortiz (66.0%) — 3.5% 145,826 20,832Brownsville, TX . . . . . . Steven L. Ortiz (30.61%) — 3.5% 194,447 27,778Everett, MA . . . . . . . . W. Kent Taylor (59.0%) — 3.5% 209,309 29,901Fargo, ND . . . . . . . . . . Scott M. Colosi (5.05%) — 3.5% 152,260 21,766Lexington, KY . . . . . . . W. Kent Taylor (10.0%) — 2.0% 92,874 —Longmont, CO . . . . . . . Steven L. Ortiz (47.5%) — 3.5% 111,656 15,951McKinney, TX . . . . . . . Steven L. Ortiz (30.0%) — 3.5% 150,601 21,514
Scott M. Colosi (2.0%)Melbourne, FL . . . . . . . W. Kent Taylor (34.0%) — — — 101,172Muncie, IN . . . . . . . . . W. Kent Taylor (11.48%) — — 37,500 12,500New Berlin, WI . . . . . . Steven L. Ortiz (30.0%) — 3.5% 101,305 14,472
Scott M. Colosi (2.0%)Omaha, NE . . . . . . . . . Scott M. Colosi (10.99%) — 3.5% 146,778 20,968Port Arthur, TX . . . . . . W. Kent Taylor (30.0%) — 3.5% 160,633 22,948
Steven L. Ortiz (30.5%)Scott M. Colosi (3.0%)
Temple, TX . . . . . . . . . Steven L. Ortiz (78.0%) — 3.5% 133,616 19,088Wichita, KS . . . . . . . . . W. Kent Taylor (48.1%) — 3.5% 239,420 34,203
Scott M. Colosi (4.0%)
On March 19, 2004, we entered into a preliminary franchise agreement with a company which is95% owned by W. Kent Taylor to develop a restaurant at a location which is to be determined. Theterms of the preliminary franchise agreement provide for no initial franchise fees and royalties of 3.5%of restaurant sales. During 2013, we received no payment from this franchise restaurant, as none wasdue. The executive officers will not be granted any additional franchise rights.
The franchise agreements and preliminary franchise agreements that we have entered into with ourexecutive officers contain the same terms and conditions as those agreements that we enter into withour other domestic franchisees, with the exception of the initial franchise fees and the royalty rates,which are currently $40,000 and 4.0%, respectively, for our other domestic franchisees. We have thecontractual right, but not the obligation, to acquire the restaurants owned by our executive officersbased on a pre-determined valuation formula which is the same as the formula contained in thedomestic franchise agreements that we have entered into with other franchisees with whom we havesuch rights. A preliminary agreement for a franchise may be terminated if the franchisee does notidentify and obtain our approval of its restaurant management personnel, locate and obtain ourapproval of a suitable site for the restaurant or does not demonstrate to us that it has securednecessary capital and financing to develop the restaurant. Once a franchise agreement has been enteredinto, it may be terminated if the franchisee defaults in the performance of any of its obligations underthe agreement, including its obligations to operate the restaurant in strict accordance with ourstandards and specifications. A franchise agreement may also be terminated if a franchisee becomesinsolvent, fails to make its required payments, creates a threat to the public health or safety, ceases tooperate the restaurant or misuses the Texas Roadhouse trademarks.
30

Other Related Transactions
The Longview, Texas restaurant, leases the land and restaurant building from an entity controlledby Steven L. Ortiz, our Chief Operating Officer. The lease is for 15 years and will terminate inNovember 2014. We can renew the lease for two additional periods of five years each. Rent isapproximately $19,000 per month. The lease can be terminated if the tenant fails to pay the rent on atimely basis, fails to maintain the insurance specified in the lease, fails to maintain the building orproperty or becomes insolvent. Total rent payments for 2013 were approximately $224,000.
The Bossier City, Louisiana restaurant, of which Steven L. Ortiz beneficially owns 66.0% and weown 5.0%, is leased from an entity owned by Mr. Ortiz. The lease is for 15 years and will terminate onMarch 31, 2020. We can renew the lease for three additional periods of five years each. Rent isapproximately $16,600 per month and escalates 10% each five years during the term. The lease can beterminated if the tenant fails to pay rent on a timely basis, fails to maintain insurance, abandons theproperty or becomes insolvent. The tenant’s obligation to pay rent commenced in April 2005 and totalrent payments for 2012 were approximately $199,000. The audit committee ratified this transaction inFebruary 2005 after considering market rentals of comparable land and building leases and consideringour limited ownership interest. Additionally, the audit committee requested that we attempt topurchase the land and building from Mr. Ortiz’s entity in the event the restaurant is ever acquired byus.
We entered into real estate lease agreements for franchise restaurants located in Everett, MA, ofwhich W. Kent Taylor beneficially owns 59.0%, Longmont, CO, of which Steven L. Ortiz owns 47.5%,and Fargo, ND, of which Scott M. Colosi owns 5.05%, before our granting franchise rights for thoserestaurants. We have subsequently assigned the leases to the franchisees, but we remain contingentlyliable if a franchisee defaults under the terms of a lease. The Longmont lease expires in May 2019, theEverett lease expires in February 2018, and the Fargo lease expires in July 2016.
31

PRESENTATION OF PROPOSALS
PROPOSAL 1—ELECTION OF DIRECTORS
The Company’s by-laws provide for not less than one and not more than 15 directors. Our Boardcurrently consists of six directors divided into three classes, with members of each class serving athree-year term. At the Annual Meeting, we are electing two Class I directors. Although it is notanticipated that either of the nominees listed below will decline or be unable to serve, if that shouldoccur, the proxy holders may, in their discretion, vote for substitute nominees.
Nominees for Election as Directors
Set forth below are the Board members who will stand for re-election at the Annual Meeting,together with their ages, all Company positions and offices each person currently holds and the year inwhich each person joined the Board.
DirectorName Age Position or Office Since
James R. Ramsey . . . . . . . . . . . . . . . . . . . . . . . . . . 65 Director 2004James R. Zarley . . . . . . . . . . . . . . . . . . . . . . . . . . . 69 Director 2004
Recommendation
THE BOARD OF DIRECTORS RECOMMENDS THAT SHAREHOLDERS VOTE ‘‘FOR’’ THEELECTION OF EACH OF THE NOMINEES FOR CLASS III DIRECTORS OF THE COMPANY.
32

PROPOSAL 2—RATIFICATION OF INDEPENDENT AUDITORS
Pursuant to its charter, the audit committee has appointed the firm of KPMG LLP to serve as theindependent auditors to audit the consolidated financial statements and the internal control overfinancial reporting of the Company for the fiscal year which ends on December 30, 2014. Accordingly,a resolution will be presented at the Annual Meeting to ratify the appointment of KPMG LLP. If theshareholders fail to ratify the appointment of KPMG LLP, the audit committee will take this result intoaccount when appointing an independent auditor for fiscal year 2015. Even if the appointment isratified, the audit committee in its discretion may direct the appointment of a different independentregistered public accounting firm as the Company’s independent auditors at any time during the year ifthe audit committee believes that such a change would be in the best interests of the Company and itsshareholders. One or more representatives of KPMG LLP are expected to be present at the AnnualMeeting, will have the opportunity to make a statement if they desire to do so and will be available torespond to appropriate questions.
Fees Paid to the Independent Auditors
We paid the following fees to KPMG LLP for fiscal years 2013 and 2012:
2013 2012
Audit Fees . . . . . . . . . . . . . . . . . . . . . . . . . . . . . . . . . . . . . . . . 567,500 537,000Audit-related Fees . . . . . . . . . . . . . . . . . . . . . . . . . . . . . . . . . . — —Tax Fees . . . . . . . . . . . . . . . . . . . . . . . . . . . . . . . . . . . . . . . . . 9,100 12,706
576,600 549,706
Audit Fees
KPMG LLP charged $567,500 in fiscal year 2013 and $537,000 in fiscal year 2012 for audit fees.These include professional services in connection with the audit of the Company’s annual financialstatements and its internal control over financial reporting. They also include reviews of the Company’sfinancial statements included in the Company’s Quarterly and Annual Reports on Form 10-Q andForm 10-K and for services that are normally provided by the accountant in connection with statutoryand regulatory filings or engagements for the fiscal years shown.
Audit-related Fees
KPMG LLP did not charge the Company for any audit-related services in fiscal years 2013 or2012.
Tax Fees
KPMG LLP charged $9,100 for tax consulting services in fiscal year 2013 and $12,706 for taxconsulting services in fiscal year 2012.
Pre-approval Policies and Procedures
The audit committee pre-approved all audit, audit-related and permissible non-audit servicesprovided to the Company by KPMG LLP before management engaged the auditors for those purposes.The policy of the committee is to review all engagement letters for accounting firms for non-auditservices.
Recommendation
THE BOARD OF DIRECTORS RECOMMENDS A VOTE ‘‘FOR’’ THE RATIFICATION OFKPMG LLP AS THE COMPANY’S INDEPENDENT AUDITORS FOR THE FISCAL YEAR 2014.
33

PROPOSAL 3—ADVISORY VOTE ON APPROVAL OF EXECUTIVE COMPENSATION
The Board of Directors requests shareholder approval of the compensation of the Company’sNamed Executive Officers as described in the Compensation Discussion and Analysis, the ExecutiveCompensation section and the other related executive compensation tables and related discussions inthis proxy statement. As an advisory vote, the outcome of the voting on this proposal is not bindingupon the Company; however, the compensation committee, which is responsible for establishing andadministering the Company’s executive compensation program, values the opinions expressed byshareholders on this proposal and will consider the outcome of the vote when making futurecompensation decisions for Named Executive Officers. Additionally, the compensation committeeinvites shareholders to express any questions or concerns regarding the Company’s compensationphilosophy for Named Executive Officers by correspondence addressed to Texas Roadhouse, Inc.Compensation Committee, 6040 Dutchmans Lane, Louisville, KY 40205.
The objective of the compensation committee in setting and evaluating the compensation of ourNamed Executive Officers is to promote the sustained profitability of the Company. Compensation forthe Named Executive Officers is divided into three key components: (1) base salary, which provides asecure base of compensation and serves to motivate and retain our Named Executive Officers; (2) acash bonus, which rewards our Named Executive Officers for the success of the Company as measuredby growth in the Company’s earnings per diluted share and its overall pre-tax profit, and for eachofficer’s individual contribution to that success; and (3) grants of restricted stock units, which offer theNamed Executive Officers a financial interest in the long-term success of the Company and align theirinterests with those of our shareholders. The compensation packages for our Named Executive Officersare somewhat unique in that they offer base salaries and target cash bonus amounts on the low end ofmarket within the casual dining restaurant sector, and feature restricted stock unit awards in fixedamounts, the value of which is wholly dependent upon the price of our common stock.
The underlying philosophy reflected by this approach is that, because a significant amount of eachofficer’s compensation lies in the value of the restricted stock units granted, the officers are motivatedto continually improve the Company’s performance in the hope that the performance will be reflectedby the stock price on the vesting date of their restricted stock units and beyond. Overall, we believethis approach provides the Named Executive Officers with a compensation package which aligns theinterests of our executive officers with those of our shareholders. The compensation packages alsoreflect a pragmatic response to external market conditions; that is, total compensation that iscompetitive with comparable positions in similar industries, including the casual dining sector of therestaurant industry, but which is reasonable and in the best interests of our shareholders. Further, asdiscussed with respect to the annual risk assessment of compensation practices performed jointly by theaudit committee and the compensation committee, we believe that issuing restricted stock unit awardsto our Named Executive Officers in fixed amounts, as opposed to making equity awards whose ultimatevalue is determined by achievement of isolated performance criteria, serves to discourage unnecessaryor excessive risk taking. The use of arbitrarily selected performance metrics to determine the amount ofrestricted stock units granted could create the risk of excessive focus on the achievement of isolatedsubsidiary objectives, to the potential detriment of our ultimate goal of maintaining sustainedprofitability and shareholder returns through Legendary Food and Legendary Service.
This structure, along with the culture and values of our Company, allows the Company to attractand retain top talent, while also encouraging our officers to keep their focus on key strategic financialand operational goals. The Board was pleased to receive shareholder approval of the compensationpackages of our Named Executive Officers in the advisory vote at the prior Annual Meeting and againrequests approval of the compensation packages of our Named Executive Officers.
Recommendation
THE BOARD OF DIRECTORS RECOMMENDS THAT SHAREHOLDERS VOTE ‘‘FOR’’ THEEXECUTIVE COMPENSATION DETAILED IN THIS PROXY STATEMENT.
34

PROPOSAL 4—NONBINDING SHAREHOLDER PROPOSAL REGARDING DECLASSIFICATIONOF THE BOARD OF DIRECTORS
The Comptroller of the State of New York, Thomas P. DiNapoli, trustee of the New York StateCommon Retirement Fund and administrative head of the New York State and Local RetirementSystem, a beneficial owner of 135,045 shares of our Common Stock, intends to submit a resolution toshareholders for approval at the Annual Meeting. We will provide the proponent’s address to anyshareholder promptly upon request. The text of the proponent’s resolution and supporting statementappear below, printed verbatim from its submission. We disclaim all responsibility for the content of theproposal and the supporting statement, including sources referenced therein.
Shareholder Proposal
‘‘RESOLVED, that shareholders of Texas Roadhouse, Inc. urge the Board of Directors to take allnecessary steps (other than any steps that must be taken by shareholders) to eliminate the classificationof the Board of Directors, and to require that all directors elected at or after the annual meeting heldin 2015 stand for elections on an annual basis. Implementation of this proposal should not affect theunexpired terms of any directors elected to the Board of Directors at or prior to the annual meeting ofthe company held in 2014.
SUPPORTING STATEMENT
We believe that the ability to elect directors is the single most important use of the shareholderfranchise. Accordingly, directors should be accountable to shareholders on an annual basis. Theelection of directors by classes, for three-year terms, in our opinion, minimizes accountability andprecludes the full exercise of the rights of shareholders to approve or disapprove annually theperformance of a director or directors.
In addition, since only one-third of the Board of Directors is elected annually, we believe thatclassified boards could frustrate, to the detriment of long-term shareholder interest, the efforts of abidder to acquire control or a challenger to engage successfully in a proxy contest. A staggered boardhas been found to be one of six entrenching mechanisms that are associated with lower firm valuation.See ‘‘What Matters in Corporate Governance?’’ Lucian Bebchuk, Alma Cohen & Allen Ferrell, Reviewof Financial Studies, Vol. 22, Issue 2, 783 (2009).
The New York State Common Retirement Fund urges you to join us in voting to declassify theelection of directors, as a powerful tool for management incentive and accountability. We urge yoursupport FOR this proposal.’’
Board of Directors Opposition Statement
All of the members of our Board recommend that you vote AGAINST this shareholder proposal.After careful consideration of the proposal and the arguments for and against a classified board, ourBoard believes that a classified board structure continues to serve the best interests of both ourCompany and our shareholders.
Business Continuity
The importance of culture to the success of our Company cannot be overstated. A key componentof our competitive advantage is that our Company, and how we run it, is unique and long-termfocused. The fact that our Board maintains a deep appreciation for the relationships, priorities, andgoals that have made us successful is fundamental to preserving our culture. This kind of appreciationdevelops over time. Abrupt changes in the composition of our Board or in our operational focus, basedon short-term initiatives or the special interests of a small group of shareholders, would threaten the
35

success of our Company as a whole. We believe that much of our success is attributable to the factthat our leadership prioritizes long-term performance and strives to balance evolution with stayingtrue to our culture and core values. We further believe that making three-year commitments to ourdirectors is consistent with this business model and sets a ‘‘tone at the top’’ of consistency and stability.
Sound Corporate Governance
While proposals for declassified board structures have become more prolific in the past few years,we caution our shareholders to consider that effective corporate governance is not a one-size-fits-allissue. Our Board of Directors, serving under a classified structure since our initial listing on NASDAQ,have demonstrated strong corporate governance practices, high ethics, and consistent responsiveness toour shareholder base. We also remind you that the members of our Board of Directors are legallyobligated to fulfill fiduciary duties to both the Company and our shareholders, regardless of the lengthof their terms. This is a responsibility that they already take very seriously; annual terms would notserve to enhance it. The Board also benefits from a robust nominating and corporate governancecommittee comprised of all of our independent directors. Under the direction of this committee, theBoard conducts regular self-assessments, reviews and responds to all shareholder correspondence, andstays informed on best practices in board governance.
Consistently Strong Performance
The proponent’s statement refers to a general conclusion from one academic study regarding therelationship between declassified boards and firm valuation as a reason to adopt this serious measure,without stating any specific reasons why declassifying our Board of Directors will benefit ourshareholders. To the contrary, our record of strong performance supports the fact that our experiencedleadership knows best how to drive shareholder value in our Company. The value of our commonstock since our 2:1 split in September 2005 has increased over 180%, and we have exceeded $1.9 billionin market valuation. In addition, returns to shareholders through declared dividends and completedshare repurchases within the past five fiscal years have exceeded $246 million, and we have increasedour quarterly dividend each year since our first dividend was declared in 2011. Finally, in a retail spacethat has faced numerous headwinds in recent years, our comparable restaurant sales have outperformedthe casual dining industry, and we have been growing market share and achieving consistent doubledigit earnings per share growth.
Protecting our Shareholders
The proponent states that the existence of a classified board would frustrate a takeover attempt.We caution you to consider, however, that the presence of a classified board does not preventunsolicited acquisition proposals, but it can provide many benefits in responding to such a proposal. Ifand when an offer is made, a board who is not operating under the threat of imminent removal canmore aggressively and effectively act on behalf of all shareholders by taking an appropriate amount oftime to evaluate the adequacy and fairness of any takeover proposal, to negotiate on behalf of allshareholders, and to consider all alternatives equally. Contrary to the position articulated by theproponent, we believe that the presence of a classified board actually protects our shareholdersbecause it reduces our vulnerability to potentially unfair and abusive takeover tactics and encouragespotential acquirers to negotiate with our Board.
Recommendation
THE BOARD RECOMMENDS A VOTE ‘‘AGAINST’’ THE NONBINDING SHAREHOLDERPROPOSAL REGARDING DECLASSIFICATION OF THE BOARD OF DIRECTORS.
36

SHAREHOLDER PROPOSALS
Under Rule 14a-8 promulgated under the Securities Exchange Act of 1934 (‘‘Exchange Act’’),shareholders may present proposals to be included in the Company proxy statement for considerationat the next annual meeting of its shareholders by submitting their proposals to the Company in a timelymanner. Any such proposal must comply with Rule 14a-8.
The Company’s by-laws, a copy of which is available on the Company’s website,www.texasroadhouse.com, require shareholders who intend to propose business for consideration byshareholders at the 2015 Annual Meeting, other than shareholder proposals that are included in theproxy statement, to deliver written notice to the principal executive offices of the Company on orbefore December 12, 2014. This notice must include a description of the business desired to be broughtbefore the annual meeting, the name and address of the shareholder proposing such business and ofthe beneficial owner, if any, on whose behalf the business is being brought, the class, series and numberof shares of the Company which are beneficially owned by the shareholder and such other beneficialowner and any material interest of the shareholder and such other beneficial owner in such business.Similar requirements are set forth in the Company’s by-laws with respect to shareholders desiring tonominate candidates for election as director. Exchange Act rules permit management to vote proxies inits discretion in certain cases if the shareholder does not comply with these deadlines, and in certainother cases notwithstanding the shareholder’s compliance with these deadlines. If a shareholdersubmitting a matter to be raised at the Company’s next annual meeting desires that such matter beincluded in the Company’s proxy statement, such matter must be submitted to the Company no laterthan December 12, 2014.
The rules of the SEC set forth standards for what shareholder proposals the Company is requiredto include in a proxy statement for an annual meeting.
SHAREHOLDERS’ COMMUNICATIONS WITH THE BOARD
Shareholders that want to communicate in writing with the Board, or specific directors individually,may send proposed communications to the Company’s General Counsel and Corporate Secretary, CeliaCatlett, at 6040 Dutchmans Lane, Louisville, Kentucky 40205. The proposed communication will bereviewed by Ms. Catlett and by the audit committee. If the communication is appropriate and serves toadvance or improve the Company or its performance, it will be forwarded to the Board or theappropriate director.
FORM 10-K
The Company’s Annual Report on Form 10-K for the fiscal year ended December 31, 2013,accompanies this proxy statement. The Company’s Annual Report does not form any part of thematerial for solicitation of proxies.
Any shareholder who wishes to obtain, without charge, a copy of the Company’s Annual Report onForm 10-K for the fiscal year ended December 31, 2013, which includes financial statements, and isrequired to be filed with the SEC, may access it at www.texasroadhouse.com in the Investors section ormay send a written request to Celia Catlett, General Counsel and Corporate Secretary, TexasRoadhouse, Inc., 6040 Dutchmans Lane, Louisville, Kentucky 40205.
37

16MAR201217592224
OTHER BUSINESS
The Board is not aware of any other matters to be presented at the Annual Meeting other thanthose set forth herein and routine matters incident to the conduct of the meeting. If any other mattersshould properly come before the Annual Meeting or any adjournment or postponement thereof, thepersons named in the proxy, or their substitutes, intend to vote on such matters in accordance withtheir best judgment.
By Order of the Board of Directors,
Celia CatlettCorporate Secretary
Louisville, KentuckyApril 11, 2014
Please vote your shares through any of the methods described on the proxy card as promptly aspossible, whether or not you plan to attend the Annual Meeting in person. If you do attend the AnnualMeeting, you may still vote in person, since the proxy may be revoked at any time before its exercise bydelivering a written revocation of the proxy to the Company’s Corporate Secretary.
38
UNITED STATESSECURITIES AND EXCHANGE COMMISSION
Washington, D.C. 20549
FORM 10-K(Mark One)
� ANNUAL REPORT PURSUANT TO SECTION 13 OR 15(D) OF THE SECURITIESEXCHANGE ACT OF 1934
For the fiscal year ended December 31, 2013
OR
� TRANSITION REPORT PURSUANT TO SECTION 13 OR 15(D) OF THE SECURITIESEXCHANGE ACT OF 1934
For the transition period from to
Texas Roadhouse, Inc.(Exact name of registrant specified in its charter)
Delaware 000-50972 20-1083890(State or other jurisdiction of (Commission File Number) (IRS Employerincorporation or organization) Identification Number)
6040 Dutchmans Lane, Suite 200Louisville, Kentucky 40205
(Address of principal executive offices) (Zip Code)
(502) 426-9984(Registrant’s telephone number, including area code)
Securities registered pursuant to Section 12(b) of the Act:
Title of Each Class Name of Each Exchange on Which Registered
Common Stock, par value $0.001 per share Nasdaq Global Select Market
Securities registered pursuant to Section 12(g) of the Act: None
Indicate by check mark if the registrant is a well-known seasoned issuer, as defined in Rule 405 of the SecuritiesAct. Yes � No �.
Indicate by check mark if the registrant is not required to file reports pursuant to Section 13 or Section 15(d) of theExchange Act. Yes � No �.
Indicate by check mark whether registrant (1) has filed all reports required to be filed by Section 13 or 15(d) of theSecurities Exchange Act of 1934 during the preceding 12 months (or for such shorter period that the registrant was required tofile such reports) and (2) has been subject to such filing requirements for the past 90 days. Yes � No �.
Indicate by check mark whether the registrant has submitted electronically and posted on its corporate Web site, if any,every Interactive Data File required to be submitted and posted pursuant to Rule 405 of Regulation S-T during the preceding12 months (or for such shorter period that the registrant was required to submit and post such files). Yes � No �.
Indicate by check mark if disclosure of delinquent filers pursuant to Item 405 of Regulation S-K is not contained hereinand will not be contained, to the best of registrant’s knowledge, in definitive proxy or information statements incorporated byreference in Part III of this Form 10-K or any amendment to the Form 10-K. �.
Indicate by check mark whether the registrant is a large accelerated filer, an accelerated filer, a non-accelerated filer or asmaller reporting company. See definitions of ‘‘large accelerated filer’’, ‘‘accelerated filer’’ and ‘‘smaller reporting company’’ inRule 12b-2 of the Exchange Act.
Large accelerated filer � Accelerated filer � Non-accelerated filer � Smaller reporting company �
Indicate by check mark whether the registrant is a shell company (as defined in Rule 12b-2 of the ExchangeAct). Yes � No �.
The aggregate market value of the voting stock held by non-affiliates of the registrant as of the last day of the secondfiscal quarter ended June 25, 2013 was $1,528,082,277 based on the closing stock price of $24.49. Shares of voting stock held byeach officer and director have been excluded in that such persons may be deemed to be affiliates. This determination of affiliatestatus is not necessarily a conclusive determination for other purposes. The market value calculation was determined using theclosing stock price of our common stock on the Nasdaq Global Select Market.
The number of shares of common stock outstanding were 69,967,867 on February 19, 2014.
Portions of the registrant’s definitive Proxy Statement for the registrant’s 2014 Annual Meeting of Stockholders, which isexpected to be filed pursuant to Regulation 14A within 120 days of the registrant’s fiscal year ended December 31, 2013, areincorporated by reference into Part III of the Form 10-K. With the exception of the portions of the Proxy Statement expresslyincorporated by reference, such document shall not be deemed filed with this Form 10-K.

TABLE OF CONTENTS
Page
PART IItem 1. Business . . . . . . . . . . . . . . . . . . . . . . . . . . . . . . . . . . . . . . . . . . . . . . . . . . . 5Item 1A. Risk Factors . . . . . . . . . . . . . . . . . . . . . . . . . . . . . . . . . . . . . . . . . . . . . . . . 18Item 1B. Unresolved Staff Comments . . . . . . . . . . . . . . . . . . . . . . . . . . . . . . . . . . . . 29Item 2. Properties . . . . . . . . . . . . . . . . . . . . . . . . . . . . . . . . . . . . . . . . . . . . . . . . . 29Item 3. Legal Proceedings . . . . . . . . . . . . . . . . . . . . . . . . . . . . . . . . . . . . . . . . . . . 30Item 4. Mine Safety Disclosures . . . . . . . . . . . . . . . . . . . . . . . . . . . . . . . . . . . . . . . 30
PART II
Item 5. Market for Registrant’s Common Equity, Related Stockholder Matters andIssuer Purchases of Equity Securities . . . . . . . . . . . . . . . . . . . . . . . . . . . . 31
Item 6. Selected Financial Data . . . . . . . . . . . . . . . . . . . . . . . . . . . . . . . . . . . . . . . 34Item 7. Management’s Discussion and Analysis of Financial Condition and Results of
Operations . . . . . . . . . . . . . . . . . . . . . . . . . . . . . . . . . . . . . . . . . . . . . . . 36Item 7A. Quantitative and Qualitative Disclosures About Market Risk . . . . . . . . . . . . 56Item 8. Financial Statements and Supplementary Data . . . . . . . . . . . . . . . . . . . . . . . 57Item 9. Changes in and Disagreements with Accountants on Accounting and
Financial Disclosure . . . . . . . . . . . . . . . . . . . . . . . . . . . . . . . . . . . . . . . . 57Item 9A. Controls and Procedures . . . . . . . . . . . . . . . . . . . . . . . . . . . . . . . . . . . . . . . 57Item 9B. Other Information . . . . . . . . . . . . . . . . . . . . . . . . . . . . . . . . . . . . . . . . . . . 58
PART III
Item 10. Directors, Executive Officers and Corporate Governance . . . . . . . . . . . . . . . 59Item 11. Executive Compensation . . . . . . . . . . . . . . . . . . . . . . . . . . . . . . . . . . . . . . . 59Item 12. Security Ownership of Certain Beneficial Owners and Management and
Related Stockholder Matters . . . . . . . . . . . . . . . . . . . . . . . . . . . . . . . . . . 59Item 13. Certain Relationships and Related Transactions and Director Independence . . 59Item 14. Principal Accounting Fees and Services . . . . . . . . . . . . . . . . . . . . . . . . . . . . 59
PART IV
Item 15. Exhibits, Financial Statement Schedules . . . . . . . . . . . . . . . . . . . . . . . . . . . . 60
Signatures . . . . . . . . . . . . . . . . . . . . . . . . . . . . . . . . . . . . . . . . . . . . . . . . . 64
2

SPECIAL NOTE REGARDING FORWARD-LOOKING STATEMENTS
This Annual Report on Form 10-K contains statements about future events and expectations thatconstitute forward-looking statements within the meaning of Section 27A of the Securities Act of 1933,as amended, and Section 21E of the Securities Exchange Act of 1934, as amended. Forward-lookingstatements are based on our beliefs, assumptions and expectations of our future financial and operatingperformance and growth plans, taking into account the information currently available to us. Thesestatements are not statements of historical fact. Forward-looking statements involve risks anduncertainties that may cause our actual results to differ materially from the expectations of futureresults we express or imply in any forward-looking statements. In addition to the other factors discussedunder ‘‘Risk Factors’’ elsewhere in this report, factors that could contribute to these differences include,but are not limited to:
• our ability to raise capital in the future;
• our ability to successfully execute our growth strategy;
• our ability to successfully open new restaurants, acquire franchise restaurants or execute otherstrategic transactions;
• our ability to increase and/or maintain sales and profits at our existing restaurants;
• our ability to integrate the franchise or other restaurants which we acquire or develop;
• the continued service of key management personnel;
• health concerns about our food products;
• our ability to attract, motivate and retain qualified employees;
• the impact of federal, state or local government laws and regulations relating to our employeesor production and the sale of food and alcoholic beverages;
• the impact of litigation, including negative publicity;
• the cost of our principal food products;
• labor shortages or increased labor costs, such as health care, market wage levels and workers’compensation insurance costs;
• inflationary increases in the costs of construction and/or real estate;
• changes in consumer preferences and demographic trends;
• the impact of initiatives by competitors and increased competition generally;
• our ability to successfully expand into new domestic and international markets;
• risks associated with partnering with franchisees or other investment partners in markets withwhom we have no prior history and whose interests may not align with ours;
• security breaches of confidential customer information in connection with our electronicprocessing of credit and debit card transactions or the failure of our information technologysystems;
• the rate of growth of general and administrative expenses associated with building astrengthened corporate infrastructure to support our growth initiatives;
• negative publicity regarding food safety, health concerns and other food or beverage relatedmatters, including the integrity of our or our suppliers’ food processing;
• our franchisees’ adherence to our practices, policies and procedures;
3

• potential fluctuation in our quarterly operating results due to seasonality and other factors;
• supply and delivery shortages or interruptions;
• our ability to adequately protect our intellectual property;
• volatility of actuarially determined insurance losses and loss estimates;
• adoption of new, or changes in existing, accounting policies and practices;
• adverse weather conditions which impact guest traffic at our restaurants; and
• unfavorable general economic conditions in the markets in which we operate that adverselyaffect consumer spending.
The words ‘‘believe,’’ ‘‘may,’’ ‘‘should,’’ ‘‘anticipate,’’ ‘‘estimate,’’ ‘‘expect,’’ ‘‘intend,’’ ‘‘objective,’’‘‘seek,’’ ‘‘plan,’’ ‘‘strive,’’ ‘‘goal,’’ ‘‘projects,’’ ‘‘forecasts,’’ ‘‘will’’ or similar words or, in each case, theirnegative or other variations or comparable terminology, identify forward-looking statements. We qualifyany forward-looking statements entirely by these cautionary factors.
Other risks, uncertainties and factors, including those discussed under ‘‘Risk Factors,’’ could causeour actual results to differ materially from those projected in any forward-looking statements we make.
We assume no obligation to publicly update or revise these forward-looking statements for anyreason, or to update the reasons actual results could differ materially from those anticipated in theseforward-looking statements, even if new information becomes available in the future.
4

PART I
ITEM 1—BUSINESS
Texas Roadhouse, Inc. (‘‘Texas Roadhouse’’ or the ‘‘Company’’) was incorporated under the laws ofthe state of Delaware in 2004. The principal executive office is located in Louisville, Kentucky.
General Development of Business
Texas Roadhouse is a growing, moderately priced, full-service restaurant chain. Our founder,chairman and chief executive officer (‘‘CEO’’), W. Kent Taylor, started the business in 1993 with theopening of the first Texas Roadhouse in Clarksville, Indiana. Since then, we have grown to420 restaurants in 48 states and three foreign countries. Our mission statement is ‘‘Legendary Food,Legendary Service�.’’ Our operating strategy is designed to position each of our restaurants as the localhometown destination for a broad segment of consumers seeking high quality, affordable meals servedwith friendly, attentive service. As of December 31, 2013, we owned and operated 346 restaurants andfranchised an additional 74 restaurants. Of the 346 restaurants we owned and operated at the end of2013, 345 operated as Texas Roadhouse restaurants.
Financial Information about Operating Segments
We consider our restaurant and franchising operations as similar and have aggregated them into asingle reportable segment. The majority of the restaurants operate in the U.S. within the casual diningsegment of the restaurant industry, providing similar products to similar customers. The restaurants thatoperate in the U.S. also possess similar pricing structures, resulting in similar long-term expectedfinancial performance characteristics. Each of our 346 company-owned restaurants is considered anoperating segment.
Narrative Description of Business
Texas Roadhouse is a full-service, casual dining restaurant chain. We offer an assortment ofspecially seasoned and aged steaks hand-cut daily on the premises and cooked to order over opengas-fired grills. In addition to steaks, we also offer our guests a selection of ribs, fish, seafood, chicken,pork chops, pulled pork and vegetable plates, and an assortment of hamburgers, salads and sandwiches.The majority of our entrees include two made-from-scratch side items, and we offer all our guests afree unlimited supply of roasted in-shell peanuts and made-from-scratch yeast rolls.
The operating strategy that underlies the growth of our concept is built on the following keycomponents:
• Offering high quality, freshly prepared food. We place a great deal of emphasis on providing ourguests with high quality, freshly prepared food. We hand-cut all but one of our assortment ofsteaks and make our sides from scratch. As part of our process, we have developed proprietaryrecipes to provide consistency in quality and taste throughout all restaurants. We expect amanagement level employee to inspect every entree before it leaves the kitchen to confirm itmatches the guest’s order and meets our standards for quality, appearance and presentation. Inaddition, we employ a team of product coaches whose function is to provide continual, hands-ontraining and education to our kitchen staff for the purpose of promoting uniform adherence torecipes, food preparation procedures, food safety standards, food appearance, freshness andportion size.
• Offering performance-based manager compensation. We offer a performance-based compensationprogram to our individual restaurant managers and multi-restaurant supervisors, who are called‘‘managing partners’’ and ‘‘market partners,’’ respectively. Each of these partners earns a basesalary plus a performance bonus, which represents a percentage of each of their respective
5

restaurant’s pre-tax net income. By providing our partners with a significant stake in the successof our restaurants, we believe that we are able to attract and retain talented, experienced andhighly motivated managing and market partners.
• Focusing on dinner. In a high percentage of our restaurants, we limit our operating hours todinner only during the weekdays with one-third of our restaurants offering lunch on Friday. Byfocusing on dinner, our restaurant teams have to prepare for and manage only one shift per dayduring the week. We believe this allows our restaurant teams to offer higher quality, moreconsistent food and service to our guests. In addition, we believe the dinner focus provides abetter ‘‘quality-of-life’’ for our management teams and, therefore, is a key ingredient inattracting and retaining talented and experienced management personnel. We also focus onkeeping our table-to-server ratios low to allow our servers to truly focus on their guests andserve their needs in a personal, individualized manner.
• Offering attractive price points. We offer our food and beverages at moderate price points that webelieve are as low as or lower than those offered by many of our competitors. Within each menucategory, we offer a choice of several price points with the goal of fulfilling each guest’s budgetand value expectations. For example, our steak entrees, which include the choice of two sideitems, generally range from $9.99 for our 6-ounce sirloin to $24.99 for our 23-ounce PorterhouseT-Bone. The per guest average check for the Texas Roadhouse restaurants we owned andoperated in 2013 was $15.80. Per guest average check represents restaurant sales divided by thenumber of guests served. We considered each sale of an entree to be a single guest served. Ourper guest average check is higher as a result of our weekday dinner only focus.
• Creating a fun and comfortable atmosphere. We believe the atmosphere we establish in ourrestaurants is a key component for fostering repeat business. Our restaurants feature a rusticsouthwestern lodge decor accentuated with hand-painted murals, neon signs, and southwesternprints, rugs and artifacts. Additionally, we offer jukeboxes, which continuously play upbeatcountry hits, and in-house entertainment such as line dancing and birthday celebrations.
Unit Prototype and Economics
We design our restaurant prototypes to provide a relaxed atmosphere for our guests, while alsofocusing on restaurant-level returns over time. Our current prototypical Texas Roadhouse restaurantsconsist of a freestanding building with approximately 6,700 to 7,500 square feet of space constructed onsites of approximately 1.7 to 2.0 acres or retail pad sites, with seating of approximately 57 to 68 tablesfor a total of 245 to 291 guests, including 15 bar seats, and parking for approximately 160 vehicleseither on-site or in combination with some form of off-site cross parking arrangement. Our currentprototypes are adaptable to in-line and end-cap locations and/or spaces within an enclosed mall or ashopping center.
As of December 31, 2013, we leased 223 properties and owned 123 properties. Our 2013 averageunit volume, adjusted to a 52 week basis, was $4.2 million, which represents restaurant sales for allTexas Roadhouse company restaurants open before June 26, 2012. The time required for a newrestaurant to reach a steady level of cash flow is approximately three to six months. Our capitalinvestment (including cash and non-cash costs) for new restaurants varies significantly depending on anumber of factors including, but not limited to: the square footage, layout, scope of any required sitework, type of construction labor (union or non-union), local permitting requirements, our ability tonegotiate with landlords, cost of liquor and other licenses and hook-up fees and geographical location.
6

For 2013, the average capital investment, including pre-opening costs, for Texas Roadhouse restaurantsdeveloped was $4.1 million, broken down as follows:
Average Cost Low High
Land(1) . . . . . . . . . . . . . . . . . . . . . . . . . . . . $1,085,000 $ 650,000 $1,720,000Building(2) . . . . . . . . . . . . . . . . . . . . . . . . . . 1,455,000 1,100,000 2,110,000Furniture and Equipment . . . . . . . . . . . . . . . 1,040,000 875,000 1,350,000Pre-opening costs . . . . . . . . . . . . . . . . . . . . . 550,000 385,000 1,430,000Other(3) . . . . . . . . . . . . . . . . . . . . . . . . . . . — — 75,000
Total . . . . . . . . . . . . . . . . . . . . . . . . . . . . . . $4,130,000
(1) Represents the average cost for land acquisitions or 10x’s initial base rent in the event theland is leased.
(2) Includes site work costs.
(3) Primarily liquor licensing costs, where applicable. This cost varies based on the licensingrequirements in each state.
Our 2013 average capital investment for restaurants developed was $4.1 million compared to our2012 average of $3.9 million and our 2011 average of $3.8 million.
Site Selection
We continue to refine our site selection process. In analyzing each prospective site, our real estateteam, including our restaurant market partners, devotes significant time and resources to the evaluationof local market demographics, population density, household income levels and site-specificcharacteristics such as visibility, accessibility, traffic generators, proximity of other retail activities, trafficcounts and parking. We work actively with real estate brokers in target markets to select high qualitysites and to maintain and regularly update our database of potential sites. We typically require three tosix months to locate, approve and control a restaurant site and typically six to 12 additional months toobtain necessary permits. Upon receipt of permits, it requires approximately four months to construct,equip and open a restaurant.
7

Existing Restaurant Locations
As of December 31, 2013, we had 346 company restaurants and 74 franchise restaurants in48 states and three foreign countries as shown in the chart below.
Number of Restaurants
Company Franchise Total
Alabama . . . . . . . . . . . . . . . . . . . . . . . . . . . . . . . . . . . . . . . . 5 — 5Arizona . . . . . . . . . . . . . . . . . . . . . . . . . . . . . . . . . . . . . . . . 13 — 13Arkansas . . . . . . . . . . . . . . . . . . . . . . . . . . . . . . . . . . . . . . . 3 — 3California . . . . . . . . . . . . . . . . . . . . . . . . . . . . . . . . . . . . . . . 2 5 7Colorado . . . . . . . . . . . . . . . . . . . . . . . . . . . . . . . . . . . . . . . 13 1 14Connecticut . . . . . . . . . . . . . . . . . . . . . . . . . . . . . . . . . . . . . . 2 — 2Delaware . . . . . . . . . . . . . . . . . . . . . . . . . . . . . . . . . . . . . . . 2 1 3Florida . . . . . . . . . . . . . . . . . . . . . . . . . . . . . . . . . . . . . . . . . 13 4 17Georgia . . . . . . . . . . . . . . . . . . . . . . . . . . . . . . . . . . . . . . . . 4 7 11Idaho . . . . . . . . . . . . . . . . . . . . . . . . . . . . . . . . . . . . . . . . . . 5 — 5Illinois . . . . . . . . . . . . . . . . . . . . . . . . . . . . . . . . . . . . . . . . . 13 — 13Indiana . . . . . . . . . . . . . . . . . . . . . . . . . . . . . . . . . . . . . . . . . 13 8 21Iowa . . . . . . . . . . . . . . . . . . . . . . . . . . . . . . . . . . . . . . . . . . 9 — 9Kansas . . . . . . . . . . . . . . . . . . . . . . . . . . . . . . . . . . . . . . . . . 3 1 4Kentucky . . . . . . . . . . . . . . . . . . . . . . . . . . . . . . . . . . . . . . . 10 2 12Louisiana . . . . . . . . . . . . . . . . . . . . . . . . . . . . . . . . . . . . . . . 7 1 8Maine . . . . . . . . . . . . . . . . . . . . . . . . . . . . . . . . . . . . . . . . . 3 — 3Maryland . . . . . . . . . . . . . . . . . . . . . . . . . . . . . . . . . . . . . . . 3 5 8Massachusetts . . . . . . . . . . . . . . . . . . . . . . . . . . . . . . . . . . . . 8 1 9Michigan . . . . . . . . . . . . . . . . . . . . . . . . . . . . . . . . . . . . . . . 8 3 11Minnesota . . . . . . . . . . . . . . . . . . . . . . . . . . . . . . . . . . . . . . . 4 — 4Mississippi . . . . . . . . . . . . . . . . . . . . . . . . . . . . . . . . . . . . . . 1 — 1Missouri . . . . . . . . . . . . . . . . . . . . . . . . . . . . . . . . . . . . . . . . 10 — 10Montana . . . . . . . . . . . . . . . . . . . . . . . . . . . . . . . . . . . . . . . . — 1 1Nebraska . . . . . . . . . . . . . . . . . . . . . . . . . . . . . . . . . . . . . . . 3 1 4Nevada . . . . . . . . . . . . . . . . . . . . . . . . . . . . . . . . . . . . . . . . . 1 — 1New Hampshire . . . . . . . . . . . . . . . . . . . . . . . . . . . . . . . . . . . 3 — 3New Jersey . . . . . . . . . . . . . . . . . . . . . . . . . . . . . . . . . . . . . . 4 — 4New Mexico . . . . . . . . . . . . . . . . . . . . . . . . . . . . . . . . . . . . . 2 — 2New York . . . . . . . . . . . . . . . . . . . . . . . . . . . . . . . . . . . . . . . 12 — 12North Carolina . . . . . . . . . . . . . . . . . . . . . . . . . . . . . . . . . . . 16 — 16North Dakota . . . . . . . . . . . . . . . . . . . . . . . . . . . . . . . . . . . . 2 1 3Ohio . . . . . . . . . . . . . . . . . . . . . . . . . . . . . . . . . . . . . . . . . . 22 2 24Oklahoma . . . . . . . . . . . . . . . . . . . . . . . . . . . . . . . . . . . . . . . 6 — 6Oregon . . . . . . . . . . . . . . . . . . . . . . . . . . . . . . . . . . . . . . . . . 2 — 2Pennsylvania . . . . . . . . . . . . . . . . . . . . . . . . . . . . . . . . . . . . . 19 6 25Rhode Island . . . . . . . . . . . . . . . . . . . . . . . . . . . . . . . . . . . . 2 — 2South Carolina . . . . . . . . . . . . . . . . . . . . . . . . . . . . . . . . . . . — 6 6South Dakota . . . . . . . . . . . . . . . . . . . . . . . . . . . . . . . . . . . . 2 — 2Tennessee . . . . . . . . . . . . . . . . . . . . . . . . . . . . . . . . . . . . . . . 11 2 13Texas . . . . . . . . . . . . . . . . . . . . . . . . . . . . . . . . . . . . . . . . . . 51 5 56Utah . . . . . . . . . . . . . . . . . . . . . . . . . . . . . . . . . . . . . . . . . . 9 1 10Vermont . . . . . . . . . . . . . . . . . . . . . . . . . . . . . . . . . . . . . . . . 1 — 1Virginia . . . . . . . . . . . . . . . . . . . . . . . . . . . . . . . . . . . . . . . . 12 — 12Washington . . . . . . . . . . . . . . . . . . . . . . . . . . . . . . . . . . . . . . 1 — 1West Virginia . . . . . . . . . . . . . . . . . . . . . . . . . . . . . . . . . . . . 1 2 3Wisconsin . . . . . . . . . . . . . . . . . . . . . . . . . . . . . . . . . . . . . . . 9 4 13Wyoming . . . . . . . . . . . . . . . . . . . . . . . . . . . . . . . . . . . . . . . 1 — 1
Total domestic restaurants . . . . . . . . . . . . . . . . . . . . . . . . . . 346 70 416Dubai, UAE . . . . . . . . . . . . . . . . . . . . . . . . . . . . . . . . . . . . . — 2 2Jeddah, KSA . . . . . . . . . . . . . . . . . . . . . . . . . . . . . . . . . . . . . — 1 1Kuwait City, Kuwait . . . . . . . . . . . . . . . . . . . . . . . . . . . . . . . . — 1 1
Total international restaurants . . . . . . . . . . . . . . . . . . . . . . . . — 4 4Total system-wide restaurants . . . . . . . . . . . . . . . . . . . . . . . . . . 346 74 420
8

Food
Menu. Texas Roadhouse restaurants offer a wide variety of menu items at attractive prices thatare designed to appeal to a broad range of consumer tastes. Our dinner entree prices generally rangefrom $8.99 to $24.99, with at least 15 meals priced under $10.00. We offer a broad assortment ofspecially seasoned and aged steaks, including 6, 8, 11 and 16 oz. Sirloins; 10, 12, and 16 oz. Rib-eyes;6 and 8 oz. Filets; New York Strip; Prime Rib; and our Porterhouse T-Bone, all cooked over opengas-fired grills and all but one hand-cut daily on the premises. We also offer our guests a selection offish, seafood, chicken, pork chops, ribs, pulled pork and vegetable plates, and an assortment ofhamburgers, salads and sandwiches. Entree prices include made-from-scratch yeast rolls and mostinclude the choice of two of the following made-from-scratch sides: baked potato, sweet potato, steakfries, mashed potatoes, house or Caesar salad, green beans, chili, seasoned rice, buttered corn,applesauce and steamed vegetables. Our menu allows guests to customize their meals by orderingsteaks that are ‘‘smothered’’ either in sauteed mushrooms, onions, cheese or gravy. Guests may alsocustomize their baked potatoes, mashed potatoes or steak fries by ordering them ‘‘loaded’’ with sourcream, cheese, bacon and/or butter. Other menu items include specialty appetizers such as the ‘‘CactusBlossom�’’. We also provide a ‘‘12 & Under’’ menu for children that includes sirloin steak, rib basket,Lil ‘Dillo Steak Bites, Jr. Chicken Tenders, grilled chicken, mini-cheeseburgers, hot dog and macaroniand cheese, all served with one side item and a beverage at prices generally between $3.49 and $7.99.
Most of our restaurants feature a full bar that offers an extensive selection of draft and bottledbeer, major brands of liquor and wine as well as margaritas. Managing partners are encouraged totailor their beer selection to include regional and local brands. Alcoholic beverages accounted forapproximately 11% of restaurant sales at Texas Roadhouse in fiscal 2013.
We have maintained a fairly consistent menu over time, with a selection of approximately60 entrees and 90 total menu items. We continually review our menu to consider enhancements toexisting menu items or the introduction of new items. We change our menu only after guest feedbackand an extensive study of the operational and economic implications. To maintain our high levels offood quality and service, we generally remove one menu item for every new menu item introduced soas to facilitate our ability to execute high quality meals on a focused range of menu items.
Food Quality and Safety. We are committed to serving a varied menu of high-quality, great tastingfood items with an emphasis on freshness. We have developed proprietary recipes to promoteconsistency in quality and taste throughout all restaurants and provide a unique flavor experience toour guests. At each restaurant, a fully trained meat cutter hand cuts our steaks and other restaurantteam members prepare our side items and yeast rolls from scratch in the restaurants daily. We assignindividual kitchen employees to the preparation of designated food items in order to focus on quality,consistency and speed. Additionally, we expect a management level employee to inspect every entreebefore it leaves the kitchen to confirm it matches the guest’s order and meets our standards for quality,appearance and presentation.
We employ a team of product coaches whose function is to provide continual, hands-on trainingand education to the kitchen staff in all Texas Roadhouse restaurants for the purpose of reinforcing theuniformity of recipes, food preparation procedures, food safety standards, food appearance, freshnessand portion size. The team currently consists of over 40 product coaches, supporting all TexasRoadhouse restaurants system-wide.
Food safety is of utmost importance to us. We currently utilize several programs to help facilitateadherence to proper food preparation procedures and food safety standards. We have a ProductQuality team whose function, in conjunction with our product coaches, is to develop, enforce andmaintain programs designed to promote compliance with food safety guidelines. Where required, fooditems purchased from qualified vendors have been inspected by reputable, outside inspection services
9

confirming that the vendor is compliant with United States Food and Drug Administration (‘‘FDA’’)and United States Department of Agriculture (‘‘USDA’’) guidelines.
We generally perform sanitation audits on each restaurant four times a year and these results arereviewed by various members of operations and management. To reinforce the importance of foodsafety, we have printed all HAACP (Hazard Analysis and Critical Points) in bold type on each recipe.In addition, most of our product coaches have obtained or are in the process of obtaining their foodsafety professional designation.
Purchasing. Our purchasing philosophy is designed to supply fresh, quality products to therestaurants at competitive prices while maximizing operating efficiencies. We negotiate directly withsuppliers for substantially all food and beverage products to maximize quality and freshness and obtaincompetitive prices. Certain products, such as dairy products and select produce, are purchased locallyto maximize freshness.
Food and supplies are ordered by and shipped directly to the restaurants, as we do not maintain acentral product warehouse or commissary. Most food products used in the operation of our restaurantsare distributed to individual restaurants through an independent national distribution company. Westrive to qualify more than one supplier for all key food items and believe that beef of comparablequality as well as all other essential food and beverage products are available, upon short notice, fromalternative qualified suppliers.
Service
Guest Satisfaction. We believe that guest satisfaction and our ability to continually evaluate andimprove the guest experience at each of our restaurants is important to our success. Through the use ofguest surveys, our website ‘‘texasroadhouse.com,’’ a toll-free guest response telephone line, socialmedia, and personal interaction in the restaurant, we receive valuable feedback from guests.Additionally, we employ an outside service to administer a ‘‘Secret Shopper’’ program whereby trainedindividuals periodically dine and comprehensively evaluate the guest experience at each of ourrestaurants. Particular attention is given to food, beverage and service quality, cleanliness, staff attitudeand teamwork, and manager visibility and interaction. The resulting reports are used for follow uptraining and providing feedback to both staff and management. We continue to evaluate and implementprocesses relating to guest satisfaction, including reducing guest wait times and improving hostinteraction with the guest.
Atmosphere. The atmosphere of Texas Roadhouse restaurants is intended to appeal to broadsegments of the population, children, families, couples, adults and business persons. Substantially allTexas Roadhouse restaurants are of our prototype design, reflecting a rustic southwestern lodgeatmosphere, featuring an exterior of rough-hewn cedar siding and corrugated metal. The interiorsfeature pine floors and stained concrete and are decorated with hand-painted murals, neon signs,southwestern prints, rugs and artifacts. The restaurants contain jukeboxes that continuously play upbeatcountry hits. Guests may also view a display-baking area, where our made-from-scratch yeast rolls areprepared, and a meat cooler displaying fresh cut steaks. Guests may wait for seating in either aspacious, comfortable waiting area or a southwestern style bar. While waiting for a table, guests canenjoy complimentary roasted in-shell peanuts and upon being seated at a table, guests can enjoymade-from-scratch yeast rolls along with roasted in-shell peanuts.
People
Management and Employees. Each of our restaurants is generally staffed with one managingpartner, one kitchen manager, one service manager, and, in most cases, one or more additionalassistant managers and/or key employees. Managing partners are single restaurant operators who haveprimary responsibility for the day-to-day operations of the entire restaurant and are responsible for
10
maintaining the standards of quality and performance we establish. We use market partners tosupervise the operation of our restaurants. Generally, each market partner has supervisoryresponsibilities for up to 10 to 15 managing partners and their respective management teams. Marketpartners also assist with our site selection process and recruitment of new management teams. Throughregular visits to the restaurants, the market partners facilitate adherence to all aspects of our concept,strategy and standards of quality. To further facilitate adherence to our standards of quality and tomaximize uniform execution throughout the system, we employ product coaches who regularly visit therestaurants to assist in training of both new and existing employees and to grade food quality. Theattentive service and high quality food, which results from each restaurant having a managing partner,two to three managers and the hands-on assistance of a product coach are critical to our success.
Training and Development. All restaurant employees are required to complete varying degrees oftraining before and during employment. Our detailed training program emphasizes our operatingstrategy, procedures and standards and is conducted individually at Texas Roadhouse restaurants and ingroups in Louisville, Kentucky.
Our managing and market partners are generally required to have significant experience in thefull-service restaurant industry and are generally hired at a minimum of nine to 12 months before theirplacement in a new or existing restaurant to allow time to fully train in all aspects of restaurantoperations. All managing partners, kitchen and service managers and other management team membersare required to complete a comprehensive training program of up to 17 weeks, which includes trainingfor every position in the restaurant. Trainees are validated at pre-determined points during theirtraining by either the market partner, product coach or a training manager or service coach.
A number of our restaurants have been certified as training centers by our training department.This certification confirms that the training center adheres to established operating procedures andguidelines. Additionally, most restaurants are staffed with training coordinators responsible for ongoingdaily training needs.
For new restaurant openings, a full team of designated trainers, each specializing in a specificrestaurant position, is deployed to the restaurant at least ten days before opening. Formal employeetraining begins seven days before opening and follows a uniform, comprehensive training course asdirected by a training manager.
Marketing
Our marketing strategy aims to promote the Texas Roadhouse brand, while retaining a localizedfocus, to:
• increase comparable restaurant sales by increasing the frequency of visits by our current guestsand attracting new guests to our restaurants;
• support new restaurant openings to achieve restaurant sales and operating margin goals; and
• communicate and promote our brand’s food quality, the guest experience and value.
We accomplish these objectives through three major initiatives.
In-restaurant Marketing. A significant portion of our marketing fund is spent in communicatingwith our guests while they are in our restaurants through point of purchase materials. We believespecial promotions such as Valentine’s Day and Mother’s Day drive significant repeat business. Also,our eight week holiday gift card campaign is one of our most significant promotions. In addition, ourmascot, ‘‘Andy Armadillo�’’, provides our guests with a familiar and easily identifiable face.
11

Local Restaurant Area Marketing. Given our strategy to be a neighborhood destination, localrestaurant area marketing is integral in developing brand awareness in each market. To enhance ourvisibility, we deliver free food to local businesses in connection with new restaurant openings and on anongoing basis to drive awareness. Managing partners are encouraged to participate in creativecommunity-based marketing, such as hosting local radio or television programs. We also engage in avariety of promotional activities, such as contributing time, money and complimentary meals tocharitable, civic and cultural programs. For instance, our involvement with the Special Olympics, a localLittle League baseball team, a local church or the Armed Forces, shows our Legendary care, concernand support for our communities. We leverage the corresponding recognition in our public relationsand marketing efforts to communicate our corporate values and mission statement to our guests. Weemploy marketing coordinators at the restaurant and market level to develop and execute the majorityof the local marketing strategies.
Advertising. Our restaurant concept does not rely on national advertising to promote the brand.We utilize public relations to generate ‘‘earned media’’ story placement in local, regional and nationalmedia. Our concept also uses a permission-based e-mail loyalty program to promote our brand and ourgrowing social media strategy provides us the opportunity to frequently communicate and engage withour guests. This approach aligns with our focus on local restaurant marketing and communityinvolvement.
Restaurant Franchise Arrangements
Franchise Restaurants. As of December 31, 2013, we had 20 franchisees that operated74 restaurants in 23 states and three foreign countries. Domestically, franchise rights are granted forspecific restaurants only, as we have not granted any rights to develop a territory in the United States.Approximately 75% of our franchise restaurants are operated by 10 franchisees. No franchisee operatesmore than 13 restaurants.
Our standard domestic franchise agreement has a term of ten years with two renewal options foran additional five years each if certain conditions are satisfied. Our current form of domestic franchiseagreement requires the franchisee to pay a royalty fee of 4.0% of gross sales. The royalty fee variesdepending on when the agreements were entered into and range from 2.0% of gross sales to thecurrent 4.0% fee. We may, at our discretion, waive or reduce the royalty fee on a temporary orpermanent basis. ‘‘Gross sales’’ means the total selling price of all services and products related to therestaurant. Gross sales do not include:
• employee discounts or other discounts;
• tips or gratuities paid directly to employees by guests;
• any federal, state, municipal or other sales, value added or retailer’s excise taxes; or
• adjustments for net returns on salable goods and discounts allowed to guests on sales.
Domestic franchisees are currently required to pay 0.3% of gross sales to a national advertisingand marketing fund for the development of advertising materials, system-wide promotions and relatedmarketing efforts. We have the ability under our agreements to increase the required nationaladvertising and marketing fund contribution up to 2.5% of gross sales. We may also charge a marketingfee of 0.5% of gross sales, which we may use for market research and to develop system-widepromotional and advertising materials. A franchisee’s total required advertising contribution orspending will not be more than 3.0% of gross sales.
Our standard domestic franchise agreement gives us the right, but not the obligation, to compel afranchisee to transfer its assets to us in exchange for shares of our stock, or to convert its equity
12

interests into shares of our stock. The amount of shares that a franchisee would receive is based on aformula that is included in the franchise agreement.
We have entered into two franchise area development agreements for the development of TexasRoadhouse restaurants in foreign countries. In 2010, we entered into an agreement for thedevelopment of restaurants in eight countries in the Middle East over ten years. In 2013, we enteredinto an agreement for the development of restaurants in Taiwan over five years. For the existinginternational agreements, the franchisee is required to pay us a franchise fee for each restaurant to beopened, royalties on the gross sales of each restaurant and a development fee for our grant ofdevelopment rights in the named countries. The term of the agreements may be extended. Weanticipate that the specific business terms of any future franchise agreement for internationalrestaurants might vary significantly from the standard terms of our domestic agreements and from theterms of existing international agreements, depending on the territory to be franchised and the extentof franchisor-provided services to each franchisee.
Any of our franchise agreements, whether domestic or international, may be terminated if thefranchisee defaults in the performance of any of its obligations under the franchise agreement,including its obligations to operate the restaurant in strict accordance with our standards andspecifications. A franchise agreement may also be terminated if a franchisee becomes insolvent, fails tomake its required payments, creates a threat to the public health or safety, ceases to operate therestaurant, or misuses the Texas Roadhouse trademarks.
Franchise Compliance Assurance. We have various systems in place to promote compliance withour systems and standards, both during the development and operating of franchise restaurants. Weactively work with our franchisees to support successful franchise operations as well as compliance withthe Texas Roadhouse standards and procedures. During the restaurant development phase, we approvethe selection of restaurant sites and make available copies of our prototype building plans tofranchisees. In addition, we ensure that the building design is in compliance with our standards. Weprovide training to the managing partner and up to three other managers of a franchisee’s firstrestaurant. We also provide trainers to assist in the opening of every domestic franchise restaurant; weprovide trainers to assist our international franchisees in the opening of their restaurants until suchtime as they develop an approved restaurant opening training program. Finally, on an ongoing basis, weconduct reviews on all franchise restaurants to determine their level of effectiveness in executing ourconcept at a variety of operational levels. Our franchisees are required to follow the same standardsand procedures regarding equipment, food purchases and food preparation as we maintain in ourcompany restaurants. Reviews are conducted by seasoned operations teams and focus on key areasincluding health, safety and execution proficiency.
To continuously improve our communications with franchisees and the consistency of the brand, wemaintain a business development advisory group that includes representatives of our domesticfranchisees and company operations personnel. The group’s functions are advisory. Its members reviewand comment on proposed advertising campaigns and materials and budget expenditures, as well asoperational initiatives. Our regional market partners also provide support to our domestic franchiserestaurant operators.
Management Services. We provide management services to 24 of the franchise restaurants inwhich we and/or our founder have an ownership interest. Such management services includeaccounting, operational supervision, human resources, training, and food, beverage and equipmentconsulting for which we receive monthly fees of up to 2.5% of gross sales. We also make available tothese restaurants certain legal services and restaurant employees and employee benefits on apass-through cost basis. In addition, we receive a monthly fee from six franchise restaurants forproviding payroll and accounting services.
13

Management Information Systems and Restaurant Reporting
All of our company restaurants utilize computerized management information systems, which aredesigned to improve operating efficiencies, provide restaurant and Support Center management withtimely access to financial and operating data and reduce administrative time and expense. With ourcurrent information systems, we have the ability to query, report and analyze this intelligent data on adaily, weekly, period, quarter and year-to-date basis and beyond, on a company-wide, regional orindividual restaurant basis. Together, this enables us to closely monitor sales, food and beverage costsand labor and operating expenses at each of our restaurants. We have a number of systems and reportsthat provide comparative information that enables both restaurant and Support Center management tosupervise the financial and operational performance of our restaurants and to recognize andunderstand trends in the business. Our accounting department uses a standard, integrated system toprepare monthly profit and loss statements, which provides a detailed analysis of sales and costs. Thesemonthly profit and loss statements are compared both to the restaurant-prepared reports and to priorperiods. Currently, we utilize cable, digital subscriber lines (DSL) or T-1 technology at the restaurantlevel, which serves as a high-speed, secure communication link between the restaurants and ourSupport Center as well as our credit and gift card processor.
Competition
According to the National Restaurant Association, or NRA, restaurant industry sales in 2014 willrepresent approximately 4% of the United States’ gross domestic product. The NRA also forecasts thatrestaurant industry sales will reach $683.4 billion in 2014 and will encompass approximately 990,000restaurants.
Competition in the restaurant industry is intense. Texas Roadhouse restaurants compete withmid-priced, full-service, casual dining restaurants primarily on the basis of taste, quality and price of thefood offered, service, atmosphere, location and overall dining experience. Our competitors include alarge and diverse group of restaurants that range from independent local operators to well-capitalizednational restaurant chains. Although we believe that we compete favorably with respect to each of theabove factors, other restaurants operate with concepts that compete for the same casual dining guestsas we do. We also compete with other restaurants and retail establishments for quality site locationsand restaurant-level employees.
Trademarks
Our registered trademarks and service marks include, among others, our trade names and ourstylized logos. We have registered all of our significant marks with the United States Patent andTrademark Office. We have registered or have registrations pending for our most significant trademarksand service marks in 42 foreign jurisdictions including the European Union. To better protect ourbrand, we have also registered various Internet domain names. We believe that our trademarks, servicemarks and other proprietary rights have significant value and are important to our brand-buildingefforts and the marketing of our restaurant concepts.
Government Regulation
We are subject to a variety of federal, state and local laws affecting our businesses. Each of ourrestaurants is subject to permitting, licensing and regulation by a number of government authorities,which may include among others, alcoholic beverage control, health and safety, nutritional menulabeling, health care, sanitation, building and fire codes, and to compliance with the applicable zoning,land use and environmental laws and regulations. Difficulties in obtaining or failure to obtain requiredlicenses or approvals could delay or prevent the development of a new restaurant in a particular area.
14
Additionally, difficulties or inabilities to retain or renew licenses, or increased compliance costs due tochanged regulations, could adversely affect operations at existing restaurants.
In 2013, the sale of alcoholic beverages accounted for approximately 11% of our restaurant sales.Alcoholic beverage control regulations require each of our restaurants to apply to a state authority and,in certain locations, county or municipal authorities, for a license or permit to sell alcoholic beverageson the premises that must be renewed annually and may be revoked or suspended for cause at anytime. Alcoholic beverage control regulations affect numerous aspects of restaurant operations, includingminimum age of patrons and employees, hours of operation, advertising, training, wholesale purchasing,inventory control and handling, storage and dispensing of alcoholic beverages. The failure of arestaurant to obtain or retain liquor or food service licenses or permits would have a material adverseeffect on the restaurant’s operations. To reduce this risk, each company restaurant is operated inaccordance with procedures intended to facilitate compliance with applicable codes and regulations.
We are subject in certain states to ‘‘dram shop’’ statutes, which generally provide a person injuredby an intoxicated person the right to recover damages from an establishment that wrongfully servedalcoholic beverages to the intoxicated person. We carry liquor liability coverage as part of our existingcomprehensive general liability insurance, as well as excess umbrella coverage of $125.0 million.
Our restaurant operations are also subject to federal and state labor laws governing such mattersas minimum and tip wage requirements, overtime pay, health benefits, unemployment tax rates,workers’ compensation rates, citizenship requirements, working conditions and hiring and employmentpractices. Significant numbers of our service, food preparation and other personnel are paid at ratesrelated to the federal minimum wage (which currently is $7.25 per hour) or federal tipped wage (whichcurrently is $2.13 per hour). Our employees who receive tips as part of their compensation, such asservers, are paid at or above a minimum wage rate, after giving effect to applicable tip credits. We relyon our employees to accurately disclose the full amount of their tip income, and we base our FICA taxreporting on the disclosures provided to us by such tipped employees. Numerous states in which weoperate have passed legislation governing the applicable state minimum hourly and/or tipped wage.Further planned and unplanned increases in federal and/or state minimum hourly and tipped wages orstate unemployment tax rates will increase our labor costs. These increases may or may not be offset byadditional menu price adjustments and/or guest traffic growth.
The Patient Protection and Affordable Care Act of 2010 (the ‘‘PPACA’’) includes provisionsrequiring all Americans to obtain health care coverage in 2014. As part of these provisions, in 2015, wewill be required to offer health insurance benefits to some of our employees that are not currentlyoffered coverage or pay a penalty. At the beginning of 2014, we offered coverage to an expanded groupof employees which included hourly employees that work a minimum of 35 hours a week. As a resultof the change, we expect our healthcare benefit costs will be $2.5 to $3.0 million higher in 2014compared to the prior year. We are continuing to assess the ongoing impact of these provisions on ourhealth care benefit costs particularly as it relates to the implementation of the program and the numberof employees that choose to participate. While we believe that the impact of the requirement toprovide health insurance benefits to employees that are more extensive than what we currently provideis manageable, the requirements could have an adverse effect on our results of operations and financialposition. These increases may or may not be offset by additional menu price adjustments and/or guesttraffic growth. We are subject to laws and regulations relating to the preparation and sale of food,including regulations regarding product safety, nutritional content and menu labeling. We are or maybecome subject to laws and regulations requiring disclosure of calorie, fat, trans fat, salt and allergencontent. The PPACA establishes a uniform, federal requirement for certain restaurants to postnutritional information on their menus, which specifically requires chain restaurants with 20 or morelocations operating under the same name and offering substantially the same menus to publish the totalnumber of calories of standard menu items on menus and menu boards, along with a statement thatputs this calorie information in the context of a total daily calorie intake. The PPACA also requires
15

covered restaurants to provide to consumers, upon request, a written summary of detailed nutritionalinformation for each standard menu item and to provide a statement on menus and menu boards aboutthe availability of this information. The PPACA further permits the FDA to require covered restaurantsto make additional nutrient disclosures, such as disclosure of trans fat content. The FDA publishedproposed regulations to implement the menu labeling provisions of the PPACA in April 2011, however,the agency has delayed the release of final regulations implementing these requirements. We expect theFDA to release the final regulations in 2014.
Compliance with current and future laws and regulations regarding the ingredients and nutritionalcontent of our menu items may be costly and time-consuming. Additionally, if consumer healthregulations or consumer eating habits change significantly, we may be required to modify or discontinuecertain menu items, and we may experience higher costs associated with the implementation of thosechanges. In addition, we cannot make any assurances regarding our ability to effectively respond tochanges in consumer health perceptions or our ability to successfully implement the nutrient contentdisclosure requirements and to adapt our menu offerings to trends in eating habits. The imposition ofmenu-labeling laws could have an adverse effect on our results of operations and financial position, aswell as the restaurant industry in general.
Our facilities must comply with the applicable requirements of the Americans with Disabilities Actof 1990 (‘‘ADA’’) and related state accessibility statutes. Under the ADA and related state laws, wemust provide equivalent service to disabled persons and make reasonable accommodation for theiremployment. In addition, when constructing or undertaking significant remodeling of our restaurants,we must make those facilities accessible.
We are subject to laws relating to information security, privacy, cashless payments and consumercredit, protection and fraud. An increasing number of governments and industry groups worldwide haveestablished data privacy laws and standards for the protection of personal information, including socialsecurity numbers, financial information (including credit card numbers), and health information.
See Item 1A ‘‘Risk Factors’’ below for a discussion of risks relating to federal, state and localregulation of our business.
Seasonality
Our business is subject to minor seasonal fluctuations. Historically, sales in most of our restaurantshave been higher during the winter months of each year.
Employees
As of December 31, 2013, we employed approximately 45,700 people in the company restaurantswe own and operate and our corporate support center. This amount includes 476 executive andadministrative personnel and 1,469 restaurant management personnel, while the remainder were hourlyrestaurant personnel. Many of our hourly restaurant employees work part-time. None of our employeesare covered by a collective bargaining agreement.
16

Executive Officers of the Company
Set forth below are the name, age, position and a brief account of the business experience of eachof our executive officers:
Name Age Position
W. Kent Taylor . . . . . . . . . . . . . . . . . 58 Chairman and Chief Executive OfficerScott M. Colosi . . . . . . . . . . . . . . . . . 49 PresidentSteven L. Ortiz . . . . . . . . . . . . . . . . . 56 Chief Operating OfficerG. Price Cooper, IV . . . . . . . . . . . . . 42 Chief Financial OfficerCelia P. Catlett . . . . . . . . . . . . . . . . . 37 General Counsel
W. Kent Taylor. Mr. Taylor is the founder of Texas Roadhouse and resumed his role as ChiefExecutive Officer in August 2011, a position he held between May 2000 and October 2004. He wasnamed Chairman of the Company and Board in October 2004. Before his founding of our concept,Mr. Taylor founded and co-owned Buckhead Bar and Grill in Louisville, Kentucky. Mr. Taylor has over30 years of experience in the restaurant industry.
Scott M. Colosi. Mr. Colosi was appointed President in August 2011. Previously, Mr. Colosiserved as our Chief Financial Officer since September 2002. From 1992 until September 2002,Mr. Colosi was employed by YUM! Brands, Inc., owner of KFC, Pizza Hut and Taco Bell brands.During this time, Mr. Colosi served in various financial positions and, immediately prior to joining us,was Director of Investor Relations. Mr. Colosi has over 25 years of experience in the restaurantindustry.
Steven L. Ortiz. Mr. Ortiz has served as our Executive Vice President of Operations since May2001. In 2004, Mr. Ortiz became Chief Operating Officer. Mr. Ortiz joined our company in 1996 as aMarket Partner in which capacity he was responsible for developing and starting new Texas Roadhouserestaurants in Texas. From 1982 to 1996, Mr. Ortiz was employed by Bennigan’s Restaurants in variouscapacities, including General Manager, Area Director and Regional Vice President. Mr. Ortiz has over30 years of experience in the restaurant industry.
G. Price Cooper, IV. Mr. Cooper was appointed Chief Financial Officer in August 2011.Previously, Mr. Cooper served as our Vice President of Finance since August 2006. From 1998 to 2006,Mr. Cooper was employed by Ruby Tuesday, Inc. During this time, Mr. Cooper held various positionsin finance, planning and accounting and, immediately prior to joining us, was Vice President of InvestorRelations and Planning. Mr. Cooper has over 20 years of finance and accounting experience, includingover 15 years of experience in the restaurant industry and holds an inactive CPA license.
Celia P. Catlett. Ms. Catlett was appointed General Counsel and Corporate Secretary inNovember 2013. She joined Texas Roadhouse in 2005 and has served as Associate General Counselsince 2010 and Corporate Secretary since 2011. Prior to joining us, Ms. Catlett practiced law in NewYork City. Ms. Catlett has 13 years of legal experience, including over 8 years of experience in therestaurant industry.
Website Access to Reports
We make our Annual Report on Form 10-K, Quarterly Reports on Form 10-Q, Current Reportson Form 8-K, and amendments to those reports, filed or furnished pursuant to section 13(a) or 15(d)of the Securities Exchange Act of 1934, available, free of charge on or through the Internet website,www.texasroadhouse.com, as soon as reasonably practicable after we electronically file such materialwith, or furnish it to, the Securities and Exchange Commission (‘‘SEC’’).
17

ITEM 1A. RISK FACTORS
From time to time, in periodic reports and oral statements and in this Annual Report onForm 10-K, we present statements about future events and expectations that constitute forward-lookingstatements within the meaning of Section 27A of the Securities Act of 1933, as amended, andSection 21E of the Securities Exchange Act of 1934, as amended. Forward-looking statements are basedon our beliefs, assumptions and expectations of our future financial and operating performance andgrowth plans, taking into account the information currently available to us. These statements are notstatements of historical fact. Forward-looking statements involve risks and uncertainties that may causeour actual results to differ materially from the expectations of future results we express or imply in anyforward-looking statements.
Careful consideration should be given to the risks described below. If any of the risks anduncertainties described in the cautionary factors described below actually occurs, our business, financialcondition and results of operations, and the trading price of our common stock could be materially andadversely affected. Moreover, we operate in a very competitive and rapidly changing environment. Newfactors emerge from time to time and it is not possible to predict the impact of all these factors on ourbusiness, financial condition or results of operation.
Risks Related to Our Business and Industry
If we fail to manage our growth effectively, it could harm our business.
Failure to manage our growth effectively could harm our business. We have grown significantlysince our inception and intend to continue growing in the future. Our existing restaurant managementsystems, financial and management controls and information systems may not be adequate to supportour planned expansion. Our ability to manage our growth effectively will require us to continue toenhance these systems, procedures and controls and to locate, hire, train and retain management andoperating personnel. We cannot assure you that we will be able to respond on a timely basis to all ofthe changing demands that our planned expansion will impose on management and on our existinginfrastructure. If we are unable to manage our growth effectively, our business and operating resultscould be materially adversely impacted.
You should not rely on past changes in our average unit volume or our comparable restaurant sales as anindication of our future results of operations because they may fluctuate significantly.
A number of factors have historically affected, and will continue to affect, our average unit volumeand comparable restaurant sales, including, among other factors:
• consumer awareness and understanding of our brand;
• our ability to execute our business strategy effectively;
• unusually strong initial sales performance by new restaurants;
• competition, either from our competitors in the restaurant industry or our own restaurants;
• weather and acts of God;
• consumer trends;
• introduction of new menu items;
• negative publicity regarding food safety, health concerns, quality of service, and other food orbeverage related matters, including the integrity of our or our suppliers’ food processing; and
• general economic conditions, which can affect restaurant traffic, local labor costs and prices wepay for the food products and other supplies we use.
18

Our average unit volume and comparable restaurant sales may not increase at rates achieved inthe past. Changes in our average unit volume and comparable restaurant sales could cause the price ofour common stock to fluctuate substantially.
Our growth strategy, which primarily depends on our ability to open new restaurants that are profitable, issubject to many factors, some of which are beyond our control.
Our objective is to grow our business and increase stockholder value by (1) expanding our base ofcompany restaurants (and, to a lesser extent, franchise restaurants) that are profitable and(2) increasing sales and profits at existing restaurants. While both these methods of achieving ourobjective are important to us, historically the most significant means of achieving our objective hasbeen through opening new restaurants and operating these restaurants on a profitable basis. We expectthis to continue to be the case in the near future.
We cannot assure you that we will be able to open new restaurants in accordance with ourexpansion plans. We have experienced delays in opening some of our restaurants in the past and mayexperience delays in the future. Delays or failures in opening new restaurants could materially adverselyaffect our growth strategy. One of our biggest challenges in executing our growth strategy is locatingand securing an adequate supply of suitable new restaurant sites. Competition for suitable restaurantsites in our target markets is intense. We cannot assure you that we will be able to find sufficientsuitable locations, or suitable purchase or lease terms, for planned expansion in any future period. Ourability to open new restaurants will also depend on numerous other factors, some of which are beyondour control, including, but not limited to, the following:
• our ability to hire, train and retain qualified operating personnel, especially market partners andmanaging partners;
• the availability of construction materials and labor;
• our ability to control construction and development costs of new restaurants;
• our ability to secure required governmental approvals and permits in a timely manner, or at all;
• our ability to secure liquor licenses;
• general economic conditions;
• the cost and availability of capital to fund construction costs and pre-opening expenses; and
• weather and acts of God.
Once opened, we anticipate that our new restaurants will generally take several months to reachplanned operating levels due to start-up inefficiencies typically associated with new restaurants. Wecannot assure you that any restaurant we open will be profitable or obtain operating results similar tothose of our existing restaurants. Our ability to operate new restaurants profitably will depend onnumerous factors, including those discussed above impacting our average unit volume and comparablerestaurant sales, some of which are beyond our control, including, but not limited to, the following:
• competition from competitors in our industry or our own restaurants;
• consumer acceptance of our restaurants in new domestic or international markets;
• the ability of the market partner and the managing partner to execute our business strategy atthe new restaurant;
• general economic conditions which can affect restaurant traffic, local labor costs, and prices wepay for the food products and other supplies we use;
• changes in government regulation;
19

• road construction and other factors limiting access to the restaurant; and
• weather and acts of God.
Our failure to successfully open new restaurants that are profitable in accordance with our growthstrategy could harm our business and future prospects. In addition, our inability to open newrestaurants and provide growth opportunities to our employees could result in the significant loss ofqualified personnel which could harm our business and future prospects.
Our objective to increase sales and profits at existing restaurants could be adversely affected bymacroeconomic conditions.
During 2014 and possibly beyond, the U.S. and global economies may continue to suffer from adownturn in economic activity. Recessionary economic cycles, higher interest rates, higher fuel andother energy costs, inflation, increases in commodity prices, higher levels of unemployment, higherconsumer debt levels, higher tax rates and other changes in tax laws or other economic factors that mayaffect consumer spending or buying habits could adversely affect the demand for our products. As inthe past, we could experience reduced guest traffic or we may be unable or unwilling to increase theprices we can charge for our products to offset higher costs or fewer transactions, either of which couldreduce our sales and profit margins. Also, landlords or other tenants in the shopping centers in whichsome of our restaurants are located may experience difficulty as a result of macroeconomic trends orcease to operate, which could in turn negatively affect guest traffic at our restaurants. All of thesefactors could have a material adverse impact on our results of operations.
Our franchisees could take actions that could harm our business.
Our franchisees are contractually obligated to operate their restaurants in accordance with TexasRoadhouse standards. We also provide training and support to franchisees. However, most franchiseesare independent third parties that we do not control, and these franchisees own, operate and overseethe daily operations of their restaurants. As a result, the ultimate success and quality of any franchiserestaurant rests with the franchisee. If franchisees do not successfully operate restaurants in a mannerconsistent with our standards, the Texas Roadhouse image and reputation could be harmed, which inturn could adversely affect our business and operating results.
Our quarterly operating results may fluctuate significantly and could fall below the expectations of securitiesanalysts and investors due to a number of factors, some of which are beyond our control, resulting in adecline in our stock price.
Our quarterly operating results may fluctuate significantly because of several factors, including:
• the timing of new restaurant openings and related expenses;
• restaurant operating costs for our newly-opened restaurants, which are often materially greaterduring the first several months of operation than thereafter;
• labor availability and costs for hourly and management personnel including mandated changes infederal and/or state minimum and tip wage rates, state unemployment tax rates, or healthbenefits;
• profitability of our restaurants, particularly in new markets;
• changes in interest rates;
• the impact of litigation, including negative publicity;
• increases and decreases in average unit volume and comparable restaurant sales;
20
• impairment of long-lived assets, including goodwill, and any loss on restaurant closures;
• general economic conditions which can affect restaurant traffic, local labor costs, and prices wepay for the food products and other supplies we use;
• negative publicity regarding food safety, health concerns and other food and beverage relatedmatters, including the integrity of our or our suppliers’ food processing;
• negative publicity relating to the consumption of beef or other products we serve;
• changes in consumer preferences and competitive conditions;
• expansion to new domestic or international markets;
• adverse weather conditions which impact guest traffic at our restaurants;
• increases in infrastructure costs;
• adoption of new, or changes in existing, accounting policies or practices;
• fluctuations in commodity prices;
• competitive actions; and
• weather and acts of God.
Our business is also subject to minor seasonal fluctuations. Historically, sales in most of ourrestaurants have been higher during the winter months of each year. As a result, our quarterlyoperating results and comparable restaurant sales may fluctuate as a result of seasonality. Accordingly,results for any one quarter are not necessarily indicative of results to be expected for any other quarteror for any year and comparable restaurant sales for any particular future period may decrease. In thefuture, operating results may fall below the expectations of securities analysts and investors. In thatevent, the price of our common stock could decrease.
If we lose the services of any of our key management personnel, our business could suffer.
Our future success depends on the continued services and performance of our key managementpersonnel. Our future performance will depend on our ability to motivate and retain these and otherkey officers and managers, particularly regional market partners, market partners and managingpartners. Competition for these employees is intense. The loss of the services of members of our seniormanagement team or other key officers or managers or the inability to attract additional qualifiedpersonnel as needed could materially harm our business.
Our failure or inability to enforce our trademarks or other proprietary rights could adversely affect ourcompetitive position or the value of our brand.
We own certain common law trademark rights and a number of federal and internationaltrademark and service mark registrations, including our trade names and logos, and proprietary rightsrelating to certain of our core menu offerings. We believe that our trademarks and other proprietaryrights are important to our success and our competitive position. We, therefore, devote appropriateresources to the protection of our trademarks and proprietary rights. The protective actions that wetake, however, may not be enough to prevent unauthorized usage or imitation by others, which couldharm our image, brand or competitive position and, if we commence litigation to enforce our rights,cause us to incur significant legal fees. Our inability to register or protect our marks and otherpropriety rights in foreign jurisdictions could adversely affect our competitive position in internationalmarkets.
21

We cannot assure you that third parties will not claim that our trademarks or menu offeringsinfringe upon their proprietary rights. Any such claim, whether or not it has merit, could betime-consuming, result in costly litigation, cause delays in introducing new menu items in the future orrequire us to enter into royalty or licensing agreements. As a result, any such claim could have amaterial adverse effect on our business, results of operations, financial condition or liquidity.
We may need additional capital in the future and it may not be available on acceptable terms.
The development of our business may require significant additional capital in the future to, amongother things, fund our operations and growth strategy. We may rely on bank financing and also mayseek access to the debt and/or equity capital markets. There can be no assurance, however, that thesesources of financing will be available on terms favorable to us, or at all. Our ability to obtain additionalfinancing will be subject to a number of factors, including market conditions, our operatingperformance, investor sentiment and our ability to incur additional debt in compliance with agreementsgoverning our outstanding debt. These factors may make the timing, amount, terms and conditions ofadditional financings unattractive to us. If we are unable to raise additional capital, our growth couldbe impeded.
Our existing credit facility limits our ability to incur additional debt.
The lenders’ obligation to extend credit under the facility depends on our maintaining certainfinancial covenants, including a minimum consolidated fixed charge coverage ratio of 2.00 to 1.00 and amaximum consolidated leverage ratio of 3.00 to 1.00. If we are unable to maintain these ratios, wewould be unable to obtain additional financing under this revolving credit facility. The revolving creditfacility permits us to incur additional secured or unsecured indebtedness outside the revolving creditfacility, except for the incurrence of secured indebtedness that in the aggregate exceeds 15% of ourconsolidated tangible net worth or circumstances where the incurrence of secured or unsecuredindebtedness would prevent us from complying with our financial covenants.
We have also entered into other loan agreements with other lenders to finance various restaurantswhich impose financial covenants that are less restrictive than those imposed by our existing revolvingcredit facility. A default under these loan agreements could result in a default under our existingrevolving credit facility, which in turn would limit our ability to secure additional funds under thatfacility. As of December 31, 2013, we were in compliance with all of our lenders’ covenants.
We may be required to record additional impairment charges in the future.
In accordance with accounting guidance as it relates to the impairment of long-lived assets, wemake certain estimates and projections with regard to company-owned restaurant operations, as well asour overall performance in connection with our impairment analyses for long-lived assets. Whenimpairment triggers are deemed to exist for any company-owned restaurant, the estimated undiscountedfuture cash flows for the restaurant are compared to its carrying value. If the carrying value exceeds theundiscounted cash flows, an impairment charge would be recorded equal to the difference between thecarrying value and the estimated fair value.
We also review the value of our goodwill on an annual basis and when events or changes incircumstances indicate that the carrying value of goodwill or other intangible assets may exceed the fairvalue of such assets. The estimates of fair value are based upon the best information available as of thedate of the assessment and incorporate management assumptions about expected future cash flows andcontemplate other valuation measurements and techniques.
The estimates of fair value used in these analyses require the use of judgment, certain assumptionsand estimates of future operating results. If actual results differ from our estimates or assumptions,
22

additional impairment charges may be required in the future. If impairment charges are significant, ourresults of operations could be adversely affected.
The acquisition of existing restaurants from our franchisees and other strategic transactions may haveunanticipated consequences that could harm our business and our financial condition.
We plan to opportunistically acquire existing restaurants from our franchisees over time.Additionally, from time to time, we evaluate potential mergers, acquisitions, joint ventures or otherstrategic initiatives to acquire or develop additional concepts. To successfully execute any acquisition ordevelopment strategy, we will need to identify suitable acquisition or development candidates, negotiateacceptable acquisition or development terms and obtain appropriate financing. Any acquisition orfuture development that we pursue, whether or not successfully completed, may involve risks, including:
• material adverse effects on our operating results, particularly in the fiscal quarters immediatelyfollowing the acquisition or development as the restaurants are integrated into our operations;
• risks associated with entering into new domestic or international markets or conductingoperations where we have no or limited prior experience;
• risks inherent in accurately assessing the value, future growth potential, strengths, weaknesses,contingent and other liabilities and potential profitability of acquisition candidates, and ourability to achieve projected economic and operating synergies; and
• the diversion of management’s attention from other business concerns.
Future acquisitions of existing restaurants from our franchisees or other strategic partners, whichmay be accomplished through a cash purchase transaction, the issuance of shares of common stock or acombination of both, could have a dilutive impact on holders of our common stock, and result in theincurrence of debt and contingent liabilities and impairment charges related to goodwill and othertangible and intangible assets, any of which could harm our business and financial condition. Thedevelopment of additional concepts and/or the entrance into international markets may not be assuccessful as our experience in the development of the Texas Roadhouse concept domestically.Development rates for newer brands may differ significantly as there is increased risk in thedevelopment of a new restaurant concept or system.
Approximately 15% of our company-owned restaurants are located in Texas and, as a result, we are sensitiveto economic and other trends and developments in that state.
As of December 31, 2013, we operated a total of 51 company-owned restaurants in Texas. As aresult, we are particularly susceptible to adverse trends and economic conditions in this state, includingits labor market. In addition, given our geographic concentration in this state, negative publicityregarding any of our restaurants in Texas could have a material adverse effect on our business andoperations, as could other occurrences in Texas such as local strikes, energy shortages or increases inenergy prices, droughts, earthquakes, fires or other natural disasters.
Our expansion into new domestic and/or international markets may present increased risks due to ourunfamiliarity with the area.
Some of our new restaurants will be located in areas where we have little or no meaningfulexperience. Those markets may have different competitive conditions, consumer tastes and discretionaryspending patterns than our existing markets, which may cause our new restaurants to be less successfulthan restaurants in our existing markets. An additional risk of expanding into new markets is the lackof market awareness of our brands. Restaurants opened in new markets may open at lower averageweekly sales volume than restaurants opened in existing markets and may have higher restaurant-level
23

operating expense ratios than in existing markets. Sales at restaurants opened in new markets may takelonger to reach average unit volume, if at all, thereby affecting our overall profitability.
We are also subject to governmental regulations throughout the world impacting the way we dobusiness with our international franchisees. These include antitrust and tax requirements, anti-boycottregulations, import/export/customs and other international trade regulations, the USA Patriot Act andThe Foreign Corrupt Practices Act. Failure to comply with any such legal requirements could subject usto monetary liabilities and other sanctions, which could adversely impact our business and financialperformance.
The possibility of future misstatement exists due to inherent limitations in our control systems, which couldadversely affect our business.
We cannot be certain that our internal control over financial reporting and disclosure controls andprocedures will prevent all possible error and fraud. A control system, no matter how well conceivedand operated, can provide only reasonable, not absolute, assurance that the objectives of the controlsystem are met. Because of inherent limitations in all control systems, no evaluation of controls canprovide absolute assurance that all control issues and instances of error or fraud, if any, in ourcompany have been detected. These inherent limitations include the realities that judgments indecision-making can be faulty and that breakdowns can occur because of simple error or mistake, whichcould have an adverse impact on our business.
Our business is affected by changes in consumer preferences and discretionary spending.
Our success depends, in part, upon the popularity of our food products. Shifts in consumerpreferences away from our restaurants or cuisine, particularly beef, would harm our business. Also, oursuccess depends to a significant extent on discretionary consumer spending, which is influenced bygeneral economic conditions and the availability of discretionary income. Accordingly, we mayexperience declines in sales during economic downturns or during periods of uncertainty. Any materialdecline in the amount of discretionary spending could have a material adverse effect on our business,results of operations, financial condition or liquidity.
Our success depends on our ability to compete with many food service businesses.
The restaurant industry is intensely competitive. We compete with many well-established foodservice companies on the basis of taste, quality and price of products offered, guest service,atmosphere, location and overall guest experience. Our competitors include a large and diverse groupof restaurant chains and individual restaurants that range from independent local operators that haveopened restaurants in various markets to well-capitalized national restaurant companies. Many of ourcompetitors or potential competitors have substantially greater financial and other resources than wedo, which may allow them to react to changes in pricing, marketing and the casual dining segment ofthe restaurant industry better than we can. As our competitors expand their operations, we expectcompetition to intensify. We also compete with other restaurant chains and other retail businesses forquality site locations and hourly employees.
Changes in food and supply costs could adversely affect our results of operations.
Our profitability depends in part on our ability to anticipate and react to changes in food andsupply costs. Any increase in food prices, particularly proteins, could adversely affect our operatingresults. In addition, we are susceptible to increases in food costs as a result of factors beyond ourcontrol, such as weather conditions, food safety concerns, product recalls, global market and tradeconditions, and government regulations. We cannot predict whether we will be able to anticipate andreact to changing food costs by adjusting our purchasing practices and menu prices, and a failure to doso could adversely affect our operating results. In addition, because we provide a moderately pricedproduct, we may not seek to or be able to pass along price increases to our guests. Also, if we adjustpricing there is no assurance that we will realize the full benefit of any adjustment due to changes inour guests’ menu item selections and guest traffic.
24

We currently purchase the majority of our beef from five beef suppliers under annual contracts.While we maintain relationships with additional suppliers, if any of these vendors were unable to fulfillits obligations under its contracts, we could encounter supply shortages and incur higher costs to secureadequate supplies, either of which would harm our business.
The food service industry is affected by litigation and publicity concerning food quality, health and otherissues, which can cause guests to avoid our restaurants and result in significant liabilities or litigation costs.
Food service businesses can be adversely affected by litigation and complaints from guests,consumer groups or government authorities resulting from food quality, illness, injury or other healthconcerns or operating issues stemming from one restaurant or a limited number of restaurants. Adversepublicity about these allegations may negatively affect us, regardless of whether the allegations are true,by discouraging guests from eating at our restaurants. We could also incur significant liabilities if alawsuit or claim results in a decision against us or litigation costs regardless of the result.
Given the marked increase in the use of social media platforms and similar devices in recent years,individuals have access to a broad audience of consumers and other interested persons. The availabilityof information on social media platforms is virtually immediate as is its impact. Many social mediaplatforms immediately publish the content their subscribers and participants can post, often withoutfilters or checks on the accuracy of the content posted. Information concerning our company may beposted on such platforms at any time. Information posted may be adverse to our interests or may beinaccurate, each of which may harm our business. The harm may be immediate without affording us anopportunity for redress or correction. These factors could have a material adverse effect on ourbusiness.
Health concerns relating to the consumption of beef or other food products could affect consumer preferencesand could negatively impact our results of operations.
Like other restaurant chains, consumer preferences could be affected by health concerns about theconsumption of beef, the key ingredient in many of our menu items, or negative publicity concerningfood quality, illness and injury in general. In recent years there has been negative publicity concerninge-coli, hepatitis A, ‘‘mad cow,’’ ‘‘foot-and-mouth’’ disease and ‘‘bird flu.’’ The restaurant industry hasalso been subject to a growing number of claims that the menus and actions of restaurant chains haveled to the obesity of certain of their guests. In April 2011, the FDA published proposed regulations toimplement the menu labeling provisions of the PPACA; however, the agency has delayed the release offinal regulations implementing these requirements. We expect the FDA to release the final regulationsin 2014. The labeling requirements and any negative publicity concerning any of the food products weserve may adversely affect demand for our food and could result in a decrease in guest traffic to ourrestaurants. If we react to the labeling requirements or negative publicity by changing our concept orour menu offerings or their ingredients, we may lose guests who do not prefer the new concept orproducts, and we may not be able to attract sufficient new guests to produce the revenue needed tomake our restaurants profitable. In addition, we may have different or additional competitors for ourintended guests as a result of a change in our concept and may not be able to compete successfullyagainst those competitors. A decrease in guest traffic to our restaurants as a result of these healthconcerns or negative publicity or as a result of a change in our menu or concept could materially harmour business.
Food safety and food-borne illness concerns may have an adverse effect on our business by reducing demandand increasing costs.
Food safety is a top priority, and we dedicate substantial resources to help ensure that our guestsenjoy safe, quality food products. However, food-borne illnesses and food safety issues have occurred inthe food industry in the past, and could occur in the future. Any report or publicity linking us to
25

instances of food-borne illness or other food safety issues, including food tampering or contamination,could adversely affect our brands and reputation as well as our revenues and profits. In addition,instances of food-borne illness, food tampering or food contamination occurring solely at restaurants ofour competitors could result in negative publicity about the food service industry generally andadversely impact our sales.
Furthermore, our reliance on third-party food suppliers and distributors increases the risk thatfood-borne illness incidents could be caused by factors outside of our control and that multiplelocations would be affected rather than a single restaurant. We cannot assure that all food items areproperly maintained during transport throughout the supply chain and that our employees will identifyall products that may be spoiled and should not be used in our restaurants. If our guests become illfrom food-borne illnesses, we could be forced to temporarily close some restaurants. Furthermore, anyinstances of food contamination, whether or not at our restaurants, could subject us or our suppliers toa food recall.
The United States and other countries have experienced, or may experience in the future,outbreaks of viruses, such as Avian Flu, SARS and H1N1. To the extent that a virus is food-borne,future outbreaks may adversely affect the price and availability of certain food products and cause ourguests to eat less of a product. To the extent that a virus is transmitted by human-to-human contact,our employees or guests could become infected, or could choose, or be advised, to avoid gathering inpublic places, any one of which could adversely affect our business.
Our business could be adversely affected by increased labor costs or labor shortages.
Labor is a primary component in the cost of operating our business. We devote significantresources to recruiting and training our managers and hourly employees. Increased labor costs due tocompetition, unionization, increased minimum and tip wage, state unemployment rates or employeebenefits costs or otherwise, would adversely impact our operating expenses. The federal governmentand numerous states have enacted legislation resulting in tip and/or minimum wage increases as well aspre-determined future increases. We anticipate that additional legislation will be enacted in futureperiods. The PPACA includes provisions requiring health care coverage for all Americans in 2014. Thelegislation imposes implementation effective dates that began in 2010 and extend through 2020, andmany of the changes require additional guidance from government agencies or federal regulations. Todate, we have not experienced material costs related to such legislation. However, due to the phased-innature of the implementation and lack of interpretive guidance, it is difficult to determine at this timewhat impact the health care reform legislation will have on our financial results. While we believe thatthe impact of the requirement to provide health insurance benefits to employees that are moreextensive than what we currently provide is manageable, the requirements could have an adverse effecton our results of operations and financial position. Our distributors and suppliers also may be affectedby higher minimum wage and benefit standards, which could result in higher costs for goods andservices supplied to us. In addition, a shortage in the labor pool or other general inflationary pressuresor changes could also increase our labor costs. Our operating expenses will be adversely affected to theextent that we are not able or are unwilling to offset these costs through higher prices on our products.
Moreover, we could suffer from significant indirect costs, including restaurant disruptions due tomanagement or hourly labor turnover and potential delays in new restaurant openings or adverse guestreactions to inadequate guest service levels due to staff shortages. Competition for qualified employeesexerts upward pressure on wages paid to attract such personnel, resulting in higher labor costs, togetherwith greater recruitment and training expense. A shortage in the labor pool could also cause ourrestaurants to be required to operate with reduced staff, which could negatively impact our ability toprovide adequate service levels to our guests.
26

In addition, our success depends on our ability to attract, motivate and retain qualified employees,including restaurant managers and staff, to keep pace with our growth strategy. If we are unable to doso, our results of operations may be adversely affected.
We may not be able to obtain and maintain licenses and permits necessary to operate our restaurants andcompliance with governmental laws and regulations could adversely affect our operating results.
The restaurant industry is subject to various federal, state and local government regulations,including those relating to the sale of food and alcoholic beverages. Such regulations are subject tochange from time to time. The failure to obtain and maintain these licenses, permits and approvals,including liquor licenses, could adversely affect our operating results. Difficulties or failure to obtainthe required licenses and approvals could delay or result in our decision to cancel the opening of newrestaurants. Local authorities may revoke, suspend or deny renewal of our liquor licenses if theydetermine that our conduct violates applicable regulations.
In addition to our having to comply with these licensing requirements, various federal and statelabor laws govern our relationship with our employees and affect operating costs. These laws includeminimum and tip wage requirements, overtime pay, health benefits, unemployment tax rates, workers’compensation rates, citizenship requirements and working conditions. A number of factors couldadversely affect our operating results, including:
• additional government-imposed increases in minimum and/or tipped wages, overtime pay, paidleaves of absence, sick leave, and mandated health benefits;
• increased tax reporting and tax payment requirements for employees who receive gratuities;
• any failure of our employees to comply with laws and regulations governing citizenship orresidency requirements resulting in disruption of our work force and adverse publicity against us;
• a reduction in the number of states that allow gratuities to be credited toward minimum wagerequirements; and
• increased employee litigation including claims under federal and/or state wage and hour laws.
The federal Americans with Disabilities Act prohibits discrimination on the basis of disability inpublic accommodations and employment. Although our restaurants are designed to be accessible to thedisabled, we could be required to make modifications to our restaurants to provide service to, or makereasonable accommodations for disabled persons.
Complaints or litigation may hurt us.
Occasionally, our guests file complaints or lawsuits against us alleging that we are responsible forsome illness or injury they suffered as a result of a visit to our restaurants, or that we have problemswith food quality or operations. We are also subject to a variety of other claims arising in the ordinarycourse of our business, including personal injury claims, contract claims, claims from franchisees andclaims alleging violations of federal and state laws regarding consumer, workplace and employmentmatters, wage and hour claims, discrimination and similar matters, or we could become subject to classaction lawsuits related to these matters in the future. The restaurant industry has also been subject to agrowing number of claims that the menus and actions of restaurant chains have led to the obesity ofcertain of their guests. In addition, we are subject to ‘‘dram shop’’ statutes. These statutes generallyallow a person injured by an intoxicated person to recover damages from an establishment thatwrongfully served alcoholic beverages to the intoxicated person. Some litigation against restaurantchains has resulted in significant judgments, including punitive damages, under dram shop statutes.Because a plaintiff may seek punitive damages, which may not be covered by insurance, this type ofaction could have an adverse impact on our financial condition and results of operations. Regardless of
27
whether any claims against us are valid or whether we are liable, claims may be expensive to defendand may divert time and money away from our operations and hurt our performance. A judgmentsignificantly in excess of our insurance coverage for any claims could materially adversely affect ourbusiness, results of operations, financial condition or liquidity. Further, adverse publicity resulting fromthese allegations may have a material adverse effect on us and our restaurants.
We rely heavily on information technology, and any material failure, weakness or interruption could prevent usfrom effectively operating our business.
We rely heavily on information systems, including point-of-sale processing in our restaurants,payment of obligations, collection of cash, credit and debit card transactions and other processes andprocedures. Our ability to efficiently and effectively manage our business depends significantly on thereliability and capacity of these systems. The failure of these systems to operate effectively,maintenance problems, upgrading or transitioning to new platforms could result in delays in guestservice and reduce efficiency in our operations. Remediation of such problems could result insignificant, unplanned capital investments.
We may incur costs resulting from breaches of security of confidential guest information related to ourelectronic processing of credit and debit card transactions.
We accept electronic payment cards for payment in our restaurants. During 2013, approximately74% of our transactions were by credit or debit cards, and such card usage could increase. Otherretailers have experienced actual or potential security breaches in which credit and debit cardinformation may have been stolen. We may in the future become subject to claims for purportedlyfraudulent transactions arising out of the actual or alleged theft of credit or debit card information, andwe may also be subject to lawsuits or other proceedings relating to these types of incidents. Any suchclaim or proceeding could cause us to incur significant unplanned expenses, in excess of our insurancecoverage, which could have an adverse impact on our financial condition and results of operations.Further, adverse publicity resulting from these allegations may have a material adverse effect on us andour restaurants.
Our current insurance may not provide adequate levels of coverage against claims.
We currently maintain insurance customary for businesses of our size and type. However, there aretypes of losses we may incur that cannot be insured against or that we believe are not economicallyreasonable to insure. Such damages could have a material adverse effect on our business and results ofoperations. In addition, we self-insure a significant portion of expected losses under our health, workerscompensation, general liability, employment practices liability and property insurance programs.Unanticipated changes in the actuarial assumptions and management estimates underlying our reservesfor these losses could result in materially different amounts of expense under these programs, whichcould have a material adverse effect on our financial condition, results of operations and liquidity.
Risks Related to Our Corporate Structure, Our Stock Ownership and Our Common Stock
Provisions in our charter documents and Delaware law may delay or prevent our acquisition by a third party.
Our certificate of incorporation and by-laws contain several provisions that may make it moredifficult for a third party to acquire control of us without the approval of our Board of Directors.These provisions include, among other things, advance notice for raising business or makingnominations at meetings, ‘‘blank check’’ preferred stock and three-year staggered terms for our Boardof Directors. Blank check preferred stock enables our Board of Directors, without approval of thestockholders, to designate and issue additional series of preferred stock with such dividend, liquidation,conversion, voting or other rights, including the right to issue convertible securities with no limitations
28

on conversion, as our Board of Directors may determine. The issuance of blank check preferred stockmay adversely affect the voting and other rights of the holders of our common stock as our Board ofDirectors may designate and issue preferred stock with terms that are senior to our common stock.These provisions may make it more difficult or expensive for a third party to acquire a majority of ouroutstanding common stock. These provisions also may delay, prevent or deter a merger, acquisition,tender offer, proxy contest or other transaction that might otherwise result in our stockholdersreceiving a premium over the market price for their common stock.
The Delaware General Corporation Law prohibits us from engaging in ‘‘business combinations’’with ‘‘interested shareholders’’ (with some exceptions) unless such transaction is approved in aprescribed manner. The existence of this provision could have an anti-takeover effect with respect totransactions not approved in advance by the Board of Directors, including discouraging attempts thatmight result in a premium over the market price for our common stock.
ITEM 1B—UNRESOLVED STAFF COMMENTS
None.
ITEM 2—PROPERTIES
Properties
Our Support Center is located in Louisville, Kentucky. We occupy this facility under leases withParagon Centre Holdings, LLC, a limited liability company in which we have a minority ownershipposition. As of December 31, 2013, we leased 69,342 square feet. Our leases expire betweenDecember 31, 2022 and December 31, 2030 including all applicable extensions. Of the 346 companyrestaurants in operation as of December 31, 2013, we owned 123 locations and leased 223 locations, asshown in the following table.
State Owned Leased Total
Alabama . . . . . . . . . . . . . . . . . . . . . . . . . . . . . . . . . . . . . . . 3 2 5Arizona . . . . . . . . . . . . . . . . . . . . . . . . . . . . . . . . . . . . . . . . 6 7 13Arkansas . . . . . . . . . . . . . . . . . . . . . . . . . . . . . . . . . . . . . . . — 3 3California . . . . . . . . . . . . . . . . . . . . . . . . . . . . . . . . . . . . . . 1 1 2Colorado . . . . . . . . . . . . . . . . . . . . . . . . . . . . . . . . . . . . . . . 7 6 13Connecticut . . . . . . . . . . . . . . . . . . . . . . . . . . . . . . . . . . . . . — 2 2Delaware . . . . . . . . . . . . . . . . . . . . . . . . . . . . . . . . . . . . . . . 1 1 2Florida . . . . . . . . . . . . . . . . . . . . . . . . . . . . . . . . . . . . . . . . 3 10 13Georgia . . . . . . . . . . . . . . . . . . . . . . . . . . . . . . . . . . . . . . . . 2 2 4Idaho . . . . . . . . . . . . . . . . . . . . . . . . . . . . . . . . . . . . . . . . . 1 4 5Illinois . . . . . . . . . . . . . . . . . . . . . . . . . . . . . . . . . . . . . . . . . 2 11 13Indiana . . . . . . . . . . . . . . . . . . . . . . . . . . . . . . . . . . . . . . . . 7 6 13Iowa . . . . . . . . . . . . . . . . . . . . . . . . . . . . . . . . . . . . . . . . . . 2 7 9Kansas . . . . . . . . . . . . . . . . . . . . . . . . . . . . . . . . . . . . . . . . 2 1 3Kentucky . . . . . . . . . . . . . . . . . . . . . . . . . . . . . . . . . . . . . . . 4 6 10Louisiana . . . . . . . . . . . . . . . . . . . . . . . . . . . . . . . . . . . . . . 1 6 7Maine . . . . . . . . . . . . . . . . . . . . . . . . . . . . . . . . . . . . . . . . . — 3 3Maryland . . . . . . . . . . . . . . . . . . . . . . . . . . . . . . . . . . . . . . . — 3 3Massachusetts . . . . . . . . . . . . . . . . . . . . . . . . . . . . . . . . . . . 1 7 8Michigan . . . . . . . . . . . . . . . . . . . . . . . . . . . . . . . . . . . . . . . 3 5 8Minnesota . . . . . . . . . . . . . . . . . . . . . . . . . . . . . . . . . . . . . . 1 3 4Mississippi . . . . . . . . . . . . . . . . . . . . . . . . . . . . . . . . . . . . . . 1 — 1Missouri . . . . . . . . . . . . . . . . . . . . . . . . . . . . . . . . . . . . . . . 2 8 10Nebraska . . . . . . . . . . . . . . . . . . . . . . . . . . . . . . . . . . . . . . . 1 2 3Nevada . . . . . . . . . . . . . . . . . . . . . . . . . . . . . . . . . . . . . . . . — 1 1
29

State Owned Leased Total
New Hampshire . . . . . . . . . . . . . . . . . . . . . . . . . . . . . . . . . . 2 1 3New Jersey . . . . . . . . . . . . . . . . . . . . . . . . . . . . . . . . . . . . . 1 3 4New Mexico . . . . . . . . . . . . . . . . . . . . . . . . . . . . . . . . . . . . 1 1 2New York . . . . . . . . . . . . . . . . . . . . . . . . . . . . . . . . . . . . . . 3 9 12North Carolina . . . . . . . . . . . . . . . . . . . . . . . . . . . . . . . . . . 4 12 16North Dakota . . . . . . . . . . . . . . . . . . . . . . . . . . . . . . . . . . . — 2 2Ohio . . . . . . . . . . . . . . . . . . . . . . . . . . . . . . . . . . . . . . . . . . 12 10 22Oklahoma . . . . . . . . . . . . . . . . . . . . . . . . . . . . . . . . . . . . . . 2 4 6Oregon . . . . . . . . . . . . . . . . . . . . . . . . . . . . . . . . . . . . . . . . — 2 2Pennsylvania . . . . . . . . . . . . . . . . . . . . . . . . . . . . . . . . . . . . 3 16 19Rhode Island . . . . . . . . . . . . . . . . . . . . . . . . . . . . . . . . . . . . — 2 2South Dakota . . . . . . . . . . . . . . . . . . . . . . . . . . . . . . . . . . . 1 1 2Tennessee . . . . . . . . . . . . . . . . . . . . . . . . . . . . . . . . . . . . . . — 11 11Texas . . . . . . . . . . . . . . . . . . . . . . . . . . . . . . . . . . . . . . . . . . 34 17 51Utah . . . . . . . . . . . . . . . . . . . . . . . . . . . . . . . . . . . . . . . . . . — 9 9Vermont . . . . . . . . . . . . . . . . . . . . . . . . . . . . . . . . . . . . . . . — 1 1Virginia . . . . . . . . . . . . . . . . . . . . . . . . . . . . . . . . . . . . . . . . 4 8 12Washington . . . . . . . . . . . . . . . . . . . . . . . . . . . . . . . . . . . . . — 1 1West Virginia . . . . . . . . . . . . . . . . . . . . . . . . . . . . . . . . . . . . 1 — 1Wisconsin . . . . . . . . . . . . . . . . . . . . . . . . . . . . . . . . . . . . . . 3 6 9Wyoming . . . . . . . . . . . . . . . . . . . . . . . . . . . . . . . . . . . . . . . 1 — 1Total . . . . . . . . . . . . . . . . . . . . . . . . . . . . . . . . . . . . . . . . . . 123 223 346
Additional information concerning our properties and leasing arrangements is included innote 2(p) and note 7 to the Consolidated Financial Statements appearing in Part II, Item 8 of thisAnnual Report on Form 10-K.
ITEM 3—LEGAL PROCEEDINGS
Occasionally, we are a defendant in litigation arising in the ordinary course of our business,including ‘‘slip and fall’ accidents, employment related claims and claims from guests or employeesalleging illness, injury or food quality, health or operational concerns. None of these types of litigation,most of which are covered by insurance, has had a material effect on us and, as of the date of thisreport, we are not party to any litigation that we believe could have a material adverse effect on ourbusiness other than the litigation discussed below.
On September 30, 2011, the U.S. Equal Employment Opportunity Commission (‘‘EEOC’’) filed alawsuit styled Equal Employment Opportunity Commission v. Texas Roadhouse, Inc., Texas RoadhouseHoldings LLC, Texas Roadhouse Management Corp. in the United States District Court, District ofMassachusetts (‘‘Court’’), Civil Action Number 1:11-cv-11732. The complaint alleges that applicantsover the age of 40 were denied employment in our restaurants in bartender, host, server and serverassistant positions due to their age. The EEOC is seeking injunctive relief, remedial actions, paymentof damages to the applicants and costs. We have filed an answer to the complaint, and the case is indiscovery. We deny liability; however, in view of the inherent uncertainties of litigation, the outcome ofthis case cannot be predicted at this time. We cannot estimate the possible amount or range of loss, ifany, associated with this matter.
ITEM 4—MINE SAFETY DISCLOSURES
Not applicable.
30

PART II
ITEM 5—MARKET FOR THE REGISTRANT’S COMMON EQUITY, RELATED STOCKHOLDERMATTERS AND ISSUER PURCHASES OF EQUITY SECURITIES
Our common stock is traded on the Nasdaq Global Select Market under the symbol TXRH. Thequarterly high and low sales prices of our common stock by quarter were as follows:
High Low
Year ended December 31, 2013First Quarter . . . . . . . . . . . . . . . . . . . . . . . . . . . . . . . . . . . . . . . . $20.17 $16.42Second Quarter . . . . . . . . . . . . . . . . . . . . . . . . . . . . . . . . . . . . . . $25.56 $19.33Third Quarter . . . . . . . . . . . . . . . . . . . . . . . . . . . . . . . . . . . . . . . $26.46 $22.97Fourth Quarter . . . . . . . . . . . . . . . . . . . . . . . . . . . . . . . . . . . . . . $29.07 $24.77
Year ended December 25, 2012First Quarter . . . . . . . . . . . . . . . . . . . . . . . . . . . . . . . . . . . . . . . . $17.83 $14.59Second Quarter . . . . . . . . . . . . . . . . . . . . . . . . . . . . . . . . . . . . . . $19.35 $15.90Third Quarter . . . . . . . . . . . . . . . . . . . . . . . . . . . . . . . . . . . . . . . $18.84 $16.65Fourth Quarter . . . . . . . . . . . . . . . . . . . . . . . . . . . . . . . . . . . . . . $17.96 $15.72
The number of holders of record of our common stock as of February 19, 2014 was 276.
On February 20, 2014, our Board of Directors authorized the payment of a cash dividend of $0.15per share of common stock. This payment will be distributed on April 4, 2014, to shareholders ofrecord at the close of business on March 19, 2014. The declaration and payment of cash dividends onour common stock is at the discretion of our Board of Directors, and any decision to declare adividend will be based on a number of factors, including, but not limited to, earnings, financialcondition, applicable covenants under our credit facility and other contractual restrictions, or otherfactors deemed relevant.
As of December 31, 2013, shares of common stock authorized for issuance under our equitycompensation plans are summarized in the following table. The weighted-average option exercise priceis for stock options only, as the restricted stock has no exercise price. See note 13 to the ConsolidatedFinancial Statements for a description of the plan.
SharesShares to Be Weighted- Available forIssued Upon Average Option Future
Plan Category Exercise Exercise Price Grants
Plans approved by stockholders(1) . . . . . . . . 2,327,300 $13.77 6,746,617Plans not approved by stockholders . . . . . . . — — —
Total . . . . . . . . . . . . . . . . . . . . . . . . . . . . . 2,327,300 $13.77 6,746,617
(1) See note 13 to the Consolidated Financial Statements.
Unregistered Sales of Equity Securities
There were no equity securities sold by the Company during the period covered by this AnnualReport on Form 10-K that were not registered under the Securities Act of 1933, as amended.
Issuer Repurchases of Securities
On February 16, 2012, our Board of Directors approved a stock repurchase program under whichit authorized us to repurchase up to $100.0 million of our common stock. This stock repurchase
31

program has no expiration date and replaced a previous stock repurchase program which was approvedon February 17, 2011. The previous program authorized us to repurchase up to $50.0 million of ourcommon stock and was increased by $50.0 million on August 18, 2011. Any repurchases will be madethrough open market transactions. The timing and the amount of any repurchases will be determinedby management under parameters established by our Board of Directors, based on its evaluation of ourstock price, market conditions and other corporate considerations. During 2013, we paid approximately$12.8 million to repurchase 461,600 shares of our common stock and we had $57.9 million remainingunder our authorized stock repurchase program as of December 31, 2013.
Since commencing our repurchase program in 2008, we have repurchased a total of 12,733,362shares of common stock at a total cost of $158.3 million through December 31, 2013 underauthorizations from our Board of Directors. The following table includes information regardingpurchases of our common stock made by us during the 14 weeks ended December 31, 2013.
Total Numberof Shares Maximum Number
Purchased as (or ApproximatePart of Dollar Value) ofPublicly Shares that May
Total Number Average Announced Yet Be Purchasedof Shares Price Paid Plans or Under the Plans
Period Purchased per Share Programs or Programs
September 25 to October 22 . . . . . . . . . . . . . . — — — $70,614,804.59October 23 to November 19 . . . . . . . . . . . . . . — — — $70,614,804.59November 20 to December 31 . . . . . . . . . . . . 461,600 $27.64 461,600 $57,863,535.55
Total . . . . . . . . . . . . . . . . . . . . . . . . . . . . . . . 461,600 461,600
32

22FEB201408121632
Stock Performance Graph
The following graph sets forth cumulative total return experienced by holders of the Company’scommon stock compared to the cumulative total return of the Russell 3000 Restaurant Index and theRussell 3000 Index for the period ended December 31, 2013, the last trading day of our fiscal year. Thegraph assumes the values of the investment in our common stock and each index was $100 onDecember 30, 2008 and the reinvestment of all dividends paid during the period of the securitiescomprising the indices.
Note: The stock price performance shown on the graph below does not indicate future performance.
Comparison of Cumulative Total Return Since December 30, 2008Among Texas Roadhouse, Inc., the Russell 3000 Index and the Russell 3000 Restaurant Index
0
20
40
60
80
100
120
140
160
180
200
220
240
260
TXRH Russell 3000 Index Russell 3000 Restaurant Index
12/24
/07
12/30
/08
12/29
/09
12/2
8/10
12/2
7/20
11
12/2
5/20
12
12/3
1/20
13
12/30/08 12/29/09 12/28/10 12/27/11 12/25/12 12/31/13
Texas Roadhouse, Inc. . . . . . . . . . . . . . . . $100.00 $158.63 $237.12 $207.26 $230.41 $380.82Russell 3000 . . . . . . . . . . . . . . . . . . . . . . $100.00 $128.89 $146.50 $146.06 $165.26 $216.47Russell 3000 Restaurant . . . . . . . . . . . . . . $100.00 $118.96 $154.76 $197.86 $196.65 $249.21
33
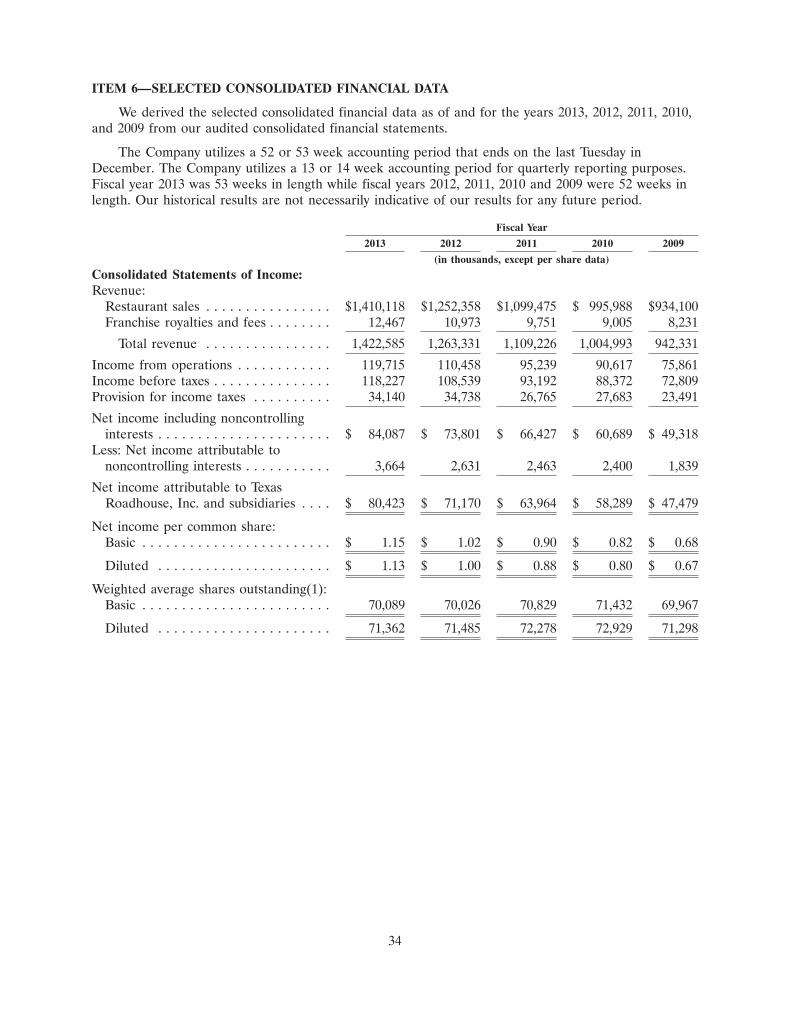
ITEM 6—SELECTED CONSOLIDATED FINANCIAL DATA
We derived the selected consolidated financial data as of and for the years 2013, 2012, 2011, 2010,and 2009 from our audited consolidated financial statements.
The Company utilizes a 52 or 53 week accounting period that ends on the last Tuesday inDecember. The Company utilizes a 13 or 14 week accounting period for quarterly reporting purposes.Fiscal year 2013 was 53 weeks in length while fiscal years 2012, 2011, 2010 and 2009 were 52 weeks inlength. Our historical results are not necessarily indicative of our results for any future period.
Fiscal Year
2013 2012 2011 2010 2009
(in thousands, except per share data)
Consolidated Statements of Income:Revenue:
Restaurant sales . . . . . . . . . . . . . . . . $1,410,118 $1,252,358 $1,099,475 $ 995,988 $934,100Franchise royalties and fees . . . . . . . . 12,467 10,973 9,751 9,005 8,231
Total revenue . . . . . . . . . . . . . . . . 1,422,585 1,263,331 1,109,226 1,004,993 942,331
Income from operations . . . . . . . . . . . . 119,715 110,458 95,239 90,617 75,861Income before taxes . . . . . . . . . . . . . . . 118,227 108,539 93,192 88,372 72,809Provision for income taxes . . . . . . . . . . 34,140 34,738 26,765 27,683 23,491
Net income including noncontrollinginterests . . . . . . . . . . . . . . . . . . . . . . $ 84,087 $ 73,801 $ 66,427 $ 60,689 $ 49,318
Less: Net income attributable tononcontrolling interests . . . . . . . . . . . 3,664 2,631 2,463 2,400 1,839
Net income attributable to TexasRoadhouse, Inc. and subsidiaries . . . . $ 80,423 $ 71,170 $ 63,964 $ 58,289 $ 47,479
Net income per common share:Basic . . . . . . . . . . . . . . . . . . . . . . . . $ 1.15 $ 1.02 $ 0.90 $ 0.82 $ 0.68
Diluted . . . . . . . . . . . . . . . . . . . . . . $ 1.13 $ 1.00 $ 0.88 $ 0.80 $ 0.67
Weighted average shares outstanding(1):Basic . . . . . . . . . . . . . . . . . . . . . . . . 70,089 70,026 70,829 71,432 69,967
Diluted . . . . . . . . . . . . . . . . . . . . . . 71,362 71,485 72,278 72,929 71,298
34

Fiscal Year
2013 2012 2011 2010 2009
($ in thousands)
Consolidated Balance Sheet Data:Cash and cash equivalents . . . . . . . . . . . . . . . $ 94,874 $ 81,746 $ 78,777 $ 86,254 $ 50,749Total assets . . . . . . . . . . . . . . . . . . . . . . . . . . 877,644 791,254 740,670 702,801 662,073Long-term debt and obligations under capital
leases, net of current maturities . . . . . . . . . 50,990 51,264 61,601 51,906 101,179Total liabilities . . . . . . . . . . . . . . . . . . . . . . . 283,784 260,517 244,848 203,419 239,123Noncontrolling interests . . . . . . . . . . . . . . . . 6,201 5,653 3,918 2,766 2,578Texas Roadhouse, Inc. and subsidiaries
stockholders’ equity(2) . . . . . . . . . . . . . . . . 587,659 525,084 491,904 496,616 420,372
Selected Operating Data (unaudited):Restaurants:
Company—Texas Roadhouse . . . . . . . . . . . 345 318 291 271 260Company—Other . . . . . . . . . . . . . . . . . . . 1 2 3 3 1Franchise . . . . . . . . . . . . . . . . . . . . . . . . . 74 72 72 71 70Total . . . . . . . . . . . . . . . . . . . . . . . . . . . . . 420 392 366 345 331
Company restaurant information:Store weeks . . . . . . . . . . . . . . . . . . . . . . . . 17,426 15,936 14,573 13,803 13,255Comparable restaurant sales growth(3) . . . . 3.4% 4.7% 4.7% 2.4% (2.8)%Texas Roadhouse restaurants only:
Comparable restaurant sales growth(3) . . 3.4% 4.7% 4.8% 2.4% (2.8)%Average unit volume(4) . . . . . . . . . . . . . $ 4,194 $ 4,085 $ 3,917 $ 3,730 $ 3,660
Net cash provided by operating activities . . . . $ 173,836 $148,046 $136,419 $120,056 $115,249Net cash used in investing activities . . . . . . . . $(111,248) $(90,154) $(79,475) $(44,816) $(43,134)Net cash used in financing activities . . . . . . . . $ (49,460) $(54,923) $(64,421) $(39,735) $(30,395)
(1) See note 11 to the Consolidated Financial Statements.
(2) See note 10 to the Consolidated Financial Statements.
(3) Comparable restaurant sales growth reflects the change in sales over the same period of the prioryears for the comparable restaurant base. We define the comparable restaurant base to includethose restaurants open for a full 18 months before the beginning of the later fiscal period,excluding sales from restaurants closed during the period.
(4) Average unit volume represents the average annual restaurant sales from Texas Roadhousecompany restaurants open for a full six months before the beginning of the period measured,excluding sales from restaurants closed during the period. Although 2013 contained 53 weeks, forcomparative purposes, 2013 average unit volume was adjusted to a 52 week basis. Additionally,average unit volume of company-owned restaurants for 2013 in the table above was adjusted toreflect the restaurant sales of any acquired franchise restaurants.
35

ITEM 7—MANAGEMENT’S DISCUSSION AND ANALYSIS OF FINANCIAL CONDITION ANDRESULTS OF OPERATIONS
The discussion and analysis below for the Company should be read in conjunction with theconsolidated financial statements and the notes to such financial statements (pages F-1 to F-19),‘‘Forward-looking Statements’’ (page 3) and Risk Factors set forth in Item 1A.
Our Company
Texas Roadhouse is a growing, moderately priced, full-service restaurant chain. Our founder,chairman and chief executive officer, W. Kent Taylor, started the business in 1993 with the opening ofthe first Texas Roadhouse in Clarksville, Indiana. Since then, we have grown to 420 restaurants in48 states and three foreign countries. Our mission statement is ‘‘Legendary Food, Legendary Service�.’’Our operating strategy is designed to position each of our restaurants as the local hometowndestination for a broad segment of consumers seeking high-quality, affordable meals served withfriendly, attentive service. As of December 31, 2013, our 420 restaurants included:
• 346 ‘‘company restaurants,’’ of which 331 were wholly-owned and 15 were majority-owned. Theresults of operations of company restaurants are included in our consolidated statements ofincome and comprehensive income. The portion of income attributable to minority interests incompany restaurants that are not wholly-owned is reflected in the line item entitled ‘‘Net incomeattributable to noncontrolling interests’’ in our consolidated statements of income andcomprehensive income.
• 74 ‘‘franchise restaurants,’’ 23 of which we have a 5.0% to 10.0% ownership interest. Theincome derived from our minority interests in these franchise restaurants is reported in the lineitem entitled ‘‘Equity income from investments in unconsolidated affiliates’’ in our consolidatedstatements of income and comprehensive income. Additionally, we provide various managementservices to these franchise restaurants, as well as seven additional franchise restaurants in whichwe have no ownership interest.
We have contractual arrangements which grant us the right to acquire at pre-determined valuationformulas (i) the remaining equity interests in 13 of the 15 majority-owned company restaurants and(ii) 66 of the franchise restaurants.
Presentation of Financial and Operating Data
We operate on a fiscal year that ends on the last Tuesday in December. Fiscal year 2013 was53 weeks in length and, as such, the fourth quarter of fiscal 2013 was 14 weeks in length. Fiscal years2012 and 2011 were 52 weeks in length, while the quarters for those years were 13 weeks in length.
Long-term Strategies to Grow Earnings Per Share
Our long-term strategies with respect to increasing net income and earnings per share, along withcreating shareholder value, include the following:
Expanding Our Restaurant Base. We will continue to evaluate opportunities to develop TexasRoadhouse restaurants in existing markets and new domestic and international markets. Domestically,we will remain focused primarily on mid-sized markets where we believe a significant demand for ourrestaurants exists because of population size, income levels and the presence of shopping andentertainment centers and a significant employment base. Our ability to expand our restaurant base isinfluenced by many factors beyond our control and therefore we may not be able to achieve ouranticipated growth. Our average capital investment for Texas Roadhouse restaurants opened during2013, including pre-opening expenses and a capitalized rent factor, was $4.1 million, which is slightlyhigher than our average capital investment in 2012 of $3.9 million. We continue to focus on driving
36

sales and managing restaurant development costs in order to further increase our restaurantdevelopment in the future.
We may, at our discretion, add franchise restaurants, domestically and/or internationally, primarilywith franchisees who have demonstrated prior success with Texas Roadhouse or other restaurantconcepts and in markets in which the franchisee demonstrates superior knowledge of the demographicsand restaurant operating conditions. In conjunction with this strategy, we signed our first internationalfranchise development agreement in 2010 for the development of Texas Roadhouse restaurants in eightcountries in the Middle East over the next ten years, in which four restaurants are currently open.Additionally, in 2010, we entered into a joint venture agreement with a casual dining restaurantoperator in China for minority ownership in four non-Texas Roadhouse restaurants, all of which arecurrently open. In 2013, we signed a franchise development agreement for the development of TexasRoadhouse restaurants in Taiwan over five years. We continue to explore opportunities in othercountries for international expansion. We may also look to acquire franchise restaurants under termsfavorable to the Company and our stockholders. Additionally, from time to time, we will evaluatepotential mergers, acquisitions, joint ventures or other strategic initiatives to acquire or developadditional concepts. Of the 346 restaurants we owned and operated at December 31, 2013, we ownedand operated 345 as Texas Roadhouse restaurants. We currently plan to open 25 to 30 TexasRoadhouse restaurants in 2014. In addition, we anticipate our existing franchise partners will open asmany as five Texas Roadhouse restaurants in 2014, including as many as three internationally.
Maintaining and/or Improving Restaurant Level Profitability. We plan to maintain, or possiblyincrease, restaurant level profitability through a combination of increased comparable restaurant salesand operating cost management. In general, we continue to balance the impacts of inflationarypressures with our value positioning as we remain focused on the long-term success of TexasRoadhouse. This may create a challenge in terms of maintaining and/or increasing restaurant margins,as a percentage of sales, in any given year, depending on the level of inflation we experience. Inaddition to restaurant margin, as a percentage of sales, we also focus on restaurant margin dollargrowth per store week as a measure of restaurant level profitability. In terms of driving higher guesttraffic counts, we remain focused on encouraging repeat visits by our guests through our continuedcommitment to operational standards relating to our quality of food and service. In order to attractnew guests and increase the frequency of visits of our existing guests, we also continue to drive variouslocalized marketing programs, to focus on speed of service and to increase throughput by adding seatsin certain restaurants.
Leveraging Our Scalable Infrastructure. To support our growth, we continue to make investments inour infrastructure. Over the past several years, we have made significant investments in ourinfrastructure including information systems, real estate, human resources, legal, marketing,international and operations. In 2013, general and administrative costs increased at a faster growth ratethan our revenue, excluding the impact of a legal settlement charge of $5.0 million recorded in the firstquarter of 2012. Our goal is to have general and administrative costs increase at a slower growth ratethan our revenue. Whether we are able to leverage our infrastructure in future years will depend, inpart, on our new restaurant openings, our comparable restaurant sales growth rate going forward andthe level of investment we continue to make in our infrastructure.
Returning Capital to Shareholders. We continue to pay dividends and evaluate opportunities toreturn capital to our shareholders through repurchases of common stock. In 2011, our Board ofDirectors declared our first quarterly dividend of $0.08 per share of common stock. We haveconsistently grown our per share dividend each year since that time and our long-term strategy includesincreasing our regular quarterly dividend amount over time. On February 20, 2014, our Board ofDirectors declared a quarterly dividend of $0.15 per share of common stock. The declaration andpayment of cash dividends on our common stock is at the discretion of our Board of Directors, and any
37

decision to declare a dividend will be based on a number of factors, including, but not limited to,earnings, financial condition, applicable covenants under our credit facility and other contractualrestrictions, or other factors deemed relevant.
On February 16, 2012, our Board of Directors approved a stock repurchase program under whichwe may repurchase up to $100.0 million of our common stock. Any repurchases will be made throughopen market transactions. As of December 31, 2013, $57.9 million remains authorized for repurchase.In 2013, we paid $12.8 million to repurchase 461,600 shares of our common stock. Since 2008, we havepaid $158.3 million through our authorized stock repurchase programs to repurchase 12,733,362 sharesof our common stock at an average price per share of $12.43.
Key Operating Personnel
Key personnel who have a significant impact on the performance of our restaurants includemanaging and market partners. Each company restaurant has one managing partner who serves as thegeneral manager. Market partners can provide supervisory services for up to 10 to 15 managingpartners and their respective management teams. Market partners also assist with our site selectionprocess and recruitment of new management teams. The managing partner of each company restaurantand their corresponding market partners are required, as a condition of employment, to sign amulti-year employment agreement. The annual compensation of our managing and market partnersincludes a base salary plus a percentage of the pre-tax net income of the restaurant(s) they operate orsupervise. Managing and market partners are eligible to participate in our equity incentive plan and, asa general rule, are required to make deposits of $25,000 and $50,000, respectively. Generally, thedeposits are refunded after five years of service.
Key Measures We Use To Evaluate Our Company
Key measures we use to evaluate and assess our business include the following:
Number of Restaurant Openings. Number of restaurant openings reflects the number ofrestaurants opened during a particular fiscal period. For company restaurant openings we incurpre-opening costs, which are defined below, before the restaurant opens. Typically, new restaurantsopen with an initial start-up period of higher than normalized sales volumes, which decrease to a steadylevel approximately three to six months after opening. However, although sales volumes are generallyhigher, so are initial costs, resulting in restaurant operating margins that are generally lower during thestart-up period of operation and increase to a steady level approximately three to six months afteropening.
Comparable Restaurant Sales Growth. Comparable restaurant sales growth reflects the change insales over the same period of the prior years for the comparable restaurant base. We define thecomparable restaurant base to include those restaurants open for a full 18 months before the beginningof the later fiscal period excluding restaurants closed during the period. Comparable restaurant salesgrowth can be impacted by changes in guest traffic counts or by changes in the per person averagecheck amount. Menu price changes and the mix of menu items sold can affect the per person averagecheck amount.
Average Unit Volume. Average unit volume represents the average annual restaurant sales forcompany-owned Texas Roadhouse restaurants open for a full six months before the beginning of theperiod measured. Average unit volume excludes sales on restaurants closed during the period. Growthin average unit volume in excess of comparable restaurant sales growth is generally an indication thatnewer restaurants are operating with sales levels in excess of the company average. Conversely, growthin average unit volume less than growth in comparable restaurant sales growth is generally anindication that newer restaurants are operating with sales levels lower than the company average.
38

Store Weeks. Store weeks represent the number of weeks that our company restaurants were openduring the reporting period.
Restaurant Margins. Restaurant margins represent restaurant sales less cost of sales, labor, rentand other operating costs. Depreciation and amortization expense, substantially all of which relates torestaurant-level assets, is excluded from restaurant operating costs and is shown separately as itrepresents a non-cash charge for the investment in our restaurants. Restaurant margin is widelyregarded as a useful metric by which to evaluate restaurant-level operating efficiency and performance.Restaurant margin is not a measurement determined in accordance with generally accepted accountingprinciples (‘‘GAAP’’) and should not be considered in isolation, or as an alternative, to income fromoperations or other similarly titled measures of other companies. Restaurant margins, as a percentageof restaurant sales, may fluctuate based on inflationary pressures, commodity costs and wage rates. Assuch, we also focus on restaurant margin dollar growth per store week as a measure of restaurant-levelprofitability as it provides additional insight on operating performance.
Other Key Definitions
Restaurant Sales. Restaurant sales include gross food and beverage sales, net of promotions anddiscounts, for all company-owned restaurants. Sales taxes collected from customers and remitted togovernmental authorities are accounted for on a net basis and therefore are excluded from restaurantsales in the consolidated statements of income and other comprehensive income.
Franchise Royalties and Fees. Domestic franchisees typically pay a $40,000 initial franchise fee foreach new restaurant. In addition, at each renewal period, we receive a fee equal to the greater of 30%of the then-current initial franchise fee or $10,000 to $15,000. Franchise royalties consist of royalties inan amount up to 4.0% of gross sales, as defined in our franchise agreement, paid to us by our domesticfranchisees. In addition, we include royalties and fees paid to us by our international franchisee. Theterms of the international agreements may vary significantly from our domestic agreements.
Restaurant Cost of Sales. Restaurant cost of sales consists of food and beverage costs.
Restaurant Labor Expenses. Restaurant labor expenses include all direct and indirect labor costsincurred in operations except for profit sharing incentive compensation expenses earned by ourrestaurant managing partners. These profit sharing expenses are reflected in restaurant other operatingexpenses. Restaurant labor expenses also include share-based compensation expense related torestaurant-level employees.
Restaurant Rent Expense. Restaurant rent expense includes all rent, except pre-opening rent,associated with the leasing of real estate and includes base, percentage and straight-line rent expense.
Restaurant Other Operating Expenses. Restaurant other operating expenses consist of all otherrestaurant-level operating costs, the major components of which are utilities, supplies, advertising,repairs and maintenance, property taxes, credit card and gift card fees, gift card breakage income andgeneral liability insurance. Profit sharing allocations to managing partners and market partners are alsoincluded in restaurant other operating expenses.
Pre-opening Expenses. Pre-opening expenses, which are charged to operations as incurred, consistof expenses incurred before the opening of a new restaurant and are comprised principally of openingteam and training compensation and benefits, travel expenses, rent, food, beverage and other initialsupplies and expenses. Pre-opening costs vary by location depending on a number of factors, includingthe size and physical layout of each location; the number of management and hourly employeesrequired to operate each restaurant; the availability of qualified restaurant staff members; the cost oftravel and lodging for different geographic areas; the timing of the restaurant opening; and the extentof unexpected delays, if any, in obtaining final licenses and permits to open the restaurants.
39

Depreciation and Amortization Expenses. Depreciation and amortization expenses (‘‘D&A’’)includes the depreciation of fixed assets and amortization of intangibles with definite lives, substantiallyall of which relates to restaurant-level assets.
Impairment and closure costs. Impairment and closure costs include any impairment of long-livedassets, including goodwill, associated with restaurants where the carrying amount of the asset is notrecoverable and exceeds the fair value of the asset and expenses associated with the closure of arestaurant. Closure costs also include any gains or losses associated with the sale of a closed restaurantand/or assets held for sale as well as lease costs associated with closed restaurants.
General and Administrative Expenses. General and administrative expenses (‘‘G&A’’) arecomprised of expenses associated with corporate and administrative functions that support developmentand restaurant operations and provide an infrastructure to support future growth including the netamount of advertising costs incurred less amounts remitted by company and franchise restaurants.Supervision and accounting fees received from certain franchise restaurants and license restaurants areoffset against G&A. G&A also includes share-based compensation expense related to executive officers,support center employees and area managers, including market partners. The realized and unrealizedholding gains and losses related to the investments in our deferred compensation plan, as well asoffsetting compensation expense, are also recorded in G&A.
Interest Expense, Net. Interest expense includes the cost of our debt obligations including theamortization of loan fees, reduced by interest income and capitalized interest. Interest income includesearnings on cash and cash equivalents.
Equity Income from Unconsolidated Affiliates. As of December 31, 2013 and December 25, 2012,we owned a 5.0% to 10.0% equity interest in 23 franchise restaurants. As of December 27, 2011, weowned a 5.0% to 10.0% equity interest in 22 franchise restaurants. Equity income from unconsolidatedaffiliates represents our percentage share of net income earned by these unconsolidated affiliates.
Net Income Attributable to Noncontrolling Interests. Net income attributable to noncontrollinginterests represents the portion of income attributable to the other owners of the majority-owned orcontrolled restaurants. Our consolidated subsidiaries at December 31, 2013 and December 25, 2012included 15 majority-owned restaurants, all of which were open. Our consolidated subsidiaries atDecember 27, 2011included 12 majority-owned restaurants, all of which were open.
Managing Partners and Market Partners. Managing partners are single unit operators who haveprimary responsibility for the day-to-day operations of the entire restaurant and are responsible formaintaining the standards of quality and performance we establish. Market partners, generally, havesupervisory responsibilities for up to 10 to 15 restaurants. In addition to supervising the operations of
40

our restaurants, they are also responsible for the hiring and development of each restaurant’smanagement team and assist in the new restaurant site selection process.
Results of Operations
Fiscal Year
2013 2012 2011
$ % $ % $ %
(in thousands)
Consolidated Statements of Income:Revenue:
Restaurant sales . . . . . . . . . . . . . . . . . . . 1,410,118 99.1 1,252,358 99.1 1,099,475 99.1Franchise royalties and fees . . . . . . . . . . . 12,467 0.9 10,973 0.9 9,751 0.9
Total revenue . . . . . . . . . . . . . . . . . . . . . . . 1,422,585 100.0 1,263,331 100.0 1,109,226 100.0Costs and expenses:(As a percentage of restaurant sales)
Restaurant operating costs (excludingdepreciation and amortization shownseparately below):Cost of sales . . . . . . . . . . . . . . . . . . . . 492,306 34.9 423,615 33.8 367,385 33.4Labor . . . . . . . . . . . . . . . . . . . . . . . . . 411,394 29.2 367,763 29.4 326,233 29.7Rent . . . . . . . . . . . . . . . . . . . . . . . . . . 28,978 2.1 25,797 2.1 23,150 2.1Other operating . . . . . . . . . . . . . . . . . . 224,882 15.9 204,318 16.3 184,073 16.7
(As a percentage of total revenue)Pre-opening . . . . . . . . . . . . . . . . . . . . . . 17,891 1.3 12,399 1.0 11,534 1.0Depreciation and amortization . . . . . . . . . 51,562 3.6 46,717 3.7 42,709 3.9Impairment and closure . . . . . . . . . . . . . 399 NM 1,624 0.1 1,201 0.1Gain on sale of other concept . . . . . . . . . (1,800) (0.1) — — — —General and administrative . . . . . . . . . . . 77,258 5.4 70,640 5.6 57,702 5.2
Total costs and expenses . . . . . . . . . . . . . . . 1,302,870 91.6 1,152,873 91.3 1,013,987 91.4Income from operations . . . . . . . . . . . . . . . 119,715 8.4 110,458 8.7 95,239 8.6Interest expense, net . . . . . . . . . . . . . . . . . 2,201 0.2 2,347 0.2 2,413 0.2Equity income from investments in
unconsolidated affiliates . . . . . . . . . . . . . (713) (0.1) (428) 0.0 (366) 0.0
Income before taxes . . . . . . . . . . . . . . . . . . 118,227 8.3 108,539 8.5 93,192 8.4Provision for income taxes . . . . . . . . . . . . . 34,140 2.4 34,738 2.7 26,765 2.4
Net income including noncontrollinginterests . . . . . . . . . . . . . . . . . . . . . . . . . 84,087 5.9 73,801 5.8 66,427 6.0
Net income attributable to noncontrollinginterests . . . . . . . . . . . . . . . . . . . . . . . . . 3,664 0.3 2,631 0.2 2,463 0.2
Net income attributable to TexasRoadhouse, Inc. and subsidiaries . . . . . . . 80,423 5.7 71,170 5.6 63,964 5.8
41

Reconciliation of GAAP and Non-GAAP Information(in thousands, except per share data)
In addition to the results provided in accordance with U.S. Generally Accepted AccountingPrinciples (‘‘GAAP’’) throughout this document, the Company has provided non-GAAP measurementswhich present operating results on a basis before the impact of a settlement of a legal matter. Thisitem is described in further detail throughout this document.
The Company used earnings before the impact of the legal settlement as a key performancemeasure of results of operations for purposes of evaluating performance internally. This non-GAAPmeasurement is not intended to replace the presentation of our financial results in accordance withGAAP. Rather, the Company believes that the presentation of results before the impact of the legalsettlement provides additional information to facilitate the comparison of past and present operations,excluding items that the Company does not believe are indicative of our ongoing operations in the52 weeks ended December 25, 2012.
53 weeks ended 52 weeks endedDecember 31, 2013 December 25, 2012
$ $
Net income attributable to Texas Roadhouse, Inc. and subsidiaries,excluding settlement charge . . . . . . . . . . . . . . . . . . . . . . . . . . . . 80,423 74,232
Amount reserved for settlement of a legal matter, net of tax(1) . . . . — (3,062)
Net income attributable to Texas Roadhouse, Inc. and subsidiaries . . 80,423 71,170
Weighted average diluted shares outstanding . . . . . . . . . . . . . . . . . 71,362 71,485
Diluted earnings per share, excluding settlement charge . . . . . . . . . 1.13 1.04Impact of settlement charge on diluted earnings per share . . . . . . . — (0.04)
Diluted earnings per share . . . . . . . . . . . . . . . . . . . . . . . . . . . . . . 1.13 1.00
(1) Amount reserved in the first quarter of 2012 for the settlement of a legal matter was $5.0 millionbefore the statutory income tax rate. The settlement is included in general administrative costs inour consolidated statements of income and comprehensive income.
42

Restaurant Unit Activity
Company Franchise Total
Balance at December 28, 2010 . . . . . . . . . . . . . . . . . . . . 274 71 345Openings—Texas Roadhouse . . . . . . . . . . . . . . . . . . . . . 20 1 21Openings—Aspen Creek . . . . . . . . . . . . . . . . . . . . . . . . — — —Closures . . . . . . . . . . . . . . . . . . . . . . . . . . . . . . . . . . . . — — —
Balance at December 27, 2011 . . . . . . . . . . . . . . . . . . . . 294 72 366Openings—Texas Roadhouse . . . . . . . . . . . . . . . . . . . . . 25 2 27Openings—Aspen Creek . . . . . . . . . . . . . . . . . . . . . . . . — — —Acquisitions from franchisees . . . . . . . . . . . . . . . . . . . . . 2 (2) —Closures—Aspen Creek . . . . . . . . . . . . . . . . . . . . . . . . . (1) — (1)
Balance at December 25,2012 . . . . . . . . . . . . . . . . . . . . . 320 72 392Openings—Texas Roadhouse . . . . . . . . . . . . . . . . . . . . . 25 4 29Openings—Other . . . . . . . . . . . . . . . . . . . . . . . . . . . . . . 1 — 1Acquisitions from franchisees . . . . . . . . . . . . . . . . . . . . . 2 (2) —Divestitures—Aspen Creek . . . . . . . . . . . . . . . . . . . . . . . (2) — (2)
Balance at December 31,2013 . . . . . . . . . . . . . . . . . . . . . 346 74 420
Restaurant Sales
Restaurant sales increased by 12.6% in 2013 as compared to 2012. The increase was primarilyattributable to the opening of new restaurants and the acquisition of two franchise restaurants onDecember 25, 2012 coupled with the addition of a 53rd week in 2013 and an increase in average unitvolume, primarily due to comparable restaurant sales growth. The 53rd week in 2013 resulted in$32.0 million in restaurant sales or 2.5% of the increase in 2013 compared to 2012. Restaurant salesincreased 13.9% in 2012 as compared to 2011. This increase was attributable to the opening of newrestaurants and an increase in average unit volume, primarily due to comparable restaurant salesgrowth.
The following table summarizes certain key drivers and/or attributes of restaurant sales at companyrestaurants for the periods. Although 2013 contains 53 weeks, for comparative purposes, 2013 average
43

unit volume was adjusted to a 52-week basis. In addition to average unit volume on a 53 week basis,for comparative purposes, we also include 2013 average unit volume adjusted to a 52 week basis.
2013 2012 2011
Company RestaurantsIncrease in store weeks . . . . . . . . . . . . . . . . . . . . . 9.3% 9.4% 5.6%Increase in average unit volume . . . . . . . . . . . . . . . 2.7 4.3 5.0Other(1) . . . . . . . . . . . . . . . . . . . . . . . . . . . . . . . . 0.6 0.2 (0.2)
Total increase in restaurant sales . . . . . . . . . . . . . . 12.6% 13.9% 10.4%
Store weeks . . . . . . . . . . . . . . . . . . . . . . . . . . . . . . 17,426 15,936 14,573Comparable restaurant sales growth . . . . . . . . . . . . 3.4% 4.7% 4.7%Texas Roadhouse restaurants only:
Comparable restaurant sales growth . . . . . . . . . . 3.4% 4.7% 4.8%Average unit volume (in thousands) . . . . . . . . . . $ 4,285 $ 4,085 $ 3,917Average unit volume (in thousands), 2013
adjusted . . . . . . . . . . . . . . . . . . . . . . . . . . . . . $ 4,194 $ 4,085 $ 3,917
(1) Includes the impact of the year-over-year change in sales volume of all Aspen Creekrestaurants, along with Texas Roadhouse restaurants open less than six months before thebeginning of the period measured, and, if applicable, the impact of restaurants closed oracquired during the period.
The increases in store weeks for the periods presented above are primarily attributable to theopening of new restaurants. In addition, the increase in store weeks in 2013 includes the impact of the53rd week and the impact of the acquisition of two franchise restaurants on December 25, 2012,partially offset by the closure of one non-Texas Roadhouse restaurant in the fourth quarter of 2012.Company restaurant count activity is shown in the restaurant unit activity table above.
The increases in average unit volume for 2013 compared to 2012 and 2012 compared to 2011 wereprimarily driven by positive comparable restaurant sales growth, partially offset by lower year-over-yearsales for the newer restaurants included in our average unit volume but excluded from comparablerestaurant sales. Comparable restaurant sales growth of 3.4% in 2013 was due to a combination of anincrease in our per person average check of 2.4% and an increase in guest traffic counts of 1.0%. For2012, comparable restaurant sales growth of 4.7% was primarily due to increases in our per personaverage check of 3.4%, along with increases in guest traffic counts of 1.3%.
The increase in our per person average check for the 2013 and 2012 was driven by menu priceincreases taken in 2013, 2012 and 2011. In 2013, we increased menu prices approximately 1.5% in earlyDecember. In 2012, we increased menu prices approximately 2.2% in the first quarter andapproximately 2.2% in early December. In 2011, we increased menu prices approximately 2.5% to 3.0%with approximately 1.0% during the first quarter of the year and the remaining during the third andfourth quarters of the year. These menu price increases were taken as a result of inflationary pressures,primarily commodities.
In 2014, we plan to open 25 to 30 company restaurants. We have either begun construction orhave sites under contract for purchase or lease for 24 of these restaurants.
Franchise Royalties and Fees
Franchise royalties and fees increased by $1.5 million or by 13.6% in 2013 from 2012. This increasewas primarily attributable to the opening of new franchise restaurants and an increase in average unitvolume, coupled with the addition of a 53rd week in 2013. The increase was partially offset by the
44

impact of the acquisition of two franchise restaurants in 2012. Franchise comparable restaurant salesincreased by 4.3% in 2013. The acquired franchise restaurants generated approximately $0.3 million infranchise royalties in 2012. Franchise restaurant count activity is shown in the restaurant unit activitytable above. We anticipate our existing franchise partners will open as many as five Texas Roadhouserestaurants in 2014.
On December 31, 2013, we acquired two franchise restaurants in Ohio. These acquisitions had noimpact on 2013 diluted earnings per share as the acquisition occurred on the last day of our fiscal year.In both 2013 and 2012, these restaurants paid us $0.3 million in franchise royalties. We expect that theacquisition will have no significant net revenue or accretive net income impact on an on-going annualbasis.
Franchise royalties and fees increased by $1.2 million or by 12.5% in 2012 from 2011. This increasewas primarily attributable to an increase in average unit volume, increasing royalty rates in conjunctionwith the renewal of certain franchise agreements and the opening of new franchise restaurants.Franchise comparable restaurant sales increased by 5.3% in 2012.
Restaurant Cost of Sales
Restaurant cost of sales, as a percentage of restaurant sales, increased to 34.9% in 2013 from33.8% in 2012. This increase was primarily attributable to commodity inflation of approximately 7.0%in 2013, partially offset by the impact of menu pricing actions taken in late 2012 and the benefit ofoperating efficiencies associated with process improvements at the restaurant level. Commodityinflation in 2013 was driven by higher food costs, primarily beef. For 2014, we have fixed pricecontracts for 35% to 40% of our overall food costs with the remainder subject to fluctuating marketprices. We expect low single digit commodity inflation in 2014.
Restaurant cost of sales, as a percentage of restaurant sales, increased to 33.8% in 2012 from33.4% in 2011. This increase was primarily attributable to commodity inflation of approximately 6.4%in 2012, partially offset by the impact of menu pricing actions in 2012 and 2011 and the benefit offavorable mix shift. Commodity inflation in 2012 was driven by higher food costs on items such as beefand pork, partially offset by lower costs for certain produce items, specifically potatoes. The benefit offavorable mix shift was primarily driven by the addition of pictures to the menu in late January 2012which has resulted in higher sales for the items shown. These items have a slightly lower food cost, as apercentage of sales, than other items within the same category.
Restaurant Labor Expenses
Restaurant labor expenses, as a percentage of restaurant sales, decreased to 29.2% in 2013 from29.4% in 2012. The decrease was primarily driven by an increase in average unit volume, partially offsetby higher average wage rates and labor inefficiencies associated with recently opened restaurants. Thetiming of restaurant openings in 2013 and 2012 led to an increase in labor inefficiencies, as apercentage of restaurant sales in 2013. Typically, restaurants open with an initial start-up period ofhigher than normalized sales volume and higher than normalized labor costs, as a percentage of sales.In 2014, we anticipate our labor costs will be pressured by continued wage rate inflation due tocontinued state-mandated increases in minimum and tip wage rates and by higher health insurancecosts due to an increase in premiums and offering coverage to an expanded population of employees.This increase may or may not be offset by additional menu price adjustments and/or guest trafficgrowth. At the beginning of 2014, we offered coverage to employees which included hourly employeesthat work a minimum of 35 hours per week. As a result of this change, we expect our health benefitcosts will be $2.5 to $3.0 million higher in 2014 compared to prior year.
Restaurant labor expenses, as a percentage of restaurant sales, decreased to 29.4% in 2012 from29.7% in 2011. The decrease was primarily driven by an increase in average unit volume, partially offset
45

by higher average wage rates and labor inefficiencies associated with recently opened restaurants. Thetiming of restaurant openings in 2012 and 2011 led to an increase in labor inefficiencies, as apercentage of restaurant sales in 2012.
Restaurant Rent Expense
Restaurant rent expense, as a percentage of restaurant sales, remained unchanged at 2.1% in 2013compared to 2012 and 2011. In all periods presented, the benefit from an increase in average unitvolume was offset by the impact of leasing more land and buildings than we have in the past. Inaddition, 2013 benefitted from the addition of a 53rd week of sales in the fourth quarter as rent expenseis incurred on a calendar month basis.
Restaurant Other Operating Expenses
Restaurant other operating expenses, as a percentage of restaurant sales, decreased to 15.9% in2013 from 16.3% in 2012. This decrease was primarily attributable to an increase in average unitvolume and lower general liability insurance and supply costs, partially offset by higher gift card fees. Inthe third quarter of 2013, we recorded a $1.3 million reduction to general liability insurance costs dueto changes in our claims development history included in our quarterly actuarial reserve estimate.Lower supply costs were primarily driven by purchasing initiatives throughout 2013, while higher giftcard fees were primarily due to the expansion of our third-party gift card retail program in the fourthquarter of 2012.
Restaurant other operating expenses, as a percentage of restaurant sales, decreased to 16.3% in2012 from 16.7% in 2011. This decrease was primarily attributable to an increase in average unitvolume and lower utility costs and credit card fees, partially offset by higher costs for managing partnerand market partner bonuses, as a percentage of sales. Managing partner and market partner bonuseswere higher in 2012 as a result of improved restaurant sales and higher restaurant margins.
Restaurant Pre-opening Expenses
Pre-opening expenses in 2013 increased to $17.9 million from $12.4 million in 2012. The increasewas primarily attributable to an increase in spending on a per store basis, along with an increase in thenumber of restaurants in the development pipeline. We opened 26 company restaurants in 2013compared to 25 restaurant openings in 2012. Pre-opening costs will fluctuate from period to periodbased on the specific pre-opening costs incurred for each restaurant, the number and timing ofrestaurant openings and the number and timing of restaurant managers hired.
Pre-opening expenses in 2012 increased to $12.4 million from $11.5 million in 2011. This increasewas primarily attributable to more restaurant openings in 2012 versus the prior year. We opened 25company restaurants in 2012 compared to 20 company restaurants in 2011.
Depreciation and Amortization Expenses (‘‘D&A’’)
D&A, as a percentage of revenue, decreased to 3.6% in 2013 from 3.7% in 2012. Along with anincrease in average unit volume, the decrease was primarily due to the impact of an additional week ofsales in 2013 and lower depreciation expense, as a percentage of revenue, on older restaurants asdepreciation expense on short-lived assets, such as equipment, has ended. The decrease was partiallyoffset by higher depreciation, as a percentage of revenue, at new restaurants and an adjustment of$0.7 million recorded in the fourth quarter of 2013 due to shortening the estimated useful life ofcertain leasehold improvements.
D&A, as a percentage of revenue, decreased to 3.7% in 2012 from 3.9% in 2011. Along with anincrease in average unit volume, the decrease was primarily due to lower depreciation expense, as a
46

percentage of revenue, on older restaurants as depreciation expense on short-lived assets, such asequipment, has ended. The decrease was partially offset by higher depreciation, as a percentage ofrevenue, at new restaurants.
Impairment and Closure Expenses
Impairment and closure expenses decreased to $0.4 million in 2013 from $1.6 million in 2012 and$1.2 million in 2011. In 2013, we recorded $0.3 million of impairment expense associated with the writedown of assets, primarily land and building, and ongoing closure costs related to a restaurant whichclosed in 2009. In addition, we recorded $0.1 million of impairment expense associated with the writedown of equipment and ongoing closure costs related to a restaurant which closed in 2012. In 2012, werecorded $0.5 million of impairment expense associated with the goodwill and intangible asset relatedto one restaurant and $0.9 million of impairment expense associated with the write down of assets,primarily land and building, related to a restaurant which was closed in 2012. In 2011, we recorded$0.8 million of impairment expense associated with the goodwill related to one restaurant and$0.3 million of impairment expense associated with the write down of assets, primarily land andbuilding, related to a restaurant which was closed in 2009. For 2012 and 2011, we also incurred costsprimarily attributable to various restaurant closures in prior fiscal years.
See note 15 in the Consolidated Financial Statements for further discussion regarding closures andimpairments recorded in 2013, 2012 and 2011, including the impairments of goodwill and otherlong-lived assets.
General and Administrative Expenses (‘‘G&A’’)
G&A, as a percentage of total revenue, decreased to 5.4% in 2013 from 5.6% in 2012. Thedecrease was primarily attributable to lower legal settlement charges, an increase in average unitvolume and a benefit from the impact of the extra week in the fourth quarter, partially offset by highercosts related to our annual managing partner conference. In the first quarter of 2012, we recorded apre-tax charge of $5.0 million related to the settlement of a previously disclosed legal matter. In 2013,we incurred costs of $4.0 million related to our annual managing partner conference compared to$2.0 million in 2012. The conference was held in the second quarter of both 2013 and 2012.
G&A, as a percentage of total revenue, increased to 5.6% in 2012 from 5.2% in 2011. Theincrease was primarily attributable to higher legal settlement charges, along with higher costs associatedwith share-based compensation, partially offset by an increase in average unit volume and lower costsrelated to our annual managing partner conference in the second quarter of 2012. The higher legalsettlement charges in 2012 were primarily due to the charge discussed above. Share-basedcompensation costs were approximately $2.0 million higher in 2012 compared to 2011 primarily drivenby a higher stock price associated with a grant of restricted stock units on January 7, 2012 inconjunction with the execution of certain executive employment contracts at the beginning of 2012.
Interest Expense, Net
Net interest expense remained relatively flat at $2.2 million in 2013 compared to $2.3 million in2012 which was relatively flat compared to $2.4 million in 2011.
Income Taxes
We account for income taxes in accordance with Financial Accounting Standards Board (‘‘FASB’’)Accounting Standards Codification (‘‘ASC’’) 740, Income Taxes (‘‘ASC 740’’). Our effective tax ratedecreased to 28.9% in 2013 from 32.0% in 2012. The decrease in 2013 was primarily attributable theretrospective reinstatement of Work Opportunity Tax Credits (‘‘WOTC’’), a decrease in non-deductible
47

officer’s compensation, and higher deductible incentive option activity. For 2014, we expect the tax rateto be 30.0% to 31.0% primarily due to the expiration of WOTC at the end of 2013.
Our effective tax rate increased to 32.0% in 2012 from 28.7% in 2011. The increase in 2012 wasprimarily attributable to the loss of the HIRE Retention tax credit, higher non-deductible officer’scompensation and lower WOTC as a percentage of pre-tax income, partially offset by higher FICA tipcredits.
Liquidity and Capital Resources
The following table presents a summary of our net cash provided by (used in) operating, investingand financing activities:
Fiscal Year
2013 2012 2011
Net cash provided by operating activities . . . . . . . $ 173,836 $148,046 $136,419Net cash used in investing activities . . . . . . . . . . . (111,248) (90,154) (79,475)Net cash used in financing activities . . . . . . . . . . . (49,460) (54,923) (64,421)
Net increase (decrease) in cash and cashequivalents . . . . . . . . . . . . . . . . . . . . . . . . . . . $ 13,128 $ 2,969 $ (7,477)
Net cash provided by operating activities was $173.8 million in 2013 compared to $148.0 million in2012. This increase was primarily due to an increase in net income, along with changes in workingcapital. The increase in net income was driven by the continued opening of new restaurants, anincrease in comparable restaurant sales at existing restaurants, partially offset by higher food andoperating costs. The changes in working capital are primarily driven by a decrease in income taxes paid,partially offset by a increase in receivables which is primarily due to an increase in amounts due fromour third party gift card retailers as the program has expanded. Net cash provided by operatingactivities was $148.0 million in 2012 compared to $136.4 million in 2011. This increase was primarilydue to an increase in net income, along with changes in working capital. The increase in net incomewas driven by continued growth in overall sales combined with higher restaurant-level profitability.
Our operations have not required significant working capital and, like many restaurant companies,we have been able to operate with negative working capital. Sales are primarily for cash, and restaurantoperations do not require significant inventories or receivables. In addition, we receive trade credit forthe purchase of food, beverages and supplies, thereby reducing the need for incremental workingcapital to support growth.
Net cash used in investing activities was $111.2 million in 2013 compared to $90.2 million in 2012.The increase was primarily due to increased spending on capital expenditures related to new restaurantopenings planned in future years, partially offset by the acquisition of two franchise restaurants in 2012.We incurred approximately $23.0 million of capital expenditures in 2013 for restaurants that areplanned to open in future years as compared to approximately $9.0 million of capital expendituresincurred in 2012 for restaurants to be opened in future years. In addition, the average capitalinvestment in Texas Roadhouse restaurants opened in 2013 was slightly higher than 2012. Net cash usedin investing activities was $90.2 million in 2012 compared to $79.5 million in 2011. The increase wasprimarily due to an increase in capital expenditures on the refurbishment of existing restaurants, suchas remodeling, room additions and other general maintenance, along with the acquisition of twofranchise restaurants on the last day of the 2012 fiscal year for a purchase price of $4.3 million,partially offset by the impact from the timing of restaurant openings, which resulted in lower capitalexpenditures on new restaurants in 2012 compared to 2011.
48
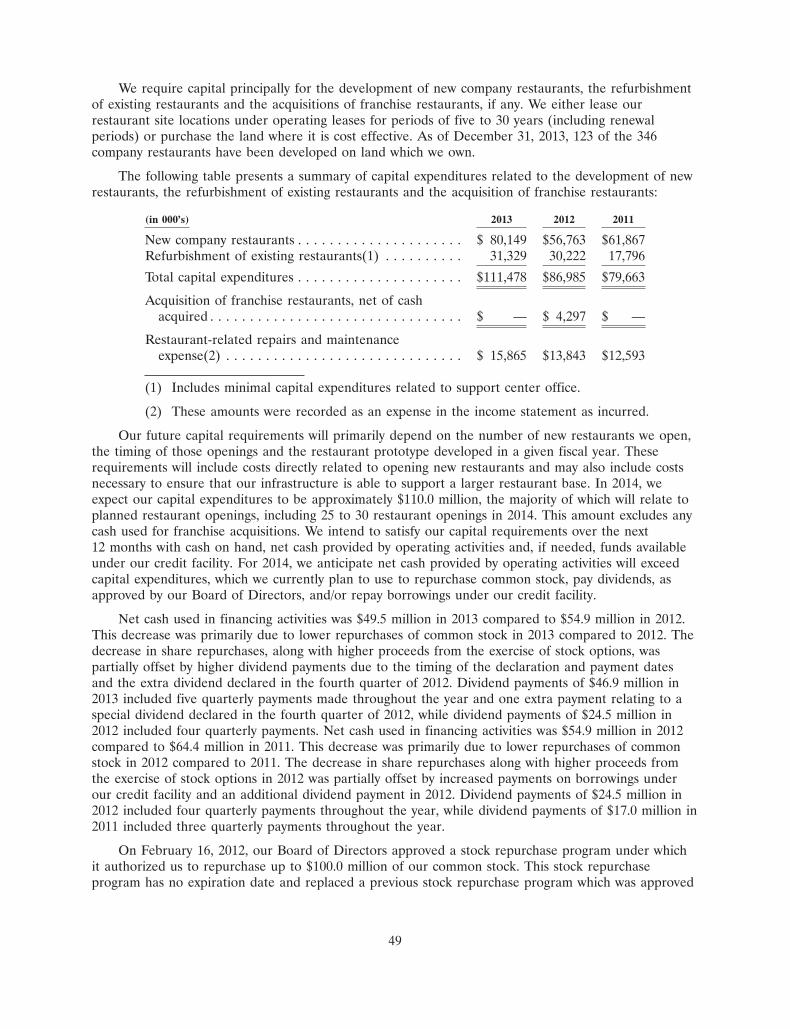
We require capital principally for the development of new company restaurants, the refurbishmentof existing restaurants and the acquisitions of franchise restaurants, if any. We either lease ourrestaurant site locations under operating leases for periods of five to 30 years (including renewalperiods) or purchase the land where it is cost effective. As of December 31, 2013, 123 of the 346company restaurants have been developed on land which we own.
The following table presents a summary of capital expenditures related to the development of newrestaurants, the refurbishment of existing restaurants and the acquisition of franchise restaurants:
(in 000’s) 2013 2012 2011
New company restaurants . . . . . . . . . . . . . . . . . . . . . $ 80,149 $56,763 $61,867Refurbishment of existing restaurants(1) . . . . . . . . . . 31,329 30,222 17,796
Total capital expenditures . . . . . . . . . . . . . . . . . . . . . $111,478 $86,985 $79,663
Acquisition of franchise restaurants, net of cashacquired . . . . . . . . . . . . . . . . . . . . . . . . . . . . . . . . $ — $ 4,297 $ —
Restaurant-related repairs and maintenanceexpense(2) . . . . . . . . . . . . . . . . . . . . . . . . . . . . . . $ 15,865 $13,843 $12,593
(1) Includes minimal capital expenditures related to support center office.
(2) These amounts were recorded as an expense in the income statement as incurred.
Our future capital requirements will primarily depend on the number of new restaurants we open,the timing of those openings and the restaurant prototype developed in a given fiscal year. Theserequirements will include costs directly related to opening new restaurants and may also include costsnecessary to ensure that our infrastructure is able to support a larger restaurant base. In 2014, weexpect our capital expenditures to be approximately $110.0 million, the majority of which will relate toplanned restaurant openings, including 25 to 30 restaurant openings in 2014. This amount excludes anycash used for franchise acquisitions. We intend to satisfy our capital requirements over the next12 months with cash on hand, net cash provided by operating activities and, if needed, funds availableunder our credit facility. For 2014, we anticipate net cash provided by operating activities will exceedcapital expenditures, which we currently plan to use to repurchase common stock, pay dividends, asapproved by our Board of Directors, and/or repay borrowings under our credit facility.
Net cash used in financing activities was $49.5 million in 2013 compared to $54.9 million in 2012.This decrease was primarily due to lower repurchases of common stock in 2013 compared to 2012. Thedecrease in share repurchases, along with higher proceeds from the exercise of stock options, waspartially offset by higher dividend payments due to the timing of the declaration and payment datesand the extra dividend declared in the fourth quarter of 2012. Dividend payments of $46.9 million in2013 included five quarterly payments made throughout the year and one extra payment relating to aspecial dividend declared in the fourth quarter of 2012, while dividend payments of $24.5 million in2012 included four quarterly payments. Net cash used in financing activities was $54.9 million in 2012compared to $64.4 million in 2011. This decrease was primarily due to lower repurchases of commonstock in 2012 compared to 2011. The decrease in share repurchases along with higher proceeds fromthe exercise of stock options in 2012 was partially offset by increased payments on borrowings underour credit facility and an additional dividend payment in 2012. Dividend payments of $24.5 million in2012 included four quarterly payments throughout the year, while dividend payments of $17.0 million in2011 included three quarterly payments throughout the year.
On February 16, 2012, our Board of Directors approved a stock repurchase program under whichit authorized us to repurchase up to $100.0 million of our common stock. This stock repurchaseprogram has no expiration date and replaced a previous stock repurchase program which was approved
49

on February 17, 2011. The previous program authorized us to repurchase up to $50.0 million of ourcommon stock and was increased by $50.0 million on August 18, 2011. Any repurchases will be madethrough open market transactions. The timing and the amount of any repurchases will be determinedby management under parameters established by our Board of Directors, based on its evaluation of ourstock price, market conditions and other corporate considerations. During 2013, we paid approximately$12.8 million to repurchase 461,600 shares of our common stock and we had $57.9 million remainingunder our authorized stock repurchase program as of December 31, 2013.
We paid cash dividends of $46.9 million in 2013, including the payment of a regular quarterlydividend authorized by our Board of Directors on November 14, 2013 of $0.12 per share of commonstock to shareholders of record at the close of business on December 11, 2013. This payment wasdistributed on December 27, 2013. On February 20, 2014, our Board of Directors authorized thepayment of a quarterly cash dividend of $0.15 per share of common stock. This payment will bedistributed on April 4, 2014 to shareholders of record at the close of business on March 19, 2014. Theincrease in the dividend per share amount reflects the increase in our regular annual dividend ratefrom $0.48 per share in 2013 to $0.60 per share in 2014. The declaration and payment of cashdividends on our common stock is at the discretion of our Board of Directors, and any decision todeclare a dividend will be based on a number of factors, including, but not limited to, earnings,financial condition, applicable covenants under our credit facility and other contractual restrictions, orother factors deemed relevant.
We paid distributions of $3.1 million and $2.7 million to equity holders of 15 of our majority-owned company restaurants in 2013 and 14 of our majority-owned company restaurants in 2012,respectively. In 2011, we paid $2.3 million to equity holders of 11 of our majority-owned companyrestaurants.
On November 1, 2013, we entered into Omnibus Amendment No. 1 and Consent to CreditAgreement and Guaranty with respect to our revolving credit facility dated as of August 12, 2011 witha syndicate of commercial lenders led by JP Morgan Chase Bank, N.A., PNC Bank, N.A., and WellsFargo, N.A. The revolving credit facility remains an unsecured, revolving credit agreement under whichwe may borrow up to $200.0 million. The amendment provides us with the option to increase therevolving credit facility by $200.0 million, up to $400.0 million, subject to certain limitations. Theoriginal revolving credit facility provided an option to increase the borrowing amount by $100.0 million,up to $300.0 million. The amendment also extends the maturity date of the revolving credit facility untilNovember 1, 2018.
The terms of the amended revolving credit facility require us to pay interest on outstandingborrowings at the London Interbank Offered Rate (‘‘LIBOR’’) plus a margin of 0.875% to 1.875%,depending on our leverage ratio, or the Alternate Base Rate, which is the higher of the issuing bank’sprime lending rate, the Federal Funds rate plus 0.50% or the Adjusted Eurodollar Rate for a onemonth interest period on such day plus 1.0%. We are also required to pay a commitment fee of 0.125%to 0.30% per year on any unused portion of the revolving credit facility, depending on our leverageratio. The weighted-average interest rate for the revolving credit facility at both December 31, 2013 andDecember 25, 2012 was 3.96%, including the impact of interest rate swaps. At December 31, 2013, wehad $50.0 million outstanding under the revolving credit facility and $145.3 million of availability, net of$4.7 million of outstanding letters of credit.
The lenders’ obligation to extend credit under the revolving credit facility depends on usmaintaining certain financial covenants, including a minimum consolidated fixed charge coverage ratioof 2.00 to 1.00 and a maximum consolidated leverage ratio of 3.00 to 1.00. The revolving credit facilitypermits us to incur additional secured or unsecured indebtedness outside the facility, except for theincurrence of secured indebtedness that in the aggregate exceeds 15% of our consolidated tangible networth or circumstances where the incurrence of secured or unsecured indebtedness would prevent usfrom complying with our financial covenants. We were in compliance with all covenants as ofDecember 31, 2013.
50

On October 22, 2008, we entered into an interest rate swap, starting on November 7, 2008, with anotional amount of $25.0 million to hedge a portion of the cash flows of our variable rate borrowings.We have designated the interest rate swap as a cash flow hedge of our exposure to variability in futurecash flows attributable to interest payments on a $25.0 million tranche of floating rate debt borrowedunder our revolving credit facility. Under the terms of the swap, we pay a fixed rate of 3.83% on the$25.0 million notional amount and receive payments from the counterparty based on the 1-monthLIBOR rate for a term ending on November 7, 2015, effectively resulting in a fixed rate on the$25.0 million notional amount. Our counterparty in the interest rate swap is JP Morgan ChaseBank, N.A. Changes in the fair value of the interest rate swap will be reported as a component ofaccumulated other comprehensive income (loss).
On January 7, 2009, we entered into an interest rate swap, starting on February 7, 2009, with anotional amount of $25.0 million to hedge a portion of the cash flows of our variable rate borrowings.We have designated the interest rate swap as a cash flow hedge of our exposure to variability in futurecash flows attributable to interest payments on a $25.0 million tranche of floating rate debt borrowedunder our revolving credit facility. Under the terms of the swap, we pay a fixed rate of 2.34% on the$25.0 million notional amount and receive payments from the counterparty based on the 1-monthLIBOR rate for a term ending on January 7, 2016, effectively resulting in a fixed rate on the$25.0 million notional amount. Our counterparty in the interest rate swap is JP Morgan ChaseBank, N.A. Changes in the fair value of the interest rate swap will be reported as a component ofaccumulated other comprehensive income (loss).
Contractual Obligations
The following table summarizes the amount of payments due under specified contractualobligations as of December 31, 2013:
Payments Due by Period
Less than More thanTotal 1 year 1 - 3 Years 3 - 5 Years 5 years
(in thousands)
Long-term debt obligations . . . . . . . . . . . . . . . $ 51,233 $ 243 $ 440 $ 50,336 $ 214Interest(1) . . . . . . . . . . . . . . . . . . . . . . . . . . . 5,653 2,096 2,505 1,039 13Operating lease obligations . . . . . . . . . . . . . . . 522,073 29,330 53,558 53,413 385,772Capital obligations . . . . . . . . . . . . . . . . . . . . . 65,202 65,202 — — —
Total contractual obligations(2) . . . . . . . . . . . . $644,161 $96,871 $56,503 $104,788 $385,999
(1) Assumes constant rate until maturity for our fixed and variable rate debt and capital leaseobligations. Uses interest rates as of December 31, 2013 for our variable rate debt. Interestpayments on our variable-rate revolving credit facility balance at December 31, 2013 are calculatedbased on the assumption that debt relating to the interest rate swaps covering notional amountstotaling $50.0 million remains outstanding until the expiration of the respective swap arrangements.The interest rates used in determining interest payments to be made under the interest rate swapagreements were determined by taking the applicable fixed rate of each swap plus the 0.875%margin, which was in effect as of December 31, 2013. Additionally, we have assumed that$50.0 million in revolving credit facility borrowings remain outstanding after the termination of theinterest rate swaps and have calculated interest payments using the weighted average interest rateof 1.04%, which was the interest rate associated with our revolving credit facility on December 31,2013.
(2) Unrecognized tax benefits under Accounting Standards Codification (‘‘ASC’’) 740 are immaterialand, therefore, are excluded from this amount.
51

The Company has no material minimum purchase commitments with its vendors that extendbeyond a year. See notes 4 and 7 to the Consolidated Financial Statements for details of contractualobligations.
Off-Balance Sheet Arrangements
Except for operating leases (primarily restaurant leases), we do not have any off-balance sheetarrangements.
Guarantees
Effective December 31, 2013, we sold two restaurants, which operated under the name AspenCreek, located in Irving, TX and Louisville, KY. We assigned the leases associated with theserestaurants to the acquirer, but remain contingently liable under the terms of the lease if the acquirerdefaults. We are contingently liable for the initial term of the lease and any renewal periods. The Irvinglease has an initial term that expires December 2019, along with three five-year renewals. TheLouisville lease has an initial term that expires November 2023, along with three five-year renewals.The assignment of the Louisville lease releases us from liability after the initial lease term expirationcontingent upon certain conditions being met by the acquirer. As the fair value of the guarantees is notconsidered significant, no liability has been recorded.
We entered into real estate lease agreements for five franchises, listed in the table below, beforegranting franchise rights for those restaurants. We have subsequently assigned the leases to thefranchisees, but remain contingently liable if a franchisee defaults, under the terms of the lease.
Lease Assignment Initial LeaseDate Term Expiration
Everett, Massachusetts(1) . . . . . . . . . . . . . . . . . . September 2002 February 2018Longmont, Colorado(1) . . . . . . . . . . . . . . . . . . . October 2003 May 2014Montgomeryville, Pennsylvania . . . . . . . . . . . . . . October 2004 June 2021Fargo, North Dakota(1) . . . . . . . . . . . . . . . . . . . February 2006 July 2016Logan, Utah . . . . . . . . . . . . . . . . . . . . . . . . . . . January 2009 August 2019
We are contingently liable for the initial term of the lease and any renewal periods. All of theleases have three five-year renewals. As the fair value of the guarantees is not considered significant,no liability has been recorded.
Recent Accounting Pronouncements
Comprehensive Income(Accounting Standards Update 2013-02, ‘‘ASU 2013-2’’)
In February 2013, the FASB issued ASU 2013-2, Reporting of Amounts Reclassified Out ofAccumulated Other Comprehensive Income, that requires an organization to present the effects on theline items of net income of significant amounts reclassified out of accumulated other comprehensiveincome (‘‘AOCI’’), but only if the item reclassified is required under GAAP to be reclassified to netincome in its entirety in the same reporting period. ASU 2013-02 was effective for fiscal yearsbeginning after December 15, 2012 (our 2013 fiscal year). The adoption of this new guidance had noimpact on our consolidated financial position, results of operations or cash flows.
Critical Accounting Policies and Estimates
The above discussion and analysis of our financial condition and results of operations are basedupon our consolidated financial statements, which have been prepared in accordance with U.S. GAAP.The preparation of these financial statements requires us to make estimates and judgments that affect
52

the reported amounts of assets, liabilities, revenue and expenses, and disclosures of contingent assetsand liabilities. Our significant accounting policies are described in note 2 to the accompanyingconsolidated financial statements. Critical accounting policies are those that we believe are mostimportant to portraying our financial condition and results of operations and also require the greatestamount of subjective or complex judgments by management. Judgments or uncertainties regarding theapplication of these policies may result in materially different amounts being reported under differentconditions or using different assumptions. We consider the following policies to be the most critical inunderstanding the judgments that are involved in preparing the consolidated financial statements.
Impairment of Long-lived Assets. We evaluate long-lived asset related to each restaurant to beheld and used in the business, such as property and equipment and intangible assets subject toamortization, for impairment whenever events and circumstances indicate that the carrying amount of arestaurant may not be recoverable. When we evaluate restaurants, cash flows are the primary indicatorof impairment. Recoverability of assets to be held and used is measured by comparison of the carryingamount of the restaurant to estimated undiscounted future cash flows expected to be generated by therestaurant. Under our policies, trailing 12-month cash flow results below $300,000 at the individualrestaurant level signals a potential impairment. In our evaluation of restaurants that do not meet thecash flow threshold, we estimate future undiscounted cash flows from operating the restaurant over itsestimated useful life, which can be a period of over 20 years. In the estimation of future cash flows, weconsider the period of time the restaurant has been open, the trend of operations over such period andfuture periods and expectations for future sales growth. We limit assumptions about important factorssuch as trend of future operations and sales growth to those that are supportable based upon our plansfor the restaurant and actual results at comparable restaurants. Both qualitative and quantitativeinformation are considered when evaluating for potential impairments. As we assess the ongoingexpected cash flows and carrying amounts of our long-lived assets, these factors could cause us torealize a material impairment charge.
If assets are determined to be impaired, we measure the impairment charge by calculating theamount by which the asset carrying amount exceeds its fair value. The determination of asset fair valueis also subject to significant judgment. We generally measure estimated fair value by discountingestimated future cash flows or by independent third party appraisal, if available. When fair value ismeasured by discounting estimated future cash flows, the assumptions used are consistent with what webelieve hypothetical market participants would use. We also use a discount rate that is commensuratewith the risk inherent in the projected cash flows. If these assumptions change in the future, we may berequired to record impairment charges for these assets.
At December 31, 2013, we had 11 restaurants whose trailing 12-month cash flows did not meet the$300,000 threshold. However, the future undiscounted cash flows from operating each of theserestaurants over their estimated useful lives exceeded the remaining carrying value of their assets andno assets were determined to be impaired. In 2013, we recorded impairment charges of $0.2 millionrelated to the write-down of a building associated with one previously closed restaurant. Thewrite-down of the building was based on discussions with the broker regarding recent offers on theproperty.
See note 15 in the Consolidated Financial Statements for further discussion regarding closures andimpairments recorded in 2013, 2012 and 2011, including the impairments of goodwill and otherlong-lived assets.
Goodwill. Goodwill is tested annually for impairment, and is tested more frequently if events andcircumstances indicate that the asset might be impaired. We have assigned goodwill to the reportingunit, which we consider to be the individual restaurant level. An impairment loss is recognized to theextent that the carrying amount exceeds the implied fair value of goodwill. The determination ofimpairment consists of two steps. First, we determine the fair value of the reporting unit and compare
53

it to its carrying amount. The fair value of the reporting unit may be based on several valuationapproaches including capitalization of earnings, discounted cash flows, comparable public companymarket multiples and comparable acquisition market multiples. Second, if the carrying amount of thereporting unit exceeds its fair value, an impairment loss is recognized for any excess of the carryingamount of the reporting unit’s goodwill over the implied fair value of the goodwill. The implied fairvalue of goodwill is determined by allocating the fair value of the reporting unit, in a manner similar toa purchase price allocation. The residual fair value after this allocation is the implied fair value of thereporting unit goodwill.
The valuation approaches used to determine fair value are subject to key judgments andassumptions that are sensitive to change such as appropriate revenue growth rates, operating margins,weighted average cost of capital, and comparable company and acquisition market multiples. Inestimating the fair value using the capitalization of earnings or discounted cash flows method weconsider the period of time the restaurant has been open, the trend of operations over such period andfuture periods, expectations of future sales growth and terminal value. Assumptions about importantfactors such as trend of future operations and sales growth are limited to those that are supportablebased upon the plans for the restaurant and actual results at comparable restaurants. When developingthese key judgments and assumptions, we consider economic, operational and market conditions thatcould impact fair value. The judgments and assumptions used are consistent with what we believehypothetical market participants would use. However, estimates are inherently uncertain and representonly our reasonable expectations regarding future developments. If the estimates used in performingthe impairment test prove inaccurate, the fair value of the restaurants may ultimately prove to besignificantly lower, thereby causing the carrying value to exceed the fair value and indicatingimpairment has occurred.
At December 31, 2013, we had 66 reporting units, primarily at the restaurant level, with allocatedgoodwill of $116.5 million. The average amount of goodwill associated with each reporting unit is$1.8 million with six reporting units having goodwill in excess of $4.0 million. Based on our estimate offair value, we are currently monitoring seven restaurants with total goodwill of $22.2 million and excessfair value over net book value of 27% for potential impairment. Since we determine the fair value ofgoodwill at the restaurant level, any significant decreases in cash flows at these restaurants or otherscould trigger an impairment charge in the future. The fair value of each of our other reporting unitswas substantially in excess of their respective carrying values as of the 2013 goodwill impairment test.See note 15 in the Consolidated Financial Statements for further discussion regarding closures andimpairments recorded in 2013, 2012 and 2011, including the impairments of goodwill and otherlong-lived assets.
Insurance Reserves. We self-insure a significant portion of expected losses under our health,workers compensation, general liability, employment practices liability and property insurance programs.We purchase insurance for individual claims that exceed the amounts listed below:
Employment practices liability . . . . . . . . . . . . . . . . . . . . . . . . . . . . . . . . $250,000Workers compensation . . . . . . . . . . . . . . . . . . . . . . . . . . . . . . . . . . . . . . $350,000General liability . . . . . . . . . . . . . . . . . . . . . . . . . . . . . . . . . . . . . . . . . . . $250,000Property . . . . . . . . . . . . . . . . . . . . . . . . . . . . . . . . . . . . . . . . . . . . . . . . $ 50,000Employee healthcare . . . . . . . . . . . . . . . . . . . . . . . . . . . . . . . . . . . . . . . $150,000
We record a liability for unresolved claims and for an estimate of incurred but not reported claimsat the anticipated cost to us based on estimates provided by management, a third party administratorand/or an actuary. Our estimated liability is based on a number of assumptions and factors regardingeconomic conditions, the frequency and severity of claims and claim development history andsettlement practices. An increase or decrease in the discount rate of 100 basis points would change thereserve, and resulting expense, by an immaterial amount. We also monitor actuarial observations of
54

historical claim development for the industry. Our assumptions are reviewed, monitored, and adjustedwhen warranted by changing circumstances.
Income Taxes. We account for income taxes in accordance with ASC 740 under which deferredassets and liabilities are recognized based upon anticipated future tax consequences attributable todifferences between financial statement carrying values of assets and liabilities and their respective taxbases. A valuation allowance is established to reduce the carrying value of deferred tax assets if it isconsidered more likely than not that such assets will not be realized. Any change in the valuationallowance would be charged to income in the period such determination was made.
Uncertain tax positions are accounted for under FASB ASC 740. FASB ASC 740 requires that aposition taken or expected to be taken in a tax return be recognized in the financial statements when itis more likely than not (i.e., a likelihood of more than fifty percent) that the position would besustained upon examination by tax authorities that have full knowledge of all relevant information. Arecognized tax position is then measured at the largest amount of benefit that is greater than fiftypercent likely of being realized upon settlement.
Leases and Leasehold Improvements. We lease land, buildings and/or certain equipment for themajority of our restaurants under non-cancelable lease agreements. Our land and/or building leasestypically have initial terms ranging from ten to 15 years, and certain renewal options for one or morefive-year periods. We account for leases in accordance with ASC 840, Leases, and other relatedauthoritative guidance. When determining the lease term, we include option periods for which failureto renew the lease imposes a penalty on us in such an amount that a renewal appears, at the inceptionof the lease, to be reasonably assured. The primary penalty to which we are subject is the economicdetriment associated with the existence of leasehold improvements which might become impaired if wechoose not to continue the use of the leased property.
Certain of our operating leases contain predetermined fixed escalations of the minimum rentduring the original term of the lease. For these leases, we recognize the related rent expense on astraight-line basis over the lease term and record the difference between the amounts charged tooperations and amounts paid as deferred rent. We generally do not receive rent concessions orleasehold improvement incentives upon opening a restaurant that is subject to a lease. We may receiverent holidays, which would begin on the possession date and end when the lease commences, duringwhich no cash rent payments are typically due under the terms of the lease. Rent holidays are includedin the lease term when determining straight-line rent expense.
Additionally, certain of our operating leases contain clauses that provide for additional contingentrent based on a percentage of sales greater than certain specified target amounts. We recognizecontingent rent expense prior to the achievement of the specified target that triggers the contingentrent, provided achievement of the target is considered probable. This may result in some variability inrent expense as a percentage of revenues over the term of the lease in restaurants where we paycontingent rent.
The judgment regarding the probable term for each restaurant property lease impacts theclassification and accounting for a lease as capital or operating, the rent holiday and/or escalation inpayments that are taken into consideration when calculating straight-line rent and the term over whichleasehold improvements for each restaurant are amortized. The material factor we consider whenmaking this judgment is the total amount invested in the restaurant at the inception of the lease andwhether management believes that renewal appears reasonably assured. While a different term mayproduce materially different amounts of depreciation, amortization and rent expense than reported, ourhistorical lease renewal rates support the judgments made. We have not made any changes to thenature of the assumptions used to account for leases in any of the fiscal years presented in ourconsolidated financial statements.
55

Effects of Inflation
We have not operated in a period of high general inflation for the last several years; however, wehave experienced material increases in certain commodity costs, specifically beef. In addition, asignificant number of our team members are paid at rates related to the federal and/or state minimumwage and, accordingly, increases in minimum wage have increased our labor costs for the last severalyears. We have increased menu prices and made other adjustments over the past few years, in an effortto offset increases in our restaurant and operating costs resulting from inflation. Whether we are ableand/or choose to continue to offset the effects of inflation will determine to what extent, if any,inflation affects our restaurant profitability in future periods.
ITEM 7A—QUANTITATIVE AND QUALITATIVE DISCLOSURES ABOUT MARKET RISK
We are exposed to market risk from changes in interest rates on debt and changes in commodityprices. Our exposure to interest rate fluctuations is limited to our outstanding bank debt. The terms ofthe revolving credit facility require us to pay interest on outstanding borrowings at London InterbankOffering Rate (‘‘LIBOR’’) plus a margin of 0.875% to 1.875%, depending on our leverage ratio, or theAlternate Base Rate, which is the higher of the issuing bank’s prime lending rate, the Federal Fundsrate plus 0.50% or the Adjusted Eurodollar Rate for a one month interest period on such day plus1.0%. At December 31, 2013, we had $50.0 million outstanding under the revolving credit facility,which bears interest at approximately 87.5 to 187.5 basis points (depending on our leverage ratios) overLIBOR. We had various other notes payable totaling $1.2 million with fixed interest rates ranging from10.46% to 10.80%.
On October 22, 2008, we entered into an interest rate swap, which started on November 7, 2008,with a notional amount of $25.0 million to hedge a portion of the cash flows of our variable rateborrowings. We have designated the interest rate swap as a cash flow hedge of our exposure tovariability in future cash flows attributable to interest payments on a $25.0 million tranche of floatingrate debt borrowed under our revolving credit facility. Under the terms of the swap, we pay a fixed rateof 3.83% on the $25.0 million notional amount and receive payments from the counterparty based onthe 1-month LIBOR rate for a term ending on November 7, 2015, effectively resulting in a fixed rateon the LIBOR component of the $25.0 million notional amount.
On January 7, 2009, we entered into another interest rate swap, starting February 7, 2009, with anotional amount of $25.0 million to hedge a portion of the cash flows of our variable rate borrowings.We have designated the interest rate swap as a cash flow hedge of our exposure to variability in futurecash flows attributable to interest payments on a $25.0 million tranche of floating rate debt borrowedunder our revolving credit facility. Under the terms of the swap, we pay a fixed rate of 2.34% on the$25.0 million notional amount and receive payments from the counterparty based on the 1-monthLIBOR rate for a term ending on January 7, 2016, effectively resulting in a fixed rate LIBORcomponent of the $25.0 million notional amount.
By using a derivative instrument to hedge exposures to changes in interest rates, we exposeourselves to credit risk. Credit risk is the failure of the counterparty to perform under the terms of thederivative contract. We minimize the credit risk by entering into transactions with high-qualitycounterparties whose credit rating is evaluated on a quarterly basis. Our counterparty in the interestrate swap is JP Morgan Chase Bank, N.A.
Many of the ingredients used in the products sold in our restaurants are commodities that aresubject to unpredictable price volatility. Currently, we do not utilize fixed price contracts for certaincommodities such as certain produce and certain dairy products, therefore, we are subject to prevailingmarket conditions when purchasing those types of commodities. For other commodities, we employvarious purchasing and pricing contract techniques in an effort to minimize volatility, including fixedprice contracts for terms of one year or less and negotiating prices with vendors with reference to
56

fluctuating market prices. We currently do not use financial instruments to hedge commodity prices, butwe will continue to evaluate their effectiveness. Extreme and/or long term increases in commodityprices could adversely affect our future results, especially if we are unable, primarily due to competitivereasons, to increase menu prices. Additionally, if there is a time lag between the increasing commodityprices and our ability to increase menu prices or if we believe the commodity price increase to be shortin duration and we choose not to pass on the cost increases, our short-term financial results could benegatively affected.
We are subject to business risk as our beef supply is highly dependent upon five vendors. If thesevendors were unable to fulfill their obligations under their contracts, we may encounter supplyshortages and incur higher costs to secure adequate supplies, any of which would harm our business.
ITEM 8—FINANCIAL STATEMENTS AND SUPPLEMENTARY FINANCIAL DATA
See Index to Consolidated Financial Statements at Item 15.
ITEM 9—CHANGES IN AND DISAGREEMENTS WITH ACCOUNTANTS ON ACCOUNTING ANDFINANCIAL DISCLOSURE
None.
ITEM 9A—CONTROLS AND PROCEDURES
Evaluation of disclosure controls and procedures
We have evaluated the effectiveness of the design and operation of our disclosure controls andprocedures pursuant to, and as defined in, Rules 13a-15(e) and 15d-15(e) under the SecuritiesExchange Act of 1934, as amended, as of the end of the period covered by this report. Based on theevaluation, performed under the supervision and with the participation of our management, includingthe Chief Executive Officer (the ‘‘CEO’’) and the Chief Financial Officer (the ‘‘CFO’’), ourmanagement, including the CEO and CFO, concluded that our disclosure controls and procedures wereeffective as of December 31, 2013.
Changes in internal control
During the fourth quarter of 2013, there were no changes with respect to our internal control overfinancial reporting that materially affected, or are reasonably likely to materially affect, our internalcontrol over financial reporting.
Management’s Report on Internal Control over Financial Reporting
Under Section 404 of the Sarbanes-Oxley Act of 2002, our management is required to assess theeffectiveness of the Company’s internal control over financial reporting as of the end of each fiscal yearand report, based on that assessment, whether the Company’s internal control over financial reportingis effective.
Management of the Company is responsible for establishing and maintaining adequate internalcontrol over financial reporting. As defined in Exchange Act Rule 13a-15(f), internal control overfinancial reporting is a process designed by, or under the supervision of, our principal executive andprincipal financial officer and effected by our board of directors, management and other personnel, toprovide reasonable assurance regarding the reliability of financial reporting and the preparation offinancial statements for external purposes in accordance with generally accepted accounting principles.Therefore, internal control over financial reporting determined to be effective can provide onlyreasonable assurance with respect to financial statement preparation and may not prevent or detect allmisstatements.
57

Under the supervision and with the participation of our management, including our CEO andCFO, we assessed the effectiveness of the Company’s internal control over financial reporting as of theend of the period covered by this report. In this assessment, the Company applied criteria based on the‘‘Internal Control—Integrated Framework (1992)’’ issued by the Committee of SponsoringOrganizations of the Treadway Commission. These criteria are in the areas of control environment, riskassessment, control activities, information and communication, and monitoring. The Company’sassessment included documenting, evaluating and testing the design and operating effectiveness of itsinternal control over financial reporting. Based upon this evaluation, our management concluded thatour internal control over financial reporting was effective as of December 31, 2013.
KPMG LLP, the independent registered public accounting firm that audited our ConsolidatedFinancial Statements included in the Annual Report on Form 10-K, has also audited the effectivenessof the Company’s internal control over financial reporting as of December 31, 2013 as stated in theirreport at F-2.
ITEM 9B—OTHER INFORMATION
None.
58

PART III
ITEM 10—DIRECTORS, EXECUTIVE OFFICERS AND CORPORATE GOVERNANCE
Information regarding the directors of the Company is incorporated herein by reference to theinformation set forth under ‘‘Election of Directors’’ in the Proxy Statement for the 2014 AnnualMeeting of Stockholders.
Information regarding executive officers of the Company has been included in Part I of thisAnnual Report under the caption ‘‘Executive Officers of the Company.’’
Information regarding corporate governance of the Company is incorporated herein by referenceto the information set forth in the Proxy Statement for the 2014 Annual Meeting of Stockholders.
ITEM 11—EXECUTIVE COMPENSATION
Incorporated by reference from the Company’s Definitive Proxy Statement to be datedapproximately April 11, 2014.
ITEM 12—SECURITY OWNERSHIP OF CERTAIN BENEFICIAL OWNERS AND MANAGEMENTAND RELATED STOCKHOLDER MATTERS
Incorporated by reference from the Company’s Definitive Proxy Statement to be datedapproximately April 11, 2014.
ITEM 13—CERTAIN RELATIONSHIPS AND RELATED TRANSACTIONS, AND DIRECTORINDEPENDENCE
Incorporated by reference from the Company’s Definitive Proxy Statement to be datedapproximately April 11, 2014.
ITEM 14—PRINCIPAL ACCOUNTING FEES AND SERVICES
Incorporated by reference from the Company’s Definitive Proxy Statement to be datedapproximately April 11, 2014.
59

PART IV
ITEM 15—EXHIBITS, FINANCIAL STATEMENT SCHEDULES
1. Consolidated Financial Statements
Page NumberDescription in Report
Reports of Independent Registered Public Accounting Firm . . . . . . . . . . . . . . . . . . . . . . F-1Consolidated Balance Sheets as of December 31, 2013 and December 25, 2012 . . . . . . . . F-3Consolidated Statements of Income and Comprehensive Income for the years ended
December 31, 2013, December 25, 2012 and December 27, 2011 . . . . . . . . . . . . . . . . . F-4Consolidated Statements of Stockholders’ Equity for the years ended December 31, 2013,
December 25, 2012 and December 27, 2011 . . . . . . . . . . . . . . . . . . . . . . . . . . . . . . . . F-5Consolidated Statements of Cash Flows for the years ended December 31, 2013,
December 25, 2012, and December 27, 2011 . . . . . . . . . . . . . . . . . . . . . . . . . . . . . . . . F-6Notes to Consolidated Financial Statements . . . . . . . . . . . . . . . . . . . . . . . . . . . . . . . . . . F-7
2. Financial Statement Schedules
Omitted due to inapplicability or because required information is shown in the Company’sConsolidated Financial Statements or notes thereto.
3. Exhibits
Exhibit No. Description
3.1 Form of Amended and Restated Certificate of Incorporation of Registrant (incorporated byreference to Exhibit 3.2 to the Registration Statement on Form S-1 of Registrant(File No. 333-115259))
3.2 Bylaws of Registrant (incorporated by reference to Exhibit 3.3 to the RegistrationStatement on Form S-1 of Registrant (File No. 333-115259))
4.1 Registration Rights Agreement, dated as of May 7, 2004, among Registrant and others(incorporated by reference to Exhibit 4.3 to the Registration Statement on Form S-1 ofRegistrant (File No. 333-115259))
10.1* Texas Roadhouse, Inc. 2004 Equity Incentive Plan (incorporated by reference to Exhibit 4.1to the Registration Statement on Form S-8 of Registrant (File No. 333-121241))
10.2* Form of Director and Executive Officer Indemnification Agreement (incorporated byreference to Exhibit 10.9 to the Registration Statement on Form S-1 of Registrant(File No. 333-115259))
10.3* Form of Limited Partnership Agreement and Operating Agreement for company-managedTexas Roadhouse restaurants, including schedule of the owners of such restaurants and theinterests held by directors, executive officers and 5% stockholders who are parties to suchan agreement (incorporated by reference to Exhibit 10.10 to the Registration Statement onForm S-1 of Registrant (File No. 333-115259))
10.4* Lease Agreement dated as of November 1999, by and between TEAS II, LLC and TexasRoadhouse Holdings LLC (incorporated by reference to Exhibit 10.13 to the RegistrationStatement on Form S-1 of Registrant (File No. 333-115259))
60

Exhibit No. Description
10.5* Form of Franchise Agreement and Preliminary Agreement for a Texas Roadhouserestaurant franchise, including schedule of directors, executive officers and 5% stockholderswhich have entered into either agreement (incorporated by reference to Exhibit 10.14 tothe Registration Statement on Form S-1 of Registrant (File No. 333-115259))
10.6* Updated schedule as of December 31, 2013 of the owners of company-managed TexasRoadhouse restaurants and the interests held by directors, executive officers and 5%stockholders who are parties to Limited Partnership Agreements and OperatingAgreements as set forth at Exhibit 10.3 of this Form 10-K
10.7* Updated schedule as of December 31, 2013 of the directors, executive officers and 5%stockholders which have entered into Franchise Agreements or Preliminary Agreements fora Texas Roadhouse Franchise as set forth at Exhibit 10.5 of this Form 10-K
10.8* Amended and Restated Credit Agreement, dated as of August 12, 2011, by and amongTexas Roadhouse, Inc., the lenders named therein and JPMorgan chase Bank, N.A., asAdministrative Agent (incorporated by reference to Exhibit 10.1 to Registrant’s CurrentReport on Form 8-K dated August 17, 2011 (File No. 000-50972))
10.9* Omnibus Amendment No. 1 and Consent to Credit Agreement and Guaranty, dated as ofNovember 1, 2013, by and among Texas Roadhouse, Inc., the lenders named therein andJPMorgan Chase Bank, N.A., as Administrative Agent (incorporated by reference toExhibit 10.1 to Registrant’s Current Report on Form 8-K dated November 1, 2013(File No. 000-50972))
10.10* Second Amendment to Amended and Restated Lease Agreement (Two Paragon Centre)dated May 10, 2007 between Paragon Centre Holdings, LLC and Texas RoadhouseHoldings, LLC (incorporated by reference to Exhibit 10.2 of the Registrant’s QuarterlyReport on Form 10-Q for the quarter ended June 26, 2007) (File No. 000-50972)
10.11* Third Amendment to Amended and Restated Lease Agreement (Two Paragon Centre)dated September 7, 2007 between Paragon Centre Holdings, LLC and Texas RoadhouseHoldings, LLC (incorporated by reference to Exhibit 10.2 of the Registrant’s QuarterlyReport on Form 10-Q for the quarter ended September 25, 2007) (File No. 000-50972)
10.12* Form of Restricted Stock Unit Award Agreement under the 2004 Equity Incentive Plan(incorporated by reference to Exhibit 10.19 of Registrant’s Annual Report on Form 10-Kfor the year ended December 25, 2007 (File No. 000-50972))
10.13* Form of First Amendment to Restricted Stock Unit Award Agreement under the 2004Equity Incentive Plan with non-management directors (incorporated by reference toExhibit 10.20 of Registrant’s Annual Report on Form 10-K for the year endedDecember 30, 2008 (File No. 000-50972))
10.14* Amendment to Texas Roadhouse, Inc. 2004 Equity Incentive Plan (incorporated byreference to Exhibit 10.21 of Registrant’s Annual Report on Form 10-K for the year endedDecember 30, 2008 (File No. 000-50972))
10.15* Amended and Restated Employment Agreement between Registrant and G. PriceCooper, IV entered into as of January 8, 2010 (incorporated by reference to Exhibit 10.33to Registrant’s Current Report on Form 8-K dated August 18, 2011 (File No. 000-50972))
61

Exhibit No. Description
10.16* Amended and Restated Employment Agreement between Registrant and W. Kent Taylor,entered into as of January 8, 2012 (incorporated by reference to Exhibit 10.35 to theRegistrant’s Annual Report on Form 10-K for the year ended December 27, 2011(File No. 000-50972))
10.17* Amended and Restated Employment Agreement between Registrant and Scott M. Colosi,entered into as of January 8, 2012 (incorporated by reference to Exhibit 10.36 to theRegistrant’s Annual Report on Form 10-K for the year ended December 27, 2011(File No. 000-50972))
10.18* Amended and Restated Employment Agreement between Registrant and Steven L. Ortiz,entered into as of January 8, 2012 (incorporated by reference to Exhibit 10.37 to theRegistrant’s Annual Report on Form 10-K for the year ended December 27, 2011(File No. 000-50972))
10.19* Amended and Restated Employment Agreement between Registrant and G. PriceCooper, IV, entered into as of January 8, 2012 (incorporated by reference to Exhibit 10.38to the Registrant’s Annual Report on Form 10-K for the year ended December 27, 2011(File No. 000-50972))
10.20* Amended and Restated Employment Agreement between Registrant and Jill Marchant,entered into as of January 8, 2012 (incorporated by reference to Exhibit 10.39 to theRegistrant’s Annual Report on Form 10-K for the year ended December 27, 2011(File No. 000-50972))
10.21* First Amendment to Amended and Restated Employment Agreement between theRegistrant and W. Kent Taylor, entered into as of November 30, 2012
10.22* First Amendment to Amended and Restated Employment Agreement between theRegistrant and Scott M. Colosi, entered into as of November 30, 2012
10.23* First Amendment to Amended and Restated Employment Agreement between theRegistrant and Steve L. Ortiz, entered into as of November 30, 2012
10.24* First Amendment to Amended and Restated Employment Agreement between theRegistrant and G. Price Cooper, IV, entered into as of November 30, 2012
10.25* First Amendment to Amended and Restated Employment Agreement between theRegistrant and Jill Marchant, entered into as of November 30, 2012
10.26* Texas Roadhouse, Inc. 2013 Long-Term Incentive Plan (incorporated by reference fromAppendix A to the Texas Roadhouse, Inc. Proxy Statement on Schedule 14A filed with theSecurities and Exchange Commission on April 5, 2013 (File No. 000-50972))
10.27* Form of Restricted Stock Award under the Texas Roadhouse, Inc. 2013 Long-TermIncentive Plan (incorporated by reference to Exhibit 10.2 of Registrant’s Quarterly Reporton Form 10-Q for the quarter ended June 25, 2013 (File No. 000-50972))
10.28* Texas Roadhouse, Inc. Cash Bonus Plan for cash incentive awards granted pursuant to theTexas Roadhouse, Inc. 2013 Long-Term Incentive Plan (incorporated by reference toExhibit 10.3 of Registrant’s Quarterly Report on Form 10-Q for the quarter ended June 25,2013 (File No. 000-50972))
62

Exhibit No. Description
10.29* Separation Agreement and General Release, dated as of November 1, 2013, by andbetween Jill Marchant and Texas Roadhouse Management Corp. (incorporated by referenceto Exhibit 10.2 to the Registrant’s Current Report on Form 8-K dated November 1, 2013(File No. 000-50972))
10.30* Employment Agreement between the Registrant and Celia Catlett entered into as ofJanuary 15, 2014
21.1 List of Subsidiaries
23.1 Consent of KPMG LLP, Independent Registered Public Accounting Firm
31.1 Certification of Chief Executive Officer pursuant to Section 302 of the Sarbanes-Oxley Actof 2002
31.2 Certification of Chief Financial Officer pursuant to Section 302 of the Sarbanes-Oxley Actof 2002
32.1 Certification of Chief Executive Officer pursuant to 18 U.S.C. Section 1350, as adoptedpursuant to Section 906 of the Sarbanes-Oxley Act of 2002
32.2 Certification of Chief Financial Officer pursuant to 18 U.S.C. Section 1350, as adoptedpursuant to Section 906 of the Sarbanes-Oxley Act of 2002
101 The following financial statements from the Texas Roadhouse, Inc. Annual Report onForm 10-K for the year ended December 31, 2013, filed February 28, 2014, formatted ineXtensible Business Reporting Language (XBRL): (i) Consolidated Balance Sheets,(ii) Consolidated Statements of Income and Comprehensive Income, (iii) ConsolidatedStatements of Stockholders’ Equity, (iv) Consolidated Statements of Cash Flows, and(v) the Notes to the Consolidated Financial Statements.
* Management contract or compensatory plan or arrangement required to be filed as an exhibit toForm 10-K.
63

SIGNATURES
Pursuant to the requirements of Section 13 or 15(d) of the Securities Exchange Act of 1934, asamended, the registrant has duly caused this report to be signed on its behalf by the undersigned,thereunto duly authorized.
TEXAS ROADHOUSE, INC.
By: /s/ W. KENT TAYLOR
W. KENT TAYLORChairman of the Company, Chief Executive
Officer, Director
Date: February 28, 2014
Pursuant to the requirements of the Securities Exchange Act of 1934, as amended, this AnnualReport has been signed below by the following persons on behalf of the registrant and in the capacitiesand on the dates indicated.
Signature Title Date
Chairman of the Company, Chief/s/ W. KENT TAYLORExecutive Officer, Director (Principal February 28, 2014
W. Kent Taylor Executive Officer)
Chief Financial Officer (Principal/s/ G. PRICE COOPER, IVFinancial Officer and Principal February 28, 2014
G. Price Cooper, IV Accounting Officer)
/s/ GREGORY N. MOOREDirector February 28, 2014
Gregory N. Moore
/s/ JAMES F. PARKERDirector February 28, 2014
James F. Parker
/s/ JAMES R. RAMSEYDirector February 28, 2014
James R. Ramsey
/s/ KATHY WIDMERDirector February 28, 2014
Kathy Widmer
/s/ JAMES R. ZARLEYDirector February 28, 2014
James R. Zarley
64

Report of Independent Registered Public Accounting Firm
The Board of Directors and StockholdersTexas Roadhouse, Inc.:
We have audited the accompanying consolidated balance sheets of Texas Roadhouse, Inc. andsubsidiaries (the ‘‘Company’’) as of December 31, 2013 and December 25, 2012, and the relatedconsolidated statements of income and comprehensive income, stockholders’ equity, and cash flows foreach of the years in the three-year period ended December 31, 2013. These consolidated financialstatements are the responsibility of the Company’s management. Our responsibility is to express anopinion on these consolidated financial statements based on our audits.
We conducted our audits in accordance with the standards of the Public Company AccountingOversight Board (United States). Those standards require that we plan and perform the audit to obtainreasonable assurance about whether the financial statements are free of material misstatement. Anaudit includes examining, on a test basis, evidence supporting the amounts and disclosures in thefinancial statements. An audit also includes assessing the accounting principles used and significantestimates made by management, as well as evaluating the overall financial statement presentation. Webelieve that our audits provide a reasonable basis for our opinion.
In our opinion, the consolidated financial statements referred to above present fairly, in allmaterial respects, the financial position of Texas Roadhouse, Inc. and subsidiaries as of December 31,2013 and December 25, 2012, and the results of their operations and their cash flows for each of theyears in the three-year period ended December 31, 2013, in conformity with U.S. generally acceptedaccounting principles.
We also have audited, in accordance with the standards of the Public Company AccountingOversight Board (United States), Texas Roadhouse, Inc.’s internal control over financial reporting as ofDecember 31, 2013, based on criteria established in Internal Control—Integrated Framework (1992)issued by the Committee of Sponsoring Organizations of the Treadway Commission (COSO), and ourreport dated February 28, 2014 expressed an unqualified opinion on the effectiveness of the Company’sinternal control over financial reporting.
/s/ KPMG LLP
Louisville, KentuckyFebruary 28, 2014
F-1

Report of Independent Registered Public Accounting Firm
The Board of Directors and StockholdersTexas Roadhouse, Inc.:
We have audited the internal control over financial reporting of Texas Roadhouse, Inc. as ofDecember 31, 2013 based on criteria established in Internal Control—Integrated Framework (1992)issued by the Committee of Sponsoring Organizations of the Treadway Commission (COSO). TexasRoadhouse, Inc.’s management is responsible for maintaining effective internal control over financialreporting and for its assessment of the effectiveness of internal control over financial reporting,included in the accompanying Management’s Report on Internal Control over Financial Reportingappearing under Item 9A. Our responsibility is to express an opinion on Texas Roadhouse Inc.’sinternal control over financial reporting based on our audit.
We conducted our audit in accordance with the standards of the Public Company AccountingOversight Board (United States). Those standards require that we plan and perform the audit to obtainreasonable assurance about whether effective internal control over financial reporting was maintainedin all material respects. Our audit included obtaining an understanding of internal control overfinancial reporting, assessing the risk that a material weakness exists, and testing and evaluating thedesign and operating effectiveness of internal control based on the assessed risk. Our audit alsoincluded performing such other procedures as we considered necessary in the circumstances. We believethat our audit provides a reasonable basis for our opinion.
A company’s internal control over financial reporting is a process designed to provide reasonableassurance regarding the reliability of financial reporting and the preparation of financial statements forexternal purposes in accordance with generally accepted accounting principles. A company’s internalcontrol over financial reporting includes those policies and procedures that (1) pertain to themaintenance of records that, in reasonable detail, accurately and fairly reflect the transactions anddispositions of the assets of the company; (2) provide reasonable assurance that transactions arerecorded as necessary to permit preparation of financial statements in accordance with generallyaccepted accounting principles, and that receipts and expenditures of the company are being made onlyin accordance with authorizations of management and directors of the company; and (3) providereasonable assurance regarding prevention or timely detection of unauthorized acquisition, use, ordisposition of the company’s assets that could have a material effect on the financial statements.
Because of its inherent limitations, internal control over financial reporting may not prevent ordetect misstatements. Also, projections of any evaluation of effectiveness to future periods are subjectto the risk that controls may become inadequate because of changes in conditions, or that the degreeof compliance with the policies or procedures may deteriorate.
In our opinion, Texas Roadhouse, Inc. maintained, in all material respects, effective internalcontrol over financial reporting as of December 31, 2013, based on criteria established in InternalControl—Integrated Framework (1992) issued by the Committee of Sponsoring Organizations of theTreadway Commission (COSO).
We also have audited, in accordance with the standards of the Public Company AccountingOversight Board (United States), the consolidated balance sheets of Texas Roadhouse, Inc. andsubsidiaries as of December 31, 2013 and December 25, 2012, and the related consolidated statementsof income and comprehensive income, stockholders’ equity, and cash flows for each of the years in thethree-year period ended December 31, 2013, and our report dated February 28, 2014 expressed anunqualified opinion on those consolidated financial statements.
/s/ KPMG LLP
Louisville, KentuckyFebruary 28, 2014
F-2
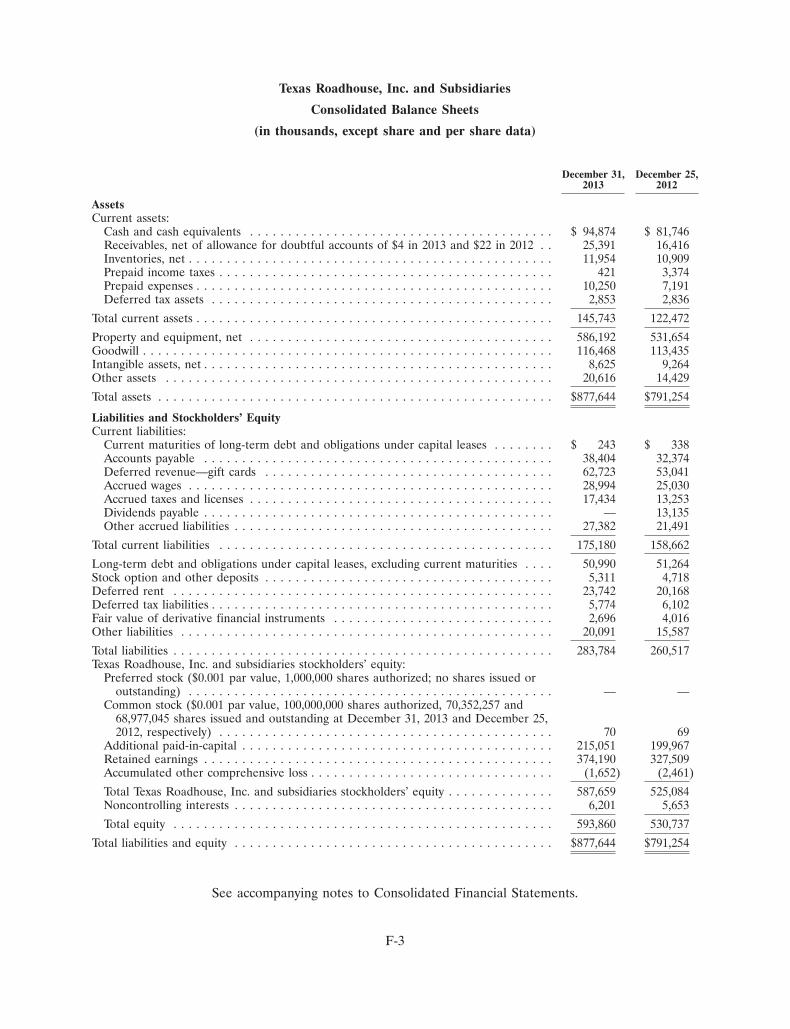
Texas Roadhouse, Inc. and Subsidiaries
Consolidated Balance Sheets
(in thousands, except share and per share data)
December 31, December 25,2013 2012
AssetsCurrent assets:
Cash and cash equivalents . . . . . . . . . . . . . . . . . . . . . . . . . . . . . . . . . . . . . . . . $ 94,874 $ 81,746Receivables, net of allowance for doubtful accounts of $4 in 2013 and $22 in 2012 . . 25,391 16,416Inventories, net . . . . . . . . . . . . . . . . . . . . . . . . . . . . . . . . . . . . . . . . . . . . . . . . 11,954 10,909Prepaid income taxes . . . . . . . . . . . . . . . . . . . . . . . . . . . . . . . . . . . . . . . . . . . . 421 3,374Prepaid expenses . . . . . . . . . . . . . . . . . . . . . . . . . . . . . . . . . . . . . . . . . . . . . . . 10,250 7,191Deferred tax assets . . . . . . . . . . . . . . . . . . . . . . . . . . . . . . . . . . . . . . . . . . . . . 2,853 2,836
Total current assets . . . . . . . . . . . . . . . . . . . . . . . . . . . . . . . . . . . . . . . . . . . . . . . 145,743 122,472
Property and equipment, net . . . . . . . . . . . . . . . . . . . . . . . . . . . . . . . . . . . . . . . . 586,192 531,654Goodwill . . . . . . . . . . . . . . . . . . . . . . . . . . . . . . . . . . . . . . . . . . . . . . . . . . . . . . 116,468 113,435Intangible assets, net . . . . . . . . . . . . . . . . . . . . . . . . . . . . . . . . . . . . . . . . . . . . . . 8,625 9,264Other assets . . . . . . . . . . . . . . . . . . . . . . . . . . . . . . . . . . . . . . . . . . . . . . . . . . . 20,616 14,429
Total assets . . . . . . . . . . . . . . . . . . . . . . . . . . . . . . . . . . . . . . . . . . . . . . . . . . . . $877,644 $791,254
Liabilities and Stockholders’ EquityCurrent liabilities:
Current maturities of long-term debt and obligations under capital leases . . . . . . . . $ 243 $ 338Accounts payable . . . . . . . . . . . . . . . . . . . . . . . . . . . . . . . . . . . . . . . . . . . . . . 38,404 32,374Deferred revenue—gift cards . . . . . . . . . . . . . . . . . . . . . . . . . . . . . . . . . . . . . . 62,723 53,041Accrued wages . . . . . . . . . . . . . . . . . . . . . . . . . . . . . . . . . . . . . . . . . . . . . . . . 28,994 25,030Accrued taxes and licenses . . . . . . . . . . . . . . . . . . . . . . . . . . . . . . . . . . . . . . . . 17,434 13,253Dividends payable . . . . . . . . . . . . . . . . . . . . . . . . . . . . . . . . . . . . . . . . . . . . . . — 13,135Other accrued liabilities . . . . . . . . . . . . . . . . . . . . . . . . . . . . . . . . . . . . . . . . . . 27,382 21,491
Total current liabilities . . . . . . . . . . . . . . . . . . . . . . . . . . . . . . . . . . . . . . . . . . . . 175,180 158,662
Long-term debt and obligations under capital leases, excluding current maturities . . . . 50,990 51,264Stock option and other deposits . . . . . . . . . . . . . . . . . . . . . . . . . . . . . . . . . . . . . . 5,311 4,718Deferred rent . . . . . . . . . . . . . . . . . . . . . . . . . . . . . . . . . . . . . . . . . . . . . . . . . . 23,742 20,168Deferred tax liabilities . . . . . . . . . . . . . . . . . . . . . . . . . . . . . . . . . . . . . . . . . . . . . 5,774 6,102Fair value of derivative financial instruments . . . . . . . . . . . . . . . . . . . . . . . . . . . . . 2,696 4,016Other liabilities . . . . . . . . . . . . . . . . . . . . . . . . . . . . . . . . . . . . . . . . . . . . . . . . . 20,091 15,587
Total liabilities . . . . . . . . . . . . . . . . . . . . . . . . . . . . . . . . . . . . . . . . . . . . . . . . . . 283,784 260,517Texas Roadhouse, Inc. and subsidiaries stockholders’ equity:
Preferred stock ($0.001 par value, 1,000,000 shares authorized; no shares issued oroutstanding) . . . . . . . . . . . . . . . . . . . . . . . . . . . . . . . . . . . . . . . . . . . . . . . . — —
Common stock ($0.001 par value, 100,000,000 shares authorized, 70,352,257 and68,977,045 shares issued and outstanding at December 31, 2013 and December 25,2012, respectively) . . . . . . . . . . . . . . . . . . . . . . . . . . . . . . . . . . . . . . . . . . . . 70 69
Additional paid-in-capital . . . . . . . . . . . . . . . . . . . . . . . . . . . . . . . . . . . . . . . . . 215,051 199,967Retained earnings . . . . . . . . . . . . . . . . . . . . . . . . . . . . . . . . . . . . . . . . . . . . . . 374,190 327,509Accumulated other comprehensive loss . . . . . . . . . . . . . . . . . . . . . . . . . . . . . . . . (1,652) (2,461)
Total Texas Roadhouse, Inc. and subsidiaries stockholders’ equity . . . . . . . . . . . . . . 587,659 525,084Noncontrolling interests . . . . . . . . . . . . . . . . . . . . . . . . . . . . . . . . . . . . . . . . . . 6,201 5,653
Total equity . . . . . . . . . . . . . . . . . . . . . . . . . . . . . . . . . . . . . . . . . . . . . . . . . . 593,860 530,737
Total liabilities and equity . . . . . . . . . . . . . . . . . . . . . . . . . . . . . . . . . . . . . . . . . . $877,644 $791,254
See accompanying notes to Consolidated Financial Statements.
F-3

Texas Roadhouse, Inc. and Subsidiaries
Consolidated Statements of Income and Comprehensive Income
(tabular amounts in thousands, except per share data)
Fiscal Year Ended
December 31, December 25, December 27,2013 2012 2011
Revenue:Restaurant sales . . . . . . . . . . . . . . . . . . . . . . . . . . . . . . . . $1,410,118 $1,252,358 $1,099,475Franchise royalties and fees . . . . . . . . . . . . . . . . . . . . . . . . 12,467 10,973 9,751
Total revenue . . . . . . . . . . . . . . . . . . . . . . . . . . . . . . . . . . . . . . 1,422,585 1,263,331 1,109,226
Costs and expenses:Restaurant operating costs (excluding depreciation and
amortization shown separately below):Cost of sales . . . . . . . . . . . . . . . . . . . . . . . . . . . . . . . . . . . 492,306 423,615 367,385Labor . . . . . . . . . . . . . . . . . . . . . . . . . . . . . . . . . . . . . . . . 411,394 367,763 326,233Rent . . . . . . . . . . . . . . . . . . . . . . . . . . . . . . . . . . . . . . . . . 28,978 25,797 23,150Other operating . . . . . . . . . . . . . . . . . . . . . . . . . . . . . . . . . 224,882 204,318 184,073
Pre-opening . . . . . . . . . . . . . . . . . . . . . . . . . . . . . . . . . . . . . 17,891 12,399 11,534Depreciation and amortization . . . . . . . . . . . . . . . . . . . . . . . . 51,562 46,717 42,709Impairment and closure . . . . . . . . . . . . . . . . . . . . . . . . . . . . . 399 1,624 1,201Gain on sale of other concept . . . . . . . . . . . . . . . . . . . . . . . . (1,800) — —General and administrative . . . . . . . . . . . . . . . . . . . . . . . . . . 77,258 70,640 57,702
Total costs and expenses . . . . . . . . . . . . . . . . . . . . . . . . . . . . . . 1,302,870 1,152,873 1,013,987Income from operations . . . . . . . . . . . . . . . . . . . . . . . . . . . . . . 119,715 110,458 95,239Interest expense, net . . . . . . . . . . . . . . . . . . . . . . . . . . . . . . . . . 2,201 2,347 2,413Equity income from investments in unconsolidated affiliates . . . . . (713) (428) (366)
Income before taxes . . . . . . . . . . . . . . . . . . . . . . . . . . . . . . . . . $ 118,227 $ 108,539 $ 93,192Provision for income taxes . . . . . . . . . . . . . . . . . . . . . . . . . . . . 34,140 34,738 26,765
Net income including noncontrolling interests . . . . . . . . . . . . . . . $ 84,087 $ 73,801 $ 66,427Less: Net income attributable to noncontrolling interests . . . . . . . 3,664 2,631 2,463
Net income attributable to Texas Roadhouse, Inc. and subsidiaries $ 80,423 $ 71,170 $ 63,964
Other comprehensive income (loss), net of tax:Unrealized gain (loss) on derivatives, net of tax of $(0.5) million,
$(0.1) million and $0.8 million, respectively . . . . . . . . . . . . . . . 809 148 (1,271)
Total comprehensive income . . . . . . . . . . . . . . . . . . . . . . . . . . . $ 81,232 $ 71,318 $ 62,693
Net income per common share attributable to TexasRoadhouse, Inc. and subsidiaries:Basic . . . . . . . . . . . . . . . . . . . . . . . . . . . . . . . . . . . . . . . . . . $ 1.15 $ 1.02 $ 0.90
Diluted . . . . . . . . . . . . . . . . . . . . . . . . . . . . . . . . . . . . . . . . $ 1.13 $ 1.00 $ 0.88
Weighted average shares outstanding:Basic . . . . . . . . . . . . . . . . . . . . . . . . . . . . . . . . . . . . . . . . . . 70,089 70,026 70,829
Diluted . . . . . . . . . . . . . . . . . . . . . . . . . . . . . . . . . . . . . . . . 71,362 71,485 72,278
Cash dividends declared per share . . . . . . . . . . . . . . . . . . . . . . . $ 0.48 $ 0.46 $ 0.32
See accompanying notes to Consolidated Financial Statements.
F-4

Texas Roadhouse, Inc. and Subsidiaries
Consolidated Statements of Stockholders’ Equity
(tabular amounts in thousands, except share data)
Accumulated Total TexasAdditional Other Roadhouse, Inc.
Par Paid-in- Retained Comprehensive and NoncontrollingShares Value Capital Earnings Loss Subsidiaries Interests Total
Balance, December 28, 2010 . . . . . . . . . 72,222,991 $72 $250,874 $247,008 $(1,338) $496,616 $ 2,766 $499,382
Net income . . . . . . . . . . . . . . . . . . — — — 63,964 — 63,964 2,463 66,427Unrealized loss on derivatives, net of tax
of $0.8 million . . . . . . . . . . . . . . . — — — — (1,271) (1,271) — (1,271)Distributions to noncontrolling interests . . — — — — — — (2,270) (2,270)Noncontrolling interests contribution . . . . — — — — — — 959 959Noncontrolling interests liquidation
adjustments . . . . . . . . . . . . . . . . . — — (37) — — (37) — (37)Dividends declared and paid ($0.24 per
share) . . . . . . . . . . . . . . . . . . . . — — — (17,012) — (17,012) — (17,012)Dividends declared ($0.08 per share) . . . . — — — (5,535) — (5,535) — (5,535)Shares issued under stock option plan
including tax effects . . . . . . . . . . . . 477,525 — 7,283 — — 7,283 — 7,283Repurchase of shares of common stock . . (3,972,100) (4) (59,143) — — (59,147) — (59,147)Settlement of restricted stock units . . . . . 674,392 1 (1) — — — — —Indirect repurchase of shares for minimum
tax withholdings . . . . . . . . . . . . . . (215,841) — (3,482) — — (3,482) — (3,482)Share-based compensation . . . . . . . . . . — — 10,525 — — 10,525 — 10,525
Balance, December 27, 2011 . . . . . . . . . 69,186,967 $69 $206,019 $288,425 $(2,609) $491,904 $ 3,918 $495,822
Net income . . . . . . . . . . . . . . . . . . — — — 71,170 — 71,170 2,631 73,801Unrealized gain on derivatives, net of tax
of $0.1 million . . . . . . . . . . . . . . . — — — — 148 148 — 148Distributions to noncontrolling interests . . — — — — — — (2,712) (2,712)Noncontrolling interests contribution . . . . — — — — — — 1,816 1,816Noncontrolling interests liquidation
adjustments . . . . . . . . . . . . . . . . . — — (368) — — (368) — (368)Dividends declared and paid ($0.27 per
share) . . . . . . . . . . . . . . . . . . . . — — — (18,951) — (18,951) — (18,951)Dividends declared ($0.19 per share) . . . . — — — (13,135) — (13,135) — (13,135)Shares issued under stock option plan
including tax effects . . . . . . . . . . . . 1,115,278 1 14,276 — — 14,277 — 14,277Repurchase of shares of common stock . . (1,786,855) (2) (29,419) — — (29,421) — (29,421)Settlement of restricted stock units . . . . . 683,614 1 (1) — — — — —Indirect repurchase of shares for minimum
tax withholdings . . . . . . . . . . . . . . (221,959) — (3,733) — — (3,733) — (3,733)Share-based compensation . . . . . . . . . . — — 13,193 — — 13,193 — 13,193
Balance, December 25, 2012 . . . . . . . . . 68,977,045 $69 $199,967 $327,509 $(2,461) $525,084 $ 5,653 $530,737
Net income . . . . . . . . . . . . . . . . . . — — — 80,423 — 80,423 3,664 84,087Unrealized gain on derivatives, net of tax
of $0.5 million . . . . . . . . . . . . . . . — — — — 809 809 — 809Distributions to noncontrolling interests . . — — — — — — (3,116) (3,116)Noncontrolling interests liquidation
adjustments . . . . . . . . . . . . . . . . . — — 36 — — 36 — 36Dividends declared and paid ($0.48 per
share) . . . . . . . . . . . . . . . . . . . . — — — (33,742) — (33,742) — (33,742)Shares issued under stock option plans
including tax effects . . . . . . . . . . . . 1,173,945 1 20,027 — — 20,028 — 20,028Repurchase of shares of common stock . . (461,600) (1) (12,760) — — (12,761) — (12,761)Settlement of restricted stock units . . . . . 991,446 1 (1) — — — — —Indirect repurchase of shares for minimum
tax withholdings . . . . . . . . . . . . . . (328,579) — (6,958) — — (6,958) — (6,958)Share-based compensation . . . . . . . . . . — — 14,740 — — 14,740 — 14,740
Balance, December 31, 2013 . . . . . . . . . 70,352,257 $70 $215,051 $374,190 $(1,652) $587,659 $ 6,201 $593,860
See accompanying notes to Consolidated Financial Statements.
F-5

Texas Roadhouse, Inc. and Subsidiaries
Consolidated Statements of Cash Flows
(in thousands)
Fiscal Year Ended
December 31, December 25, December 27,2013 2012 2011
Cash flows from operating activities:Net income including noncontrolling interests . . . . . . . . . . . . . . . . . . . . . . . $ 84,087 $ 73,801 $ 66,427Adjustments to reconcile net income to net cash provided by operating activities:
Depreciation and amortization . . . . . . . . . . . . . . . . . . . . . . . . . . . . . . . 51,562 46,717 42,709Deferred income taxes . . . . . . . . . . . . . . . . . . . . . . . . . . . . . . . . . . . . (947) (2,166) 70Loss on disposition of assets . . . . . . . . . . . . . . . . . . . . . . . . . . . . . . . . . 3,794 2,805 2,378Gain on sale of other concept . . . . . . . . . . . . . . . . . . . . . . . . . . . . . . . . (1,800) — —Impairment and closure costs . . . . . . . . . . . . . . . . . . . . . . . . . . . . . . . . 278 1,459 1,127Equity income from investments in unconsolidated affiliates . . . . . . . . . . . . . (713) (428) (366)Distributions of income received from investments in unconsolidated affiliates . 444 429 336Provision for doubtful accounts . . . . . . . . . . . . . . . . . . . . . . . . . . . . . . . 86 17 183Share-based compensation expense . . . . . . . . . . . . . . . . . . . . . . . . . . . . . 14,740 13,193 10,525
Changes in operating working capital:Receivables . . . . . . . . . . . . . . . . . . . . . . . . . . . . . . . . . . . . . . . . . . . (9,063) (4,953) (3,139)Inventories . . . . . . . . . . . . . . . . . . . . . . . . . . . . . . . . . . . . . . . . . . . . (1,057) (119) (1,533)Prepaid expenses and other current assets . . . . . . . . . . . . . . . . . . . . . . . . (3,066) (146) 159Other assets . . . . . . . . . . . . . . . . . . . . . . . . . . . . . . . . . . . . . . . . . . . (4,720) (2,773) (3,497)Accounts payable . . . . . . . . . . . . . . . . . . . . . . . . . . . . . . . . . . . . . . . . 5,712 1,736 3,785Deferred revenue—gift cards . . . . . . . . . . . . . . . . . . . . . . . . . . . . . . . . 9,555 8,842 4,893Accrued wages . . . . . . . . . . . . . . . . . . . . . . . . . . . . . . . . . . . . . . . . . 3,964 1,329 2,651Excess tax benefits from share-based compensation . . . . . . . . . . . . . . . . . . (4,887) (3,605) (2,255)Prepaid income taxes and income taxes payable . . . . . . . . . . . . . . . . . . . . . 7,931 806 2,055Accrued taxes and licenses . . . . . . . . . . . . . . . . . . . . . . . . . . . . . . . . . . 4,088 872 63Other accrued liabilities . . . . . . . . . . . . . . . . . . . . . . . . . . . . . . . . . . . . 5,891 3,842 5,262Deferred rent . . . . . . . . . . . . . . . . . . . . . . . . . . . . . . . . . . . . . . . . . . 3,453 3,035 2,676Other liabilities . . . . . . . . . . . . . . . . . . . . . . . . . . . . . . . . . . . . . . . . . 4,504 3,353 1,910
Net cash provided by operating activities . . . . . . . . . . . . . . . . . . . . . . . 173,836 148,046 136,419
Cash flows from investing activities:Capital expenditures—property and equipment . . . . . . . . . . . . . . . . . . . . . . (111,478) (86,985) (79,663)Acquisition of franchise restaurants, net of cash acquired . . . . . . . . . . . . . . . . — (4,297) —Investment in unconsolidated affiliates . . . . . . . . . . . . . . . . . . . . . . . . . . . . (1,180) — —Proceeds from sale of other concept, net . . . . . . . . . . . . . . . . . . . . . . . . . . 1,387 — —Proceeds from sale of property and equipment, including insurance proceeds . . . 23 1,128 188
Net cash used in investing activities . . . . . . . . . . . . . . . . . . . . . . . . . . . (111,248) (90,154) (79,475)
Cash flows from financing activities:(Repayments of) proceeds from revolving credit facility . . . . . . . . . . . . . . . . . — (10,000) 10,000Repurchase of shares of common stock . . . . . . . . . . . . . . . . . . . . . . . . . . . (12,761) (29,421) (59,147)Proceeds from noncontrolling interest contributions and other . . . . . . . . . . . . . — 1,285 —Distributions to noncontrolling interest holders . . . . . . . . . . . . . . . . . . . . . . (3,116) (2,712) (2,270)Excess tax benefits from share-based compensation . . . . . . . . . . . . . . . . . . . . 4,887 3,605 2,255Proceeds from stock option and other deposits, net . . . . . . . . . . . . . . . . . . . . 593 172 494Indirect repurchase of shares for minimum tax withholdings . . . . . . . . . . . . . . (6,958) (3,733) (3,482)Principal payments on long-term debt and capital lease obligations . . . . . . . . . . (369) (303) (275)Proceeds from exercise of stock options . . . . . . . . . . . . . . . . . . . . . . . . . . . 15,141 10,670 5,016Dividends paid to shareholders . . . . . . . . . . . . . . . . . . . . . . . . . . . . . . . . (46,877) (24,486) (17,012)
Net cash used in financing activities . . . . . . . . . . . . . . . . . . . . . . . . . . . (49,460) (54,923) (64,421)
Net increase (decrease) in cash and cash equivalents . . . . . . . . . . . . . . . . 13,128 2,969 (7,477)Cash and cash equivalents—beginning of year . . . . . . . . . . . . . . . . . . . . . . . . . 81,746 78,777 86,254
Cash and cash equivalents—end of year . . . . . . . . . . . . . . . . . . . . . . . . . . . . $ 94,874 $ 81,746 $ 78,777
Supplemental disclosures of cash flow information:Interest paid, net of amounts capitalized . . . . . . . . . . . . . . . . . . . . . . . . . . $ 2,400 $ 2,478 $ 2,368Income taxes paid . . . . . . . . . . . . . . . . . . . . . . . . . . . . . . . . . . . . . . . . . $ 27,156 $ 36,096 $ 24,641Capital expenditures included in accounts payable . . . . . . . . . . . . . . . . . . . . $ 1,383 $ 1,065 $ 3,171
See accompanying notes to Consolidated Financial Statements.
F-6
Texas Roadhouse, Inc. and Subsidiaries
Notes to Consolidated Financial Statements
(Tabular amounts in thousands, except share and per share data)
(1) Description of Business
The accompanying Consolidated Financial Statements include the accounts of TexasRoadhouse, Inc. (‘‘TRI’’), our wholly-owned subsidiaries and subsidiaries in which we own more than50 percent interest (collectively, the ‘‘Company’’, ‘‘we’’, ‘‘our’’ and/or ‘‘us’’) as of and for the 53 weeksended December 31, 2013 and 52 weeks ended December 25, 2012 and December 27, 2011. Ourwholly-owned subsidiaries include: Texas Roadhouse Holdings LLC (‘‘Holdings’’), Texas RoadhouseDevelopment Corporation (‘‘TRDC’’), Texas Roadhouse Management Corp (‘‘Management Corp.’’)and Strategic Restaurant Concepts, LLC (‘‘Strategic Concepts’’). We and our subsidiaries operaterestaurants primarily under the Texas Roadhouse name. Holdings also provides supervisory andadministrative services for certain other franchise Texas Roadhouse restaurants. TRDC sells franchiserights and collects the franchise royalties and fees. Management Corp. provides management services tothe Company and certain other franchise Texas Roadhouse restaurants. All significant balances andtransactions between the consolidated entities have been eliminated.
As of December 31, 2013, we owned and operated 346 restaurants and franchised an additional74 restaurants in 48 states and three foreign countries. Of the 420 restaurants that were operating atDecember 31, 2013, (i) 346 were Company-owned restaurants, 331 of which were wholly-owned and 15of which were majority-owned and (ii) 74 were franchise restaurants.
As of December 25, 2012, we owned and operated 320 restaurants and franchised or licensed anadditional 72 restaurants in 47 states and two foreign countries. Of the 392 restaurants that wereoperating at December 25, 2012, (i) 320 were Company-owned restaurants, 305 of which were wholly-owned and 15 of which were majority-owned, (ii) 71 were franchise restaurants and (iii) one was alicense restaurant.
(2) Summary of Significant Accounting Policies
(a) Principles of Consolidation
As of December 31, 2013 and December 25, 2012, we owned a 5.0% to 10.0% equity interest in23 restaurants. The unconsolidated restaurants are accounted for using the equity method. While weexercise significant control over these franchise restaurants, we do not consolidate their financialposition, results of operations or cash flows as it is immaterial to our consolidated financial position,results of operations and/or cash flows. Our investments in these unconsolidated affiliates are includedin Other assets in our consolidated balance sheets, and we record our percentage share of net incomeearned by these unconsolidated affiliates in our consolidated statements of income and comprehensiveincome under Equity income from investments in unconsolidated affiliates. All significant intercompanybalances and transactions for these unconsolidated restaurants as well as the companies whose accountshave been consolidated have been eliminated.
(b) Fiscal Year
We utilize a 52 or 53 week accounting period that ends on the last Tuesday in December. Weutilize a 13 week accounting period for quarterly reporting purposes, except in years containing53 weeks when the fourth quarter contains 14 weeks. Fiscal year 2013 was 53 weeks in length. In fiscal2013, the 53rd week added approximately $32.0 million to restaurant sales and total revenues and an
F-7

Texas Roadhouse, Inc. and Subsidiaries
Notes to Consolidated Financial Statements (Continued)
(Tabular amounts in thousands, except share and per share data)
(2) Summary of Significant Accounting Policies (Continued)
estimated $0.03 to $0.04 to diluted earnings per share in our consolidated statements of income andcomprehensive income. Fiscal years 2012 and 2011 were 52 weeks in length.
(c) Cash and Cash Equivalents
For purposes of the consolidated statements of cash flows, we consider all highly liquid debtinstruments with original maturities of three months or less to be cash equivalents. Book overdrafts arerecorded in accounts payable and are included within operating cash flows. Cash and cash equivalentsalso included receivables from credit card companies, which amounted to $7.7 million and $19.7 millionat December 31, 2013 and December 25, 2012, respectively, because the balances are settled within twoto three business days.
(d) Receivables
Receivables consist principally of amounts due from retail gift card providers, certain franchiserestaurants for reimbursement of labor costs, pre-opening and other expenses, and amounts due forroyalty fees from franchise restaurants.
Receivables are recorded at the invoiced amount and do not bear interest. The allowance fordoubtful accounts is our best estimate of the amount of probable credit losses in our existing accountsreceivable. We determine the allowance based on historical write-off experience. We review ourallowance for doubtful accounts quarterly. Past due balances over 120 days and a specified amount arereviewed individually for collectability. Account balances are charged off against the allowance after allmeans of collection have been exhausted and the potential for recovery is considered remote.
(e) Inventories
Inventories, consisting principally of food, beverages and supplies, are valued at the lower of cost(first-in, first-out) or market.
(f) Pre-opening Expenses
Pre-opening expenses are charged to operations as incurred. These costs include wages, benefits,travel and lodging for the training and opening management teams, rent and food, beverage and otherrestaurant operating expenses incurred prior to a restaurant opening for business.
(g) Property and Equipment
Property and equipment are stated at cost. Expenditures for major renewals and betterments arecapitalized while expenditures for maintenance and repairs are expensed as incurred. Depreciation iscomputed on property and equipment, including assets located on leased properties, over the shorter ofthe estimated useful lives of the related assets or the underlying lease term using the straight-linemethod. In some cases, assets on leased properties are depreciated over a period of time whichincludes both the initial term of the lease and one or more option periods. See note 2(p). Depreciationand amortization expense as shown on our consolidated statements of income and comprehensiveincome is substantially all attributable to restaurant-level assets.
F-8
Texas Roadhouse, Inc. and Subsidiaries
Notes to Consolidated Financial Statements (Continued)
(Tabular amounts in thousands, except share and per share data)
(2) Summary of Significant Accounting Policies (Continued)
The estimated useful lives are:
Land improvements . . . . . . . . . . . . . . . . . . . . . . . . . . . . . . . . . . . . . 10 - 25 yearsBuildings and leasehold improvements . . . . . . . . . . . . . . . . . . . . . . . 10 - 25 yearsEquipment and smallwares . . . . . . . . . . . . . . . . . . . . . . . . . . . . . . . . 3 - 10 yearsFurniture and fixtures . . . . . . . . . . . . . . . . . . . . . . . . . . . . . . . . . . . 3 - 10 years
The cost of purchasing transferable liquor licenses through open markets in jurisdictions with alimited number of authorized liquor licenses are capitalized and indefinite-lived assets and included inProperty and equipment, net.
Repairs and maintenance expense amounted to $15.9 million, $13.8 million and $12.6 million forthe years ended December 31, 2013, December 25, 2012 and December 27, 2011, respectively. Thesecosts are included in other operating costs in our consolidated statements of income andcomprehensive income.
(h) Impairment of Goodwill
Goodwill represents the excess of cost over fair value of assets of businesses acquired. Inaccordance with the provisions of Financial Accounting Standards Board (‘‘FASB’’) AccountingStandards Codification (‘‘ASC’’) 350, Intangibles—Goodwill and Other (‘‘ASC 350’’), we perform teststo assess potential impairments at the end of each fiscal year or during the year if an event or othercircumstance indicates that it may be impaired. Our assessment is performed at the reporting unit level,which is at the individual restaurant level. In the first step of the review process, we compare theestimated fair value of the restaurant with its carrying value, including goodwill. If the estimated fairvalue of the restaurant exceeds its carrying amount, no further analysis is needed. If the estimated fairvalue of the restaurant is less than its carrying amount, the second step of the review process requiresthe calculation of the implied fair value of the goodwill by allocating the estimated fair value of therestaurant to all of the assets and liabilities of the restaurant as if it had been acquired in a businesscombination. If the carrying value of the goodwill associated with the restaurant exceeds the impliedfair value of the goodwill, an impairment loss is recognized for that excess amount.
The valuation approaches used to determine fair value are subject to key judgments andassumptions that are sensitive to change such as judgment and assumptions about appropriate revenuegrowth rates, operating margins, weighted average cost of capital and comparable company andacquisition market multiples. In estimating the fair value using the capitalization of earnings method ordiscounted cash flows, we consider the period of time the restaurant has been open, the trend ofoperations over such period and future periods, expectations of future sales growth and terminal value.Assumptions about important factors such as trend of future operations and sales growth are limited tothose that are supportable based upon the plans for the restaurant and actual results at comparablerestaurants. When developing these key judgments and assumptions, we consider economic, operationaland market conditions that could impact fair value. The judgments and assumptions used are consistentwith what we believe hypothetical market participants would use. However, estimates are inherentlyuncertain and represent only our reasonable expectations regarding future developments. If theestimates used in performing the impairment test prove inaccurate, the fair value of the restaurants
F-9

Texas Roadhouse, Inc. and Subsidiaries
Notes to Consolidated Financial Statements (Continued)
(Tabular amounts in thousands, except share and per share data)
(2) Summary of Significant Accounting Policies (Continued)
may ultimately prove to be significantly lower, thereby causing the carrying value to exceed the fairvalue and indicating impairment has occurred.
In 2013, as a result of our annual goodwill impairment analysis, we determined that there was nogoodwill impairment. In 2012, as a result of our annual goodwill impairment analysis, we determinedthat goodwill related to one restaurant was impaired as discussed further in note 15. Refer to note 6for additional information related to goodwill and intangible assets.
(i) Other Assets
Other assets consist primarily of deferred compensation plan assets, investments in foreignoperations, deposits and costs related to the issuance of debt. The debt issuance costs are beingamortized to interest expense over the term of the related debt. For further discussion of the deferredcompensation plan, see note 14.
(j) Impairment or Disposal of Long-lived Assets
In accordance with ASC 360-10-05, Property, Plant and Equipment, long-lived assets related to eachrestaurant to be held and used in the business, such as property and equipment and intangible assetssubject to amortization, are reviewed for impairment whenever events or changes in circumstancesindicate that the carrying amount of a restaurant may not be recoverable. When we evaluaterestaurants, cash flows are the primary indicator of impairment. Recoverability of assets to be held andused is measured by a comparison of the carrying amount of the restaurant to estimated undiscountedfuture cash flows expected to be generated by the restaurant. Under our policies, trailing 12-monthcash flow results below $300,000 at the individual restaurant level signals potential impairment. In ourevaluation of restaurants that do not meet the cash flow threshold, we estimate future undiscountedcash flows from operating the restaurant over its estimated useful life, which can be for a period ofover 20 years. In the estimation of future cash flows, we consider the period of time the restaurant hasbeen open, the trend of operations over such period and future periods and expectations of future salesgrowth. Assumptions about important factors such as trend of future operations and sales growth arelimited to those that are supportable based upon the plans for the restaurant and actual results atcomparable restaurants. If the carrying amount of the restaurant exceeds its estimated future cashflows, an impairment charge is recognized by the amount by which the carrying amount exceeds the fairvalue of the assets. We generally measure fair value by discounting estimated future cash flows or byindependent third party appraisal, if available. When fair value is measured by discounting estimatedfuture cash flows, the assumptions used are consistent with what we believe hypothetical marketparticipants would use. We also use a discount rate that is commensurate with the risk inherent in theprojected cash flows. The adjusted carrying amounts of assets to be held and used are depreciated overtheir remaining useful life. In 2013, we recorded $0.2 million of impairment related to one previouslyclosed restaurant. In 2012, as a result of our impairment analysis, we determined that the building,equipment, furniture and fixtures at one restaurant was impaired. For further discussion regardingclosures and impairments recorded in 2013, 2012 and 2011, including the impairments of goodwill andother long-lived assets, refer to note 15.
F-10

Texas Roadhouse, Inc. and Subsidiaries
Notes to Consolidated Financial Statements (Continued)
(Tabular amounts in thousands, except share and per share data)
(2) Summary of Significant Accounting Policies (Continued)
(k) Insurance Reserves
We self-insure a significant portion of expected losses under our workers compensation, generalliability, employment practices liability, property insurance and employee healthcare programs. Wepurchase insurance for individual claims that exceed the amounts listed below:
Employment practices liability . . . . . . . . . . . . . . . . . . . . . . . . . . . . . . . . $250,000Workers compensation . . . . . . . . . . . . . . . . . . . . . . . . . . . . . . . . . . . . . . $350,000General liability . . . . . . . . . . . . . . . . . . . . . . . . . . . . . . . . . . . . . . . . . . . $250,000Property . . . . . . . . . . . . . . . . . . . . . . . . . . . . . . . . . . . . . . . . . . . . . . . . $ 50,000Employee healthcare . . . . . . . . . . . . . . . . . . . . . . . . . . . . . . . . . . . . . . . $150,000
We record a liability for unresolved claims and for an estimate of incurred but not reported claimsat our anticipated cost based on estimates provided by management, a third party administrator and/oractuary. The estimated liability is based on a number of assumptions and factors regarding economicconditions, the frequency and severity of claims and claim development history and settlementpractices. Our assumptions are reviewed, monitored, and adjusted when warranted by changingcircumstances. The workers compensation and general liability reserves are discounted as we considerthe amount and timing of cash payments reliably determinable. The discount is not significant.
(l) Segment Reporting
We consider our restaurant and franchising operations as similar and have aggregated them into asingle reportable segment. The majority of the restaurants operate in the U.S. within the casual diningsegment of the restaurant industry, providing similar products to similar customers. The restaurants alsopossess similar pricing structures, resulting in similar long-term expected financial performancecharacteristics. As of December 31, 2013, we operated 346 restaurants, each as a single operatingsegment, and franchised an additional 74 restaurants. Revenue from external customers is derivedprincipally from food and beverage sales. We do not rely on any major customers as a source ofrevenue.
(m) Revenue Recognition
Revenue from restaurant sales is recognized when food and beverage products are sold. Deferredrevenue primarily represents our liability for gift cards that have been sold, but not yet redeemed.When the gift cards are redeemed, we recognize restaurant sales and reduce deferred revenue.
For some of the gift cards that were sold, the likelihood of redemption is remote. When thelikelihood of a gift card’s redemption is determined to be remote, we record a breakage adjustmentand reduce deferred revenue by the amount never expected to be redeemed. We use historic gift cardredemption patterns to determine when the likelihood of a gift card’s redemption becomes remote andhave determined that approximately 5% of the value of gift cards will never be redeemed. Themethodology we use to match the expected redemption value of unredeemed gift cards to our historicredemption patterns is to amortize the historic 5% rate of breakage over a three year period. As aresult, the amount of unredeemed gift card liability included in deferred revenue is the full value ofunredeemed gift cards less the amortized portion of the 5% rate of breakage. We recorded our gift
F-11

Texas Roadhouse, Inc. and Subsidiaries
Notes to Consolidated Financial Statements (Continued)
(Tabular amounts in thousands, except share and per share data)
(2) Summary of Significant Accounting Policies (Continued)
card breakage adjustment as a reduction of other operating expense in our consolidated statements ofincome and comprehensive income. We review and adjust our estimates on a quarterly basis.
We franchise Texas Roadhouse restaurants. We execute franchise agreements for each franchiserestaurant which sets out the terms of our arrangement with the franchisee. Our franchise agreementstypically require the franchisee to pay an initial, non-refundable fee and continuing fees based upon apercentage of sales. Subject to our approval and payment of a renewal fee, a franchisee may generallyrenew the franchise agreement upon its expiration. We collect ongoing royalties of 2.0% to 4.0% ofsales from our domestic franchisees, along with royalties paid to us by our international franchisee.These ongoing royalties are reflected in the accompanying consolidated statements of income andcomprehensive income as franchise royalties and fees. We recognize initial franchise fees as revenueafter performing substantially all initial services or conditions required by the franchise agreement,which is generally upon the opening of a restaurant. We received initial franchise fees of $0.1 millionfor the year ended December 31, 2013. We received initial franchise fees of $0.2 million for both of theyears ended December 25, 2012 and December 27, 2011. Continuing franchise royalties are recognizedas revenue as the fees are earned. We also perform supervisory and administrative services for certainfranchise restaurants for which we receive management fees, which are recognized as the services areperformed. Revenue from supervisory and administrative services is recorded as a reduction of generaland administrative expenses in the accompanying consolidated statements of income and comprehensiveincome. Total revenue from supervisory and administrative services recorded for the years endedDecember 31, 2013, December 25, 2012 and December 27, 2011 was approximately $0.7 million,$0.6 million and $0.6 million, respectively.
Sales taxes collected from customers and remitted to governmental authorities are accounted foron a net basis and therefore are excluded from revenue in the consolidated statements of income andcomprehensive income.
(n) Income Taxes
We account for income taxes in accordance with ASC 740, Income Taxes, under which deferredassets and liabilities are recognized based upon anticipated future tax consequences attributable todifferences between financial statement carrying values of assets and liabilities and their respective taxbases. We recognize both interest and penalties on unrecognized tax benefits as part of income taxexpense. A valuation allowance is established to reduce the carrying value of deferred tax assets if it isconsidered more likely than not that such assets will not be realized. Any change in the valuationallowance would be charged to income in the period such determination was made.
(o) Advertising
We have a domestic system-wide marketing and advertising fund. We maintain control of themarketing and advertising fund and, as such, have consolidated the fund’s activity for the years endedDecember 31, 2013, December 25, 2012 and December 27, 2011. Domestic company and franchiserestaurants are required to remit a designated portion of sales, currently 0.3%, to the advertising fund.These reimbursements do not exceed the costs incurred by the advertising fund throughout the yearassociated with various marketing programs which are developed internally by us. Therefore, the netamount of the advertising costs incurred less amounts remitted by company and franchise restaurants is
F-12

Texas Roadhouse, Inc. and Subsidiaries
Notes to Consolidated Financial Statements (Continued)
(Tabular amounts in thousands, except share and per share data)
(2) Summary of Significant Accounting Policies (Continued)
included in general and administrative expense in our consolidated statements of income andcomprehensive income.
The company-owned restaurant contribution and other costs related to local restaurant areamarketing initiatives are included in other operating costs in our consolidated statements of income andcomprehensive income. These costs amounted to approximately $10.1 million, $9.1 million and$8.5 million for the years ended December 31, 2013, December 25, 2012 and December 27, 2011,respectively.
(p) Leases and Leasehold Improvements
We lease land, buildings and/or certain equipment for the majority of our restaurants undernon-cancelable lease agreements. Our land and/or building leases typically have initial terms rangingfrom 10 to 15 years, and certain renewal options for one or more five-year periods. We account forleases in accordance with ASC 840, Leases, and other related authoritative guidance. When determiningthe lease term, we include option periods for which failure to renew the lease imposes a penalty on usin such an amount that a renewal appears, at the inception of the lease, to be reasonably assured. Theprimary penalty to which we are subject is the economic detriment associated with the existence ofleasehold improvements which might become impaired if we choose not to continue the use of theleased property.
Certain of our operating leases contain predetermined fixed escalations of the minimum rentduring the original term of the lease. For these leases, we recognize the related rent expense on astraight-line basis over the lease term and record the difference between the amounts charged tooperations and amounts paid as deferred rent. We generally do not receive rent concessions orleasehold improvement incentives upon opening a restaurant that is subject to a lease. We may receiverent holidays, which would begin on the possession date and end when the lease commences, duringwhich no cash rent payments are typically due under the terms of the lease. Rent holidays are includedin the lease term when determining straight-line rent expense.
Additionally, certain of our operating leases contain clauses that provide for additional contingentrent based on a percentage of sales greater than certain specified target amounts. We recognizecontingent rent expense prior to the achievement of the specified target that triggers the contingentrent, provided achievement of the target is considered probable. This may result in some variability inrent expense as a percentage of sales over the term of the lease in restaurants where we pay contingentrent.
The judgment regarding the probable term for each restaurant property lease impacts theclassification and accounting for a lease as capital or operating, the rent holiday and/or escalation inpayments that are taken into consideration when calculating straight-line rent and the term over whichleasehold improvements for each restaurant are amortized. The material factor we consider whenmaking this judgment is the total amount invested in the restaurant at the inception of the lease andwhether management believes that renewal appears reasonably assured. While a different term mayproduce materially different amounts of depreciation, amortization and rent expense than reported, ourhistorical lease renewal rates support the judgments made. We have not made any changes to the
F-13

Texas Roadhouse, Inc. and Subsidiaries
Notes to Consolidated Financial Statements (Continued)
(Tabular amounts in thousands, except share and per share data)
(2) Summary of Significant Accounting Policies (Continued)
nature of the assumptions used to account for leases in any of the fiscal years presented in ourconsolidated financial statements.
(q) Use of Estimates
We have made a number of estimates and assumptions relating to the reporting of assets andliabilities, the disclosure of contingent assets and liabilities at the date of the consolidated financialstatements and the reporting of revenue and expenses during the period to prepare these consolidatedfinancial statements in conformity with generally accepted accounting principles (‘‘GAAP’’). Significantitems subject to such estimates and assumptions include the carrying amount of property andequipment, goodwill, obligations related to insurance reserves, share-based compensation expense andincome taxes. Actual results could differ from those estimates.
(r) Comprehensive Income
ASC 220, Comprehensive Income, establishes standards for reporting and presentation ofcomprehensive income and its components in a full set of financial statements. Comprehensive incomeconsists of net income and other comprehensive income (loss) items that are excluded from net incomeunder GAAP in the United States. The effective unrealized portion of changes in fair value of cashflow hedges is our only other comprehensive income item.
(s) Fair Value of Financial Instruments
Fair value is determined based on the present value of expected future cash flows considering therisks involved and using discount rates appropriate for the duration and considers counterpartyperformance risk.
(t) Derivative Instruments and Hedging Activities
We do not use derivative instruments for trading purposes. Currently, our only free standingderivative instruments are two interest rate swap agreements.
We account for derivatives and hedging activities in accordance with ASC 815, Derivatives andHedging, which requires that all derivative instruments be recorded on the consolidated balance sheet attheir respective fair values. The accounting for changes in the fair value of a derivative instrument isdependent upon whether the derivative has been designated and qualifies as part of a hedgingrelationship. Our current derivatives have been designated and qualify as cash flow hedges. Forderivative instruments that are designated and qualify as a cash flow hedge, the effective portion of thegain or loss on the derivative instrument is reported as a component of other comprehensive income(loss) and reclassified into earnings in the same period or periods during which the hedged transactionsaffect earnings. There was no hedge ineffectiveness recognized during the years ended December 31,2013, December 25, 2012 and December 27, 2011.
(u) Reclassifications
Certain prior year amounts have been reclassified in our consolidated financial statements toconform with current year presentation.
F-14

Texas Roadhouse, Inc. and Subsidiaries
Notes to Consolidated Financial Statements (Continued)
(Tabular amounts in thousands, except share and per share data)
(2) Summary of Significant Accounting Policies (Continued)
(v) Recent Accounting Pronouncements
Comprehensive Income(Accounting Standards Update 2013-02, ‘‘ASU 2013-2’’)
In February 2013, the FASB issued ASU 2013-2, Reporting of Amounts Reclassified Out ofAccumulated Other Comprehensive Income, that requires an organization to present the effects on theline items of net income of significant amounts reclassified out of accumulated other comprehensiveincome (‘‘AOCI’’), but only if the item reclassified is required under GAAP to be reclassified to netincome in its entirety in the same reporting period. ASU 2013-02 was effective for fiscal yearsbeginning after December 15, 2012 (our 2013 fiscal year). The adoption of this new guidance had noimpact on our consolidated financial position, results of operations or cash flows.
(3) Divestitures and Acquisitions
On December 31, 2013, we sold our Aspen Creek concept, including two restaurants, and,pursuant to the terms of the purchase agreement, we received two Texas Roadhouse franchiserestaurants in Ohio and $1.5 million in cash, for an aggregate transaction value of $6.0 million. Werecorded a $1.8 million gain in conjunction with the sale of the Aspen Creek concept and restaurants.The acquisition of the two franchise restaurants did not have a significant net revenue or accretiveimpact since the restaurants were acquired on the last day of our fiscal year. The acquisition isconsistent with our long-term strategy to increase net income and earnings per share.
The acquisition of the two franchise restaurants was accounted for using the purchase method asdefined in ASC 805, Business Combinations (‘‘ASC 805’’). Based on a purchase price of $4.5 million,$3.0 million of goodwill was generated by the acquisition, which is not amortizable for book purposes,but is deductible for tax purposes.
The purchase price has been preliminary allocated as follows:
Current assets . . . . . . . . . . . . . . . . . . . . . . . . . . . . . . . . . . . . . . . . . . . . . . $ 64Property and equipment, net . . . . . . . . . . . . . . . . . . . . . . . . . . . . . . . . . . . 558Goodwill . . . . . . . . . . . . . . . . . . . . . . . . . . . . . . . . . . . . . . . . . . . . . . . . . 3,013Intangible asset . . . . . . . . . . . . . . . . . . . . . . . . . . . . . . . . . . . . . . . . . . . . . 1,154Current liabilities . . . . . . . . . . . . . . . . . . . . . . . . . . . . . . . . . . . . . . . . . . . (139)Other liabilities . . . . . . . . . . . . . . . . . . . . . . . . . . . . . . . . . . . . . . . . . . . . . (150)
$4,500
As a result of this acquisition, we recorded an intangible asset associated with reacquired franchiserights of $1.2 million in accordance with ASC 805. ASC 805 requires that a business combinationbetween two parties that have a preexisting relationship be evaluated to determine if a settlement of apreexisting relationship exists. ASC 805 also requires that certain reacquired rights (including the rightsto the acquirer’s trade name under a franchise agreement) be recognized as intangible assets apartfrom goodwill.
F-15

Texas Roadhouse, Inc. and Subsidiaries
Notes to Consolidated Financial Statements (Continued)
(Tabular amounts in thousands, except share and per share data)
(3) Divestitures and Acquisitions (Continued)
The fair value of $1.2 million assigned to the intangible asset acquired was determined primarilyusing valuation methods that discount expected future cash flow to present value using estimates andassumptions determined by management. The intangible asset has a weighted-average life ofapproximately 3.7 years based on the remaining terms of the franchise agreements. We expect theannual expense for the next four years to average approximately $0.3 million.
On December 25, 2012, we acquired two franchise restaurants in Illinois, which had no significantnet revenue or accretive impact since the restaurants were acquired on the last day of our fiscal year.Pursuant to the terms of the purchase agreement, we paid a purchase price of $4.2 million. Thisacquisition is consistent with our long-term strategy to increase net income and earnings per share.
This transaction was accounted for using the purchase method as defined in ASC 805. Based on apurchase price of $4.2 million, $2.8 million of goodwill was generated by the acquisition, which is notamortizable for book purposes, but is deductible for tax purposes.
The purchase price has been allocated as follows:
Current assets . . . . . . . . . . . . . . . . . . . . . . . . . . . . . . . . . . . . . . . . . . . . . . $ 64Property and equipment, net . . . . . . . . . . . . . . . . . . . . . . . . . . . . . . . . . . . 304Goodwill . . . . . . . . . . . . . . . . . . . . . . . . . . . . . . . . . . . . . . . . . . . . . . . . . 2,759Intangible asset . . . . . . . . . . . . . . . . . . . . . . . . . . . . . . . . . . . . . . . . . . . . . 1,342Current liabilities . . . . . . . . . . . . . . . . . . . . . . . . . . . . . . . . . . . . . . . . . . . (195)Other liabilities . . . . . . . . . . . . . . . . . . . . . . . . . . . . . . . . . . . . . . . . . . . . . (64)
$4,210
As a result of this acquisition, we recorded an intangible asset associated with reacquired franchiserights of $1.3 million in accordance with ASC 805. The fair value of $1.3 million assigned to theintangible asset acquired was determined primarily using valuation methods that discount expectedfuture cash flow to present value using estimates and assumptions determined by management. Theintangible asset has a weighted-average life of approximately 2.6 years based on the remaining terms ofthe franchise agreements. We recorded amortization expense relating to the intangible asset of$0.6 million for the year ended December 31, 2013. We expect the annual expense to be $0.5 millionfor 2014, $0.2 million for 2015 and $0.1 million for 2016.
Pro forma results of operations have not been presented because the effects of the acquisitionswere not material to our consolidated financial position, results of operations or cash flows.
F-16

Texas Roadhouse, Inc. and Subsidiaries
Notes to Consolidated Financial Statements (Continued)
(Tabular amounts in thousands, except share and per share data)
(4) Long-term Debt and Obligations Under Capital Leases
Long-term debt and obligations under capital leases consisted of the following:
December 31, December 25,2013 2012
Installment loans, due 2014 - 2020 . . . . . . . . . . . . . . . . . . $ 1,233 $ 1,473Obligations under capital leases . . . . . . . . . . . . . . . . . . . . — 129Revolver . . . . . . . . . . . . . . . . . . . . . . . . . . . . . . . . . . . . 50,000 50,000
51,233 51,602Less current maturities . . . . . . . . . . . . . . . . . . . . . . . . . . 243 338
$50,990 $51,264
Maturities of long-term debt at December 31, 2013 are as follows:
2014 . . . . . . . . . . . . . . . . . . . . . . . . . . . . . . . . . . . . . . . . . . . . . . . . . . . . $ 2432015 . . . . . . . . . . . . . . . . . . . . . . . . . . . . . . . . . . . . . . . . . . . . . . . . . . . . 2832016 . . . . . . . . . . . . . . . . . . . . . . . . . . . . . . . . . . . . . . . . . . . . . . . . . . . . 1572017 . . . . . . . . . . . . . . . . . . . . . . . . . . . . . . . . . . . . . . . . . . . . . . . . . . . . 1592018 . . . . . . . . . . . . . . . . . . . . . . . . . . . . . . . . . . . . . . . . . . . . . . . . . . . . 50,177Thereafter . . . . . . . . . . . . . . . . . . . . . . . . . . . . . . . . . . . . . . . . . . . . . . . 214
$51,233
The weighted average interest rate for installment loans outstanding at December 31, 2013 andDecember 25, 2012 was 10.54% and 10.56%, respectively. The debt is secured by certain land andbuildings and is subject to certain prepayment penalties.
On November 1, 2013, we entered into Omnibus Amendment No. 1 and Consent to CreditAgreement and Guaranty with respect to our revolving credit facility dated as of August 12, 2011 witha syndicate of commercial lenders led by JP Morgan Chase Bank, N.A., PNC Bank, N.A., and WellsFargo, N.A. The revolving credit facility remains an unsecured, revolving credit agreement under whichwe may borrow up to $200.0 million. The amendment provides us with the option to increase therevolving credit facility by $200.0 million, up to $400.0 million, subject to certain limitations. Theoriginal revolving credit facility provided an option to increase the borrowing amount by $100.0 million,up to $300.0 million. The amendment also extends the maturity date of the revolving credit facility untilNovember 1, 2018.
The terms of the amended revolving credit facility require us to pay interest on outstandingborrowings at the London Interbank Offered Rate (‘‘LIBOR’’) plus a margin of 0.875% to 1.875%,depending on our leverage ratio, or the Alternate Base Rate, which is the higher of the issuing bank’sprime lending rate, the Federal Funds rate plus 0.50% or the Adjusted Eurodollar Rate for a onemonth interest period on such day plus 1.0%. We are also required to pay a commitment fee of 0.125%to 0.30% per year on any unused portion of the revolving credit facility, depending on our leverageratio. The weighted-average interest rate for the revolving credit facility at both December 31, 2013 andDecember 25, 2012 was 3.96%, including the impact of interest rate swaps. At December 31, 2013, wehad $50.0 million outstanding under the revolving credit facility and $145.3 million of availability, net of$4.7 million of outstanding letters of credit.
F-17

Texas Roadhouse, Inc. and Subsidiaries
Notes to Consolidated Financial Statements (Continued)
(Tabular amounts in thousands, except share and per share data)
(4) Long-term Debt and Obligations Under Capital Leases (Continued)
The lenders’ obligation to extend credit under the revolving credit facility depends on usmaintaining certain financial covenants, including a minimum consolidated fixed charge coverage ratioof 2.00 to 1.00 and a maximum consolidated leverage ratio of 3.00 to 1.00. The revolving credit facilitypermits us to incur additional secured or unsecured indebtedness outside the facility, except for theincurrence of secured indebtedness that in the aggregate exceeds 15% of our consolidated tangible networth or circumstances where the incurrence of secured or unsecured indebtedness would prevent usfrom complying with our financial covenants. We were in compliance with all covenants as ofDecember 31, 2013.
On October 22, 2008, we entered into an interest rate swap, starting on November 7, 2008, with anotional amount of $25.0 million to hedge a portion of the cash flows of our variable rate borrowings.We have designated the interest rate swap as a cash flow hedge of our exposure to variability in futurecash flows attributable to interest payments on a $25.0 million tranche of floating rate debt borrowedunder our revolving credit facility. Under the terms of the swap, we pay a fixed rate of 3.83% on the$25.0 million notional amount and receive payments from the counterparty based on the 1-monthLIBOR rate for a term ending on November 7, 2015, effectively resulting in a fixed rate on the$25.0 million notional amount. Changes in the fair value of the interest rate swap will be reported as acomponent of accumulated other comprehensive income (loss).
On January 7, 2009, we entered into an interest rate swap, starting on February 7, 2009, with anotional amount of $25.0 million to hedge a portion of the cash flows of our variable rate borrowings.We have designated the interest rate swap as a cash flow hedge of our exposure to variability in futurecash flows attributable to interest payments on a $25.0 million tranche of floating rate debt borrowedunder our revolving credit facility. Under the terms of the swap, we pay a fixed rate of 2.34% on the$25.0 million notional amount and receive payments from the counterparty based on the 1-monthLIBOR rate for a term ending on January 7, 2016, effectively resulting in a fixed rate on the$25.0 million notional amount. Changes in the fair value of the interest rate swap will be reported as acomponent of accumulated other comprehensive income (loss).
(5) Property and Equipment, Net
Property and equipment were as follows:
December 31, December 25,2013 2012
Land and improvements . . . . . . . . . . . . . . . . . . . . . . . . . $ 100,456 $ 99,536Buildings and leasehold improvements . . . . . . . . . . . . . . . 457,139 418,412Equipment and smallwares . . . . . . . . . . . . . . . . . . . . . . . 229,621 203,313Furniture and fixtures . . . . . . . . . . . . . . . . . . . . . . . . . . . 71,329 62,686Construction in progress . . . . . . . . . . . . . . . . . . . . . . . . . 25,516 10,167Liquor licenses . . . . . . . . . . . . . . . . . . . . . . . . . . . . . . . . 6,667 6,592
890,728 800,706Accumulated depreciation and amortization . . . . . . . . . . . (304,536) (269,052)
$ 586,192 $ 531,654
F-18

Texas Roadhouse, Inc. and Subsidiaries
Notes to Consolidated Financial Statements (Continued)
(Tabular amounts in thousands, except share and per share data)
(5) Property and Equipment, Net (Continued)
The amount of interest capitalized in connection with restaurant construction was approximately$0.5 million, $0.4 million and $0.3 million for the years ended December 31, 2013, December 25, 2012and December 27, 2011, respectively.
(6) Goodwill and Intangible Assets
The changes in the carrying amount of goodwill and intangible assets are as follows:
Goodwill Intangible Assets
Balance as of December 27, 2011 . . . . . . . . . . . . . . . . . . . 110,946 9,042Additions . . . . . . . . . . . . . . . . . . . . . . . . . . . . . . . . . . . . 2,741 1,511Amortization expense . . . . . . . . . . . . . . . . . . . . . . . . . . . — (1,076)Disposals and other, net . . . . . . . . . . . . . . . . . . . . . . . . . — —Impairment . . . . . . . . . . . . . . . . . . . . . . . . . . . . . . . . . . . (252) (213)
Balance as of December 25, 2012 . . . . . . . . . . . . . . . . . . . 113,435 9,264Additions . . . . . . . . . . . . . . . . . . . . . . . . . . . . . . . . . . . . 3,033 985Amortization expense . . . . . . . . . . . . . . . . . . . . . . . . . . . — (1,624)Disposals and other, net . . . . . . . . . . . . . . . . . . . . . . . . . — —Impairment . . . . . . . . . . . . . . . . . . . . . . . . . . . . . . . . . . . — —
Balance as of December 31, 2013 . . . . . . . . . . . . . . . . . . . 116,468 8,625
Intangible assets consist of reacquired franchise rights. The gross carrying amount and accumulatedamortization of the intangible assets at December 31, 2013 were $16.1 million and $7.5 million,respectively. As of December 25, 2012, the gross carrying amount and accumulated amortization of theintangible assets was $15.1 million and $5.9 million. We amortize reacquired franchise rights on astraight-line basis over the remaining term of the franchise operating agreements, which varies byrestaurant. Amortization expense for the next five years is expected to range from $0.9 million to$1.8 million. Refer to note 3 for discussion of the acquisition completed on December 31, 2013.
(7) Leases
The following is a schedule of future minimum lease payments required for operating leases thathave initial or remaining noncancelable terms in excess of one year as of December 31, 2013:
OperatingLeases
2014 . . . . . . . . . . . . . . . . . . . . . . . . . . . . . . . . . . . . . . . . . . . . . . . . . . . $ 29,3302015 . . . . . . . . . . . . . . . . . . . . . . . . . . . . . . . . . . . . . . . . . . . . . . . . . . . 27,2132016 . . . . . . . . . . . . . . . . . . . . . . . . . . . . . . . . . . . . . . . . . . . . . . . . . . . 26,3452017 . . . . . . . . . . . . . . . . . . . . . . . . . . . . . . . . . . . . . . . . . . . . . . . . . . . 26,5342018 . . . . . . . . . . . . . . . . . . . . . . . . . . . . . . . . . . . . . . . . . . . . . . . . . . . 26,879Thereafter . . . . . . . . . . . . . . . . . . . . . . . . . . . . . . . . . . . . . . . . . . . . . . . 385,772
Total . . . . . . . . . . . . . . . . . . . . . . . . . . . . . . . . . . . . . . . . . . . . . . . . . $522,073
F-19

Texas Roadhouse, Inc. and Subsidiaries
Notes to Consolidated Financial Statements (Continued)
(Tabular amounts in thousands, except share and per share data)
(7) Leases (Continued)
Rent expense for operating leases consisted of the following:
December 31, 2013 December 25, 2012 December 27, 2011
Minimum rent—occupancy . . . . $28,191 $25,110 $22,532Contingent rent . . . . . . . . . . . . 787 687 618
Rent expense, occupancy . . . . 28,978 25,797 23,150Minimum rent—equipment and
other . . . . . . . . . . . . . . . . . . 3,502 3,393 3,013
Rent expense . . . . . . . . . . . . $32,480 $29,190 $26,163
(8) Income Taxes
Components of our income tax (benefit) and provision for the years ended December 31, 2013,December 25, 2012 and December 27, 2011 are as follows:
Fiscal Year Ended
December 31, 2013 December 25, 2012 December 27, 2011
Current:Federal . . . . . . . . . . . . . . . . $28,648 $29,286 $20,546State . . . . . . . . . . . . . . . . . . 6,439 7,618 6,149
Total current . . . . . . . . . . . 35,087 36,904 26,695Deferred:
Federal . . . . . . . . . . . . . . . . (919) (1,511) 289State . . . . . . . . . . . . . . . . . . (28) (655) (219)
Total deferred . . . . . . . . . . (947) (2,166) 70
Income tax provision . . . . . . . . $34,140 $34,738 $26,765
F-20

Texas Roadhouse, Inc. and Subsidiaries
Notes to Consolidated Financial Statements (Continued)
(Tabular amounts in thousands, except share and per share data)
(8) Income Taxes (Continued)
A reconciliation of the statutory federal income tax rate to our effective tax rate for December 31,2013, December 25, 2012 and December 27, 2011 is as follows:
December 31, December 25, December 27,2013 2012 2011
Tax at statutory federal rate . . . . . . . . . . . . . 35.0% 35.0% 35.0%State and local tax, net of federal benefit . . . 3.5 3.7 3.7FICA tip tax credit . . . . . . . . . . . . . . . . . . . (6.5) (6.2) (6.0)HIRE retention credit . . . . . . . . . . . . . . . . . — — (2.1)Work opportunity tax credit . . . . . . . . . . . . . (1.7) (0.9) (1.2)Incentive stock options . . . . . . . . . . . . . . . . (0.7) (0.2) (0.2)Nondeductible officer compensation . . . . . . . 0.4 1.2 0.5Net income attributable to noncontrolling
interests . . . . . . . . . . . . . . . . . . . . . . . . . (1.1) — —Other . . . . . . . . . . . . . . . . . . . . . . . . . . . . . — 0.2 (0.2)
Total . . . . . . . . . . . . . . . . . . . . . . . . . . . . . 28.9% 32.8% 29.5%
In prior years, we deducted net income attributable to noncontrolling interests from income beforetaxes as shown in our consolidated statements of income and comprehensive income to determine theeffective tax rates shown in the table above. The impact of including the net income attributable tononcontrolling interests would have reduced our effective tax rate to 32.0% and 28.7% for the yearsended December 25, 2012 and December 27, 2011, respectively.
F-21

Texas Roadhouse, Inc. and Subsidiaries
Notes to Consolidated Financial Statements (Continued)
(Tabular amounts in thousands, except share and per share data)
(8) Income Taxes (Continued)
Components of deferred tax assets (liabilities) are as follows:
December 31, 2013 December 25, 2012
Deferred tax assets:Insurance reserves . . . . . . . . . . . . . . . . . . . . . $ 3,876 $ 3,142Other reserves . . . . . . . . . . . . . . . . . . . . . . . . 515 450Deferred rent . . . . . . . . . . . . . . . . . . . . . . . . . 8,563 7,185Share-based compensation . . . . . . . . . . . . . . . . 5,246 5,231Deferred revenue—gift cards . . . . . . . . . . . . . . 3,860 3,135Deferred compensation . . . . . . . . . . . . . . . . . . 4,200 3,507Other assets and liabilities . . . . . . . . . . . . . . . . 3,311 2,456
Total deferred tax asset . . . . . . . . . . . . . . . . . . . 29,571 25,106
Deferred tax liabilities:Property and equipment . . . . . . . . . . . . . . . . . (27,585) (24,449)Goodwill and intangibles . . . . . . . . . . . . . . . . . (3,304) (2,943)Other assets and liabilities . . . . . . . . . . . . . . . . (1,603) (980)
Total deferred tax liability . . . . . . . . . . . . . . . . . . (32,492) (28,372)
Net deferred tax liability . . . . . . . . . . . . . . . . . . . $ (2,921) $ (3,266)
Current deferred tax asset . . . . . . . . . . . . . . . . . $ 2,853 $ 2,836Noncurrent deferred tax liability . . . . . . . . . . . . . (5,774) (6,102)
Net deferred tax liability . . . . . . . . . . . . . . . . . . . $ (2,921) $ (3,266)
We have not provided any valuation allowance as we believe the realization of our deferred taxassets is more likely than not.
A reconciliation of the beginning and ending liability for unrecognized tax benefits is as follows:
Uncertain tax Uncertain taxpositions impacting positions not Total uncertain
tax rate impacting tax rate tax positions
Balance at December 27, 2011 . . . $ 124 $— $ 124Additions to tax positions related
to prior years . . . . . . . . . . . . . . 145 — 145Reductions due to statute
expiration . . . . . . . . . . . . . . . . (87) — (87)
Balance at December 25, 2012 . . . 182 — 182Additions to tax positions related
to current year . . . . . . . . . . . . . 102 — 102Reductions due to exam
settlement . . . . . . . . . . . . . . . . (112) — (112)
Balance at December 31, 2013 . . . $ 172 $— $ 172
F-22

Texas Roadhouse, Inc. and Subsidiaries
Notes to Consolidated Financial Statements (Continued)
(Tabular amounts in thousands, except share and per share data)
(8) Income Taxes (Continued)
We recognize both interest and penalties on unrecognized tax benefits as part of income taxexpense. As of December 31, 2013 and December 25, 2012, the total amount of accrued penalties andinterest related to uncertain tax provisions was immaterial.
All entities for which unrecognized tax benefits exist as of December 31, 2013 possess a Decembertax year-end. As a result, as of December 31, 2013, the tax years ended December 28, 2010,December 27, 2011 and December 25, 2012 remain subject to examination by all tax jurisdictions. As ofDecember 31, 2013, no audits were in process by a tax jurisdiction that, if completed during the nexttwelve months, would be expected to result in a material change to our unrecognized tax benefits.Additionally, as of December 31, 2013, no event occurred that is likely to result in a significant increaseor decrease in the unrecognized tax benefits through December 30, 2014.
(9) Preferred Stock
Our Board of Directors is authorized, without further vote or action by the holders of commonstock, to issue from time to time up to an aggregate of 1,000,000 shares of preferred stock in one ormore series. Each series of preferred stock will have the number of shares, designations, preferences,voting powers, qualifications and special or relative rights or privileges as shall be determined by theBoard of Directors, which may include, but are not limited to, dividend rights, voting rights, redemptionand sinking fund provisions, liquidation preferences, conversion rights and preemptive rights. Therewere no shares of preferred stock outstanding at December 31, 2013 and December 25, 2012.
(10) Stockholders’ Equity
On February 16, 2012, our Board of Directors approved a stock repurchase program under whichit authorized us to repurchase up to $100.0 million of our common stock. This stock repurchaseprogram has no expiration date and replaced a previous stock repurchase program which was approvedon February 17, 2011. The previous program authorized us to repurchase up to $50.0 million of ourcommon stock and was increased by $50.0 million on August 18, 2011. Any repurchases will be madethrough open market transactions. The timing and the amount of any repurchases will be determinedby management under parameters established by our Board of Directors, based on its evaluation of ourstock price, market conditions and other corporate considerations.
For the years ended December 31, 2013, December 25, 2012 and December 27, 2011, we paidapproximately $12.8 million, $29.4 million and $59.1 million to repurchase 461,600, 1,786,855 and3,972,100 shares of our common stock, respectively.
(11) Earnings Per Share
The share and net income per share data for all periods presented are based on the historicalweighted-average shares outstanding. The diluted earnings per share calculations show the effect of theweighted-average stock options and RSUs outstanding from our equity incentive plans as discussed innote 13.
F-23

Texas Roadhouse, Inc. and Subsidiaries
Notes to Consolidated Financial Statements (Continued)
(Tabular amounts in thousands, except share and per share data)
(11) Earnings Per Share (Continued)
The following table summarizes the options and nonvested stock that were outstanding but notincluded in the computation of diluted earnings per share because their inclusion would have had ananti-dilutive effect:
Fiscal Year Ended
December 31, December 25, December 27,2013 2012 2011
Options . . . . . . . . . . . . . . . . . . . . . . . . . . . — 292,193 521,512Nonvested stock . . . . . . . . . . . . . . . . . . . . . 23,520 — —
Total . . . . . . . . . . . . . . . . . . . . . . . . . . . . . 23,520 292,193 521,512
The following table sets forth the calculation of earnings per share and weighted average sharesoutstanding (in thousands) as presented in the accompanying consolidated statements of income andcomprehensive income:
Fiscal Year Ended
December 31, December 25, December 27,2013 2012 2011
Net income attributable to Texas Roadhouse, Inc. andsubsidiaries . . . . . . . . . . . . . . . . . . . . . . . . . . . . . . . . . . . . $80,423 $71,170 $63,964
Basic EPS:Weighted-average common shares outstanding . . . . . . . . . . . . . 70,089 70,026 70,829
Basic EPS . . . . . . . . . . . . . . . . . . . . . . . . . . . . . . . . . . . . . . . $ 1.15 $ 1.02 $ 0.90
Diluted EPS:Weighted-average common shares outstanding . . . . . . . . . . . . . 70,089 70,026 70,829Dilutive effect of stock options and nonvested stock . . . . . . . . 1,273 1,459 1,449
Shares—diluted . . . . . . . . . . . . . . . . . . . . . . . . . . . . . . . . . . . 71,362 71,485 72,278
Diluted EPS . . . . . . . . . . . . . . . . . . . . . . . . . . . . . . . . . . . . . $ 1.13 $ 1.00 $ 0.88
(12) Commitments and Contingencies
The estimated cost of completing capital project commitments at December 31, 2013 andDecember 25, 2012 was approximately $65.2 million and $73.2 million, respectively.
Effective December 31, 2013, we sold two restaurants, which operated under the name AspenCreek, located in Irving, TX and Louisville, KY. We assigned the leases associated with theserestaurants to the acquirer, but remain contingently liable if the acquirer defaults, under the terms ofthe lease. We are contingently liable for the initial term of the lease and any renewal periods. TheIrving lease has an initial term that expires December 2019, along with three five-year renewals. TheLouisville lease has an initial term that expires November 2023, along with three five-year renewals.The assignment of the Louisville lease releases us from liability after the initial lease term expiration
F-24

Texas Roadhouse, Inc. and Subsidiaries
Notes to Consolidated Financial Statements (Continued)
(Tabular amounts in thousands, except share and per share data)
(12) Commitments and Contingencies (Continued)
contingent upon certain conditions being met by the acquirer. As the fair value of the guarantees is notconsidered significant, no liability has been recorded.
We entered into real estate lease agreements for five franchises, listed in the table below, beforegranting franchise rights for those restaurants. We have subsequently assigned the leases to thefranchisees, but remain contingently liable if a franchisee defaults, under the terms of the lease.
Lease Assignment Initial Lease TermDate Expiration
Everett, Massachusetts(1) . . . . . . . . . . . . . . . . . September 2002 February 2018Longmont, Colorado(1) . . . . . . . . . . . . . . . . . . . October 2003 May 2014Montgomeryville, Pennsylvania . . . . . . . . . . . . . . October 2004 June 2021Fargo, North Dakota(1) . . . . . . . . . . . . . . . . . . . February 2006 July 2016Logan, Utah . . . . . . . . . . . . . . . . . . . . . . . . . . . January 2009 August 2019
(1) As discussed in note 17, these restaurants are owned, in whole or part, by certain officers,directors and 5% shareholders of the Company.
We are contingently liable for the initial term of the lease and any renewal periods. All of theleases have three five-year renewals. As the fair value of the guarantees is not considered significant,no liability has been recorded.
During the year ended December 31, 2013, we bought most of our beef from four suppliers.Although there are a limited number of beef suppliers, we believe that other suppliers could provide asimilar product on comparable terms. A change in suppliers, however, could cause supply shortages anda possible loss of sales, which would affect operating results adversely. We have no material minimumpurchase commitments with our vendors that extend beyond a year.
On September 30, 2011, the U.S. Equal Employment Opportunity Commission (‘‘EEOC’’) filed alawsuit styled Equal Employment Opportunity Commission v. Texas Roadhouse, Inc., Texas RoadhouseHoldings LLC, Texas Roadhouse Management Corp. in the United States District Court, District ofMassachusetts (‘‘Court’’), Civil Action Number 1:11-cv-11732. The complaint alleges that applicantsover the age of 40 were denied employment in our restaurants in bartender, host, server and serverassistant positions due to their age. The EEOC is seeking injunctive relief, remedial actions, paymentof damages to the applicants and costs. We have filed an answer to the complaint, and the case is indiscovery. We deny liability; however, in view of the inherent uncertainties of litigation, the outcome ofthis case cannot be predicted at this time. We cannot estimate the possible amount or range of loss, ifany, associated with this matter.
On January 19, 2011, a Massachusetts putative class action was filed styled Jenna Crenshaw,Andrew Brickley, et al, and all others similarly situated v. Texas Roadhouse, Inc., Texas RoadhouseHoldings LLC, Texas Roadhouse of Everett, LLC and Texas Roadhouse Management Corp.,d/b/a Texas Roadhouse. The complaint was filed in the United States District Court, District ofMassachusetts. The complaint alleged a failure to comply with Massachusetts wage laws specifically thatwe improperly shared pooled tips with ineligible employees. On September 5, 2012, the court approveda Settlement Agreement (the ‘‘Agreement’’) between the parties and dismissed the complaint. Under
F-25

Texas Roadhouse, Inc. and Subsidiaries
Notes to Consolidated Financial Statements (Continued)
(Tabular amounts in thousands, except share and per share data)
(12) Commitments and Contingencies (Continued)
the Agreement, we agreed to pay $5.0 million, which includes payment of the plaintiffs’ attorneys’ fees,payment of expenses to administer the settlement, and individual payments to resolve the claims ofservers employed in Massachusetts restaurants from January 18, 2005 through September 5, 2012, thedate of final court approval. As a result of the Agreement, as previously reported, we recorded a$5.0 million charge in the first quarter of 2012 which is included in general and administrative expensesin our consolidated statements of income and comprehensive income.
We are involved in various other claims and legal actions arising in the normal course of business.In the opinion of management, the ultimate disposition of these matters will not have a material effecton our consolidated financial position, results of operations or cash flows.
(13) Share-based Compensation
On May 16, 2013, the Company’s stockholders approved the Texas Roadhouse, Inc. 2013Long-Term Incentive Plan (the ‘‘Plan’’). The Plan provides for the granting of incentive andnon-qualified stock options to purchase shares of common stock, stock appreciation rights, and fullvalue awards, including restricted stock, restricted stock units (‘‘RSUs’’), deferred stock units,performance stock and performance stock units. As a result of the approval of the Plan, no futureawards will be made under the Texas Roadhouse, Inc. 2004 Equity Incentive Plan.
Beginning in 2008, we changed the method by which we provide share-based compensation to ouremployees by eliminating stock option grants and, instead, granting RSUs as a form of share-basedcompensation. An RSU is the conditional right to receive one share of common stock upon satisfactionof the vesting requirement.
The following table summarizes the share-based compensation recorded in the accompanyingconsolidated statements of income and comprehensive income:
Fiscal Year Ended
December 31, December 25, December 27,2013 2012 2011
Labor expense . . . . . . . . . . . . . . . . . . . . . . $ 5,439 $ 4,570 $ 3,905General and administrative expense . . . . . . . 9,301 8,623 6,620
Total share-based compensation expense . . . $14,740 $13,193 $10,525
Share-based compensation activity by type of grant as of December 31, 2013 and changes duringthe period then ended is presented below.
F-26

Texas Roadhouse, Inc. and Subsidiaries
Notes to Consolidated Financial Statements (Continued)
(Tabular amounts in thousands, except share and per share data)
(13) Share-based Compensation (Continued)
Summary Details for Share Options
Weighted-AverageRemaining
Weighted-Average Contractual AggregateShares Exercise Price Term (years) Intrinsic Value
Outstanding at December 25, 2012 . . . . . . 2,258,921 $13.24Granted . . . . . . . . . . . . . . . . . . . . . . . . . — —Forfeited . . . . . . . . . . . . . . . . . . . . . . . . . (41,624) 9.64Exercised . . . . . . . . . . . . . . . . . . . . . . . . (1,173,859) 12.90
Outstanding at December 31, 2013 . . . . . . 1,043,438 $13.77 2.25 $14,637
Exercisable at December 31, 2013 . . . . . . . 1,043,438 $13.77 2.25 $14,637
No stock options were granted during the fiscal years ended December 31, 2013, December 25,2012 and December 27, 2011.
The total intrinsic value of options exercised during the years ended December 31, 2013,December 25, 2012 and December 27, 2011 was $11.2 million, $8.7 million and $3.0 million,respectively. No stock options vested during the 53 week period ended December 31, 2013. The totalgrant date fair value of stock options vested during the years ended December 25, 2012 andDecember 27, 2011 was $0.2 million and $0.7 million, respectively.
For the years ended December 31, 2013, December 25, 2012 and December 27, 2011, cashreceived before tax withholdings from options exercised was $15.1 million, $10.7 million and$5.0 million, respectively. The excess tax benefit realized from tax deductions associated with optionsexercised for the years ended December 31, 2013, December 25, 2012 and December 27, 2011 was$4.9 million, $3.6 million and $2.3 million, respectively.
Summary Details for RSUs
Weighted-AverageWeighted-Average Remaining
Grant Date Contractual AggregateShares Fair Value Term (years) Intrinsic Value
Outstanding at December 25, 2012 . . . . . . . 1,803,514 $15.73Granted . . . . . . . . . . . . . . . . . . . . . . . . . . 531,355 23.57Forfeited . . . . . . . . . . . . . . . . . . . . . . . . . (59,561) 17.93Vested . . . . . . . . . . . . . . . . . . . . . . . . . . . (991,446) 15.98
Outstanding at December 31, 2013 . . . . . . . 1,283,862 $18.68 8.53 $35,691
As of December 31, 2013, with respect to unvested RSUs, there was $12.4 million of unrecognizedcompensation cost that is expected to be recognized over a weighted-average period of 1.3 years. Thevesting terms of the RSUs range from approximately 1.0 to 5.0 years. The total intrinsic value of RSUsvested during the years ended December 31, 2013, December 25, 2012 and December 27, 2011 was$21.3 million, $11.6 million and $11.0 million, respectively.
F-27

Texas Roadhouse, Inc. and Subsidiaries
Notes to Consolidated Financial Statements (Continued)
(Tabular amounts in thousands, except share and per share data)
(14) Fair Value Measurement
ASC 820, Fair Value Measurements and Disclosures (‘‘ASC 820’’), establishes a framework formeasuring fair value and expands disclosures about fair value measurements. ASC 820 establishes athree-level hierarchy, which requires an entity to maximize the use of observable inputs and minimizethe use of unobservable inputs in measuring fair value. The valuation hierarchy is based upon thetransparency of inputs to the valuation of an asset or liability on the measurement date.
Level 1 Inputs based on quoted prices in active markets for identical assets.
Level 2 Inputs other than quoted prices included within Level 1 that are observablefor the assets, either directly or indirectly.
Level 3 Inputs that are unobservable for the asset.
There were no transfers among levels within the fair value hierarchy during the year endedDecember 31, 2013.
The following table presents the fair values for our financial assets and liabilities measured on arecurring basis:
Fair Value Measurements
Level December 31, 2013 December 25, 2012
Interest rate swaps . . . . . . . . . . . . . . . . . . 2 $ (2,696) $(4,016)Deferred compensation plan—assets . . . . . 1 11,916 9,145Deferred compensation plan—liabilities . . . 1 (11,913) (9,160)
The fair values of our interest rate swaps were determined based on industry-standard valuationmodels. Such models project future cash flows and discount the future amounts to present value usingmarket-based observable inputs including interest rate curves. See note 16 for discussion of our interestrate swaps.
The Second Amended and Restated Deferred Compensation Plan of Texas RoadhouseManagement Corp., as amended, (the ‘‘Deferred Compensation Plan’’) is a nonqualified deferredcompensation plan which allows highly compensated employees to defer receipt of a portion of theircompensation and contribute such amounts to one or more investment funds held in a rabbi trust. Wereport the accounts of the rabbi trust in our consolidated financial statements. These investments areconsidered trading securities and are reported at fair value based on third-party broker statements. Therealized and unrealized holding gains and losses related to these investments, as well as the offsettingcompensation expense, are recorded in general and administrative expense in the consolidatedstatements of income and comprehensive income.
F-28
Texas Roadhouse, Inc. and Subsidiaries
Notes to Consolidated Financial Statements (Continued)
(Tabular amounts in thousands, except share and per share data)
(14) Fair Value Measurement (Continued)
The following table presents the fair values for our assets and liabilities measured on anonrecurring basis:
Total lossesFair Value Measurements
December 31, December 25, December 31, December 25,Level 2013 2012 2013 2012
Long-lived assets . . . . . . . . . . . . . . . . . . . 2 $1,203 $1,398 $195 $ —Goodwill and intangible assets . . . . . . . . . 3 — 740 — 465
Long-lived assets include land and building related to a previously closed restaurant and are valuedusing Level 2 inputs, primarily discussions with the broker regarding recent offers on the property.These assets are included in Property and equipment, net in our consolidated balance sheets. Cost tomarket and/or sell the assets are factored into the estimates of fair value.
At December 25, 2012, goodwill in the table above relates to one underperforming restaurant inwhich the carrying value of the associated goodwill was reduced to fair value, based on their historicalresults and anticipated future trends of operations. This charge is included in Impairment and closuresin our consolidated statements of income and comprehensive income. For further discussion ofimpairment charges, see note 15.
At December 31, 2013 and December 25, 2012, the fair values of cash and cash equivalents,accounts receivable and accounts payable approximated their carrying values based on the short-termnature of these instruments. The fair value of our revolving credit facility at December 31, 2013 andDecember 25, 2012 approximated its carrying value since it is a variable rate credit facility (Level 2).The fair value of our installment loans is estimated based on the current rates offered to us forinstruments of similar terms and maturities. The carrying amounts and related estimated fair values forour installment loans are as follows:
December 31, 2013 December 25, 2012
Carrying CarryingAmount Fair Value Amount Fair Value
Installment loans—Level 2 . . . . . . . . . . . . . $1,233 $1,434 $1,473 $1,752
(15) Impairment and Closure Costs
We recorded impairment charges of $0.4 million, $1.6 million and $1.2 million for the years ended2013, 2012, and 2011, respectively, related to goodwill and/or long-lived assets. These charges weremeasured and recognized following current accounting guidance which requires that the carrying valueof these assets be tested for impairment whenever circumstances indicate that impairment may exist, orat least annually in the case of goodwill. Refer to note 2 for further discussion of the methodology usedby us to test for long-lived asset and goodwill impairment.
Impairment charges in 2013 included $0.2 million related to the write-down of a buildingassociated with one restaurant closed in 2009. The write-down of the building was based on discussionswith the broker regarding recent offers on the property. The remaining $0.2 million in expenses wereongoing closure costs associated with one restaurant that was closed in 2012 and one restaurant thatwas closed in 2009.
F-29

Texas Roadhouse, Inc. and Subsidiaries
Notes to Consolidated Financial Statements (Continued)
(Tabular amounts in thousands, except share and per share data)
(15) Impairment and Closure Costs (Continued)
Impairment charges in 2012 included $0.5 million associated with the impairment of goodwill andintangible assets related to one restaurant and $0.9 million related to the write-down of building,equipment and furniture and fixtures associated with one restaurant closed in 2012. The goodwillimpairment charges in 2012 resulted from our annual testing which relies, in part, on the historicaltrends and anticipated future trends of operations of individual restaurants. The remaining $0.2 millionin expenses were ongoing closure costs associated with one restaurant that was closed in 2012 and onerestaurant that was closed in 2009.
Impairment charges in 2011 included $0.8 million associated with the impairment of goodwillrelated to one restaurant and the $0.4 million related to the write-down of land, building, equipmentand furniture and fixtures and ongoing closure costs associated with one restaurant closed in 2008. Thegoodwill impairment charges in 2011 resulted from our annual testing which relies, in part, on thehistorical trends and anticipated future trends of operations of individual restaurants.
(16) Derivative and Hedging Activities
We enter into derivative instruments for risk management purposes only, including derivativesdesignated as hedging instruments under FASB ASC 815, Derivatives and Hedging (‘‘ASC 815’’). Weuse interest rate-related derivative instruments to manage our exposure to fluctuations of interest rates.By using these instruments, we expose ourselves, from time to time, to credit risk and market risk.Credit risk is the failure of the counterparty to perform under the terms of the derivative contract.When the fair value of a derivative contract is positive, the counterparty owes us, which creates creditrisk for us. We attempt to minimize the credit risk by entering into transactions with high-qualitycounterparties whose credit rating is evaluated on a quarterly basis. Our counterparty in the interestrate swaps is JP Morgan Chase Bank, N.A. Market risk is the adverse effect on the value of a financialinstrument that results from a change in interest rates. We minimize market risk by establishing andmonitoring parameters that limit the types and degree of market risk that may be taken.
Interest Rate Swaps
On October 22, 2008, we entered into an interest rate swap, starting on November 7, 2008, with anotional amount of $25.0 million to hedge a portion of the cash flows of our variable rate borrowings.We have designated the interest rate swap as a cash flow hedge of our exposure to variability in futurecash flows attributable to interest payments on a $25.0 million tranche of floating rate debt borrowedunder our revolving credit facility. Under the terms of the swap, we pay a fixed rate of 3.83% on the$25.0 million notional amount and receive payments from the counterparty based on the 1-monthLIBOR rate for a term ending on November 7, 2015, effectively resulting in a fixed rate on the$25.0 million notional amount.
On January 7, 2009, we entered into an interest rate swap, starting on February 7, 2009, with anotional amount of $25.0 million to hedge a portion of the cash flows of our variable rate borrowings.We have designated the interest rate swap as a cash flow hedge of our exposure to variability in futurecash flows attributable to interest payments on a $25.0 million tranche of floating rate debt borrowedunder our revolving credit facility. Under the terms of the swap, we pay a fixed rate of 2.34% on the$25.0 million notional amount and receive payments from the counterparty based on the 1-month
F-30

Texas Roadhouse, Inc. and Subsidiaries
Notes to Consolidated Financial Statements (Continued)
(Tabular amounts in thousands, except share and per share data)
(16) Derivative and Hedging Activities (Continued)
LIBOR rate for a term ending on January 7, 2016, effectively resulting in a fixed rate on the$25.0 million notional amount.
We entered into the above interest rate swaps with the objective of eliminating the variability ofour interest cost that arises because of changes in the variable interest rate for the designated interestpayments. Changes in the fair value of the interest rate swaps will be reported as a component ofaccumulated other comprehensive income or loss. Additionally, amounts related to the yield adjustmentof the hedged interest payments are subsequently reclassified into interest expense in the same periodwhich the related interest affects earnings. We will reclassify any gain or loss from accumulated othercomprehensive income or loss, net of tax, in our consolidated balance sheet to interest expense in ourconsolidated statement of income and comprehensive income when the interest rate swap expires or atthe time we choose to terminate the swap. See note 14 for fair value discussion of these interest rateswaps.
The following table summarizes the fair value and presentation in the consolidated balance sheetsfor derivatives designated as hedging instruments under ASC 815:
Derivative Assets Derivative Liabilities
Balance Sheet December 31, December 25, December 31, December 25,Location 2013 2012 2013 2012
Derivative Contracts Designated asHedging Instruments underASC 815 . . . . . . . . . . . . . . . . . . (1)
Interest rate swaps . . . . . . . . . . . . $— $— $2,696 $4,016
Total Derivative Contracts . . . . . . . $— $— $2,696 $4,016
(1) Derivative assets and liabilities are included in fair value of derivative financial instruments on theconsolidated balance sheets.
The following table summarizes the effect of our interest rate swaps in the consolidated statementsof income and comprehensive income for the 53 and 52 weeks ended December 31, 2013 andDecember 25, 2012:
Fiscal Year Ended
December 31, December 25, December 27,2013 2012 2011
Gain (loss) recognized in AOCI, net of tax(effective portion) . . . . . . . . . . . . . . . . . . $809 $148 $(1,271)
Loss reclassified from AOCI to income(effective portion) . . . . . . . . . . . . . . . . . . $ 99 $124 $ 118
The loss reclassified from AOCI to income was recognized in interest expense on our consolidatedstatements of income and comprehensive income. For each of the fiscal periods ended December 31,2013, December 25, 2012 and December 27, 2011, we did not recognize any gain or loss due to hedge
F-31

Texas Roadhouse, Inc. and Subsidiaries
Notes to Consolidated Financial Statements (Continued)
(Tabular amounts in thousands, except share and per share data)
(16) Derivative and Hedging Activities (Continued)
ineffectiveness related to the derivative instruments in the consolidated statements of income andcomprehensive income.
(17) Related Party Transactions
The Longview, Texas restaurant, which was acquired by us in connection with the completion ofour initial public offering, leases the land and restaurant building from an entity controlled bySteven L. Ortiz, our Chief Operating Officer. The lease term is 15 years and will terminate inNovember 2014. The lease can be renewed for two additional terms of five years each. Rent isapproximately $19,000 per month. The lease can be terminated if the tenant fails to pay the rent on atimely basis, fails to maintain the insurance specified in the lease, fails to maintain the building orproperty or becomes insolvent. Total rent payments were approximately $0.2 million for each of theyears ended December 31, 2013, December 25, 2012 and December 27, 2011.
The Bossier City, Louisiana restaurant, of which Mr. Ortiz beneficially owns 66.0% and we own5.0%, leases the land and building from an entity owned by Mr. Ortiz. The lease term is 15 years andwill terminate on March 31, 2020. Rent is approximately $16,600 per month and escalates 10% eachfive years during the term. The next rent escalation is in the second quarter of 2015. The lease can beterminated if the tenant fails to pay rent on a timely basis, fails to maintain insurance, abandons theproperty or becomes insolvent. Total rent payments were approximately $0.2 million for each of theyears ended December 31, 2013, December 25, 2012 and December 27, 2011.
We have 15 franchise restaurants owned in whole or part by certain officers, directors andstockholders of the Company as of December 31, 2013, December 25, 2012 and December 27, 2011.These entities paid us fees of $2.4 million, $2.3 million and $2.2 million for the years endedDecember 31, 2013, December 25, 2012 and December 27, 2011, respectively. As discussed in note 12,we are contingently liable on leases which are related to three of these restaurants.
F-32

Texas Roadhouse, Inc. and Subsidiaries
Notes to Consolidated Financial Statements (Continued)
(Tabular amounts in thousands, except share and per share data)
(18) Selected Quarterly Financial Data (unaudited)
2013
First Second Third FourthQuarter Quarter Quarter Quarter Total
Revenue . . . . . . . . . . . . . . . . . . . . . . . . . . . $359,676 $352,119 $334,770 $376,020 $1,422,585Total costs and expenses . . . . . . . . . . . . . . . . $321,508 $322,322 $309,074 $349,966 $1,302,870Income from operations . . . . . . . . . . . . . . . . $ 38,168 $ 29,797 $ 25,696 $ 26,054 $ 119,715Net income attributable to Texas
Roadhouse, Inc. and subsidiaries . . . . . . . . $ 26,171 $ 19,963 $ 17,170 $ 17,119 $ 80,423Basic earnings per common share . . . . . . . . . $ 0.38 $ 0.29 $ 0.24 $ 0.24 $ 1.15Diluted earnings per common share . . . . . . . $ 0.37 $ 0.28 $ 0.24 $ 0.24 $ 1.13Cash dividends declared per share . . . . . . . . $ 0.12 $ 0.12 $ 0.12 $ 0.12 $ 0.48
2012
First Second Third FourthQuarter Quarter Quarter Quarter Total
Revenue . . . . . . . . . . . . . . . . . . . . . . . . . . . $324,869 $320,275 $308,656 $309,531 $1,263,331Total costs and expenses . . . . . . . . . . . . . . . . $295,467 $289,028 $280,922 $287,456 $1,152,873Income from operations . . . . . . . . . . . . . . . . $ 29,402 $ 31,247 $ 27,734 $ 22,075 $ 110,458Net income attributable to Texas
Roadhouse, Inc. and subsidiaries . . . . . . . . $ 18,869 $ 20,310 $ 18,067 $ 13,924 $ 71,170Basic earnings per common share . . . . . . . . . $ 0.27 $ 0.29 $ 0.26 $ 0.20 $ 1.02Diluted earnings per common share . . . . . . . $ 0.27 $ 0.28 $ 0.25 $ 0.19 $ 1.00Cash dividends declared per share . . . . . . . . $ 0.09 $ 0.09 $ 0.09 $ 0.19 $ 0.46
In the fourth quarter of 2013, we recorded a gain of $1.8 million ($1.2 million after-tax) associatedwith the sale of the Aspen Creek concept, including two restaurants. The fourth quarter of 2013 alsoincludes an estimated impact of $0.03 to $0.04 per share for the 53rd week. See Note 2 for furtherdiscussion.
In the first quarter of 2012, we recorded a charge of $5.0 million ($3.1 million after-tax) associatedwith a legal settlement. In the fourth quarter of 2012, we recorded closure costs of $1.1 million($0.7 million after-tax) primarily for fixed assets that were written off due to the closure of arestaurant. In addition, in the fourth quarter of 2012, we recorded a charge of $0.5 million ($0.3 millionafter-tax) associated with the impairment of goodwill related to one restaurant which the carrying valuewas reduced to fair value.
See note 15 for further discussion of impairment and closure costs.
F-33

(This page has been left blank intentionally.)

In 2013, we celebrated our 20th year the best way we
know how–by growing our brand, both domestically
and internationally. We opened 30 new restaurants
systemwide in 2013, generating growth for our people
and providing solid returns for our shareholders. We
were also named one of the Top 50 Best Places to Work!
By staying true to our proven operating model, we grew
both sales and traffic counts at our existing restaurants
for the fourth straight year. Thanks to our Managing
Partners, sales at existing restaurants increased 3.4% for
the year. This, combined with new restaurant openings
and a little help from having an extra operating week
in 2013, led to double digit growth in both revenues
and earnings. We also continued to return cash to our
shareholders through cash dividends and repurchasing
shares of our stock.
Our 2013 results included:
• Over $1.4 billion in revenue, 13% higher than 2012,
driven by an increase in operating weeks, resulting
from new restaurant openings as well as the additional
week in our fiscal year, along with sales growth at
existing restaurants.
• We opened 26 company restaurants and our franchise
partners opened four restaurants.
• Restaurant margins, as a percentage of restaurant
sales, decreased 52 basis points to 17.9%, primarily
due to 7% food cost inflation.
• Diluted earnings per share grew 13%.
• We paid $46.9 million in dividends.
• We repurchased 461,600 shares of our common stock.
Operationally, we remain committed to our partnership-
based operating model, serving made-from-scratch food,
our value position and growing our brand. Growth is
good for everyone associated with Texas Roadhouse as it
creates new jobs, new opportunities and good returns for
our shareholders.
Heading into 2014, we continue to feel very confident
about the opportunities for the Texas Roadhouse brand.
Domestically, we are targeting 25 to 30 new locations
for the year. On the international front, we expect our
franchise partners to open four to five locations in 2014
and we are excited about a newly signed agreement to
develop restaurants in Taiwan.
We anticipate that food cost inflation in 2014 will
be in the low single-digit range compared to the 6 to 7%
increases we have experienced each of the last
two years. We are optimistic that lower inflation this
year, combined with growth in sales, will help our
restaurants continue to make more money than they
did the year before.
Speaking of making money, we expect to once again
generate enough cash from operations to pay for the
development of new restaurants and the maintenance of
existing ones. As such, we expect to continue paying a
dividend, which our Board of Directors just increased by
25%. We also plan to continue buying back shares of our
own stock. Overall, we plan to maintain a conservative
balance sheet, which at the end of 2013 included $95
million of cash and $51 million of debt.
In conclusion, I want to thank our shareholders for your
continued support and trust in Texas Roadhouse. And, a
huge thanks to the 45,000 plus team members who make
Legendary Food, Legendary Service happen each and
every day, for each and every guest. Their commitment
and passion is second to none, and I am honored to be
their partner. Now, let’s kick some butt and have some
fun in 2014….after all, we are finally legal after turning
21 in February!
W. Kent Taylor
Founder & Chairman, Chief Executive Officer
Support Center (Corporate Office)6040 Dutchmans Lane • Louisville, KY 40205(800) TEX-ROAD (839-7623)
Annual MeetingThursday, May 22, 2014 9am ESTTexas Roadhouse Support Center6040 Dutchmans Lane • Louisville, KY 40205
Stock ListingTexas Roadhouse, Inc. Common Stock is listed on the NASDAQ Stock Exchange under the symbol TXRH.
Transfer AgentComputershareP.O. Box 30170 • College Station, TX 77842-3170Phone (800) 622-6757
Financial InquiriesFor additional financial documents and information, please visit our website at www.texasroadhouse.com. Please contact us by phone at (502) 515-7300 or by sending an e-mail to [email protected].
Media InquiriesFor all media requests please contact Travis Dosterat (502) 638-5457.
Independent AuditorsKPMG LLP400 W. Market Street, Suite 2600 • Louisville, KY 40202Phone (502) 587-0535
Gregory N. Moore Former Senior Vice President, ControllerYum! Brands, Inc.
James F. ParkerFormer Chief Executive Officer, Vice-Chairman of the BoardSouthwest Airlines Co.
James R. RamseyPresidentUniversity of Louisville
Kathleen M. WidmerExecutive Vice President, Chief Marketing OfficerElizabeth Arden, Inc.
James R. ZarleyChief Executive OfficerValueClick, Inc.
W. Kent TaylorFounder & Chairman, Chief Executive OfficerTexas Roadhouse, Inc.
0259_Cover.indd 2 3/18/14 10:35 AM

0259_Cover.indd 1 3/26/14 3:12 PM