04-07- atmospheric deposition to tampa bay and watershed
TRANSCRIPT

9/18/07 TBEP Technincal Report #04-07
1
CMAQ-UCD Atmospheric Deposition Estimates to Tampa Bay Watershed Sub-basins and Tampa Bay Waters
Robin L. Dennis† and Jeff Arnold| †Atmospheric Modeling Division, National Exposure Research Laboratory, U.S. Environmental Protection Agency
|National Center for Environmental Assessment, U.S. Environmental Protection Agency
Model-derived estimates of wet and dry atmospheric deposition of nitrogen (N) to the Tampa bay and its watershed sub-basins from the CMAQ-UCD model are provided here for use in the Tampa Bay TMDL implementation planning process. The deposition estimates are from the CMAQ-UCD model run at a 2km resolution over the Tampa and nearby regions to be able to adequately resolve the bay waters and watershed sub-basins. The 2km domain is nested within an 8km domain that covers all of Florida and most of South Carolina, Georgia and Alabama. A 32km outer domain covers the continental United States. The CMAQ-UCD hourly results are combined into a constructed annual average from 10 months of simulations that meet a criterion that each simulation month’s rainfall is close to the 15-year average rainfall across the watershed. The 10 months are April, May, July, August, September, October and November of 2002 and January, February and March of 2003. Units of the results are typically kg-N/ha or kg-N. However, totals for the bay and watershed are also presented in lbs-N. To facilitate the Tampa Bay Estuary Program (TBEP) TMDL planning process, CMAQ-UCD has been run in several modes to provide answers to TBEP questions aimed at developing an improved understanding of atmospheric deposition of N to Tampa bay and its watershed. Results are provided in several attachments, each attachment addressing a major question posed by the TBEP: Attachment A: Base 2002 estimates of atmospheric wet and dry deposition of oxidized- and reduced-nitrogen to bay segments
and watershed sub-basins Attachment B: Estimates of the relative contribution from local source emissions to oxidized-N deposition to bay segments and
watershed sub-basins, including the breakdown of these local source contributions into mobile, power plant and other sources Attachment C: Estimates of the reductions in N deposition to bay segments and watershed sub-basins associated with power
plant upgrades (to reduce emissions) to the Gannon and Big Bend power plants Attachment D: Estimates of the reductions in N deposition to bay segments and watershed sub-basins associated with the 2010
Clean Air Interstate Rule (CAIR) air emission reductions

9/18/07 TBEP Technincal Report #04-07
2
The emissions basically represent 2002 conditions. The mobile source and power plant emissions, representing approximately 75% of the emissions in the watershed are for 2002. The other sector emissions, representing 25% are for 2001, but with the slow economic growth during this period it appears reasonable to assume these 2001 emissions will be nearly equal to those for 2002. Deposition estimates are provided in terms of oxidized nitrogen (ox-N) and reduced nitrogen (red-N). Ox-N dry deposition is comprised of total-nitrate deposition (TNO3) (TNO3 = nitric acid (HNO3) + coarse and fine particulate nitrate) plus deposition of NOX (NOX = NO + NO2) and other oxides of nitrogen. The dry deposition rates take into account the fact that NOX and many of the other oxides of nitrogen are less water soluble than nitric acid. Red-N dry and wet deposition is comprised of ammonia gas and particulate ammonium deposition.
9/18/07 TBEP Technincal Report #04-07
3
Attachment A
Base 2002 CMAQ-UCD Estimates of Annual Atmospheric Wet and Dry Deposition of Oxidized- and Reduced-Nitrogen
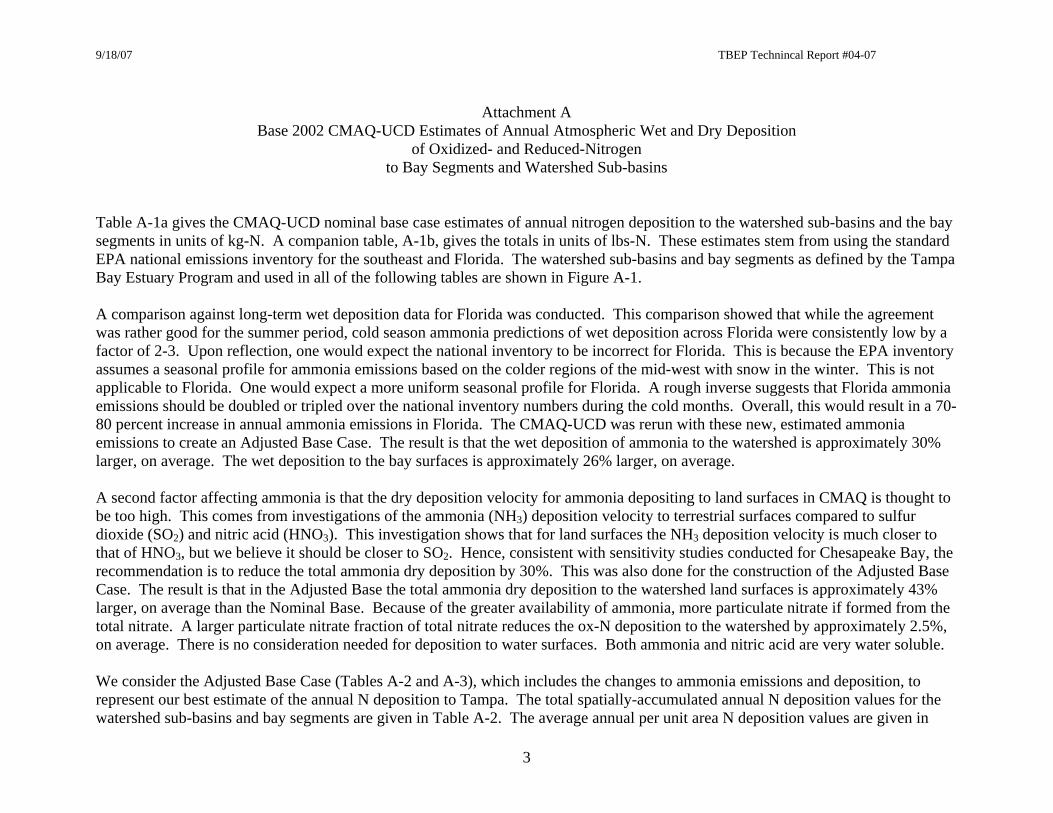
to Bay Segments and Watershed Sub-basins Table A-1a gives the CMAQ-UCD nominal base case estimates of annual nitrogen deposition to the watershed sub-basins and the bay segments in units of kg-N. A companion table, A-1b, gives the totals in units of lbs-N. These estimates stem from using the standard EPA national emissions inventory for the southeast and Florida. The watershed sub-basins and bay segments as defined by the Tampa Bay Estuary Program and used in all of the following tables are shown in Figure A-1. A comparison against long-term wet deposition data for Florida was conducted. This comparison showed that while the agreement was rather good for the summer period, cold season ammonia predictions of wet deposition across Florida were consistently low by a factor of 2-3. Upon reflection, one would expect the national inventory to be incorrect for Florida. This is because the EPA inventory assumes a seasonal profile for ammonia emissions based on the colder regions of the mid-west with snow in the winter. This is not applicable to Florida. One would expect a more uniform seasonal profile for Florida. A rough inverse suggests that Florida ammonia emissions should be doubled or tripled over the national inventory numbers during the cold months. Overall, this would result in a 70-80 percent increase in annual ammonia emissions in Florida. The CMAQ-UCD was rerun with these new, estimated ammonia emissions to create an Adjusted Base Case. The result is that the wet deposition of ammonia to the watershed is approximately 30% larger, on average. The wet deposition to the bay surfaces is approximately 26% larger, on average. A second factor affecting ammonia is that the dry deposition velocity for ammonia depositing to land surfaces in CMAQ is thought to be too high. This comes from investigations of the ammonia (NH3) deposition velocity to terrestrial surfaces compared to sulfur dioxide (SO2) and nitric acid (HNO3). This investigation shows that for land surfaces the NH3 deposition velocity is much closer to that of HNO3, but we believe it should be closer to SO2. Hence, consistent with sensitivity studies conducted for Chesapeake Bay, the recommendation is to reduce the total ammonia dry deposition by 30%. This was also done for the construction of the Adjusted Base Case. The result is that in the Adjusted Base the total ammonia dry deposition to the watershed land surfaces is approximately 43% larger, on average than the Nominal Base. Because of the greater availability of ammonia, more particulate nitrate if formed from the total nitrate. A larger particulate nitrate fraction of total nitrate reduces the ox-N deposition to the watershed by approximately 2.5%, on average. There is no consideration needed for deposition to water surfaces. Both ammonia and nitric acid are very water soluble. We consider the Adjusted Base Case (Tables A-2 and A-3), which includes the changes to ammonia emissions and deposition, to represent our best estimate of the annual N deposition to Tampa. The total spatially-accumulated annual N deposition values for the watershed sub-basins and bay segments are given in Table A-2. The average annual per unit area N deposition values are given in

9/18/07 TBEP Technincal Report #04-07
4
Table A-3. Figure A-2 shows the total nitrogen deposition (wet + dry), in kg-N/ha, for the Adjusted Base Case for the full 2-km CMAQ-UCD domain. Orlando is shown as well as Tampa. Tampa has noticeably more deposition than Orlando. Figure A-3 shows the total nitrogen deposition (wet + dry) for the Adjusted Base Case, in kg-N/ha, zoomed to a domain around Tampa that is larger than the Tampa watershed. A few points of interpretation for the Adjusted Base Case may be of interest. First, the dry deposition of NO and NO2 is very important, especially over the urban areas. The NO + NO2 dry deposition is comparable to or greater than the dry deposition of total-nitrate (HNO3 + particulate nitrate). For the urban areas it is greater and the rural areas it is smaller. The total-nitrate dry deposition increases on the order of 50-100% across the urban areas compared to the rural areas. However, the NO + NO2 dry deposition more than doubles across the urban areas compared to the suburban/rural areas. Thus, there is a noticeable increase in dry oxidized-N deposition from rural to urban areas and that increase is enhanced by the local deposition of NO + NO2. Second, dry oxidized-N deposition is greater than dry reduced-N deposition, a factor of 1.8 larger, mostly because of the influence of the local deposition of NO + NO2. Thus, 64% of dry N-deposition is from dry oxidized-N and 36% is from dry reduced-N. Third, dry deposition of N is greater than wet deposition of N for the watershed. For oxidized-N dry is roughly 4 (3.7) times wet. For reduced-N dry is roughly 2 (2.1) times wet. Thus, the old rule of thumb that dry is approximately equal to wet deposition is not true for urban areas like Tampa. It may be approximately correct for some rural areas if only total-nitrate and total-ammonia deposition is considered. It is not true, even there, when deposition from other forms of oxidized nitrogen are included, which they should be. Fourth, dry deposition to the watershed is greater than dry deposition to the bay waters. This is because there is less turbulence over the water, slowing down the ability of gases and particles to get close to the water’s surface and get incorporated into it. Wet deposition is approximately the same over water and land surfaces. Finally, in terms of the two forms of nitrogen, oxidized-N deposition is greater than reduced-N deposition by a moderate amount. Total deposition of oxidized-N is approximately 56% higher than reduced-N deposition on average for the watershed. Total deposition of oxidized-N is approximately 39% higher than reduced-N deposition on average for the bay waters. Most of the difference is the result of differences in dry deposition. These percentages vary among the different sub-basins. Uncertainty 1: A bias in a CMAQ dry deposition computation was uncovered at the end of this study. CMAQ developers discovered the NO and NO2 dry deposition parameterizations were missing a component, making the CMAQ estimate of NO and NO2 dry deposition to vegetative surfaces up to a factor of two too high. The PAN deposition was updated at the same time, increasing its rate of deposition. Also, the deposition exchange with water surfaces was updated, reducing the rate of NO and NO2 dry deposition to water. There is no error for dry deposition to impervious surfaces. The NO and NO2 dry deposition formulation errors introduce a bias in the tabulated results for the oxidized-N deposition estimates. A subset of 4 months was used to develop a “best” estimate of

9/18/07 TBEP Technincal Report #04-07
5
the bias in the annual deposition numbers. As a result, the oxidized-N dry deposition in Tables A-1, A-2 and A-3 is approximately 17% and 24% too high for land and water, respectively. The Total-N in Table A-1 is approximately 9.8% and 11.4% too high for land and water total accumulated deposition, respectively. The Total-N in Tables A-2 and A-3 is approximately 8.1% and 7.5% too high for land and water total deposition, respectively. The bias in Total-N in Tables A-2 and A-3 is largest for the watershed sub-basins with dense urban emissions. The Total-N numbers for Coastal Old Tampa Bay, Coastal Hillsborough Bay, Coastal Middle Tampa Bay, and Boca Ciega Bay are 14.8%, 12.9%, 12.2%, and 13.0% too high, respectively. Uncertainty 2: There are several sources of uncertainty affecting the deposition estimates from the CMAQ-UCD: meteorological and emissions input uncertainties (especially NOX and NH3 emissions) and model process description uncertainties. The evaluation of the meteorology for Tampa suggests the meteorological model is performing in a quantified bias and error range typical of performance for the rest of the US. The evaluation of CMAQ-UCD against the May 2002 data suggests it too is functioning in a fairly typical manner, similar to evaluations performed for other areas in the eastern US. The seasonal and annual wet deposition comparisons for Florida sites suggest CMAQ-UCD is functioning in a manner typical of its performance for the rest of the eastern US. Thus, uncertainties for Tampa are expected to be of the same order as uncertainties observed for the eastern US in CMAQ evaluation studies. For annual results, wet deposition can have uncertainties at any one location of ±50% to ±100%. Ambient concentrations at any one location can have uncertainties of ±25% to ±50%. The uncertainties in the dry deposition parameterizations and representation of turbulent mixing will add to and inflate these ambient concentration uncertainty estimates. Emissions uncertainties are judged to be the order of ±40% to ±50%. The uncertainties in meteorology, emissions, and model process descriptions are by and large independent. Thus, the uncertainty of the CMAQ-UCD estimates of total deposition is expected to be ±50% and up to a factor of 2 at any one location.

9/18/07 TBEP Technincal Report #04-07
6
Table A-1a. Nominal Base Case: Accumulated Annual Deposition of N Across Each Region’s Area
DryOx-N (kg-N)
DryRed-N (kg-N)
Dry-N (kg-N)
WetOx-N (kg-N)
WetRed-N (kg-N)
Wet-N (kg-N)
TotOx-N (kg-N)
TotRed-N (kg-N)
Total-N (kg-N)
Watershed Sub-basins Coastal Old Tampa Bay 518,408 119,509 637,917 104,787 64,284 169,071 623,195 183,793 806,988 Alafia River 557,161 261,505 818,666 168,052 133,097 301,149 725,212 394,602 1,119,815 Hillsborough River 1,070,093 339,766 1,409,860 275,783 180,851 456,634 1,345,877 520,616 1,866,494 Coastal Hillsborough Bay 293,905 135,390 429,295 58,405 49,037 107,442 352,310 184,427 536,737 Little Manatee River 270,510 189,341 459,851 88,358 91,702 180,060 358,868 281,042 639,911 Coastal Middle Tampa Bay 110,613 37,266 147,879 23,118 15,907 39,024 133,731 53,173 186,903 Coastal Lower Tampa Bay 37,676 11,959 49,635 10,447 8,401 18,848 48,122 20,360 68,482 Terra Ceia Watershed 7,218 1,693 8,912 1,776 1,271 3,047 8,994 2,964 11,959 Manatee River Watershed 373,931 142,827 516,758 131,706 105,816 237,522 505,637 248,643 754,280 Boca Ciega Bay 154,313 43,048 197,361 31,078 18,787 49,865 185,391 61,835 247,226 Total Watershed 3,393,829 1,282,304 4,676,133 893,510 669,152 1,562,661 4,287,338 1,951,456 6,238,974 Tampa Bay Segments Old Tampa Bay 47,123 12,045 59,168 35,621 20,973 56,593 82,744 33,018 115,762 Hillsborough Bay 26,768 8,806 35,574 13,652 10,601 24,253 40,420 19,407 59,827 Middle Tampa Bay 38,276 15,960 54,237 49,152 32,755 81,907 87,429 48,715 136,144 Lower Tampa Bay 31,163 7,627 38,790 38,207 20,012 58,219 69,371 27,639 97,010 Boca Ciega Bay 14,725 4,205 18,929 9,031 4,686 13,717 23,756 8,890 32,646 Terra Ceia Bay 2,109 431 2,540 711 438 1,149 2,820 869 3,689 Manatee River 13,236 3,334 16,570 3,663 2,459 6,122 16,898 5,793 22,692 Total Bay 173,400 52,408 225,808 150,037 91,924 241,961 323,437 144,332 467,769
Table A-1b. Nominal Base Case: Accumulated Deposition Totals in Pounds Nitrogen
DryOx-N (lbs-N)
DryRed-N (lbs-N)
Dry-N (lbs-N)
WetOx-N (lbs-N)
WetRed-N (lbs-N)
Wet-N (lbs-N)
TotOx-N (lbs-N)
TotRed-N (lbs-N)
Total-N (lbs-N)
Total Watershed 7,466,423 2,821,069 10,287,492 1,965,721 1,472,134 3,437,855 9,432,144 4,293,203 13,725,347 Total Bay 381,480 115,298 496,778 330,082 202,232 532,314 711,562 317,530 1,029,092

9/18/07 TBEP Technincal Report #04-07
7
Figure A-1. Tampa Bay Watershed Sub-basins and Bay Segments

9/18/07 TBEP Technincal Report #04-07
8
Table A-2a. Adjusted Base Case: Accumulated Annual Deposition of N Across Each Region’s Area
DryOx-N (kg-N)
DryRed-N (kg-N)
Dry-N (kg-N)
WetOx-N (kg-N)
WetRed-N (kg-N)
Wet-N (kg-N)
TotOx-N (kg-N)
TotRed-N (kg-N)
Total-N (kg-N)
Watershed Sub-basins Coastal Old Tampa Bay 509,566 173,930 683,496 104,885 83,501 188,386 614,451 257,431 871,882 Alafia River 541,968 371,419 913,387 168,126 176,234 344,360 710,094 547,653 1,257,747 Hillsborough River 1,048,172 486,852 1,535,023 276,022 245,462 521,484 1,324,193 732,314 2,056,507 Coastal Hillsborough Bay 287,339 187,262 474,601 58,428 64,579 123,007 345,767 251,841 597,608 Little Manatee River 259,960 263,433 523,393 88,397 115,997 204,394 348,357 379,429 727,787 Coastal Middle Tampa Bay 107,601 53,931 161,532 23,124 20,303 43,427 130,725 74,234 204,959 Coastal Lower Tampa Bay 36,644 17,596 54,240 10,447 10,287 20,735 47,091 27,883 74,974 Terra Ceia Watershed 7,039 2,562 9,602 1,776 1,560 3,336 8,815 4,122 12,938 Manatee River Watershed 361,563 210,425 571,988 131,751 129,770 261,521 493,314 340,195 833,509 Boca Ciega Bay 150,333 64,293 214,626 31,091 23,835 54,926 181,424 88,128 269,552 Total Watershed 3,310,185 1,831,703 5,141,888 894,046 871,528 1,765,574 4,204,231 2,703,231 6,907,462 Tampa Bay Segments Old Tampa Bay 46,093 26,422 72,515 35,632 26,646 62,279 81,725 53,068 134,793 Hillsborough Bay 26,119 19,230 45,349 13,656 14,056 27,712 39,775 33,286 73,060 Middle Tampa Bay 37,128 32,934 70,062 49,164 41,124 90,287 86,292 74,057 160,349 Lower Tampa Bay 30,389 17,331 47,720 38,219 24,772 62,991 68,608 42,103 110,711 Boca Ciega Bay 14,322 9,303 23,625 9,035 5,858 14,893 23,356 15,162 38,518 Terra Ceia Bay 2,045 948 2,992 711 545 1,256 2,755 1,493 4,248 Manatee River 12,864 7,052 19,916 3,663 3,053 6,715 16,527 10,104 26,631 Total Bay 168,959 113,219 282,179 150,079 116,054 266,132 319,038 229,273 548,311
Table A-2b. Adjusted Base Case: Accumulated Deposition Totals in Pounds Nitrogen
DryOx-N (lbs-N)
DryRed-N (lbs-N)
Dry-N (lbs-N)
WetOx-N (lbs-N)
WetRed-N (lbs-N)
Wet-N (lbs-N)
TotOx-N (lbs-N)
TotRed-N (lbs-N)
Total-N (lbs-N)
Total Watershed 7,282,408 4,029,747 11,312,155 1,966,901 1,917,361 3,884,262 9,249,309 5,947,108 15,196,417 Total Bay 371,711 249,082 620,793 330,174 255,318 585,491 701,884 504,400 1,206,285
9/18/07 TBEP Technincal Report #04-07
9
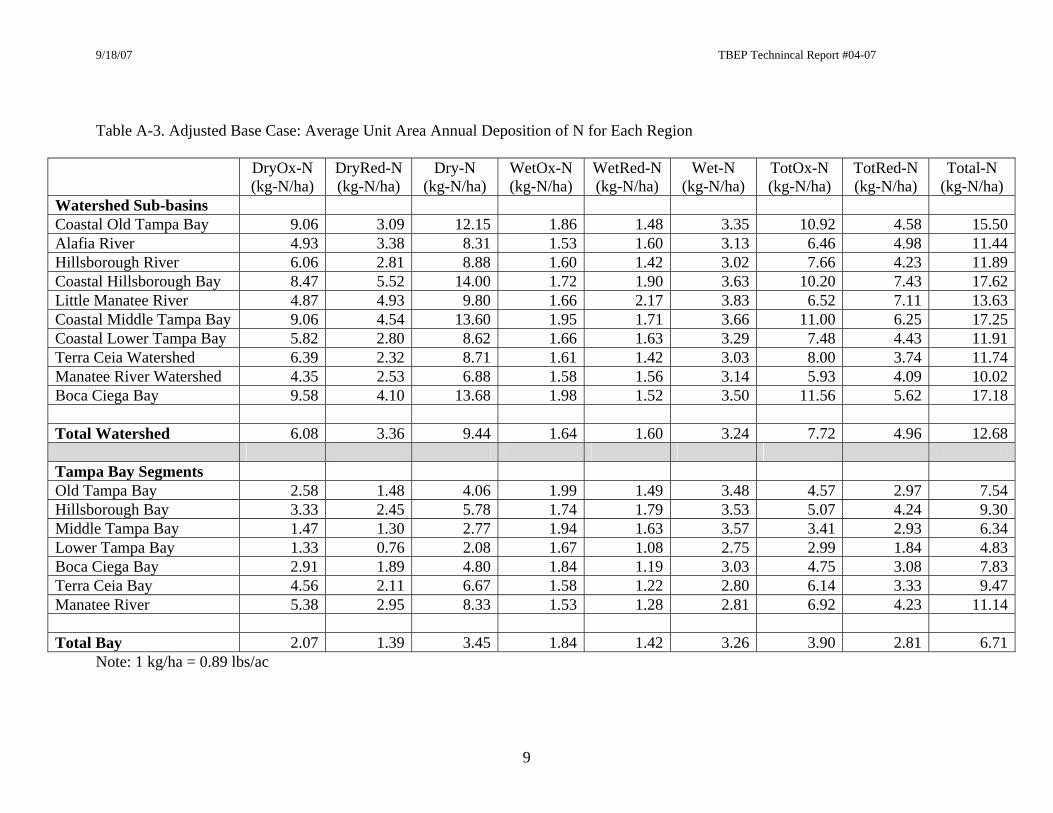
Table A-3. Adjusted Base Case: Average Unit Area Annual Deposition of N for Each Region
DryOx-N (kg-N/ha)
DryRed-N (kg-N/ha)
Dry-N (kg-N/ha)
WetOx-N (kg-N/ha)
WetRed-N (kg-N/ha)
Wet-N (kg-N/ha)
TotOx-N (kg-N/ha)
TotRed-N (kg-N/ha)
Total-N (kg-N/ha)
Watershed Sub-basins Coastal Old Tampa Bay 9.06 3.09 12.15 1.86 1.48 3.35 10.92 4.58 15.50 Alafia River 4.93 3.38 8.31 1.53 1.60 3.13 6.46 4.98 11.44 Hillsborough River 6.06 2.81 8.88 1.60 1.42 3.02 7.66 4.23 11.89 Coastal Hillsborough Bay 8.47 5.52 14.00 1.72 1.90 3.63 10.20 7.43 17.62 Little Manatee River 4.87 4.93 9.80 1.66 2.17 3.83 6.52 7.11 13.63 Coastal Middle Tampa Bay 9.06 4.54 13.60 1.95 1.71 3.66 11.00 6.25 17.25 Coastal Lower Tampa Bay 5.82 2.80 8.62 1.66 1.63 3.29 7.48 4.43 11.91 Terra Ceia Watershed 6.39 2.32 8.71 1.61 1.42 3.03 8.00 3.74 11.74 Manatee River Watershed 4.35 2.53 6.88 1.58 1.56 3.14 5.93 4.09 10.02 Boca Ciega Bay 9.58 4.10 13.68 1.98 1.52 3.50 11.56 5.62 17.18 Total Watershed 6.08 3.36 9.44 1.64 1.60 3.24 7.72 4.96 12.68 Tampa Bay Segments Old Tampa Bay 2.58 1.48 4.06 1.99 1.49 3.48 4.57 2.97 7.54 Hillsborough Bay 3.33 2.45 5.78 1.74 1.79 3.53 5.07 4.24 9.30 Middle Tampa Bay 1.47 1.30 2.77 1.94 1.63 3.57 3.41 2.93 6.34 Lower Tampa Bay 1.33 0.76 2.08 1.67 1.08 2.75 2.99 1.84 4.83 Boca Ciega Bay 2.91 1.89 4.80 1.84 1.19 3.03 4.75 3.08 7.83 Terra Ceia Bay 4.56 2.11 6.67 1.58 1.22 2.80 6.14 3.33 9.47 Manatee River 5.38 2.95 8.33 1.53 1.28 2.81 6.92 4.23 11.14 Total Bay 2.07 1.39 3.45 1.84 1.42 3.26 3.90 2.81 6.71
Note: 1 kg/ha = 0.89 lbs/ac

9/18/07 TBEP Technincal Report #04-07
10
Figure A-2. Total nitrogen deposition (wet + dry), in kg-N/ha, estimated by CMAQ-UCD for the Adjusted Base Case for the full 2-km CMAQ-UCD domain. Orlando is shown as well as Tampa. The nitrogen deposition is nominally for 2002 emission rates.
CMAQ-UCD Annual Total-N (Wet + Dry) Deposition (kg-N/ha)for the 2002 Adjusted Base Case
CMAQ-UCD Annual Total-N (Wet + Dry) Deposition (kg-N/ha)for the 2002 Adjusted Base Case

9/18/07 TBEP Technincal Report #04-07
11
Figure A-3. Total nitrogen deposition (wet + dry), in kg-N/ha, estimated by CMAQ-UCD for the Adjusted Base Case for the 2-km CMAQ-UCD domain surrounding Tampa. The nitrogen deposition is nominally for 2002 emission rates.
CMAQ-UCD Annual Total-N (Wet + Dry) Deposition (kg-N/ha)for the 2002 Adjusted Base Case
CMAQ-UCD Annual Total-N (Wet + Dry) Deposition (kg-N/ha)for the 2002 Adjusted Base Case

9/18/07 TBEP Technincal Report #04-07
12
Attachment B CMAQ-UCD Estimates of the Relative Contribution
from Local Watershed Sources of NOX Emissions to Annual Oxidized-N (Ox-N) Deposition Across the Watershed Table B-1. Relative Responsibility of all NOX Emissions within the Watershed for Annual Ox-N Deposition across the Watershed
All Watershed NOX Emissions
DryOx-N (%)
WetOx-N (%)
TotalOx-N (%)
Watershed Sub-basins Coastal Old Tampa Bay 63.9 44.6 60.7Alafia River 44.3 33.7 41.9Hillsborough River 48.2 36.3 45.8Coastal Hillsborough Bay 69.5 37.8 64.3Little Manatee River 50.1 33.4 46.0Coastal Middle Tampa Bay 66.2 41.0 61.9Coastal Lower Tampa Bay 57.9 35.3 53.0Terra Ceia Watershed 58.1 36.0 53.7Manatee River Watershed 44.1 32.7 41.1Boca Ciega Bay 64.5 44.0 61.0 Total Watershed 53.0 36.4 49.5 Tampa Bay Segments Old Tampa Bay 47.1 45.0 46.2Hillsborough Bay 63.3 36.3 54.1Middle Tampa Bay 32.0 40.2 36.6Lower Tampa Bay 23.8 41.1 33.3Boca Ciega Bay 47.4 43.6 46.0Terra Ceia Bay 41.4 38.0 40.6Manatee River 48.7 36.2 46.0 Total Bay 42.2 41.3 41.8

9/18/07 TBEP Technincal Report #04-07
13
Table B-1 gives the estimates of the relative contribution of all of the NOX emissions from within the watershed boundaries to dry, wet and total oxidized-nitrogen deposition to the watershed sub-basins and bay segments. Figure B-1 shows the relative contribution of watershed NOX emissions to total oxidized-nitrogen deposition across the Tampa region by 2-km grid cell. Figure B-2 shows the relative contribution of watershed NOX emissions to dry oxidized-nitrogen deposition across the Tampa region by 2-km grid cell. As shown in Table B-1, local, watershed NOX emissions are responsible for half of the oxidized-nitrogen deposition to the watershed (approximately 50%). The degree of responsibility varies across space, being more like 42% in the rural areas and 61-64% in the urbanized areas (see for example Coastal Hillsborough Bay’s 64%). The strong degree of spatial variation is illustrated in Figures B-1 and B-2. As shown in the figures, the impact of the Tampa watershed NOX emissions is highly localized to the Tampa region. Also, in the urban core the degree of responsibility of local NOX emissions to oxidized-nitrogen deposition reaches more than 80%. The range of percent responsibility would be even larger for a finer grid size. The CMAQ-UCD estimates may represent fairly well the average impact of local emissions and the spatial variability of that impact across the Tampa watershed. The contribution of local, watershed NOX emissions to oxidized-nitrogen deposition is significantly higher for dry deposition than for wet deposition. This is evident in the difference between Figures B-1 and B-2. Wet deposition has more of a regional character. For urban areas dry deposition percent responsibility is a bit less than double that for wet deposition (for example, 70% versus 38% for Coastal Hillsborough Bay). For rural areas (like the Manatee River Watershed) dry deposition percent responsibility is a bit more than one-third-again as high as wet deposition. On average over the watershed the local, watershed NOX emission-related dry deposition responsibility (53%) is about 26% higher than the responsibility for wet deposition (42%). As shown in Table B-1, local, watershed NOX emissions are responsible for about two-fifths of the total oxidized-nitrogen deposition to the bay waters (approximately 42%). Table B-1 indicates that spatial variation in the relative percent contribution of local emissions to deposition to the watershed and bay waters is driven by dry deposition (see Figure B-2). For the watershed the percent contribution of dry deposition varies from 44-70%, with an average of 53%. For the bay segments the percent contribution of dry deposition varies from 24-63%, with an average of 42%. On the other hand, the relative % contribution of local watershed NOX emissions to wet deposition is not very variable. For the watershed it varies from 33-44%. For the bay segments it varies between 36% and 45%.

9/18/07 TBEP Technincal Report #04-07
14
Figure B-1. Fraction of the Annual Total, Wet plus Dry, Oxidized-Nitrogen Deposition that CMAQ-UCD Predicts is Explained by the Watershed NOX Emissions.
The Fraction of Total (Wet + Dry) Oxidized-N DepositionExplained by Watershed NOX emissions
The Fraction of Total (Wet + Dry) Oxidized-N DepositionExplained by Watershed NOX emissions

9/18/07 TBEP Technincal Report #04-07
15
Figure B-2. Fraction of the Annual Dry Oxidized-Nitrogen Deposition that CMAQ-UCD Predicts is Explained by the Watershed NOX Emissions.
The Fraction of Dry Oxidized-N DepositionExplained by Watershed NOX emissions
The Fraction of Dry Oxidized-N DepositionExplained by Watershed NOX emissions

9/18/07 TBEP Technincal Report #04-07
16
Table B-2 gives the absolute and relative contribution to the total NOX emissions of the NOX emissions from the three “sectors” chosen for study. The NOX emissions from Hillsborough, Manatee and Pinellas Counties are used to approximate the emissions from the watershed. Approximately half of the emissions are associated with electric generating units. Mobile source and Other NOX emissions equally divide responsibility for the other half of the emissions. Table B-2
2002 NOX Emissions for Hillsborough, Manatee and Pinellas Counties To Approximate Emissions from Watershed
Mobile Source NOX
(tons/yr)
Power Plant NOX
(tons/yr)
Other NOX
(tons/yr)
Total NOX
(tons/yr) 3-County Total 35,569 72,105 35,158 144,098 Percent of Total 24.7% 50.0% 25.1%

9/18/07 TBEP Technincal Report #04-07
17
Table B-3 gives the relative contribution of the NOX emissions from the three sectors to the oxidized-N deposition. The four sets of numbers are independent calculations. The sum of Mobile, Power Plants and Other compared to Total is a measure of the internal consistency of the model predictions. All but three sets are within 1%. Two are within 2% and one within 3%. This is excellent. Table B-3. Relative Responsibility of a Three-Sector Subdivision of NOX Emissions within the Watershed to Annual Ox-N Deposition
Percent Contribution of Watershed NOX Emissions to Ox-N Deposition by Source Category
Mobile (%)
PowerPlants (%)
Other (%)
TotalOx-N (%)
Watershed Sub-basins Table B-1 Coastal Old Tampa Bay 30.2 12.1 17.9 60.7Alafia River 16.9 13.9 10.5 41.9Hillsborough River 24.3 11.0 9.9 45.8Coastal Hillsborough Bay 29.0 18.7 16.1 64.3Little Manatee River 18.5 17.7 9.3 46.0Coastal Middle Tampa Bay 26.6 16.1 18.9 61.9Coastal Lower Tampa Bay 24.2 16.7 11.7 53.0Terra Ceia Watershed 27.0 14.1 12.2 53.7Manatee River Watershed 17.0 14.3 9.4 41.1Boca Ciega Bay 30.4 11.5 18.8 61.0 Total Watershed 23.3 13.5 12.3 49.5 Tampa Bay Segments Old Tampa Bay 17.5 13.9 13.9 46.2Hillsborough Bay 16.9 15.6 21.0 54.1Middle Tampa Bay 11.1 13.7 10.8 36.6Lower Tampa Bay 9.6 13.6 9.1 33.3Boca Ciega Bay 19.0 13.3 12.9 46.0Terra Ceia Bay 17.6 11.7 10.8 40.6Manatee River 21.0 11.4 13.1 46.0 Total Bay 14.3 13.8 12.8 41.8

9/18/07 TBEP Technincal Report #04-07
18
It is immediately apparent that the NOX emission fractions are not a predictor of the oxidized-N deposition fractions. As shown in Table B-2 the power plants contribute 50% of the watershed NOX emissions, double the mobile source contribution of 25%. However, as shown in Table B-3, for deposition to the watershed the roles of power plants and mobile sources are nearly reversed in terms of oxidized-nitrogen deposition. Mobile sources are responsible for almost twice as much deposition (23%) as power plants (13.5%). This is because power plants, with their stacks, are putting the emissions higher up in the atmosphere where they can transport and mix and dilute; thus, contributing more to long range transport and regional deposition and less to local deposition. The mobile source emissions are close to the ground, allowing them to locally deposit more effectively. The Other sector NOX emissions are responsible for about the same fraction of deposition as power plants. The Other sector NOX emissions do not contribute the same amount of oxidized-nitrogen deposition per unit of emissions as mobile sources, but they contribute more oxidized-nitrogen deposition per unit of emissions than do power plants. The Other sector emissions effectiveness is in the middle between mobile sources and power plants. This may be related to their being less spatially concentrated and to their proximity to sources of ammonia around the watershed. The CMAQ-UCD results are that the mobile sources have by far the largest responsibility for oxidized-nitrogen deposition per unit of NOX emissions. We have confirmed that the CMAQ-UCD results are internally consistent. For deposition to the bay segments (water surface), the three source categories contribute about equally to the oxidized-nitrogen deposition. Here the deposition effectiveness of the Other source emissions catches up with the mobile source emissions. To the water surface, both are twice as effective at depositing oxidized nitrogen per unit of NOX emissions as are emissions of power plants. The relative responsibilities of the mobile source NOX emissions, the power plant emissions and the other sector emissions to the wet and dry components of the oxidized-N deposition to the watershed sub-basins and bay segments are given in Tables B-4, B-5, and B-6, respectively. As shown in Table B-4, the dry oxidized-nitrogen deposition contribution from mobile sources to the watershed deposition is several times larger than the wet oxidized-nitrogen deposition. On average, dry is more than 3 times higher than wet (3.5 times). This is because the NOX deposition is a very important component of mobile source dry deposition and wet deposition only involves total nitrate (= nitric acid + particulate nitrate). Half of the responsibility of oxidized-nitrogen dry deposition from local sources is attributable to mobile source NOX emissions. But mobile sources are responsible for less than a quarter of the oxidized nitrogen wet deposition associated with local, watershed sources. The same pattern holds for oxidized-nitrogen deposition to the bay segments. As shown in Table B-5, the wet oxidized-nitrogen deposition contribution to the watershed deposition from power plants is larger than the dry oxidized-nitrogen deposition, on average 34% larger. This is because the power plant emissions are emitted above the surface and have to be mixed downward (with dilution) to dry deposit. The power plants are responsible for a bit under a quarter of the locally associated dry deposition to the watershed, but almost half of the locally associated wet deposition.

9/18/07 TBEP Technincal Report #04-07
19
Table B-4. Relative Responsibility of Mobile Source NOX Emissions within the Watershed to Annual Watershed Ox-N Deposition
Watershed Mobile Source NOX Emissions
DryOx-N (%)
WetOx-N (%)
TotalOx-N (%)
Watershed Sub-basins Coastal Old Tampa Bay 34.2 10.7 30.2Alafia River 20.0 6.5 16.9Hillsborough River 28.6 7.8 24.3Coastal Hillsborough Bay 33.2 8.1 29.0Little Manatee River 22.3 6.9 18.5Coastal Middle Tampa Bay 30.3 8.6 26.6Coastal Lower Tampa Bay 28.8 7.8 24.2Terra Ceia Watershed 31.7 8.2 27.0Manatee River Watershed 20.5 7.0 17.0Boca Ciega Bay 34.6 9.4 30.4 Total Watershed 27.4 7.8 23.3 Tampa Bay Segments Old Tampa Bay 23.5 9.6 17.5Hillsborough Bay 21.4 8.2 16.9Middle Tampa Bay 14.4 8.6 11.1Lower Tampa Bay 10.9 8.6 9.6Boca Ciega Bay 25.2 8.9 19.0Terra Ceia Bay 20.5 9.1 17.6Manatee River 24.2 9.0 21.0 Total Bay 19.1 8.8 14.3

9/18/07 TBEP Technincal Report #04-07
20
Table B-5. Relative Responsibility of Power Plant NOX Emissions within the Watershed to Annual Watershed Ox-N Deposition
Watershed Power Plant NOX Emissions
DryOx-N (%)
WetOx-N (%)
TotalOx-N (%)
Watershed Sub-basins Coastal Old Tampa Bay 10.8 18.6 12.1Alafia River 13.2 16.4 13.9Hillsborough River 9.4 16.9 11.0Coastal Hillsborough Bay 19.0 17.6 18.7Little Manatee River 18.2 16.0 17.7Coastal Middle Tampa Bay 15.5 18.9 16.1Coastal Lower Tampa Bay 16.8 16.4 16.7Terra Ceia Watershed 13.6 16.2 14.1Manatee River Watershed 13.8 15.4 14.3Boca Ciega Bay 9.7 20.6 11.5 Total Watershed 12.6 16.9 13.5 Tampa Bay Segments Old Tampa Bay 9.3 20.1 13.9Hillsborough Bay 15.4 15.9 15.6Middle Tampa Bay 9.1 17.2 13.7Lower Tampa Bay 6.9 19.2 13.6Boca Ciega Bay 8.4 21.4 13.3Terra Ceia Bay 10.2 16.1 11.7Manatee River 10.4 15.3 11.4 Total Bay 9.8 18.5 13.8

9/18/07 TBEP Technincal Report #04-07
21
Table B-6. Relative Responsibility of Other NOX Emissions within the Watershed to Annual Watershed Ox-N Deposition
Watershed Other NOX Emissions
DryOx-N
(%) WetOx-N
(%) TotalOx-N
(%) Watershed Sub-basins Coastal Old Tampa Bay 18.8 13.5 17.9Alafia River 11.0 9.1 10.5Hillsborough River 10.0 9.7 9.9Coastal Hillsborough Bay 17.2 10.3 16.1Little Manatee River 9.4 8.9 9.3Coastal Middle Tampa Bay 20.3 11.9 18.9Coastal Lower Tampa Bay 12.2 9.7 11.7Terra Ceia Watershed 12.7 10.2 12.2Manatee River Watershed 9.5 9.0 9.4Boca Ciega Bay 20.0 12.3 18.8 Total Watershed 12.9 10.0 12.3 Tampa Bay Segments Old Tampa Bay 14.1 13.6 13.9Hillsborough Bay 26.3 10.6 21.0Middle Tampa Bay 8.3 12.8 10.8Lower Tampa Bay 5.7 11.9 9.1Boca Ciega Bay 13.5 11.9 12.9Terra Ceia Bay 10.6 11.5 10.8Manatee River 13.8 10.7 13.1 Total Bay 13.1 12.4 12.8

9/18/07 TBEP Technincal Report #04-07
22
As shown in Table B-5, the wet oxidized-nitrogen deposition relative contribution to the bay segment (water surface) deposition from power plants is nearly twice the dry oxidized-nitrogen deposition. Not quite a quarter of the responsibility of oxidized-nitrogen dry deposition from local sources is attributable to power plant NOX emissions. But power plant emissions are responsible for about half of the oxidized nitrogen wet deposition associated with local, watershed sources. The same pattern holds for oxidized-nitrogen deposition to the bay segments. As shown in Table B-6, the dry oxidized-nitrogen deposition contribution to the watershed deposition from the other source category is somewhat larger (30% larger) than the wet oxidized-nitrogen deposition. For the oxidized-nitrogen deposition to the bay segments the average deposition is basically equal. For oxidized-nitrogen deposition attributable to watershed NOX emissions, the emissions from the other source category are responsible for about a quarter of both wet and dry deposition.

9/18/07 TBEP Technincal Report #04-07
23
Attachment C
CMAQ-UCD Estimates of the Reduction in Annual N Deposition by 2010 Due to the Repowering of Gannon and Big Bend
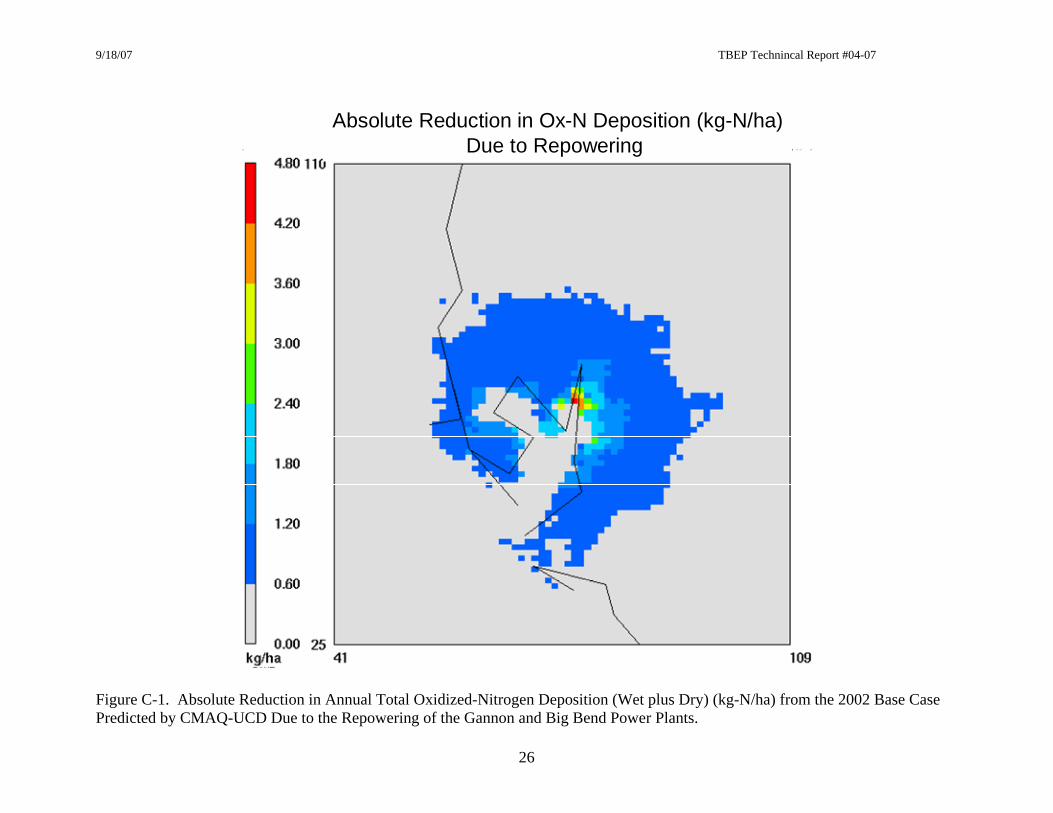
Table C-1 gives the change in oxidized-nitrogen deposition as a result of the repowering of the Gannon and Big Bend plants. The change is for the year 2010, when full repowering is attained at the Big Bend plant. Figure C-1 shows the absolute change in oxidized-nitrogen deposition by 2-km grid cell. Our Base emissions numbers come from 2002 CEM (continuous emissions monitoring) data for 2002 and 2001 NEI emissions based on CEM data for January – March 2003 (to avoid effects of Gannon’s early repowering in 2003). We used 28,099 tons NOX/yr and 24,739 tons NOX/yr for Big Bend and Gannon, respectively. We developed our emissions reductions from information Laura Crouch provided to the TBEP with necessary adjustments to reflect full repowering of Big Bend. The 2010 emissions were 5,620 tons NOX/yr and 371 tons NOX/yr for Big Bend and Gannon (now named Bayside), respectively. Our 2010 emissions are very close to but not identical to the emission numbers for these two plants in the EPA’s 2010 CAIR emissions inventory. The total repowering NOX reduction represents a 65% reduction in power plant emissions shown in Table B-2. Overall, the decrease in oxidized-nitrogen deposition to the watershed is 9.9% and to the bay waters is 10.5%. Factoring in the ammonia deposition, the decrease in the total-nitrogen deposition is 6.6% for the watershed and 7.2% for the bay waters. For the watershed, the decrease in absolute kg’s of dry oxidized-nitrogen deposition is more than three times the decrease in wet oxidized-nitrogen deposition. However, the percent reduction for wet deposition is modestly higher than for dry deposition, about 39% higher. As shown in Table B-5, local power plants contribute a larger fraction to the wet deposition than to the dry deposition because their NOX is emitted aloft. Thus, it is logical to expect the wet deposition response to the repowering will be relatively larger than the dry deposition response. It is interesting that there is a slight increase in reduced-nitrogen dry deposition, less than 1%, however. This is because the Gannon repowering reduces SO2 emissions as well as NOX emissions. With the decrease in sulfate, there will then be a decrease in NH4
+ concentrations and an increase in NH3 concentrations (for the same total ammonia). This will result in an increase in reduced-nitrogen dry deposition. In this instance, the sulfate effect is rather small and the increase is dry deposition of reduced-nitrogen happens to be very modest. There is effectively no change in wet deposition because both NH3 and NH4
+ are quite water soluble. The reductions computed from the repowering CMAQ-UCD simulation are 414,399 kg for the total watershed and 33,603 kg for Tampa Bay waters. This estimate translates to a reduction in N-deposition to the watershed of 456 English tons-N or 82.1 English tons-N delivered to the bay waters, using the TBEP transfer coefficient of 0.18. Adding this to the estimated 37.0 English tons-N

9/18/07 TBEP Technincal Report #04-07
24
reduction from direct deposition to the bay waters results in an overall nitrogen load reduction to Tampa bay of 119.0 tons-N from 2002 to 2010 (8 years) or about 14.9 tons-N per year (assuming a simple linear reduction). The reduction of 119.0 tons of N by 2010 is larger than, but within the range, of a Tampa Electric Company (TECO) estimate of 95.3 tons-N provided by Holly Greening. Uncertainty 1: A bias in a CMAQ dry deposition computation was uncovered at the end of this study. CMAQ developers discovered the NO and NO2 dry deposition parameterizations were missing a component, making the CMAQ estimate of NO and NO2 dry deposition to vegetative surfaces up to a factor of two too high. The PAN deposition was updated at the same time, increasing its rate of deposition. Also, the deposition exchange with water surfaces was updated, reducing the rate of NO and NO2 dry deposition to water. There is no error for dry deposition to impervious surfaces. The NO and NO2 dry deposition formulation errors introduce a bias in the tabulated results for the oxidized-N deposition estimates. A subset of 4 months was used to develop a “best” estimate of the bias in the annual deposition numbers. The dry deposition formulation errors reduce the oxidized-N deposition in the Base Case totaled over the watershed by roughly 17% and by 14% in the Repowering Case (24% and 23%, respectively, for the total to the water surfaces). As a result, there is a significant decrease in the deposition reduction attributable to Repowering. The analysis indicates the Total-N deposition reduction in Table C-1 is approximately 29.7% and 13.2% too high for the total land and water area, respectively. Thus, the above estimate of the total N load reduction to Tampa Bay waters is approximately 25% too high. An estimated bias-corrected reduction of N to Tampa Bay waters due to Repowering would be 89.8 tons of N from 2002 to 2010 (8 years) or about 11.2 tons-N per year (assuming a simple linear reduction). The 90 tons of N reduction estimate is very close to the 95.3 tons-N reduction estimated by TECO for 2010, as provided by Holly Greening. Uncertainty 2: There are several sources of uncertainty affecting the deposition estimates from the CMAQ-UCD: meteorological and emissions input uncertainties (especially NOX and NH3 emissions) and model process description uncertainties. The evaluation of the meteorology for Tampa suggests the meteorological model is performing in a quantified bias and error range typical of performance for the rest of the US. The evaluation of CMAQ-UCD against the May 2002 data suggests it too is functioning in a fairly typical manner, similar to evaluations performed for other areas in the eastern US. The seasonal and annual wet deposition comparisons for Florida sites suggest CMAQ-UCD is functioning in a manner typical of its performance for the rest of the eastern US. Thus, uncertainties for Tampa are expected to be of the same order as uncertainties observed for the eastern US in CMAQ evaluation studies. For annual results, wet deposition can have uncertainties at any one location of ±50% to ±100%. Ambient concentrations at any one location can have uncertainties of ±25% to ±50%. The uncertainties in the dry deposition parameterizations and representation of turbulent mixing will add to and inflate these ambient concentration uncertainty estimates. Emissions uncertainties are judged to be the order of ±40% to ±50%. The uncertainties in meteorology, emissions, and model process descriptions are by and large independent. Thus, the uncertainty of the CMAQ-UCD estimates of total deposition is expected to be ±50% and up to a factor of 2 at any one location. For the annual relative change estimates, several types of uncertainties can cancel or be damped because the same uncertainty affects both the base and the change cases. The air quality models are always expected to perform better at estimating relative change than for estimating absolute amounts. The uncertainty for relative changes is judged to be the order of ±25% up to ±50%.

9/18/07 TBEP Technincal Report #04-07
25
Table C-1. Change in Annual Nitrogen Deposition by 2010 Due to Repowering
DryOx-N (kg-N)
DryRed-N (kg-N)
Dry-N (kg-N)
WetOx-N (kg-N)
WetRed-N (kg-N)
Wet-N (kg-N)
TotOx-N (kg-N)
TotRed-N (kg-N)
Total-N (kg-N)
Watershed Sub-basins Coastal Old Tampa Bay -37,925 1,339 -36,586 -14,355 -1 -14,356 -52,280 1,338 -50,942 Alafia River -56,642 1,809 -54,833 -20,920 -55 -20,975 -77,563 1,754 -75,809 Hillsborough River -78,110 3,557 -74,553 -36,224 10 -36,215 -114,334 3,566 -110,767 Coastal Hillsborough Bay -44,823 867 -43,956 -8,753 28 -8,725 -53,575 894 -52,681 Little Manatee River -33,913 1,260 -32,654 -9,927 -128 -10,055 -43,840 1,131 -42,709 Coastal Middle Tampa Bay -11,673 252 -11,421 -3,447 -8 -3,455 -15,120 244 -14,876 Coastal Lower Tampa Bay -4,335 62 -4,272 -1,199 -10 -1,209 -5,534 52 -5,482 Terra Ceia Watershed -689 9 -680 -204 -1 -205 -893 8 -885 Manatee River Watershed -33,144 1,060 -32,084 -13,877 -113 -13,990 -47,021 947 -46,074 Boca Ciega Bay -9,549 334 -9,215 -4,928 -31 -4,959 -14,477 303 -14,174 Total Watershed -310,803 10,548 -300,254 -113,834 -310 -114,144 -424,637 10,238 -414,399 Tampa Bay Segments Old Tampa Bay -3,039 138 -2,901 -5,840 1 -5,839 -8,880 140 -8,740 Hillsborough Bay -3,446 65 -3,381 -1,993 13 -1,980 -5,439 78 -5,361 Middle Tampa Bay -2,680 111 -2,570 -6,746 2 -6,744 -9,426 113 -9,313 Lower Tampa Bay -1,748 39 -1,709 -4,704 -1 -4,705 -6,451 38 -6,413 Boca Ciega Bay -857 31 -826 -1,331 -5 -1,337 -2,189 26 -2,163 Terra Ceia Bay -157 2 -155 -81 0 -81 -238 2 -236 Manatee River -985 17 -968 -408 0 -408 -1,393 17 -1,376 Total Bay -12,913 404 -12,509 -21,104 10 -21,094 -34,016 414 -33,603
DryOx-N
(lbs-N) DryRed-N
(lbs-N) Dry-N (lbs-N)
WetOx-N (lbs-N)
WetRed-N (lbs-N)
Wet-N (lbs-N)
TotOx-N (lbs-N)
TotRed-N (lbs-N)
Total-N (lbs-N)
Total Watershed -683,766 23,206 -660,559 -250,435 -682 -251,117 -934,201 22,524 -911,677 Total Bay -28,408 888 -27,519 -46,428 22 -46,406 -74,836 910 -73,926
9/18/07 TBEP Technincal Report #04-07
26
Figure C-1. Absolute Reduction in Annual Total Oxidized-Nitrogen Deposition (Wet plus Dry) (kg-N/ha) from the 2002 Base Case Predicted by CMAQ-UCD Due to the Repowering of the Gannon and Big Bend Power Plants.
Absolute Reduction in Ox-N Deposition (kg-N/ha)Due to Repowering
Absolute Reduction in Ox-N Deposition (kg-N/ha)Due to Repowering
Absolute Reduction in Ox-N Deposition (kg-N/ha)Due to Repowering
9/18/07 TBEP Technincal Report #04-07
27
Attachment D CMAQ-UCD Estimates of the Reduction in Annual N Deposition Due to the 2010 CAIR Rule
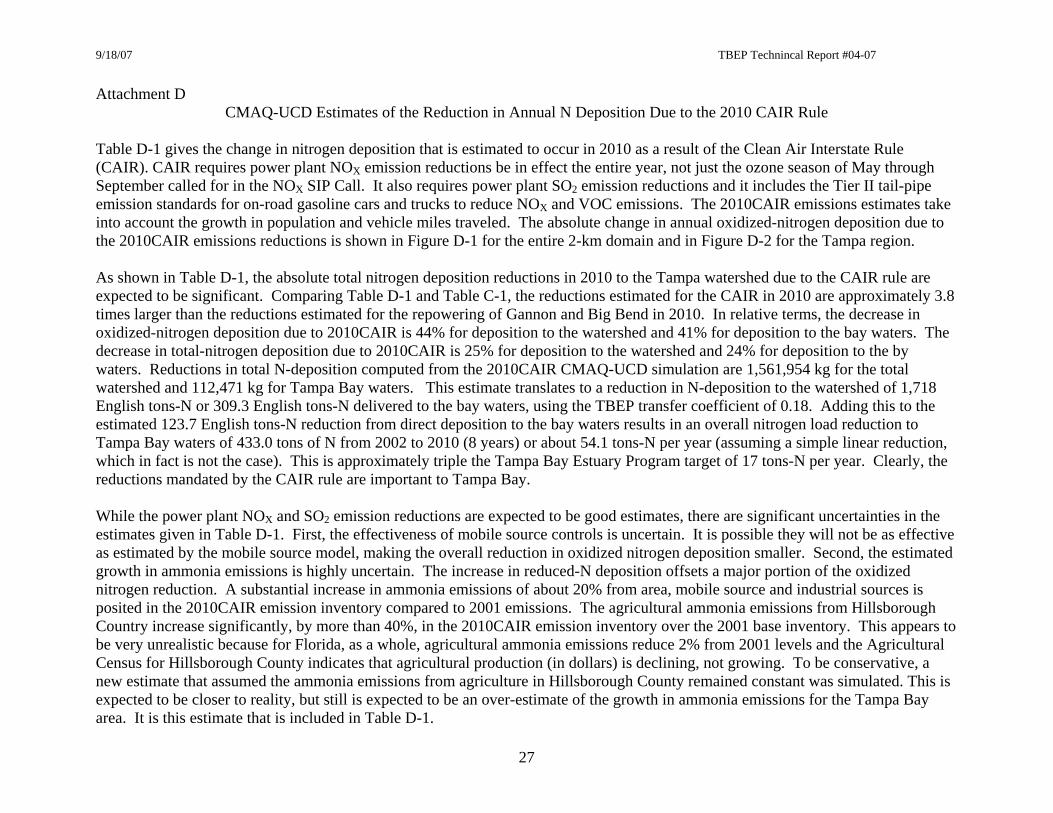
Table D-1 gives the change in nitrogen deposition that is estimated to occur in 2010 as a result of the Clean Air Interstate Rule (CAIR). CAIR requires power plant NOX emission reductions be in effect the entire year, not just the ozone season of May through September called for in the NOX SIP Call. It also requires power plant SO2 emission reductions and it includes the Tier II tail-pipe emission standards for on-road gasoline cars and trucks to reduce NOX and VOC emissions. The 2010CAIR emissions estimates take into account the growth in population and vehicle miles traveled. The absolute change in annual oxidized-nitrogen deposition due to the 2010CAIR emissions reductions is shown in Figure D-1 for the entire 2-km domain and in Figure D-2 for the Tampa region. As shown in Table D-1, the absolute total nitrogen deposition reductions in 2010 to the Tampa watershed due to the CAIR rule are expected to be significant. Comparing Table D-1 and Table C-1, the reductions estimated for the CAIR in 2010 are approximately 3.8 times larger than the reductions estimated for the repowering of Gannon and Big Bend in 2010. In relative terms, the decrease in oxidized-nitrogen deposition due to 2010CAIR is 44% for deposition to the watershed and 41% for deposition to the bay waters. The decrease in total-nitrogen deposition due to 2010CAIR is 25% for deposition to the watershed and 24% for deposition to the by waters. Reductions in total N-deposition computed from the 2010CAIR CMAQ-UCD simulation are 1,561,954 kg for the total watershed and 112,471 kg for Tampa Bay waters. This estimate translates to a reduction in N-deposition to the watershed of 1,718 English tons-N or 309.3 English tons-N delivered to the bay waters, using the TBEP transfer coefficient of 0.18. Adding this to the estimated 123.7 English tons-N reduction from direct deposition to the bay waters results in an overall nitrogen load reduction to Tampa Bay waters of 433.0 tons of N from 2002 to 2010 (8 years) or about 54.1 tons-N per year (assuming a simple linear reduction, which in fact is not the case). This is approximately triple the Tampa Bay Estuary Program target of 17 tons-N per year. Clearly, the reductions mandated by the CAIR rule are important to Tampa Bay. While the power plant NOX and SO2 emission reductions are expected to be good estimates, there are significant uncertainties in the estimates given in Table D-1. First, the effectiveness of mobile source controls is uncertain. It is possible they will not be as effective as estimated by the mobile source model, making the overall reduction in oxidized nitrogen deposition smaller. Second, the estimated growth in ammonia emissions is highly uncertain. The increase in reduced-N deposition offsets a major portion of the oxidized nitrogen reduction. A substantial increase in ammonia emissions of about 20% from area, mobile source and industrial sources is posited in the 2010CAIR emission inventory compared to 2001 emissions. The agricultural ammonia emissions from Hillsborough Country increase significantly, by more than 40%, in the 2010CAIR emission inventory over the 2001 base inventory. This appears to be very unrealistic because for Florida, as a whole, agricultural ammonia emissions reduce 2% from 2001 levels and the Agricultural Census for Hillsborough County indicates that agricultural production (in dollars) is declining, not growing. To be conservative, a new estimate that assumed the ammonia emissions from agriculture in Hillsborough County remained constant was simulated. This is expected to be closer to reality, but still is expected to be an over-estimate of the growth in ammonia emissions for the Tampa Bay area. It is this estimate that is included in Table D-1.

9/18/07 TBEP Technincal Report #04-07
28
Addressing the uncertainty in the trends in oxidized- and reduced-nitrogen deposition and uncertainty in the air quality model is warranted and will be important to help understand observed changes in water quality in Tampa Bay. It will be important to empirically monitor multi-year trends in air concentrations of NO, NO2, NOY, NH3 and NH4
+ around the Tampa and St. Petersburg area to provide a local cross-check on the growth and change estimates in the national emissions inventory. Wet deposition trends alone may not provide a relevant check on the local Tampa and St. Petersburg trends in ammonia emissions. The trends will need to be documented in terms of ambient air concentrations. Uncertainty 1: A bias in a CMAQ dry deposition computation was uncovered at the end of this study. CMAQ developers discovered the NO and NO2 dry deposition parameterizations were missing a component, making the CMAQ estimate of NO and NO2 dry deposition to vegetative surfaces up to a factor of two too high. The PAN deposition was updated at the same time, increasing its rate of deposition. Also, the deposition exchange with water surfaces was updated, reducing the rate of NO and NO2 dry deposition to water. There is no error for dry deposition to impervious surfaces. The NO and NO2 dry deposition formulation errors introduce a bias in the tabulated results for the oxidized-N deposition estimates. A subset of 4 months was used to develop a “best” estimate of the bias in the annual deposition numbers. The dry deposition formulation errors reduce the oxidized-N deposition in the Base Case by roughly 17% and 15% in the 2010 Clean Air Interstate Rule (CAIR) Case for land (24% and 28%, respectively, for water). As a result, there is a noticeable decrease in the deposition reduction attributable to the 2010CAIR. The bias in the Total-N reductions in Table D-1 is largest for the watershed sub-basins with dense urban emissions. The Total-N reductions for Coastal Old Tampa Bay, Coastal Hillsborough Bay, Coastal Middle Tampa Bay, and Boca Ciega Bay are 26.3%, 28.5%, 26.1%, and 26.6% too high, respectively. The bias in the other sub-basins is much lower. The bias for the Tampa Bay segments ranges between 4 and 15%. The analysis indicates the Total-N deposition reduction in Table D-1 is approximately 18.4% and 8.9% too high for the land and water area total accumulated deposition, respectively. Thus, the above estimate of the total N load reduction to Tampa Bay waters is approximately 16% too high. An estimated bias-corrected reduction of Total-N to Tampa Bay waters due to 2010CAIR NOX and SO2 emissions reductions would be (252.4 + 112.7 =) 365.1 tons-N from 2002 to 2010 (8 years) or about 45.6 tons-N per year (assuming a simple linear reduction). Uncertainty 2: There are several sources of uncertainty affecting the deposition estimates from the CMAQ-UCD: meteorological and emissions input uncertainties (especially NOX and NH3 emissions) and model process description uncertainties. The evaluation of the meteorology for Tampa suggests the meteorological model is performing in a quantified bias and error range typical of performance for the rest of the US. The evaluation of CMAQ-UCD against the May 2002 data suggests it too is functioning in a fairly typical manner, similar to evaluations performed for other areas in the eastern US. The seasonal and annual wet deposition comparisons for Florida sites suggest CMAQ-UCD is functioning in a manner typical of its performance for the rest of the eastern US. Thus, uncertainties for Tampa are expected to be of the same order as uncertainties observed for the eastern US in CMAQ evaluation studies. For annual results, wet deposition can have uncertainties at any one location of ±50% to ±100%. Ambient concentrations at any one location can have uncertainties of ±25% to ±50%. The uncertainties in the dry deposition parameterizations and
9/18/07 TBEP Technincal Report #04-07
29
representation of turbulent mixing will add to and inflate these ambient concentration uncertainty estimates. Emissions uncertainties are judged to be the order of ±40% to ±50%. The uncertainties in meteorology, emissions, and model process descriptions are by and large independent. Thus, the uncertainty of the CMAQ-UCD estimates of total deposition is expected to be ±50% and up to a factor of 2 at any one location. For the annual relative change estimates, several types of uncertainties can cancel or be damped because the same uncertainty affects both the base and the change cases. The air quality models are always expected to perform better at estimating relative change than for estimating absolute amounts. The uncertainty for relative changes is judged to be the order of ±25% up to ±50%. The NO2 bias discussed above is an example of the uncertainty in the estimation of an absolute amount of change, rather than a relative change. In the NO2 bias case, both the base and the control case were changed by approximately the same percentage. Therefore, the relative change, as a percent reduction, remains basically the same for the original Base-to-2010CAIR and the bias-corrected Base-to-2010CAIR with a difference of less than half of a percentage point between them.

9/18/07 TBEP Technincal Report #04-07
30
Table D-1. Change in Annual Nitrogen Deposition by 2010 Due to Clean Air Interstate Rule (CAIR)
DryOx-N (kg-N)
DryRed-N (kg-N)
Dry-N (kg-N)
WetOx-N (kg-N)
WetRed-N (kg-N)
Wet-N (kg-N)
TotOx-N (kg-N)
TotRed-N (kg-N)
Total-N (kg-N)
Watershed Sub-basins See Note Coastal Old Tampa Bay -205,988 42,641 -163,347 -52,905 1,871 -51,034 -258,894 44,512 -214,381 Alafia River -240,633 54,168 -186,465 -81,113 -3,451 -84,564 -321,746 50,717 -271,029 Hillsborough River -481,026 93,827 -387,199 -138,140 -1,798 -139,937 -619,166 92,029 -527,137 Coastal Hillsborough Bay -97,853 32,288 -65,565 -27,829 2,631 -25,198 -125,682 34,919 -90,762 Little Manatee River -124,479 32,595 -91,885 -41,627 -829 -42,457 -166,107 31,765 -134,342 Coastal Middle Tampa Bay -44,653 10,530 -34,123 -11,372 343 -11,028 -56,024 10,873 -45,151 Coastal Lower Tampa Bay -16,373 3,151 -13,221 -4,965 110 -4,855 -21,338 3,262 -18,077 Terra Ceia Watershed -3,020 564 -2,456 -838 -12 -850 -3,858 552 3,306 Manatee River Watershed -164,069 34,917 -129,151 -60,632 -3,093 -63,725 -224,701 31,824 -192,876 Boca Ciega Bay -65,212 15,733 -49,480 -15,868 599 -15,269 -81,080 16,332 -64,749 Total Watershed -1,443,306 320,414 -1,122,893 -435,289 -3,772 -439,061 -1,878,595 316,641 -1,561,954 Tampa Bay Segments Old Tampa Bay -17,969 4,924 -13,045 -17,904 586 -17,318 -35,873 5,510 -30,363 Hillsborough Bay -3,832 3,008 -824 -6,443 509 -5,935 -10,275 3,516 -6,758 Middle Tampa Bay -14,565 4,284 -10,282 -23,269 816 -22,453 -37,835 5,100 -32,735 Lower Tampa Bay -11,940 2,866 -9,074 -18,292 351 -17,941 -30,232 3,216 -27,015 Boca Ciega Bay -5,990 1,633 -4,357 -4,551 89 -4,463 -10,541 1,722 -8,820 Terra Ceia Bay -855 150 -705 -328 10 -317 -1,183 160 -1,022 Manatee River -5,372 1,104 -4,268 -1,652 30 -1,622 -7,024 1,134 -5,890 Total Bay -60,523 17,969 -42,554 -72,439 2,523 -69,916 -132,962 20,492 -112,471
DryOx-N
(lbs-N) DryRed-N
(lbs-N) Dry-N (lbs-N)
WetOx-N (lbs-N)
WetRed-N (lbs-N)
Wet-N (lbs-N)
TotOx-N (lbs-N)
TotRed-N (lbs-N)
Total-N (lbs-N)
Total Watershed -3,175,274 704,910 -2,470,364 -957,636 -8,299 -965,935 -4,132,909 696,611 -3,436,298 Total Bay -133,151 39,531 -93,620 -159,366 5,550 -153,816 -292,517 45,081 -247,435
Note: The Wet Reduced-N column has an estimated adjustment to correct for the agricultural emissions inventory error in ammonia

9/18/07 TBEP Technincal Report #04-07
31
Figure D-1. Absolute Reduction in Total Annual Oxidized-Nitrogen Deposition (Dry plus Wet) from the 2002 Base Case in kg-N/ha Predicted by CMAQ-UCD for the 2010 CAIR Rule.
Absolute Reduction in Ox-N Deposition (kg-N/ha)Due to 2010 CAIR Rule
Absolute Reduction in Ox-N Deposition (kg-N/ha)Due to 2010 CAIR Rule

9/18/07 TBEP Technincal Report #04-07
32
Figure D-2. Absolute Reduction in Total Annual Oxidized-Nitrogen Deposition (Dry plus Wet) from the 2002 Base Case in kg-N/ha Predicted by CMAQ-UCD for the 2010 CAIR Rule, zoomed to cover Tampa.
Absolute Reduction in Ox-N Deposition (kg-N/ha)Due to 2010 CAIR Rule
Absolute Reduction in Ox-N Deposition (kg-N/ha)Due to 2010 CAIR Rule