04 solar panel wind load fsi optimization case … panel wind load fsi optimization.pdf · overview...
TRANSCRIPT

Structural Optimization of the Pole Mount Supports
of a Solar Panel in a Wind Load Case Study
Mono-objective Optimization
www.ozeninc.com/Optimization
www.ozeninc.com/Optimization

OVERVIEW
1. Problem Definition - Optimization of a Pole Mount Supports of a Solar Panel under
Wind Load
2. ANSYS CFX FSI Analysis
Optimization Applied to a Solar Panel
Mounts
3. Optimization Problem Definition - Workflow Creation in modeFRONTIER
4. Postprocessing – Analyzing the Optimum Configurations
5. Conclusions: Solar Panel Improvements through Optimization
6. What modeFRONTIER can do for you?

Increase the Structural Rigidity of the Solar Panel
System
Objective:
• To determine the optimized geometric configuration
of the pole mount support structure of a solar panel
under a 5 m/s wind load when subjected to a mono
objective optimization: Minimize the Max Panel
Displacement
Pole Mounted Solar Panel
Why to Minimize the Solar Panel Max Displacement
• Increase in the structural rigidity of the solar panel and the pole mount attachments to withstand
sufficient wind loading which in turn improves the product quality.
• On the other hand this could also improve the accuracy of the system that control the panel tilting.
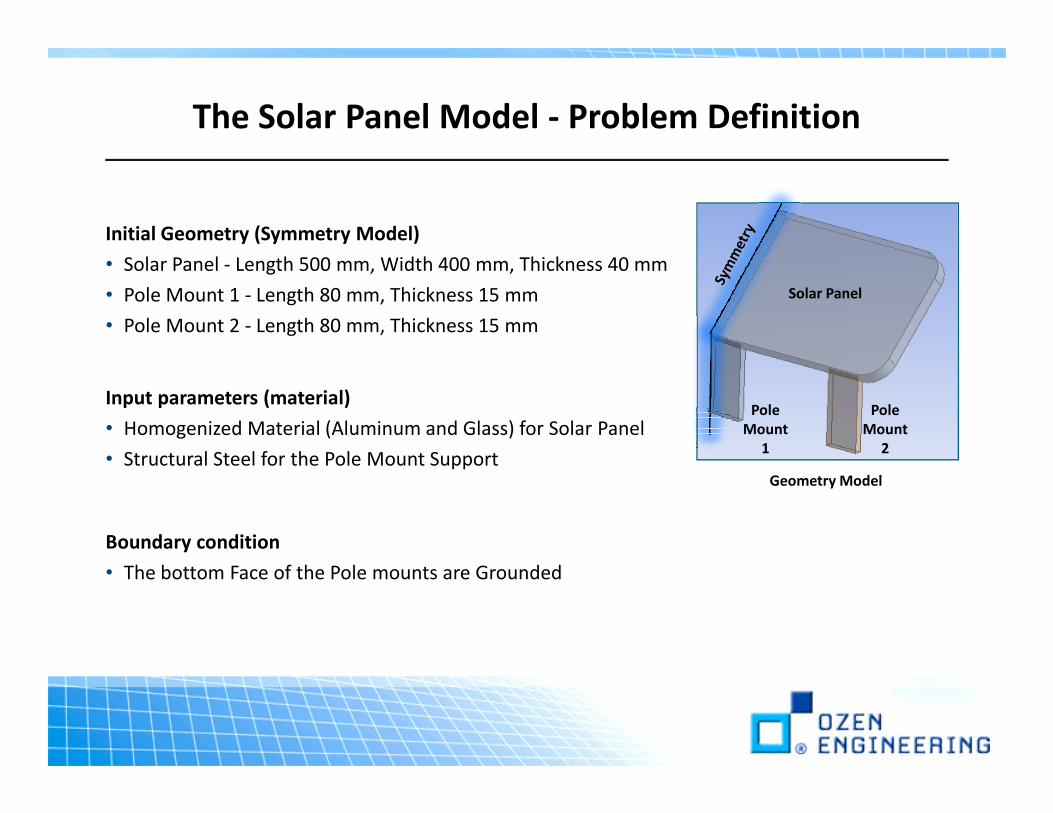
The Solar Panel Model - Problem Definition
Initial Geometry (Symmetry Model)
• Solar Panel - Length 500 mm, Width 400 mm, Thickness 40 mm
• Pole Mount 1 - Length 80 mm, Thickness 15 mm
• Pole Mount 2 - Length 80 mm, Thickness 15 mm
Input parameters (material)
Solar Panel
Pole Pole Input parameters (material)
• Homogenized Material (Aluminum and Glass) for Solar Panel
• Structural Steel for the Pole Mount Support
Boundary condition
• The bottom Face of the Pole mounts are Grounded
Geometry Model
Pole
Mount
1
Pole
Mount
2

Annual Average Wind Resource Estimates in the Contiguous United States
Wind Speed Wind Speed
considered for the
Problem is 5 m/s
Image from http://rredc.nrel.gov/wind
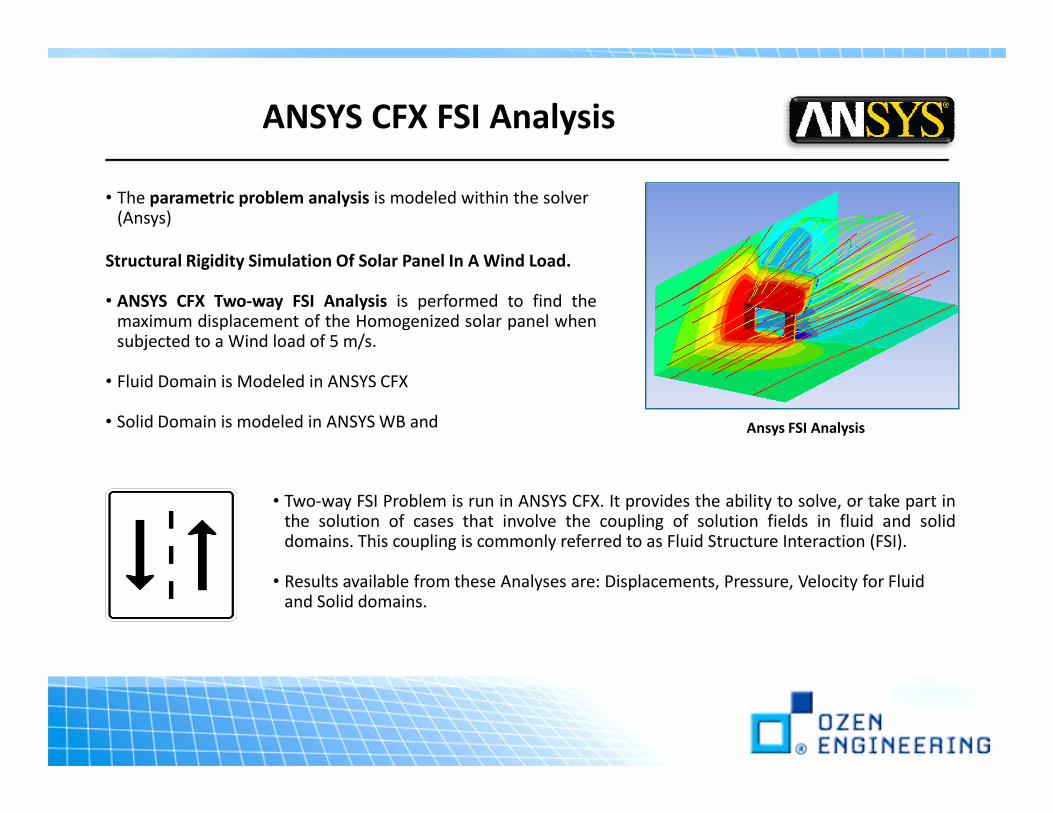
• The parametric problem analysis is modeled within the solver(Ansys)
ANSYS CFX FSI Analysis
Structural Rigidity Simulation Of Solar Panel In A Wind Load.
• ANSYS CFX Two-way FSI Analysis is performed to find themaximum displacement of the Homogenized solar panel whensubjected to a Wind load of 5 m/s.
• Fluid Domain is Modeled in ANSYS CFX
Ansys FSI Analysis• Solid Domain is modeled in ANSYS WB and
• Two-way FSI Problem is run in ANSYS CFX. It provides the ability to solve, or take part inthe solution of cases that involve the coupling of solution fields in fluid and soliddomains. This coupling is commonly referred to as Fluid Structure Interaction (FSI).
• Results available from these Analyses are: Displacements, Pressure, Velocity for Fluid and Solid domains.
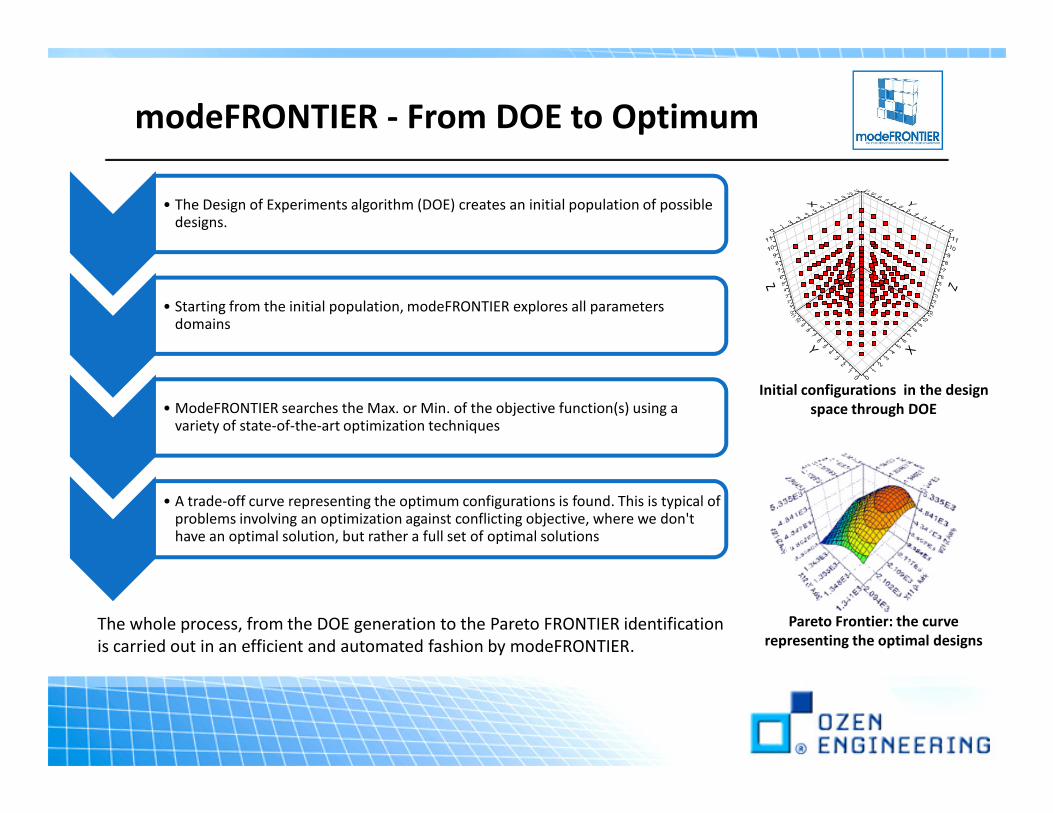
modeFRONTIER - From DOE to Optimum
a
• The Design of Experiments algorithm (DOE) creates an initial population of possible designs.
a
• Starting from the initial population, modeFRONTIER explores all parameters domains
• ModeFRONTIER searches the Max. or Min. of the objective function(s) using a
Initial configurations in the design
space through DOE
The whole process, from the DOE generation to the Pareto FRONTIER identification
is carried out in an efficient and automated fashion by modeFRONTIER.
• ModeFRONTIER searches the Max. or Min. of the objective function(s) using a variety of state-of-the-art optimization techniques
• A trade-off curve representing the optimum configurations is found. This is typical of problems involving an optimization against conflicting objective, where we don't have an optimal solution, but rather a full set of optimal solutions
space through DOE
Pareto Frontier: the curve
representing the optimal designs
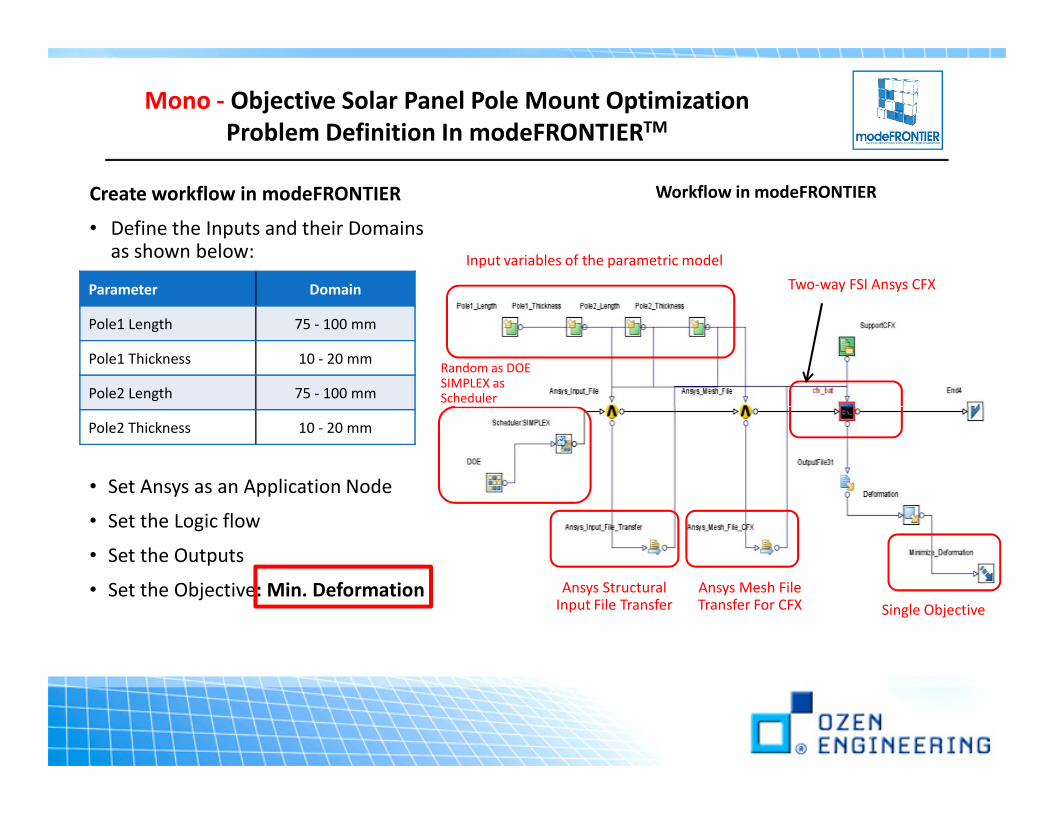
Create workflow in modeFRONTIER
• Define the Inputs and their Domains as shown below:
Mono - Objective Solar Panel Pole Mount Optimization
Problem Definition In modeFRONTIERTM
Parameter Domain
Pole1 Length 75 - 100 mm
Pole1 Thickness 10 - 20 mm
Pole2 Length 75 - 100 mm
Random as DOESIMPLEX as Scheduler
Input variables of the parametric model
Workflow in modeFRONTIER
Two-way FSI Ansys CFX
Pole2 Thickness 10 - 20 mm
Single Objective
• Set Ansys as an Application Node
• Set the Logic flow
• Set the Outputs
• Set the Objective: Min. Deformation Ansys StructuralInput File Transfer
Ansys Mesh FileTransfer For CFX
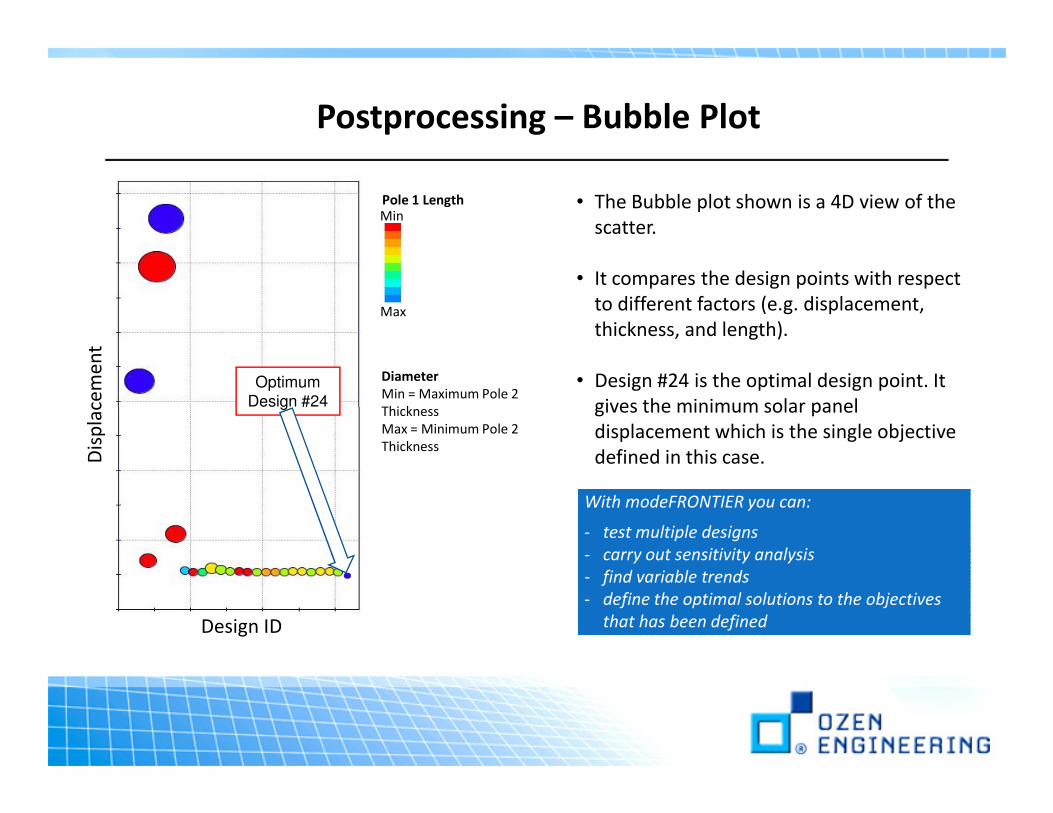
Postprocessing – Bubble Plot
• The Bubble plot shown is a 4D view of the
scatter.
• It compares the design points with respect
to different factors (e.g. displacement,
thickness, and length).
• Design #24 is the optimal design point. It
gives the minimum solar panel
Dis
pla
cem
en
t
Pole 1 LengthMin
Max
Diameter
Min = Maximum Pole 2
Thickness
Optimum
Design #24 gives the minimum solar panel
displacement which is the single objective
defined in this case.
With modeFRONTIER you can:
- test multiple designs
- carry out sensitivity analysis
- find variable trends
- define the optimal solutions to the objectives
that has been defined
With modeFRONTIER you can:
- test multiple designs
- carry out sensitivity analysis
- find variable trends
- define the optimal solutions to the objectives
that has been definedDesign ID
Dis
pla
cem
en
t
Thickness
Max = Minimum Pole 2
Thickness
Design #24

<ID>Pole1
Length
Pole1
Thickness
Pole2
Length
Pole2
Thickness
modeFRONTIER
OBJECTIVE -
Minimize Solar Panel
Max. Displacement
0 75 10 100 20 1.434E-003
1 75 10 75 10 5.812E-003
2 100 15 75 20 1.154E-003
23 100 20 75 20 9.064E-004
24 100 20 100 20 7.372E-004
Postprocessing - Designs Table and
Optimum Configuration
Few of the Simplex Designs are represented in the table above for your convenience
• modeFRONTIER tested several designs
• Design #24 represents the optimum design with a displacement decrease of 56.6% from the initial
design
• modeFRONTIER tested several designs
• Design #24 represents the optimum design with a displacement decrease of 56.6% from the initial
design
Few of the Simplex Designs are represented in the table above for your convenience
ParameterPole1
Length
Pole1
Thickness
Pole2
Length
Pole2
Thickness
Solar Panel
Max. Displacement
Initial Design 80 15 80 15 1.702E-003 0%
Mono. Obj. Design 100 20 100 20 7.372E-004 56.6%
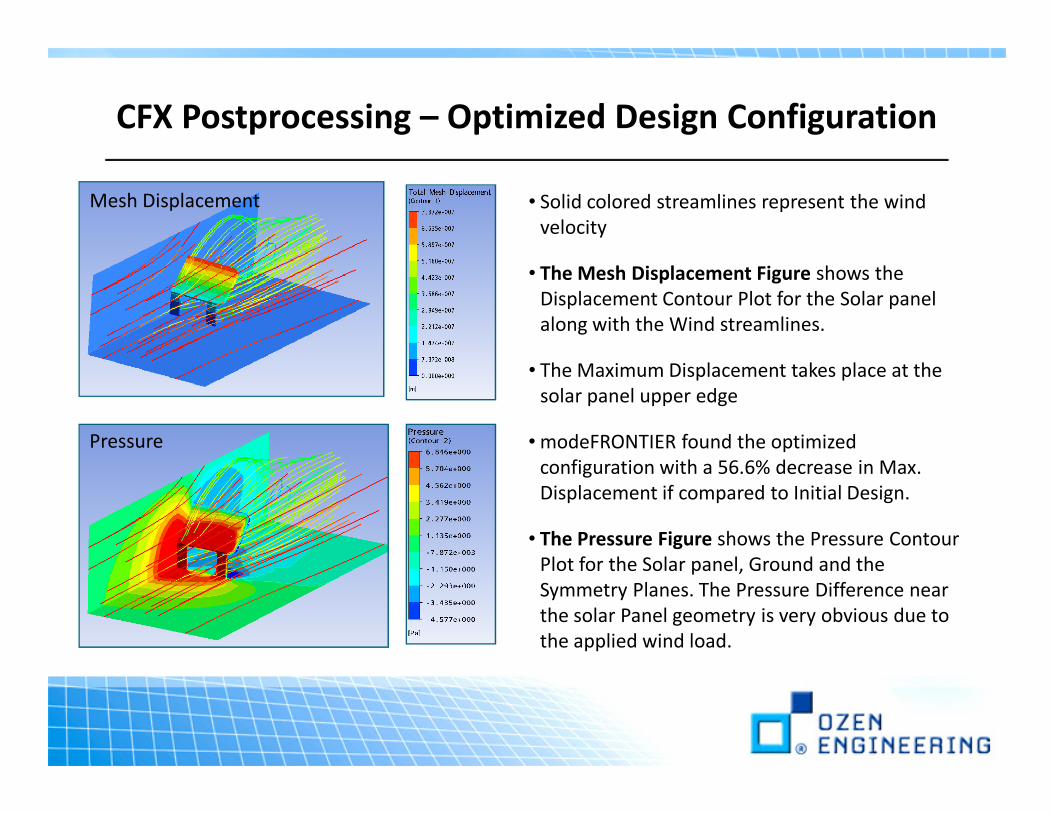
CFX Postprocessing – Optimized Design Configuration
• Solid colored streamlines represent the wind
velocity
• The Mesh Displacement Figure shows the
Displacement Contour Plot for the Solar panel
along with the Wind streamlines.
• The Maximum Displacement takes place at the
solar panel upper edge
Mesh Displacement
• modeFRONTIER found the optimized
configuration with a 56.6% decrease in Max.
Displacement if compared to Initial Design.
• The Pressure Figure shows the Pressure Contour
Plot for the Solar panel, Ground and the
Symmetry Planes. The Pressure Difference near
the solar Panel geometry is very obvious due to
the applied wind load.
Pressure

Conclusions
• In few hours modeFRONTIER tested several
configurations, the same task would have
taken days for a single operator
• ModeFRONTIER found the optimum design
achieving improvement for all the parameter
specified:
56.6% displacement reduction = increase in 56.6% displacement reduction = increase in
product quality
• modeFRONTIER created an automatic procedure: once the parametric model is set,
the optimizator will keep iterating it till it finds the best configurations
• modeFRONTIER finds the optimum solutions (pareto frontier), therefore the need of
testing only the best configurations reducing the experimental phase and
controlling the spending

What can do for you?
The Designer using modeFRONTIER:
• can increase the structural rigidity of the
solar panel and supports by finding the
Optimum Design Configuration for the
problem In hand.
• can decrease the Material Cost by
Panel Tilt Degree
Pole
Support Structures
Wind
• can decrease the Material Cost by
decreasing the Support Mass at the same
time ensuring the Structural Rigidity of the
system.
• can find Optimal Tilt Degree values of the
Solar Panel on the prevailing wind
conditions.
• …
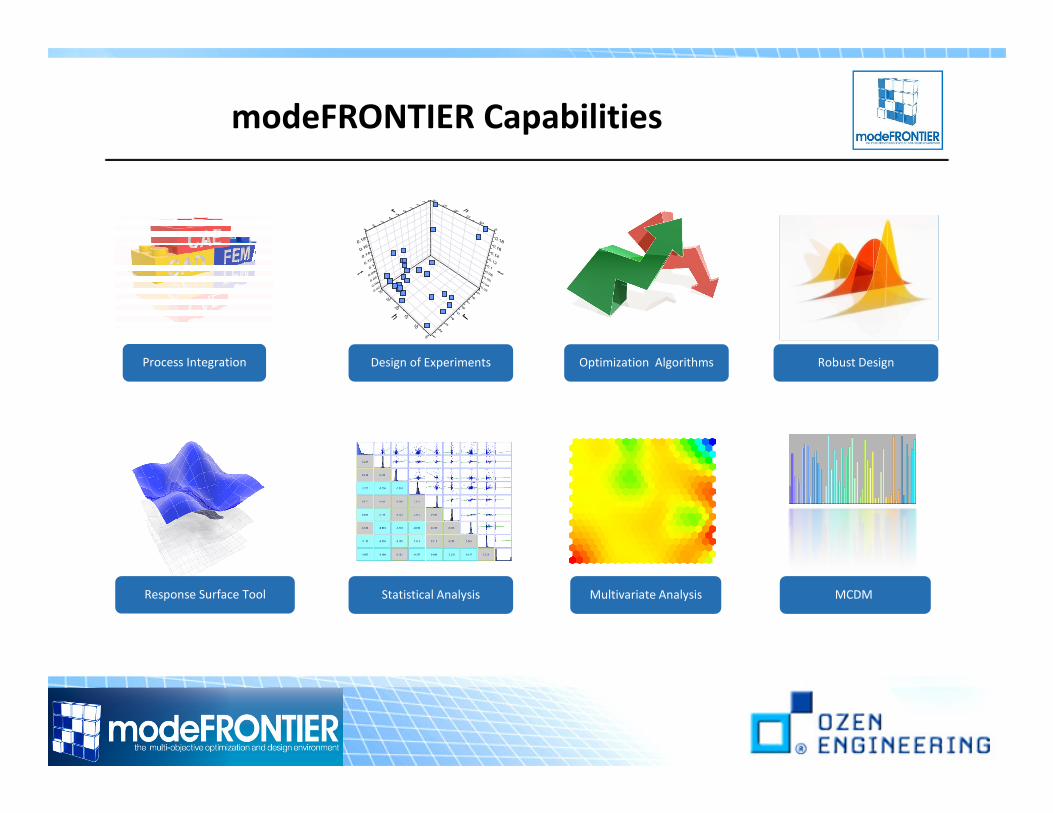
Process Integration Design of Experiments Optimization Algorithms Robust Design
modeFRONTIER Capabilities
MCDM Multivariate AnalysisStatistical AnalysisResponse Surface Tool

Stay Ahead During Challenging Times
• To learn more about how Ozen Engineering can help
you incorporate simulation into your design and
testing processes, please visit us at www.ozeninc.com
• For more Design Optimization Case Studies visit: • For more Design Optimization Case Studies visit:
http://ozeninc.com/default.asp?ii=256
• To learn more about modeFRONTIER visit us at:
www.ozeninc.com/Optimization
• If you would like us to create a demo for your specific
case or for any other question, please contact us at: