0.440 160 january 3, 2016 statistics jumbo group ltd
TRANSCRIPT

January 3, 2016
Consu
mer
Sta
ple
s Sin
gapore
SEE PAGE 43 FOR IMPORTANT DISCLOSURES AND ANALYST CERTIFICATIONS Co. Reg No: 198700034E MICA (P) : 099/03/2012
Gregory Yap [email protected] (65) 6231 5848
Jumbo Group Ltd (JUMBO SP)
Give Me More Of This Crab
Initiating coverage: BUY to SGD0.58 TP
Jumbo’s highly-profitable seafood restaurants and signature crab dishes
are much loved in Singapore and now, being successfully exported to
China where it has three outlets. With its far bigger market potential and
high ROI, there is room to add one new outlet in China a year as new
outlets fully recoup investments in just 1-3 years. Jumbo deserves a
premium to peers for its uniquely-Singapore brand and product and first-
mover advantage in China. We initiate coverage with a BUY and DCF-P/E
blended TP of SGD0.58.
Bringing a uniquely Singapore dish to China
Jumbo’s expansion in China is just beginning. The mainland Chinese have
taken to chilli crabs in droves, and we think this expansion will provide
years of double-digit growth to come. We project accelerating earnings
growth of 9%/11%/20% in FY16E-18E, driving China from a 10% market
now to 32% of revenue by FY18E. By our estimates, its China outlets are
capable of generating ROI of 32-86% with a relatively short payback
period of 1-3 years which reduces risk.
More than just crabs that can travel
Jumbo has demonstrated that it can successfully replicate its seafood-
restaurant business in China. But it has other dining concepts (eg hotpot,
Teochew cuisine, bak kut teh) that can be exported overseas as well, not
just in China but the rest of South-east Asia. Gross margins for all its
brands run in the 40-60% range, and with scale, we see room for upside.
Deserving of a tasty premium
We value Jumbo at SGD0.58 for c.40% potential upside. We use blended
P/E and DCF valuations to capture the full value of its mid-term
expansion potential. This values Jumbo at 25x FY16E, 22x FY17E and 19x
FY18E EPS, a slight premium to its regional peers. Our DCF valuation of
SGD0.65 is conservative, assuming a higher-than-usual 10% market return
and 1.2x beta for possibly higher risks from its China expansion.
Good growth, high margins, strong cashflow: What more can you ask for?
Share Price SGD 0.43
12m Price Target SGD 0.58 (+36%)
BUY
Company description
Statistics
52w high/low (SGD)
3m avg turnover (USDm)
Free float (%)
Issued shares (m)
Market capitalisation
Major shareholders:
57.9%
6.6%
6.2%
641
3.8
F&B retailer in Singapore and China, most famous for
its chilli crabs and JUMBO Seafood brand JPOT
Hotpot. Has five other brands in its stable.
JBO Holdings
Mr Tan Gee Jian
Orchid 1 Investments
na/na
24.3
SGD272.6M
USD193M
Price Performance
90
100
110
120
130
140
150
160
0.300
0.320
0.340
0.360
0.380
0.400
0.420
0.440
Nov-15 Nov-15 Nov-15 Nov-15 Dec-15 Dec-15 Dec-15 Dec-15
Jumbo Group Ltd - (LHS, SGD) Jumbo Group Ltd / Straits Times Index - (RHS, %)
-1M -3M -12M
Absolute (%) 8 na na
Relative to index (%) 6 na na
Source: FactSet
FYE Sep (SGD m) FY14A FY15A FY16E FY17E FY18E
Revenue 112 123 147 169 191
EBITDA 19 18 22 25 31
Core net profit 13 14 15 17 20
Core EPS (cts) 2.1 2.1 2.3 2.6 3.1
Core EPS growth (%) 39.8 3.0 8.6 11.1 20.5
Net DPS (cts) 0.0 8.1 0.7 0.8 0.9
Core P/E (x) 20.4 19.8 18.3 16.4 13.6
P/BV (x) 5.8 4.8 6.3 4.9 3.9
Net dividend yield (%) 0.0 19.0 1.6 1.8 2.2
ROAE (%) 31.8 26.4 29.8 33.7 31.8
ROAA (%) 20.8 17.8 18.5 19.2 19.0
EV/EBITDA (x) na na 10.3 9.1 7.3
Net debt/equity (%) net cash net cash net cash net cash net cash
Consensus net profit - - na na na
MKE vs. Consensus (%) - - na na na
0%
10%
20%
30%
40%
50%
60%
0
10,000
20,000
30,000
40,000
50,000
60,000
70,000
FY15 FY16E FY17E FY18E
(SGD'000)
Net cash Free cashflow
Core NP growth (RHS) Gross margin (RHS)

January 3, 2016 2
Jumbo Group Ltd
Company Proposition
A restaurant operator whose greatest value proposition is
ability to generate high demand for its business with
reasonable prices and consistent taste.
Iconic dishes, footprint of outlets in ideal locations, strong
brands and effective front- and back-end operations
provide high defensible margins.
Branding and identity that hinge on signature seafood such
as chilli crab, a national dish. Helps it stand out in
crowded markets especially when expanding overseas.
Low-cost cash business financed by suppliers’ credit. High
FCF generation supports aggressive expansion plans yet
provides future dividend support for shareholders.
How Jumbo stacks up on profitability & returns
Source: FactSet estimates, Maybank Kim Eng
Price Drivers
Revenue breakdown
Source: Company data, Maybank Kim Eng estimates
Listed just in Nov 2015, trading history is too short to
identify inflexion points. We believe market will focus on its
opening of new outlets in China and/or introduction of new
dining concepts.
1. Second China JUMBO SEAFOOD outlet opened in Raffles
City Shanghai in Aug 2015.
2. Third China outlet opening in IFC Mall in Jan 2016.
3. Fourth China outlet assumed to open in Oct 2016.
4. Fifth China outlet assumed to open in Oct 2017, fourth
JPOT outlet in Singapore assumed to open in mid-FY17
Financial Metrics
Revenue growth. Given two new JUMBO outlets in China,
would expect to see increasingly stronger topline growth
in next 3-4 quarters, unless other brands underperform.
EBIT & net margins. Gross margin (excluding direct costs
such as food & rental) is controllable. There may be
quarters of higher start-up costs where margins fall below
trend, but generally expect good indirect cost
management and efficient tax planning.
Watch for deteriorating asset & liability turns. Strong FCF
generation comes from AP days far exceeding AR and stock
days. Don’t be alarmed if FCF is dragged down by capex.
Strong revenue growth with stable margins expected
Source: Company data, Maybank Kim Eng estimates
Swing Factors
Upside
Better-than-expected Singapore and China sales,
especially from new outlets.
Lower-than-expected food and staff costs that could lead
to better-than-expected margins.
Expectations of higher dividends or articulation of a
dividend policy.
Downside
Any changes in China’s food safety laws that could affect
China’s import of mud crabs.
Shortage of critical ingredients for its signature dishes:
crabs, other seafood.
Epidemics or health scares that can damage its
reputation or cuisine eg mass food poisoning, salmonella.
(6.0)
(4.0)
(2.0)
0.0
2.0
4.0
6.0
8.0
10.0
12.0
(70.0) (60.0) (50.0) (40.0) (30.0) (20.0) (10.0) 0.0 10.0 20.0 30.0 40.0
Avg 3Y ROE
Avg 3Y Net Margin
JumboJapan Foods
ABR Holdings
Soup Restaurant
BreadTalkSakae Holdings
Auric Pacific
Tung Lok
Flagship brands:Jumbo - JUMBO SEAFOODJapan Foods - Ajisen RamenABR - Swensen's, Gloria Jean's CoffeesSoup Restaurant - SOUPBreadTalk - Din Tai Fung, Carl's JrSakae Holdings - Sakae SushiAuric Pacific - Delifrance, Food JunctionTung Lok - TungLok, Lao Beijing
12.2% 12.3% 12.2% 13.2%10.4% 10.2% 9.8% 10.4%
9%
19%
15%
13%
0.0%
5.0%
10.0%
15.0%
20.0%
25.0%
FY15 FY16E FY17E FY18E
EBIT margin Net margin Revenue growth
1
1 2 3 4

January 3, 2016 3
Jumbo Group Ltd
Fig 1: SWOT Analysis
Strengths
Strong branding in Singapore, widely known by locals.
Outlets well-located in key tourist hotspots.
14 restaurants in Singapore, two in China with five brands.
Front-end optimises diner-capture and outlet utilisation.
Back-end centralises cooking and food preparation.
Consistent taste of dishes through standardised
preparation of ingredients lowers staffing cost.
Weaknesses
Limited differentiation of menu, especially signature
seafood dishes.
Supply of seafood, especially crabs, may be affected by
disease or closure of source markets.
Rental costs may escalate, especially as expansion is
taking it into REIT-controlled malls.
Opportunities
Strong reception in China. Room to grow number of
outlets in Shanghai.
Capitalise on rising food-safety awareness in China as a
well-regarded Singapore brand.
Other brands can also be exported to China or South-east
Asia.
Expansion into higher-margin catering business.
Threats
New outlets or brands fail to take off.
Fluctuation of food cost (80% of COGS), especially seafood
which account for 70-80% of revenue.
Adverse food-safety developments could hurt revenue and
brand value.
Change in consumer tastes and preferences or sharp drop
in tourist arrivals could affect demand.
Source: Company data, Maybank Kim Eng
Fig 2: Porter’s Five Forces Model Analysis
Source: Company data, Maybank Kim Eng
Bargaining power of suppliers:
Low Top three seafood suppliers account
for less than 20% of COGS. Other fresh
ingredients are freely available on
the market.
Industry competition: High
Seafood restaurant business is fragmented. Jumbo’s biggest value proposition is in fair transparent prices and consistent taste that keeps customers coming back.
Bargaining power of
customers: Medium
Buyers can vote with their feet and wallets. However, Jumbo’s 48,000-member loyalty program acts to
dilute buyer power.
Threat of substitutes: Low
No substitute for signature chilli crab
which is a national dish of Singapore.
Threat of new entrants: Low-to-Medium
Anyone can start a seafood restaurant, but not many have as large a footprint as Jumbo or its
strong branding.
January 3, 2016 4
Jumbo Group Ltd
Table of Contents 1. Investment thesis 5
1.1 Deserving of a tasty premium 5
1.2 Catalyst #1: China expansion the main growth driver 5
1.3 Catalyst #2: More than just crabs that can be exported 5
1.4 Catalyst #3: May pay more dividends to get fatter ROEs 5
2. Company Background 6
2.1 The seafood specialist 6
2.2 Among the top 10 players locally 7
2.3 Taking the chilli crab to the hairy crab kingdom 7
2.4 Other hot & spicy brands that can also be exported 8
3. Industry Potential 10
3.1 Singapore on the global foodie’s trail… 10
3.2 …with crab at the top of the menu 11
3.3 China bursting with potential 11
4. Growth Drivers 13
4.1 Expand further in China 13
4.2 Attractive locations secured in China 14
4.3 Part of the solution for China’s retail challenges 16
4.4 Export other brands to the region 17
4.5 Acquisitions, JVs or strategic alliances 17
5. Barriers to Entry 18
5.1 Competitive with a clear path to growth 18
5.2 Food quality & safety a key mantra 18
5.3 Expand central kitchen & IT to enhance scalability 19
6. Forecasts & Assumptions 21
6.1 Sales to grow by 16% CAGR, NP 13% in FY16E-18E 21
6.2 China to be the main growth driver 21
6.3 Optimistic on China expansion 22
6.4 Singapore a sturdy mainstay 23
6.5 Why do we believe future expansion will favour JUMBO and JPOT? 23
6.6 Overall revenue assumptions 24
6.7 Margin trends should be stable 25
6.8 Well-financed, capex not a concern given ample FCF 26
6.9 Can afford to pay more dividends 27
7. Valuation & Target Price 31
7.1 Undervalued to regional peers 31
7.2 Deserving of a tasty premium 31
8. Risks & Concerns 34
8.1 Singapore tourism down but not a dealbreaker 34
8.2 Must keep reputation intact at all costs 34
8.3 Crab shortages 35
8.4 Possible earnings volatility until new outlets mature 35
Annex I: Listing Details 36
Annex II: Board of Directors/Senior Management 36
Annex III: Shareholding Details 39
January 3, 2016 5
Jumbo Group Ltd
1. Investment thesis
Restauranteur Jumbo Group is the leading brand in Singapore’s seafood
dining industry which accounts for 80% of its revenue. Its signature dishes
– chilli crab and black pepper crab – are widely available in Singapore,
varying only with the creativity of the chef. Singapore lays claim to chilli
crab as a “uniquely Singapore” dish, prompting other Southeast Asian
countries such as Malaysia to also lay claim to it as their own. For
investors, however, it is not so much the formulation or origin of this dish
but Jumbo’s brands, execution, well-tested systems and growth strategy
that merit investment. We forecast accelerating earnings growth of
9%/11%/20% in FY16E-18E, underpinned by expansion in China, and
initiate coverage with a BUY and blended DCF-P/E TP of SGD0.58.
1.1 Deserving of a tasty premium We value Jumbo at SGD0.58 for c.40% upside potential. We use blended
P/E and DCF valuations to capture the full value of its expansion prospects
that should take more than a year to pan out. This values Jumbo at 25x
FY16E, 22x FY17E and 19x FY18E EPS, a slight premium to its regional
peers. We think this is reasonable. Our DCF valuation is conservative, as
we have assumed a higher-than-usual 10% market rate of return and 1.2x
beta to account for possibly higher risks associated with its aggressive
China expansion. We employed five-year forecasts up until 2020 and
assumed steady-state expansion of 5% pa until 2025.
1.2 Catalyst #1: China expansion the main growth driver China is expected to generate the biggest revenue and earnings growth for
Jumbo, justifying the addition of four outlets in FY15-FY18E, of which two
have been confirmed for FY15-FY16E. The early results have been
overwhelmingly positive for Jumbo. China accounted for 6% of group
revenue in the year that its first outlet opened in FY14. This number
climbed to 9% by the second year in FY15, all from just one outlet in
Shanghai. Profitability was achieved by the end of the first year. The
additional outlets we have forecasted are expected to lift China’s revenue
contributions to 32% by FY18E, with the biggest jump in FY16E from two
new outlets in Aug 2015 and Jan 2016 respectively.
1.3 Catalyst #2: More than just crabs that can be exported While Jumbo’s seafood business can be easily replicated in different
markets, it has four other brands in Singapore that we think can be
profitably exported overseas as well. Gross margins for all its brands run
in the 40-60% range and with scale, we see room for upside. Financing
expansion capex is not a problem at all. Jumbo generates solid cash flows
as it’s mostly a cash business with almost no credit terms. Nothing is kept
in stock for long, and what’s more, suppliers are financing its business, by
giving Jumbo c.30 days of credit.
1.4 Catalyst #3: May pay more dividends to get fatter ROEs Jumbo intends to pay out at least 30% of its annual earnings as dividends
in FY16-17. On our part, we think it can afford to pay more as by our
estimates, its ROE could be dragged down if it does not do so, given the
ample amount of FCF that it generates. We currently forecast ROE
declining from 30% in FY17E to 28.4% in FY18E assuming a 30% payout
ratio. However, if it pays out 50%, ROEs should remain stable at 31-32% in
FY17E-18E. If so, dividend yield should rise from <2% to 3% in FY16E and
closer to 4% by FY18E.
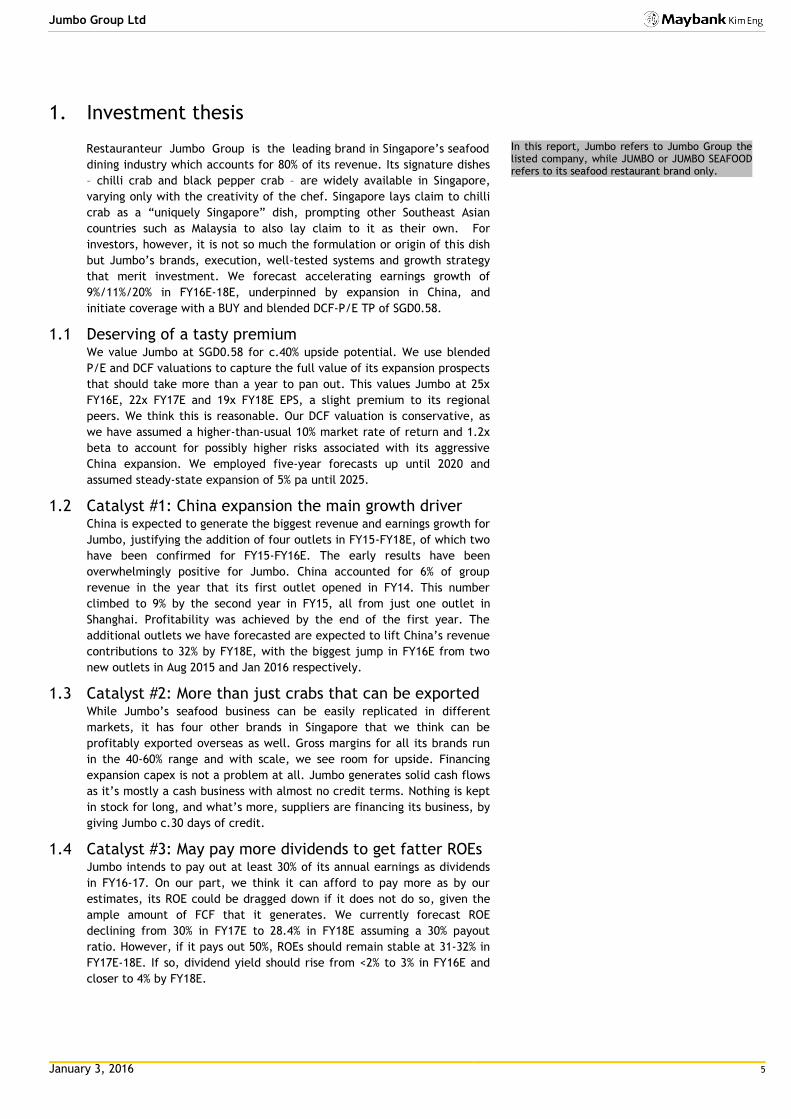
In this report, Jumbo refers to Jumbo Group the listed company, while JUMBO or JUMBO SEAFOOD refers to its seafood restaurant brand only.
January 3, 2016 6
Jumbo Group Ltd
2. Company Background
2.1 The seafood specialist Jumbo is one of Singapore’s leading multi-concept dining establishments.
Arguably, it has done more than its fair share to put Singapore on the world
culinary map, with its signature chilli and black pepper crabs. JUMBO SEAFOOD
outlets are popular with both locals and tourists. A quick search on
tripadvisor.com.sg for Singapore chilli crab throws up three of JUMBO SEAFOOD’s
five restaurants among the top 10. While there are no estimates from the
company, our eyeball estimates suggest a 50/50 local/tourist customer
composition for Jumbo. Anecdotally, it is usually the first stop on the dining trail
of tourists. We observe that its outlets remain crowded in fair and foul weather,
including the annual haze in Singapore.
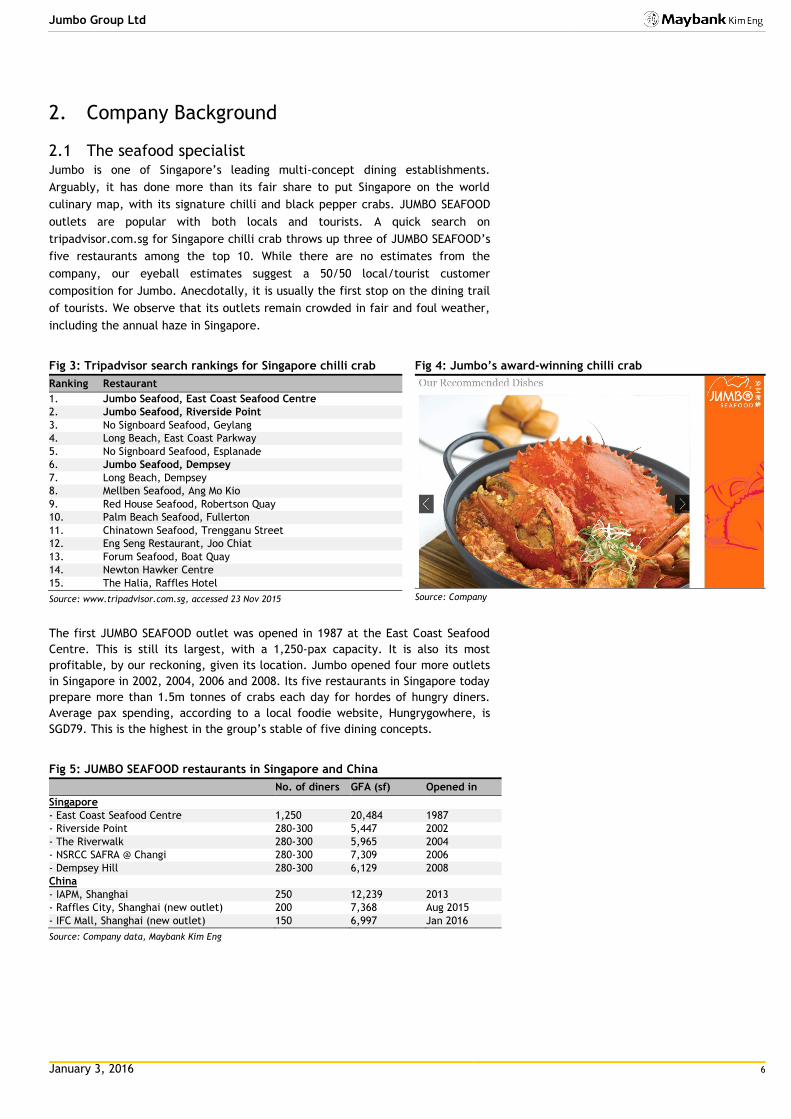
Fig 3: Tripadvisor search rankings for Singapore chilli crab
Ranking Restaurant
1. Jumbo Seafood, East Coast Seafood Centre
2. Jumbo Seafood, Riverside Point
3. No Signboard Seafood, Geylang
4. Long Beach, East Coast Parkway
5. No Signboard Seafood, Esplanade
6. Jumbo Seafood, Dempsey
7. Long Beach, Dempsey
8. Mellben Seafood, Ang Mo Kio
9. Red House Seafood, Robertson Quay
10. Palm Beach Seafood, Fullerton
11. Chinatown Seafood, Trengganu Street
12. Eng Seng Restaurant, Joo Chiat
13. Forum Seafood, Boat Quay
14. Newton Hawker Centre
15. The Halia, Raffles Hotel
Source: www.tripadvisor.com.sg, accessed 23 Nov 2015
Fig 4: Jumbo’s award-winning chilli crab
Source: Company
The first JUMBO SEAFOOD outlet was opened in 1987 at the East Coast Seafood
Centre. This is still its largest, with a 1,250-pax capacity. It is also its most
profitable, by our reckoning, given its location. Jumbo opened four more outlets
in Singapore in 2002, 2004, 2006 and 2008. Its five restaurants in Singapore today
prepare more than 1.5m tonnes of crabs each day for hordes of hungry diners.
Average pax spending, according to a local foodie website, Hungrygowhere, is
SGD79. This is the highest in the group’s stable of five dining concepts.
Fig 5: JUMBO SEAFOOD restaurants in Singapore and China
No. of diners GFA (sf) Opened in
Singapore
- East Coast Seafood Centre 1,250 20,484 1987
- Riverside Point 280-300 5,447 2002
- The Riverwalk 280-300 5,965 2004
- NSRCC SAFRA @ Changi 280-300 7,309 2006
- Dempsey Hill 280-300 6,129 2008
China
- IAPM, Shanghai 250 12,239 2013
- Raffles City, Shanghai (new outlet) 200 7,368 Aug 2015
- IFC Mall, Shanghai (new outlet) 150 6,997 Jan 2016
Source: Company data, Maybank Kim Eng
January 3, 2016 7
Jumbo Group Ltd
2.2 Among the top 10 players locally Jumbo is among Singapore’s top 10 listed local restaurant groups by revenue.
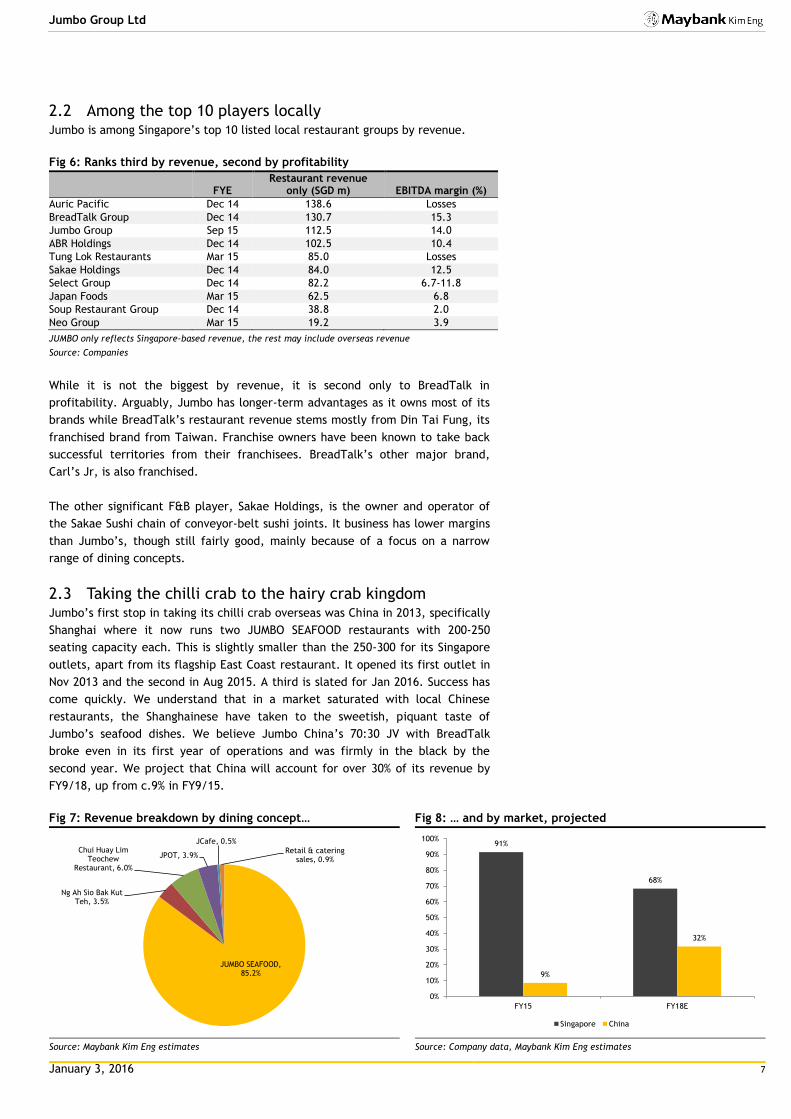
Fig 6: Ranks third by revenue, second by profitability
FYE Restaurant revenue
only (SGD m)
EBITDA margin (%)
Auric Pacific Dec 14 138.6 Losses
BreadTalk Group Dec 14 130.7 15.3
Jumbo Group Sep 15 112.5 14.0
ABR Holdings Dec 14 102.5 10.4
Tung Lok Restaurants Mar 15 85.0 Losses
Sakae Holdings Dec 14 84.0 12.5
Select Group Dec 14 82.2 6.7-11.8
Japan Foods Mar 15 62.5 6.8
Soup Restaurant Group Dec 14 38.8 2.0
Neo Group Mar 15 19.2 3.9
JUMBO only reflects Singapore-based revenue, the rest may include overseas revenue
Source: Companies
While it is not the biggest by revenue, it is second only to BreadTalk in
profitability. Arguably, Jumbo has longer-term advantages as it owns most of its
brands while BreadTalk’s restaurant revenue stems mostly from Din Tai Fung, its
franchised brand from Taiwan. Franchise owners have been known to take back
successful territories from their franchisees. BreadTalk’s other major brand,
Carl’s Jr, is also franchised.
The other significant F&B player, Sakae Holdings, is the owner and operator of
the Sakae Sushi chain of conveyor-belt sushi joints. It business has lower margins
than Jumbo’s, though still fairly good, mainly because of a focus on a narrow
range of dining concepts.
2.3 Taking the chilli crab to the hairy crab kingdom Jumbo’s first stop in taking its chilli crab overseas was China in 2013, specifically
Shanghai where it now runs two JUMBO SEAFOOD restaurants with 200-250
seating capacity each. This is slightly smaller than the 250-300 for its Singapore
outlets, apart from its flagship East Coast restaurant. It opened its first outlet in
Nov 2013 and the second in Aug 2015. A third is slated for Jan 2016. Success has
come quickly. We understand that in a market saturated with local Chinese
restaurants, the Shanghainese have taken to the sweetish, piquant taste of
Jumbo’s seafood dishes. We believe Jumbo China’s 70:30 JV with BreadTalk
broke even in its first year of operations and was firmly in the black by the
second year. We project that China will account for over 30% of its revenue by
FY9/18, up from c.9% in FY9/15.
Fig 7: Revenue breakdown by dining concept…
Source: Maybank Kim Eng estimates
Fig 8: … and by market, projected
Source: Company data, Maybank Kim Eng estimates
JUMBO SEAFOOD, 85.2%
Ng Ah Sio Bak Kut Teh, 3.5%
Chui Huay Lim Teochew
Restaurant, 6.0%
JPOT, 3.9%
JCafe, 0.5%
Retail & catering sales, 0.9%
91%
68%
9%
32%
0%
10%
20%
30%
40%
50%
60%
70%
80%
90%
100%
FY15 FY18E
Singapore China
January 3, 2016 8
Jumbo Group Ltd
2.4 Other hot & spicy brands that can also be exported Besides JUMBO SEAFOOD, which we estimate makes up c.85% of its revenue,
Jumbo has acquired or built a host of other dining concepts. We believe they can
also be exported to other countries, especially JPOT to China and Ng Ah Sio Bak
Kut Teh or Chui Huay Lim to countries with similar food and receptive
populations such as Malaysia or Thailand.
Ng Ah Sio Bak Kut Teh. Established in 1955, Jumbo acquired 51% of Ng Ah
Sio Investments in 2010, which operates an established bak kut teh
restaurant on Rangoon Road. This restaurant specialises in a Singapore
Teochew dish known as “white pepper” bak kut teh, a savoury pork-rib soup
prepared with toasted white pepper and garlic. Jumbo has proven to be a
supportive shareholder. Ng Ah Sio now has four outlets, up from just one
before its entry. After Jumbo came onboard in 2010, it added an Ng Ah Sio
food stall at the Rasapura Masters food court in Marina Bay Sands the same
year. This was followed by more outlets at a shophouse in Tanjong Katong
and on the premises of the Chui Huay Lim Club - a private Chinese clan
association - in 2012. Prices average SGD13-14 per pax, according to
Hungrygowhere.
JPOT hotpot restaurants. This is a fresh take on traditional hotpot dining
with a range of Singapore-style soup bases such as laksa (coconut-based
curry soup), silky porridge, tom yum (Thai spicy soup) and bak kut teh
(savoury pork broth). Jumbo owns and operates three JPOT outlets in
Singapore, with capacity for 160-210 diners each. Jumbo started this dining
concept in 2009 and added two more outlets in 2012 and 2014. Situated in
Vivocity, Tampines 1 and Parkway Parade, close to major population centres
and tourist attraction Sentosa, JPOT enjoys a locational advantage. Despite
higher rentals in these malls which are owned by REITs, our channel checks
suggest quick table turns and lean operations. For example, the outlet in
Vivocity can seat more than 200 but is staffed by only a service crew of 10.
Diners order through iPads and food is delivered within minutes. We
estimate at least three turns per table per night. The outlet is crowded even
on weekday nights. Prices average SGD35 per pax, according to
Hungrygowhere.
Fig 10: JPOT’s outlets
No. of diners Opened in Mall owner
Singapore
- Vivocity 160-210 2009 Mapletree Commercial Trust
- Tampines 1 160-210 2012 Asia Retail Mall Fund
- Parkway Parade 160-210 2014 Parkway Parade Partnership Ltd - 46%-owned by NTUC Income, 33% by PGGM Real Estate Fund
Source: Company, Maybank Kim Eng
Chui Huay Lim Teochew Cuisine. Serving authentic Teochew cuisine, this
restaurant is located at the Chui Huay Lim club, a private clan association
for Teochew businessmen. It serves an extensive menu of classic Teochew
dishes and offers Teochew porridge with more than 20 side dishes during
lunch. Seating capacity is 1,000 with nine private dining rooms and two
banquet halls. Average pax spending is SGD50, according to Hungrygowhere.
J Café. The latest dining concept launched in 2014, essentially on the
golfers’ terrace of the National Service Resort & Country Club, J Cafe serves
Singapore hawker classics. As it is this should have been a package deal with
the JUMBO SEAFOOD restaurant on the same premises, its rentals may be
lower.
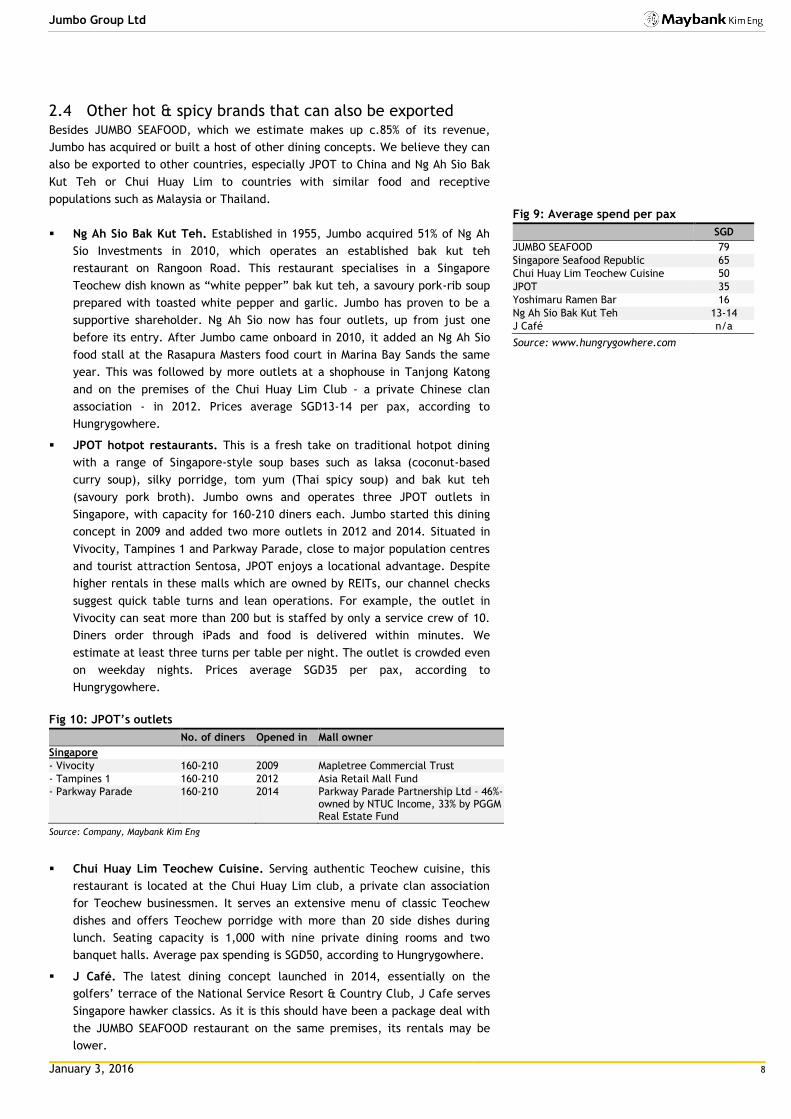
Fig 9: Average spend per pax
SGD
JUMBO SEAFOOD 79
Singapore Seafood Republic 65
Chui Huay Lim Teochew Cuisine 50
JPOT 35
Yoshimaru Ramen Bar 16
Ng Ah Sio Bak Kut Teh 13-14
J Café n/a
Source: www.hungrygowhere.com

January 3, 2016 9
Jumbo Group Ltd
Finally, Jumbo manages and invests in two other dining concepts: the Singapore
Seafood Republic (SSR) chain of Singapore-style seafood cuisine in Singapore and
Japan, and Yoshimaru Ramen Bar in Holland Village. It operates these through
two JVs: SRPL for the SSR outlets in Japan plus Yoshimaru in Singapore; and SSR
Singapore for the SSR outlet in Singapore. At the moment, their profit
contributions are booked under associates and are not significant.

January 3, 2016 10
Jumbo Group Ltd
3. Industry Potential
3.1 Singapore on the global foodie’s trail… According to the Singapore Tourism Board (STB), shopping and F&B spending
makes up the bulk of domestic tourism revenue, at 21% and 10% respectively.
Singapore is widely regarded as a top eating capital in the Asia Pacific, with
ample food haunts and trails. In recent years, its restaurant scene has
blossomed, with the number of restaurants up from 2,041 in 2008 to 2,480 in
2013, according to SingStat.
There were 6,751 F&B establishments in Singapore in 2013 with restaurants
accounting for about a third. While restaurants have not grown as quickly as
other segments such as catering, they account for the largest chunk of revenue
and are growing the fastest, especially chain restaurants that can exploit size
advantages when negotiating for rental space in Singapore’s REIT-controlled
shopping malls.
The gastronomy bar has also been raised with the entry of renowned chefs like
Joël Robuchon (L’Atelier and Joël Robuchon Restaurant at Resorts World
Sentosa), Tetsuya Wakuda (Waku Ghin at MBS), Jamie Oliver (Jamie’s Italian at
Forum and Vivocity) and Gordon Ramsay (Bread Street Kitchen).1
Fig 11: Restaurants comprise 37% of F&B establishments…
Source: SingStat
Fig 12: …and 40% of operating receipts
Source: SingStat
Fig 13: They have been growing the fastest of all the F&B operations
Source: SingStat
1 source: www.stb.gov.sg/industries/dining-and-retail
January 3, 2016 11
Jumbo Group Ltd
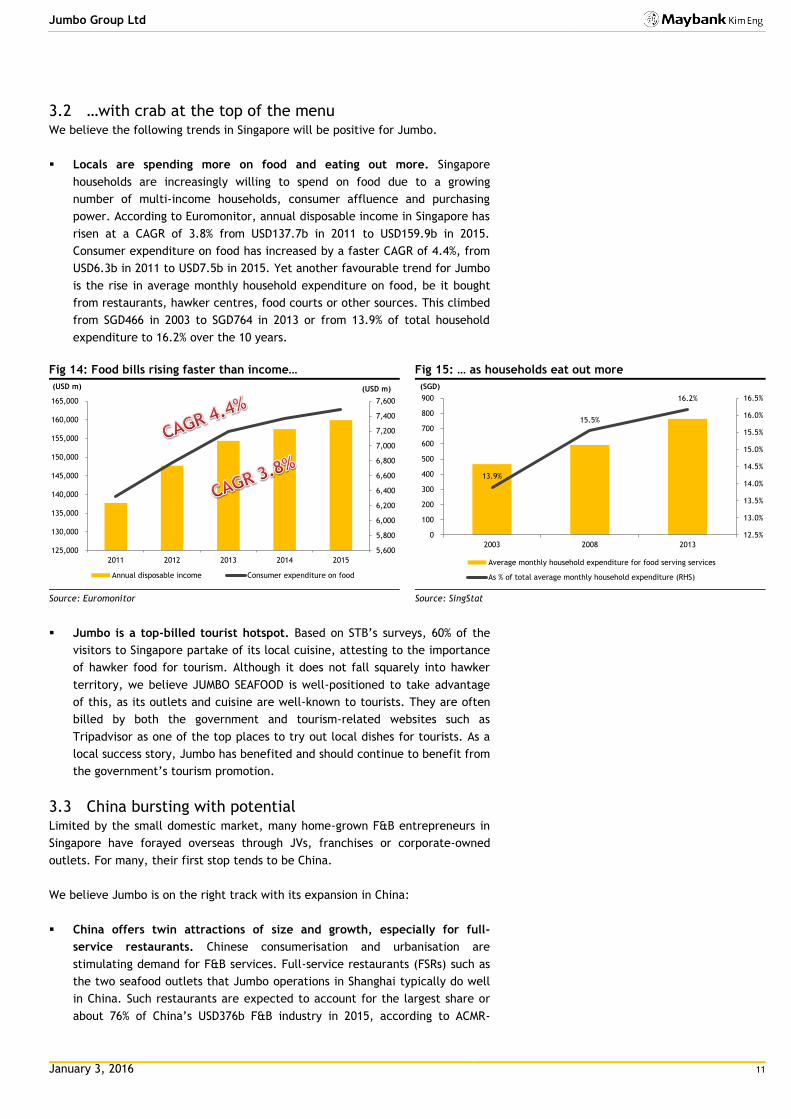
3.2 …with crab at the top of the menu We believe the following trends in Singapore will be positive for Jumbo.
Locals are spending more on food and eating out more. Singapore
households are increasingly willing to spend on food due to a growing
number of multi-income households, consumer affluence and purchasing
power. According to Euromonitor, annual disposable income in Singapore has
risen at a CAGR of 3.8% from USD137.7b in 2011 to USD159.9b in 2015.
Consumer expenditure on food has increased by a faster CAGR of 4.4%, from
USD6.3b in 2011 to USD7.5b in 2015. Yet another favourable trend for Jumbo
is the rise in average monthly household expenditure on food, be it bought
from restaurants, hawker centres, food courts or other sources. This climbed
from SGD466 in 2003 to SGD764 in 2013 or from 13.9% of total household
expenditure to 16.2% over the 10 years.
Fig 14: Food bills rising faster than income…
Source: Euromonitor
Fig 15: … as households eat out more
Source: SingStat
Jumbo is a top-billed tourist hotspot. Based on STB’s surveys, 60% of the
visitors to Singapore partake of its local cuisine, attesting to the importance
of hawker food for tourism. Although it does not fall squarely into hawker
territory, we believe JUMBO SEAFOOD is well-positioned to take advantage
of this, as its outlets and cuisine are well-known to tourists. They are often
billed by both the government and tourism-related websites such as
Tripadvisor as one of the top places to try out local dishes for tourists. As a
local success story, Jumbo has benefited and should continue to benefit from
the government’s tourism promotion.
3.3 China bursting with potential Limited by the small domestic market, many home-grown F&B entrepreneurs in
Singapore have forayed overseas through JVs, franchises or corporate-owned
outlets. For many, their first stop tends to be China.
We believe Jumbo is on the right track with its expansion in China:
China offers twin attractions of size and growth, especially for full-
service restaurants. Chinese consumerisation and urbanisation are
stimulating demand for F&B services. Full-service restaurants (FSRs) such as
the two seafood outlets that Jumbo operations in Shanghai typically do well
in China. Such restaurants are expected to account for the largest share or
about 76% of China’s USD376b F&B industry in 2015, according to ACMR-
5,600
5,800
6,000
6,200
6,400
6,600
6,800
7,000
7,200
7,400
7,600
125,000
130,000
135,000
140,000
145,000
150,000
155,000
160,000
165,000
2011 2012 2013 2014 2015
(USD m)(USD m)
Annual disposable income Consumer expenditure on food
13.9%
15.5%
16.2%
12.5%
13.0%
13.5%
14.0%
14.5%
15.0%
15.5%
16.0%
16.5%
0
100
200
300
400
500
600
700
800
900
2003 2008 2013
(SGD)
Average monthly household expenditure for food serving services
As % of total average monthly household expenditure (RHS)

January 3, 2016 12
Jumbo Group Ltd
IBISWorld. The market has grown by an 11% CAGR since 2010.2 FSRs are
particularly relevant for big cities such as Shanghai, which now offer a
dizzying variety of international cuisines to expats and an increasingly
wealthy local middle class. Shanghai alone has more than 58,000 restaurants
touting 10 regional and 11 international cuisines, according to EURObiz, the
European Union Chamber of Commerce in China.3
Singapore-style cuisine works in China. According to Jumbo, Singapore’s
cuisine has been warmly embraced by the Shanghainese, as its sweetish,
lightly-spicy taste contrasts well with local flavours that are heavily spiced
eg Sichuan or Beijing cuisine. Moreover, Shanghainese are used to eating
crabs, since they have their own hairy-crab dishes. Unlike the hairy crab
which comes into season only in Oct-Dec, Jumbo’s chilli crab is available all
year round. Still, as management is cautious about whether its crab-based
seafood would work outside Shanghai, we believe further expansion for
JUMBO SEAFOOD will be limited to Shanghai for now. Outside Shanghai,
Jumbo is likely to try out its other dining concepts.
Positive hotpot precedent for Jumbo. One dining concept that has found
favour in China is hotpots. We believe its successful expansion in the past
reflects well on Jumbo. The Mongolian hotpot chain, Little Sheep Group
acquired by YUM! Brands, is China’s second-largest FSR chain after Pizza
Hut. YUM!’s 2011 acquisition underscored China’s multi-tiered nature of
demand in China. While demand for high-end, Western-style dining options
from global chains is still significant and growing, Euromonitor believes there
remains untapped demand for more familiar and affordable offerings from
chains such as Little Sheep, which combine more familiar dishes with a
clean, consistent chain experience that is highly appealing. Jumbo’s chain of
hotpot restaurants in Singapore under its JPOT brand with Singapore-
flavoured soups could be brought into play in China at some point, in our
view. Given its high margins, we would not be surprised if Jumbo rolls out
JPOT as its second exportable brand in China sometime in the future.
2 http://www.ibisworld.com/industry/china/full-service-restaurants.html 3 http://www.eurobiz.com.cn/food-thought-investing-chinas-fb-industry/
January 3, 2016 13
Jumbo Group Ltd
4. Growth Drivers
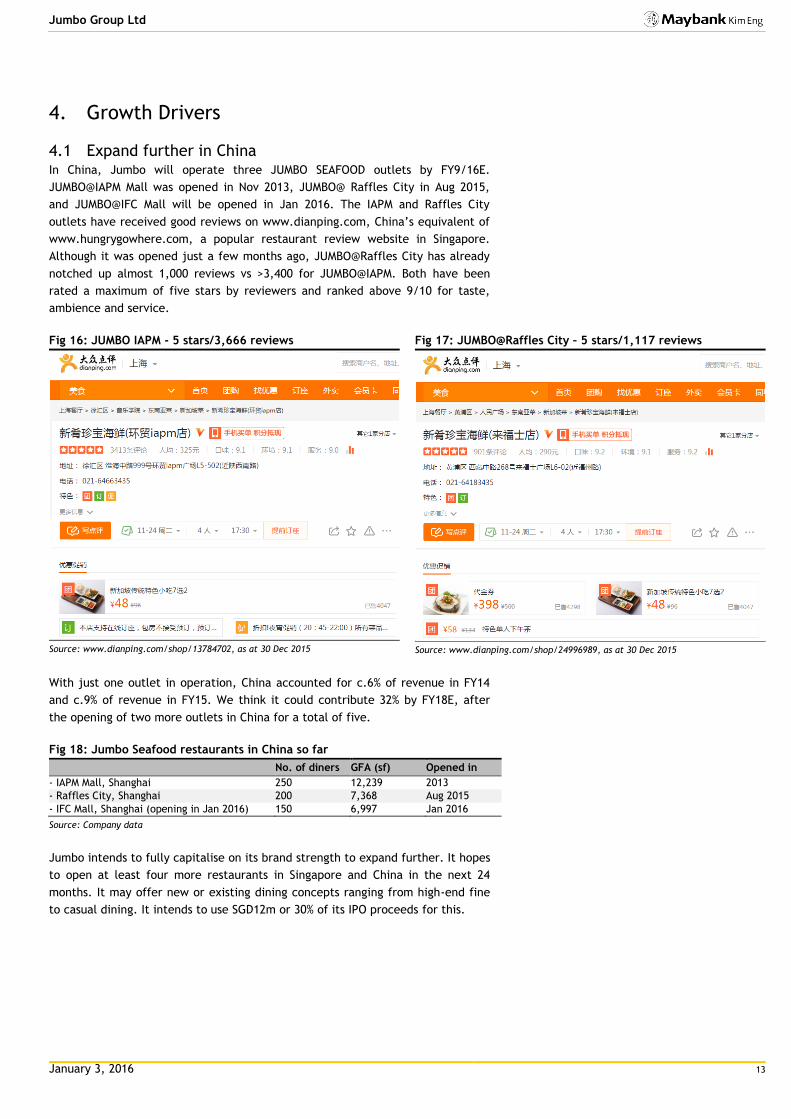
4.1 Expand further in China In China, Jumbo will operate three JUMBO SEAFOOD outlets by FY9/16E.
JUMBO@IAPM Mall was opened in Nov 2013, JUMBO@ Raffles City in Aug 2015,
and JUMBO@IFC Mall will be opened in Jan 2016. The IAPM and Raffles City
outlets have received good reviews on www.dianping.com, China’s equivalent of
www.hungrygowhere.com, a popular restaurant review website in Singapore.
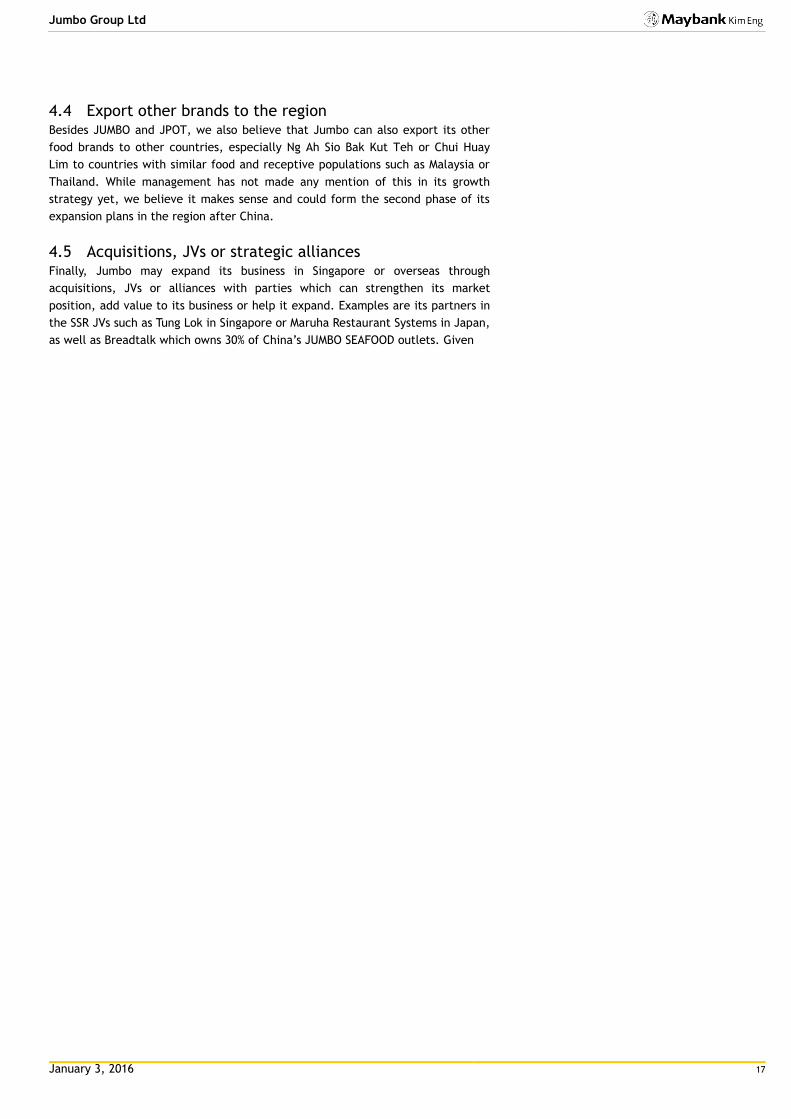
Although it was opened just a few months ago, JUMBO@Raffles City has already
notched up almost 1,000 reviews vs >3,400 for JUMBO@IAPM. Both have been
rated a maximum of five stars by reviewers and ranked above 9/10 for taste,
ambience and service.
Fig 16: JUMBO IAPM - 5 stars/3,666 reviews
Source: www.dianping.com/shop/13784702, as at 30 Dec 2015
Fig 17: JUMBO@Raffles City – 5 stars/1,117 reviews
Source: www.dianping.com/shop/24996989, as at 30 Dec 2015
With just one outlet in operation, China accounted for c.6% of revenue in FY14
and c.9% of revenue in FY15. We think it could contribute 32% by FY18E, after
the opening of two more outlets in China for a total of five.
Fig 18: Jumbo Seafood restaurants in China so far
No. of diners GFA (sf) Opened in
- IAPM Mall, Shanghai 250 12,239 2013
- Raffles City, Shanghai 200 7,368 Aug 2015
- IFC Mall, Shanghai (opening in Jan 2016) 150 6,997 Jan 2016
Source: Company data
Jumbo intends to fully capitalise on its brand strength to expand further. It hopes
to open at least four more restaurants in Singapore and China in the next 24
months. It may offer new or existing dining concepts ranging from high-end fine
to casual dining. It intends to use SGD12m or 30% of its IPO proceeds for this.

January 3, 2016 14
Jumbo Group Ltd
4.2 Attractive locations secured in China Jumbo appears to have formed a strong working relationship with Sun Hung Kai
Properties (SHK), which owns both the IAPM Mall and IFC Mall. IAPM Mall houses
its first outlet opened in Nov 2013 while IFC Mall will soon host its third in Jan
2016. SHK (16 HK) is one of the largest property companies in Hong Kong, owned
by the Kwok brothers. It has a strong presence in China as an owner and
developer of residential, office and hotel properties.
IAPM Mall: Opened in Aug 2013, IAPM Mall is an upscale mall with a late-night
shopping concept. It is part of the integrated Shanghai ICC development, which
sits on Huaihai Middle Road in the busy commercial district of Puxi. The whole
development comprises two office towers, a shopping mall and deluxe
residences. With 1.3m sf of shopping GFA, the mall is fully leased out. In its
latest results presentation, SHK continued to report strong traffic growth and
tenant sales. This location is promising as it sits at the interchange of three
major metro lines.
Fig 19: IAPM Mall is at the interchange of Shanghai metro lines 1, 10 and 12, accessible by Shanxi Nan Lu station
Source: Shanghai ICC
IFC Mall: Mostly completed in 2010 but continuing to be upgraded, IFC Mall is
part of the Shanghai IFC integrated development located in the Pudong Lujiazui
Finance and Trade Zone. Jumbo’s third outlet will open here in Jan 2016. We are
equally optimistic on this high-end location on the famous Lujiazui roundabout,
near tourist attractions such as the Oriental Pearl Tower and Super Brand Mall.
The two towers are also home to the five-star Ritz Carlton Shanghai and the
Shanghai HQ of HSBC in China. It can be accessed via Lujiazui station on Metro
Line 2 and is just across the road from the bustling Super Brand Mall.

January 3, 2016 15
Jumbo Group Ltd
Fig 20: Shanghai IFC at the Lujiazui roundabout, near famous landmarks such as the Oriental Pearl Tower
Source: Shanghai IFC
Figure 21: Shanghai ICC in Puxi, site of IAPM Mall
Source: Sun Hung Kai Properties, FY14/15 annual results presentation
Figure 22: Shanghai IFC in Pudong, site of IFC Mall
Source: Sun Hung Kai Properties, FY14/15 annual results presentation
Raffles City: Jumbo’s second outlet was opened in Raffles City Shanghai in Aug
2015. Owned by Capitaland Mall Asia, this is a bustling mid-to-high-end mall
located at Xizang Middle Road in Shanghai’s downtown. The mall is close to
tourist haunts such as People’s Square, Nanjing Road Pedestrian Street, Shanghai
Museum and Shanghai Municipal Building with connectivity to People’s Square
subway station.

January 3, 2016 16
Jumbo Group Ltd
4.3 Part of the solution for China’s retail challenges Malls in China have had to evolve or devolve to deal with the country’s economic
slowdown. Retail sales, though still growing, have slowed, especially at the high-
end where big lux brands such as Prada, Chanel and LV have closed stores in the
past two years. Online shopping is having an adverse impact on bricks and mortar
retail, as is the import taxes that result in higher prices within China, leading
many to shop overseas or take advantage of daigou agents to provide overseas
buying services. The anti-corruption campaign by the government has also led to
a sharp halt in “gifting” luxury items in business deals.
In evolving to the changing landscape, the retail experience in China in becoming
less about shopping and buying products, but for leisure, entertainment, eating &
drinking and other social fulfilment concepts that bring differentiation to a highly
competitive retail environment. These include areas for children, unique food &
beverage options, live entertainment such as music or fashion shows, cinemas,
ice skating rinks, bowling alleys, etc. Malls have become destinations in
themselves, drawing in people to enjoy a day out and fill their leisure time with
activities that distract them from the daily grind.
Strong mall operators such as Sun Hung Kai Properties and Capitaland Mall Asia
are able to do this because they own the entire property and are able to provide
a unique shopping experience with a planned tenant mix. A key part of iAPM
Mall’s success is offering longer hours. The mall is open until 11pm for shops and
midnight for dinner and drinks. It has a wide range of entertainment, including a
6-screen IMAX cinema complex that accommodates more than 1,000 viewers.
Also, it has a successful social media loyalty program called VIC with over 1.7m
Weibo followers.
Where it applies to Jumbo, mall operators are setting aside 30-40% of the gross
floor area for food & beverage, up from 10-15% before 2007, according to real
estate consultancy CBRE. More F&B and entertainment space makes sense,
especially since Chinese malls are often integrated with residential projects. As
such, operators are also looking out for unique F&B options, such as what Jumbo
can offer. In terms of the broad numbers, this strategy appears to be working. A
report by the China Hotel Association said that F&B revenue in China rebounded
9.7% in 2014 after three years of slowdown.4
The trend to having more food-related activities as part of the high-end shopping
experience is in-line with what luxury brand companies are doing globally as
well. Food is a resilient business because restaurant meals are relatively
inexpensive pleasures compared to luxury shopping. According to Asia Retail
Partners, a HK retail consultancy, the next big wave in China is food as mainland
Chinese are eager to discover a new lifestyle. As a result, more and more lux
brands have entered the high-end food sector through acquisitions and restaurant
or café openings.
In 2014, LVMH acquired Milanese coffee house Pasticceria Confetteria Cova
Srl and took it to Beijing in 2015, with plans for Taiwan in 2016.5
In 2014, L Capital, LVMH’s private equity arm, bought Singapore’s Crystal
Jade, a chain of over 100 Chinese restaurants across Asia.6
In 2015, Gucci opened the world’s first Gucci Café in iAPM Mall in Shanghai.7
4 www.ibtimes.com/chinas-food-beverage-industry-rebounding-amid-anti-corruption-drive-1924543 5 http://www.straitstimes.com/lifestyle/food/the-pastry-war 6 http://www.lcapitalasia.com/portfolio_detail/crystal-jade 7 jingdaily.com/luxury-brands-break-into-food-business-to-reach-chinas-shoppers/#.VnC_10p97tQ
Fig 23: China retail sales growth slowing
Source: National Bureau of Statistics
January 3, 2016 17
Jumbo Group Ltd
4.4 Export other brands to the region Besides JUMBO and JPOT, we also believe that Jumbo can also export its other
food brands to other countries, especially Ng Ah Sio Bak Kut Teh or Chui Huay
Lim to countries with similar food and receptive populations such as Malaysia or
Thailand. While management has not made any mention of this in its growth
strategy yet, we believe it makes sense and could form the second phase of its
expansion plans in the region after China.
4.5 Acquisitions, JVs or strategic alliances Finally, Jumbo may expand its business in Singapore or overseas through
acquisitions, JVs or alliances with parties which can strengthen its market
position, add value to its business or help it expand. Examples are its partners in
the SSR JVs such as Tung Lok in Singapore or Maruha Restaurant Systems in Japan,
as well as Breadtalk which owns 30% of China’s JUMBO SEAFOOD outlets. Given

January 3, 2016 18
Jumbo Group Ltd
5. Barriers to Entry
5.1 Competitive with a clear path to growth Unlike Ngiam Tong Boon, a bartender widely credited to be the creator of the
Singapore Sling in the early 1900s, Jumbo is not the inventor of the chilli crab.
That honour goes to Mdm Cher Yam Tian of Roland Restaurant. In fact, its
signature dishes – chilli crab and black pepper crab – are widely available in
Singapore, varying only with the creativity of the chef.
Jumbo prices its signature crab dishes at a market-topping SGD78/kg.
Anecdotally, the market range is SGD45-80/kg. The lower-end prices can be
found in eating places such as non-air-conditioned coffee shops or industrial food
centres. Higher-end establishments such as JUMBO can charge more as they are
located in popular dining enclaves such as the East Coast Seafood Centre, Clarke
Quay or Dempsey Hill that also serve tourists. Despite similar dishes at lower
prices, we do not view the lower-end places as direct competitors of JUMBO.
For investors, however, the formulation, origin or price points of this dish are not
determinants for their investment, in our view. What matters should be the
following:
Great branding and marketing – Lower-end seafood places do not have the
branding, marketing reach or scale of Jumbo. Locals may claim that
Mellben’s or Roland’s crabs taste better, but they may equally choose to eat
at JUMBO whenever they want to be assured of consistency in taste and
ambience. For tourists, JUMBO is usually their dining destination of choice.
Arguably, locals also introduce their foreign friends to JUMBO for their first
“typical” taste of seafood in Singapore, on the reasonable assumption that
JUMBO is likely to leave a good impression with the tourists, not bad.
Growing footprint of outlets and brands – Now up to five brands, of which
only one is seafood-related, and 16 outlets in Singapore and China. The
growing footprint will serve Jumbo well in dealing with future competitive
pressures, in our view.
Well-tested systems and execution – This footprint is backed by a 10,000 sf
central kitchen and processes that allow it to reduce costs, maximise
revenue per staff, achieve consistency in food quality and tastes, and try out
more dining concepts with lower risk.
Clear expansion strategy – Jumbo intends to open four new outlets in the
next two years in Singapore and China. For its overseas story, it plans to
focus on China first, specifically Shanghai and JUMBO. Its first outlet in
China, opened in 2013, has been so successful that it will have three outlets
there by 2016.
5.2 Food quality & safety a key mantra Jumbo’s reputation and branding should work in its favour in China. As a
Singapore company, we believe Chinese consumers can be confident that the
quality of its ingredients, food preparation and food service are second to none.
This should appeal to the average Chinese consumer who is by now extremely
wary and demanding when it comes to food safety.
Jumbo only buys its ingredients from a list of approved suppliers and kitchen
staff must adhere to strict procedures in preparing and handling dishes.
According to management, even the crabs sold in its Shanghai outlets are
imported live from Singapore to ensure freshness and quality.

January 3, 2016 19
Jumbo Group Ltd
To further ensure high food-safety standards, Jumbo applies the HACCP safety
management system to all its operations. HACCP stands for Hazard Analysis and
Critical Control Point. While it is also used in non-food industries such as
chemicals and pharmaceuticals, its seven principles8 are just as applicable to the
food industry, namely:
(1) Identify hazards in each step, from purchasing, delivery and storage to
preparation, cooking and chilling
(2) Determine critical control points (CCPs) that ensure the control of the
hazards eg cooking raw meat thoroughly to kill pathogens
(3) Establish critical limits to facilitate the identification of a CCP when it is out
of control eg when cooking beef burgers, the centre of the burger must
reach a certain temperature to ensure the destruction of pathogens
(4) Establish a system to monitor control of the CCP
(5) Take corrective measures when monitoring indicates that a particular CCP is
not under control
(6) Establish procedures for confirmation that the HACCP system is working
effectively
(7) Establish documentation for all procedures
5.3 Expand central kitchen & IT to enhance scalability Jumbo’s central kitchens in Singapore and China prepare sauces and marinades,
process certain food ingredients and roll out semi-finished food products such as
marinated meats for its outlets. This way, quality and taste are controlled and
standardised. According to management, it does not need to station a master
chef at each outlet as the central kitchen is able to standardise the critical
ingredients and food preparations.
Jumbo’s 10,000 sf central kitchen in Singapore supplies to its local and China
outlets. Although located within the same building, it is separate from its
corporate offices and other kitchens. Jumbo intends to utilise SGD11.5m or 29%
of its IPO proceeds to bring together its operations under one roof in either
acquired or leased premises. It also wants to acquire new equipment and
machinery. In China, Jumbo has a small facility for marinating ingredients,
although its all-important pastes and spices are imported from Singapore to
protect its recipes. It also imports live crabs and certain critical herbs such as
lemongrass from Singapore. At some point, it may expand this operation.
Central kitchens are crucial to Jumbo’s operations as they can support scalability
as it expands its network. Their advantages are:
Ensuring food consistency. Before Jumbo opened its central kitchen in
2008, even its signature crab differs in taste from outlet to outlet. This is no
longer an issue as its central kitchen standardises the pastes and spices.
Jumbo has also found a way to reproduce its signature dishes easily, such
that even junior chefs can prepare the dish. This does away with the need to
employ expensive onsite master chefs.
Space and time savings. Laborious work such as washing and chopping are
done by kitchen helpers at its central kitchen. This leaves its chefs fresh to
work the whole night, to focus on food consistency. Furthermore, food
8 https://www.fsai.ie/food_businesses/haccp/principles_of_haccp.html
January 3, 2016 20
Jumbo Group Ltd
preparation starts at 2pm at its central kitchens instead of 5pm at each site,
saving on space and allowing for faster table turns.
Greater automation. Jumbo’s central kitchens use automation which
requires just 1-2 workers to produce sauces and spices for all its outlets.
Finally, Jumbo is big on using IT to improve efficiency and productivity. It was
among the first F&B establishments in Singapore to use integrated front-end
point-of-sale systems, whereby iPads and mobile POS terminals are used to take
orders that go straight to the kitchen. This leaves servers with more time to
attend to customers. Jumbo works with chope.com for online reservations for all
its outlets except Ng Ah Sio and J Café, which do not take reservations. Queuing
is also automated. Upon entering their mobile numbers, customers waiting for
their tables can leave and an SMS will alert them when their tables are ready.
A capable back-end IT system gives management timely information. We
understand that the implementation of an ERP system by early 2016 will give
management access to sales and cost data that are updated every five minutes.
This upgrade should allow management to respond faster to dining conditions.
For example, management will be aware of slow nights at a particular restaurant
in real time or slow-selling dishes. It can immediately instruct servers to respond
with special offers to diners.

January 3, 2016 21
Jumbo Group Ltd
6. Forecasts & Assumptions
6.1 Sales to grow by 16% CAGR, NP 13% in FY16E-18E We forecast sales to rise by 19%/15%/13% and core net profit to grow by
9%/11%/20% in FY16E/17E/18E. The revenue spike in FY16E is due mainly to the
addition of two JUMBO outlets in China. However, we expect FY16E NP growth to
be lower at 9% as we assumed that these two outlets will need a year to break
even. Thereafter however, NP growth should accelerate to 11% in FY17E and 20%
in FY18E as they start to positively contribute in the second year. While we
expect Jumbo to continue to open new outlets each year (eg one outlet per year
in China assumed with an additional outlet in Singapore assumed for FY17E), the
pace should be less frenetic and will allow the existing outlets to better cover
start-up costs of new outlets.
Fig 24: Revenue/net profit CAGRs of 16%/13% in FY15-18E…
Source: Company data, Maybank Kim Eng
Fig 25: … mainly from one new outlet per year in China
Source: Company data, Maybank Kim Eng
6.2 China to be the main growth driver China is expected to generate the biggest revenue and earnings growth for
Jumbo, justifying the addition of four outlets in FY15-FY18E, of which two have
been confirmed for FY15-FY16E. The early results have been overwhelmingly
positive for Jumbo. China accounted for 6% of group revenue in the year that its
first outlet opened in FY14. This number climbed to 9% by the second year in
FY15, all from just the one outlet in IAPM Mall. Profitability was achieved by the
end of the first year. The additional outlets we have forecasted are expected to
lift China’s revenue contributions to 32% by FY18E, with the biggest jump in
FY16E from two new outlets opened in Aug 2015 and Jan 2016 respectively.
Fig 26: China is expected to account for 32% of group revenue by FY18E…
Source: Company data, Maybank Kim Eng
Fig 27: …far outperforming Singapore’s single-digit growth
Source: Company data, Maybank Kim Eng
3%
9%
11%
20%
9%
19%
15%
13%
0%
5%
10%
15%
20%
25%
0
50,000
100,000
150,000
200,000
250,000
FY15 FY16E FY17E FY18E
(SGD'000)
Revenue Core NP
Core NP growth (RHS) Revenue growth (RHS)
5 5 5 5
6 6
1
2
3
4
5
0
1
2
3
4
5
6
7
FY13 FY14 FY15 FY16E FY17E FY18E
Singapore JUMBO China JUMBO
100%94% 91%
79%73% 68%
6% 9%
21%27% 32%
0%
10%
20%
30%
40%
50%
60%
70%
80%
90%
100%
FY13 FY14 FY15 FY16E FY17E FY18E
Singapore China
6% 4% 5% 7%
60%
189%
53%
31%
0%
20%
40%
60%
80%
100%
120%
140%
160%
180%
200%
0
20,000
40,000
60,000
80,000
100,000
120,000
140,000
FY15 FY16E FY17E FY18E
(SGD'000)
Singapore China
Singapore growth (RHS) China growth (RHS)

January 3, 2016 22
Jumbo Group Ltd
6.3 Optimistic on China expansion Based on our estimates, Jumbo’s first China seafood outlet at IAPM Mall should
have been profitable by the end of the first year. We believe its ROI is very high
as spending per pax in China tends to exceed Singapore’s with lower operating
costs. Its China prices are higher as crabs and sauces are imported from
Singapore but margins are better as other ingredients such as meat and
vegetables are sourced locally and sold at Singapore prices. Rental and labour
costs are also estimated to be lower than in Singapore due to preferential rental
rates from landlords and the employment of students/interns who are known to
be willing to trade lower wages for work experience.
At full operation, the investment payback time for an outlet could be as good as
three years with an ROI of 32%, assuming one table turn per night. Furthermore,
assuming Jumbo is able to capitalise on the positive impact it has made on the
local market so far by driving up table turns to an average of two per night, its
outlet payback could be as short as 1-2 years with an ROI of 86%, by our
estimates. Arguably, returns could be even better as we did not control for staff
and utility costs which are semi-variable for an F&B business. Just because
revenue doubles, staff and utility costs may not double along with it. Hence, we
believe our analysis is still conservative.
Fig 28: China ROI - our analysis of JUMBO IAPM’s performance
FY14 % of revenue 1 turn/night 2 turns/night YoY chg
Months of operation, opened in Nov 2013 10 12 12
Revenue (SGD'000) 6,529
12,000 24,000
Revenue (CNY'000), @ 4.50 CNY/SGD 29,381
54,000 108,000 100%
Revenue/table/month (CNY) 9,794
18,000 36,000
Revenue/table/night (CNY) 326
600 1,200
Table turns/night 1
1 2
Revenue/pax (CNY), based on 2 pax/table, 1 turn/night & dianping.com average spend/pax
163.2 300.0 300.0
Depreciation (assume 10 years) (1,125) 4% (1,125) (1,125)
Food costs (8,814) 30% (16,200) (32,400)
Rental costs (2,350) 8% (4,320) (4,320)
Gross profit (CNY'000) 17,091
32,355 70,155 117%
Gross margin 58%
60% 65% Staff costs (4,407) 15% (8,100) (16,200) EBIT 12,684
24,255 53,955 122%
EBIT margin 43%
45% 50% Utilities cost (2,938) 10% (5,400) (10,800) Other opex (5,876) 20% (10,800) (21,600) Pretax profit (CNY'000) 3,870
8,055 21,555 168%
Taxation, assume 25% statutory rate (967)
(2,014) (5,389) Minorities (30% owned by Breadtalk) (1,161)
(2,417) (6,467)
Net profit (CNY'000) 1,741
3,625 9,700 168%
Net margin 6%
7% 9%
Return on investment 15%
32% 86%
Payback period (years) 6.5
3.1 1.2
Estimated capex (CNY'000) 11,250
No. of tables 250
Source: Maybank Kim Eng estimates

January 3, 2016 23
Jumbo Group Ltd
6.4 Singapore a sturdy mainstay Against the backdrop of a surging China, Singapore’s growth is expected to be
mid-to-high single digits, stoked largely by the performance of existing JUMBO
restaurants as well as the expansion of the JUMBO and JPOT network.
Singapore’s growth should mainly centre on diner growth and higher table spend,
especially at JUMBO outlets:
Improving diner volume. We are confident that Jumbo can continue to draw
customers to its flagship brands such as JUMBO SEAFOOD, JPOT or Ng Ah Sio
as they are established names serving popular cuisine. The trick is to
improve table turns. Jumbo has slick front-end service which includes online
reservations, an SMS-based queuing system and electronic order-taking.
When its new ERP system comes online, management can moreover access
sales and cost data that are updated every five minutes. This upgrade should
allow for a faster response to dining conditions.
Raising the price of crabs. According to Maybank Kim Eng’s in-house
foodies, Jumbo raised its crab prices twice last year from SGD68/kg to
SGD72/kg and further to SGD78/kg early this year. These hikes did not seem
to have been necessitated by costlier crabs as crab costs rose only a tame 6%
vs its FY15 revenue growth of 9%. Rather, prices were raised apparently to
offset higher rental costs and allow Jumbo to maintain its gross margins.
With full-year effects, we expect gross margins to improve in FY16.
For the organic growth of the existing outlets, we have predicated Singapore
growth on the following:
3% growth in average table spend for JUMBO (vs a more robust 5% for JUMBO
in China to account for the newness of the dining concept and brand)
1% growth in average table spend for Ng Ah Sio, Chui Huay Lim, JPOT and J
Café
To account for expansion of new outlets, our forecasts assumed the following:
The addition of one new 285-table JUMBO outlet, its sixth, in FY17E.
The addition of one new 50-table JPOT outlet, its fourth, in FY17E.
Obviously, this assumes that Jumbo is able to find suitable locations, especially
for JUMBO outlets which are usually found in tourist hotspots near rivers, the sea
or in foodie haunts such as Dempsey Hill. We do not preclude the possibility that
Jumbo could launch new dining concepts and the new outlets could involve new
brands instead of existing brands.
6.5 Why do we believe future expansion will favour JUMBO
and JPOT? Subject to finding the right locations at the right costs, we believe that
management is more likely to expand JPOT and JUMBO than its other dining
concepts. By our estimates, JUMBO SEAFOOD and JPOT command the best
margins, both gross and operating. These are followed by Ng Ah Sio Bak Kut Teh,
Chui Huay Lim Teochew Restaurant and J Café, in that order. Nevertheless, we
estimate that all its dining concepts are able to command gross margins of at
least 40% up to 60% for its flagship brands.
We believe food costs for JUMBO SEAFOOD and JPOT are among the lowest in the
group, given their central-kitchen modus operandi. JPOT’s ingredients are mainly
raw, with little to no preparation except for cutting and marinating. These can
be centralised. We also believe JUMBO’s food costs are below the group average
January 3, 2016 24
Jumbo Group Ltd
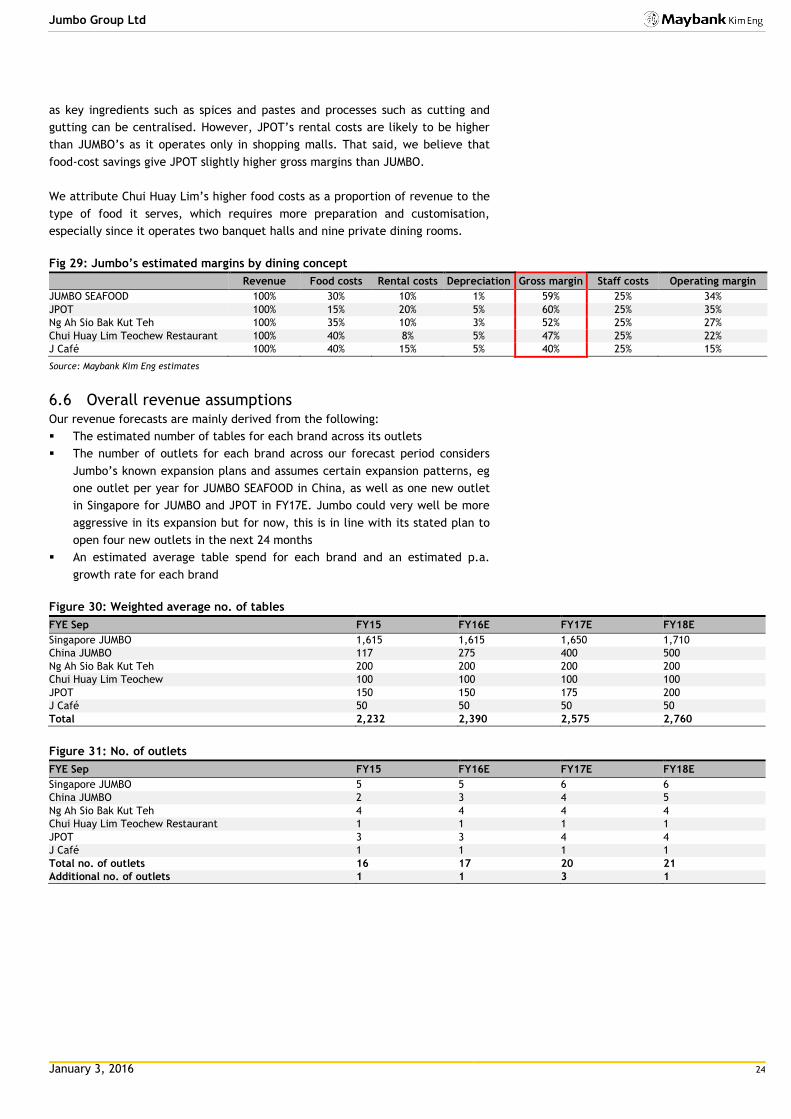
as key ingredients such as spices and pastes and processes such as cutting and
gutting can be centralised. However, JPOT’s rental costs are likely to be higher
than JUMBO’s as it operates only in shopping malls. That said, we believe that
food-cost savings give JPOT slightly higher gross margins than JUMBO.
We attribute Chui Huay Lim’s higher food costs as a proportion of revenue to the
type of food it serves, which requires more preparation and customisation,
especially since it operates two banquet halls and nine private dining rooms.
Fig 29: Jumbo’s estimated margins by dining concept
Revenue Food costs Rental costs Depreciation Gross margin Staff costs Operating margin
JUMBO SEAFOOD 100% 30% 10% 1% 59% 25% 34%
JPOT 100% 15% 20% 5% 60% 25% 35%
Ng Ah Sio Bak Kut Teh 100% 35% 10% 3% 52% 25% 27%
Chui Huay Lim Teochew Restaurant 100% 40% 8% 5% 47% 25% 22%
J Café 100% 40% 15% 5% 40% 25% 15%
Source: Maybank Kim Eng estimates
6.6 Overall revenue assumptions Our revenue forecasts are mainly derived from the following:
The estimated number of tables for each brand across its outlets
The number of outlets for each brand across our forecast period considers
Jumbo’s known expansion plans and assumes certain expansion patterns, eg
one outlet per year for JUMBO SEAFOOD in China, as well as one new outlet
in Singapore for JUMBO and JPOT in FY17E. Jumbo could very well be more
aggressive in its expansion but for now, this is in line with its stated plan to
open four new outlets in the next 24 months
An estimated average table spend for each brand and an estimated p.a.
growth rate for each brand
Figure 30: Weighted average no. of tables
FYE Sep FY15 FY16E FY17E FY18E
Singapore JUMBO 1,615 1,615 1,650 1,710
China JUMBO 117 275 400 500
Ng Ah Sio Bak Kut Teh 200 200 200 200
Chui Huay Lim Teochew 100 100 100 100
JPOT 150 150 175 200
J Café 50 50 50 50
Total 2,232 2,390 2,575 2,760
Figure 31: No. of outlets
FYE Sep FY15 FY16E FY17E FY18E
Singapore JUMBO 5 5 6 6
China JUMBO 2 3 4 5
Ng Ah Sio Bak Kut Teh 4 4 4 4
Chui Huay Lim Teochew Restaurant 1 1 1 1
JPOT 3 3 4 4
J Café 1 1 1 1
Total no. of outlets 16 17 20 21
Additional no. of outlets 1 1 3 1

January 3, 2016 25
Jumbo Group Ltd
6.7 Margin trends should be stable We expect stable margin trends for Jumbo. Not all companies break out their
costs but for those that do, Jumbo compares quite favourably, particularly on
raw materials and staff costs.
Figure 32: Operating margins
Source: Company data, Maybank Kim Eng
Fig 33: Operating cost trends
Raw materials
Staff costs
Rental costs
As % of revenue FY13 FY14 FY15 FY13 FY14 FY15 FY13 FY14 FY15
Jumbo Group 38.9 38.0 36.9 27.7 27.1 28.3 8.1 7.9 8.4
Breadtalk Group - - - 26.6 26.9 27.3 - - -
Neo Group 31.0 29.6 38.3 30.1 32.4 30.2 6.2 6.8 5.7
Select Group - - - - - 34.8 9.7 7.9 6.7
Soup Restaurant Group 23.3 23.3 23.1 34.7 36.2 37.2 36.6 35.4 35.7
Tung Lok Restaurants - - - 33.7 31.5 33.6 16.2 15.1 15.9
Source: Companies
The key costs are:
Raw materials and consumables (36-37% of revenue) form the biggest
chunk of Jumbo’s costs, presumably because seafood is behind more than
70% of its revenue. Such costs have been declining in the last few years,
from 39% in FY13 to below 37% in FY15. As Jumbo becomes an ever bigger
buyer of seafood, it should be able to attract better pricing from its
suppliers. It mentioned in its IPO prospectus that it was able to obtain more
competitive pricing for seafood from another supplier between FY12 and
1H15. An expanded central kitchen should also help it optimise raw-material
usage.
Staff costs (27-28% of revenue) are the second biggest chunk. Jumbo has
consistently paid less than the industry for staff except BreadTalk. We
attribute this to its lean staffing and savvy use of IT at the front of the house
to maximise table turns. Stable staff turnover is another positive, keeping
staff costs in check. About 100 of its 700+ employees have been with Jumbo
for more than 10 years. We believe an ERP system early next year will be
another step in optimising staff costs, through real-time decisions on the
deployment of temporary workers, in response to nightly takings. We have
assumed staff costs will be higher in future now that it is a listed company.
Rentals (8% of revenue) should be more or less stable, though they may
creep slightly higher. Jumbo generally signs three-year leases which seem to
be evenly spaced out as its rental expenses have been increasing every year.
52%
52%
53%
53%
54%
54%
55%
55%
56%
56%
0%
2%
4%
6%
8%
10%
12%
14%
16%
18%
FY13 FY14 FY15 FY16E FY17E FY18E
Gross margin (RHS) EBITDA margin
PBT margin Net margin
January 3, 2016 26
Jumbo Group Ltd
Its biggest Singapore outlet at the East Coast Seafood Centre is likely to be
leased from the National Parks Board at competitive rates since it has been
there for more than 20 years. Still, we would watch for any changes in
conditions by National Parks that may affect Jumbo. Recall that Red House
Seafood closed in March this year after its lease expired and National Parks
decided to take back the space for beachgoers.9 In China, Jumbo has been
able to secure competitive rates as it was invited by the landlords of the
malls it operates in.
Other operating expenses (10-11% of revenue) have been very stable as a
percentage of revenue in the past and we see no reason why this should
change. Other opex mainly includes cleaning costs, credit card costs,
marketing & advertising, repairs & maintenance, etc. Similarly with utilities
costs at c.3% of revenue.
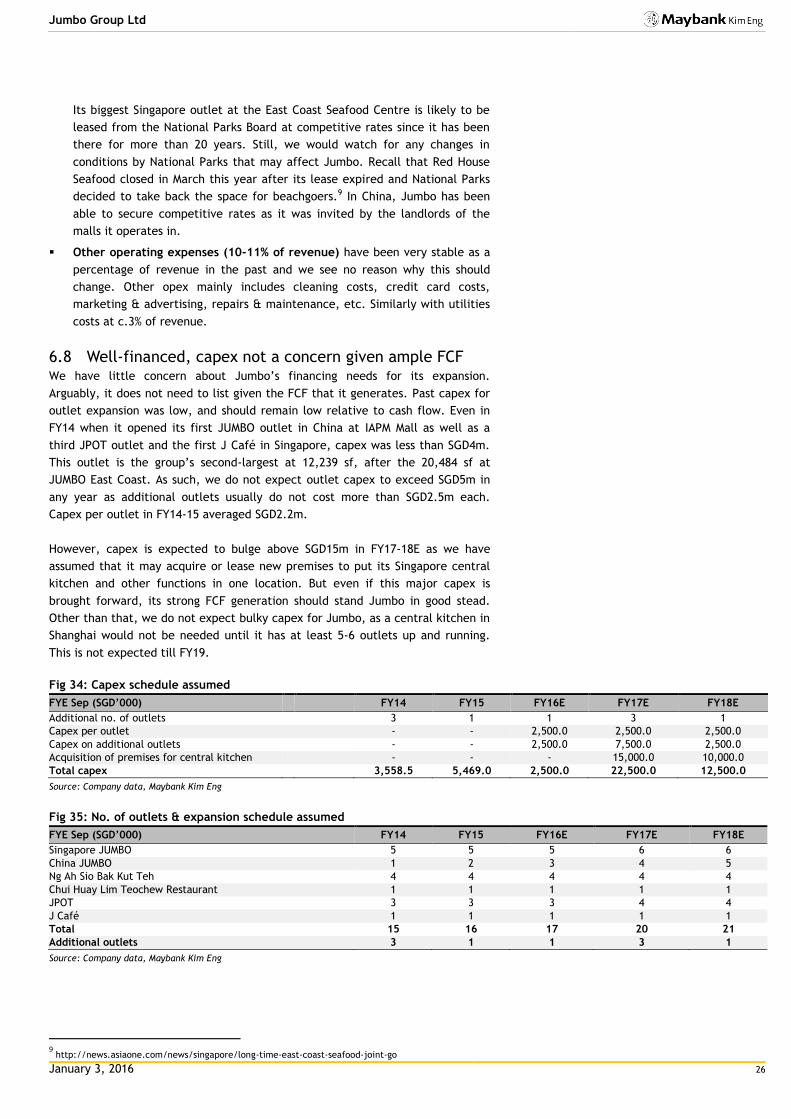
6.8 Well-financed, capex not a concern given ample FCF We have little concern about Jumbo’s financing needs for its expansion.
Arguably, it does not need to list given the FCF that it generates. Past capex for
outlet expansion was low, and should remain low relative to cash flow. Even in
FY14 when it opened its first JUMBO outlet in China at IAPM Mall as well as a
third JPOT outlet and the first J Café in Singapore, capex was less than SGD4m.
This outlet is the group’s second-largest at 12,239 sf, after the 20,484 sf at
JUMBO East Coast. As such, we do not expect outlet capex to exceed SGD5m in
any year as additional outlets usually do not cost more than SGD2.5m each.
Capex per outlet in FY14-15 averaged SGD2.2m.
However, capex is expected to bulge above SGD15m in FY17-18E as we have
assumed that it may acquire or lease new premises to put its Singapore central
kitchen and other functions in one location. But even if this major capex is
brought forward, its strong FCF generation should stand Jumbo in good stead.
Other than that, we do not expect bulky capex for Jumbo, as a central kitchen in
Shanghai would not be needed until it has at least 5-6 outlets up and running.
This is not expected till FY19.
Fig 34: Capex schedule assumed
FYE Sep (SGD’000)
FY14 FY15 FY16E FY17E FY18E
Additional no. of outlets
3 1 1 3 1
Capex per outlet
- - 2,500.0 2,500.0 2,500.0
Capex on additional outlets
- - 2,500.0 7,500.0 2,500.0
Acquisition of premises for central kitchen
- - - 15,000.0 10,000.0
Total capex
3,558.5 5,469.0 2,500.0 22,500.0 12,500.0
Source: Company data, Maybank Kim Eng
Fig 35: No. of outlets & expansion schedule assumed
FYE Sep (SGD’000) FY14 FY15 FY16E FY17E FY18E
Singapore JUMBO 5 5 5 6 6
China JUMBO 1 2 3 4 5
Ng Ah Sio Bak Kut Teh 4 4 4 4 4
Chui Huay Lim Teochew Restaurant 1 1 1 1 1
JPOT 3 3 3 4 4
J Café 1 1 1 1 1
Total 15 16 17 20 21
Additional outlets 3 1 1 3 1
Source: Company data, Maybank Kim Eng
9 http://news.asiaone.com/news/singapore/long-time-east-coast-seafood-joint-go
January 3, 2016 27
Jumbo Group Ltd
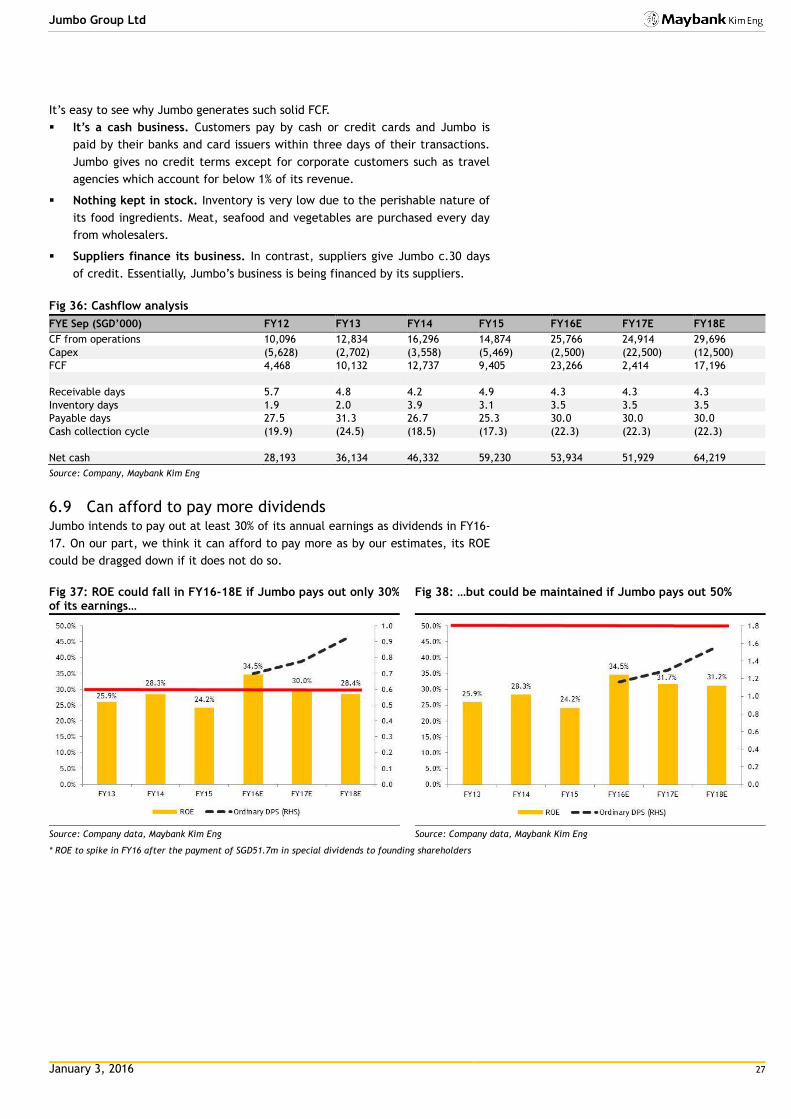
It’s easy to see why Jumbo generates such solid FCF.
It’s a cash business. Customers pay by cash or credit cards and Jumbo is
paid by their banks and card issuers within three days of their transactions.
Jumbo gives no credit terms except for corporate customers such as travel
agencies which account for below 1% of its revenue.
Nothing kept in stock. Inventory is very low due to the perishable nature of
its food ingredients. Meat, seafood and vegetables are purchased every day
from wholesalers.
Suppliers finance its business. In contrast, suppliers give Jumbo c.30 days
of credit. Essentially, Jumbo’s business is being financed by its suppliers.
Fig 36: Cashflow analysis
FYE Sep (SGD’000) FY12 FY13 FY14 FY15 FY16E FY17E FY18E
CF from operations 10,096 12,834 16,296 14,874 25,766 24,914 29,696
Capex (5,628) (2,702) (3,558) (5,469) (2,500) (22,500) (12,500)
FCF 4,468 10,132 12,737 9,405 23,266 2,414 17,196
Receivable days 5.7 4.8 4.2 4.9 4.3 4.3 4.3
Inventory days 1.9 2.0 3.9 3.1 3.5 3.5 3.5
Payable days 27.5 31.3 26.7 25.3 30.0 30.0 30.0
Cash collection cycle (19.9) (24.5) (18.5) (17.3) (22.3) (22.3) (22.3)
Net cash 28,193 36,134 46,332 59,230 53,934 51,929 64,219
Source: Company, Maybank Kim Eng
6.9 Can afford to pay more dividends Jumbo intends to pay out at least 30% of its annual earnings as dividends in FY16-
17. On our part, we think it can afford to pay more as by our estimates, its ROE
could be dragged down if it does not do so.
Fig 37: ROE could fall in FY16-18E if Jumbo pays out only 30% of its earnings…
Source: Company data, Maybank Kim Eng
Fig 38: …but could be maintained if Jumbo pays out 50%
Source: Company data, Maybank Kim Eng
* ROE to spike in FY16 after the payment of SGD51.7m in special dividends to founding shareholders
January 3, 2016 28
Jumbo Group Ltd
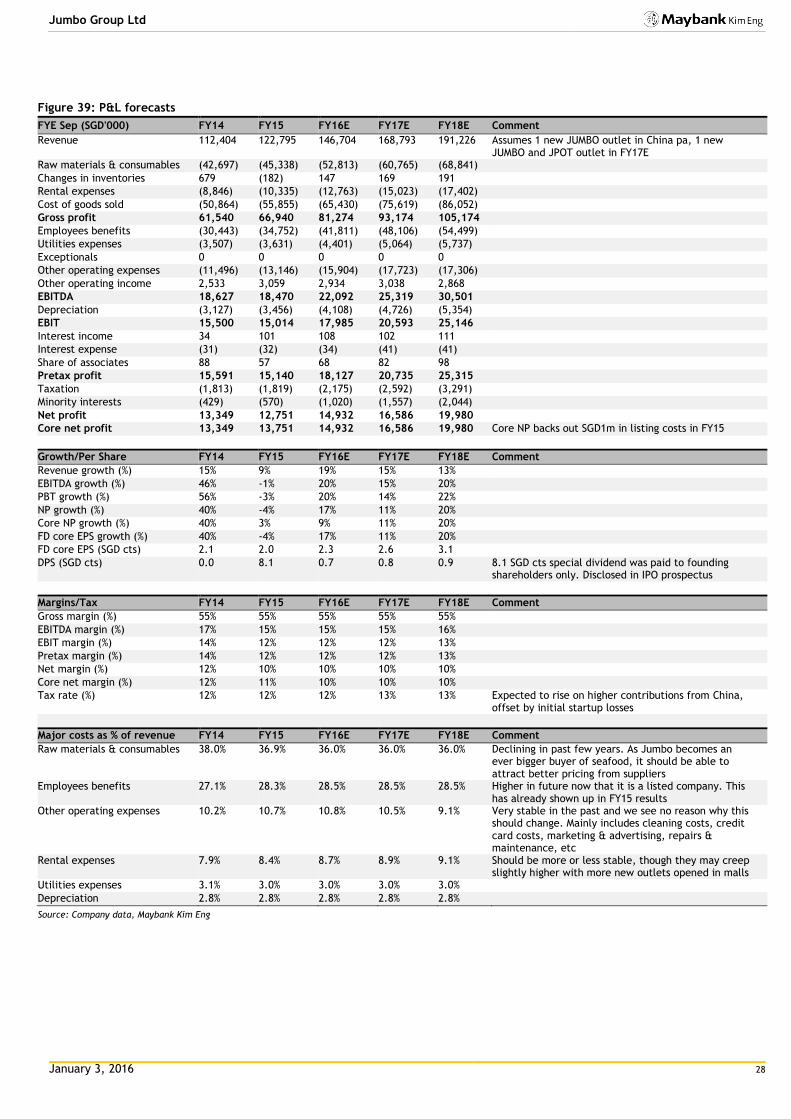
Figure 39: P&L forecasts
FYE Sep (SGD'000) FY14 FY15 FY16E FY17E FY18E Comment
Revenue 112,404 122,795 146,704 168,793 191,226 Assumes 1 new JUMBO outlet in China pa, 1 new JUMBO and JPOT outlet in FY17E
Raw materials & consumables (42,697) (45,338) (52,813) (60,765) (68,841)
Changes in inventories 679 (182) 147 169 191
Rental expenses (8,846) (10,335) (12,763) (15,023) (17,402)
Cost of goods sold (50,864) (55,855) (65,430) (75,619) (86,052)
Gross profit 61,540 66,940 81,274 93,174 105,174
Employees benefits (30,443) (34,752) (41,811) (48,106) (54,499)
Utilities expenses (3,507) (3,631) (4,401) (5,064) (5,737)
Exceptionals 0 0 0 0 0
Other operating expenses (11,496) (13,146) (15,904) (17,723) (17,306)
Other operating income 2,533 3,059 2,934 3,038 2,868
EBITDA 18,627 18,470 22,092 25,319 30,501
Depreciation (3,127) (3,456) (4,108) (4,726) (5,354)
EBIT 15,500 15,014 17,985 20,593 25,146
Interest income 34 101 108 102 111
Interest expense (31) (32) (34) (41) (41)
Share of associates 88 57 68 82 98
Pretax profit 15,591 15,140 18,127 20,735 25,315
Taxation (1,813) (1,819) (2,175) (2,592) (3,291)
Minority interests (429) (570) (1,020) (1,557) (2,044)
Net profit 13,349 12,751 14,932 16,586 19,980
Core net profit 13,349 13,751 14,932 16,586 19,980 Core NP backs out SGD1m in listing costs in FY15
Growth/Per Share FY14 FY15 FY16E FY17E FY18E Comment
Revenue growth (%) 15% 9% 19% 15% 13%
EBITDA growth (%) 46% -1% 20% 15% 20%
PBT growth (%) 56% -3% 20% 14% 22%
NP growth (%) 40% -4% 17% 11% 20%
Core NP growth (%) 40% 3% 9% 11% 20%
FD core EPS growth (%) 40% -4% 17% 11% 20%
FD core EPS (SGD cts) 2.1 2.0 2.3 2.6 3.1
DPS (SGD cts) 0.0 8.1 0.7 0.8 0.9 8.1 SGD cts special dividend was paid to founding shareholders only. Disclosed in IPO prospectus
Margins/Tax FY14 FY15 FY16E FY17E FY18E Comment
Gross margin (%) 55% 55% 55% 55% 55%
EBITDA margin (%) 17% 15% 15% 15% 16%
EBIT margin (%) 14% 12% 12% 12% 13%
Pretax margin (%) 14% 12% 12% 12% 13%
Net margin (%) 12% 10% 10% 10% 10%
Core net margin (%) 12% 11% 10% 10% 10%
Tax rate (%) 12% 12% 12% 13% 13% Expected to rise on higher contributions from China, offset by initial startup losses
Major costs as % of revenue FY14 FY15 FY16E FY17E FY18E Comment
Raw materials & consumables 38.0% 36.9% 36.0% 36.0% 36.0% Declining in past few years. As Jumbo becomes an ever bigger buyer of seafood, it should be able to attract better pricing from suppliers
Employees benefits 27.1% 28.3% 28.5% 28.5% 28.5% Higher in future now that it is a listed company. This has already shown up in FY15 results
Other operating expenses 10.2% 10.7% 10.8% 10.5% 9.1% Very stable in the past and we see no reason why this should change. Mainly includes cleaning costs, credit card costs, marketing & advertising, repairs & maintenance, etc
Rental expenses 7.9% 8.4% 8.7% 8.9% 9.1% Should be more or less stable, though they may creep slightly higher with more new outlets opened in malls
Utilities expenses 3.1% 3.0% 3.0% 3.0% 3.0%
Depreciation 2.8% 2.8% 2.8% 2.8% 2.8%
Source: Company data, Maybank Kim Eng
January 3, 2016 29
Jumbo Group Ltd
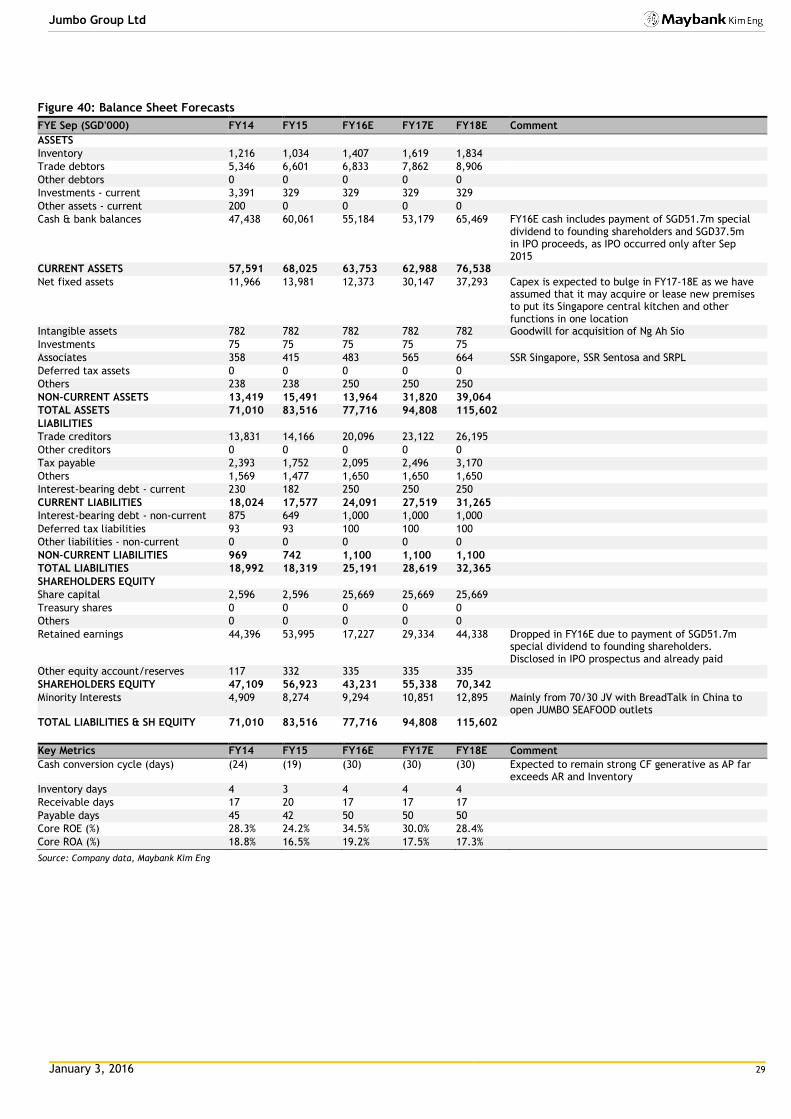
Figure 40: Balance Sheet Forecasts
FYE Sep (SGD'000) FY14 FY15 FY16E FY17E FY18E Comment
ASSETS
Inventory 1,216 1,034 1,407 1,619 1,834
Trade debtors 5,346 6,601 6,833 7,862 8,906
Other debtors 0 0 0 0 0
Investments - current 3,391 329 329 329 329
Other assets - current 200 0 0 0 0
Cash & bank balances 47,438 60,061 55,184 53,179 65,469 FY16E cash includes payment of SGD51.7m special dividend to founding shareholders and SGD37.5m in IPO proceeds, as IPO occurred only after Sep 2015
CURRENT ASSETS 57,591 68,025 63,753 62,988 76,538
Net fixed assets 11,966 13,981 12,373 30,147 37,293 Capex is expected to bulge in FY17-18E as we have assumed that it may acquire or lease new premises to put its Singapore central kitchen and other functions in one location
Intangible assets 782 782 782 782 782 Goodwill for acquisition of Ng Ah Sio
Investments 75 75 75 75 75
Associates 358 415 483 565 664 SSR Singapore, SSR Sentosa and SRPL
Deferred tax assets 0 0 0 0 0
Others 238 238 250 250 250
NON-CURRENT ASSETS 13,419 15,491 13,964 31,820 39,064
TOTAL ASSETS 71,010 83,516 77,716 94,808 115,602
LIABILITIES
Trade creditors 13,831 14,166 20,096 23,122 26,195
Other creditors 0 0 0 0 0
Tax payable 2,393 1,752 2,095 2,496 3,170
Others 1,569 1,477 1,650 1,650 1,650
Interest-bearing debt - current 230 182 250 250 250
CURRENT LIABILITIES 18,024 17,577 24,091 27,519 31,265
Interest-bearing debt - non-current 875 649 1,000 1,000 1,000
Deferred tax liabilities 93 93 100 100 100
Other liabilities - non-current 0 0 0 0 0
NON-CURRENT LIABILITIES 969 742 1,100 1,100 1,100
TOTAL LIABILITIES 18,992 18,319 25,191 28,619 32,365
SHAREHOLDERS EQUITY
Share capital 2,596 2,596 25,669 25,669 25,669
Treasury shares 0 0 0 0 0
Others 0 0 0 0 0
Retained earnings 44,396 53,995 17,227 29,334 44,338 Dropped in FY16E due to payment of SGD51.7m special dividend to founding shareholders. Disclosed in IPO prospectus and already paid
Other equity account/reserves 117 332 335 335 335
SHAREHOLDERS EQUITY 47,109 56,923 43,231 55,338 70,342
Minority Interests 4,909 8,274 9,294 10,851 12,895 Mainly from 70/30 JV with BreadTalk in China to open JUMBO SEAFOOD outlets
TOTAL LIABILITIES & SH EQUITY 71,010 83,516 77,716 94,808 115,602
Key Metrics FY14 FY15 FY16E FY17E FY18E Comment
Cash conversion cycle (days) (24) (19) (30) (30) (30) Expected to remain strong CF generative as AP far exceeds AR and Inventory
Inventory days 4 3 4 4 4
Receivable days 17 20 17 17 17
Payable days 45 42 50 50 50
Core ROE (%) 28.3% 24.2% 34.5% 30.0% 28.4%
Core ROA (%) 18.8% 16.5% 19.2% 17.5% 17.3%
Source: Company data, Maybank Kim Eng

January 3, 2016 30
Jumbo Group Ltd
Figure 41: Cashflow Forecasts
FYE Sep (SGD'000) FY14 FY15 FY16E FY17E FY18E Comment
EBITDA 18,627 18,470 22,092 25,319 30,501
Change in working capital: (1,561) (1,136) 5,499 1,785 1,813
Inventory (679) 182 (373) (212) (215)
Trade debtors (736) (1,255) (232) (1,029) (1,045)
Trade creditors 185 335 5,930 3,026 3,073
Others (331) (397) 173 0 0
Cash generated from operations 17,066 17,334 27,591 27,104 32,314
Tax paid (770) (2,460) (1,825) (2,191) (2,618)
Net cash from operations 16,296 14,874 25,766 24,914 29,696
Net capex (3,532) (5,454) (2,500) (22,500) (12,500) Capex is expected to bulge in FY17-18E as we have assumed that it may acquire or lease new premises to put its Singapore central kitchen and other functions in one location
Interest income 34 101 108 102 111
Others (1,124) 3,464 (80) (82) (98)
Net cash from investments (4,622) (1,889) (2,472) (22,480) (12,487)
Interest paid (31) (32) (34) (41) (41)
Equity issuance & buybacks 0 0 23,073 0 0
Net change in debt (195) (275) 419 0 0
Dividends paid 0 0 (51,700) (4,480) (4,976) FY16E includes SGD51.7m special dividend to founding shareholders. Disclosed in IPO prospectus and already paid
Others (3,082) (198) 0 0 0
Net cash from financing (3,308) (505) (28,242) (4,521) (5,017)
Change in cash & fixed deposits 8,366 12,480 (4,948) (2,088) 12,192
Free cashflow 12,764 9,420 23,266 2,414 17,196
Source: Company data, Maybank Kim Eng
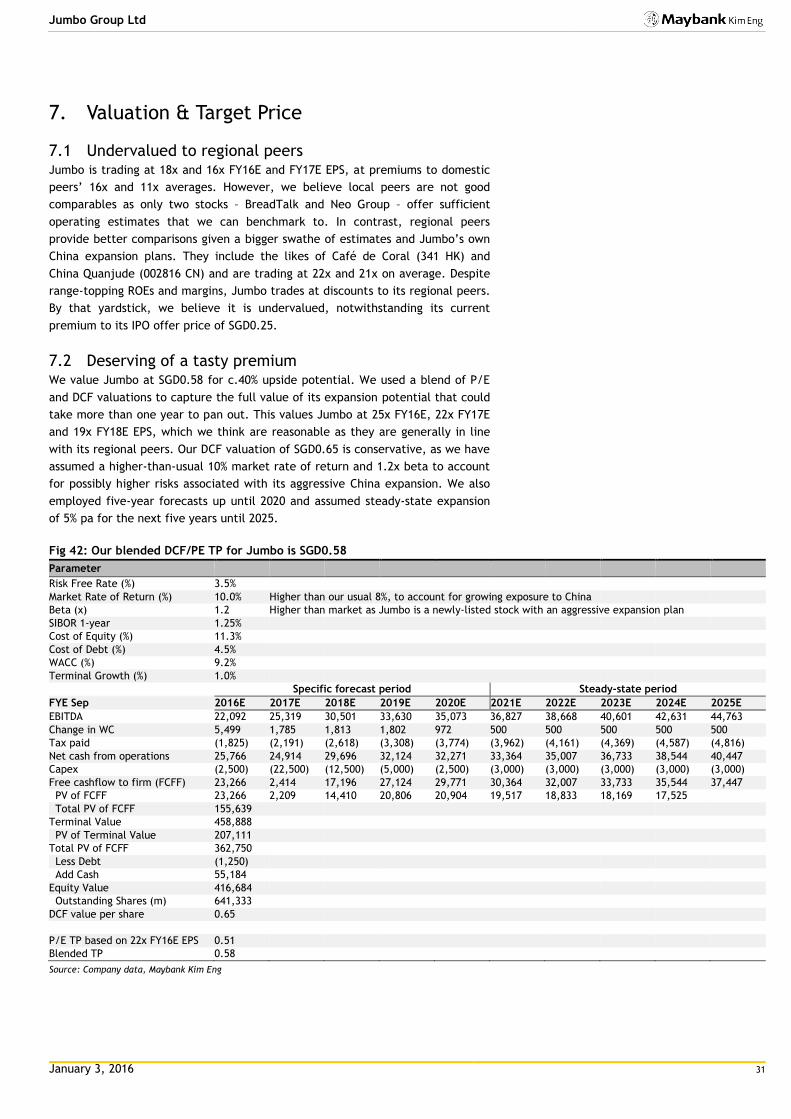
January 3, 2016 31
Jumbo Group Ltd
7. Valuation & Target Price
7.1 Undervalued to regional peers Jumbo is trading at 18x and 16x FY16E and FY17E EPS, at premiums to domestic
peers’ 16x and 11x averages. However, we believe local peers are not good
comparables as only two stocks – BreadTalk and Neo Group – offer sufficient
operating estimates that we can benchmark to. In contrast, regional peers
provide better comparisons given a bigger swathe of estimates and Jumbo’s own
China expansion plans. They include the likes of Café de Coral (341 HK) and
China Quanjude (002816 CN) and are trading at 22x and 21x on average. Despite
range-topping ROEs and margins, Jumbo trades at discounts to its regional peers.
By that yardstick, we believe it is undervalued, notwithstanding its current
premium to its IPO offer price of SGD0.25.
7.2 Deserving of a tasty premium We value Jumbo at SGD0.58 for c.40% upside potential. We used a blend of P/E
and DCF valuations to capture the full value of its expansion potential that could
take more than one year to pan out. This values Jumbo at 25x FY16E, 22x FY17E
and 19x FY18E EPS, which we think are reasonable as they are generally in line
with its regional peers. Our DCF valuation of SGD0.65 is conservative, as we have
assumed a higher-than-usual 10% market rate of return and 1.2x beta to account
for possibly higher risks associated with its aggressive China expansion. We also
employed five-year forecasts up until 2020 and assumed steady-state expansion
of 5% pa for the next five years until 2025.
Fig 42: Our blended DCF/PE TP for Jumbo is SGD0.58
Parameter
Risk Free Rate (%) 3.5%
Market Rate of Return (%) 10.0% Higher than our usual 8%, to account for growing exposure to China
Beta (x) 1.2 Higher than market as Jumbo is a newly-listed stock with an aggressive expansion plan
SIBOR 1-year 1.25%
Cost of Equity (%) 11.3%
Cost of Debt (%) 4.5%
WACC (%) 9.2%
Terminal Growth (%) 1.0%
Specific forecast period Steady-state period
FYE Sep 2016E 2017E 2018E 2019E 2020E 2021E 2022E 2023E 2024E 2025E
EBITDA 22,092 25,319 30,501 33,630 35,073 36,827 38,668 40,601 42,631 44,763
Change in WC 5,499 1,785 1,813 1,802 972 500 500 500 500 500
Tax paid (1,825) (2,191) (2,618) (3,308) (3,774) (3,962) (4,161) (4,369) (4,587) (4,816)
Net cash from operations 25,766 24,914 29,696 32,124 32,271 33,364 35,007 36,733 38,544 40,447
Capex (2,500) (22,500) (12,500) (5,000) (2,500) (3,000) (3,000) (3,000) (3,000) (3,000)
Free cashflow to firm (FCFF) 23,266 2,414 17,196 27,124 29,771 30,364 32,007 33,733 35,544 37,447
PV of FCFF 23,266 2,209 14,410 20,806 20,904 19,517 18,833 18,169 17,525
Total PV of FCFF 155,639
Terminal Value 458,888
PV of Terminal Value 207,111
Total PV of FCFF 362,750
Less Debt (1,250)
Add Cash 55,184
Equity Value 416,684
Outstanding Shares (m) 641,333
DCF value per share 0.65
P/E TP based on 22x FY16E EPS 0.51
Blended TP 0.58
Source: Company data, Maybank Kim Eng

Jum
bo G
roup L
td .
Jan
uary 3
, 20
16
32
Fig 43: Peer comparison
Close Mkt Cap P/E (x) EV/EBITDA (x) P/BV (x) Dividend yield (%) ROE (%) EPS Growth (%)
Company (Local) (USD'm) Act FY1 FY2 Act FY1 FY2 Act FY1 FY2 Act FY1 FY2 Act FY1 FY2 Act FY1 FY2
Jumbo Group Ltd. (Singapore) 0.42 190 19.6 18.0 16.2 11.4 9.8 8.6 4.7 6.2 4.9 0.0% 1.7% 1.8% 24.2% 34.5% 30.0% 3.0% 8.6% 11.1%
Singapore + Regional F&B groups 25.4 21.5 18.9 11.7 10.0 8.7 3.5 3.2 3.1 2.6% 2.9% 3.1% 14.1% 14.9% 15.6% 9.4% 19.6% 20.9%
Singapore-listed F&B groups 25.6 16.4 10.8 5.6 4.3 3.1 3.0 2.6 2.2 1.5% 1.5% 2.5% 10.0% 13.2% 16.2% -25.4% 57.9% 52.8%
Breadtalk Group 1.14 227 29.5 19.8 13.6 5.6 4.3 3.1 3.0 2.6 2.2 1.5% 1.5% 2.0% 10.0% 13.2% 16.2% -10.7% 49.1% 45.7%
ABR Holdings 0.73 104 - - - - - - - - - - - - - - - - - -
Neo Group 0.65 67 21.7 13.0 8.1 - - - - - - 1.5% 1.5% 3.1% - - - -40.0% 66.7% 60.0%
Auric Pacific Group 0.73 65 - - - - - - - - - - - - - - - - - -
Japan Foods 0.45 55 - - - - - - - - - - - - - - - - - -
Select Group 0.40 40 - - - - - - - - - - - - - - - - - -
Sakae Holdings 0.41 41 - - - - - - - - - - - - - - - - - -
Soup Restaurant 0.19 41 - - - - - - - - - - - - - - - - - -
Tung Lok Restaurants 0.11 21 - - - - - - - - - - - - - - - - - -
Regional F&B groups
25.4 22.4 20.5 12.4 10.6 9.3 3.5 3.2 3.2 2.8% 3.1% 3.2% 14.5% 15.0% 15.5% 15.5% 15.2% 13.2%
Jollibee Foods 219.00 4,978 41.2 35.4 29.7 20.8 17.3 15.2 8.1 7.3 6.7 1.0% 1.1% 1.4% 19.8% 20.6% 22.4% 5.1% 16.3% 19.1%
Minor International 36.00 4,390 32.0 27.5 23.8 20.6 17.6 15.5 4.9 4.4 3.8 1.0% 1.2% 1.5% 15.2% 15.8% 15.9% 2.3% 16.4% 15.6%
Cafe de Coral 22.75 1,712 23.7 23.2 20.3 13.7 12.2 10.9 3.6 3.4 3.3 3.1% 3.4% 3.8% 15.0% 14.7% 16.0% -8.6% 2.1% 14.3%
MK Restaurant 57.00 1,437 26.3 24.1 21.9 15.1 13.7 13.4 4.0 3.9 3.8 3.3% 3.5% 3.8% 15.4% 16.2% 17.2% -3.8% 9.0% 10.3%
China Quanjude 23.16 1,102 47.3 42.1 35.1 - - - - - - - - - - - - 19.5% 12.2% 20.0%
Gourmet Master 234.00 1,007 29.7 23.7 19.4 12.3 10.2 8.1 4.5 4.0 3.5 1.0% 1.5% 1.6% 15.1% 16.7% 18.2% 110.4% 25.7% 22.0%
Ajisen (China) 3.38 476 15.0 14.7 14.1 3.1 2.8 2.5 1.1 1.0 1.0 4.7% 4.7% 4.9% 7.1% 7.1% 7.2% -10.9% 2.2% 4.3%
Oishi Group 62.00 322 17.7 15.6 - - - - 2.9 2.7 - 3.2% 3.7% - 16.4% 17.2% - 25.0% 13.7% -
Tsui Wah Holdings 1.80 328 16.5 14.5 13.4 7.4 6.0 5.0 1.9 1.8 1.8 4.3% 4.7% 5.4% 11.6% 12.5% 13.4% -2.5% 13.8% 7.8%
Berjaya Food 2.33 204 23.8 17.7 14.4 11.0 8.6 7.2 2.1 2.1 2.0 2.4% 3.1% 3.9% 8.9% 11.7% 13.8% 42.0% 34.4% 22.5%
Oldtown 1.61 174 15.0 14.0 12.9 7.7 7.1 5.7 2.1 2.0 - 3.7% 4.1% 2.9% 13.8% 14.3% - 0.3% 7.2% 8.7%
La Kaffa International 84.00 72 16.9 16.0 - - - - 3.5 3.0 - - - - 20.6% 18.5% - 3.3% 5.8% -
Source: FactSet Estimates, Maybank Kim Eng, as at 30 Dec 2015
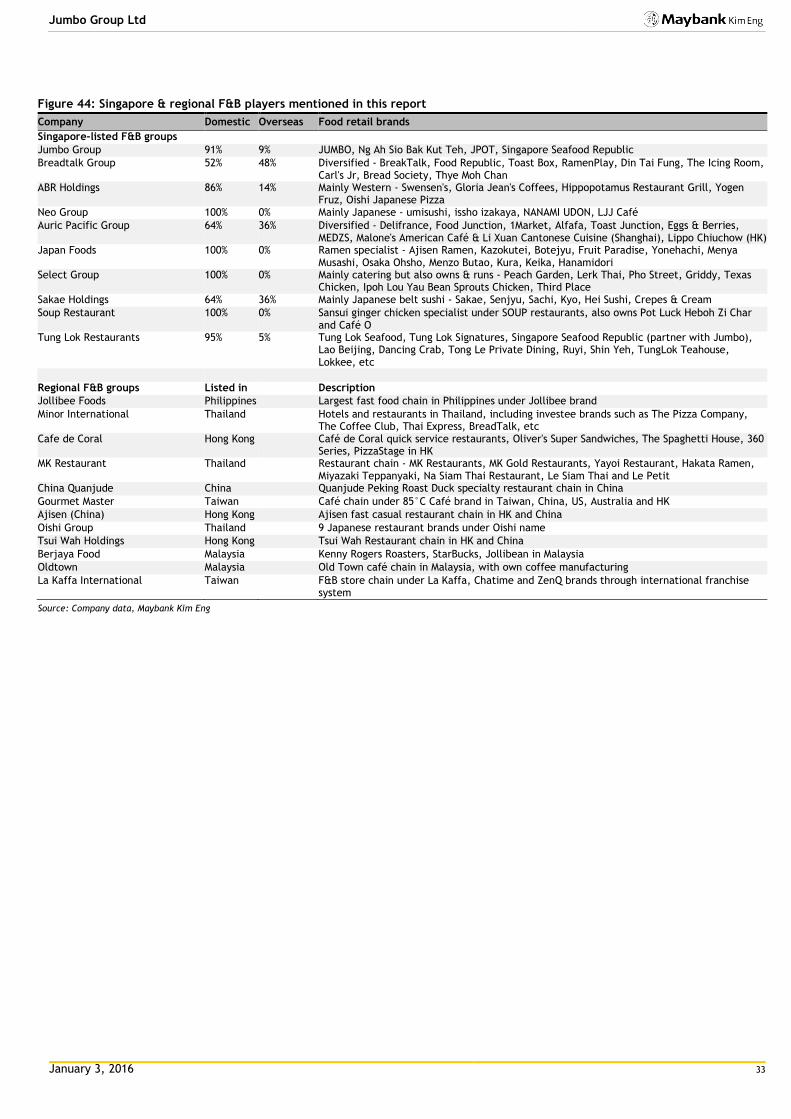
January 3, 2016 33
Jumbo Group Ltd
Figure 44: Singapore & regional F&B players mentioned in this report
Company Domestic Overseas Food retail brands
Singapore-listed F&B groups
Jumbo Group 91% 9% JUMBO, Ng Ah Sio Bak Kut Teh, JPOT, Singapore Seafood Republic
Breadtalk Group 52% 48% Diversified - BreakTalk, Food Republic, Toast Box, RamenPlay, Din Tai Fung, The Icing Room, Carl's Jr, Bread Society, Thye Moh Chan
ABR Holdings 86% 14% Mainly Western - Swensen's, Gloria Jean's Coffees, Hippopotamus Restaurant Grill, Yogen Fruz, Oishi Japanese Pizza
Neo Group 100% 0% Mainly Japanese - umisushi, issho izakaya, NANAMI UDON, LJJ Café
Auric Pacific Group 64% 36% Diversified - Delifrance, Food Junction, 1Market, Alfafa, Toast Junction, Eggs & Berries, MEDZS, Malone's American Café & Li Xuan Cantonese Cuisine (Shanghai), Lippo Chiuchow (HK)
Japan Foods 100% 0% Ramen specialist - Ajisen Ramen, Kazokutei, Botejyu, Fruit Paradise, Yonehachi, Menya Musashi, Osaka Ohsho, Menzo Butao, Kura, Keika, Hanamidori
Select Group 100% 0% Mainly catering but also owns & runs - Peach Garden, Lerk Thai, Pho Street, Griddy, Texas Chicken, Ipoh Lou Yau Bean Sprouts Chicken, Third Place
Sakae Holdings 64% 36% Mainly Japanese belt sushi - Sakae, Senjyu, Sachi, Kyo, Hei Sushi, Crepes & Cream
Soup Restaurant 100% 0% Sansui ginger chicken specialist under SOUP restaurants, also owns Pot Luck Heboh Zi Char and Café O
Tung Lok Restaurants 95% 5% Tung Lok Seafood, Tung Lok Signatures, Singapore Seafood Republic (partner with Jumbo), Lao Beijing, Dancing Crab, Tong Le Private Dining, Ruyi, Shin Yeh, TungLok Teahouse, Lokkee, etc
Regional F&B groups Listed in Description
Jollibee Foods Philippines Largest fast food chain in Philippines under Jollibee brand
Minor International Thailand Hotels and restaurants in Thailand, including investee brands such as The Pizza Company, The Coffee Club, Thai Express, BreadTalk, etc
Cafe de Coral Hong Kong Café de Coral quick service restaurants, Oliver's Super Sandwiches, The Spaghetti House, 360 Series, PizzaStage in HK
MK Restaurant Thailand Restaurant chain - MK Restaurants, MK Gold Restaurants, Yayoi Restaurant, Hakata Ramen, Miyazaki Teppanyaki, Na Siam Thai Restaurant, Le Siam Thai and Le Petit
China Quanjude China Quanjude Peking Roast Duck specialty restaurant chain in China
Gourmet Master Taiwan Café chain under 85°C Café brand in Taiwan, China, US, Australia and HK
Ajisen (China) Hong Kong Ajisen fast casual restaurant chain in HK and China
Oishi Group Thailand 9 Japanese restaurant brands under Oishi name
Tsui Wah Holdings Hong Kong Tsui Wah Restaurant chain in HK and China
Berjaya Food Malaysia Kenny Rogers Roasters, StarBucks, Jollibean in Malaysia
Oldtown Malaysia Old Town café chain in Malaysia, with own coffee manufacturing
La Kaffa International Taiwan F&B store chain under La Kaffa, Chatime and ZenQ brands through international franchise system
Source: Company data, Maybank Kim Eng

January 3, 2016 34
Jumbo Group Ltd
8. Risks & Concerns
8.1 Singapore tourism down but not a dealbreaker Singapore tourism has been hamstrung by weak source markets this year,
especially Europe and Asia where the resilient SGD vs EUR and other Asian
currencies has made Singapore more expensive. European and Asian visitors
made up 88% of total visitors in 2014. In addition, the annual recurring haze that
lasted an abnormal two months this year did not help. As JUMBO SEAFOOD’s
outlets are mostly al fresco, they were unlikely to have escaped unscathed.
During the height of the haze in 2013, takings from its Dempsey Hill outlet were
down by as much as 40%, according to press reports.
Tourism has been stagnant since 2013. The number of tourists visiting Singapore
peaked in 2013 and has plateaued at 15-15.5b annually since. STB is targeting
15.1-15.5m visitors in 2015; with 11.4m visitors in 9M15, this looks achievable. To
boost this number further, STB launched a SGD20m global marketing campaign in
June to promote Singapore as part of its SG50 celebrations. According to a
spokesperson, some of its programmes will extend into 2016. On the plus side,
although tourists dropped this year, the average tourist has been staying longer.
This should translate into opportunities for visiting more places in Singapore and
partaking in more of its local cuisine.
Fig 45: Monthly arrivals in Singapore…
Source: SingStat
Fig 46: … and their average length of stay
Source: CEIC, STB
On balance, we do not see stagnant tourism as a dealbreaker for Jumbo.
Customers eat at JUMBO because its outlets are destinations in themselves,
especially for tourists who may have heard about JUMBO even before their
arrival. This is borne out by our observation that its outlets are packed on most
nights, although they are found outside shopping malls. At least two are in the
out-of-the-way East Coast Seafood Centre and Dempsey Hill.
8.2 Must keep reputation intact at all costs Since its acquisition of Little Sheep in 2011, YUM!’s investment has proven to be
problematic, mainly due to unhygienic practices in the China hotpot industry that
have affected its reputation. These include the recycling of customers’ leftover
soups and instances of chicken, duck, rat or fox meat sold as lamb. YUM! has
since written down its original USD860m investment to USD100m. The obvious
takeaway is that providing and maintaining food quality is the No. 1 priority for
any F&B player in China. In recent years, China’s food supply chain has come
under the spotlight, ranging from the melamine-laced infant-milk scandal of 2008
to a gutter-oil scandal in 2010. As Jumbo sources some of its ingredients locally
for its China restaurants, including meat, non-crab seafood and vegetables,
(10.0)
(5.0)
0.0
5.0
10.0
15.0
20.0
0
200,000
400,000
600,000
800,000
1,000,000
1,200,000
1,400,000
1,600,000(YoY %)
International visitor arrivals YoY (%)
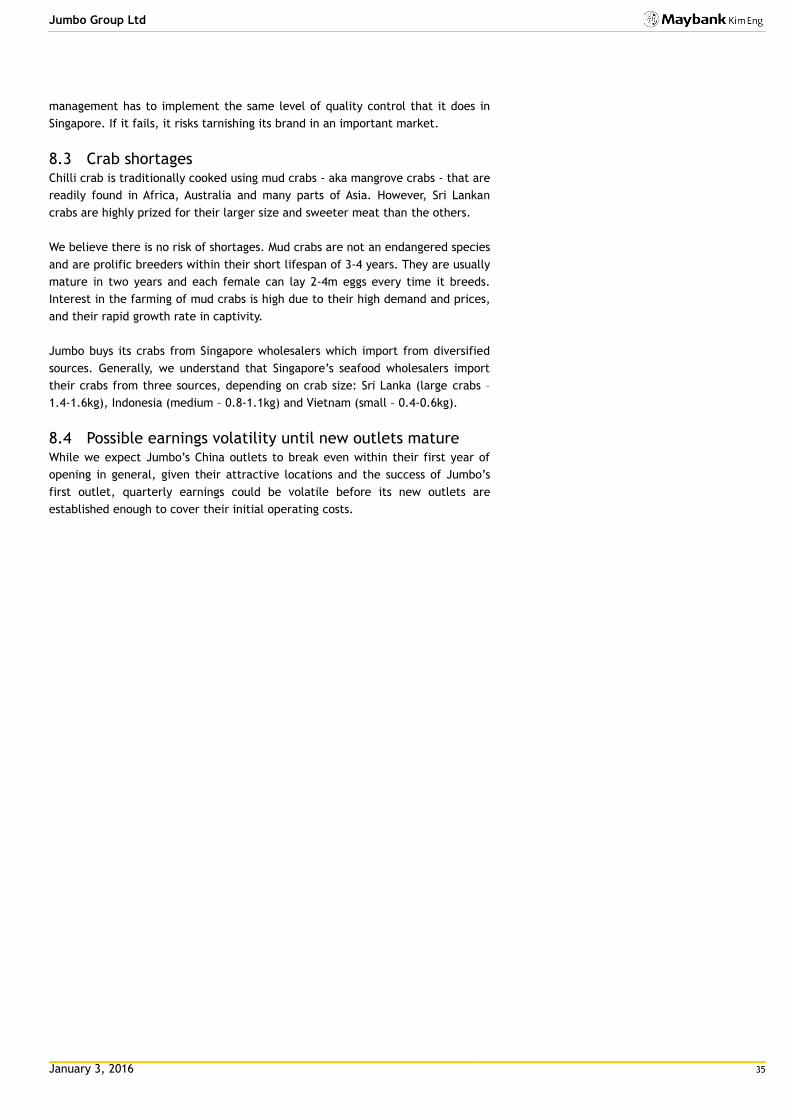
January 3, 2016 35
Jumbo Group Ltd
management has to implement the same level of quality control that it does in
Singapore. If it fails, it risks tarnishing its brand in an important market.
8.3 Crab shortages Chilli crab is traditionally cooked using mud crabs - aka mangrove crabs - that are
readily found in Africa, Australia and many parts of Asia. However, Sri Lankan
crabs are highly prized for their larger size and sweeter meat than the others.
We believe there is no risk of shortages. Mud crabs are not an endangered species
and are prolific breeders within their short lifespan of 3-4 years. They are usually
mature in two years and each female can lay 2-4m eggs every time it breeds.
Interest in the farming of mud crabs is high due to their high demand and prices,
and their rapid growth rate in captivity.
Jumbo buys its crabs from Singapore wholesalers which import from diversified
sources. Generally, we understand that Singapore’s seafood wholesalers import
their crabs from three sources, depending on crab size: Sri Lanka (large crabs –
1.4-1.6kg), Indonesia (medium – 0.8-1.1kg) and Vietnam (small – 0.4-0.6kg).
8.4 Possible earnings volatility until new outlets mature While we expect Jumbo’s China outlets to break even within their first year of
opening in general, given their attractive locations and the success of Jumbo’s
first outlet, quarterly earnings could be volatile before its new outlets are
established enough to cover their initial operating costs.
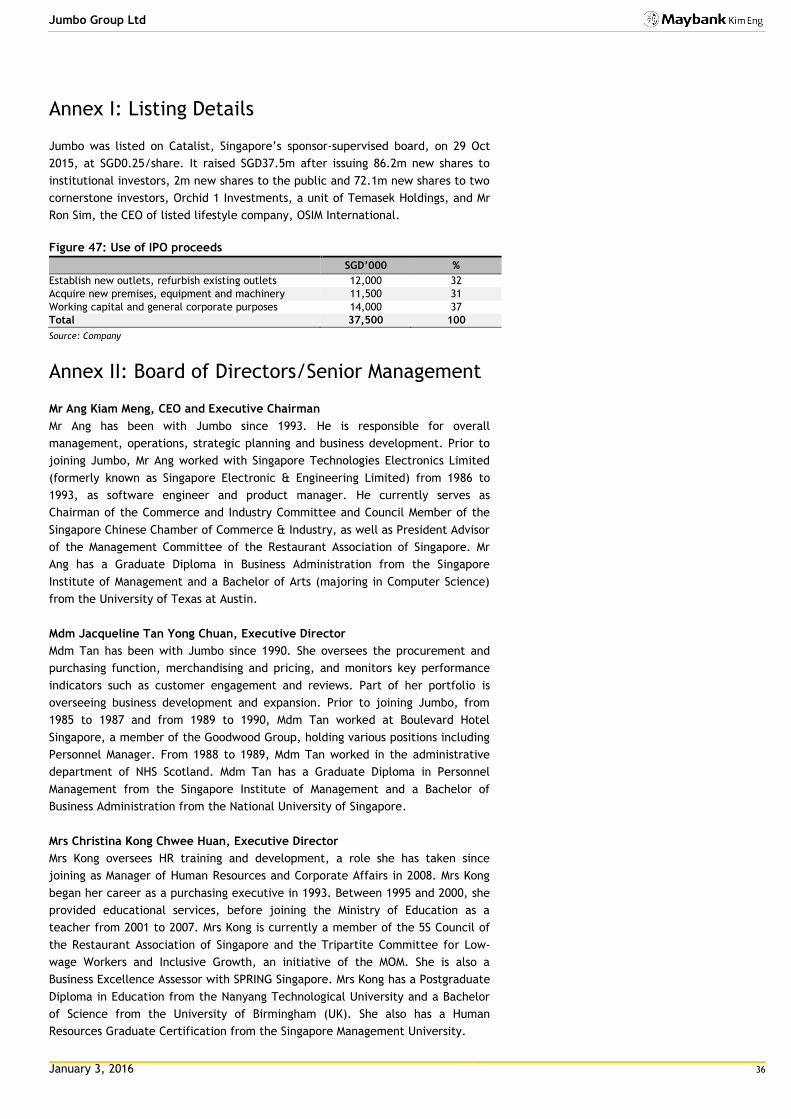
January 3, 2016 36
Jumbo Group Ltd
Annex I: Listing Details
Jumbo was listed on Catalist, Singapore’s sponsor-supervised board, on 29 Oct
2015, at SGD0.25/share. It raised SGD37.5m after issuing 86.2m new shares to
institutional investors, 2m new shares to the public and 72.1m new shares to two
cornerstone investors, Orchid 1 Investments, a unit of Temasek Holdings, and Mr
Ron Sim, the CEO of listed lifestyle company, OSIM International.
Figure 47: Use of IPO proceeds
SGD’000 %
Establish new outlets, refurbish existing outlets 12,000 32
Acquire new premises, equipment and machinery 11,500 31
Working capital and general corporate purposes 14,000 37
Total 37,500 100
Source: Company
Annex II: Board of Directors/Senior Management
Mr Ang Kiam Meng, CEO and Executive Chairman
Mr Ang has been with Jumbo since 1993. He is responsible for overall
management, operations, strategic planning and business development. Prior to
joining Jumbo, Mr Ang worked with Singapore Technologies Electronics Limited
(formerly known as Singapore Electronic & Engineering Limited) from 1986 to
1993, as software engineer and product manager. He currently serves as
Chairman of the Commerce and Industry Committee and Council Member of the
Singapore Chinese Chamber of Commerce & Industry, as well as President Advisor
of the Management Committee of the Restaurant Association of Singapore. Mr
Ang has a Graduate Diploma in Business Administration from the Singapore
Institute of Management and a Bachelor of Arts (majoring in Computer Science)
from the University of Texas at Austin.
Mdm Jacqueline Tan Yong Chuan, Executive Director
Mdm Tan has been with Jumbo since 1990. She oversees the procurement and
purchasing function, merchandising and pricing, and monitors key performance
indicators such as customer engagement and reviews. Part of her portfolio is
overseeing business development and expansion. Prior to joining Jumbo, from
1985 to 1987 and from 1989 to 1990, Mdm Tan worked at Boulevard Hotel
Singapore, a member of the Goodwood Group, holding various positions including
Personnel Manager. From 1988 to 1989, Mdm Tan worked in the administrative
department of NHS Scotland. Mdm Tan has a Graduate Diploma in Personnel
Management from the Singapore Institute of Management and a Bachelor of
Business Administration from the National University of Singapore.
Mrs Christina Kong Chwee Huan, Executive Director
Mrs Kong oversees HR training and development, a role she has taken since
joining as Manager of Human Resources and Corporate Affairs in 2008. Mrs Kong
began her career as a purchasing executive in 1993. Between 1995 and 2000, she
provided educational services, before joining the Ministry of Education as a
teacher from 2001 to 2007. Mrs Kong is currently a member of the 5S Council of
the Restaurant Association of Singapore and the Tripartite Committee for Low-
wage Workers and Inclusive Growth, an initiative of the MOM. She is also a
Business Excellence Assessor with SPRING Singapore. Mrs Kong has a Postgraduate
Diploma in Education from the Nanyang Technological University and a Bachelor
of Science from the University of Birmingham (UK). She also has a Human
Resources Graduate Certification from the Singapore Management University.

January 3, 2016 37
Jumbo Group Ltd
Mr Tan Cher Liang, Lead Independent Director
Mr Tan has more than 40 years of experience in corporate audits, general
management and business advisory. In May 2000, he co-founded Boardroom
Limited, a company listed on the main board of SGX-ST. He was the Managing/
Finance Director of Boardroom Limited from 2000 to 2013, and is currently an
Advisor to Boardroom Limited. He was also the Managing Director of Boardroom
Business Solutions Pte Ltd and Boardroom Corporate & Advisory Services Pte Ltd,
from 1992 to 2013 and 1994 to 2013 respectively. Prior to 1992, he worked with
Ernst & Young Singapore and its affiliates, since Sep 1973. Mr Tan currently
serves as an Independent Director of Vibrant Group Limited and Kingsmen
Creatives Ltd, and Wilton Resources Corporation Limited. He holds directorships
in charitable organisations such as the D.S. Lee Foundation and Etonhouse
Community Fund Limited, and is also a Trustee of Kwan Im Thong Hood Cho
Temple. Mr. Tan was awarded the Public Service Medal in 1996. Mr. Tan was a
Fellow of the Association of Chartered Certified Accountants of the United
Kingdom from 1982 to 2014, and a member of the Institute of Singapore
Chartered Accountants from 1984 to 2014.
Mr Richard Tan Kheng Swee, Independent Director
Mr Tan has more than 11 years of experience in legal practice and is currently a
partner at Chris Chong & CT Ho Partnership, a Singapore law firm. His practice
includes advising and representing companies in a wide range of commercial
transactions such as asset acquisitions, IPOs and other fund-raising exercises,
M&As, corporate advisory and compliance involving listed and private companies.
Mr Tan previously practised law in various law firms in Singapore, including
RHTLaw Taylor Wessing LLP (Singapore Law Practice) where he was Partner and
Team Head, Corporate and Securities Practice, from 2013 to 2014. He has also
practised law in Mason Sier Turnbull, a mid-sized law firm in Victoria, Australia,
where he advised on corporate advisory, mergers and acquisitions, cross-border
refinancing and intellectual property. Mr. Tan currently serves as an Independent
Director of Mirach Energy Limited and Dapai International Holdings Co Limited.
Mr Tan has a Bachelor of Laws (Honours) from the National University of
Singapore and a Bachelor of Science (Honours) from the University of Melbourne,
Australia. He is an Advocate & Solicitor of the Supreme Court of Singapore, and
a Barrister & Solicitor of the Supreme Court of Victoria, Australia.
Dr Lim Boh Soon, Independent Director
Dr Lim has more than 25 years of experience in the banking and finance industry
in Asia. Dr Lim is currently a Director of Arise Asset Management Pte Ltd and
Isoquant Sdn Bhd. Prior to that, Dr Lim was the first non-Muslim CEO of Kuwait
Finance House (Singapore) Pte. Ltd. from 2007 to 2009, and the first foreign CEO
of Vietcombank Fund Management Company in Vietnam from 2005 to 2007. He
was a Group Corporate Director of Autron Corporation Limited from 2002 to 2006
(concurrently when he was CEO of Vietcombank Fund Management Company).
From 1996 to 1999, he served in various senior management positions with UBS
AG, including as a Partner, co-heading UBS Capital Asia Pacific. Dr Lim currently
serves as an Independent Director of CSE Global Limited and Auric Pacific Group
Limited, as well as AcrossAsia Limited and SMTrack Berhad. Dr Lim obtained a
Bachelor of Science with First Class Honours and a Doctor of Philosophy in
Mechanical Engineering from the University of Strathclyde, UK, in 1981 and 1985
respectively. He also has a Graduate Diploma in Marketing Management from the
Singapore Institute of Management, and a Diploma in Marketing from the
Chartered Institute of Management, UK. Dr Lim is a Fellow of the Singapore
Institute of Directors.
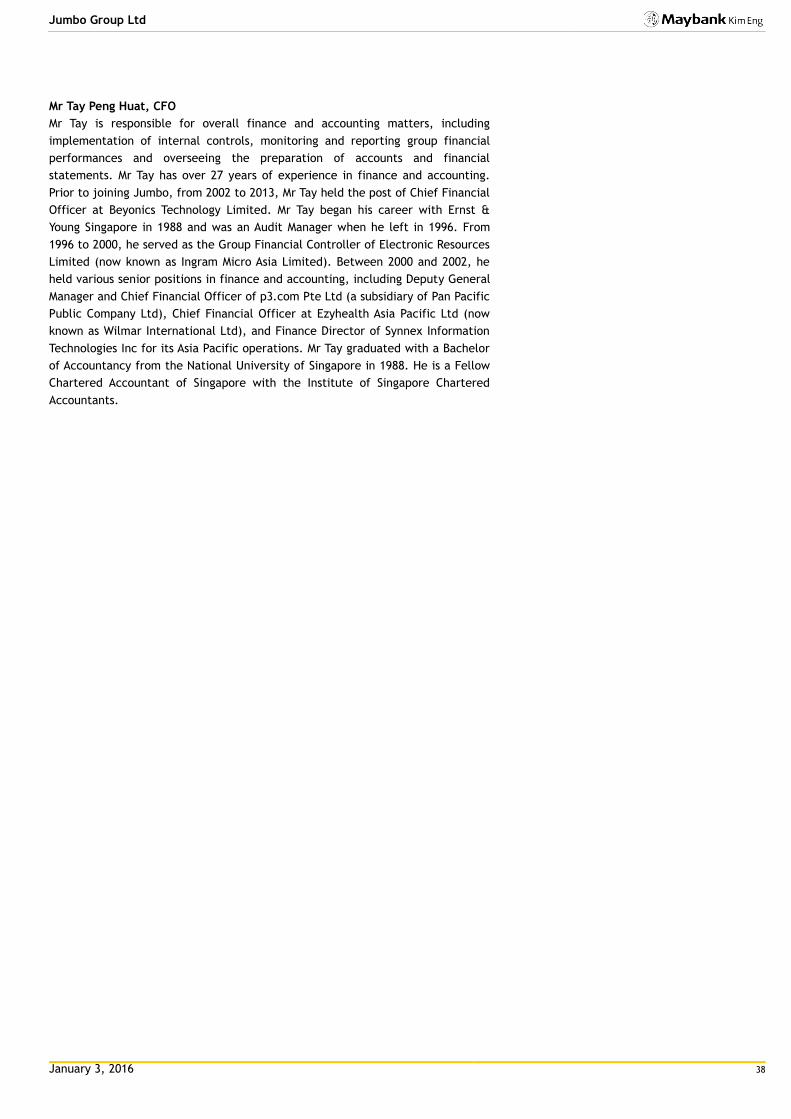
January 3, 2016 38
Jumbo Group Ltd
Mr Tay Peng Huat, CFO
Mr Tay is responsible for overall finance and accounting matters, including
implementation of internal controls, monitoring and reporting group financial
performances and overseeing the preparation of accounts and financial
statements. Mr Tay has over 27 years of experience in finance and accounting.
Prior to joining Jumbo, from 2002 to 2013, Mr Tay held the post of Chief Financial
Officer at Beyonics Technology Limited. Mr Tay began his career with Ernst &
Young Singapore in 1988 and was an Audit Manager when he left in 1996. From
1996 to 2000, he served as the Group Financial Controller of Electronic Resources
Limited (now known as Ingram Micro Asia Limited). Between 2000 and 2002, he
held various senior positions in finance and accounting, including Deputy General
Manager and Chief Financial Officer of p3.com Pte Ltd (a subsidiary of Pan Pacific
Public Company Ltd), Chief Financial Officer at Ezyhealth Asia Pacific Ltd (now
known as Wilmar International Ltd), and Finance Director of Synnex Information
Technologies Inc for its Asia Pacific operations. Mr Tay graduated with a Bachelor
of Accountancy from the National University of Singapore in 1988. He is a Fellow
Chartered Accountant of Singapore with the Institute of Singapore Chartered
Accountants.

January 3, 2016 39
Jumbo Group Ltd
Annex III: Shareholding Details
Fig 48: Shareholders of Jumbo
No. of shares % Comments
JBO 371,582,400 57.9 16 shareholders including Mr Ang Hon Nam, Mr Ang Kiam Meng, Jacqueline Tan Yong Chuan and Mrs Christina Kong Chwee Huan
Mr Tan Gee Jian 42,254,900 6.6 Co-founder of Jumbo
Orchid 1 Investments 40,000,000 6.2 Subsidiary of Temasek Holdings
Mr Ron Sim Chye Hock 32,100,000 5.0 CEO of OSIM International
Mr See Boon Huat 28,169,800 4.4 Co-founder of Jumbo
Mr Koh Ah Say @ See Boon Chye 14,084,700 2.2 Brother of Mr See Boon Huat
Other employees 7,838,000 1.2 Comprising 16 key employees of Jumbo
Palm Beach Seafood Restaurant 12,545,200 2.0 Ex-JV partner for JUMBO Riverside and JUMBO Riverwalk
Mr Ng Kok Kiang 465,500 0.1 Investor in Chui Huay Lim Teochew Cuisine
Mdm Chan Hwee Eng 465,500 0.1 Investor in Chui Huay Lim Teochew Cuisine
NSH Holdings 3,594,000 0.6 50% owned by Mr Ng Siak Hai, co-founder of Jumbo and son of Ng Mui Song, founder of Ng Ah Sio Bak Kut Teh
Public shareholders 88,233,000 13.8
Total 641,333,000 100.0
Source: Company
Fig 49: Shareholders of JBO
Stake Comments
Mr Ang Hon Nam 28.9% Co-founder of Jumbo. Father of Mr Ang Kiam Meng, Mrs Christina Kong Chwee Huan, Mdm Wendy Ang Chui Yong, Mr Ang Kiam Lian and Ms Ang Cheau Hoon
Mr Ang Kiam Meng 13.1% Current CEO and Executive Chairman of Jumbo. Husband of Mdm Jacqueline Tan Yong Chuan
Mr Ng Siak Hai 10.7% Co-founder of Jumbo and son of Ng Mui Song, founder of Ng Ah Sio Bak Kut Teh
Mr Lee Ching Poo 7.6% No information
Mr Ng Nam Soon 7.6% Brother of Mr Ang Hon Nam
Mr Ng Nam Huat 7.6% Brother of Mr Ang Hon Nam
Mdm Nyeo Sai Joo 6.2% Spouse of Mr Ang Hon Nam
Mdm Tan Yong Chuan, Jacqueline 4.0% Spouse of Mr Ang Kiam Meng
Mr Eng Nam Heng 3.1% Brother of Mr Ang Hon Nam
Ms Ng Cheau Lee 3.1% Daughter of Mr Ng Nam Soon
Mr Ng Kiam Chiaw (Huang Jianchao) 3.1% Son of Mr Ng Nam Huat
Mdm Goh Guay Ngoh, Shirley 3.1% Mother of Mr Ang Hon Nam's son
Mrs Christina Kong Chwee Huan 1.7% Sister of Mr Ang Kiam Meng
Mdm Wendy Ang Chui Yong 0.1% Sister of Mr Ang Kiam Meng
Mr Ang Kiam Lian 0.1% Brother of Mr Ang Kiam Meng
Ms Ang Cheau Hoon 1 share Sister of Mr Ang Kiam Meng
Source: Company
Fig 50: Moratorium
Shareholder With regard to Duration of moratorium
JBO Shares in Jumbo 24 months from 29 Oct 2015
Mr Ang Hon Nam, Mr Ang Kiam Meng, Jacqueline Tan Yong Chuan and Mrs Christina Kong Chwee Huan
Shares in JBO 24 months from 29 Oct 2015
NSH Holdings, Other employees, Mr Koh Ah Say @ See Boon Chye, Mr See Boon Huat, Mr Tan Gee Jian
Shares in Jumbo 100% within 6 months from 29 Oct 2015, 50% for next 6 mths
Shareholders of NSH Holdings Shares in NSH Holdings 12 months from 29 Oct 2015
Orchid 1 Investments, Mr Ron Sim Shares in Jumbo 6 months from 29 Oct 2015
Source: Company
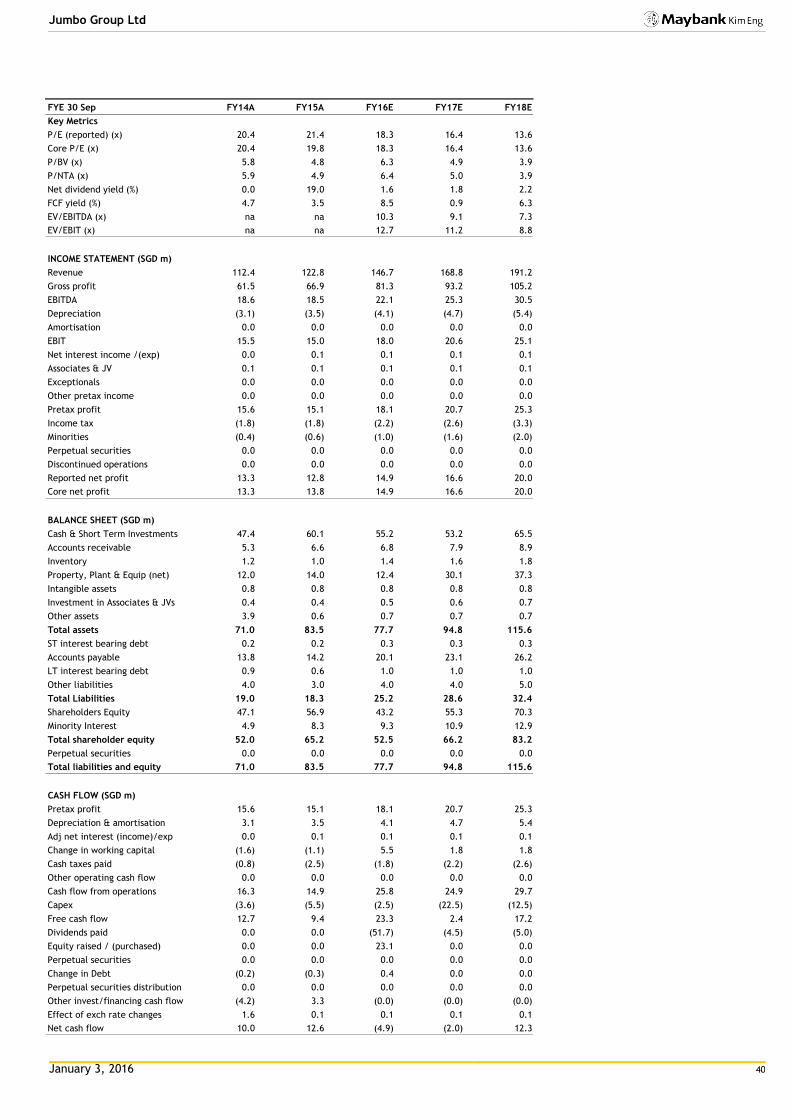
January 3, 2016 40
Jumbo Group Ltd
FYE 30 Sep FY14A FY15A FY16E FY17E FY18E
Key Metrics
P/E (reported) (x) 20.4 21.4 18.3 16.4 13.6
Core P/E (x) 20.4 19.8 18.3 16.4 13.6
P/BV (x) 5.8 4.8 6.3 4.9 3.9
P/NTA (x) 5.9 4.9 6.4 5.0 3.9
Net dividend yield (%) 0.0 19.0 1.6 1.8 2.2
FCF yield (%) 4.7 3.5 8.5 0.9 6.3
EV/EBITDA (x) na na 10.3 9.1 7.3
EV/EBIT (x) na na 12.7 11.2 8.8
INCOME STATEMENT (SGD m)
Revenue 112.4 122.8 146.7 168.8 191.2
Gross profit 61.5 66.9 81.3 93.2 105.2
EBITDA 18.6 18.5 22.1 25.3 30.5
Depreciation (3.1) (3.5) (4.1) (4.7) (5.4)
Amortisation 0.0 0.0 0.0 0.0 0.0
EBIT 15.5 15.0 18.0 20.6 25.1
Net interest income /(exp) 0.0 0.1 0.1 0.1 0.1
Associates & JV 0.1 0.1 0.1 0.1 0.1
Exceptionals 0.0 0.0 0.0 0.0 0.0
Other pretax income 0.0 0.0 0.0 0.0 0.0
Pretax profit 15.6 15.1 18.1 20.7 25.3
Income tax (1.8) (1.8) (2.2) (2.6) (3.3)
Minorities (0.4) (0.6) (1.0) (1.6) (2.0)
Perpetual securities 0.0 0.0 0.0 0.0 0.0
Discontinued operations 0.0 0.0 0.0 0.0 0.0
Reported net profit 13.3 12.8 14.9 16.6 20.0
Core net profit 13.3 13.8 14.9 16.6 20.0
BALANCE SHEET (SGD m)
Cash & Short Term Investments 47.4 60.1 55.2 53.2 65.5
Accounts receivable 5.3 6.6 6.8 7.9 8.9
Inventory 1.2 1.0 1.4 1.6 1.8
Property, Plant & Equip (net) 12.0 14.0 12.4 30.1 37.3
Intangible assets 0.8 0.8 0.8 0.8 0.8
Investment in Associates & JVs 0.4 0.4 0.5 0.6 0.7
Other assets 3.9 0.6 0.7 0.7 0.7
Total assets 71.0 83.5 77.7 94.8 115.6
ST interest bearing debt 0.2 0.2 0.3 0.3 0.3
Accounts payable 13.8 14.2 20.1 23.1 26.2
LT interest bearing debt 0.9 0.6 1.0 1.0 1.0
Other liabilities 4.0 3.0 4.0 4.0 5.0
Total Liabilities 19.0 18.3 25.2 28.6 32.4
Shareholders Equity 47.1 56.9 43.2 55.3 70.3
Minority Interest 4.9 8.3 9.3 10.9 12.9
Total shareholder equity 52.0 65.2 52.5 66.2 83.2
Perpetual securities 0.0 0.0 0.0 0.0 0.0
Total liabilities and equity 71.0 83.5 77.7 94.8 115.6
CASH FLOW (SGD m)
Pretax profit 15.6 15.1 18.1 20.7 25.3
Depreciation & amortisation 3.1 3.5 4.1 4.7 5.4
Adj net interest (income)/exp 0.0 0.1 0.1 0.1 0.1
Change in working capital (1.6) (1.1) 5.5 1.8 1.8
Cash taxes paid (0.8) (2.5) (1.8) (2.2) (2.6)
Other operating cash flow 0.0 0.0 0.0 0.0 0.0
Cash flow from operations 16.3 14.9 25.8 24.9 29.7
Capex (3.6) (5.5) (2.5) (22.5) (12.5)
Free cash flow 12.7 9.4 23.3 2.4 17.2
Dividends paid 0.0 0.0 (51.7) (4.5) (5.0)
Equity raised / (purchased) 0.0 0.0 23.1 0.0 0.0
Perpetual securities 0.0 0.0 0.0 0.0 0.0
Change in Debt (0.2) (0.3) 0.4 0.0 0.0
Perpetual securities distribution 0.0 0.0 0.0 0.0 0.0
Other invest/financing cash flow (4.2) 3.3 (0.0) (0.0) (0.0)
Effect of exch rate changes 1.6 0.1 0.1 0.1 0.1
Net cash flow 10.0 12.6 (4.9) (2.0) 12.3

January 3, 2016 41
Jumbo Group Ltd
FYE 30 Sep FY14A FY15A FY16E FY17E FY18E
Key Ratios
Growth ratios (%)
Revenue growth 15.1 9.2 19.5 15.1 13.3
EBITDA growth 46.5 (0.8) 19.6 14.6 20.5
EBIT growth 55.7 (3.1) 19.8 14.5 22.1
Pretax growth 55.6 (2.9) 19.7 14.4 22.1
Reported net profit growth 39.8 (4.5) 17.1 11.1 20.5
Core net profit growth 39.8 3.0 8.6 11.1 20.5
Profitability ratios (%)
EBITDA margin 16.6 15.0 15.1 15.0 16.0
EBIT margin 13.8 12.2 12.3 12.2 13.1
Pretax profit margin 13.9 12.3 12.4 12.3 13.2
Payout ratio 0.0 nm 30.0 30.0 30.0
DuPont analysis
Net profit margin (%) 11.9 10.4 10.2 9.8 10.4
Revenue/Assets (x) 1.6 1.5 1.9 1.8 1.7
Assets/Equity (x) 1.5 1.5 1.8 1.7 1.6
ROAE (%) 31.8 26.4 29.8 33.7 31.8
ROAA (%) 20.8 17.8 18.5 19.2 19.0
Liquidity & Efficiency
Cash conversion cycle (75.1) (65.5) (71.1) (80.0) (80.2)
Days receivable outstanding 15.9 17.5 16.5 15.7 15.8
Days inventory outstanding 6.2 7.3 6.7 7.2 7.2
Days payables outstanding 97.2 90.2 94.3 102.9 103.2
Dividend cover (x) nm 0.2 3.3 3.3 3.3
Current ratio (x) 3.2 3.9 2.6 2.3 2.4
Leverage & Expense Analysis
Asset/Liability (x) 3.7 4.6 3.1 3.3 3.6
Net debt/equity (%) net cash net cash net cash net cash net cash
Net interest cover (x) na na na na na
Debt/EBITDA (x) 0.1 0.0 0.1 0.0 0.0
Capex/revenue (%) 3.2 4.5 1.7 13.3 6.5
Net debt/ (net cash) (46.3) (59.2) (53.9) (51.9) (64.2)
Source: Company; Maybank
January 3, 2016 42
Jumbo Group Ltd
Research Offices
REGIONAL
Sadiq CURRIMBHOY
Regional Head, Research & Economics
(65) 6231 5836 [email protected]
WONG Chew Hann, CA
Regional Head of Institutional Research
(603) 2297 8686 [email protected]
ONG Seng Yeow
Regional Head of Retail Research
(65) 6231 5839 [email protected]
TAN Sin Mui
Director of Research
(65) 6231 5849 [email protected]
ECONOMICS
Suhaimi ILIAS Chief Economist Singapore | Malaysia (603) 2297 8682 [email protected]
Luz LORENZO Philippines
(63) 2 849 8836 [email protected]
Tim LEELAHAPHAN Thailand (66) 2658 6300 ext 1420 [email protected]
JUNIMAN Chief Economist, BII Indonesia (62) 21 29228888 ext 29682
STRATEGY
Sadiq CURRIMBHOY
Global Strategist
(65) 6231 5836 [email protected]
Willie CHAN
Hong Kong / Regional
(852) 2268 0631 [email protected]
MALAYSIA
WONG Chew Hann, CA Head of Research (603) 2297 8686 [email protected] • Strategy
Desmond CH’NG, ACA (603) 2297 8680 [email protected] • Banking & Finance
LIAW Thong Jung (603) 2297 8688 [email protected] • Oil & Gas Services- Regional
ONG Chee Ting, CA (603) 2297 8678 [email protected] • Plantations - Regional
Mohshin AZIZ (603) 2297 8692 [email protected] • Aviation - Regional • Petrochem
YIN Shao Yang, CPA (603) 2297 8916 [email protected] • Gaming – Regional • Media
TAN Chi Wei, CFA (603) 2297 8690 [email protected] • Power • Telcos
WONG Wei Sum, CFA (603) 2297 8679 [email protected] • Property
LEE Yen Ling (603) 2297 8691 [email protected] • Building Materials • Glove • Ports • Shipping
CHAI Li Shin, CFA (603) 2297 8684 [email protected] • Plantation • Construction & Infrastructure
Ivan YAP (603) 2297 8612 [email protected] • Automotive • Semiconductor • Technology
Kevin WONG (603) 2082 6824 [email protected] • REITs • Consumer Discretionary
LIEW Wei Han
(603) 2297 8676 [email protected] • Consumer Staples
LEE Cheng Hooi Regional Chartist (603) 2297 8694 [email protected]
Tee Sze Chiah Head of Retail Research (603) 2297 6858 [email protected]
Cheah Chong Ling (603) 2297 8767 [email protected]
HONG KONG / CHINA
Howard WONG Head of Research (852) 2268 0648 [email protected] • Oil & Gas - Regional
Benjamin HO (852) 2268 0632 [email protected] • Consumer & Auto
Jacqueline KO, CFA (852) 2268 0633 [email protected] • Consumer Staples & Durables
Ka Leong LO, CFA (852) 2268 0630 [email protected] • Consumer Discretionary & Auto
Mitchell KIM (852) 2268 0634 [email protected] • Internet & Telcos
Osbert TANG, CFA (86) 21 5096 8370 [email protected] • Transport & Industrials
Stefan CHANG, CFA (852) 2268 0675 [email protected] • Technology
Steven ST CHAN (852) 2268 0645 [email protected] • Banking & Financials - Regional
Warren LAU (852) 2268 0644 [email protected] • Technology – Regional
INDIA
Jigar SHAH Head of Research
(91) 22 6623 2632 [email protected]
• Oil & Gas • Automobile • Cement
Anubhav GUPTA
(91) 22 6623 2605 [email protected]
• Metal & Mining • Capital Goods • Property
Vishal MODI
(91) 22 6623 2607 [email protected]
• Banking & Financials
Abhijeet KUNDU
(91) 22 6623 2628 [email protected]
• Consumer
Neerav DALAL
(91) 22 6623 2606 [email protected]
• Software Technology • Telcos
SINGAPORE
Gregory YAP (65) 6231 5848 [email protected] • SMID Caps • Technology & Manufacturing • Telcos
YEAK Chee Keong, CFA (65) 6231 5842 [email protected] • Offshore & Marine
Derrick HENG, CFA (65) 6231 5843 [email protected] • Transport • Property • REITs (Office)
Joshua TAN (65) 6231 5850 [email protected] • REITs (Retail, Industrial)
John CHEONG, CFA (65) 6231 5845 [email protected] • Small & Mid Caps • Healthcare
TRUONG Thanh Hang (65) 6231 5847 [email protected] • Small & Mid Caps
INDONESIA
Isnaputra ISKANDAR Head of Research (62) 21 2557 1129 [email protected] • Strategy • Metals & Mining • Cement
Rahmi MARINA (62) 21 2557 1128 [email protected] • Banking & Finance
Aurellia SETIABUDI (62) 21 2953 0785 [email protected] • Property
Pandu ANUGRAH (62) 21 2557 1137 [email protected] • Infra • Construction • Transport• Telcos
Janni ASMAN (62) 21 2953 0784 [email protected] • Cigarette • Healthcare • Retail
Adhi TASMIN (62) 21 2557 1209 [email protected] • Plantations
Anthony LUKMAWIJAYA (62) 21 2557 1126 [email protected] • Aviation
PHILIPPINES
Luz LORENZO Head of Research (63) 2 849 8836 [email protected] • Strategy • Utilities • Conglomerates • Telcos
Lovell SARREAL (63) 2 849 8841 [email protected] • Consumer • Media • Cement
Rommel RODRIGO (63) 2 849 8839 [email protected] • Conglomerates • Property • Gaming • Ports/ Logistics
Katherine TAN (63) 2 849 8843 [email protected] • Banks • Construction
Michael BENGSON (63) 2 849 8840 [email protected] • Conglomerates
Jaclyn JIMENEZ (63) 2 849 8842 [email protected] • Consumer
Arabelle MAGHIRANG (63) 2 849 8838 [email protected] • Banks
THAILAND
Maria LAPIZ Head of Institutional Research Dir (66) 2257 0250 | (66) 2658 6300 ext 1399 [email protected] • Consumer • Materials • Ind. Estates
Sittichai DUANGRATTANACHAYA (66) 2658 6300 ext 1393 [email protected]
• Services Sector • Transport
Yupapan POLPORNPRASERT (66) 2658 6300 ext 1395 [email protected] • Oil & Gas
Sukit UDOMSIRIKUL Head of Retail Research (66) 2658 6300 ext 5090 [email protected]
Mayuree CHOWVIKRAN (66) 2658 6300 ext 1440 [email protected] • Strategy
Padon VANNARAT (66) 2658 6300 ext 1450 [email protected] • Strategy
Surachai PRAMUALCHAROENKIT (66) 2658 6300 ext 1470 [email protected] • Auto • Conmat • Contractor • Steel
Suttatip PEERASUB (66) 2658 6300 ext 1430 [email protected] • Media • Commerce
Sutthichai KUMWORACHAI (66) 2658 6300 ext 1400 [email protected] • Energy • Petrochem
Termporn TANTIVIVAT (66) 2658 6300 ext 1520 [email protected] • Property
Jaroonpan WATTANAWONG (66) 2658 6300 ext 1404 [email protected] • Transportation • Small cap
VIETNAM
LE Hong Lien, ACCA Head of Institutional Research (84) 8 44 555 888 x 8181 [email protected] • Strategy • Consumer • Diversified • Utilities
THAI Quang Trung, CFA, Deputy Manager, Institutional Research (84) 8 44 555 888 x 8180 [email protected] • Real Estate • Construction • Materials
Le Nguyen Nhat Chuyen (84) 8 44 555 888 x 8082 [email protected] • Oil & Gas
NGUYEN Thi Ngan Tuyen, Head of Retail Research (84) 8 44 555 888 x 8081 [email protected] • Food & Beverage • Oil&Gas • Banking
TRINH Thi Ngoc Diep (84) 4 44 555 888 x 8208 [email protected] • Technology • Utilities • Construction
PHAM Nhat Bich (84) 8 44 555 888 x 8083 [email protected] • Consumer • Manufacturing • Fishery
NGUYEN Thi Sony Tra Mi (84) 8 44 555 888 x 8084 [email protected] • Port operation • Pharmaceutical • Food & Beverage
TRUONG Quang Binh (84) 4 44 555 888 x 8087 [email protected] • Rubber plantation • Tyres and Tubes • Oil&Gas

January 3, 2016 43
Jumbo Group Ltd
APPENDIX I: TERMS FOR PROVISION OF REPORT, DISCLAIMERS AND DISCLOSURES
DISCLAIMERS
This research report is prepared for general circulation and for information purposes only and under no circumstances should it be considered or intended as an offer to sell or a solicitation of an offer to buy the securities referred to herein. Investors should note that values of such securities, if any, may fluctuate and that each security’s price or value may rise or fall. Opinions or recommendations contained herein are in form of technical ratings and fundamental ratings. Technical ratings may differ from fundamental ratings as technical valuations apply different methodologies and are purely based on price and volume-related information extracted from the relevant jurisdiction’s stock exchange in the equity analysis. Accordingly, investors’ returns may be less than the original sum invested. Past performance is not necessarily a guide to future performance. This report is not intended to provide personal investment advice and does not take into account the specific investment objectives, the financial situation and the particular needs of persons who may receive or read this report. Investors should therefore seek financial, legal and other advice regarding the appropriateness of investing in any securities or the investment strategies discussed or recommended in this report.
The information contained herein has been obtained from sources believed to be reliable but such sources have not been independently verified by Maybank Investment Bank Berhad, its subsidiary and affiliates (collectively, “MKE”) and consequently no representation is made as to the accuracy or completeness of this report by MKE and it should not be relied upon as such. Accordingly, MKE and its officers, directors, associates, connected parties and/or employees (collectively, “Representatives”) shall not be liable for any direct, indirect or consequential losses or damages that may arise from the use or reliance of this report. Any information, opinions or recommendations contained herein are subject to change at any time, without prior notice.
This report may contain forward looking statements which are often but not always identified by the use of words such as “anticipate”, “believe”, “estimate”, “intend”, “plan”, “expect”, “forecast”, “predict” and “project” and statements that an event or result “may”, “will”, “can”, “should”, “could” or “might” occur or be achieved and other similar expressions. Such forward looking statements are based on assumptions made and information currently available to us and are subject to certain risks and uncertainties that could cause the actual results to differ materially from those expressed in any forward looking statements. Readers are cautioned not to place undue relevance on these forward-looking statements. MKE expressly disclaims any obligation to update or revise any such forward looking statements to reflect new information, events or circumstances after the date of this publication or to reflect the occurrence of unanticipated events.
MKE and its officers, directors and employees, including persons involved in the preparation or issuance of this report, may, to the extent permitted by law, from time to time participate or invest in financing transactions with the issuer(s) of the securities mentioned in this report, perform services for or solicit business from such issuers, and/or have a position or holding, or other material interest, or effect transactions, in such securities or options thereon, or other investments related thereto. In addition, it may make markets in the securities mentioned in the material presented in this report. MKE may, to the extent permitted by law, act upon or use the information presented herein, or the research or analysis on which they are based, before the material is published. One or more directors, officers and/or employees of MKE may be a director of the issuers of the securities mentioned in this report.
This report is prepared for the use of MKE’s clients and may not be reproduced, altered in any way, transmitted to, copied or distributed to any other party in whole or in part in any form or manner without the prior express written consent of MKE and MKE and its Representatives accepts no liability whatsoever for the actions of third parties in this respect.
This report is not directed to or intended for distribution to or use by any person or entity who is a citizen or resident of or located in any locality, state, country or other jurisdiction where such distribution, publication, availability or use would be contrary to law or regulation. This report is for distribution only under such circumstances as may be permitted by applicable law. The securities described herein may not be eligible for sale in all jurisdictions or to certain categories of investors. Without prejudice to the foregoing, the reader is to note that additional disclaimers, warnings or qualifications may apply based on geographical location of the person or entity receiving this report.
Malaysia
Opinions or recommendations contained herein are in the form of technical ratings and fundamental ratings. Technical ratings may differ from fundamental ratings as technical valuations apply different methodologies and are purely based on price and volume-related information extracted from Bursa Malaysia Securities Berhad in the equity analysis.
Singapore
This report has been produced as of the date hereof and the information herein may be subject to change. Maybank Kim Eng Research Pte. Ltd. (“Maybank KERPL”) in Singapore has no obligation to update such information for any recipient. For distribution in Singapore, recipients of this report are to contact Maybank KERPL in Singapore in respect of any matters arising from, or in connection with, this report. If the recipient of this report is not an accredited investor, expert investor or institutional investor (as defined under Section 4A of the Singapore Securities and Futures Act), Maybank KERPL shall be legally liable for the contents of this report, with such liability being limited to the extent (if any) as permitted by law.
Thailand
The disclosure of the survey result of the Thai Institute of Directors Association (“IOD”) regarding corporate governance is made pursuant to the policy of the Office of the Securities and Exchange Commission. The survey of the IOD is based on the information of a company listed on the Stock Exchange of Thailand and the market for Alternative Investment disclosed to the public and able to be accessed by a general public investor. The result, therefore, is from the perspective of a third party. It is not an evaluation of operation and is not based on inside information. The survey result is as of the date appearing in the Corporate Governance Report of Thai Listed Companies. As a result, the survey may be changed after that date. Maybank Kim Eng Securities (Thailand) Public Company Limited (“MBKET”) does not confirm nor certify the accuracy of such survey result.
Except as specifically permitted, no part of this presentation may be reproduced or distributed in any manner without the prior written permission of MBKET. MBKET accepts no liability whatsoever for the actions of third parties in this respect.
US
This research report prepared by MKE is distributed in the United States (“US”) to Major US Institutional Investors (as defined in Rule 15a-6 under the Securities Exchange Act of 1934, as amended) only by Maybank Kim Eng Securities USA Inc (“Maybank KESUSA”), a broker-dealer registered in the US (registered under Section 15 of the Securities Exchange Act of 1934, as amended). All responsibility for the distribution of this report by Maybank KESUSA in the US shall be borne by Maybank KESUSA. All resulting transactions by a US person or entity should be effected through a registered broker-dealer in the US. This report is not directed at you if MKE is prohibited or restricted by any legislation or regulation in any jurisdiction from making it available to you. You should satisfy yourself before reading it that Maybank KESUSA is permitted to provide research material concerning investments to you under relevant legislation and regulations.
UK
This document is being distributed by Maybank Kim Eng Securities (London) Ltd (“Maybank KESL”) which is authorized and regulated, by the Financial Services Authority and is for Informational Purposes only. This document is not intended for distribution to anyone defined as a Retail Client under the Financial Services and Markets Act 2000 within the UK. Any inclusion of a third party link is for the recipients convenience only, and that the firm does not take any responsibility for its comments or accuracy, and that access to such links is at the individuals own risk. Nothing in this report should be considered as constituting legal, accounting or tax advice, and that for accurate guidance recipients should consult with their own independent tax advisers.
January 3, 2016 44
Jumbo Group Ltd
Disclosure of Interest
Malaysia: MKE and its Representatives may from time to time have positions or be materially interested in the securities referred to herein and may further act as market maker or may have assumed an underwriting commitment or deal with such securities and may also perform or seek to perform investment banking services, advisory and other services for or relating to those companies.
Singapore: As of 3 January 2016, Maybank KERPL and the covering analyst do not have any interest in any companies recommended in this research report.
Thailand: MBKET may have a business relationship with or may possibly be an issuer of derivative warrants on the securities /companies mentioned in the research report. Therefore, Investors should exercise their own judgment before making any investment decisions. MBKET, its associates, directors, connected parties and/or employees may from time to time have interests and/or underwriting commitments in the securities mentioned in this report.
Hong Kong: KESHK may have financial interests in relation to an issuer or a new listing applicant referred to as defined by the requirements under Paragraph 16.5(a) of the Hong Kong Code of Conduct for Persons Licensed by or Registered with the Securities and Futures Commission.
As of 3 January 2016, KESHK and the authoring analyst do not have any interest in any companies recommended in this research report.
MKE may have, within the last three years, served as manager or co-manager of a public offering of securities for, or currently may make a primary market in issues of, any or all of the entities mentioned in this report or may be providing, or have provided within the previous 12 months, significant advice or investment services in relation to the investment concerned or a related investment and may receive compensation for the services provided from the companies covered in this report.
OTHERS
Analyst Certification of Independence
The views expressed in this research report accurately reflect the analyst’s personal views about any and all of the subject securities or issuers; and no part of the research analyst’s compensation was, is or will be, directly or indirectly, related to the specific recommendations or views expressed in the report.
Reminder
Structured securities are complex instruments, typically involve a high degree of risk and are intended for sale only to sophisticated investors who are capable of understanding and assuming the risks involved. The market value of any structured security may be affected by changes in economic, financial and political factors (including, but not limited to, spot and forward interest and exchange rates), time to maturity, market conditions and volatility and the credit quality of any issuer or reference issuer. Any investor interested in purchasing a structured product should conduct its own analysis of the product and consult with its own professional advisers as to the risks involved in making such a purchase.
No part of this material may be copied, photocopied or duplicated in any form by any means or redistributed without the prior consent of MKE.
Ong Seng Yeow | Executive Director, Maybank Kim Eng Research
Definition of Ratings
Maybank Kim Eng Research uses the following rating system
BUY Return is expected to be above 10% in the next 12 months (excluding dividends)
HOLD Return is expected to be between - 10% to +10% in the next 12 months (excluding dividends)
SELL Return is expected to be below -10% in the next 12 months (excluding dividends)
Applicability of Ratings
The respective analyst maintains a coverage universe of stocks, the list of which may be adjusted according to needs. Investment ratings are only applicable to the stocks which form part of the coverage universe. Reports on companies which are not part of the coverage do not carry investment ratings as we do not actively follow developments in these companies.
DISCLOSURES
Legal Entities Disclosures
Malaysia: This report is issued and distributed in Malaysia by Maybank Investment Bank Berhad (15938-H) which is a Participating Organization of Bursa Malaysia Berhad and a holder of Capital Markets and Services License issued by the Securities Commission in Malaysia. Singapore: This material is issued and distributed in Singapore by Maybank KERPL (Co. Reg No 197201256N) which is regulated by the Monetary Authority of Singapore. Indonesia: PT Kim Eng Securities (“PTKES”) (Reg. No. KEP-251/PM/1992) is a member of the Indonesia Stock Exchange and is regulated by the BAPEPAM LK. Thailand: MBKET (Reg. No.0107545000314) is a member of the Stock Exchange of Thailand and is regulated by the Ministry of Finance and the Securities and Exchange Commission. Philippines: Maybank ATRKES (Reg. No.01-2004-00019) is a member of the Philippines Stock Exchange and is regulated by the Securities and Exchange Commission. Vietnam: Maybank Kim Eng Securities JSC (License Number: 71/UBCK-GP) is licensed under the State Securities Commission of Vietnam.Hong Kong: KESHK (Central Entity No AAD284) is regulated by the Securities and Futures Commission. India: Kim Eng Securities India Private Limited (“KESI”) is a participant of the National Stock Exchange of India Limited (Reg No: INF/INB 231452435) and the Bombay Stock Exchange (Reg. No. INF/INB 011452431) and is regulated by Securities and Exchange Board of India. KESI is also registered with SEBI as Category 1 Merchant Banker (Reg. No. INM 000011708) US: Maybank KESUSA is a member of/ and is authorized and regulated by the FINRA – Broker ID 27861. UK: Maybank KESL (Reg No 2377538) is authorized and regulated by the Financial Services Authority.

January 3, 2016 45
Jumbo Group Ltd
Malaysia Maybank Investment Bank Berhad
(A Participating Organisation of
Bursa Malaysia Securities Berhad)
33rd Floor, Menara Maybank,
100 Jalan Tun Perak,
50050 Kuala Lumpur
Tel: (603) 2059 1888;
Fax: (603) 2078 4194
Singapore Maybank Kim Eng Securities Pte Ltd
Maybank Kim Eng Research Pte Ltd
50 North Canal Road
Singapore 059304
Tel: (65) 6336 9090
London Maybank Kim Eng Securities
(London) Ltd
5th Floor, Aldermary House
10-15 Queen Street
London EC4N 1TX, UK
Tel: (44) 20 7332 0221
Fax: (44) 20 7332 0302
New York Maybank Kim Eng Securities USA
Inc
777 Third Avenue, 21st Floor
New York, NY 10017, U.S.A.
Tel: (212) 688 8886
Fax: (212) 688 3500
Stockbroking Business:
Level 8, Tower C, Dataran Maybank,
No.1, Jalan Maarof
59000 Kuala Lumpur
Tel: (603) 2297 8888
Fax: (603) 2282 5136
Hong Kong Kim Eng Securities (HK) Ltd
Level 30,
Three Pacific Place,
1 Queen’s Road East,
Hong Kong
Tel: (852) 2268 0800
Fax: (852) 2877 0104
Indonesia PT Maybank Kim Eng Securities
Plaza Bapindo
Citibank Tower 17th Floor
Jl Jend. Sudirman Kav. 54-55
Jakarta 12190, Indonesia
Tel: (62) 21 2557 1188
Fax: (62) 21 2557 1189
India Kim Eng Securities India Pvt Ltd
2nd Floor, The International 16,
Maharishi Karve Road,
Churchgate Station,
Mumbai City - 400 020, India
Tel: (91) 22 6623 2600
Fax: (91) 22 6623 2604
Philippines Maybank ATR Kim Eng Securities Inc.
17/F, Tower One & Exchange Plaza
Ayala Triangle, Ayala Avenue
Makati City, Philippines 1200
Tel: (63) 2 849 8888
Fax: (63) 2 848 5738
Thailand Maybank Kim Eng Securities
(Thailand) Public Company Limited
999/9 The Offices at Central World,
20th - 21st Floor,
Rama 1 Road Pathumwan,
Bangkok 10330, Thailand
Tel: (66) 2 658 6817 (sales)
Tel: (66) 2 658 6801 (research)
Vietnam Maybank Kim Eng Securities Limited
4A-15+16 Floor Vincom Center Dong
Khoi, 72 Le Thanh Ton St. District 1
Ho Chi Minh City, Vietnam
Tel : (84) 844 555 888
Fax : (84) 8 38 271 030
Saudi Arabia In association with
Anfaal Capital
Villa 47, Tujjar Jeddah
Prince Mohammed bin Abdulaziz
Street P.O. Box 126575
Jeddah 21352
Tel: (966) 2 6068686
Fax: (966) 26068787
South Asia Sales Trading Kevin Foy
Regional Head Sales Trading
Tel: (65) 6336-5157
US Toll Free: 1-866-406-7447
North Asia Sales Trading Andrew Lee
Tel: (852) 2268 0283
US Toll Free: 1 877 837 7635
Malaysia Rommel Jacob [email protected] Tel: (603) 2717 5152
Thailand Tanasak Krishnasreni [email protected] Tel: (66)2 658 6820
Indonesia Harianto Liong [email protected] Tel: (62) 21 2557 1177
New York Andrew Dacey [email protected] Tel: (212) 688 2956
India Manish Modi [email protected] Tel: (91)-22-6623-2601
Vietnam Tien Nguyen [email protected]
Tel: (84) 44 555 888 x8079
Philippines Keith Roy [email protected] Tel: (63) 2 848-5288
www.maybank-ke.com | www.maybank-keresearch.com