05-0221-o
TRANSCRIPT

NHTSA’S LIGHT VEHICLE HANDLING AND ESC EFFECTIVENESS RESEARCH PROGRAM Garrick J. Forkenbrock National Highway Traffic Safety Administration Devin Elsasser and Bryan O’Harra Transportation Research Center, Inc. United States Paper Number 05-0221 ABSTRACT In 2004, the National Highway Traffic Safety Administration (NHTSA) created its Light Vehicle Handling and electronic stability control (ESC) research program. When first conceived, this program emphasized the development of test maneuvers and analysis methods capable of objectively quantifying handling. At the time, it was envisioned the publication of such results would complement the Agency’s NCAP dynamic rollover resistance ratings, thereby allowing consumers to better understand the potential tradeoffs between dynamic rollover stability and good handling. However, as the 2004 testing proceeded, the Agency’s vision of quantifying handling was replaced by the desire to research the safety benefits of ESC. One of the primary objectives of this refocused effort was to develop a way to objectively assess ESC effectiveness on the test track. The research discussed in this paper examined the ESC effectiveness of five vehicles using twelve maneuvers. Maneuvers are described and their ability to satisfy three ESC effectiveness criteria is discussed. Maneuvers utilized automated and driver-based steering inputs. If driver-based steering was required, multiple drivers were used to assess input variability. To quantify the effects of ESC on handling test outcome, each vehicle was evaluated with ESC enabled and disabled. INTRODUCTION The intent of this paper is to describe the tests NHTSA used to explore light vehicle handling and assess ESC effectiveness. All tests were performed at the Transportation Research Center, Inc. (TRC), located in East Liberty, Ohio. Specifically, the facility’s Vehicle Dynamics Area (VDA), a 50-acre asphalt test pad, was used. Although dry and wet surfaces were utilized, the wet surfaces introduced an undesirable combination of test variability and sensor
malfunctions. For this reason, this paper only discusses NHTSA’s dry testing efforts. The tests described in this paper occurred during the period of April 4 through October 25, 2004. During this time, the VDA’s peak coefficient of friction ranged from 0.91 to 0.97. The slide coefficient varied slightly less, ranging from 0.83 to 0.87. The lowest ambient testing temperature was 38°F, recorded prior to a series of tests performed on October 5, 2004. The highest ambient testing temperature was 85°F, recorded prior to tests performed on June 8, 2004 and August 3, 2004. Five vehicles equipped with ESC were used. Although they had been used in previous test programs, each vehicle was originally purchased as new by NHTSA, and the respective suspensions were in excellent mechanical condition. Some basic descriptions of these vehicles are presented in Table 1. The measurements provided in this table were taken with a Hybrid II anthropomorphic test dummy positioned in the driver’s seat and a full tank of fuel, but without instrumentation or outriggers.
Table 1. Baseline Vehicle Descriptions.
Vehicle Description ESC Wheelbase (inches)
Weight (lbs)
2003 Toyota Camry
Medium-Sized Car VSC 107.0 3634
2002 Chevrolet Corvette Sports Car Active
Handling 104.3 3361
2004 Volvo XC90 4x4 SUV DTSC 112.3 4803
2003 Toyota 4Runner 4x4 SUV VSC 109.9 4408
2004 GMC Savana 3500
15-Passenger Van Stabilitrak 155.5 6770
Tires were of original equipment specification, and were inflated to the pressures recommended by the manufacturer on the respective placards. With the
Forkenbrock 1

exception of the NHTSA Fishhook and J-Turn, the tire wear observed during the conduct of maneuvers discussed in this paper was generally not severe, therefore multiple maneuvers were performed with a single tire set. All tests were performed with the vehicles in NHTSA’s Nominal Load condition (driver, instrumentation, full fuel). With the exception of the Chevrolet Corvette, titanium outriggers were installed in lieu of the front and rear bumpers. Given the diversity of the vehicle pool, the authors believe results of this study should be reasonably representative of most light vehicles evaluated in the Nominal Load condition. TEST MANEUVER GROUPS Tests were divided into three groups: Test Groups 1, 2, and 3. A programmable steering machine was used to command the Test Group 1 and 3 handwheel inputs, while experienced drivers were used for Test Group 2. Table 2 presents the overall matrix. For the sake of brevity, Test Group 1 maneuver descriptions are not included in this paper. They are described in [1,2,3].
Table 2.
NHTSA’s 2004 Light Vehicle Handling / ESC Test Matrix.
Test Group 1 Test Group 2 Test Group 3
• Slowly Increasing Steer
• NHTSA J-Turn
• NHTSA Fishhook
• Modified ISO 3888-2
• Constant Radius Turn
• Closing Radius Turn • Pulse Steer (500 deg/s, 700 deg/s) • Sine Steer (0.5 Hz, 0.6 Hz, 0.7 Hz,
0.8 Hz) • Increasing Amplitude Sine
Steer (0.5 Hz, 0.6 Hz, 0.7 Hz) • Sine with Dwell (0.5 Hz, 0.7 Hz) • Yaw Acceleration
Steering Reversal (500 deg/s, 720 deg/s) • Increasing Amplitude
Yaw Acceleration Steering Reversal
(500 deg/s, 720 deg/s)
Test Group 1 Test Group 1 was comprised of maneuvers well known to NHTSA: the Slowly Increasing Steer
(SIS), NHTSA J-Turn and NHTSA Fishhook. In recent years, these maneuvers have been used by NHTSA to evaluate on-road, untripped dynamic rollover resistance. They were included in this study, research designed to evaluate handling and ESC effectiveness, for a number of reasons. First, the maneuvers may offer more utility than previously realized. Tests used to measure dynamic rollover propensity may also reveal important information about important handling characteristics. Second, the instrumentation used for handling research differed slightly from that used for the rollover research program. Measurement of lateral velocity (to facilitate calculation of body slip angles) and vehicle position (via GPS) was not previously performed. Third, it is important to establish a relationship between on-road, untripped rollover, handling, and ESC effectiveness. Understanding what potential compromises may exist between these factors is of great interest to NHTSA (e.g., has the handling of a particular vehicle been degraded so as to improve dynamic rollover resistance?). Finally, these maneuvers will help NHTSA further understand how ESC can affect dynamic rollover resistance. Test Group 2 Test Group 2 was comprised of two maneuvers: (1) the Constant Radius Turn, and (2) double lane changes performed with a modified version of the ISO 3888 Part 2 test course. Due to the path-following nature of these maneuvers, use of VRTC’s programmable steering machine was not feasible. Although maneuvers that rely on the inputs of human drivers are inherently influenced by input variability, NHTSA believed some important insight into vehicle handling could be gained by understanding the subjective impressions of its test drivers. With this knowledge, it was envisioned that a meaningful objective handling test could ultimately be developed. To reduce input variability to the greatest extent possible, up to four experienced drivers were used for each of the Test Group 2 maneuvers. Constant Radius Turn The Constant Radius Turn maneuver required the driver attempt to maintain vehicle position on a 200-ft radius circle delineated by pavement marking paint. To begin the maneuver, the driver positioned the vehicle on the circle, with an initial heading tangent to the circle. Beginning from rest, the driver slowly increased vehicle speed and steering such that as it accelerated, the center of the vehicle remained as close to the pavement markings as possible. The driver continued the gradual increase in vehicle speed
Forkenbrock 2

Forkenbrock 3
Figure 1. Modified ISO 3888-2 course layout.
until the vehicle could no longer maintain its position on the pavement markings, regardless of the steering wheel angle used, at which point the test was terminated. A total of twelve tests per driver were used. With enabled ESC, the driver performed three left-steer tests followed by three right-steer tests. The ESC was then disabled and the process repeated. Two experienced drivers performed the Constant Radius Turn tests with each of the five test vehicles. Modified ISO 3888 Part 2 Double Lane Change Double lane change maneuvers can provide valuable information about the handling of a vehicle in a highly transient situation. Unlike maneuvers such as the NHTSA Fishhook, lane changes are path-following in nature, and therefore possess an inherently high face validity. These are avoidance maneuvers that frequently occur in the real world. There are many different double lane changes used in industry. These include ISO 3888 Parts 1 and 2, the Consumer’s Union short and long courses, and that presented to NHTSA by the Alliance of Automobile Manufacturers. NHTSA used the ISO 3888-2 lane change to evaluate untripped, dynamic rollover resistance in Phase IV of its Rollover Research Program. The course was comprised of three lanes, two of which had their width defined by the width of the vehicle being evaluated (a consideration that endeavors to impose similar severity for all vehicles, and to reduce steering input variability). After performing these tests in Phase IV, the authors concluded that use of the maneuver for quantifying rollover resistance was not appropriate, and that it may be better suited for near-limit subjective handling assessment. The reasons for this were two-fold: (1) due to its length, the second lane of the course briefly allowed the
vehicles to stabilize before being steered toward the third lane, and (2) the width of the second lane was so narrow that the vehicles were unable to generate significant rear slip angles without striking cones (thus violating a validity requirement). To maintain some of the desirable features of the ISO 3888-2 course (e.g., adjusting dimensions to the vehicle being evaluated), but with increased maneuver severity, the second lane was replaced with a gate comprised of only two pylons. The width of this gate still remained a function of the vehicle being evaluated, and its longitudinal position remained constant regardless of what test vehicle was being used. Figure 1 presents the modified IS0 3888-2 course layout, while Table 3 specifies what lane/gate widths were used for each vehicle. Due to the track width similarities of the Volvo XC90, Savana 3500, and Chevrolet Corvette, the course layout used for these vehicles was held constant.
Table 3.
Modified ISO 3888-2 Entrance Lane and Obstacle Gate Widths.
Vehicle Vehicle Width
(m)
Entrance Lane Width
“A” (m)
Obstacle Gate Width
“B” (m)
2004 GMC Savana 3500 1.98 2.43 2.98
2004 Volvo XC90 4x4 1.88 2.30 2.86
2003 Toyota 4Runner 4x4 1.85 2.30 2.86
2002 Chevrolet Corvette 1.82 2.30 2.86
2003 Toyota Camry 1.75 2.17 2.74

Four experienced drivers performed the Modified ISO 3888-2 tests, with each of the five test vehicles. All vehicles were evaluated with their respective ESC systems enabled and disabled. Each driver performed the disabled ESC tests prior to those performed with the systems enabled. To begin this maneuver, the vehicle was driven in a straight line at the desired entrance speed. Prior to entering the first lane, the driver released the throttle and, at a nominal distance of 6.6 ft (2.0 m) after entering the first lane, the maneuver entrance speed was recorded (as shown in Figure 1). No throttle input or brake application was permitted during the remainder of the maneuver. The driver steered the vehicle from the entrance lane, through the offset (left) gate, then through the exit lane. Drivers iteratively increased maneuver entrance speed from approximately 35 mph. The iterations continued until “clean” tests could no longer be performed (the desired course could not be followed without striking or bypassing cones), however each driver was instructed to perform only ten tests per vehicle configuration. Each driver was required to perform at least two “clean” runs using their maximum maneuver entrance speed. Runs that were not “clean” were not considered to be valid, and were not used for later analysis. To reduce any confounding effect tire wear may have on the modified ISO 3888-2 double lane change results, a new tire set was installed on each vehicle after two drivers had completed their respective lane changes (i.e., two drivers shared one tire set). Test Group 3 Test Group 3 included maneuvers developed by the Alliance of Automobile Manufactures (subsequently referred to as the Alliance for brevity) and NHTSA. The Alliance-developed maneuvers were originally conceived to provide data to be used to objectively quantify light vehicle handling. For this reason, these maneuvers were each performed with a programmable steering machine. NHTSA’s Test Group 3 maneuvers were developed after the Alliance had developed it’s handling maneuvers. Conceptually, these maneuvers were nearly identical to those developed by the Alliance, however they included a provision that allowed the maneuvers to be adapted to the vehicle being evaluated. Although the Test Group 3 maneuvers utilized a programmable steering machine for all steering inputs, the rates and magnitudes are believed to be within the capabilities of a human driver.
With the exception of the Closing Radius Turn maneuver, handwheel angles used for the Test Group 3 tests were nominally increased in 20-degree increments from 60- to 300-degrees to increase maneuver severity. However, a test series was terminated once excessive yaw caused the vehicle’s final heading to be approximately 90-degrees from the initial direction of travel. Closing Radius Turn Conceptually, this maneuver simulates a situation where a driver enters a tight, closing radius corner with excessive speed (e.g., a low-speed exit ramp from a highway or interstate roadway). In this scenario, the driver begins to slowly steer the vehicle onto the exit ramp, but is then surprised by the rate at which the curve tightens. As an instinctual countermeasure, the driver rapidly inputs more and more steering as they travel deeper into the turn. If excessive speed is present, the vehicle may not respond to the additional steering commands input by the driver. This can lead to a roadway departure in which the front of the vehicle departs the roadway before the rear. To begin the maneuver, the driver accelerated the vehicle to a speed of approximately 52 mph, at which point the throttle was released and the steering controller engaged. Once the vehicle had coasted down to a speed of 50 mph, the steering machine automatically executed one of the steering inputs shown in Figure 2.
As shown in Figure 2, the Closing Radius Turn maneuver was comprised of two parts. The first was a linear increase in steering angle from zero to the
Figure 2. Closing Radius Turn handwheel inputs.
Forkenbrock 4

average handwheel angle capable of achieving 0.5g (corrected for roll effects) during the six previously described SIS tests. The second part of each maneuver was comprised of a partial sinusoid, based on one of four frequencies: 0.075, 0.1, 0.2, or 0.3 Hz. For each frequency, one of three peak steering angle magnitudes was used: 1.5*δ90%MaxAY, 2.0*δ90%MaxAY, or 360 degrees, where δ90%MaxAY was the handwheel angle measured at 90 percent of the average maximum lateral acceleration achieved during each vehicle’s respective SIS tests. Pulse Steer The Pulse Steer maneuver was comprised of triangular steering inputs performed with constant handwheel rates and incrementally increasing handwheel angles. Two steering ramp rates were used, 500 deg/sec or 700 deg/sec, and each maneuver only used one rate per test (i.e., the first and second ramp rates were always the same). Figure 3 describes the Pulse Steer steering inputs.
Sine Steer The four Sine Steer maneuvers performed in this study were each comprised of one single cycle sinusoidal steering input. The peak magnitudes of the first and second half-cycles were identical. Frequencies of 0.5, 0.6, 0.7 and 0.8 Hz were used. Figure 4 provides an example of the Sine Steer steering inputs.
Sine with Dwell In a manner nearly identical to the Sine Steer tests, the two Sine with Dwell maneuvers were based on one single cycle sinusoidal steering input. Although the peak magnitudes of the first and second half-cycles were identical, the Sine with Dwell maneuver included a 500 ms pause after completion of the third quarter-cycle of the sinusoid. Frequencies of 0.5 and 0.7 Hz were used. Figure 5 provides an example of the Sine with Dwell steering inputs.
Increasing Amplitude Sine Like the other maneuvers based on sinusoidal steering, the three Increasing Amplitude Sine maneuvers were based on one single cycle sinusoidal steering input. However, the amplitude of the second half-cycle was 1.3 times greater than the first half-cycle for this maneuver. Frequencies of 0.5, 0.6, and 0.7 Hz were used for the first half cycle; the duration of the second half cycle was 1.3 times that of the first. Figure 6 provides an example of the Increasing Amplitude Sine steering inputs.
Yaw Acceleration Steering Reversal (YASR) The Yaw Acceleration Steering Reversal (YASR) maneuver was designed to trigger changes in
Figure 5. Sine with Dwell handwheel inputs.
Figure 3. Pulse Steer handwheel inputs.
Figure 6. Increasing amplitude sine handwheel inputs.
Figure 4. Sine Steer handwheel inputs.
Forkenbrock 5

direction of steer at maximum yaw rate. In theory, this timing should maximize maneuver severity by allowing each vehicle to seek out its own yaw natural frequency. The maneuver was comprised of three steering ramps: an initial steer, a steering reversal, and a return back to zero. The rate of each ramp was constant for a given maneuver at either 500 or 720 deg/sec (i.e., different ramp rates were not used during the same maneuver). Figure 7 provides an example of the YASR handwheel inputs.
Increasing Amplitude Yaw Acceleration Steering Reversal (IAYASR) Figure 8 provides an example of the IAYASR handwheel inputs. Like the previously described maneuver, the Increasing Amplitude Yaw Acceleration Steering Reversal (IAYASR) maneuver was designed to trigger changes in direction of steer at maximum yaw rate, and was comprised of three steering ramps: an initial steer, a steering reversal, and a return back to zero. The rate of each ramp was constant for a given maneuver at either 500 or 720 deg/sec. The key difference between this maneuver and the YASR maneuver was the magnitude of the initial steer, as it was 1.3 times less than the peak reversal magnitude. Conceptually, this maneuver was very similar to the Increasing Amplitude Sine Steer, but rather than relying on handwheel inputs being based on a finite set of frequencies, the vehicle was able to seek out its own yaw natural frequency. MANEUVER DISCUSSION In the previous section, the authors described the maneuvers used by NHTSA’s 2004 Light Vehicle Handling and ESC Effectiveness Program. This section discusses what elements NHTSA believes are important when considering ESC effectiveness and provides an overall maneuver assessment summary.
Throughout the remainder of this paper, the terms “excessive yaw” and “spinout” are frequently used when discussing yaw motion. In the context of this paper, the authors define excessive yaw as a situation where the final heading of the vehicle being evaluated is 90-degrees or more from the initial path (before the maneuver’s handwheel inputs are initiated). NHTSA’s proposed definition of spinout is provided later in this paper.
Elements of a “Good” ESC Detection Maneuver NHTSA researchers believe a maneuver capable of providing a good assessment of ESC effectiveness should possess the following attributes:
Figure 7. Yaw Acceleration Steering Reversal handwheel input description.
Figure 8. Increasing amplitude yaw acceleration steering reversal handwheel input description.
1. The ability to impose a high level of severity on the vehicle and its respective ESC
2. Is repeatable and reproducible 3. Considers lateral stability and responsiveness Element #1: Ability to impose a high level of severity The authors consider each of the twelve maneuvers used in this study to be “limit” maneuvers. In each case, steering and/or vehicle speed was increased in a manner that ultimately brought each vehicle up to the limit of lateral adhesion. When it was enabled, ESC intervention was detected during the conduct of all twelve maneuvers. Test Group 1 For use in this study, the maximum handwheel angle used during the SIS tests was 270-degrees. This
Forkenbrock 6

handwheel angle magnitude, when combined with a 50-mph target speed, allowed experimenters to measure maximum lateral acceleration and quasi-steady state lateral stability. In some cases, SIS tests have induced excessive yaw and even two-wheel lift [4]. As such, NHTSA considers the SIS maneuver to be a severe test, provided a maximum handwheel angle of 270-degrees is used. The NHTSA J-Turn and Fishhook maneuvers were designed to provide experimenters with ways of objectively quantifying on-road, untripped rollover propensity. Although the handwheel angles used by these maneuvers are within the capabilities of a human driver, the combination of sudden inputs and optimized steering reversals (in the case of the NHTSA Fishhook) make the NHTSA J-Turn and Fishhook maneuvers two of the most severe tests known to NHTSA. Test Group 2 The maneuver severity imposed by the Constant Radius Turn maneuver was approximately equal to that of the previously described Slowly Increasing Steer maneuver. Since the maneuver can be used to measure maximum lateral acceleration, NHTSA considers the Constant Radius Turn maneuver to be a severe test. However, unlike the SIS maneuver, the Constant Radius Turn maneuver requires the driver provide throttle and steering inputs. For this reason it is very important to have an experienced test driver perform this maneuver. Abrupt applications of throttle and/or steering may unsettle the vehicle as it approaches its limit of lateral adhesion, and may not provide an accurate portrayal of the vehicle’s actual limit state (e.g., whether the vehicle is terminal under- or oversteer). The modified ISO 3888-2 lane change maneuver severity often varied as a function of driver steering strategy. Even two tests performed by the same driver, with nearly identical maneuver entrance speeds, contained steering input variability (i.e., different timing, magnitudes, and rates), and this variability was capable of influencing the magnitude of the vehicle’s yaw responses. Driving style also influenced the extent to which ESC intervened. ESC intervention observed during the modified ISO lane changes differed from test to test and driver to driver, and intervention intervals varied from quick brake pulses to extended periods of substantial modulation at one or more of the wheels. In summary, while the maneuver did provide an opportunity for experimenters to observe some limit
behavior, the maneuver was unable to consistently produce responses as severe as those capable of being produced with the automated steering controller. Test Group 3 With only one exception, the Test Group 3 maneuvers performed in this study were able to induce excessive yaw, for each vehicle, when the respective ESC systems were disabled (when 0.7 Hz and 0.8 Hz Sine Steer tests were performed with the GMC Savana, even handwheel angle inputs of 300-degrees were unable to produce excessive yaw). This makes these maneuvers well suited for assessing oversteer mitigation, one of the most important attributes of ESC. Table 4 presents a list of Test Group 3 maneuvers, and the commanded handwheel angle used during the test for which excessive yaw was observed. Maneuvers requiring the least amount of steering are believed to be more severe than those requiring large handwheel angles. Pulse Steer. In terms of eliciting excessive yaw in the disabled ESC configuration, the Pulse Steer maneuver was the least effective maneuver for three of the five vehicles (the Volvo XC90, Toyota Camry, and Chevrolet Corvette). With this maneuver, use of 700 deg/sec handwheel ramp rates required 20 to 60 degrees more steering to produce excessive yaw than did those maneuvers performed at 500 deg/sec. Since Pulse Steer steering inputs are completed quickly, large magnitudes must be used to excite oversteer. When considering a maneuver to be able to identify whether a vehicle is equipped with an effective ESC, this is a disadvantage since there will likely be vehicles that successfully complete the maneuver (i.e., do not produce excessive yaw) even though they are not equipped with an ESC. Sine Steer. As suggested by the Alliance, the Sine Steer maneuver was performed using four frequencies. Although time-consuming, the Alliance’s recommendation to include four frequencies is understandable. Since all vehicles do not possess the same yaw natural frequency, it is unlikely that the use of a sinusoidal steer maneuver based one frequency will be equally effective across all light vehicles. The more frequencies considered, the greater the likelihood the correct one will be selected. In the context of the work described in this paper, the “correct” frequency is that which induces the greatest yaw response with the smallest amount of steering.
Forkenbrock 7

Table 4. Handwheel Input Magnitudes Capable of Producing Excessive Yaw (in degrees).
Maneuver
Pulse Steer Sine Steer Sine with Dwell Increasing Amplitude Sine Steer
YASR IAYASR Vehicle
500 deg/s
700 deg/s
0.5 Hz
0.6 Hz
0.7 Hz
0.8 Hz 0.5 Hz 0.7 Hz 0.5
Hz 0.6 Hz
0.7 Hz
500 deg/s
720 deg/s
500 deg/s
720 deg/s
2004 Volvo XC90 4x4 200 240 140 150 170 1801 130 130 160 160 160 140 140 160 160
2004 GMC Savana 3500 2402 280 240 300 N/A N/A 170 190 220 240 290 200 240 220 220
2003 Toyota Camry 240 260 170 210 230 270 160 160 210 200 200 180 200 1802 200
2003 Toyota 4Runner 4x4 2002 300 180 180 200 210 180 170 210 210 200 180 180 200 200
2002 Chevrolet Corvette 180 220 120 140 140 160 120 110 140 130 140 140 140 140 160
1Test series was terminated prematurely. The last test only allowed the vehicle’s final heading to be 80 degrees from the initial path. 2Test series was terminated prematurely. The last test only allowed the vehicle’s final heading to be 85 degrees from the initial path. For each vehicle evaluated in this study, use of 0.5 Hz steering most effectively excited an oversteer response. Depending on the vehicle, 0.5 Hz steering was able to produce excessive yaw with 10 to 100 degrees less handwheel angle input than for the other frequencies. Use of 0.5 Hz sinusoidal steering was particularly effective for producing excessive yaw with the Chevrolet Corvette (120 degrees), Volvo XC90 (140 degrees), and Toyota Camry (170 degrees). In the case of the GMC Savana, only use of 0.5 and 0.6 Hz steering was able to produce excessive yaw. Figure 9 presents these tests, performed with 240 and 300-degrees of steer, respectively. The 0.7 Hz and 0.8 Hz Sine Steer tests were unable to produce excessive yaw, even with handwheel angles as large as 300-degrees. Sine with Dwell. In a manner nearly identical to those used in the Sine Steer maneuver, the Sine with Dwell maneuver uses left-right sinusoidal handwheel inputs. The only difference between these maneuvers is a 500 ms pause that occurs immediately after the peak right-steer handwheel reversal magnitude had been achieved. In this respect, the handwheel inputs used for the Sine with Dwell maneuver are much like those used in the NHTSA Fishhook, although the pause duration is six times shorter and the handwheel magnitudes tend to be less extreme.
Generally speaking, the Sine with Dwell was the maneuver best able to excite an oversteer response from the vehicles examined. The only exception was for the Toyota Camry, however the difference in the steering angle required to produce excessive yaw during Sine with Dwell testing (180 degrees) was negligible when compared to that required by the 0.5 Hz Sine Steer maneuver (only 10 degrees less). Increasing Amplitude Sine Steer. The Increasing Amplitude Sine Steer is similar to the Sinusoidal Steer maneuver, with the exception being the second half cycle is comprised of an amplitude and duration 1.3 times greater than the first half cycle. With the exception of the GMC Savana, the steering angles capable of producing excessive yaw during the Increasing Amplitude Sine Steer maneuver were within the range of handwheel angles established with the Sine Steer maneuver. The Increasing Amplitude Sine Steer maneuver produced inconsistent results for the different vehicles. In the case of the GMC Savana, as the steering frequency was increased from 0.5 to 0.7 Hz, the handwheel angle necessary to produce excessive yaw increased from 220 degrees at 0.5 Hz to 300 degrees at 0.7 Hz. Conversely, the Toyota Camry required less steering magnitude as the frequency of the inputs was increased, although this phenomenon
Forkenbrock 8

Figure 9. Handwheel inputs and vehicle responses produced during Sine Steer tests performedwith a 2004 GMC Savana 3500.
was less extreme than that seen during GMC Savana testing. At 0.5 Hz, the Toyota Camry required 220 degrees of steer to produce excessive yaw, while 0.7 Hz required 190 degrees. Different still, the Toyota 4Runner, Volvo XC90, and Chevrolet Corvette appeared to be insensitive to increases in handwheel input frequency. The handwheel angles capable of producing excessive yaw with these vehicles were, respectively, within 10 degrees regardless of the commanded frequency. Yaw Acceleration Steering Reversal. The YASR maneuver was designed to trigger changes in direction of steer at maximum yaw rate. In theory, this timing should maximize maneuver severity by allowing each vehicle to seek out its own yaw natural frequency. The maneuver was comprised of three steering ramps: an initial steer, a steering reversal, and a return back to zero. The rate of each ramp was constant for a given maneuver at either 500 or 720 deg/sec (i.e., different ramp rates were not used during the same maneuver). Realizing that this maneuver is still in an early stage of development, results appear to be encouraging. For all five vehicles, the steering required to produce excessive yaw with 720 deg/sec handwheel rates was within the respective range observed during Sine Steer tests performed at 0.5 to 0.6 Hz. In the case of the GMC Savana, the YASR performed with 500
deg/sec handwheel ramps produced excessive yaw with up to 40-degrees less amplitude than those required by 0.5 to 0.6 Hz sinusoidal steering. No YASR required less steering than that required by the Sine with Dwell maneuver to produce excessive yaw. That said, tests performed with the Toyota Camry using 500 deg/sec steering ramps were able to achieve excessive yaw using steering magnitudes equivalent to those required by the 0.5 and 0.7 Hz Sine with Dwell tests performed with this vehicle. Increasing Amplitude Yaw Acceleration Steering Reversal. Conceptually, this maneuver is very similar to the Increasing Amplitude Sine Steer, but rather than relying on handwheel inputs being based on a finite set of frequencies, the vehicle was free to seek out its own yaw natural frequency. Like the YASR, the IAYASR maneuver was designed to trigger changes in direction of steer at maximum yaw rate, and is comprised of three steering ramps: an initial steer, a steering reversal, and a return back to zero. The rate of each ramp was constant for a given maneuver at either 500 or 720 deg/sec. The key difference between the IAYASR and the YASR was the magnitude of the initial steer, as it was 1.3 times less than the right steer peak magnitude. Many of the handwheel angles capable of producing excessive yaw during YASR tests were also able to do so during comparable IAYASR tests (Toyota
Forkenbrock 9

Camry at 500 and 720 deg/sec, and Chevrolet Corvette at 500 deg/sec). During the IAYASR maneuver, the only vehicle and steering rate combination to induce excessive yaw at a lower handwheel angle than those used in the YASR was the GMC Savana with at steering rate of 720 deg/sec. Using the increasing amplitude steering technique, excessive yaw was produced using 20 degrees less steering than was necessary with symmetric steering (220 vs. 240 degrees). Element #2: Is repeatable and reproducible Of the twelve maneuvers examined in this study, the authors believe only those executed with steering machine-based handwheel inputs are appropriate for an objective evaluation of ESC effectiveness. Throughout its Light Vehicle Rollover Research Program, NHTSA has gained extensive experience with the use of programmable steering machines. Use of these machines has made dynamic rollover testing a reality, since the steering inputs are accurate, repeatable, and reproducible. Recent NHTSA technical reports have established the ability for the steering machines used by NHTSA to successfully achieve the desired handwheel rates and magnitudes [1,2,3]. NHTSA is pleased with its automated steering capabilities, and believes the utility of this technology extends beyond the realm of dynamic rollover resistance testing. Maneuvers performed in Test Groups 1 and 3 were all performed with a steering machine. For this reason, the steering inputs were inherently repeatable and reproducible. Similarly, the output from these tests is also expected to be repeatable and reproducible, provided careful attention to tire wear is used. This has been demonstrated for the NHTSA Fishhook, J-Turn, and Slowly Increasing Steer maneuvers in [1,3,4], and although repeatability analyses were beyond the scope of this study, the authors believe the maneuvers performed in Test Group #3 will retain the repeatability and reproducibility established by previously performed rollover maneuvers. Each of the maneuvers performed in Test Group 2 relied on test drivers to provide steering and throttle inputs. When compared to results from Test Groups 1 and 3, this resulted in degraded input repeatability and reproducibility. The input variability seen during the lane changes performed in this study were consistent with results previously published by NHTSA in [1].
In summary, since the maneuvers performed in Test Groups 1 and 3 were performed with a steering machine, each maneuver possesses an acceptable level of repeatability and reproducibility. Conversely, the authors do not believe the Modified ISO 3888-2 double lane change or the Constant Radius Turn maneuvers provide sufficiently high repeatability and reproducibility since test drivers are responsible for the necessary steering and throttle inputs. Element #3: Considers lateral stability and responsiveness In this paper, lateral stability refers to a vehicle’s ability to resist excessive yaw. As will be discussed in this section, there are many maneuvers capable of assessing lateral stability, particularly those contained within Test Group 3. However, when considering ESC effectiveness, lateral stability is not the only important consideration. Achieving good lateral stability should not be achieved at the expense of responsiveness, or the ability of the vehicle to react to the inputs commanded by the driver. There are a number of ways to consider responsiveness. However, the metric(s) used for one maneuver may not be appropriate for another. In addition to discussing lateral stability, this section explores some issues pertaining to responsiveness. Test Group 1 Although the NHTSA Fishhook and J-Turn maneuvers both have the ability to provide information relevant to the handling (e.g., lateral stability, the path deviation, time-to-peak response, etc.), it is important to recognize these maneuvers are designed primarily for the evaluation of dynamic rollover propensity. The inputs used for both maneuvers contain periods of time where the handwheel angle is held constant for extended durations, a feature that gives experimenters the ability to examine how vehicles respond to high roll rates followed by extended periods of high lateral acceleration. Furthermore, in the case of the NHTSA Fishhook, the roll response of the vehicle directly commands the handwheel reversals input by the steering machine. If the scope of NHTSA’s ESC effectiveness research was limited to determining what effect ESC has on on-road untripped rollover, the authors believe use of the NHTSA Fishhook would be appropriate. However, since the greatest benefit of ESC is oversteer mitigation, and NHTSA’s present efforts
Forkenbrock 10

seek to develop a criteria to identify whether a vehicle is equipped with an ESC, the authors believe use of maneuvers capable of exciting yaw motion are more desirable than those used to excite roll motion. The authors believe there is a clear, conceptual difference in these two types of maneuvers. Therefore, when considering lateral stability and responsiveness, the authors believe maneuvers capable of effectively evaluating yaw motion should be emphasized. The SIS maneuver provides useful data about a vehicle’s linear range and limit performance. Since the primary objective of this study was to identify a maneuver (or set of maneuvers) capable of determining whether a vehicle is equipped with an ESC, linear range performance is not of interest—ESC does not intervene while the vehicle is being operated in this range. That said, ESC does typically intervene as the vehicle approaches its limit of lateral adhesion during the later part of the SIS maneuver. The most common intervention is the reduction of drive torque via reduction or removal of the driver’s throttle commands. This is generally a very effective way of settling the vehicle, albeit at the expense of the driver’s ability to maintain constant vehicle speed. Although it is a somewhat atypical phenomenon, NHTSA has evaluated vehicles that have exhibited terminal oversteer during SIS tests, even when ESC was enabled [2]. For this reason, there is evidence the maneuver is capable of providing valuable information about the lateral stability at the vehicle’s limit of adhesion. The maneuver can also provide valuable information pertaining to responsiveness. For example, items such as: (1) maximum lateral acceleration, (2) the degraded output responses of the vehicle to increasing handwheel magnitudes (e.g., of lateral acceleration, yaw rate, etc.), and (3) the degraded effect of throttle application as the maneuver progressed, are all easily monitored during execution of the SIS. That said, the authors do not believe the test provides as much insight into lateral stability and responsiveness as other maneuvers evaluated in this study, particularly those discussed in Test Group #3. Furthermore, since the vehicle is being operated in a quasi steady state for a majority of the maneuver’s duration, the authors believe that the maneuver is not particularly well suited to consider of responsiveness. In summary, although the maneuvers performed in Test Group 1 can be accurately and repeatably performed with a steering machine, the authors do
not believe the NHTSA Fishhook, J-Turn, or SIS maneuvers have the ability to provide inputs appropriate for the measurement of lateral stability and responsiveness necessary to determine whether a vehicle is equipped with an ESC. Test Group 2 To quantify lateral stability and responsiveness during tests performed with the modified ISO 3888-2 double lane change, each driver was required to complete a questionnaire. This questionnaire, most of which was developed by the Alliance, instructed the drivers to describe their subjective impressions of the test vehicles using a rating scale of 1 to 10. The drivers responded to a total of 13 questions, five of which specifically targeted ESC intervention and effectiveness. The modified ISO 3888-2 double lane change clearly facilitates measurement of lateral stability and responsiveness since the drivers are specifically asked to describe their impressions pertaining to these factors. However, while the responses to these questions are capable of providing useful information about handling and ESC intervention, they are all subjective impressions based on inputs with relatively high steering variability (especially when compared to those produced with a steering machine). Even when results from the questionnaire are normalized against those recorded for a control vehicle, the authors do not believe the responses are capable of measuring lateral stability and responsiveness in the context of establishing a minimum level of ESC effectiveness. Like the SIS maneuver, the Constant Radius Turn maneuver provides useful data about a vehicle’s limit performance, and can typically trigger an ESC intervention as a vehicle approaches its limit of lateral adhesion. The most common form of intervention is the reduction of drive torque via reduction or removal of the driver’s throttle commands. As previously mentioned, this is generally a very effective way of settling the vehicle, albeit at the expense of the driver’s ability to increase vehicle speed to increase maneuver severity (a concern usually reserved for the test track, not real world driving). The maneuver is not particularly well suited to consider responsiveness, as the vehicle is operated in a quasi steady state for a majority of its duration. That said, since the driver performs all handwheel inputs, measures of the steering required to maintain lane position and throttle modulation effectiveness are both interesting outputs. However, once ESC intervenes it is very likely that throttle
Forkenbrock 11

modulation will not have much effect adjusting vehicle speed unless the ESC deems the vehicle to be back under control; and if throttle modulation is not capable of increasing vehicle speed, varying the steering wheel angle will not be necessary. In summary, the authors do not believe the Constant Radius Turn maneuver or the modified ISO 3888-2 double lane change have the ability to provide inputs appropriate for the measurement of lateral stability and responsiveness necessary to determine whether a vehicle is equipped with an ESC. Test Group 3 With the exception of the 0.7 and 0.8 Hz Sine Steer tests performed with the GMC Savana, all Test Group 3 maneuvers were able to induce excessive oversteer when ESC was disabled. When ESC was enabled, only one instance of excessive yaw was observed: during a 0.8 Hz Sine Steer test performed with the Toyota Camry. Although some Test Group 3 maneuvers may be able to produce excessive yaw with lesser steering magnitudes than others, the authors believe each maneuver in this group is capable of providing valuable information about lateral stability, with the Sine with Dwell, Increasing Amplitude Sine, and the two Yaw Acceleration Steering Reversals being particularly well suited for the evaluation of ESC oversteer mitigation effectiveness. There are many, many ways for the data output by the Test Group 3 maneuvers to be used to quantify responsiveness. Fortunately, the scope of NHTSA’s current work is narrow: isolate a maneuver and metric(s) capable of assessing ESC effectiveness. After meeting with automakers, ESC manufacturers, and testing organizations, NHTSA ultimately decided the best way to quantify responsiveness, using Test Group 3 maneuvers, was to consider lateral displacement. In order for displacement to effectively assess responsiveness, the maneuver must provide an opportunity for the vehicle to traverse laterally without relying on excessive yaw to do so. Maneuvers such as the Sine Steer, Sine with Dwell, Increasing Amplitude Sine, and the two Yaw Acceleration Steering Reversals all basically emulate single lane changes. As such, these maneuvers each provide an opportunity to study how increasing handwheel angles and ESC intervention affect lateral displacement. The Pulse Steer, on the other hand, was not based on a reverse steer input. The steering wheel angle was increased from zero to a target
magnitude, then back to zero. For this reason, the ability of the Pulse Steer to displace the vehicle laterally prior to generating excessive yaw is compromised, and the concept of determining a minimum lateral displacement from the initial path makes little sense. Lateral deviation only occurs in one direction, and there is no chance for the vehicle to recover from the initial steering input. In summary, the authors believe the Sine with Dwell, Increasing Amplitude Sine, and the two Yaw Acceleration Steering Reversals each provide inputs capable of measuring lateral stability and responsiveness in a way that can adequately determine whether a vehicle is equipped with an effective ESC. While the Sine Steer maneuver shares some of the attributes possessed by the other reverse-steer maneuvers, each iteration (i.e., frequency) of the maneuver includes limited frequency content and symmetric steering. This requires multiple frequencies be used in a suite of Sine Steer maneuvers. If only one Sine Steer frequency is used, the results of this study indicate a vehicle’s “worst-case” performance may not be realized. Maneuver Assessment Summary This study evaluated twelve maneuvers capable of providing insight into ESC effectiveness. The primary objective of this study was to decide which, if any, of these maneuvers could be used by NHTSA to determine whether a vehicle is equipped with an ESC capable of satisfying a series of minimum effectiveness criteria. As explained in the previous sections, three evaluation criteria were used to assess how well each maneuver was able to satisfy this objective. Table 5 provides a summary of the findings. To simplify the summary, each maneuver has been assigned an adjectival rating ranging from Excellent to Fair. While the authors have tried to objectively catalog the merits and problems of each maneuver, these ratings are subjective. Adjectival ratings were assigned as follows: Excellent. In the evaluated aspect, the maneuver is the best (or tied for best) of all of the ESC effectiveness maneuvers studied. In the evaluated aspect, a maneuver assigned an excellent rating was capable of adequately demonstrating a vehicle was, or was not, equipped with an ESC capable of satisfying NHTSA’s minimum effectiveness criteria. Good. In the evaluated aspect, the maneuver is substantially better than fair but not the best of ESC effectiveness maneuvers studied. In the evaluated aspect, a maneuver assigned a good rating was still
Forkenbrock 12
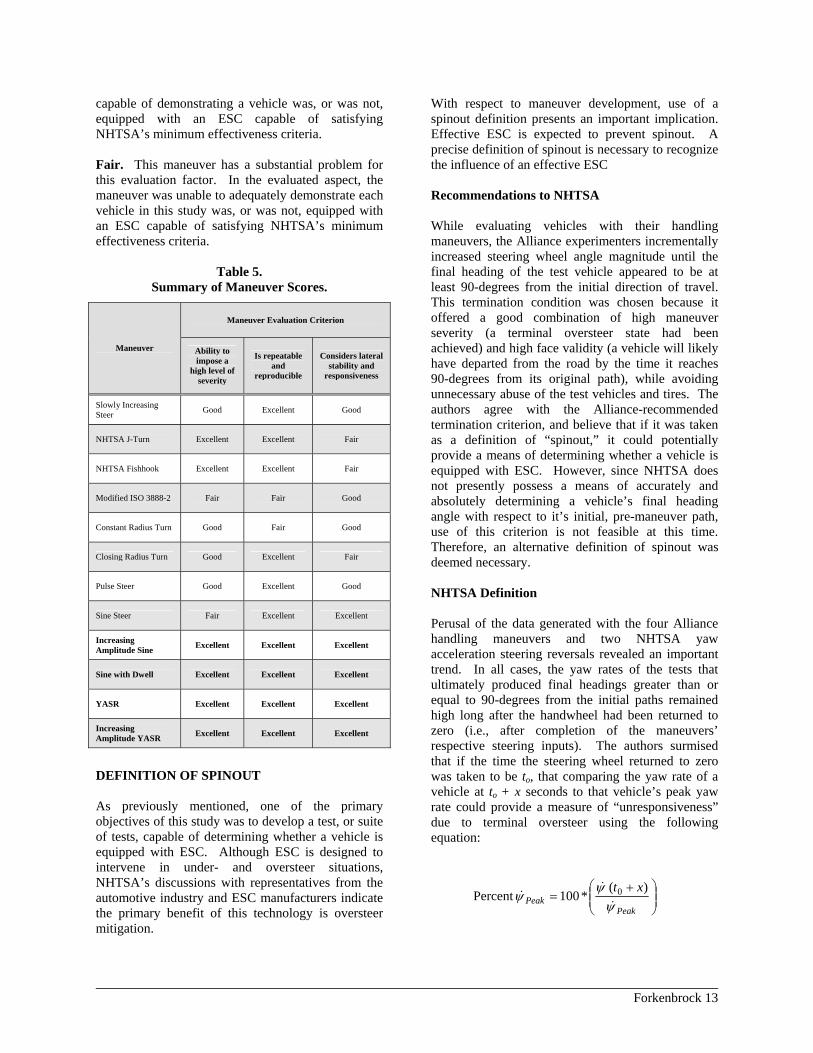
capable of demonstrating a vehicle was, or was not, equipped with an ESC capable of satisfying NHTSA’s minimum effectiveness criteria. Fair. This maneuver has a substantial problem for this evaluation factor. In the evaluated aspect, the maneuver was unable to adequately demonstrate each vehicle in this study was, or was not, equipped with an ESC capable of satisfying NHTSA’s minimum effectiveness criteria.
Table 5. Summary of Maneuver Scores.
Maneuver Evaluation Criterion
Maneuver Ability to impose a
high level of severity
Is repeatable and
reproducible
Considers lateral stability and
responsiveness
Slowly Increasing Steer Good Excellent Good
NHTSA J-Turn Excellent Excellent Fair
NHTSA Fishhook Excellent Excellent Fair
Modified ISO 3888-2 Fair Fair Good
Constant Radius Turn Good Fair Good
Closing Radius Turn Good Excellent Fair
Pulse Steer Good Excellent Good
Sine Steer Fair Excellent Excellent
Increasing Amplitude Sine Excellent Excellent Excellent
Sine with Dwell Excellent Excellent Excellent
YASR Excellent Excellent Excellent
Increasing Amplitude YASR Excellent Excellent Excellent
DEFINITION OF SPINOUT As previously mentioned, one of the primary objectives of this study was to develop a test, or suite of tests, capable of determining whether a vehicle is equipped with ESC. Although ESC is designed to intervene in under- and oversteer situations, NHTSA’s discussions with representatives from the automotive industry and ESC manufacturers indicate the primary benefit of this technology is oversteer mitigation.
With respect to maneuver development, use of a spinout definition presents an important implication. Effective ESC is expected to prevent spinout. A precise definition of spinout is necessary to recognize the influence of an effective ESC Recommendations to NHTSA While evaluating vehicles with their handling maneuvers, the Alliance experimenters incrementally increased steering wheel angle magnitude until the final heading of the test vehicle appeared to be at least 90-degrees from the initial direction of travel. This termination condition was chosen because it offered a good combination of high maneuver severity (a terminal oversteer state had been achieved) and high face validity (a vehicle will likely have departed from the road by the time it reaches 90-degrees from its original path), while avoiding unnecessary abuse of the test vehicles and tires. The authors agree with the Alliance-recommended termination criterion, and believe that if it was taken as a definition of “spinout,” it could potentially provide a means of determining whether a vehicle is equipped with ESC. However, since NHTSA does not presently possess a means of accurately and absolutely determining a vehicle’s final heading angle with respect to it’s initial, pre-maneuver path, use of this criterion is not feasible at this time. Therefore, an alternative definition of spinout was deemed necessary. NHTSA Definition Perusal of the data generated with the four Alliance handling maneuvers and two NHTSA yaw acceleration steering reversals revealed an important trend. In all cases, the yaw rates of the tests that ultimately produced final headings greater than or equal to 90-degrees from the initial paths remained high long after the handwheel had been returned to zero (i.e., after completion of the maneuvers’ respective steering inputs). The authors surmised that if the time the steering wheel returned to zero was taken to be to, that comparing the yaw rate of a vehicle at to + x seconds to that vehicle’s peak yaw rate could provide a measure of “unresponsiveness” due to terminal oversteer using the following equation:
⎟⎟⎠
⎞⎜⎜⎝
⎛ +=
PeakPeak
xtψ
ψψ
&
&&
)( *100Percent 0
Forkenbrock 13

where,
If this method could be defined in a way that was equally relevant and applicable to all light vehicles, it could be used to identify spinout with high accuracy and certainty. Furthermore, determining whether the spinout criteria had been satisfied could occur immediately after a particular test was performed on the test track, and would require only simple post-test calculation. However, this definition required two key pieces of information: (1) time x, and (2) the value of percent yaw peak that constitutes a spin out. This technique offers two benefits: (1) it quantifies the severity of a vehicle’s tendency to maintain high levels of rotation over time, and (2) it represents a way by which each vehicle could be directly compared against its peers. Timing Most Relevant to Predicting Spinout Relating a vehicle’s yaw rate at to + x seconds to its peak yaw rate is a way of objectively identifying loss of control due to oversteer. This is accomplished by identifying the point after which it is not likely the vehicle will be able to respond to the driver’s handwheel input. The handwheel angle has been returned back to zero, but the vehicle continues to rotate about its vertical axis. Specifying a time is important because it makes the distinction between phase lag and loss of control. While the correlation between a mild loss of control and vehicle safety is not presently known, loss of control due to skidding has been a contributing factor to thousands of single vehicle crashes and fatalities each year. Five time intervals were used to determine the time for which yaw rate data, when compared against its previously established peak value, was most useful in determining whether the vehicle’s final heading was greater than or equal to 90-degrees from the initial path. These times were 1.0, 1.5, 2.0, 2.5, and 3.0 seconds, each measured from completion of the maneuvers’ respective steering inputs. A logistic regression model, known as the SAS Genmod procedure, was used to determine how well the percentage of peak yaw, measured at different time intervals would predict the trial outcome, represented by a binary response variable (spin, no
spin). Separate analyses at five different time intervals using two different models were computed. The first model included only the percentage of peak yaw. The second model added vehicle type. Generally, the fit to the data was worse when the vehicle type was included in the model. Therefore, it was concluded that including vehicle type in the model was not necessary, and a more general simple model was used. When reviewing the data output by SAS, it was important to consider two factors: (1) if the probability of the chi-square analysis (the Chi-Square p-value) is less than 0.05, there is better than a 50-50 chance that percent of peak yaw rate can predict the final heading of the vehicle will be ≥90 degrees from its initial path; and (2) the confidence intervals containing the estimated probability of the final heading being ≥90 degrees from the initial path can contain values both less than and greater than 0.5 (50 percent probability). For each time increment, consideration of these two factors helps to demonstrate the different regions of model output uncertainty. The results for the different time intervals were compared, and it was determined that the percentage of peak yaw measured 1.0 second after the beginning of the trial provided the best predictions of outcome. Specifically, it had only one of eleven selected points of percentage of peak yaw for which the outcome was highly uncertain (i.e., the confidence intervals containing the estimated probability of the final heading being ≥90 degrees from the initial path included values both less than and greater than 50 percent). All longer time intervals had more points associated with high uncertainty. Percentage of Peak Yaw Rate Most Relevant to Predicting Spinout Figure 10 presents a series of curves that model how well the percent of peak yaw rate was able to predict the probability of the vehicle’s final heading being ≥90 degrees from the initial path for each of the time intervals considered.
Ideally, the shape of each curve would be comprised of a simple step function. As the percent of peak yaw angle increased, the probability of final heading being ≥90 degrees from the initial path would remain at zero until a critical percent of peak yaw angle had been achieved. At this point, the curve would step to “1”, indicating the probability of final heading being ≥90 degrees from the initial path would change from zero to 100 percent in a binary manner. After the
= first local yaw rate peak produced after the second steering reversal
Peakψ&
)( xto +ψ& = yaw rate at x seconds after completion of a maneuver’s dynamic steering inputs
Forkenbrock 14

critical percent of peak yaw angle had been achieved, the probability of final heading being ≥90 degrees from the initial path would remain at one for all higher percent of peak yaw angle values.
Clearly the curves presented in Figure 10 are not ideal, but the fact that their respective slopes tend to be less steep as the amount of time after completion of the maneuver’s steering inputs had occurred is important. This is particularly true for the data where the percentage of peak yaw values were greater than 50 percent. In the case of the output at time x = 1.0 second, one region of uncertainty was found: when the percent of peak yaw angle was 60 percent (i.e., the confidence intervals containing the estimated probability of the final heading being ≥90 degrees from the initial path included values both less than and greater than 50 percent). With percentages of peak yaw <60 percent, for this time interval, the confidence intervals only contained estimated probabilities less than 50 percent. Conversely, with percentages of peak yaw >60 percent at time x = 1.0 second, the confidence intervals only contained estimated probabilities greater than 50 percent. In summary, despite a small sample size and lack of repeated tests, a logistic regression modeled with SAS was able to estimate the probability that percent of peak yaw rate can predict whether a vehicle’s final heading will be ≥90 degrees from its initial path. Comparison of data collected 1.0, 1.5, 2.0, 2.5, and 3.0 seconds after completion of the maneuver’s respective steering inputs indicate the model is the least uncertain when time x = 1.0 second are used.
Using time x = 1.0 second data, the model produced one region of uncertainty (60-percent of peak yaw rate), whereas the other four times produced three regions of uncertainty. FUTURE WORK The objective of this study was to isolate a small number of maneuvers capable of demonstrating whether a vehicle is equipped with an effective ESC. In the next research phase, NHTSA will use a reduced set of maneuvers and a much greater sample of vehicles. Specifically, the data generated in NHTSA’s 2005 research efforts will be used to validate, and refine, NHTSA’s spinout model. Although ESC is intended to combat excessive under- and oversteer, NHTSA’s 2005 research efforts will emphasize only the evaluation of oversteer mitigation effectiveness. The reasons for this are twofold: (1) oversteer mitigation is believed to reduce more crashes than understeer mitigation, and (2) make best use of available Agency resources. NHTSA believes that quantifying under- and oversteer mitigation effectiveness will require multiple maneuvers, and at this time NHTSA does not believe it has identified a maneuver capable of effectively quantifying understeer mitigation. To embark on a test program that endeavors to evaluate a large number of test vehicles while simultaneously developing maneuvers capable of quantifying understeer mitigation was not deemed feasible. Maneuver Reduction Of all the test maneuvers used in this study, only four received “excellent” ratings for each of the three maneuver evaluation criteria: the Increasing Amplitude Sine (0.7 Hz), Sine with Dwell (0.7 Hz), and both 500 deg/sec YASRs. Of these maneuvers, the Sine with Dwell maneuver was particularly effective in exciting excessive yaw with low steering angles. It is believed this occurred because the maneuver increased the opportunity of the yaw responses to “catch-up” to the respective steering inputs before the handwheel angle was returned to zero. Interestingly, although the YASR maneuver is quite capable of producing spinouts, the more favorable overall results seen during Sine with Dwell testing indicate the maneuver is not optimal. In certain Sine with Dwell tests, peak yaw rate occurred before the steering reversal occurs (after the 500 ms pause), yet the handwheel angle data presented previously in Table 4 showed the maneuver was the most effective in producing spinouts. This
Figure 10. Percent of peak yaw vs. probabilityof final heading being ≥90 degrees from theinitial path.
Forkenbrock 15

indicates that simply reversing direction of steer at maximum yaw rate does not necessarily maximize the yaw response of the vehicle. Due to the lower yaw responses when the direction of steer was reversed at maximum yaw rate, and the fact that the YASR (500 deg/sec) was as, if not more, effective than the IAYASR (500 deg/sec), NHTSA will be discarding the later maneuver in favor of a new iteration. The magnitudes of the initial and countersteer handwheel angles associated with this new maneuver are equal, however there is an additional pause before the second steering reversal occurs, as shown in Figure 11.
This combination may provide NHTSA with a maneuver possessing the good adaptability provided by test-dependent, yaw acceleration based steering reversals, but with greater ability to induce excessive yaw due to a 250-ms pause (i.e., conceptually identical to that provided by the Sine with Dwell maneuver). All Yaw Acceleration Steering Reversals with Pause maneuvers will be performed using 500 deg/sec handwheel ramp rates.
Table 6 presents the final, reduced text matrix NHTSA intends to use to evaluate ESC effectiveness in 2005. Note that in the Handwheel Angle Increments column, “δmax” is defined as: (1) the handwheel angle capable of producing a spinout, or (2) the greater of either the handwheel angle capable of achieving a lateral acceleration of 0.3g multiplied by a scalar of 6.5, or 270-degrees. ACKNOWLEDGEMENTS The authors wish to recognize the outstanding support of our research colleagues. W. Riley Garrott, Pat Boyd, Larry Jolliff, Greg Stevens, Jim Preston,
Michael Brown, and Dave Dashner have each made significant contributions to this study. Additionally, the Alliance of Automobile Manufacturers provided considerable insight into test maneuver development.
Table 6.
NHTSA’s 2005 ESC Effectiveness Test Matrix.
Maneuver Steering
Frequency (Hz)
Steering Ramp Rates (degrees/sec)
Handwheel Angle
Increments (degrees)
Maneuver Entrance
Speed (mph)
Increasing Amplitude Sine
0.7 N/A
Sine with Dwell 0.7 N/A
YASR N/A 500 deg/sec
YASR with 250 ms pause N/A 500 deg/sec
45 to δmax 50
Slowly Increasing Steer
N/A 13.5 deg/sec
Linearly increases from 0 to
δ0.55g
50 (constant
speed)
REFERENCES [1] Forkenbrock, G.J., Garrott, W.R, Heitz, M., O’Harra, B.C., “A Comprehensive Experimental Examination of Test Maneuvers That May Induce On-Road, Untripped Light Vehicle Rollover – Phase IV of NHTSA’s Light Vehicle Rollover Research Program,” NHTSA Technical Report, DOT HS 809 513, October 2002. [2] Forkenbrock, G.J., Garrott, W.R, Heitz, M., O’Harra, B.C., “An Experimental Examination of 26 Light Vehicles Using Test Maneuvers That May Induce On-Road, Untripped Light Vehicle Rollover – Phases VI and VII of NHTSA’s Light Vehicle Rollover Research Program,” NHTSA Technical Report, DOT HS 809 547, October 2003. [3] Forkenbrock, G.J., O’Harra, B.C., Elsasser, D., “A Demonstration of the Dynamic Tests Developed for NHTSA’s Light Vehicle Rollover Research Program – Phase VIII of NHTSA’s Light Vehicle Rollover Research Program,” NHTSA Technical Report, DOT HS 809 705, August 2004. [4] Forkenbrock, G.J., Garrott, W.R, “Testing the Rollover Resistance of Two 15-Passenger Vans with Multiple Load Configurations,” NHTSA Technical Report, DOT HS 809 704, June 2004.
Figure 11. Yaw Acceleration Steering Reversal with Pause handwheel input description.
Forkenbrock 16