05 2016 chapter 5 ipp
DESCRIPTION
http://www.panhandlewater.org/2016-IPP/05-2016_Chapter_5_IPP.pdfTRANSCRIPT

Initially Prepared Plan Panhandle Water Planning Area Draft
C hapter 5 Water Management Strategies
There are 34 water users and five wholesale water providers that are identified with a projected need over the planning period. As previously discussed the largest quantities of water needs are associated with irrigated agriculture, but this plan also identified over 104,000 acre-feet of needs for municipal and manufacturing water use. This chapter identifies the potential water management strategies that could be implemented to meet these needs.
Chapter 5 is divided into four main parts. Chapter 5A discusses the types of potentially feasible water management strategies, the process used to develop the strategies, and the factors considered in evaluating the strategies. Chapter 5B discusses the water conservation strategies that were considered and recommended for the PWPA. This includes the identification and evaluation for municipal and irrigation conservation measures. Chapter 5C presents the recommended water management strategies for the six wholesale providers in the PWPA. Chapter 5D addresses the recommended strategies for each water user group with identified needs and summarizes the water management plans by county.
The water management strategies identified in the following subchapters are for water users with projected needs. For aggregated water users, such as “County-Other”, the identification of needs can be challenging due to the nature of the data evaluation. If water quantity or quality needs for smaller entities (municipalities with populations less than 500) became known to the PWPG, strategies for these needs are also included in this plan. However, the PWPG considers the development of water strategies for smaller entities that may not show a need consistent with the Panhandle Water Plan.
The report assumes that management strategies to meet any identified needs are employed or implemented by the respective water user. The PWPG does not take responsibility in planning or implementing the strategies.
5-1

Subchapter 5A April 13, 2015 Identification of Potentially Feasible Water Management Strategies Draft
Subchapter 5A Identification of Potentially Feasible Water Management Strategies
This section provides a review of the types of water management strategies (WMS) considered for the PWPA and the approach for identifying the potentially feasible water management strategies for water users with needs. Once a list of potential feasible strategies have been identified, the most feasible strategies are recommended for implementation. Alternative strategies can also be identified, in case the recommended strategies become unfeasible. These strategies are discussed in more detail in later subchapters. This subchapter identifies the potentially feasible strategies for water users and wholesale water providers that were found to have a projected need in Chapter 4.
5A.1 Water Management Strategy Types
Identification of a supply source as a potentially feasible strategy depends on the availability of the source, the accessibility of the source to the entity developing the strategy, and the feasibility of developing a strategy from the source of supply. It should be noted that there can be potentially feasible strategies that are not identified, or recommended or alternative for an entity. A list of the potentially feasible strategy types considered for each water user with a need is included in Attachment 5-1.
The purpose of this chapter is to provide a big picture discussion on the various strategy types that were identified to potentially reduce the WUG/WWP needs. A comprehensive list of the potential strategy types identified is included below.
• Water conservation and drought management
• Wastewater reuse
• Expanded use of existing supplies
o System operation,
o Conjunctive use of groundwater and surface water,
o Reallocation of reservoir storage
o Voluntary redistribution of water resources
o Voluntary subordination of water rights
o Yield enhancement
o Water quality improvements
• New supply development
o Surface water resources
o Groundwater resources
• Brush control
5-2

Subchapter 5A April 13, 2015 Identification of Potentially Feasible Water Management Strategies Draft
• Precipitation enhancement
• Desalination
• Water right cancellation
• Aquifer storage and recovery
• Interbasin transfers
While each of these strategy types were considered by the PWPA, not all were determined as viable options for addressing needs in the region. Strategies were determined as unfeasible when the associated costs involved with implementation of the strategy outweighed the overall benefits. Such costs can include, but are not limited to, economic feasibility and negative impacts on other water users. The strategy types (and associated subcategories) that were determined as potentially feasible strategies for entities within the PWPA are: 1) water conservation and drought management 2) wastewater reuse 3) expanded use of existing supplies (groundwater supplies, surface water supplies, local supplies, conjunctive use and voluntary redistribution), 4) new groundwater supply development, 5) brush control, and 6) precipitation enhancement.
The sections below include a brief discussion of each of these strategy types and the specific application to the users in the PWPA.
5A.1.1 Water Conservation and Drought Management
Water conservation is defined as methods and practices that reduce the consumption of water, reduce the loss or waste of water, improve the efficiency in the use of water, or increase the recycling and reuse of water so that a water supply is made available for future or alternative uses. Water conservation is typically viewed as long-term changes in water use that are incorporated into daily activities. On the contrary, drought management is the temporary reduction in water use in direct response to a drought or water supply emergency. It is typically short-term and does not result in lasting changes. If drought management measures are used as water management strategies, there is little or no flexibility remaining should the drought exceed the previous drought-of-record conditions.
Water conservation is a valued water management strategy in the PWPA because it helps prolong the limited water resources in the region. It is recommended for municipal (only County-Other users with needs were evaluated, all other municipal water user groups were evaluated) and irrigation water users, whether the user has a defined need or not, and it is encouraged for all other users. Drought management is not a recommended strategy in the PWPA because it does not provide a long-term solution to water needs. This strategy is still an important option to water users for times when existing water supplies are threatened during drought and entities should develop drought contingency plans in accordance with Texas Administrative Code, Chapter 288 rules.
5-3

Subchapter 5A April 13, 2015 Identification of Potentially Feasible Water Management Strategies Draft
5A.1.2 Wastewater Reuse
Wastewater reuse utilizes treated wastewater effluent as either a replacement for a potable water supply (direct reuse) or utilizes treated wastewater that has been returned to a water supply resource (indirect reuse). Wastewater reuse is currently heavily utilized by industries that purchases wastewater effluent from larger municipalities. It is also used for limited agricultural irrigation. The largest producers of wastewater effluent are the larger cities, including Amarillo, Borger, Canyon, Dumas and Pampa. Currently, Amarillo sells most of its treated wastewater to Xcel Energy for cooling water. Borger also sells its wastewater to industrial customers. There may be potential to expand wastewater reuse in the PWPA, but the amounts are limited due to the current level of use.
5A.1.3 Expanded Use of Existing Supplies
Expanded use of existing supplies includes seven subcategories ranging from selling developed water that is not currently used to enhancing existing supplies through operations, storage, treatment or other means. In the PWPA, three of the seven subcategories were determined potentially feasible. These include conjunctive use of groundwater and surface water, voluntary transfer (sales or contracts for developed water), and water quality improvements.
Conjunctive Use of Groundwater and Surface Water
Conjunctive use is the operation of multiple sources of water to optimize the water resources for additional supply. In the PWPA, there are two wholesale water providers that own and operate both surface water and groundwater sources: CRMWA and Greenbelt MIWA. Both of these entities intend to conjunctively use the surface water when available to meet demands and use additional groundwater to supplement surface water supplies during drought. This will help reduce evaporative losses associated with the surface water reservoirs, while still meeting demands with groundwater when less or no surface water is available.
Voluntary Redistribution
Voluntary redistribution is transfer of existing water supplies from one user to another through sales, leases, contracts, options, subordination or other similar types of agreements. Typically, the entity providing the water has determined that it does not need the water for the duration of the transfer. The transfer of water could be for a set period of years or a permanent transfer. Redistribution of water makes use of existing resources and provides a more immediate source of water. In the PWPA, there is little to no developed water that is available for redistribution without the development of additional strategies. This strategy is used to represent sales and contracts between a water provider and its customers. It can include current contractual obligations and potential future customers.
5-4

Subchapter 5A April 13, 2015 Identification of Potentially Feasible Water Management Strategies Draft
Water Quality Improvements
Water quality improvements allow for the use of impaired water for municipal or other uses. In PWPA, there are areas with impaired water quality, specifically elevated nitrates and salts. Water quality improvement for these sources are typically accomplished through desalination. Nitrates can also be treated using ion exchange. This strategy type would apply to treatment of other water quality parameters. This strategy is considered for users with sufficient water quantity, but impaired water quality.
5A.1.4 New Groundwater Development
As previously discussed, groundwater accounted for approximately 98 percent of the total water use in the PWPA in 2010. Over much of the region, there is available groundwater for future development. Towards the southeast portion of region, groundwater resources become more limited and there are water quality concerns. Even with these limitations, groundwater is a viable and cost-effective supply source for the PWPA. Most of municipal water users with a need during the planning period are expected to expand their current groundwater use or develop new groundwater supplies. Table 5A-1 shows the amount of groundwater that is available for new groundwater development by aquifer. There are areas within the PWPA that have limited groundwater sources or are heavily using these sources. Counties that are near capacity in utilizing the fresh groundwater resources are Childress, Collingsworth, Hall, and Potter counties. Also, there is little groundwater available for future development in heavily irrigated areas in Dallam, Hartley, Moore, and Sherman counties. Potential users of new or expanded groundwater is presented by aquifer and county in Table 5A-2.
Table 5A-1: Available Groundwater Supplies for Strategies
Aquifer Unallocated Supplies1 (acre-feet)
Ogallala Aquifer 987,669 Ogallala-Rita Blanca Aquifer 83,300 Blaine Aquifer 294,573 Dockum Aquifer 13,498 Other Aquifer 476 Seymour Aquifer 7,116 1 This is the amount of groundwater that is available for strategies.
5-5

Subchapter 5A April 13, 2015 Identification of Potentially Feasible Water Management Strategies Draft
Table 5A-2: Potential Users of New Groundwater
Source County Ogallala/Rita Blanca Dockum Seymour
Armstrong Claude
Carson Panhandle, Amarillo
Childress
Collingsworth Wellington
Dallam Dalhart, Texline
Donley Memphis, GMIWA
Gray McLean, Pampa
Hall
Hansford Gruver, Spearman
Hartley
Hemphill Canadian
Hutchinson Borger, Stinnett, TCW Supply
Lipscomb Booker
Moore Cactus, Dumas
Sunray, County-Other
Ochiltree Perryton
Oldham
Potter Amarillo, County-Other County-Other
Randall Canyon, Lake Tanglewood, County-Other
Canyon, County-Other
Roberts CRMWA, Amarillo
Sherman
Wheeler Wheeler
5A.1.5 Brush Control
In 1985, the Texas Legislature authorized the Texas State Soil and Water Conservation Board (TSSWCB) to conduct a program for the “selective control, removal, or reduction of brush species that consume water to a degree that is detrimental to water conservation.” In 1999 the TSSWCB began the Brush Control Program. In 2011, the 82nd legislature replaced the Brush Control Program with the Water Supply Enhancement Program (WSEP). The WSEP’s purpose is to increase available surface and groundwater supplies through the selective control of brush species that are detrimental to water conservation.
WSEP considers priority watersheds across the state, the need for conservation within the territory of a proposed projection based on the State Water Plan and if the Regional Water Planning Group has identified brush control as a strategy in the State Water Plan as part of their competitive grant, cost sharing program. There are three primary species of brush in the PWPA that are eligible for funding from the WSEP as shown in Table 5A-3.
5-6

Subchapter 5A April 13, 2015 Identification of Potentially Feasible Water Management Strategies Draft
Table 5A-3: Plant Water Use Rates
Plant Water Use Per Tree (gallons/tree/day)
Water Savings (ac-ft/ac/yr)
Juniper 46.8 0.14 – 0.33 Mesquite 44 0.05 Salt cedar 0.1 – 15 2 – 5 Source: Texas State Soil and Water Conservation Board Brush Control Program, 2010
Annual Report
The Lake Meredith watershed is a priority watershed for brush control. In 2000, the State sponsored a feasibility study of brush removal in the Canadian River downstream from Ute Reservoir to Lake Meredith, which indicated potential significant reductions in water loss from brush. Since then, CRMWA has helped sponsor brush removal in the Lake Meredith watershed. However, brush management must be an on-going strategy to continue to realize water savings. This strategy is a potentially feasible strategy for CRMWA and users of Lake Meredith.
5A.1.6 Precipitation Enhancement
Precipitation enhancement introduces seeding agents to stimulate clouds to generate more rainfall. This process is also commonly known as cloud seeding or weather modification. There is one active precipitation enhancement program in the PWPA. This program covers most of the counties in the Panhandle GCD. The benefits from increased rainfall through precipitation enhancement projects include increased agricultural production, decreased irrigation use, increased reservoir levels, increased and higher quality forage for livestock and wildlife, and fire and hail suppression. Due to its primary use for agricultural benefits in the PWPA, this strategy is considered as part of the irrigation conservation strategies and discussed in Chapter 5B.
5A.2 Evaluation Procedures
The consideration and selection of water management strategies for water user groups with needs followed TWDB guidelines and were conducted in open meetings within the PWPA. The PWPA consistently endorsed the highest level of conservation achievable for all water uses in the region. In addition, environmental impacts and the protection of the region’s resources were a priority in the selection process. In the development of the water management strategies, existing water rights, water contracts, and option agreements are recognized and fully protected.
In accordance with state guidance, the potentially feasible strategies were evaluated with respect to:
• Quantity, reliability and cost;
• Environmental factors, including effects on environmental water needs, wildlife habitat and cultural resources;
5-7

Subchapter 5A April 13, 2015 Identification of Potentially Feasible Water Management Strategies Draft
• Impacts on water resources, such as playas and other water management strategies;
• Impacts on agriculture and natural resources; and
• Other relevant factors.
The other considerations listed in TAC 357.7(a), such as inter-basin transfers and third party impacts due to re-distribution of water rights, were not specifically reviewed because they were not applicable to strategies identified for the Panhandle Water Planning Area (PWPA) needs.
The definition of quantity is the amount of water the strategy would provide to the respective user group in acre-feet per year. This amount is considered with respect to the user’s short-term and long-term needs. Reliability is an assessment of the availability of the specified water quantity to the user over time. If the quantity of water is available to the user all the time, then the strategy has a high reliability. If the quantity of water is contingent on other factors, reliability will be lower. The assessment of cost for each strategy is expressed in dollars per acre-foot per year for water delivered and treated for the end user requirements. Calculations of these costs follow the Texas Water Development Board’s guidelines for cost considerations and identify capital and annual costs by decade. Project capital costs are based on September 2013 price levels and include construction costs, engineering, land acquisition, mitigation, right-of-way, contingencies and other project costs associated with the respective strategy. Annual costs include power costs associated with transmission, water treatment costs, water purchase (if applicable), operation and maintenance, and other project-specific costs. Debt service for capital improvements was calculated over 20 years at a 5.5 percent interest rate. In the case of municipal and county-other water needs, the cost estimates are only for development of the supply and delivery to the user’s distribution system. There may be additional costs to actually deliver the water to the end users of the water that are not represented in these estimates.
Potential impacts to sensitive environmental factors were considered for each strategy. Sensitive environmental factors may include wetlands, threatened and endangered species, unique wildlife habitats, and cultural resources. In most cases, a detailed evaluation could not be completed because a specific location for groundwater rights was not available. Therefore, a more detailed environmental assessment will be required before a strategy is implemented.
The impact on water resources considers the effects of the strategy on water quantity, quality, and use of the water resource. A water management strategy may have a positive or negative effect on a water resource. This review also evaluated whether the strategy would impact the water quantity and quality of other water management strategies identified.
A water management strategy could potentially impact agricultural production or local natural resources. Impacts to agriculture may include reduction in agricultural acreage, reduced water supply for irrigation, or impacts to water quality as it affects crop production. Various strategies may actually improve water quality, while others may have a negative impact. The impacts to natural resources may consider
5-8

Subchapter 5A April 13, 2015 Identification of Potentially Feasible Water Management Strategies Draft
inundation of parklands, impacts to exploitable natural resources (such as mining), recreational use of a natural resource, and other strategy-specific factors.
Other relevant factors include regulatory requirements, political and local issues, amount of time required to implement the strategy, recreational impacts of the strategy, and other socio-economic benefits or impacts.
Municipal and manufacturing strategies were developed to provide water of sufficient quantity and quality that is acceptable for its end use. Water quality issues affect water use options and treatment requirements. For the evaluations of the strategies, it was assumed that the final water product would meet existing state water quality requirements for the specified use. For example, a strategy that provided water for municipal supply would meet existing drinking water standards, while water used for mining may have a lower quality.
5A.3 Strategy Development Assumptions
Strategies were developed for water user groups in the context of their current supply sources, previous supply studies and available supply within reasonable vicinity of the need. As previously discussed, most of the water supply in the PWPA is from groundwater. For many of the identified needs, the potentially feasible strategies included development of new groundwater supplies or further development of an existing well field. Site-specific data were used when available. When specific well fields could not be identified, assumptions regarding the source aquifer, well capacity, depth of well, and relative distance to the user were developed. Other strategy assumptions were developed with the input of the strategy sponsor.
While the development of the strategies considered acquisition of water rights when needed, the implementation of any groundwater strategy will need to ensure an adequate quantity of groundwater rights while complying with all applicable water conservation district rules. For this plan, strategy supplies could not exceed the MAG. This results in some strategies with less water than originally intended by the sponsor. If the MAGs increase in future rounds of planning, the supplies for these strategies may be adjusted.
5A.3.1 Strategy Costs
The cost estimates for water management strategies identify both capital and annual costs. Capital costs are based on standard unit costs provided by the TWDB for installed pipe, pump stations and standard treatment facilities developed from experience with similar projects throughout the State of Texas. If a project had more detailed costs, these costs were used. Assumptions for groundwater strategies include project location, well depth, and well capacity.
5-9

Subchapter 5A April 13, 2015 Identification of Potentially Feasible Water Management Strategies Draft
Transmission lines were assumed to follow existing highways or roads where possible. For new well fields that are not specifically identified, an average transmission distance was assumed. A more detailed explanation of the cost assumptions and summaries of the costs developed for each strategy are included in Appendix E.
5-10

Subchapter 5B April 13, 2015 Water Conservation Draft
Subchapter 5B Water Conservation
Water conservation is a demand management strategy that pro-actively reduces future water needs. Conservation facilitates more efficient use of existing water supplies and may delay the need to develop new water supplies. An expected level of conservation is included in the municipal demand projections from the Texas Water Development Board (TWDB) due to the natural replacement of less efficient plumbing fixtures with low flow fixtures, as mandated under the Plumbing Code. Irrigation water demands also include a declining demand over the planning horizon due to expected reduced use associated with declining groundwater levels and the transfers of water rights to other uses.
Water conservation strategies must be considered for all water users with a need. In the PWPA, this includes municipal, manufacturing and irrigation water users. All of the manufacturing water needs are associated with needs of a municipal water provider. Conservation strategies to reduce manufacturing water use are typically industry and process-specific and cannot be specified to meet county-wide needs. Wastewater reuse is a more general strategy that can be utilized by various industries for process water, and this strategy will be considered where appropriate. For municipal and irrigation users, additional conservation savings can potentially be achieved in the region through the implementation of conservation best management practices (BMPs). These additional conservation measures were considered for municipal (only County-Other users with needs were evaluated, all other municipal water user groups were evaluated) and irrigation water user groups in the Panhandle Water Planning Area (PWPA). The PWPA recognizes that it has no authority to implement, enforce, or regulate water conservation practices. These water conservation practices are intended to be guidelines. Water conservations strategies determined and implemented by the individual water user group supersede the recommendations in the Regional Water Plan (Plan) and are considered to meet regulatory requirements for consistency with the Plan.
5B.1 Municipal Conservation
Each public water supplier is required to update and submit a Water Conservation Plan (WCP) to the Texas Commission on Environmental Quality (TCEQ) every five years. Per Title 30, Part 1, Chapter 288, Subchapter A, Rule 288.2 of the Texas Administrative Code, some specific conservation strategies are required to be included as part of a water conservation plan. At a minimum each plan must include:
• Utility Profile that describes the entity, water system and water use data;
• Record management system that is capable of recording water use by different types of users;
• Quantified five-year and ten-year water savings goals;
• Metering device with a 5% accuracy to measure the amount of water diverted from the source of supply;
• A program for universal metering;
5-11

Subchapter 5B April 13, 2015 Water Conservation Draft
• Measures to determine and control water loss;
• A program of continuing public education and information regarding water conservation;
• A non-promotional water rate structure.
If a public water supplier serves over 5,000 people, they are additionally required to the have a conservation oriented rate structure and a program of leak detection, repair, and water loss accounting for the water transmission, delivery, and distribution system.
5B.1.1 Identification of Potentially Feasible Conservation BMPS
To assess the appropriateness of additional conservation BMPs for the PWPA, 68 potential strategies were identified and a screening level evaluation was conducted. Due to difference in the water needs and available resources between the larger municipalities and smaller rural areas, the screening evaluation was performed both for entities with populations less than 20,000 people and entities with population great than 20,000. In the PWPA, there are four entities that have populations greater than 20,000 during the planning period: Amarillo, Canyon, Dumas and Pampa.
The evaluation considered six criteria:
• Cost
• Potential Water Savings
• Time to Implement
• Public Acceptance
• Technical Feasibility
• Staff Resources
Each criterion was scored from 1 to 5 with 5 being the most favorable. Scores for all the criteria were then added to create a composite score. The strategies were then ranked and selected based on their composite score.
Selected Strategies for Entities under 20,000
Based on the screening level evaluation and requirements from the TCEQ, the following strategies were selected for consideration for entities in the PWPA with less than 20,000 people during every decade of the planning period:
• Education and Outreach
• Water Audits and Leak Repair
• Conservation – Oriented Rate Structure
• Water Waste Ordinance
5-12

Subchapter 5B April 13, 2015 Water Conservation Draft
Selected Strategies for Entities over 20,000
Based on the screening level evaluation and requirements from the TCEQ, the following strategies were selected for consideration for entities in the PWPA with more than 20,000 people during any decade of the planning period:
• Education and Outreach
• Water Audits and Leak Repair
• Conservation – Oriented Rate Structure
• Water Waste Ordinance
• Landscape Ordinance
• Time of Day Watering Limit
Each of the selected strategies above, were considered and evaluated for the appropriate water user groups (greater than or less than 20,000). For the purposes of strategy evaluation, each household was assumed to have an average of three people. Additional assumptions were developed and used in the evaluation of the selected municipal conservation measures as described in Section 5B.1.2.
5B.1.2 Recommended Municipal Conservation Strategies
Published reports and previous studies were used to refine the description for the selected BMPs, including the potential water savings and costs. Water savings for some BMPs are difficult to estimate since there is little data for an extended time period. Also, most entities tend to implement a suite a strategies at the same time, which makes it difficult to estimate the individual water savings. These factors were considered in developing the assumptions defined below for each BMP. As more data become available through more rigorous water use tracking, the ability to estimate water conservation savings will improve.
Education and Outreach
Local officials would offer water conservation education to schools, civic associations, include information in water bills, provide pamphlets and other materials as appropriate. It was assumed that the education outreach programs would be needed throughout the planning period to maintain the water savings. It was assumed that education and outreach would save 2% of the total water demands. Per person cost were based on data obtained from municipalities and water providers. The costs for entities with populations less than 20,000 are greater on a per person basis than for the larger cities. .
Water Audits and Leak Repair
Local officials would perform a water audit system wide and create a program of leak detection and repair including infrastructure replacement as necessary. It was assumed that 20% of an entity’s losses could be recovered through a water audit and leak repair program, and that the leak detection and repair program
5-13

Subchapter 5B April 13, 2015 Water Conservation Draft
is an on-going activity to maintain the level of water loss reductions. This strategy was considered for all cities with greater than or equal to 15% losses and WSCs with losses greater than or equal to 25%. If no water loss data was available, this strategy was considered for an entity with a gpcd over 140. A constant 5% savings rate was assumed until an entity’s gpcd was equal to 140. Costs were estimated at $10 per person per year.
Rate Structure
Local officials would implement an increasing block rate structure where the unit cost of water increases as consumption increases. Increasing block rate structures discourage the inefficient use or waste of water. Many cities already have a non-promotional rate structure. This strategy assumes that the entity adopts a higher level of a non-promotional rate structure. It is assumed that increasing block rates would save 6,000 gallons per household per year and that 10 percent of the households would respond to this measure by reducing water use. Since it is likely that the entity would conduct the rate structure modifications themselves, this BMP has no additional costs to the water provider.
Water Waste Ordinance
Local officials would implement an ordinance prohibiting water waste such as watering of sidewalks and driveways or runoff into public streets. A water waste ordinance saves about 3,000 gallons/household/year. It is assumed that 75 percent of the households would respond to this measure by not wasting water. Costs for this strategy would be those costs associated with enforcement.
Landscape Ordinance
Local officials would implement an ordinance that would promote residential plantings that conserve water for all new construction. This strategy is assumed to be implemented by 2030 and would only apply to new construction for both residential and commercial properties. This BMP would save 1,000 gallons per increased number of households per year. Costs for this strategy would be those costs associated with enforcement.
Time of Day Watering Limit
Local officials would implement an ordinance prohibiting outdoor watering during the hottest part of the day when most of that water is lost (wasted) through evaporation. Many ordinances limit outdoor watering to between 6 p.m. and 10 a.m. on a year round basis. It is assumed that time of day watering limits saves 1,000 gallons/household/year and 75 percent of the population would realize these savings (the other 25 percent is either not irrigating or already abide by this practice). Costs for this strategy would be those costs associated with enforcement.
5-14

Subchapter 5B April 13, 2015 Water Conservation Draft
5B.1.3 Evaluation of Municipal Conservation Strategies
Quantity, Reliability and Cost
The water savings associated with municipal conservation vary depending on the potential of the entity’s customers to reduce water use. For most water users in the PWPA, water that is conserved (i.e., not consumed) will further protect the natural resources for future use. The reliability is moderate because this strategy relies on actions of others (customers) and the willingness to change daily behaviors. The suite of recommended strategies focuses on the actions of the water provider, which have shown to be successful in reducing water consumption. The costs are low to moderate for larger entities and high for smaller entities. Much of the higher costs are associated with the leak detection and repair strategy. For smaller entities, this strategy may not be cost effective. Table 5B-1 shows the total water savings by provider and associated costs for each decade.
Environmental Factors
Potential environmental impacts associated with municipal conservation should be neutral to positive. Reductions in water use will preserve water for other uses, including potential environmental purposes.
Impacts to Agricultural and Natural Resources
Impacts to agricultural and rural areas should be neutral to positive. Conserved water by cities could provide additional supplies to agricultural and rural areas. Impacts to natural resources should be neutral to positive. Conserved water by cities would protect limited groundwater supplies for future use. If the water remains in the original source and is not used for other purposes, municipal conservation could help maintain existing water quality of these resources. High use of some water sources can possibly degrade water quality over time.
Impacts to Other Water Resources and Management Strategies
There are no known impacts to other water resources and management strategies.
5B.1.4 Municipal Conservation Summary
It is estimated that the municipal conservation strategy outlined in this memorandum will save, on a regional basis, over 3,700 acre-feet in 2020 and over 5,400 acre-feet in 2070. The cost for this strategy is over $1.76 million in 2020 increasing to approximately $2.45 million in 2070. The combined unit cost across the region is approximately $473 per acre-foot in 2020 and $449 per acre-foot in 2070. The unit costs varies considerably between water user groups depending on the population size, and implementation of a water audit and leak repair program for entities with high water losses. Conservation programs are typically funded through the city’s annual operating budget. Capital costs shown in Table 5B-1 represent an estimate of the total capital expenditures over 50 years. However, these costs may differ for each entity; therefore, all capital expenditures for conservation is considered consistent.
5-15

Subchapter 5B April 13, 2015 Water Conservation Draft
Table 5B-1: Municipal Water Conservation Savings and Cost by Water User Group
Conservation Savings (Ac-ft) Conservation Cost Conservation Unit Cost ($/Ac-ft) WUG 2020 2030 2040 2050 2060 2070 Capital Cost 2020 2030 2040 2050 2060 2070 2020 2030 2040 2050 2060 2070 Amarillo 1,734 1,935 2,122 2,316 2,534 2,762 $0 $432,980 $501,809 $547,028 $592,633 $641,811 $693,285 $250 $259 $258 $256 $253 $251 Booker 15 17 18 19 20 21 $0 $9,846 $10,448 $10,819 $11,298 $11,650 $11,952 $648 $618 $603 $583 $570 $559 Borger 104 107 106 106 106 106 $0 $42,769 $44,122 $44,394 $44,394 $44,394 $44,394 $410 $414 $417 $417 $418 $418 Cactus 32 36 41 45 50 55 $0 $16,638 $18,266 $20,001 $21,761 $23,598 $25,471 $519 $504 $491 $479 $469 $460 Canadian 64 70 76 82 88 93 $2,294,900 $43,454 $48,108 $52,060 $56,128 $59,761 $63,089 $681 $683 $684 $682 $679 $675 Canyon 127 142 156 171 187 203 $0 $76,793 $104,961 $108,132 $111,379 $114,834 $118,424 $604 $737 $693 $653 $615 $583 Childress 132 135 138 141 145 148 $4,098,000 $85,363 $88,423 $90,973 $93,460 $95,933 $98,343 $646 $654 $661 $664 $664 $663 Clarendon 14 13 13 13 13 13 $0 $10,742 $10,742 $10,742 $10,742 $10,742 $10,742 $787 $798 $807 $813 $813 $813 Claude 29 29 28 28 28 28 $721,800 $20,338 $20,338 $20,338 $20,338 $20,338 $20,338 $698 $707 $716 $719 $721 $721 County - Other (Hall) 25 26 26 26 26 26 $660,000 $18,706 $19,089 $19,089 $19,089 $19,089 $19,089 $735 $741 $745 $747 $747 $747 County - Other (Moore) 14 15 17 19 21 23 $0 $11,636 $12,568 $13,555 $14,559 $15,607 $16,679 $857 $826 $797 $770 $744 $723 County - Other (Potter) 266 291 318 347 379 413 $13,409,600 $225,014 $249,520 $275,440 $301,259 $329,424 $359,068 $846 $858 $866 $869 $869 $869 County - Other (Randall) 143 158 173 189 207 225 $0 $70,346 $78,070 $85,803 $93,723 $102,152 $110,903 $493 $496 $496 $496 $494 $492 Dalhart 79 86 93 100 107 113 $0 $29,206 $31,576 $33,914 $36,180 $38,349 $40,423 $369 $367 $365 $363 $360 $357 Dumas 133 152 171 190 210 231 $0 $80,584 $109,861 $114,416 $119,039 $123,861 $128,802 $606 $722 $671 $628 $590 $558 Fritch 37 38 37 37 37 37 $1,367,000 $32,999 $34,019 $34,287 $34,312 $34,325 $34,351 $889 $902 $916 $920 $922 $921 Groom 5 5 5 5 5 5 $0 $6,579 $6,579 $6,579 $6,579 $6,579 $6,579 $1,252 $1,267 $1,277 $1,281 $1,281 $1,281 Gruver 23 25 26 28 30 31 $964,600 $21,652 $23,449 $25,018 $26,331 $27,657 $28,881 $958 $953 $947 $943 $932 $924 Happy 26 28 30 31 33 35 $964,600 $21,652 $23,449 $25,018 $26,331 $27,657 $28,881 $849 $845 $840 $836 $827 $820 Lake Tanglewood 25 24 24 24 24 24 $492,000 $15,455 $15,455 $15,455 $15,455 $15,455 $15,455 $625 $632 $638 $640 $642 $642 Mclean 17 18 20 23 25 27 $669,900 $15,761 $16,909 $18,286 $20,058 $21,460 $22,939 $938 $926 $912 $887 $869 $852 Memphis 34 23 14 14 14 14 $470,000 $34,555 $35,371 $11,551 $11,551 $11,551 $11,551 $1,029 $1,535 $803 $805 $806 $806 Miami 17 18 17 17 17 17 $373,200 $12,816 $12,943 $12,956 $12,956 $12,956 $12,956 $734 $737 $743 $746 $746 $746 Pampa 146 161 178 202 220 240 $0 $85,322 $114,089 $118,601 $124,409 $129,036 $133,867 $584 $707 $665 $615 $586 $559 Panhandle 47 48 48 48 48 48 $1,559,800 $36,760 $37,933 $38,545 $38,545 $38,545 $38,545 $777 $787 $796 $802 $803 $803 Perryton 85 90 96 103 111 119 $0 $31,752 $33,749 $35,894 $38,201 $40,679 $43,343 $374 $373 $372 $370 $367 $364 Shamrock 30 31 31 32 33 35 $1,301,900 $30,156 $31,150 $32,107 $33,088 $34,172 $35,320 $997 $1,015 $1,029 $1,026 $1,021 $1,015 Spearman 24 24 25 25 26 27 $0 $14,639 $15,032 $15,337 $15,651 $15,975 $16,311 $619 $619 $619 $617 $612 $606 Stinnett 37 38 37 37 37 37 $1,212,200 $29,863 $30,755 $30,985 $30,985 $30,985 $30,985 $809 $819 $831 $832 $834 $834 Stratford 39 42 43 44 45 46 $1,489,900 $32,923 $35,269 $36,544 $37,666 $38,482 $39,081 $838 $844 $852 $853 $852 $849 Sunray 37 42 46 52 57 63 $1,822,300 $33,254 $37,194 $41,401 $45,673 $50,135 $54,687 $896 $896 $893 $886 $877 $870 TCW Supply Inc 58 59 59 59 59 59 $1,346,700 $32,629 $33,611 $33,866 $33,866 $33,866 $33,866 $563 $566 $570 $573 $574 $574 Texline 18 20 22 24 26 28 $464,500 $12,472 $13,415 $14,410 $15,379 $16,322 $17,227 $709 $683 $662 $643 $627 $612 Vega 22 23 23 23 23 23 $608,100 $17,253 $18,056 $18,056 $18,056 $18,056 $18,056 $790 $787 $797 $802 $802 $802 Wellington 44 45 46 47 49 50 $1,533,900 $34,555 $36,123 $37,156 $38,354 $39,285 $40,101 $794 $804 $812 $811 $809 $807 Wheeler 15 15 16 16 17 18 $0 $9,524 $9,703 $9,873 $10,049 $10,244 $10,451 $638 $631 $624 $615 $605 $593 White Deer 20 21 21 21 21 21 $704,400 $19,344 $19,879 $20,147 $20,147 $20,147 $20,147 $950 $957 $968 $971 $971 $971 Region A Total 3,716 4,050 4,363 4,706 5,078 5,466 $38,529,300 $1,756,323 $1,982,029 $2,078,772 $2,199,619 $2,325,109 $2,454,577 $473 $489 $476 $467 $458 $449
5-16

Subchapter 5B April 13, 2015 Water Conservation Draft
5B.2 Agricultural Water Conservation
Agriculture is the largest user of water in the PWPA, and accounted for 92% of the total water use in the PWPA in 2010. Most of the Counties in the PWPA can met the agricultural demands. There are three counties showing needs in irrigation: Dallam, Hartley and Moore. These needs are projected to reach 155,688 acre-feet per year in 2020 and peak at 192,876 acre-feet per year deficit in 2040. Given the limited renewability of aquifers in the area, there is no readily available water supply in or near the high demand irrigation counties that could be developed to fully meet these needs. Water management strategies for reducing irrigation demands in the Ogallala Aquifer for all 21 counties were examined by the PWPG Agricultural Demands and Projections Committee. The primary strategies identified to address irrigation needs are demand reduction strategies (conservation). The eight agricultural water conservation strategies considered include irrigation scheduling, irrigation equipment changes, conservation tillage, advances in plant breeding, precipitation enhancement, conversion to dryland farming and changes to crop types and crop varieties that use less water. These strategies are summarized in Section 5B.2.1 and evaluated in detail in Appendix D. There are no identified conservation strategies for livestock water use.
Precipitation enhancement is considered a limited use strategy since it cannot be implemented by an individual producer and little interest has been shown in implementing this strategy by ground water districts in the region with the exception of the Panhandle Groundwater Conservation District.
A list of the potentially feasible irrigation strategies is shown in Table 5B-2. A synopsis of the potential water savings associated with all eight strategies is presented in Section 5B.2.2 for PWPA and each county with an irrigation need. County evaluations for each strategy are found in Appendix D.
5B.2.1 Irrigation Strategies
Irrigation scheduling
Irrigation scheduling refers to the process of allocating irrigation water according to crop requirements based on meteorological demands and field conditions with the intent to manage and conserve water, control disease infestations, and maximize farm profit. Proper and accurate irrigation scheduling is critical to ensure profitable agricultural production and conservation of the existing water resources. Soil water measurement-based methods, plant stress sensing-based methods, and weather-based methods are the common irrigation scheduling tools. The prevalent soil-based irrigation scheduling method utilized in the region today employs soil moisture probes that estimate soil moisture at different depths to schedule irrigation. Irrigation scheduling based on crop evapotranspiration reported by ET networks in the region is also an important weather-based irrigation scheduling method since this data references the climatic demand, which varies annually and can vary substantially within the season. Plant stress-based irrigation scheduling techniques using thermal sensors are also a developing irrigation scheduling strategy but are not yet widespread in use. The soil moisture probe and thermal sensor methods can allow for automation of irrigation scheduling by wireless connection of the sensors to respective irrigation systems. Proper and
5-17

Subchapter 5B April 13, 2015 Water Conservation Draft
accurate irrigation scheduling can save up to 2 to 3 acre-inches of irrigation per year for corn. In this analysis, the water savings from this strategy is assumed to be 10% of the water applied for each crop.
The cost of irrigation scheduling can vary significantly depending on several factors including the level of service, equipment costs, and area served. More money tends to be invested in irrigation scheduling of higher value crops. A range of $3.00 to $12.00 per acre for irrigation scheduling was identified based on discussions with industry representatives, depending on the level of service. In this analysis, a $5.00 per acre annual cost was assumed for irrigation scheduling. Irrigation scheduling costs can be reduced if the producer choses to buy the soil moisture probe. Typically, the cost of a soil moisture probe ranges from $1,300 to $2,650, depending on the company and level of sophistication of the probe.
Change in Crop Variety
The evaporative demand for short season varieties can be significantly lower than that for long season varieties. Converting from long season varieties to short season varieties of corn and grain sorghum can be a useful water conservation strategy as they use less water than the conventional longer season varieties. Short season hybrids may be seeded earlier to possible avoid insect threat, and have the potential of planting a third crop in two years either by planting a short season variety prior to or following a wheat crop (Howell et al., 1996). Early planting of the short season hybrids can also help avoid high evaporative demand periods and save water. The seasonal evapotranspiration for short season corn hybrids was found to be generally 5 inches less than that of long season hybrids (Howell et al., 1998). The water use of short season grain sorghum is about 0.6 inches less than that of long season varieties. In this analysis, the water savings from adopting short season corn and short season grain sorghum are assumed to be 4.1 and 3.0 acre-inches per acre, respectively.
The implementation cost of this water conservation strategy was assumed to be the compensation needed to account for the loss in yield and profitability of employing the strategy. Howell et al. (1998) reported that the yield from short season hybrids was about 15% less than that from the full season hybrids. A partial budget analysis considering the loss in revenue versus the reduction in pumping cost, fertilizer, and harvest expense indicates that approximately half of the revenue reduction is profit loss (Texas A&M AgriLife Crop and Livestock Budgets, 2014). In this analysis, the loss of revenue from short season corn and grain sorghum is estimated as 15% of the average revenue for the last 5 years and the implementation cost is assumed to be half of that amount. The average revenue was calculated using the average corn and grain sorghum yield and the average price received in Northern High Plains for last 5 years (USDA, 2014). It should be noted that the reduction in gross receipts and associated expenditures is expected to have a negative impact on the regional economy.
Irrigation Equipment Changes
Current irrigation methods practiced in the Texas Panhandle include conventional furrow irrigation (CF), center pivot irrigation (MESA: Mid Elevation Spray Application, LESA: Low Elevation Spray Application, and
5-18

Subchapter 5B April 13, 2015 Water Conservation Draft
LEPA: Low Elevation Precision Application) and subsurface drip irrigation (SDI).The average application efficiency of CF, MESA, LESA, LEPA, and SDI is 60, 78, 88, 95, and 97%, respectively (Amosson et al., 2011). These application efficiencies are the percentage of irrigation water applied that is used by the crop with the remainder being lost to runoff, evaporation or deep percolation. Switching from low efficiency irrigation systems such as CF and MESA to more efficient irrigation systems such as LEPA and SDI improves the efficiency of irrigation system water use and can help conserve groundwater resources. Switching irrigation systems can be a costly strategy to conserve irrigation water, but that expense can be partially offset by the decrease in pumping cost. The water conservation strategy of changing irrigation equipment includes establishing new MESA and LESA systems in CF irrigated fields and converting MESA and LESA to LEPA to improve its application efficiency. Establishing MESA, LESA, LEPA, or SDI systems requires a major investment, while converting MESA and LESA to LEPA using conversion kits are comparatively less expensive. The regional water savings estimate in 2020 from this strategy is 3.5 and 1.3 acre-inches per acre for conversion of furrow to MESA/LESA and MESA/LESA to LEPA, respectively. It should be noted that water savings from this strategy vary by county and over time as the amount of water pumped changes.
Initial investment in irrigation equipment varies depending on the dealer and spacing between sprinkler drops or tape in the case of SDI. In consultation with industry representatives and other secondary sources, the cost of adding a quarter-mile (125 acres) sprinkler system was estimated to be $75,000-$80,000. The estimates to convert a MESA or LESA quarter-mile sprinkler system to LEPA ranged from $7,000-$10,000, depending on the spacing of the drops. The estimates for installing a SDI system ranged from $1,200-$1,500 per acre, depending primarily on whether drip tapes were spaced 80 inches or 40 inches apart.
The implementation cost of this strategy is estimated using the costs associated with the irrigation equipment required for each of the systems and their respective adoption rate. The assumed adoption percentage of the irrigation systems during each decade was used along with the acreage and average water use to estimate the amount of irrigation applied using these systems during the baseline period and future periods. These irrigation amounts were multiplied with the cost per acre-inch to get the total cost of irrigation during the baseline and future time periods. The difference in cost between successive time periods is the cost of implementation for this strategy.
Change in Crop Type
Selection of crops with lower water requirements can be an effective water conservation strategy. Corn, cotton, wheat, and grain sorghum are the four major crops in the Panhandle region accounting for about 90% of the irrigated acreage. Corn has one of the highest water requirements of any irrigated crop grown in the Texas High Plains because of a longer growing season than most other spring crops, which can adversely affect yield in limited moisture situations (Howell et al., 1996). The seasonal evaporative demand for corn is 28 to 32 inches, for wheat is 26 to 28 inches, for cotton is 13 to 27 inches, and for grain sorghum is 13 to 24 inches. To date, the majority of water used for irrigation has been applied to high
5-19

Subchapter 5B April 13, 2015 Water Conservation Draft
water use crops such as corn. On the other hand, cotton, wheat, and grain sorghum can tolerate lower moisture availability and are more suited to deficit irrigation practices. Considerable amounts of irrigation water can be saved by shifting from high water use crops like corn to lower water use crops like cotton, wheat or grain sorghum. In this analysis, it is assumed that shifting from corn to low water use crops can save 7.8 to 8.6 acre-inches per acre depending on the crop choice.
The cost of implementing this water conservation strategy is evaluated in terms of an “opportunity cost” expressed by the reduced land values which reflect the water availability required to produce crops. Land that has “good” water availability to support corn production is worth more compared to the land with “fair” availability of water that can support cotton, wheat, or grain sorghum. Hence the cost of adoption of this strategy for one acre of land is estimated as the difference between the average land value in the region for irrigated cropland with good water availability and that of irrigated cropland with fair water availability. This per acre cost of adoption is then multiplied by the assumed acreage of adoption to get the total cost, which is then expressed as the cost per acre-foot of water savings. The value of irrigated cropland with fair water availability in the region ranges from $1,800 to $2,500 per acre. The average of these two prices ($2,150) was used as the average land value for irrigated cropland with fair water availability in the region.
Soil Management
Effective soil management practices can increase the efficiency of both irrigation and rainfall events, increase soil infiltration, reduce runoff, reduce evaporative loss, and conserve moisture available within the soil profile. Thus, these practices promote efficient use of the available water and enhance crop production and sustainability of the region’s natural resources. Conservation tillage practices, furrow diking, and introduction of fallow and low water use crops in the crop rotation are the most important land management practices that can lead to water conservation within the region.
Conservation tillage is defined as tillage practices that minimize soil and water loss by maintaining a surface residue cover of more than 30% on the soil surface (CTIC, 2014). Conservation tillage can reduce evaporation, increase rainfall infiltration, water storage, soil moisture conservation, and water use efficiency. Conservation tillage systems are also reported to have economic advantages as it reduces machinery, fuel, and labor costs. Conservation tillage is a term covering a wide range of tillage practices with the common characteristic of reduced soil and water loss. Different tillage practices such as minimum tillage, reduced tillage, no-till; ridge tillage, vertical tillage, and strip tillage are often interchangeably used with the term conservation tillage. In this analysis, the water savings from adopting effective soil management strategy is assumed to be 1.75 acre-inches per acre.
The initial capital investment in equipment may impede the adoption of soil management practices. The purchase price of conservation tillage equipment capable of doing strip till or vertical tillage varies considerably depending on the size and company that made it. For example, a six-row strip till implement
5-20

Subchapter 5B April 13, 2015 Water Conservation Draft
costs approximately $32,000, whereas a 24-row prices out at $116,500 (Texas A&M AgriLife Crop and Livestock Budgets, 2014). A 14-foot vertical tillage implement costs $39,000, where a 40-foot version priced out at $116,500. The appropriate size of conservation implements depends upon the equipment compliment of the producer.
The implementation cost is estimated as the difference between the cost of conventional tillage and conservation tillage. It is assumed that the average conventionally tilled field will be disked once, chiseled once, and cultivated three times during the year. This will be followed by two herbicide applications; one pre-plant and one post-plant. In the case of conservation tillage (strip tillage is assumed as it is most common in the region), it is assumed that the field is chiseled once and cultivated two times. There are three herbicide applications in conservation tillage. The cost of conventional and conservation tillage are calculated as $87.75 and $85.16 per acre, respectively.
Precipitation Enhancement
Precipitation enhancement, commonly known as cloud seeding or weather modification, is a process in which clouds are inoculated with condensation agents (such as silver iodide) to enhance rainfall formation. Currently, cloud seeding is conducted in almost one-fifth of the land area of Texas, covering about 31 million acres. In 2012, the weather modification programs in Texas conducted 162 missions, treating 353 thunderstorms. Analysis showed that the treated storms lived 40% longer, covered 47% more area, and produced 124% more rain than the untreated storms. The estimated increase in water availability was 1,517,266 acre-feet at a cost of $11/acre-foot (TDLR, 2014). Precipitation enhancement can help conserve groundwater by reducing the irrigation requirement. It can also increase reservoir levels and could have a positive impact on dryland farms and ranches, including hail suppression. This analysis assumes a water savings of one acre-inch per acre for all irrigated acreage in the region by precipitation enhancement.
The strategy of precipitation enhancement is adopted only by the counties in the Panhandle Groundwater Conservation District (PGCD), which are Carson, Donley, Gray, Roberts, Wheeler and parts of Armstrong, Hutchinson, and Potter Counties. In consultation with PGCD personnel, the cost of adoption of this strategy per acre feet of water saved is estimated as $6.28 in the 2006 plan. Since this was a local estimate of the cost it was determined to be more accurate than the TDRL cost for the area. This 2006 PGCD value was adjusted to 2014 dollars (USDA, 2014). The cost of adoption of this strategy per acre-foot of water saved is estimated to be $8.11
Conversion from Irrigated to Dryland Crops
Converting from an irrigated to dryland cropping system may be a viable economic alternative for some producers in the Panhandle on marginally irrigated lands or as a regional strategy to conserve water reserves. The primary dryland crops grown in the area are winter wheat, grain sorghum, and cotton. Conversion programs that provide incentives for dryland conversion, identifying and adopting crops that
5-21

Subchapter 5B April 13, 2015 Water Conservation Draft
perform well in the region under rainfed conditions, and developing higher yielding heat and drought-tolerant varieties will be critical in implementing this strategy. Other highly drought tolerant crops like canola, safflower, mustard, camelina, jatropha, castor, guar, and rapeseed are currently being evaluated for suitability and profitability, but sustained markets and returns on investments are still valid concerns. This analysis assumes 13.9 acre-inches per acre water savings by the adoption of this strategy over the entire region; however, the amount varies by county depending on crop composition.
The cost of implementing this water conservation strategy is evaluated in terms of reduced land values. Land that has sufficient water available for irrigation is worth much more compared to dry cropland. The cost of adoption for one acre of land is estimated as the difference between the average land value in the region for irrigated cropland and that of dryland. This per acre cost of adoption is then multiplied by the assumed acreage of adoption to get the total cost. The land values reported by the Texas chapter of the American Society of Farm Managers and Rural Appraisers (ASFMRA, 2013) provided the average land value for irrigated and dry cropland in the region. The value of irrigated cropland with fair water availability in the region ranges from $1,800 to $4,000 per acre. The average of these two values ($2,900) was used as the average land value for irrigated cropland availability in the region. The average land value of dry cropland ranged from $500 to $700 per acre in the western parts of the region and from $700 to $1,100 in the Eastern parts of the region resulting in an overall average of $750 per acre. The cost assumed in the analysis to retire an acre of irrigated land was the difference in the irrigated cropland value and dry cropland value. In addition to the implementation cost, the loss in gross receipts from the conversion of irrigated to dryland crop production was estimated.
Advances in Plant Breeding
Plant breeding has played a major role in increasing crop productivity and enhancing the efficiency of input such as irrigation. The adoption of drought resistant varieties with high water use efficiency can be a potential water conservation strategy. The first wave of drought resistant varieties for corn, cotton, and soybeans are expected to be released by 2020 followed by a second wave in 2040 that will improve drought and heat tolerance even more. This analysis assumes that the first round of drought resistant varieties will reduce water use by 15% and the second round of varieties will reduce the water use an additional 15% compared to current varieties. It is also assumed that drought tolerant varieties of wheat and grain sorghum will be available by 2030 and will reduce the water use by 12%.
The implementation cost of this strategy assumed an additional cost of drought resistant seed estimated at a dollar for every one percent reduction in water use. It was assumed a 15 percent reduction in water use will cost $15 per acre and a 30 percent reduction will cost $30 per acre. Cost estimates were made after consultation with industry personnel and researchers working in the area. These costs were then multiplied with the annual total acreage for corn, cotton and soybeans, affected by incorporation of this strategy. It is also assumed that drought tolerant varieties of wheat and grain sorghum will cost $12/acre for a 12 percent reduction in water use.
5-22

Subchapter 5B April 13, 2015 Water Conservation Draft
The estimated water savings and implementation schedule used in the 2016 planning effort for each of the strategies is presented in Table 5B-2.
Table 5B-2: Possible Water Management Strategies for Reducing Irrigation Demands
5B.2.2 Methodology
Water savings, implementation cost, savings from reduced pumping and the impact on gross crop receipts were estimated for each proposed water management strategy evaluated in the planning effort and described in the forthcoming sections. The year 2013 was selected as the baseline for evaluating strategies. Baseline adoption rates for strategies were estimated using secondary data sources and future
Water Management
Strategy
Annual Regional
Water Savings (ac-
in/ac/yr)
Assumed Baseline Use 2013
Goal for Adoption
2020
Goal for Adoption
2030
Goal for Adoption
2040
Goal for Adoption
2050
Goal for Adoption
2060
Goal for Adoption
2070
Irrigation Scheduling
10% 20% 35% 50% 75% 85% 90% 95%
Irrigation Equipment Changes
Furrow to MESA or LESA
3.5
87% 90% 91.5% 93% 94.5% 96% 98%
MESA or LESA to LEPA or
SDI 1.3
75% 80% 85% 90% 95% 100% 100%
Change in crop type
7.8-8.6 10% 15% 20% 25% 30% 35% 40%
Change in crop variety
4.10 (corn) 3.0 (sorghum)
40% 50% 60% 70% 70% 70% 70%
Conversion to Dryland
13.9 0% 2.5% 5% 5% 5% 5% 5%
Soil Management
1.75 70% 75% 80% 85% 90% 95% 95%
Advances in Plant Breeding
Corn, cotton, and soybean 15% (2020-2030); 30% starting in
2040
0% 50% 75% 85% 95% 95% 95%
Wheat and sorghum 12%
starting in 2030
0% 0% 50% 75% 85% 95% 95%
Precipitation Enhancement
1.0 38% 38% 38% 38% 38% 38% 38%
5-23

Subchapter 5B April 13, 2015 Water Conservation Draft
adoption rates (2020 – 2070) were identified under the guidance of the PWPG Agriculture committee, Table 5B-2. Since final implementation rates of conservation strategies do not occur until 2070, the water savings, direct cost and net cost of all strategies were evaluated over a 60-year planning horizon (2020 – 2079). A five-year average (2006 – 2010) of Farm Service Agency (FSA) irrigated acreage for the region was used to establish a baseline from which effectiveness of alternative conservation strategies were measured. FSA irrigated acreage estimates were increased in some counties based on local knowledge to account for farms known not to be registered with FSA. The five-year average of irrigated acreage was used to dampen distortions resulting from acreage shifts between crops caused by volatile crop prices. Water availability was assumed to remain constant in measuring the impacts of the various water conservation strategies.
In addition, the Agricultural subcommittee identified three combinations of the previously mentioned strategies that may likely be employed in irrigation deficit counties. The combinations of strategies were:
• change in crop type, irrigation scheduling, and changes in irrigation equipment
• changes in crop variety, irrigation scheduling, and changes in irrigation equipment
• change in crop type, advances in plant breeding, irrigation scheduling, and changes in irrigation equipment
When implementing multiple strategies the impact on potential water savings are not additive in most instances. The cumulative water savings from use of multiple strategies was estimated using a stepwise procedure; first revising water use after implementing one strategy and then using the revised water use as the base before introducing the second strategy and repeating the process for the third and fourth strategy. For example, the impact of changing crop type on water use was estimated, then based on the revised water use, the impact of scheduling was identified and water use revised again, and based on this estimate, the effectiveness of changes in irrigation equipment was made. The water savings of the three combinations of strategies considered was done for the three large irrigation counties (Dallam, Hartley, and Moore) and the region as a whole. In examining the cost effectiveness of the strategy combinations (done on a regional basis), it was assumed the cost was additive.
Implementation costs were defined as the costs that could be borne by producers and/or the government associated with implementing a strategy. The savings in pumping cost takes into the account the variable cost savings from the reduced irrigation. The variable cost of irrigation is assumed be $9.10 per acre-inch (Texas A&M AgriLife Crop and Livestock Budgets, 2014). All costs were evaluated in September 2013 dollars. The loss in gross receipts was estimated by strategy, where warranted. The impact on the regional economy resulting from a change in gross receipts was not estimated but is discussed.
Several caveats to this analysis need to be mentioned. First, the associated water savings with these strategies are “potential” water savings. In the absence of water use constraints, most of the strategies considered will simply increase gross receipts. In fact, the improved water use efficiencies generated from
5-24

Subchapter 5B April 13, 2015 Water Conservation Draft
some of these strategies may actually increase the depletion rate of the Ogallala Aquifer. Second, potential water savings may be overestimated when combinations of strategies are implemented. For example, the savings associated with the implementation of irrigation equipment changes cannot be applied to irrigated land that is converted to dryland farming. To address this potential conflict, the decrease in water savings from using multiple conservation strategies is estimated for three combinations. Table 5B-3 shows the total estimated water savings and costs associated with proposed individual irrigation water conservation strategies and the three potential combination for the region.
Table 5B-3: Estimated Water Savings and Costs for Proposed Conservation Strategies
Water Management Strategy
Cumulative Water
Savings (WS)
Implementation Cost (IC) IC/WS Cost
Savings Net
Cost/WS
Loss in Gross
Receipts
ac-ft $1,000 $/ac-ft $1,000 $/ac-ft $1,000 Irrigation Scheduling 4,685,325 209,396 $44.69 511,637 ($64.51) - Change in Crop Variety 3,064,326 602,294 $196.55 - $196.55 1,204,587 Irrigation Equipment Changes 3,643,928 55,638 $15.27 397,917 ($93.93) - Change in Crop Type 6,394,663 199,934 $31.27 - $31.27 3,006,360 Soil Management 1,970,123 -34,989 ($17.76) 215,137 ($126.99) - Precipitation Enhancement 813,923 6,601 $8.11 88,880 ($101.09) - Irrigated to Dryland Farming 4,156,337 145,226 $34.94 - $34.94 2,805,477 Advances in Plant Breeding 13,821,966 113,322 $8.20 1,509,359 ($102.63) - Combinations Change in Crop Type, Irrigation Scheduling & Irrigation Equipment 13,602,712 265,034 $19.48 1,485,416 ($89.72) 3,006,360
Change in Crop Variety, Irrigation Scheduling & Irrigation Equipment 10,325,042 867,328 $84.00 1,127,495 ($25.20) 1,204,587
Change in Crop Type, Advances in Plant Breeding, Irrigation Scheduling & Irrigation Equipment
22,928,545 378,356 $16.50 2,503,797 ($92.70) 3,006,360
5B.2.3 Recommended Combination
For the purposes of planning, the recommended combination will provide the greatest level of irrigation conservation for counties with water needs. The recommended combination includes: change in crop type, advances in plant breeding, irrigation scheduling, and changes in irrigation equipment. Counties without a need are recommended to adopt conservation measures of: advances in plant breeding, irrigation scheduling, and changes in irrigation equipment. A change in crop type is not recommended as the negative economic impact may deter potential irrigators from implementation if there is no need. Table 5B-4 through 5B-7 show the county by county savings for each of the individual strategies. Table 5B-8 shows the savings associated with the recommended strategies which accounts for potential overestimation of water savings. Dallam, Hartley and Moore are represented with the recommended
5-25

Subchapter 5B April 13, 2015 Water Conservation Draft
combination of four conservation measures, whereas the remaining counties are evaluated with only three conservation strategies. Table 5B-9 shows the costs based on $16.50 per acre-foot as shown in the previous Table 5B-3. On a regional basis the PWPA is projected to save approximately 482,700 acre-feet per year at a cost of $8.0 million per year.
Weather Modification (Precipitation Enhancement) is only a recommended strategy for counties in the Panhandle Groundwater Conservation District (PGCD), which are Carson, Donley, Gray, Roberts, Wheeler and parts of Armstrong, Hutchinson, and Potter Counties. Table 5-10 shows the estimate water savings for those counties.
While these selected strategies are recommended by the PWPG, all irrigation conservation strategies are recognized and encouraged with the PWPA, and such strategies are considered consistent with this plan.
Table 5B-4: Estimated Water Savings from Irrigation Scheduling by County in the PWPA
County
Water savings from Irrigation Scheduling (acre-feet/yr) Baseline 2020 2030 2040 2050 2060 2070
Armstrong 0 66 132 242 287 309 331 Carson 0 844 1,688 3,094 3,656 3,938 4,219 Childress 0 107 215 393 465 501 537 Collingsworth 0 269 538 986 1,166 1,255 1,345 Dallam 0 5,547 11,094 20,338 24,036 25,885 27,734 Donley 0 362 723 1,325 1,566 1,687 1,807 Gray 0 319 638 1,169 1,382 1,488 1,594 Hall 0 152 303 556 657 708 758 Hansford 0 2,018 4,036 7,399 8,744 9,417 10,089 Hartley 0 5,179 10,358 18,990 22,442 24,169 25,895 Hemphill 0 29 57 105 124 134 143 Hutchinson 0 599 1,199 2,198 2,597 2,797 2,997 Lipscomb 0 300 600 1,100 1,300 1,400 1,500 Moore 0 2,143 4,286 7,858 9,287 10,001 10,716 Ochiltree 0 857 1,713 3,141 3,713 3,998 4,284 Oldham 0 59 118 215 255 274 294 Potter 0 51 102 187 221 238 255 Randall 0 269 537 985 1,164 1,254 1,344 Roberts 0 89 178 327 387 416 446 Sherman 0 3,290 6,580 12,064 14,257 15,354 16,450 Wheeler 0 124 247 454 536 577 618 Total 0 22,671 45,342 83,127 98,241 105,798 113,355
5-26

Subchapter 5B April 13, 2015 Water Conservation Draft
Table 5B-5: Estimated Water Savings from Irrigation Equipment Changes by County in the PWPA
County Water savings from Irrigation Equipment Changes (acre-feet/yr)
Baseline 2020 2030 2040 2050 2060 2070
Armstrong 0 67.4 109.3 154 176.5 236.3 266.3 Carson 0 895.6 1451 2045 2344.3 3138.7 3536.7 Childress 0 117.5 190.4 268.3 307.5 411.8 464 Collingsworth 0 288.5 467.4 658.7 755.1 1011 1139.2 Dallam 0 5947 9634.6 13578.5 15566.3 20840.8 23483.7 Donley 0 387.2 627.3 884 1013.4 1356.8 1528.9 Gray 0 342.3 554.6 781.7 896.1 1199.7 1351.9 Hall 0 162.9 264 372 426.5 571 643.4 Hansford 0 2169.1 3514.1 4952.6 5677.6 7601.3 8565.3 Hartley 0 5553 8996.4 12679.1 14535.2 19460.3 21928.2 Hemphill 0 30.7 49.7 70 80.3 107.5 121.1 Hutchinson 0 643.3 1042.2 1468.8 1683.8 2254.3 2540.2 Lipscomb 0 321.7 521.2 734.6 842.1 1127.5 1270.4 Moore 0 2299.7 3725.8 5250.9 6019.5 8059.2 9081.3 Ochiltree 0 920.4 1491.1 2101.5 2409.1 3225.5 3634.5 Oldham 0 63.3 102.6 144.5 165.7 221.8 250 Potter 0 55.1 89.3 125.8 144.2 193.1 217.6 Randall 0 289.4 468.9 660.8 757.6 1014.3 1142.9 Roberts 0 95.8 155.2 218.7 250.8 335.7 378.3 Sherman 0 3552.9 5756 8112.1 9299.7 12450.8 14029.8 Wheeler 0 131.9 213.7 301.1 345.2 462.2 520.8 Total 0 24,335 39,425 55,563 63,697 85,280 96,095
5-27

Subchapter 5B April 13, 2015 Water Conservation Draft
Table 5B-6: Estimated Water Savings from Changes in Crop Type by County in the PWPA
County Water savings from Changes in Crop Type (acre-feet/yr)
Baseline 2020 2030 2040 2050 2060 2070
Armstrong 0 40.7 81.5 122.2 163 203.7 244.5 Carson 0 1033 2066 3099 4132 5165.1 6198.1 Childress 0 5.4 10.8 16.2 21.6 27 32.3 Collingsworth 0 29.6 59.1 88.7 118.3 147.9 177.4 Dallam 0 8341.3 16682.6 25023.9 33365.2 41706.5 50047.8 Donley 0 94.7 189.4 284.1 378.8 473.6 568.3 Gray 0 424.3 848.7 1273 1697.3 2121.7 2546 Hall 0 0 0 0 0 0 0 Hansford 0 2955.9 5911.8 8867.7 11823.7 14779.6 17735.5 Hartley 0 6842.3 13684.7 20527 27369.4 34211.7 41054 Hemphill 0 2.9 5.9 8.8 11.7 14.6 17.6 Hutchinson 0 836.2 1672.4 2508.6 3344.9 4181.1 5017.3 Lipscomb 0 233.1 466.2 699.2 932.3 1165.4 1398.5 Moore 0 3325.2 6650.4 9975.5 13300.7 16625.9 19951.1 Ochiltree 0 1229 2458 3687 4916 6145 7374 Oldham 0 9.8 19.6 29.3 39.1 48.9 58.7 Potter 0 0.4 0.9 1.3 1.8 2.2 2.7 Randall 0 66.4 132.7 199.1 265.4 331.8 398.1 Roberts 0 144.5 289 433.6 578.1 722.6 867.1 Sherman 0 4773.2 9546.4 14319.6 19092.8 23866 28639.2 Wheeler 0 62.8 125.5 188.3 251.1 313.8 376.6 Total 0 30,451 60,902 91,352 121,803 152,254 182,705
5-28

Subchapter 5B April 13, 2015 Water Conservation Draft
Table 5B-7: Estimated Water Savings from Advances in Plant Breeding by County in the PWPA
County Water savings from Advances in Plant Breeding for Drought Tolerance (acre-feet/yr) Baseline 2020 2030 2040 2050 2060 2070
Armstrong 0 102.6 250 492.9 553.2 572.4 572.4 Carson 0 2823.3 4858.2 10591 11788.1 11912.7 11912.7 Childress 0 177.6 326.4 695.9 776.9 788.9 788.9 Collingsworth 0 70.2 195.2 387 419.6 437.6 437.6 Dallam 0 19444.8 33500.2 72707.8 81256.3 82122.9 82122.9 Donley 0 209.7 366.6 796.4 885.2 895.6 895.6 Gray 0 899 1470.6 3251.7 3623.7 3648.2 3648.2 Hall 0 135.2 219 485.5 541.4 544.6 544.6 Hansford 0 6644 12325.8 26201.7 29258.9 29730.8 29730.8 Hartley 0 15812.3 27154.1 59014.1 65927.3 66614.5 66614.5 Hemphill 0 6.2 21.4 40.1 44.1 46.5 46.5 Hutchinson 0 1843.7 3190.9 6919 7729.1 7814.2 7814.2 Lipscomb 0 451.6 848.6 1799.5 2007.1 2041.3 2041.3 Moore 0 7445.6 13209.1 28559.6 31762.5 32170.6 32170.6 Ochiltree 0 2842.6 5121.3 11017.6 12259.5 12431 12431 Oldham 0 23.1 196.7 339.9 363.3 395.7 395.7 Potter 0 3.2 51 80.7 90.7 99.9 99.9 Randall 0 184 892.8 1607.9 1747.7 1871.1 1871.1 Roberts 0 313.5 496.1 1106.5 1235.2 1240.4 1240.4 Sherman 0 11572.4 20447.4 44120.8 49226.2 49843.9 49843.9 Wheeler 0 197.5 355.4 763.3 851.1 862.9 862.9 Total 0 71,202 125,497 270,979 302,347 306,086 306,086
5-29

Subchapter 5B April 13, 2015 Water Conservation Draft
Table 5B-8: Estimated Water Savings from the Recommended Combination by County
County Water savings from Recommended Combination (acre-feet/yr)
Baseline 2020 2030 2040 2050 2060 2070
Armstrong 0 206 425 721 800 869 900 Carson 0 3,980 6,910 12,747 14,010 14,774 15,146 Childress 0 351 632 1,100 1,220 1,324 1,378 Collingsworth 0 548 1,037 1,647 1,843 2,104 2,250 Dallam 0 34,218 61,174 106,343 121,011 132,167 140,612 Donley 0 836 1,484 2,436 2,729 3,065 3,259 Gray 0 1,361 2,301 4,216 4,648 4,929 5,078 Hall 0 392 679 1,145 1,280 1,419 1,499 Hansford 0 9,447 17,175 31,242 34,401 36,373 37,260 Hartley 0 29,197 52,161 90,476 103,095 113,047 120,509 Hemphill 0 57 111 174 196 224 239 Hutchinson 0 2,692 4,694 8,578 9,459 10,010 10,281 Lipscomb 0 936 1,702 2,945 3,268 3,555 3,706 Moore 0 13,308 24,120 41,895 47,571 52,037 55,406 Ochiltree 0 4,030 7,195 13,177 14,476 15,292 15,670 Oldham 0 127 360 567 617 694 723 Potter 0 95 209 319 359 413 441 Randall 0 647 1,641 2,637 2,890 3,221 3,356 Roberts 0 435 717 1,339 1,475 1,550 1,590 Sherman 0 16,063 28,329 52,104 57,321 60,415 61,854 Wheeler 0 395 706 1,230 1,364 1,480 1,542 Total 0 119,321 213,762 377,038 424,033 458,962 482,699
5-30

Subchapter 5B April 13, 2015 Water Conservation Draft
Table 5B-9: Estimated Cost for the Recommended Combination by County in the PWPA
County Capital Cost Cost for Recommended Combination ($/yr)
2020 2030 2040 2050 2060 2070
Armstrong $154,200 $3,399 $7,013 $11,897 $13,200 $14,339 $14,850 Carson $2,047,700 $65,670 $114,015 $210,326 $231,165 $243,771 $249,909 Childress $268,700 $5,792 $10,428 $18,150 $20,130 $21,846 $22,737 Collingsworth $659,600 $9,042 $17,111 $27,176 $30,410 $34,716 $37,125 Dallam $13,596,900 $564,597 $1,009,371 $1,754,660 $1,996,682 $2,180,756 $2,320,098 Donley $885,200 $13,794 $24,486 $40,194 $45,029 $50,573 $53,774 Gray $782,700 $22,457 $37,967 $69,564 $76,692 $81,329 $83,787 Hall $372,500 $6,468 $11,204 $18,893 $21,120 $23,414 $24,734 Hansford $4,959,300 $155,876 $283,388 $515,493 $567,617 $600,155 $614,790 Hartley $12,696,300 $481,751 $860,657 $1,492,854 $1,701,068 $1,865,276 $1,988,399 Hemphill $70,100 $941 $1,832 $2,871 $3,234 $3,696 $3,944 Hutchinson $1,470,800 $44,418 $77,451 $141,537 $156,074 $165,165 $169,637 Lipscomb $735,600 $15,444 $28,083 $48,593 $53,922 $58,658 $61,149 Moore $5,258,000 $219,582 $397,980 $691,268 $784,922 $858,611 $914,199 Ochiltree $2,104,300 $66,495 $118,718 $217,421 $238,854 $252,318 $258,555 Oldham $144,700 $2,096 $5,940 $9,356 $10,181 $11,451 $11,930 Potter $126,000 $1,568 $3,449 $5,264 $5,924 $6,815 $7,277 Randall $661,700 $10,676 $27,077 $43,511 $47,685 $53,147 $55,374 Roberts $219,000 $7,178 $11,831 $22,094 $24,338 $25,575 $26,235 Sherman $8,123,100 $265,040 $467,429 $859,716 $945,797 $996,848 $1,020,591 Wheeler $301,500 $6,518 $11,649 $20,295 $22,506 $24,420 $25,443 Total $55,637,900 $1,968,797 $3,527,073 $6,221,127 $6,996,545 $7,572,873 $7,964,534
5-31

Subchapter 5B April 13, 2015 Water Conservation Draft
Table 5B-10: Estimated Water Savings from Weather Modification (Precipitation Enhancement) by County in the PWPA
County Water savings from Precipitation Enhancement (acre-feet/yr)
Baseline 2020 2030 2040 2050 2060 2070
Armstrong 0 402 402 402 402 402 402 Carson 0 4,850 4,850 4,850 4,850 4,850 4,850 Childress 0 0 0 0 0 0 0 Collingsworth 0 0 0 0 0 0 0 Dallam 0 0 0 0 0 0 0 Donley 0 1,866 1,866 1,866 1,866 1,866 1,866 Gray 0 1,858 1,858 1,858 1,858 1,858 1,858 Hall 0 0 0 0 0 0 0 Hansford 0 0 0 0 0 0 0 Hartley 0 0 0 0 0 0 0 Hemphill 0 0 0 0 0 0 0 Hutchinson 0 2,960 2,960 2,960 2,960 2,960 2,960 Lipscomb 0 0 0 0 0 0 0 Moore 0 0 0 0 0 0 0 Ochiltree 0 0 0 0 0 0 0 Oldham 0 0 0 0 0 0 0 Potter 0 216 216 216 216 216 216 Randall 0 0 0 0 0 0 0 Roberts 0 469 469 469 469 469 469 Sherman 0 0 0 0 0 0 0 Wheeler 0 944 944 944 944 944 944 Total 0 13,565 13,565 13,565 13,565 13,565 13,565
5-32

Subchapter 5B April 13, 2015 Water Conservation Draft
5B.2.4 Additional Irrigation Supply from Groundwater Wells
While the PWPG does not recommend new groundwater wells as a strategy to meet future irrigation needs during the planning period because of declining water levels, drilling of new wells is an option for individual producers who have not fully developed their water rights. Approximate cost estimates were developed to determine the expense associated with installing irrigation wells. Table 5B-11 summarizes two scenarios: a pumping rate of less than and greater than 700 gallons per minute.
Table 5B-11: Estimated Costs of Irrigation Wells in the PWPA
Pumping Rate (gpm)
Approximate Well Depth
(ft.)
Approximate Well Casing
Diameter (in.)
Approximate Pumping
Unit Diameter
(in.)
Well Cost Pumping
Equipment Cost
Total Cost
Less than 700 375 12¾ 4 - 6 $33,750 $25,500 $59,250
Greater than 700 500 16 8 $55,000 $54,500 1 $109,500
$55,000 $61,000 2 $116,000 1 Assumes submersible pump and associated equipment 2 Assumes electric turbine and associated equipment
5B.3 Water Conservation Plans
The TCEQ defines water conservation as “a strategy or combination of strategies for reducing the volume of water withdrawn from a water supply source, for reducing the loss or waste of water, for maintaining or improving the efficiency in the use of water, for increasing the recycling and reuse of water, and for preventing the pollution of water.”
The TCEQ requires water conservation plans for all municipal and industrial water users with surface water rights of 1,000 acre-feet per year or more and irrigation water users with surface water rights of 10,000 acre-feet per year or more. Water conservation plans are also required for all water users applying for a State water right, and may also be required for entities seeking State funding for water supply projects. Legislation passed in 2003 requires all conservation plans to specify quantifiable 5-year and 10-year conservation goals and targets. While these goals are not enforceable, they must be identified. In 2007 legislation was passed that requires all public water suppliers with greater than 3,300 connections to submit a conservation plan to the TWDB. All updated water conservation plans were to be submitted to the Executive Director of the TCEQ by May 1, 2014.
In the PWPA, eight water suppliers hold municipal or industrial surface water rights in excess of 1,000 acre-feet per year or have more than 3,300 connections. There are no entities with surface irrigation water rights greater than 10,000 acre-feet per year. Each of these entities is required to develop and submit to
5-33

Subchapter 5B April 13, 2015 Water Conservation Draft
the TCEQ a water conservation plan. Several water users have contracts with regional water providers for water of 1,000 acre-feet per year or more. Presently, these water users are not required to develop water conservation plans unless the user is seeking State funding; however, a wholesale water provider may request that its customers prepare a conservation plan to assist in meeting the goals and targets of the wholesale water provider’s plan. A list of the users in the PWPG required to submit water conservation plans is shown in Table 5B-12.
Table 5B-12: Water Users in the PWPA Required to Prepare Water Conservation Plans
Municipal and Industrial Water Users Irrigation Water Users City of Amarillo None in Region A Canadian River Municipal Water Authority Greenbelt Municipal Water Authority Palo Duro River Authority Borger Canyon Dumas Pampa
There are numerous irrigation users pumping groundwater in excess of 10,000 acre-feet per year and these users are usually regulated through the local GCD which will issue well permits to the irrigators. The GCD is required to submit a groundwater management plan to the TWDB for approval. A groundwater management plan is a 10-year plan that describes a district's groundwater management goals. These goals include providing the most efficient use of groundwater, controlling and preventing waste of groundwater, controlling and preventing subsidence, addressing conjunctive surface water management issues, addressing natural resource issues, addressing drought conditions, and addressing conservation (§356.5 and §356.6, Texas Administrative Code, relating to Management Plan and Plan Submittal, respectively).
To assist entities in the PWPA with developing water conservation plans, model plans for municipal water users (wholesale or retail public water suppliers), industrial users and irrigation districts were developed considering the region’s unique water issues. Each of these model plans address the latest TCEQ requirements and is intended to be modified by each user to best reflect the activities appropriate to the entity. These plans can be accessed through the PWPA website at www.panhandlewater.org. General model water conservation plan forms are also available from TCEQ in Microsoft Word and PDF formats. A printed copy of the form from TCEQ can be obtained by calling TCEQ at 512-239-4691 or by email to [email protected].
The focus of the conservation activities for municipal water users in the PWPA are:
• Education and public awareness programs, • Reduction of unaccounted for water through water audits and maintenance of water systems,
5-34

Subchapter 5B April 13, 2015 Water Conservation Draft
• Water rate structures and ordinances that discourage water waste.
Industrial water users include manufacturing and processing industries as well as smaller local manufacturers. Conservation activities associated with industries are site and industry-specific. Some industries can utilize brackish water supplies or wastewater effluent while others require only potable water. It is important in evaluating conservation strategies for industries to balance the water savings from conservation to economic benefits to the industry and the region.
The focus of the conservation activities for industrial users is:
• Evaluation of water saving equipment and processes, and • Water rate structures that discourage water waste.
5B.4 Other Conservation Recommendations
The PWPG encourages all water user groups to practice advanced conservation efforts to reduce water demand, not only during drought conditions, but as a goal in maintaining future supplies. This includes municipal, industrial and agricultural water users. As appropriate, municipal users should strive to reduce per capita water use to achieve the State-recommended goal of 140 gpcd use. The PWPG recognizes that some cities and rural communities may not achieve this level of reductions, but many communities have the opportunity to increase their water savings.
With irrigated agriculture being the largest water user in the PWPA, this sector has the greatest opportunities for water reductions due to conservation. The plan recommends strategies that would reduce the estimated irrigation water use by 482,699 acre-feet per year by 2070. This represents a reduction of 60 percent of the projected demands. These strategies are specific to region, but there may be additional strategies that are appropriate for selected crop type or irrigation practices. The PWPG supports the implementation of any and all measures that effectively reduce water for agricultural purposes.
The PWPG supports and encourages the collaboration of multiple entities across the region to promote water conservation. This could be accomplished with the assistance of regional organizations, such as the PRPC and GCDs. Consistent messaging is important in continuing to maintain and/or increase conservation levels in the region.
The TWDB provides a significant amount of information and services pertaining to water conservation that can be accessed at:
http://www.twdb.texas.gov/conservation/
5-35

Subchapter 5C April 13, 2015 Water Management Strategies for Wholesale Water Providers Draft
Subchapter 5C Water Management Strategies for Wholesale Water Providers
There are six wholesale water providers located in the PWPA. Of these entities, five are projected to have needs within the planning period: CRMWA, Amarillo, Borger, Cactus and PDRA. The other wholesale provider, Greenbelt MIWA is planning to develop projects to secure additional supplies for its customers. With the on-going drought, the reliability of its current supplies could be further impacted. Discussion of the water needs and recommended water management strategies for each of the wholesale water providers follows.
5C.1 Canadian River Municipal Water Authority (CRMWA)
The CRMWA provides groundwater from Roberts County and surface water from Lake Meredith to users in the PWPA and entities in the Llano Estacado Region. The total available safe supply from the CRMWA system is 69,000 acre-feet per year in 2020, decreasing to 40,700 acre-feet per year by 2070 as groundwater becomes depleted within CRMWA’s current well fields. Current demands on CRMWA are estimated at approximately 100,450 acre-feet per year in 2020 and increase to over 121,630 acre-feet per year by 2070. This results in near-term needs of 31,450 acre-feet per year and long-term needs of about 81,000 acre-feet per year. Table 5C-1 lists the demands by customer, current supplies, and projected needs for CRMWA.
The potentially feasible strategies considered for CRMWA to meet these needs include:
• Conservation of wholesale customers
• Expanded development of Roberts County well field with additional transmission
• Conjunctive use of groundwater with Lake Meredith
• Brush control in Lake Meredith watershed
5-36

Subchapter 5C April 13, 2015 Water Management Strategies for Wholesale Water Providers Draft
Table 5C-1: Summary of Demands, Supplies, and Projected Needs for CRMWA
Customers Demands (ac-ft/yr)
2020 2030 2040 2050 2060 2070 Region A: City of Pampa 1,818 1,827 1,836 4,680 4,680 4,680 City of Borger 7,054 7,091 7,072 7,068 7,064 7,063 City of Amarillo 46,000 50,000 50,000 50,000 50,000 50,000 Region O: City of Lamesa 1,534 1,950 2,300 2,750 2,750 2,750 City of O'Donnell 137 139 142 146 150 153 City of Plainview 2,761 3,000 3,250 3,500 3,500 3,500 City of Levelland 2,301 2,400 2,500 2,588 2,671 2,743 City of Lubbock 35,600 39,000 43,500 47,000 47,000 47,000 City of Slaton 1,405 1,430 1,455 1,479 1,477 1,477 City of Tahoka 460 477 483 496 507 517 City of Brownfield 1,380 1,500 1,600 1,750 1,750 1,750 Total 100,450 108,814 114,138 121,457 121,549 121,633
Sources Current Water Supply (ac-ft/yr)
2020 2030 2040 2050 2060 2070 Lake Meredith 0 0 0 0 0 0 Roberts County Groundwater1 69,000 60,463 55,502 50,483 45,590 40,697 Total Current Supply 69,000 60,463 55,502 50,483 45,590 40,697
Need Need (ac-ft/yr)
Current Customers 31,450 48,351 58,636 70,974 75,959 80,936 1 Groundwater supply over time is based on a 1 MGD reduction per year of well field capacity and a 1.25% peaking factor.
Each of the four strategies identified for CRMWA is recommended for implementation. Conservation measures and associated savings for the wholesale customers that are in the PWPA are discussed in Chapter 5B. The savings associated with customers in Region O (Llano Estacado Region) are discussed in the Llano Estacado water plan and are included in the total wholesale customer conservation savings for CRMWA in Table 5C-2. A brief description of each of the other strategies is presented below.
5C.1.1 Expanded Development of Roberts County Well Field
Due to continued lack of inflow for Lake Meredith, CRMWA is proceeding to expand their groundwater production and delivery capacity. CRMWA holds water rights to 444,833 acres in Roberts and adjacent counties. Presently, only a fraction of these rights are developed. The current capacity of the transmission system (CRMWA I) from the Robert County well field is 65 MGD and CRMWA can deliver up to 69,000 acre-feet per year. The existing well field capacity is 84 MGD, and CRMWA is experiencing a reduction of about 1 MGD per year. This reduction is expected to slow down but over the course of the planning period, CRMWA will need to construct additional wells to replace lost groundwater supplies for the existing transmission system. It will also need to develop additional groundwater supplies and
5-37

Subchapter 5C April 13, 2015 Water Management Strategies for Wholesale Water Providers Draft
transmission capacity from the Roberts County well field to meet its projected needs. CRMWA plans to develop a second pipeline with a capacity of 54 MGD to deliver 48,000 acre-feet per year. This brings the total capacity from the Roberts County well field to 117,000 acre-feet per year, which is the full capacity of its existing Lake Meredith system. It is assumed that a new 67-mile 54 inch pipeline (CRMWA II) would be constructed from Roberts County to the terminal storage reservoir northeast of Amarillo. Infrastructure needed to develop the water and transmission is detailed in the cost estimates in Appendix E.
Time Intended to Complete
Continued expansion of the Robert County well field to fully utilize the existing transmission capacity is needed by 2020 and would be on-going through the planning period. The planning and design of CRMWA II transmission system is expected to begin by 2020 with the transmission system on line by 2024. Additional wells may be needed over time to maintain the full capacities of the system.
Quantity, Reliability and Cost
The total quantity of water provided by this strategy would be 76,000 acre-feet per year. This includes the development of 28,000 acre-feet per year of new groundwater supply for the existing pipeline and an additional 48,000 acre-feet per year for the new pipeline. Reliability of Ogallala supplies is moderate to high. There are significant quantities of untapped water supplies in Roberts County, but the availability of this water also depends on other water users. Costs to expand the Roberts County well field is estimated at $275 million.
Environmental Issues
The environmental issues associated with this water management strategy are for pipeline rights-of-way and sites for pumping plants and storage facilities. Since routes and sites can be selected to avoid sensitive wildlife habitat and cultural resources, there would be very little, if any, environmental issues of significant concern.
Impact on Water Resources and Other Management Strategies
The increased demands on the Ogallala will continue to deplete the storage in the aquifer. There are other users that may compete for groundwater supplies, but there is sufficient water in Roberts County to support these demands.
Impact on Agriculture and Natural Resources
The expansion of the Roberts County well field and maintenance of the existing well field are expected to have minimal impacts on the agriculture and other natural resources. A small amount of agricultural lands may be affected by the transmission system associated with the well field, depending on the final transmission route.
5-38

Subchapter 5C April 13, 2015 Water Management Strategies for Wholesale Water Providers Draft
Other Relevant Factors
There are no other identified relevant factors.
5C.1.2 Conjunctive Use of Roberts County Well Field and Lake Meredith
With the on-going drought, the reliability of water from Lake Meredith has been severely impacted. There were several years in which CRMWA used very little to no water from this source. For planning purposes, the reliable supply is assumed to be zero. However, when there are inflows to the lake and water levels recover, CRMWA does plan to utilize this source for water supply to reduce groundwater pumping. Depending upon the ultimate end user, water from the two sources may need to be blended to meet water quality standards. Since both systems are currently in place, there are no infrastructure improvements associated with this strategy.
Time Intended to Complete
This strategy would be implemented immediately provided there is sufficient water in Lake Meredith to withdraw. Due to the uncertainty of inflows to Lake Meredith and the nature of conjunctive use, the conjunctive use operations may include extended periods of only groundwater use.
Quantity, Reliability and Cost
For purposes of planning, it is assumed that up to 40,000 acre-feet of surface water would be used conjunctively with the Roberts County groundwater in any one year. On a decadal average, the amount of additional water is estimated to be 10,000 acre-feet per year. The reliability of this supply is moderate if it is operated conjunctively with CRMWA’s groundwater supplies. There are no capital costs associated with this strategy.
Environmental Issues
Potential environmental issues may be associated with reduced lake levels. However, CRMWA does not intend to operate the lake when levels are very low; therefore, environmental issues are expected to be low.
Impact on Water Resources and Other Management Strategies
This strategy would help prolong CRMWA’s groundwater supplies with the use of renewable surface water. It also would provide a beneficial use of water that otherwise would have been lost to evaporation. This strategy would reduce pumping costs associated with the Expanded Development of Roberts County Well Field strategy.
Impact on Agriculture and Natural Resources
This strategy does not have any impacts to agriculture or natural resources.
5-39

Subchapter 5C April 13, 2015 Water Management Strategies for Wholesale Water Providers Draft
Other Relevant Factors
There are no other identified relevant factors.
5C.1.3 Brush Control in Lake Meredith Watershed
CRMWA has an active salt cedar control program in the Lake Meredith watershed. The purpose of the program is to increase flow in the Canadian River, improve water quality and improve the habitat for the federally listed Arkansas River Shiner, which is known to inhabit this area. CRMWA has treated approximately 27,000 acres of salt cedar, which accounts for about 95 percent of the total salt cedar in the Lake Meredith watershed. Since 2004, nearly $3.5 million has been spent with on brush control, with CRMWA contributing most of the funds. The salt cedar beetle was introduced into the Lake Meredith watershed several years ago and is becoming established. And could help control re-infestation. However, retreatment will likely still be needed. CRMWA is now in the on-going maintenance phase, which requires retreating of areas to control the growth and potential re-infestation of salt cedar. This strategy recommends that CRMWA continue with its program with support from the State Water Supply Enhancement Program to control salt cedar in the Lake Meredith watershed.
Time Intended to Complete
This strategy is on-going and would be implemented throughout the planning period.
Quantity, Reliability and Cost
The amount of water developed from brush control is difficult to estimate since there are so many factors that affect reservoir inflows. For this plan, it is assumed that the water made available from Lake Meredith in the Conjunctive Use strategy includes water made available from brush control. Therefore, the total supply from brush control would range between 0 and less than 10,000 acre-feet per year. The reliability during drought is low. The annual costs are estimated at $200,000.
Environmental Issues
There is concern about the removal of brush for wildlife. However, with increased runoff to streams and lakes, this strategy would provide additional water for wildlife.
Impact on Water Resources and Other Management Strategies
This strategy should have a positive impact to Lake Meredith and the Conjunctive Use strategy.
Impact on Agriculture and Natural Resources
The removal of invasive brush will allow for the development of native grasslands and other agricultural uses. It should have a positive impact on natural resources.
5-40

Subchapter 5C April 13, 2015 Water Management Strategies for Wholesale Water Providers Draft
Other Relevant Factors
There are no other identified relevant factors.
5C.1.4 Summary for CRMWA
The recommended strategies for CRMWA would provide up to 88,000 acre-feet per year. CRMWA is planning to initiate well capacity replacement in 2020 and transmission expansion by 2024. Based on this timing, CRMWA may not be able to fully meet contractual demands until after the CRMWA II pipeline from Roberts County well field is completed. The recommended strategies and quantities are shown in Table 5C-2. The costs for the strategies are summarized in Table 5C-3.
Table 5C-2: Recommended Water Management Strategies for CRMWA (ac-ft/yr)
2020 2030 2040 2050 2060 2070
Need 31,450 48,351 58,636 70,974 75,959 80,936
Recommended Strategies 2020 2030 2040 2050 2060 2070
Region A Customer Conservation 1,377 1,526 1,664 1,814 1,973 2,141 Region O Customer Conservation
Replace Well Capacity for CRMWA I1 0 9,000 13,000 19,000 23,000 28,000
Expand GW and delivery capacity (CRMWA II) 1 48,000 48,000 48,000 48,000 48,000
Conjunctive Use 10,000 10,000 10,000 10,000 10,000 10,000
Brush Control2 0 0 0 0 0 0
Total from Strategies 11,377 68,526 72,664 78,814 82,973 88,141 1 This is part of the Expanded Development of Roberts County Well Field strategy. 2 Supply from Brush Control assumed to be included with Conjunctive Use.
Table 5C-3: Summary of Costs for CRMWA’s Recommended Strategies
Recommended Strategies Capital Cost
Annual Costs ($ Million)
2020 2030 2040 2050 2060 2070 Replace Well Capacity $24.80 - $1.68 $1.68 $4.31 $4.31 $2.93 Expand GW and delivery capacity (CRMWA II) $250.30 - $32.47 $32.47 $11.52 $11.52 $11.52
Conjunctive Use - - - - - - - Brush Control - $0.20 $0.20 $0.20 $0.20 $0.20 $0.20 Total $275.10 $0.20 $34.35 $34.35 $16.03 $16.03 $14.65
5-41

Subchapter 5C April 13, 2015 Water Management Strategies for Wholesale Water Providers Draft
5C.2 City of Amarillo
The City of Amarillo provides municipal water to city customers in Randall and Potter Counties, the City of Canyon, and Palo Duro State Park. It also provides most of the manufacturing water needs in Potter County with a small amount to manufacturing demands in Randall County. The City also has a contract with Xcel Energy for treated wastewater effluent.
Amarillo owns water rights in Randall, Potter, Carson, Deaf Smith, Lipscomb, Ochiltree and Roberts County, but only a portion of these groundwater rights are fully developed. In addition, the City has a contract with CRMWA for water from Lake Meredith and Roberts County groundwater. The current delivery capacity for water from CRMWA is 42,987 acre-feet of year of water. The total estimated current supply for the City is 50,807 acre-feet per year of potable water and 25,387 acre-feet of reuse supply. Potable water supplies are projected to decrease to 27,923 acre-feet per year as groundwater supplies decline. Reuse is expected is increase over time and is supplied to Xcel Energy for steam electric power use.
Table 5C-4 lists the projected demands by customer, the current sources of supply available, and the projected water needs. The projected needs are expected to begin in 2020 with a shortfall of about 5,300 acre-feet per year and increasing to nearly 56,000 acre-feet per year by 2070. Some of this need will be met when CRMWA develops additional groundwater in Roberts County to fully meet Amarillo’s contractual demands. However, the City would still need to develop about 22,000 acre-feet of new water.
Table 5C-4: Summary of Demands, Supplies, and Projected Needs for Amarillo
Customers Demands (ac-ft/yr)
2020 2030 2040 2050 2060 2070 City of Amarillo 47,731 52,110 56,810 61,860 67,631 73,739 Manufacturing - Potter County 6,799 7,323 7,834 8,276 8,884 9,535 City of Canyon 1,000 1,000 1,000 1,000 0 0 Manufacturing - Randall County 550 550 550 550 550 550 Palo Duro State Park 25 25 25 25 25 25 Steam Electric Power–Potter County 25,387 26,804 28,408 30,011 34,115 37,669 Total Demand 81,492 87,812 94,627 101,722 111,205 121,518
Sources Current Water Supply (ac-ft/yr)
2020 2030 2040 2050 2060 2070 Ogallala - Randall County 2,263 1,735 1,372 1,100 890 680 Ogallala - Potter County 9,467 7,388 7,123 6,735 6,199 5,664 Ogallala - Carson County 10,948 9,378 7,882 6,669 5,760 4,850 Ogallala - Roberts County (CRMWA) 28,029 27,841 24,313 20,782 18,754 16,729 Meredith (CRMWA) 0 0 0 0 0 0 Ogallala - Deaf Smith 100 100 100 100 50 0 Reuse 25,387 26,804 28,408 30,011 34,115 37,669 Total Current Supply (W/O Reuse) 50,807 46,442 40,791 35,386 31,653 27,923 Need 5,298 14,566 25,428 36,325 45,436 55,926
5-42

Subchapter 5C April 13, 2015 Water Management Strategies for Wholesale Water Providers Draft
The recommended water management strategies for Amarillo include conservation strategies, purchase of additional supply from CRMWA, expansion of their Potter and Carson County well fields, and development of the Roberts County Well Field. The city is considering direct reuse as an alternate strategy.
Recommended Strategies
• Implement conservation strategies (See Section 5B.1)
• Obtain contractual supplies from CRMWA (this is evaluated with CRMWA strategies)
• Develop Phase 2 of the Potter County Well Field (Ogallala aquifer)
• Purchase and Develop Additional Groundwater in Carson County
• Develop Roberts County Well Field (Ogallala aquifer)
Alternate Strategies
• Develop Direct Potable Reuse Supply
5C.2.1 Develop Phase II of the Potter County Well Field (Ogallala aquifer)
The City of Amarillo has unused groundwater rights in the Ogallala aquifer in Potter County that were not developed as part of the Phase 1 well field. However, due to limitation of the MAG in Potter County, the supply from this strategy is also limited. For the purposes of this plan, 6,000 acre-feet per year is available in 2020, decreasing to 4,000 acre-feet per year by 2070. If the MAG values are changed in the future water plans, the quantities available to Amarillo may increase. This well field strategy assumes that approximately 12 new wells will be drilled in Potter County. The wells will be drilled to a depth of 600 feet and produce approximately 850 gallons per minute. This project includes 40 miles of well field piping ranging from 8- to 54-inches in diameter, and 5-miles of 54-inch pipeline to transport the water to existing infrastructure. Additional pumping capacity and storage are also included. These infrastructure improvements were provided by Amarillo and include the infrastructure to develop up to 15 MGD of additional supply.
Time Intended to Complete
Phase II of the Potter County Well Field is anticipated to be online by 2020.
Quantity, Reliability and Cost
Approximately 6,000 acre-feet of additional water will be obtained from the Potter County well field in 2020 declining to 4,000 acre-feet by 2070. In Potter County, the reliability of Ogallala supplies are moderate to low since there is significant use of this supply. In the vicinity of Amarillo’s well field, the reliability should be moderate as determined by previous studies. The total capital cost for the Potter County Phase II well field is $53.4 million.
5-43

Subchapter 5C April 13, 2015 Water Management Strategies for Wholesale Water Providers Draft
Environmental Issues
The environmental impacts from groundwater development are expected to be low. Once the specific locations of additional wells and alignments associated with infrastructure are identified, a detailed evaluation to determine environmental impacts, if any, will need to be performed. Since this well field is connecting to existing transmission infrastructure there is likely to be very little, if any, environmental issues of concern.
Impact on Water Resources and Other Management Strategies
The increased demands on the Ogallala will continue to deplete the storage in the aquifer. There are other users competing for groundwater supplies in Potter County, and competition may increase as the supply is depleted. This strategy utilized most of undeveloped Ogallala groundwater, such that there is little available supply for other strategies.
Impact on Agriculture and Natural Resources
The increased demands on the Ogallala will continue to deplete the storage in the aquifer. The development of the proposed well fields are expected to have minimal impact on the agriculture and other natural resources since Amarillo already owns the water rights. A small amount of agricultural lands may be affected by the transmission system associated with the well field, depending on the final transmission route.
Other Relevant Factors
There are no other identified relevant factors.
5C.2.2 Purchase and Develop Additional Groundwater in Carson County
The City of Amarillo has an existing well field in the Ogallala aquifer in Carson County. The city plans to purchase and develop additional water rights near the existing well field to maintain the current capacity of water source. While Amarillo intends to develop this strategy over time with the addition of one or two wells every couple of years, this strategy is formulated on the ultimate development. It is assumed that Amarillo could develop up to 10 MGD of additional water supply over time. To provide this quantity of water, it is assumed that approximately 18 new wells will be drilled in Carson County. The wells will be drilled to a depth of 800 feet and produce approximately 750 gallons per minute. This project includes 95,000 feet of well field piping ranging from 8- to 30-inches in diameter. It is assumed that an additional transmission pipeline will be needed to move the water the city’s existing infrastructure. For this plan, 5-miles of 42-inch pipeline and associated pumping facilities upgrades are included in the cost estimates.
Time Intended to Complete
This project was assumed to be online in 2040.
5-44

Subchapter 5C April 13, 2015 Water Management Strategies for Wholesale Water Providers Draft
Quantity, Reliability and Cost
Approximately 11,200 acre-feet per year of additional water will be obtained from the Carson County well field. In Carson County, the reliability of Ogallala supplies is moderate since there is currently competition for this supply with irrigators. The total capital cost for the Carson County well field is $37.5 million.
Environmental Issues
The environmental impacts from groundwater development are expected to be low. Once the specific locations of additional wells and alignments associated with infrastructure are identified, a detailed evaluation to determine environmental impacts, if any, will need to be performed.
Impact on Water Resources and Other Management Strategies
The increased demands on the Ogallala will continue to deplete the storage in the aquifer. There are other users that may compete for groundwater supplies in Carson County including irrigation users that may be impacted by the development of this well field
Impact on Agriculture and Natural Resources
The development of the proposed well fields are expected to have low impact on the agriculture and other natural resources. A small amount of agricultural lands may be affected by the transmission system associated with the well field, depending on the final transmission route.
Other Relevant Factors
There are no other identified relevant factors.
5C.2.3 Develop Roberts County Well Field (Ogallala aquifer)
The City of Amarillo has unused groundwater rights in the Ogallala aquifer in Roberts County. These rights are located the furthest from the city and will likely be developed after sources closer to Amarillo. As more supplies are needed, the city will develop its groundwater rights in Roberts County. It is assumed that the Roberts County strategy will be implemented in two phases, with Phase 1 being developed by 2070. This well field strategy assumes that approximately 18 new wells will be drilled in southeastern Roberts County. The wells will be drilled to a depth of 600 feet and produce approximately 800 gallons per minute. This project includes 18 miles of well field piping ranging from 12- to 42-inches in diameter, and 75-miles of 42-inch pipeline to transport the water from Roberts County to Amarillo.
Time Intended to Complete
The Roberts County well field will be developed as additional supplies are needed. This is expected to occur by 2070.
5-45

Subchapter 5C April 13, 2015 Water Management Strategies for Wholesale Water Providers Draft
Quantity, Reliability and Cost
Approximately 11,200 acre-feet per year of additional water will be obtained from the Roberts County well field. In Roberts County, the reliability of Ogallala supplies is moderate to high since there are large quantities of undeveloped supply in this county, though competing interests may be present. The total capital cost for the Roberts County well field is $170 million. These costs could potentially be less if Amarillo and CRMWA jointly develop additional transmission capacity from Roberts County.
Environmental Issues
The environmental impacts from groundwater development are expected to be low. Once the specific locations of additional wells and alignments associated with infrastructure are identified, a detailed evaluation to determine environmental impacts, if any, will need to be performed.
Impact on Water Resources and Other Management Strategies
The increased demands on the Ogallala will continue to deplete the storage in the aquifer. There are other users that may compete for groundwater supplies, but there is sufficient water in Roberts County to support these demands.
Impact on Agriculture and Natural Resources
The development of the proposed well fields are expected to have minimal impact on the agriculture and other natural resources. A small amount of agricultural lands may be affected by the transmission system associated with the well field, depending on the final transmission route.
Other Relevant Factors
There are no other identified relevant factors.
5C.2.4 Direct Potable Reuse
The City of Amarillo is considering a project to treat their wastewater effluent to potable water status. This is an alternative strategy for the City of Amarillo. The strategy would include treating up to 8 MGD at the existing wastewater treatment plan with pre-treatment and reverse osmosis to produce 5.45 MGD of finished water. The water would then be transported approximately 7 miles to the balancing reservoir. The reject water would be discharged by a 7 mile pipeline to the Prairie Dog Town Fork of the Red River below.
Time Intended to Complete
This project could be permitted and constructed by 2030.
5-46

Subchapter 5C April 13, 2015 Water Management Strategies for Wholesale Water Providers Draft
Quantity, Reliability and Cost
Direct potable reuse would have moderate to high reliability since Amarillo is producing a greater amount of wastewater than necessary for this strategy. The capital cost for this project is approximately $63.6 million. If Amarillo is not able to discharge to a stream the cost for deep well injection could substantially increase the capital cost.
Environmental Issues
The greatest potential environmental impact is the quality of the discharge water. An initial review of the TDS stream standard for the Upper Prairie Dog Town Fork of the Red River is 2,000 mg/L. Additional studies would need to be conducted to determine the feasibility of discharging to the Prairie Dog Town Fork of the Red River.
Impact on Water Resources and Other Management Strategies
Amarillo is currently providing a significant amount of their direct reuse for steam electric cooling. Direct potable reuse could impact the amount of reuse available for steam electric power in Potter County. Also, there is a potential strategy to sell reuse water to manufacturing in Potter County. This strategy could impact the supplies available to Potter County manufacturing.
Impact on Agriculture and Natural Resources
Discharges to the Prairie Dog Town Fork of the Red River will need to be further evaluated to determine the impact to natural resources
Other Relevant Factors
This strategy would require extensive coordination with the TCEQ to obtain the necessary permits for use and discharge.
5C.2.5 Summary of Recommended Strategies for Amarillo
The recommended strategies for Amarillo would provide up to 62,000 acre-feet per year and fully meet the City’s needs. Amarillo is planning to initiate Phase II of their Potter County Well field by 2020. The recommended strategies and quantities are shown in Table 5C-5. The total capital cost for Amarillo is $261 million and the annual costs for the strategies are summarized in Table 5C-6.
5-47

Subchapter 5C April 13, 2015 Water Management Strategies for Wholesale Water Providers Draft
Table 5C-5: Recommended Water Management Strategies for Amarillo (ac-ft/yr)
2020 2030 2040 2050 2060 2070 Need 6,923 16,003 25,428 36,325 45,436 55,926
Recommended Strategies Supply from Strategy
2020 2030 2040 2050 2060 2070 Conservation 1,734 1,935 2,122 2,316 2,534 2,762 Supplies from CRMWA 19,596 23,596 25,687 29,218 31,246 33,271 Potter County Well Field – Phase 2 6,000 5,600 5,200 4,800 4,400 4,000 Carson County Well Field 11,200 11,200 11,200 11,200 Roberts County Well Field 11,200 Total from Strategies 27,330 31,131 44,209 47,534 49,380 62,433
Alternate Strategy 2020 2030 2040 2050 2060 2070 Direct Reuse 0 6,100 6,100 6,100 6,100 6,100
Table 5C-6: Summary of Costs for Recommended Strategies for Amarillo
Recommended Strategies Capital Cost Annual Costs ($ Million)
2020 2030 2040 2050 2060 2070
Conservation - $0.43 $0.50 $0.55 $0.59 $0.64 $0.69 Supplies from CRMWA1 - - - - - - - Potter County Well Field Phase 2 $53.4 $5.64 $5.64 $1.18 $1.18 $1.18 $1.18 Carson County Well Field $37.5 $4.94 $4.94 $1.80 $1.80 Roberts County Well Field $170.2 $17.2 Total from Strategies $261.10 $6.07 $6.14 $6.67 $6.71 $3.62 $20.87
Alternate Strategy Capital Cost Annual Costs ($ Million)
2020 2030 2040 2050 2060 2070
Direct Reuse $63.57 - $8.34 $8.34 $3.02 $3.02 $3.02 1 Purchase of additional supplies from CRMWA does not include additional infrastructure and the purchase costs are already negotiated
5-48

Subchapter 5C April 13, 2015 Water Management Strategies for Wholesale Water Providers Draft
5C.3 City of Borger
The City of Borger provides water to customers in Hutchinson County, and Hutchinson and Carson County manufacturing. The City receives water from CRMWA and operates wells in the Ogallala aquifer in Hutchison and Carson Counties. The City has a complex arrangement of trading water with several industries to most efficiently supply water to its customers. The City also sells treated wastewater to its manufacturing customers. Table 5C-7 lists the projected demands and supplies for the City of Borger and its customers. Borger need to develop additional supplies to meet needs.
Table 5C-7: Summary of Demands, Supplies and Needs for the City of Borger
Customers Demands (ac-ft/yr)
2020 2030 2040 2050 2060 2070 Borger 3,215 3,254 3,234 3,229 3,225 3,224 Manufacturing - Hutchinson Co. 6,337 6,707 7,062 7,371 7,885 8,435 Manufacturing - Carson Co. 450 450 450 450 450 450 Hutchinson County-other 56 57 57 55 52 49 Total Demand 10,058 10,468 10,803 11,105 11,612 12,158
Sources Current Water Supply (ac-ft/yr)
2010 2020 2030 2040 2050 2060 Ogallala - Hutchinson Co. 4,667 3,802 3,249 2,803 2,434 2,064 Ogallala - Carson Co. 561 457 391 337 293 248 Reuse 1,045 1,045 1,045 1,045 1,045 1,045 Lake Meredith (CRMWA) 0 0 0 0 0 0 Ogallala - Roberts Co. 3,829 3,829 3,439 2,938 2,650 2,363 Total Current Supply 10,102 9,133 8,124 7,123 6,422 5,720
Need 177 1,557 2,679 3,982 5,190 6,438
The recommended strategies include implementing conservation measures, obtaining contractual supplies from CRMWA and developing additional groundwater from the Ogallala in Hutchinson County. Table 5C-8 shows the amount of water supply associated with each of the recommended strategies. The yield of the City of Borger’s well field is expected to decline over time. It is anticipated that Borger will continue to operate the groundwater system at levels similar to current pumpage. The City is currently developing additional groundwater in Hutchinson County and expects to have these supplies online in 2015.
Recommended Strategies
• Implement conservation strategies (See Section 5B.1)
• Obtain contractual supplies from CRMWA (this is evaluated with CRMWA strategies)
• Develop additional groundwater well (Ogallala aquifer)
5-49

Subchapter 5C April 13, 2015 Water Management Strategies for Wholesale Water Providers Draft
After the City of Borger implements conservation and receives its full contracted amount of water from CRMWA, the City would need to develop approximately 6,000 acre-feet of water. This is expected to come from new and expanded groundwater sources.
5C.3.1 Develop additional groundwater well (Ogallala aquifer)
The City of Borger has purchased water rights for the Ogallala aquifer in Hutchinson County. This strategy includes drilling 13 groundwater wells to a depth of 500 feet with a capacity of 600 gpm. The infrastructure includes 10 miles of 20-inch pipeline to transport the water to the City of Borger. The City currently has sufficient treatment capacity to treat the annual supply of 6,000 acre-feet.
Time Intended to Complete
The City has been actively developing a new well field southwest of the current well field since 2012. Production wells, pipelines, pumps, and storage facilities have been constructed and the project should be on-line in 2015.
Quantity, Reliability and Cost
Approximately 6,000 acre-feet per year of additional water will be obtained from the Hutchinson County well field. Reliability of groundwater in Hutchinson County is moderate to high, depending on location and competing interests. The capital costs for expanding the Hutchinson County well field are estimated at $26.1 million. Actual costs may differ.
Environmental Issues
The environmental impacts from groundwater development are expected to be low. The project is nearly complete.
Impact on Water Resources and Other Management Strategies
The increased demands on the Ogallala will continue to deplete the storage in the aquifer. There are other users that may compete for groundwater supplies, but there is sufficient water in Hutchinson County to support these demands.
Impact on Agriculture and Natural Resources
The development of the proposed well fields are expected to have minimal impact on the agriculture and other natural resources. A small amount of agricultural lands may be affected by the transmission system associated with the well field, depending on the final transmission route.
Other Relevant Factors
There are no other identified relevant factors.
5-50

Subchapter 5C April 13, 2015 Water Management Strategies for Wholesale Water Providers Draft
5C.3.2 Summary of Recommended Strategies for Borger
The recommended strategies for the City of Borger would provide up to 10,806 acre-feet per year by 2070. The City of Borger has initiated development of their new well field to be completed by 2015. With the ability to purchase additional water from CRMWA, the City of Borger should be able to fully meet demands once the CRMWA II pipeline from Roberts County well field is completed. The recommended strategies and quantities are shown in Table 5C-8. The costs for the strategies are summarized in Table 5C-9.
Table 5C-8: Recommended Strategies for Borger (ac-ft/yr)
2020 2030 2040 2050 2060 2070
Need 177 1,557 2,679 3,982 5,190 6,438
Recommended Strategies 2020 2030 2040 2050 2060 2070
Conservation 104 107 106 106 106 106 Supplies from CRMWA 3,447 3,484 3,633 4,130 4,414 4,700 Additional Ogallala – Hutchinson Co. 6,000 6,000 6,000 6,000 6,000 6,000 Total from Strategies 9,551 9,591 9,739 10,236 10,520 10,806
Table 5C-9: Summary of Costs for Recommended Strategies for Borger
Recommended Strategies Capital Cost (millions)
Annual Costs ($ Million) 2020 2030 2040 2050 2060 2070
Conservation - $0.04 $0.04 $0.04 $0.04 $0.04 $0.04 Supplies from CRMWA1 - - - - - - - Additional Ogallala – Hutchinson Co. $26.07 $3.12 $3.12 $0.95 $0.95 $0.95 $0.95
Total from Strategies $26.07 $3.2 $3.2 $1.0 $1.0 $1.0 $1.0 1 Purchase of additional supplies from CRMWA does not include additional infrastructure and the purchase costs are already negotiated
5-51

Subchapter 5C April 13, 2015 Water Management Strategies for Wholesale Water Providers Draft
5C.4 City of Cactus
The City of Cactus provides water to municipal and manufacturing customers in Moore County. Cactus currently obtains all of its supplies from the Ogallala aquifer in Moore County. Cactus is also a member of the Palo Duro River Authority. Table 5C-10 lists the projected demands by customer, current supplies, and recommended strategies for Cactus to meet the projected water needs.
Table 5C-10: Summary of Demands, Supplies, and Needs for the City of Cactus
Customers
Demands (ac-ft/yr) 2020 2030 2040 2050 2060 2070
City of Cactus 985 1108 1242 1382 1532 1686 Moore County-Other 98 108 119 132 146 160 Moore County Manufacturing 3,168 3,342 3,513 3,664 3,913 4,178
Total Demand 4,251 4,558 4,874 5,178 5,591 6,024
Sources
Current Water Supply (ac-ft/yr)
2020 2030 2040 2050 2060 2070 Ogallala - Moore County 1,733 1,359 1,053 794 677 559 Total Current Supply 1,733 1,359 1,053 794 677 559
Need 2,518 3,199 3,821 4,384 4,914 5,465
The recommended strategies for the City of Cactus include water conservation and the development of new wells in the Ogallala Aquifer in Moore County. At this time Palo Duro reservoir is considered an alternative strategy
Recommended Strategies
• Implement conservation strategies (see Section 5B.1)
• Develop new wells in the Ogallala aquifer in Moore County
Alternate Strategies
• Palo Duro Reservoir Transmission System
5C.4.1 Develop new wells in the Ogallala aquifer in Moore County
This strategy includes developing new groundwater from the Ogallala aquifer in northwest Moore County with 8 new wells producing approximately 850 gpm at a depth of 600 feet. The location of the new well field is unknown. For planning purposes, this strategy assumes 3 miles of 24-inch pipeline to connect to existing infrastructure.
5-52

Subchapter 5C April 13, 2015 Water Management Strategies for Wholesale Water Providers Draft
Time Intended to Complete
Cactus will need to develop approximately 2,500 acre-feet of additional supplies by 2020 increasing to 5,500 by 2070.
Quantity, Reliability and Cost
The quantity of water should be sufficient to meet the city’s needs. Reliability of Ogallala supply is low to moderate since the aquifer is heavily used and availability depends on other water users. In order to obtain this quantity of water, agricultural producers would need to implement conservation measures. Otherwise there is insufficient quantity of water from this strategy. The capital cost for new wells is $18.2 million.
Environmental Issues
The environmental impacts from conservation and groundwater development are expected to be low. Once the specific locations of additional wells and alignments associated with infrastructure are identified, a detailed evaluation to determine environmental impacts, if any, will need to be performed.
Impact on Water Resources and Other Management Strategies
The increased demands on the Ogallala will continue to deplete the storage in the aquifer. To prolong the life of the Ogallala, other users will need to reduce their demands. This strategy may impact other groundwater development strategies in Moore County, as competition for available water supplies increase.
Impact on Agriculture and Natural Resources
The recommended strategies are expected to have moderate impact on the agriculture and other natural resources. This strategy may reduce the irrigated acreage for farming as additional water rights acreage is purchased. This acreage could be used for dry land farming if needed, but may require crop changes.
Other Relevant Factors
There are no other identified relevant factors.
5C.4.2 Palo Duro Reservoir
Cactus is one of the six member cities of the Palo Duro River Authority. The project would involve a transmission system to connect the six member cities to the reservoir. Cactus would be responsible for a share of the cost necessary to connect the City of Cactus and not the whole system. This strategy is evaluated in Section 5C.6 for PDRA.
5-53

Subchapter 5C April 13, 2015 Water Management Strategies for Wholesale Water Providers Draft
5C.4.3 Summary of Recommended Strategies for Cactus
Recommended Strategies
The City of Cactus is expected to experience needs in 2020 of 2,500 acre-feet increasing to over 5,400 acre-feet by 2070. The recommended strategies of water conservation and development of a new well field in the Ogallala aquifer will be needed to meet these needs. Conservation is anticipated to provide approximately 50 acre-feet per year and the well field is sized to provide 5,500 acre-feet as shown in Table 5C-11. The total capital cost for the recommended strategies as shown in Table 5C-12 is $18.2 million.
Alternative Strategy
As a member of the PDRA, Cactus is interested in developing a regional transmission system to use water from Palo Duro Reservoir. The Palo Duro Reservoir transmission project is an alternative strategy for Cactus. The project would have very little impact on the environment, agricultural or other natural resources. Once the pipeline route is established, a more detailed analysis of the impacts should be considered. No interbasin transfer permits would be required for the Palo Duro transmission project. The use of this supply might decrease lake levels and impact recreation uses on the lake from time to time. No other impacts are expected from this project. Cactus is expected to have a capital cost of $61.9 million associated with their portion of the project.
Table 5C-11: Recommended Water Management Strategies for Cactus (ac-ft/yr)
2020 2030 2040 2050 2060 2070
Need 2,518 3,199 3,821 4,384 4,914 5,465
Recommended Strategies Supply from Strategy
2020 2030 2040 2050 2060 2070
Conservation 32 36 41 45 50 55
New Well Field -Ogallala Aquifer 5,500 5,500 5,500 5,500 5,500 5,500
Total from Strategies 5,532 5,536 5,541 5,545 5,550 5,555
Alternate Strategy 2020 2030 2040 2050 2060 2070
Lake Palo Duro Project 0 0 1,744 1,744 1,744 1,744
Table 5C-12: Summary of Costs for Recommended Strategies
Recommended Strategies Capital Cost
Annual Costs ($ Million) 2020 2030 2040 2050 2060 2070
Conservation - $0.02 $0.02 $0.02 $0.02 $0.02 $0.03 New Well Field -Ogallala Aquifer $18.2 $2.31 $2.31 $0.8 $0.8 $0.8 $0.8
Total from Strategies $0.00 $0.31 $0.31 $2.12 $2.12 $2.12 $2.12
5-54

Subchapter 5C April 13, 2015 Water Management Strategies for Wholesale Water Providers Draft
Alternate Strategy: Capital Cost
Annual Costs ($ Million) 2020 2030 2040 2050 2060 2070
Lake Palo Duro Project $66.7 - $7.07 $7.07 $1.49 $1.49 $1.49
5-55

Subchapter 5C April 13, 2015 Water Management Strategies for Wholesale Water Providers Draft
5C.5 Greenbelt Municipal and Industrial Water Authority
Greenbelt Municipal and Industrial Water Authority (Greenbelt MIWA) owns and operates Greenbelt Reservoir on the Salt Fork of the Red River. The MIWA also recently developed local groundwater supplies from the Ogallala aquifer. The Greenbelt MIWA is located in Donley County and provides water to local municipalities through an extensive delivery system, including a 121-mile aqueduct. There are five member cities, including Clarendon, Hedley, and Childress in the PWPA and Quanah and Crowell in the Region B planning area. The Red River Authority is a non-voting member of the Greenbelt MIWA.
Greenbelt MIWA’s primary water source is Greenbelt Reservoir. The estimated reliable supply from the reservoir is about 3,850 acre-feet per year in 2020 and declining to 3,440 acre-feet per year over the planning period. Groundwater supplies are estimated 1,900 acre-feet per year and are expected to decline to about half of this amount by 2070. Current projected demands on the MIWA are shown in Table 5C-13 and are not expected to exceed 3,700 acre-feet per year over the planning period. Considering both the reservoir supplies and local groundwater supplies, Greenbelt MIWA is not expected to have any water Needs during the planning period.
Table 5C-13: Summary of Demands and Supplies for the Greenbelt MIWA
Customers Demands (ac-ft/yr) 2020 2030 2040 2050 2060 2070
City of Childress 1,624 1,658 1,686 1,722 1,768 1,814 City of Chillicothe 65 63 60 61 62 62 City of Clarendon 378 369 361 356 356 356 City of Crowell 138 134 132 131 131 131 City of Memphis 100 100 100 100 100 100 Childress County-Other 178 184 189 194 200 204 Donley County-Other 95 95 95 95 95 95 Foard County-Other 50 50 50 50 50 50 Hall County-Other 92 92 92 92 92 92 Hardeman County-Other 60 60 60 60 60 60 Hardeman County Manufacturing 276 294 313 332 332 332 City of Quanah 397 391 388 394 397 400 TOTAL 3,453 3,490 3,526 3,587 3,643 3,696
Sources Supply (ac-ft/yr) 2010 2020 2030 2040 2050 2060
Ogallala - Donley County 1,900 1,615 1,373 1,167 992 843 Greenbelt Reservoir 3,850 3,768 3,686 3,604 3,522 3,440 Total 5,750 5,383 5,059 4,771 4,514 4,283 Surplus or (Need) 2,297 1,893 1,533 1,184 871 587
While the projections indicate Greenbelt MIWA can meet its projected demands, there are concerns regarding the reliability of the surface water supplies and the long-term reliability of the local
5-56

Subchapter 5C April 13, 2015 Water Management Strategies for Wholesale Water Providers Draft
groundwater. Greenbelt Reservoir is in current drought of record conditions. As the drought continues, the reliable supply may decrease. The on-going drought also increases the competition for local groundwater from nearby irrigators. With these uncertainties, Greenbelt is pursuing additional groundwater in northern Donley County. This additional supply will provide additional reliability to the Greenbelt MIWA’s system. The recommended strategies for Greenbelt MIWA are shown below. Conservation measures and associated savings for the wholesale customers of the MIWA are discussed in Chapter 5B.
Recommended strategies
• Conservation of wholesale customers
• Develop additional supplies from the Ogallala Aquifer in Donley County
5C.5.1 Develop additional supplies from the Ogallala Aquifer in Donley County
In 2013, a feasibility study was developed for the Greenbelt MIWA. The recommended strategy included developing groundwater in North Donley County, transporting the water by a 16-inch pipeline approximately 13 miles to the Greenbelt Water Treatment Plant site. The strategy would include a pump station and ground storage tank and associated electrical and instrumentation. This would be in-lieu of sending the groundwater to the existing Greenbelt Reservoir. It was assumed that the Greenbelt MIWA would purchase the groundwater rights necessary to provide 2,000 acre-feet annually.
Time Intended to Complete
It was assumed that this project could be online by 2020 if the water rights were able to be purchased from willing sellers.
Quantity, Reliability and Cost
The quantity of water should be sufficient. Reliability of groundwater supply is moderate since there is competition for water from the Ogallala in Donley County. The capital cost for a new well is $12.6 million.
Environmental Issues
The environmental impacts from groundwater development are expected to be low. Once the specific locations of additional wells and alignments associated with infrastructure are identified, a detailed evaluation to determine environmental impacts, if any, will need to be performed.
Impact on Water Resources and Other Management Strategies
The proposed well is located north of reservoir in an area with some competition for groundwater for irrigation. The strategy should not significantly impact other water resources or management strategies.
5-57

Subchapter 5C April 13, 2015 Water Management Strategies for Wholesale Water Providers Draft
Impact on Agriculture and Natural Resources
The recommended strategy is expected to have low impact on the agriculture and other natural resources. It is assumed that nay water rights purchased would be on a willing buyer- willing sell basis.
Other Relevant Factors
Greenbelt MIWA will need to seek a groundwater permit from the Panhandle GCD.
5C.5.2 Summary of Recommended Strategies for Greenbelt MIWA
Water Conservation by Greenbelt MIWA customers in PWPA will provide approximately 140 acre-feet in 2020 increasing to 160 acre-feet by 2070. New wells in the Ogallala aquifer can provide an additional 2,000 acre-feet per years and could be completed by 2020. Table 5C-14 shows the amount of supply from the recommended strategies. The total capital costs for the recommended strategies is $12.6 million as shown in Table 5C-15
Table 5C-14: Recommended Water Management Strategies for Greenbelt MIWA (ac-ft/yr)
2020 2030 2040 2050 2060 2070 Need 0 0 0 0 0 0
Recommended Strategies Supply from Strategy
2020 2030 2040 2050 2060 2070 Conservation of Customers 146 149 151 154 158 162 Donley County Groundwater 2,000 2,000 2,000 2,000 2,000 2,000 Total from Strategies 2,146 2,149 2,151 2,154 2,158 2,162
Table 5C-15: Summary of Costs for Recommended Strategies
Recommended Strategies
Capital Cost
Annual Costs 2020 2030 2040 2050 2060 2070
Donley County Groundwater $12.62 $1.26 $1.26 $0.20 $0.20 $0.20 $0.20
Total from Strategies $12.62 $1.26 $1.26 $0.20 $0.20 $0.20 $0.20
5-58

Subchapter 5C April 13, 2015 Water Management Strategies for Wholesale Water Providers Draft
5C.6 Palo Duro River Authority (PDRA)
The PDRA owns and operates the Palo Duro Reservoir in Hansford County, a potential future water supply source for cities in the PWPA. The PDRA was authorized to serve Hansford and Moore Counties and the City of Stinnett. The lake was completed in 1991, but the infrastructure to transport and treat the water has not been constructed. As such, the PDRA currently does not provide water to any member city. The PDRA has six member cities that are interested in Palo Duro Reservoir as an alternative strategy. All six cities are projected to have water Needs over the planning period: Cactus, Dumas, Gruver, Spearman, Stinnett and Sunray.
To meet the water supply needs of its member cities, PDRA could build a proposed transmission system to deliver water from the Palo Duro Reservoir to these cities by 2030. Based on the projected needs and existing supplies, the amount of water each city is expected to receive from the Palo Duro Reservoir is presented in Table 5C-16. Some of this water will be used by the cities for municipal and industrial sales. The PDRA’s water rights and the Canadian River Compact allow use of water from the reservoir for manufacturing needs if the water is supplied through a municipality.
Table 5C-16: Distribution of Water from Palo Duro Reservoir
Water User Year 2030
Peak (MGD) Supply (ac-ft/yr)
Cactus 3.1 1,744
Dumas 2.42 1,356
Gruver 0.48 271
Spearman 0.21 116
Sunray 0.48 271
Stinnett 0.21 116
Total 6.9 3,875 Note: Peak (MGD) was estimated based on a peaking factor of 2. Pipelines and pump stations were sized for peak flows.
For regional planning purposes, the supply from the reservoir has been allocated to avoid exceeding the firm yield. However, the Palo Duro River Authority would operate the reservoir on an overdraft basis, using groundwater to supplement supply during drought conditions. It is assumed that these cities could supplement their use of the Palo Duro Reservoir water with groundwater. This would allow the cities to conserve their groundwater resources when there is sufficient water in the reservoir. It would also allow them to increase the usage of the reservoir because they are not depending on it for water supply in dry years.
Recommended Strategy
• None
5-59

Subchapter 5C April 13, 2015 Water Management Strategies for Wholesale Water Providers Draft
Alternative Strategy
• Develop Palo Duro Reservoir transmission system
5C.6.1 Develop Palo Duro Reservoir Transmission System
The Palo Duro transmission system is an alternative strategy for the Palo Duro River Authority that would move water from Palo Duro Reservoir to the six member cities. While the member cities plan to meet projected needs with groundwater, these cities are interested in keeping this project listed as an alternative strategy for their supply in this plan.
Time Intended to Complete
The Palo Duro Reservoir transmission system could be completed by 2030.
Quantity, Reliability and Cost
The quantity of water should be sufficient. Reliability of the water in Palo Duro Reservoir is low. The reservoir is in drought of record conditions and the current capacity is 1.6 percent. The reliable supply is likely less than shown in Chapter 3, which was estimated using the Canadian River WAM model. The total capital cost for the transmission system is $139.6 million. Table C-19 shows the breakdown of supply and capital cost for the participating cities.
Environmental Issues
The environmental impacts associated with the construction of the transmission system are expected to be low. Once the specific pipeline route is established, a detailed evaluation to determine environmental impacts, if any, will need to be performed. Diverting water from the reservoir may result in lower lake levels, which could impact aquatic habitats. It is likely that diversions would be less during periods of low lake levels.
Impact on Water Resources and Other Management Strategies
The use of this supply might decrease lake levels and impact recreation uses on the lake from time to time. No other impacts are expected from this project.
Impact on Agriculture and Natural Resources
The recommended strategy is expected to have positive impacts on agriculture as there is less competition for groundwater. Impacts to other natural resources are expected to be minimal.
Other Relevant Factors
There are no other identified relevant factors.
5-60

Subchapter 5C April 13, 2015 Water Management Strategies for Wholesale Water Providers Draft
5C.6.2 Summary of Alternative Strategies for PDRA
Connection of the six member cities to Palo Duro Reservoir will cost approximately $139.5 million dollars with the cost split by the infrastructure necessary to provide the supply.
Table 5C-17: Alternative Water Management Strategies for PDRA (ac-ft/yr)
2020 2030 2040 2050 2060 2070 Need 873 2,031 3,371 4,961 6,386 7,791
Alternate Strategies Supply from Strategy
2020 2030 2040 2050 2060 2070 Customer Conservation 248 279 309 340 373 407 Palo Duro Delivery System 3,875 3,875 3,875 3,875 3,875 Total from Strategies
248 4,154 4,184 4,215 4,248 4,282
Table 5C-18: Summary of Costs for Alternative Strategies
Alternate Strategies Capital Cost Annual Costs ($ Million)
2020 2030 2040 2050 2060 2070
Palo Duro Delivery System $139.57 - $14.76 $14.76 $3.09 $3.09 $3.09
Table 5C-19: Summary of Strategies
Participating City Annual Supply Amount (ac-ft/yr) Capital Cost ($ Millions)
Cactus 1,744 $66.72 Dumas 1,356 $45.55 Sunray 271 $9.36 Gruver 116 $5.62 Spearman 271 $4.78 Stinnett 116 $7.54
Total 3,875 $139.57
5-61

Subchapter 5D April 13, 2015 Water Management Strategies for Water Users by County Draft
Subchapter 5D Water Management Strategies for Water Users by County
There are twenty-one counties in the PWPA, of which seven show no needs after conservation. This subchapter discusses the water issues of each county and outlines the proposed water management strategies to meet the identified needs. For some counties, there are projected needs that cannot be met through an economically viable project. These “unmet needs” are also identified, if present, by county. Descriptions of water management strategies that are developed by a wholesale water provider are discussed in Chapter 5C and included in the county summary tables for completeness, as appropriate. The detailed costs are presented in Appendix E and a summary evaluation matrix is included as Attachment 5-2.
Water Conservation is recommended for municipal (only County-Other users with needs were evaluated, all other municipal water user groups were evaluated) and irrigation water users, whether the user has a defined need or not, and it is encouraged for all other users. The description and evaluation of these strategies are in Chapter 5B. They are not discussed in this subchapter, but are included in the county summary sections.
5D.1 Armstrong County
Armstrong County is located along the southern edge of the Northern Ogallala aquifer. The City of Claude, with a population of 1,203, is the largest city in the county. Water users in Armstrong County obtain their current water supplies from the Ogallala aquifer, with a small amount coming from the Dockum aquifer. The City of Claude is the only entity shown to have a need over the planning period.
5D.1.1 Claude
The City of Claude currently obtains its water supply from four wells in the Ogallala aquifer. Due to declining water levels, Claude is projected to have a water need of 110 acre-feet per year by 2070.
For this plan the potentially feasible water management strategies for Claude are:
• Municipal Conservation (see Section 5B.1)
• Drill Additional Groundwater Wells
5-62

Subchapter 5D April 13, 2015 Water Management Strategies for Water Users by County Draft
Drill Additional Groundwater Wells
The City has plans to drill 2 new supplemental wells in the Ogallala aquifer. The City of Claude currently owns 640 acres of water rights south, south-west and south-east of town. This strategy assumes that 2 new wells would be drilled to provide up to 400 acre-feet per year of supplemental supplies. These wells would produce water from approximately 275 feet below surface. For the purpose of this plan, the new wells are assumed to be drilled near the City’s existing wells 3 ½ miles southeast of town. These 2 new wells will provide approximately 400 acre-feet per year. Minimal treatment such as chlorine disinfection will be required.
Time Intended to Complete
The city of Claude intends to complete these wells when funding becomes available. For purposes of this plan, the strategy would be completed by 2040.
Quantity, Reliability, and Cost
Each well would have a depth of 275 and an average 240 gpm capacity. The two wells can produce 400 acre-feet per year. There is sufficient water from the Ogallala to support this strategy. The reliability would be moderate due to competition for water from this source. The costs are estimated at $2.9 million.
Environmental Issues
No significant environmental impact is expected for additional groundwater development. Once the specific locations of the additional wells and alignments associated with infrastructure are identified, a detailed evaluation to determine environmental impacts, if any, will need to be performed.
Impact on Water Resources and Other Management Strategies
The increased demands on the Ogallala will continue to deplete the storage in the aquifer. To prolong the life of this water resource, the recommended conservation strategies will help to demands on this source.
Impact on Agriculture and Natural Resources
No significant impact on agricultural or natural resources is expected for this strategy.
Other Relevant Factors
The most significant challenge for this strategy is locating areas with sufficient well production where the water quality is good. The water quality in the Ogallala aquifer varies from fresh water in the north with TDS less than 400 milligrams per liter, to high TDS in the south in excess of standard drinking water parameters. Advanced treatment and additional funding may be required for municipal use.
Table 5D-1 shows the capital cost and annual supplies expected from the recommended strategies.
5-63

Subchapter 5D April 13, 2015 Water Management Strategies for Water Users by County Draft
Table 5D-1: Recommended Water Strategies for Claude (ac-ft/yr)
Capital Cost ($ Millions) 2020 2030 2040 2050 2060 2070
Need 0 0 0 35 72 110 Recommended Strategies Municipal Conservation $0 29 29 28 28 28 28 New Wells $2.9 400 400 400 400 Total $2.9 29 29 428 428 428 428
5D.1.2 Armstrong County Summary
The primary source of water for Armstrong County is groundwater. These supplies have limited recharge and are generally finite in nature. To preserve these sources for future use, it is recommended that the City of Claude and local irrigators implement water conservation measures. For Claude, it is also recommended to expand its well field to replace lost capacity associated with declining water levels. A summary of the recommended water management plan for Armstrong County is shown in Table 5D-2.
Table 5D-2: Armstrong County Water Management Plan
Water User Group Current Supplies Need Recommended Water Management Strategies
Claude Ogallala aquifer Yes Conservation, New well County-Other Ogallala and Other aquifers No None
Irrigation Ogallala aquifers No Irrigation conservation
Livestock Ogallala and Other aquifers and local supply (stock ponds) No None
Manufacturing None - - Mining Ogallala aquifer No None
Steam Electric None - -
5D.2 Carson County
Most of the water supplies for Carson County is obtained from the Northern Ogallala aquifer. Small amounts of surface water and reuse supplies are used for irrigation. The City of Amarillo also operates a large well field in western Carson County and has plans for expansion. The City of Panhandle, with a population of nearly 2,500, is the largest city in the county. Panhandle is the only entity shown to have a need over the planning period.
5-64

Subchapter 5D April 13, 2015 Water Management Strategies for Water Users by County Draft
5D.2.1 Panhandle
The City of Panhandle is projected to have a water need beginning in 2020 and reaching a peak need of 582 acre-feet per year by 2040. This need is due to declining water levels in the City’s current well field. The City of Panhandle is evaluating a groundwater source in the Ogallala aquifer to back up its current supplies.
The potential strategies for Panhandle are:
• Municipal Conservation (see Section 5B.1)
• Drill Additional Groundwater Well
Drill Additional Groundwater Well
City of Panhandle is to develop additional groundwater from the Ogallala aquifer with new wells and associated transmission. For planning purposes, it is assumed that that 2 new wells and associated well field piping will be necessary to meet the City’s water needs. These 2 new wells will provide approximately 600 acre-feet per year and will produce water approximately 680 feet below the surface. Minimal treatment such as chlorine disinfection will be required.
Time Intended to Complete
This strategy would be completed by 2020. The City may elect to drill the wells in phases if needed, but the strategy costs and supplies are developed for one phase.
Quantity, Reliability, and Cost
The quantity and reliability of water from this source is expected to be approximately 475 gpm, and provide up to 600 acre-feet per year. Reliability of Ogallala supplies is high to moderate. There is plenty of supply in Carson County, but there may be potential competing demands. The capital cost for the additional groundwater wells and collection piping is $3.2 million.
Environmental Issues
Long-term water quality of the Ogallala aquifer is unknown. Groundwater development from this source is expected to cause minimal environmental impacts.
Impact on Water Resources and Other Management Strategies
The quantity of water from this strategy is assumed to have a minimal impact on the Ogallala aquifer and other surrounding water resources.
Impact on Agriculture and Natural Resources
No significant impact on agricultural or natural resources is expected for the recommended strategy.
5-65

Subchapter 5D April 13, 2015 Water Management Strategies for Water Users by County Draft
Other Relevant Factors
There are no other identified relevant factors.
Table 5D-3: Recommended Water Strategies for Panhandle (ac-ft/yr)
Capital Cost ($ Millions) 2020 2030 2040 2050 2060 2070
Need 89 521 582 577 576 576 Recommended Strategies Municipal Conservation $0 47 48 48 48 48 48 New Wells $3.2 0 600 600 600 600 600 Total $3.2 47 648 648 648 648 648
5D.2.2 Carson County Summary
Carson County has a total projected water need of 582 acre-feet per year, all of which is associated with the City of Panhandle. The county’s primary source of water, Ogallala aquifer has over 100,000 acre-feet per year of water that is not currently developed and could be used to meet water needs. Some of this water will be developed by Amarillo, but there is self-supplies for Carson County. With development of additional Ogallala supplies, there are no needs.
Table 5D-4: Carson County Water Management Plan
Water User Group Current Supplies Need Proposed Water Management Strategies
County-Other Ogallala aquifer No None Groom Ogallala aquifer No Conservation
Irrigation Ogallala aquifer, reuse and surface water No Irrigation conservation
Livestock Ogallala aquifer and local supply (stock ponds) No None
Manufacturing Ogallala aquifer No None Mining Ogallala aquifer No None
Panhandle Ogallala aquifer Yes Conservation, New wells Steam Electric None - -
White Deer Ogallala aquifer No Conservation
5-66

Subchapter 5D April 13, 2015 Water Management Strategies for Water Users by County Draft
5D.3 Childress County
Childress County is located in the far southeastern part of the PWPA. The City of Childress is the largest city in the county with a 2020 population of 6,303. Groundwater sources in Childress County are limited. Municipal supplies are provided by the Greenbelt MIWA and small quantities of local groundwater. The Seymour and Blaine aquifers are the primary sources for agricultural use.
While the county is not water rich, it does not have a projected need over the planning period. Conservation is recommended for the City of Childress and irrigation. A summary of the water plan for Childress County is shown in Table 5D-5.
Table 5D-5: Childress County Water Management Plan
Water User Group Current Supplies Need Proposed Water Management Strategies
Childress Greenbelt Reservoir No Conservation
County-Other Seymour aquifer and Greenbelt Reservoir No None
Irrigation Blaine, Seymour and Whitehorse aquifers and reuse No Irrigation conservation
Livestock Seymour aquifers and local supply (stock ponds) No None
Manufacturing None - - Mining Local supply No None
Steam Electric None - -
5-67

Subchapter 5D April 13, 2015 Water Management Strategies for Water Users by County Draft
5D.4 Collingsworth County
Collingsworth County is located on the southeastern border of the PWPA. The primary source of water is groundwater from the Seymour and Blaine aquifers. Due to the poor water quality of the Blaine aquifer, most of the municipal supplies are obtained from the Seymour aquifer. Small amounts of groundwater are also obtained from undefined aquifers, known as Other Aquifer.
Collingsworth County does not have a projected need over the planning period. However, the City of Wellington is planning to develop additional groundwater supplies to improve the reliability of its current sources.
5D.4.1 Wellington
The City of Wellington currently obtains its water supply from the Seymour aquifer in Collingsworth County. The city has been having water quality issues associated with elevated nitrates and quantity concerns from dropping water levels. The city is presently evaluating the Seymour aquifer for additional groundwater to back up its existing supply. Alternatively, the city would be receptive to receiving water from outside of the county if the opportunity arises.
For this plan, the potentially feasible water management strategies for Wellington are:
• Municipal Conservation (see Section 5B.1)
• Drill Additional Groundwater Well
• Nitrate Treatment of Seymour Aquifer Supplies
Drill Additional Groundwater Well
This strategy includes 2 new wells and 1 mile of 6-inch diameter well field piping. In addition, 3 miles of 8-inch diameter will be constructed to transport the water to existing infrastructure. The 2 new wells would be drilled to provide approximately 180 acre-feet per year and is assumed to produce water approximately 160 feet below the surface. Due to the Seymour having high levels of nitrate and chloride throughout its extent, advanced treatment for municipal use may be required. Treatment for nitrates is evaluated as a separate strategy
5-68

Subchapter 5D April 13, 2015 Water Management Strategies for Water Users by County Draft
Time Intended to Complete
The city is considering expanding its well field in the near future. For purposes of this plan, the strategy will be completed by 2020.
Quantity, Reliability, and Cost
The quantity and reliability of water from this source is expected to be approximately 100 gpm, which can produce an average annual amount of 180 acre-feet per year. Reliability of the supply is considered to be moderate to low due to water quality and competing demand. The capital cost for the additional groundwater wells, associated well field piping, and transmission pipeline is $2.6 million.
Environmental Issues
No significant environmental impact is expected for the recommended strategy. Once the specific locations of additional wells and alignments associated with infrastructure are identified, a detailed evaluation to determine environmental impacts, if any, will need to be performed.
Impact on Water Resources and Other Management Strategies
Increased demands on the Seymour aquifer will continue to deplete the storage. To prolong the life of this water resource, other users may need to reduce their demands.
Impact on Agriculture and Natural Resources
The recommended strategy is expected to have low to moderate impact on agriculture and other natural resources. This strategy may reduce the irrigated acreage for farming as additional water rights acreage is purchased. This acreage could be used for dry land farming if needed, but may require crop changes.
Other Relevant Factors
There are no other identified relevant factors.
Nitrate Treatment
This strategy assumes the development of advanced treatment facilities to treat the City of Wellington’s current and future groundwater from the Seymour aquifer. Currently, the city is experiencing elevated nitrate levels in its water source. This strategy assumes that half of the city’s groundwater would be treated by reverse osmosis or other method and then blended with the remaining supplies to reduce nitrate concentrations. This strategy assumes that a 0.5 MGD treatment facility would be constructed and the waste stream from the facility could be discharged to a local tributary of the Salt Fork of the Red River.
Time Intended to Complete
The City is experiencing water quality issues now. To address these issues, the strategy will be completed by 2020.
5-69

Subchapter 5D April 13, 2015 Water Management Strategies for Water Users by County Draft
Quantity, Reliability, and Cost
This strategy will not produce new water, but it will improve the water quality of existing sources. The quantity is shown as zero. The capital cost is estimated at $3.7 million.
Environmental Issues
There may be environmental impacts with the discharge of the waste stream. This would need to be permitted by the State. At that time, environmental impacts would be assessed.
Impact on Water Resources and Other Management Strategies
With the losses associated with the treatment, the city would need to compensate by pumping additional groundwater to meet its needs.
Impact on Agriculture and Natural Resources
The strategy is expected to have low to moderate impact on agriculture and other natural resources.
Other Relevant Factors
There are no other identified relevant factors.
The recommended strategies for the City of Wellington are shown in Table 5D-6.
Table 5D-6: Recommended Strategies for City of Wellington (ac-ft/yr)
Capital Cost ($ Millions) 2020 2030 2040 2050 2060 2070
Need 0 0 0 0 0 0 Recommended Strategies Conservation 44 45 46 47 49 50 New Wells $2.6 180 180 180 180 180 180 Nitrate Treatment $3.7 0 0 0 0 0 0 Total $6.30 224 225 226 227 229 230
5D.4.2 Collingsworth County Summary
Collingsworth County has no projected needs, but water users in the county are experiencing water quality issues and quantity issues during drought. To address these issues, additional groundwater development, advanced treatment and conservation are recommended for the City of Wellington. Conservation is also recommended for irrigation. A summary of the water plan for Collingsworth County is shown in Table 5D-7.
5-70

Subchapter 5D April 13, 2015 Water Management Strategies for Water Users by County Draft
Table 5D-7: Collingsworth County Water Management Plan
Water User Group Current Supplies Need Proposed Water Management Strategies
Wellington Seymour aquifer No Additional Seymour Aquifer, Nitrate Treatment, Conservation
County-Other Blaine, Seymour and Other aquifers No None
Irrigation Ogallala, Blaine and Seymour aquifers, reuse and Red River
water rights No Irrigation conservation
Livestock Ogallala, Blaine, Seymour and
Other aquifers and local supply (stock ponds)
No None
Manufacturing None - - Mining None - -
Steam Electric None - -
5D.5 Dallam County
Dallam County is located in the far northwestern part of the PWPA. Dalhart is the largest city in Dallam County with a total population of approximately 8,800, of which about two-thirds are located in Dallam County. The remaining population is in Hartley County.
Dallam County is one of the larger irrigation water users in the region. The primary source of water in the county is the Ogallala aquifer. Smaller quantities of groundwater from the Dockum aquifer and local livestock supply are also used in the county.
There is plenty of water available from the Ogallala aquifer in Dallam County, but the use is concentrated in the heavily irrigated areas, which results in large water declines over time. Due to the geographic constraints imposed by the water supply allocation process, there are projected needs for the cities of Dalhart and Texline, and irrigated agriculture in Dallam County. The recommended strategies to meet the needs for irrigation is conservation, which is discussed in Chapter 5B. The potential strategies for Texline and Dalhart are discussed below.
5-71

Subchapter 5D April 13, 2015 Water Management Strategies for Water Users by County Draft
5D.5.1 Dalhart
The City of Dalhart falls into two counties, Dallam and Hartley. Its current supplies are obtained from an existing well field in Dallam County. There is considerable competition for water from surrounding agricultural lands. As a result, the City of Dallam is expected to have a need beginning in 2020 and reaching 2,800 acre-feet per year by 2070. To meet this need, the strategies considered include:
• Municipal Conservation (see Section 5B.1)
• Develop Additional Groundwater Well
Develop Additional Groundwater Well
The City of Dalhart is considering re-developing an existing well field in Hartley County that is located south-southwest of the city. The city plans on rehabilitating three existing wells and possibly drilling one additional well to develop the needed supply from the Ogallala aquifer. A new booster station and ground storage would be needed at the well field, along with a 2-mile pipeline from the booster station to the city’s existing water line.
Time Intended to Complete
This strategy would be implemented by 2020.
Quantity, Reliability, and Cost
Assuming a similar well production as Dalhart’s existing wells, this strategy could provide an average annual supply of 2,700 acre-feet per year. The reliability would be moderate due to the competition from other water users. The capital costs are estimated at $2.9 million.
Environmental Impacts
No significant environmental impact is expected for this strategy. The well field is already in place and the new infrastructure would be located within existing groundwater rights area.
Impact on Water Resources and Other Management Strategies
Increased demands on the Ogallala aquifer will continue to deplete the storage. There are no impacts to other water management strategies.
Impact on Agriculture and Natural Resources
This strategy is expected to have low to moderate impact on agriculture and other natural resources due to competition for water. This strategy would not impact any existing agricultural water rights since the water rights are already owned by Dalhart.
5-72

Subchapter 5D April 13, 2015 Water Management Strategies for Water Users by County Draft
Other Relevant Factors
There are no other identified relevant factors.
Table 5D-8: Recommended Water Strategies for Dalhart (ac-ft/yr)
Capital Cost ($ Millions) 2020 2030 2040 2050 2060 2070
Need 749 1,138 1,558 1,982 2,399 2,807
Recommended Strategies
Municipal Conservation $0 79 86 93 100 107 113
New wells $2.9 2,700 2,700 2,700 2,700 2,700 2,700
Total $2.9 2,779 2,786 2,793 2,800 2,807 2,813
5D.5.2 Texline
The City of Texline currently obtains its water supply from the Ogallala-Rita Blanca aquifer. The Rita Blanca aquifer underlies the Ogallala aquifer in the northwest corner of Dallam County and is hydraulically connected. The City is shown to have a small need beginning in 2050. The potential strategies to meet this need include:
• Municipal Conservation (see Section 5B.1)
• Drill Additional Groundwater Well
Drill Additional Groundwater Well
This strategy assumes that one new well will be drilled near the City’s existing wells. Well field piping will be installed to connect to the current collection system. The new well would be drilled to provide approximately 150 acre-feet per year and is assumed to produce water from approximately 350 feet below the surface. Minimal treatment such as chlorine disinfection will be required for municipal use. There is no transmission system associated with this strategy. It is assumed that the existing transmission system is sufficient.
Time Intended to Complete
This strategy would be implemented by 2050.
Quantity, Reliability, and Cost
The quantity and reliability of water from this source is expected to be approximately 200 gpm, which can provide an average annual supply of 150 acre-feet per year. Reliability of the supply is considered to be high due to large volumes of available water. In places where the Ogallala and Rita Blanca are hydraulically connected, the total thickness of water yielding formation is much greater. The capital cost for the additional groundwater well and well field piping is $1.1 million.
5-73

Subchapter 5D April 13, 2015 Water Management Strategies for Water Users by County Draft
Environmental Issues
No significant environmental impact is expected for this strategy.
Impact on Water Resources and Other Management Strategies
This strategy is assumed to have a minimal impact on the Ogallala-Rita Blanca aquifer and other surrounding water resources. There are no impacts to other management strategies.
Impact on Agriculture and Natural Resources
It is uncertain whether Texline already holds sufficient groundwater rights or whether additional rights would need to be obtained. It is assumed if water rights are purchased from agricultural or rural water users, it would be on a willing buyer-willing seller basis. No significant impact on agricultural and natural resources is expected for this strategy.
Other Relevant Factors
There are no other relevant factors.
Table 5D-9: Recommended Water Strategies for Texline (ac-ft/yr)
Capital Cost ($ Millions) 2020 2030 2040 2050 2060 2070
Need 0 0 0 46 99 161 Recommended Strategies Municipal Conservation $0 18 20 22 24 26 28 New Wells $1.1 0 0 0 150 150 150 Total $1.1 18 20 22 174 176 178
5D.5.3 Dallam County Irrigation
The irrigation needs in Dallam County peak at over 94,000 acre-feet per year over the planning period. These needs cannot be fully met through conservation in the early decades. A summary of the projected water needs and strategies for Dallam County is shown in Table 5D-10. The irrigation conservation strategy is discussed in Section 5B.2.
Table 5D-10: Recommended Water Strategies for Dallam County Irrigation (ac-ft/yr)
Capital Cost ($ Millions) 2020 2030 2040 2050 2060 2070
Need 79,399 91,675 94,226 87,452 77,836 68,218 Recommended Strategies Irrigation Conservation $01 34,218 61,174 106,343 121,011 132,167 140,612 Total $0 34,218 61,174 106,343 121,011 132,167 140,612
1 Irrigation conservation costs are determined on an annual basis as shown in 5B.2
5-74

Subchapter 5D April 13, 2015 Water Management Strategies for Water Users by County Draft
5D.5.4 Dallam County Summary
Dallam County has a total projected water need of over 95,000 acre-feet per year. Much of this need can be met through conservation. The municipal needs are planned to be met through conservation and additional groundwater from the Ogallala aquifer. However, not all of the need for irrigated agriculture can be met through conservation. There is a projected unmet water need for Irrigation of about 45,000 acre-feet in 2020, which decreases to zero by 2040. After 2040, there is potential water savings above the projected needs. This indicates potential aquifer storage depletions early in the planning period could be offset by water savings in later decades. The recommended water plan for Dallam County is shown in Table 5D-11. The unmet needs are shown in Table 5D-12.
Table 5D-11: Dallam County Water Management Plan
Water User Group Current Supplies Need Proposed Water Management Strategies
Dalhart Ogallala aquifer No Conservation, Additional Ogallala Texline Ogallala aquifer Yes New wells, Conservation
County-Other Ogallala aquifer No None
Irrigation Ogallala/Rita Blanca and Dockum aquifers and reuse Yes Irrigation conservation
Livestock Ogallala/ Rita Blanca aquifer and local supply (stock ponds) No None
Manufacturing None - - Mining None - -
Steam Electric None - -
Table 5D-12: Unmet Water Needs in Dallam County (ac-ft/yr)
Water User Group 2020 2030 2040 2050 2060 2070
Irrigation (45,181) (30,501) 0 0 0 0
5-75

Subchapter 5D April 13, 2015 Water Management Strategies for Water Users by County Draft
5D.6 Donley County
Donley County lies on the southwestern edge of the Ogallala aquifer. It is also home to the Greenbelt Reservoir. The largest city in Donley County is Clarendon, which has a population of about 2,000. The majority of the water supply for Donley County is obtained from these two sources. A small amount of local supply is used for agricultural purposes. Current sources of supply are shown to be adequate for all users. It is recommended that conservation be implemented for Clarendon and irrigation to preserve existing supplies for future use.
Table 5D-13: Donley County Water Management Plan
Water User Group Current Supplies Need Proposed Water Management Strategies
Clarendon Greenbelt reservoir No Municipal conservation
County-Other Ogallala aquifer and Greenbelt reservoir No None
Irrigation Ogallala aquifer and Red River water rights No Irrigation conservation
Livestock Ogallala and Other aquifers and local supply (stock ponds) No None
Manufacturing None - - Mining Ogallala aquifer No None
Steam Electric None - -
5-76

Subchapter 5D April 13, 2015 Water Management Strategies for Water Users by County Draft
5D.7 Gray County
The Ogallala aquifer underlies most of Gray County. This water resource is the primary source for most users in the county. The City of Pampa, which is the largest city in the county, is a member city of CRMWA. CRMWA provides water from its Roberts County well field and Lake Meredith (when available) to Pampa. Only about 20 percent of the total available supply from the Ogallala in Gray County is currently developed.
There is sufficient developed supplies to meet most of the demands in the county. Only McLean and Pampa are identified with projected water needs. Most of Pampa’s need is associated with the need for CRMWA, which is addressed with the wholesale water provider in Chapter 5C.
5D.7.1 McLean
The City of McLean is located in southwestern Gray County. Its current water supply is from the Ogallala aquifer. The city is projected to have a water supply need beginning in 2050 associated with declining water levels. However, due to the increased activities associated with mining and other construction and corresponding demands on the city, McLean is planning to develop a new well by 2020. The potentially feasible strategies for McLean include:
• Municipal Conservation (see Section 5B.1)
• Drill Additional Groundwater Well
Drill Additional Groundwater Well
This strategy assumes the city would drill one new well in the Ogallala aquifer near its existing well field. The well would be able to produce 260 gpm with well depths of about 180 feet. Only well field piping to connect to McLean’s existing system is included in this strategy. If McLean develops new water in a different location, additional transmission would be needed, which will increase the costs in this plan.
Time Intended to Complete
The time to complete is 2020.
5-77

Subchapter 5D April 13, 2015 Water Management Strategies for Water Users by County Draft
Quantity, Reliability, and Cost
This strategy would provide McLean with an additional 200 acre-feet per year of reliable supply. There is available water in the Ogallala and limited competition for the water. The capital cost of this strategy is $790,000, which provides a unit cost of $1.37 per thousand gallons.
Environmental Issues
There are no known environmental issues with this strategy.
Impact on Water Resources and Other Management Strategies
This strategy, at 200 acre-feet per year, is not expected to impact the Ogallala aquifer or other water management strategies.
Impact on Agriculture and Natural Resources
No impacts to agriculture or natural resources are anticipated. This strategy would improve the reliability of water supply to rural users.
Other Relevant Factors
There are no other relevant factors.
Table 5D-14: Recommended Water Strategies for McLean (ac-ft/yr)
Capital Cost ($ Millions) 2020 2030 2040 2050 2060 2070
Need 0 0 0 89 135 182 Recommended Strategies Municipal Conservation $0 17 18 20 23 25 27
New wells $0.79 200 200 200 200 200 200 Total $0.79 217 218 220 223 225 227
5D.7.2 Pampa
The City of Pampa provides water to customers in Gray County, including TDCJ, and Titan Specialties and other manufactories. The city receives blended water from CRMWA and operates wells for groundwater from the Ogallala aquifer. The city also reuses treated wastewater to supply irrigation water to its municipal golf course. The city is able to meet its current water demands. However, a water need of approximately 1,700 acre-feet is projected by 2030 and increasing to about 3,800 acre-feet by 2070. Most of this need is associated with the need on CRMWA and will be met through strategies developed by CRMWA. Pampa is planning on further developing its own water supplies near the city. The potentially feasible strategies for Pampa include:
5-78

Subchapter 5D April 13, 2015 Water Management Strategies for Water Users by County Draft
• Municipal Conservation (see Section 5B.1)
• Obtain contractual supplies from CRMWA (this is evaluated with CRMWA strategies in Section 5C.1)
• Drill Additional Groundwater Wells
Drill Additional Groundwater Well
This strategy includes four new wells and associated well field piping. The new wells would be drilled to provide 2,000 acre-feet per year and are assumed to produce water from approximately 555 feet below the surface. Minimal treatment such as chlorine disinfection will be required for municipal use. These wells are assumed to be located within three miles of the City.
Time Intended to Complete
The time to complete is 2020.
Quantity, Reliability, and Cost
The new wells will provide 2,000 acre-feet of good supply. These wells are expected to be reliable and there is limited competition for water near the city’s existing well field. The capital cost for the wells and 3-mile transmission system is $8.6 million. The units cost of this additional water is estimated at $1.50 per thousand gallons.
Environmental Issues
No significant environmental impact is expected for the recommended strategy. Once the specific locations of additional wells and alignments associated with infrastructure are identified, a detailed evaluation to determine environmental impacts, if any, will need to be performed
Impact on Water Resources and Other Management Strategies
This strategy is assumed to have a minimal impact on the Ogallala aquifer and other surrounding water resources.
Impact on Agriculture and Natural Resources
There are no identified impacts to agricultural and natural resources.
Other Relevant Factors
There are no other relevant factors.
5-79

Subchapter 5D April 13, 2015 Water Management Strategies for Water Users by County Draft
Table 5D-15: Recommended Water Strategies for Pampa (ac-ft/yr)
Capital Cost ($ Millions) 2020 2030 2040 2050 2060 2070
Need 0 1,752 2,491 2,190 2,985 3,806
Recommended Strategies Municipal Conservation $0 146 161 178 202 220 240
New Wells $8.6 2,000 2,000 2,000 2,000 2,000 2,000
CRMWA Supplies1 $0 0 812 943 2,735 2,925 3,114
TOTAL $8.6 2,146 2,973 3,121 4,937 5,145 5,354 1 CRMWA supply costs are evaluated in 5C.1
5D.7.3 Gray County Summary
Gray County has a total projected of nearly 3,000 acre-feet per year. Much of this need can be met through conservation. The municipal needs are planned to be met through conservation and additional groundwater from the Ogallala aquifer. The county’s primary source of water, Ogallala aquifer has over 100,000 acre-feet per year of water that is not currently developed and could be used to meet water needs. The recommended water plan for Gray County is shown in Table 5D-16.
Table 5D-16: Gray County Water Management Plan
Water User Group Current Supplies Need Proposed Water Management Strategies
McLean Ogallala aquifer No Municipal conservation, new well in Ogallala
Pampa Ogallala aquifer and CRMWA system No
Municipal conservation, new wells in Ogallala, and contracted supplies
from CRMWA County-Other Ogallala aquifer No None
Irrigation Ogallala and reuse No Irrigation conservation
Livestock Ogallala aquifer and local supply (stock ponds) No None
Manufacturing Ogallala aquifer No None Mining Ogallala aquifer No None
Steam Electric Ogallala aquifer No None
5-80

Subchapter 5D April 13, 2015 Water Management Strategies for Water Users by County Draft
5D.8 Hall County
Hall County has limited water sources. The primary sources of water are the Seymour and Blaine aquifers. Both of these sources have water quality concerns, which limits their use for municipal purposes. There is little surface water in the region. The largest city in Hall County is Memphis and this city obtains its water from Donley County. There is also about 1,000 acre-feet per year of water that is obtained from the Whitehorse formation, which is listed as Other Aquifer in this plan.
The only entity with a need in Hall County is the City of Memphis.
5D.8.1 Memphis
The City of Memphis currently obtains its water supply from the Ogallala aquifer in Donley County and purchases treated surface water from Greenbelt MIWA as needed. Due to the limited groundwater in Donley County, Memphis is projected to have a need of 68 acre-feet by 2050, increasing to approximately 143 acre-feet from 2070 To meet this need, Memphis is planning to develop additional groundwater in Donley County within its existing well field. The potential water management strategies for Memphis include:
• Municipal Conservation (see Section 5B.1)
• Drill Additional Groundwater Well
Drill Additional Groundwater Well
This strategy assumes that two new wells will be drilled near the City’s existing wells. Well field piping will be installed to connect to the current collection system. The new well would be drilled to provide approximately 150 acre-feet per year and is assumed to produce water from approximately 150 feet below the surface. Minimal treatment such as chlorine disinfection will be required for municipal use. There is no transmission system associated with this strategy. It is assumed that the existing transmission system is sufficient.
Time Intended to Complete
This strategy would be implemented by 2050.
5-81

Subchapter 5D April 13, 2015 Water Management Strategies for Water Users by County Draft
Quantity, Reliability, and Cost
The quantity and reliability of water from this source is expected to be approximately 150 gpm per well, which can provide an average annual supply of 150 acre-feet per year. Reliability of the supply is considered to be moderate due to thinner saturated thickness of the aquifer towards the southern edge. The capital cost for the additional groundwater wells and well field piping is $1.1 million.
Environmental Issues
No significant environmental impact is expected for this strategy.
Impact on Water Resources and Other Management Strategies
This strategy is assumed to have a minimal impact on the Ogallala-Rita Blanca aquifer and other surrounding water resources. There are no impacts to other management strategies.
Impact on Agriculture and Natural Resources
It is uncertain whether Memphis already holds sufficient groundwater rights or whether additional rights would need to be obtained. It is assumed if water rights are purchased from agricultural or rural water users, it would be on a willing buyer-willing seller basis. No significant impact on agricultural and natural resources is expected for this strategy.
Other Relevant Factors
There are no other relevant factors.
Table 5D-17: Recommended Water Strategies for Memphis (ac-ft/yr)
Capital Cost ($ Millions) 2020 2030 2040 2050 2060 2070
Need 0 0 0 68 100 133 Recommended Strategies Municipal Conservation $0 34 23 14 14 14 14 New Wells $1.1 0 0 0 150 150 150 Total $1.1 34 23 14 164 164 164
5D.8.2 Hall County – Other (Brice-Lesley, Estelline, Lakeview, Turkey)
A survey returned by the Hall County Judge indicated that two communities, Estelline and Lakeview, as having water quantity and quality concerns. The City of Turkey and Brice-Lesley WSC also are planning to expand their water supplies. The potential strategies for Hall County-Other include.
• Drill Additional Groundwater Well (Brice-Lesley)
• Drill Additional Groundwater Well (Estelline)
5-82

Subchapter 5D April 13, 2015 Water Management Strategies for Water Users by County Draft
• Drill Additional Groundwater Well (Turkey)
• Water Quality Improvements (Lakeview)
Drill Additional Groundwater Well (Brice-Lesley)
This strategy assumes that one new wells will be drilled near Brice-Lesly existing wells. Well field piping will be installed to connect to the current collection system. The new wells would be drilled to provide approximately 50 acre-feet per year and is assumed to produce water from approximately 250 feet below the surface. Minimal treatment such as chlorine disinfection will be required for municipal use. There is no transmission system associated with this strategy. It is assumed that the existing transmission system is sufficient.
Time Intended to Complete
This strategy would be implemented by 2020.
Quantity, Reliability, and Cost
The quantity and reliability of water from this source is expected to be approximately 170 gpm per well, which can provide an average annual supply of more than 50 acre-feet per year. Reliability of the supply is considered to be moderate due to thinner saturated thickness of the aquifer towards the southern edge. The capital cost for the additional groundwater wells and well field piping is $0.3 million.
Environmental Issues
No significant environmental impact is expected for this strategy.
Impact on Water Resources and Other Management Strategies
This strategy is assumed to have a minimal impact on the Seymour aquifer and other surrounding water resources. There are no impacts to other management strategies.
Impact on Agriculture and Natural Resources
It is uncertain whether Brice-Lesley already holds sufficient groundwater rights or whether additional rights would need to be obtained. It is assumed if water rights are purchased from agricultural or rural water users, it would be on a willing buyer-willing seller basis. No significant impact on agricultural and natural resources is expected for this strategy.
Other Relevant Factors
There are no other relevant factors.
5-83

Subchapter 5D April 13, 2015 Water Management Strategies for Water Users by County Draft
Drill Additional Groundwater Well (Estelline)
This strategy assumes that one new wells will be drilled near Estelline’s existing wells. Well field piping will be installed to connect to the current collection system. The new wells would be drilled to provide approximately 50 acre-feet per year and is assumed to produce water from approximately 150 feet below the surface. Minimal treatment such as chlorine disinfection will be required for municipal use. There is no transmission system associated with this strategy. It is assumed that the existing transmission system is sufficient.
Time Intended to Complete
This strategy would be implemented by 2020.
Quantity, Reliability, and Cost
The quantity and reliability of water from this source is expected to be approximately 75 gpm per well, which can provide an average annual supply of 50 acre-feet per year. Reliability of the supply is considered to be moderate due to thinner saturated thickness of the aquifer towards the southern edge. The capital cost for the additional groundwater wells and well field piping is $0.1 million.
Environmental Issues
No significant environmental impact is expected for this strategy.
Impact on Water Resources and Other Management Strategies
This strategy is assumed to have a minimal impact on the Seymour aquifer and other surrounding water resources. There are no impacts to other management strategies.
Impact on Agriculture and Natural Resources
It is uncertain whether Estelline already holds sufficient groundwater rights or whether additional rights would need to be obtained. It is assumed if water rights are purchased from agricultural or rural water users, it would be on a willing buyer-willing seller basis. No significant impact on agricultural and natural resources is expected for this strategy.
Other Relevant Factors
There are no other relevant factors.
Drill Additional Groundwater Well (Turkey)
Turkey has an Economically Distressed Areas Program project grant funded through TWDB to put in new wells in the Ogallala aquifer in Briscoe County, but they are still in the early stages of implementation. There is sufficient supply available for this project.
5-84

Subchapter 5D April 13, 2015 Water Management Strategies for Water Users by County Draft
Time Intended to Complete
This strategy would be implemented by 2020.
Quantity, Reliability, and Cost
The quantity and reliability of water from this source is expected to provide an average annual supply of 100 acre-feet per year. Reliability of the supply is considered to be moderate due to competition for water. The capital cost for the additional groundwater wells and transmission system is estimated at $1.3 million.
Environmental Issues
No significant environmental impact is expected for this strategy.
Impact on Water Resources and Other Management Strategies
This strategy is assumed to have a minimal impact on the Ogallala aquifer and other surrounding water resources. There are no impacts to other management strategies.
Impact on Agriculture and Natural Resources
It is assumed that Turkey holds sufficient groundwater rights for this project and there would be no significant impact on agricultural and natural resources for this strategy.
Other Relevant Factors
There are no other relevant factors.
Advance Treatment (Nitrate Removal)
This strategy assumes the development of advanced treatment facilities to treat the City of Lakeview’s current and future groundwater from the Seymour aquifer. Currently, the city is experiencing elevated nitrate levels in its water source. This strategy assumes that half of the city’s groundwater would be treated by reverse osmosis or other method and then blended with the remaining supplies to reduce nitrate concentrations. This strategy assumes that a 0.1 MGD treatment facility would be constructed and the waste stream from the facility could be discharged to a local tributary of the Prairie Dog Town Fork of the Red River.
Time Intended to Complete
The City is experiencing water quality issues now. To address these issues, the strategy will be completed by 2020.
5-85

Subchapter 5D April 13, 2015 Water Management Strategies for Water Users by County Draft
Quantity, Reliability, and Cost
This strategy will not produce new water, but it will improve the water quality of existing sources. The quantity is shown as zero. The capital cost is estimated at $1.6 million.
Environmental Issues
There may be environmental impacts with the discharge of the waste stream. This would need to be permitted by the State. At that time, environmental impacts would be assessed.
Impact on Water Resources and Other Management Strategies
With the losses associated with the treatment, the city would need to compensate by pumping additional groundwater to meet its needs.
Impact on Agriculture and Natural Resources
The strategy is expected to have low to moderate impact on agriculture and other natural resources.
Other Relevant Factors
There are no other identified relevant factors.
The recommended strategies for Hall County-Other are shown in Table 5D-18.
Table 5D-18: Recommended Water Strategies for Hall County-Other (Brice-Lesley, Estelline, Lakeview, Turkey) (ac-ft/yr)
Capital Cost ($ Millions) 2020 2030 2040 2050 2060 2070
Need 0 0 0 0 0 0 Recommended Strategies Municipal Conservation $0 25 26 26 26 26 26 New Well (Brice-Lesley) $0.3 50 50 50 50 50 50
New Well (Estelline) $0.1 50 50 50 50 50 50 New Well (Turkey) $1.3 100 100 100 100 100 100 Advance Treatment (Nitrate Removal) $1.6 0 0 0 0 0 0
Total $3.3 225 226 226 226 226 226
5-86

Subchapter 5D April 13, 2015 Water Management Strategies for Water Users by County Draft
5D.8.3 Hall County Summary
Hall County has a total projected need of less than 100 acre-feet per year. Much of this need can be met through conservation. The municipal needs are planned to be met through conservation and additional groundwater from the Seymour aquifer. The county’s primary source of water, Seymour aquifer, has limited capacity between 2,000 and 5,000 acre-feet above what is currently developed it also has known water quality concerns. The recommended water plan for Hall County is shown in Table 5D-19.
Table 5D-19: Hall County Water Management Plan
Water User Group Current Supplies Need Proposed Water Management Strategies
Memphis Seymour aquifer and Greenbelt reservoir Yes
Municipal conservation, New well in Ogallala and increase supplies from
Greenbelt reservoir
County-Other Ogallala and Seymour aquifers and Greenbelt reservoir Yes
New wells in the Ogallala (Briscoe, Donley) and Seymour (Hall) and
Nitrate Removal
Irrigation Seymour aquifers and Red River water rights No Irrigation conservation
Livestock Seymour and Other
aquifers and local supply (stock ponds)
No None
Manufacturing None - - Mining Other aquifer No None
Steam Electric None - -
5D.9 Hansford County
Nearly all of the water supplies currently used in Hansford County are obtained from the Ogallala aquifer. The Palo Duro Reservoir is also located in Hansford County, but there is no infrastructure developed to transport the water. The larger municipalities include Spearman and Gruver. Both of these cities are member cities of the PDRA, but both currently obtain their water from the Ogallala aquifer.
There are sufficient supplies to meet most of the water demands in Hansford County. Both Gruver and Spearman have projected needs due to declining water levels within each city’s existing well field.
5-87

Subchapter 5D April 13, 2015 Water Management Strategies for Water Users by County Draft
5D.9.1 Gruver
The City of Gruver currently obtains its water supply from the Ogallala aquifer in Hansford County. Based on the availability of the City’s current wells, Gruver will need to develop additional supplies before 2040. Projected needs for Gruver range from 111 acre-feet in 2040 to 344 acre-feet in 2070. The City owns approximately 1,000 acres of undeveloped water rights. These water rights may be sufficient to meet the projected needs, pending competition for water from other users. As a member of the PDRA, Gruver may be interested in developing a regional transmission system to use water from Palo Duro Reservoir. This strategy is evaluated for PDRA in Chapter 5C. The potential water management strategies for Gruver include:
• Municipal Conservation (see Section 5B.1)
• Drill Additional Groundwater Well
• Develop PDRA Transmission System (See Section 5C.6)
Drill Additional Groundwater Wells
This strategy assumes that 2 new wells will be drilled to provide approximately 350 acre-feet per year. Treatment associated with this strategy is minimal and most likely includes chlorine disinfection. These wells are assumed to be approximately 180 feet below the surface. The new wells will be drilled near the City’s existing wells. Well field piping will be installed to connect to the current collection system. There is no additional transmission to the city.
Time Intended to Complete
The wells will be completed prior to 2040.
Quantity, Reliability and Cost
The quantity of water from this strategy should be able to produce 350 acre-feet per year with average well capacities of 265 gpm. Reliability of Ogallala supplies is moderate since availability depends on other water users. For cost purposes, it is assumed that the new wells would be located within the existing well field. The capital cost for the additional groundwater well is approximately $1.4 million.
Environmental Issues
No significant environmental impact is expected for this strategy. The City already owns the water rights and no transmission system is included in this strategy.
Impact on Water Resources and Other Management Strategies
The increased demands on the Ogallala will continue to deplete the storage in the aquifer. To prolong the life of this water resource, other users may need to reduce their demands.
5-88

Subchapter 5D April 13, 2015 Water Management Strategies for Water Users by County Draft
Impact on Agriculture and Natural Resources
No significant impact on agricultural or natural resources is expected for the recommended strategies.
Other Relevant Factors
There are no other identified relevant factors.
Develop PDRA Transmission System
The Palo Duro Reservoir transmission project is an alternative strategy for Gruver. The project would have little impact on the environment, agricultural or other natural resources. Once the pipeline route is established, a more detailed analysis of the impacts should be considered. No interbasin transfer permits would be required for the Palo Duro transmission project. The use of this supply might decrease lake levels and impact recreation uses on the lake from time to time. No other impacts are expected from this project. Gruver would expect to have a capital cost of $5.6 million associated with their portion of the project. This project is evaluated for the PDRA in Chapter 5C.
Table 5D-20: Recommended Water Strategies for Gruver (ac-ft/yr)
Capital Cost ($ Millions) 2020 2030 2040 2050 2060 2070
Need 0 0 111 196 272 344 Recommended Strategies Municipal Conservation $0 23 25 26 28 30 31 New Wells $1.4 0 0 350 350 350 350 Total $1.4 23 25 376 378 380 381
5D.9.2 Spearman
The City of Spearman currently obtains its water supply from the Ogallala aquifer in Hansford County. Based on the availability of the city’s current wells, Spearman will need to develop additional supplies by 2050 to replace lost production of its existing well field. The city will need 634 acre-feet per year by 2070. As a member of the PDRA, Spearman may be interested in developing a regional transmission system to use water from Palo Duro Reservoir. This strategy is evaluated for PDRA in Chapter 5C. The potential water management strategies for Spearman include:
• Municipal Conservation (see Section 5B.1)
• Drill Additional Groundwater Well
• Develop PDRA Transmission System (See Section 5C.6)
Drill Additional Groundwater Wells
5-89

Subchapter 5D April 13, 2015 Water Management Strategies for Water Users by County Draft
This strategy assumes that 2 new wells will be drilled provide approximately 650 acre-feet per year and are assumed to produce water approximately 554 feet below the surface. The additional wells are assumed to be located within 1 mile of the City. Treatment associated with this strategy is minimal and most likely includes chlorine disinfection. Well field piping will be installed to connect to the current collection system. The exact location of the additional wells is not known.
Time Intended to Complete
The wells will be completed prior to 2040.
Quantity, Reliability and Cost
The quantity of water from these strategies should be able to produce 650 acre-feet per year with average well capacities of 620 gpm. Reliability of Ogallala supplies is moderate since availability depends on other water users. For costing purposes, the transmission system includes 1 mile of 14-inch pipeline and a well field pump station. The capital cost for the additional groundwater well is approximately $3.4 million.
Environmental Issues
No significant environmental impact is expected for this strategy. Once the specific locations of additional wells and alignments associated with infrastructure are identified, a detailed evaluation to determine environmental impacts, if any, will need to be performed.
Impact on Water Resources and Other Management Strategies
The increased demands on the Ogallala will continue to deplete the storage in the aquifer. To prolong the life of this water resource, other users may need to reduce their demands.
Impact on Agriculture and Natural Resources
No significant impact on agricultural or natural resources is expected. Increased demands on the Ogallala aquifer will continue to deplete the storage. To prolong the life of this water resource, other users may need to reduce their demands.
Other Relevant Factors
There are no other identified relevant factors.
Develop PDRA Transmission System
The Palo Duro Reservoir transmission project is an alternative strategy for Spearman. The project would have little impact on the environment, agricultural or other natural resources. Once the pipeline route is established, a more detailed analysis of the impacts should be considered. No interbasin transfer permits would be required for the Palo Duro transmission project. The use of this supply might decrease lake levels and impact recreation uses on the lake from time to time. No other impacts are expected from this
5-90

Subchapter 5D April 13, 2015 Water Management Strategies for Water Users by County Draft
project. Spearman would expect to have a capital cost of $4.8 million associated with their portion of the project. This project is evaluated for the PDRA in Chapter 5C.
Table 5D-21: Recommended Water Strategies for Spearman (ac-ft/yr)
Capital Cost ($ Millions) 2020 2030 2040 2050 2060 2070
Need 0 0 0 283 466 634 Recommended Strategies Municipal Conservation $0 24 24 25 25 26 27 New Wells $3.4 0 0 0 650 650 650 Total $3.4 24 24 25 675 676 677
5D.9.3 Hansford County Summary
Hansford County has a total projected need of 900 acre-feet per year by 2070. Much of this need can be met through conservation. The municipal needs are planned to be met through conservation and additional groundwater from the Ogallala aquifer. The county’s primary source of water, Ogallala aquifer has over 100,000 acre-feet per year of water that is not currently developed and could be used to meet water needs. The recommended water plan for Hansford County is shown in Table 5D-22.
Table 5D-22: Hansford County Water Management Plan
Water User Group Current Supplies Need Proposed Water Management Strategies
Gruver Ogallala aquifer Yes Municipal conservation, New well in Ogallala
Spearman Ogallala aquifer Yes Municipal conservation, New well in Ogallala
County-Other Ogallala aquifer No None
Irrigation Ogallala aquifer, Canadian River Yes Irrigation conservation
Livestock Ogallala aquifer and local supply (stock ponds) No None
Manufacturing Ogallala aquifer No None Mining Ogallala aquifer No None
Steam Electric None - -
5-91

Subchapter 5D April 13, 2015 Water Management Strategies for Water Users by County Draft
5D.10 Hartley County
Hartley County is located in the far northwestern part of the PWPA. Dalhart is the largest city in Hartley County with a total population of approximately 8,800, of which about one-third are located in Hartley County. The remaining population is in Dallam County.
Hartley County is one of the larger irrigation water users in the region. The primary source of water in the county is the Ogallala aquifer. Smaller quantities of groundwater from the Dockum aquifer and local livestock supply are also used in the county.
There is plenty of water available from the Ogallala aquifer in Hartley County, but the use is concentrated in the heavily irrigated areas, which results in large water declines over time. Due to the geographic constraints imposed by the water supply allocation process, there are projected needs for the City of Dalhart and irrigated agriculture. The recommended strategies to meet the needs for irrigation is conservation, which is discussed in Chapter 5B. The potential strategies for Dalhart are discussed in Section 5D.5, under Dallam County.
5D.10.1 Hartley County Irrigation
The irrigation needs in Hartley County peak at over 98,000 acre-feet per year over the planning period. These needs cannot be fully met through conservation in the early decades. A summary of the projected water needs and strategies for Hartley County irrigation is shown in Table 5D-23. The irrigation conservation strategy is discussed in Section 5B.2.
Table 5D-23: Recommended Water Strategies for Irrigation (ac-ft/yr)
Capital Cost ($ Millions) 2020 2030 2040 2050 2060 2070
Need 77,305 93,368 98,650 92,699 83,415 74,130 Recommended Strategies Irrigation Conservation $01 29,197 52,161 90,476 103,095 113,047 120,509 Total $0 29,197 52,161 90,476 103,095 113,047 120,509
1 Irrigation conservation costs are determined on an annual basis as shown in 5B.2
5D.10.2 Hartley County Summary
Hartley County has a total projected water need of over 99,000 acre-feet per year. Much of this need can be met through conservation. The municipal needs are planned to be met through conservation and
5-92

Subchapter 5D April 13, 2015 Water Management Strategies for Water Users by County Draft
additional groundwater from the Ogallala aquifer. However, not all of the need for irrigated agriculture can be met through conservation. There is a projected unmet water need for Irrigation of about 48,100 acre-feet in 2020, which decreases to zero by 2050. After 2050, there is potential water savings above the projected needs. This indicates potential aquifer storage depletions early in the planning period could be offset by water savings in later decades. The recommended water plan for Hartley County is shown in Table 5D-24. The unmet needs are shown in Table 5D-25.
Table 5D-24: Hartley County Water Management Plan
Water User Group Current Supplies Need Proposed Water Management Strategies
Dalhart Ogallala aquifer No Municipal Conservation, Additional Ogallala
County-Other Ogallala aquifer No None Irrigation Ogallala aquifer Yes Irrigation conservation
Livestock Ogallala and Dockum aquifers and local supply (stock ponds) No None
Manufacturing Ogallala aquifer No None Mining None - -
Steam Electric None - -
Table 5D-25: Unmet Water Needs in Hartley County (ac-ft/yr)
Water User Group 2020 2030 2040 2050 2060 2070
Irrigation (48,108) (41,207) (8,174) 0 0 0
5D.11 Hemphill County
Hemphill County is located along the eastern edge of the PWPA. The City of Canadian, with a population of 3,000 is the largest city in the county. Water users in Hemphill County obtain their current water supplies from the Ogallala aquifer, with a small amount coming from the local supplies for livestock. Current sources of supply are shown to be adequate with no projected water need over the planning period. It is recommended that conservation be implemented for Canadian and irrigation to preserve supplies for future use. A summary of the recommended water plan for Hemphill County is shown in Table 5D-26.
5-93

Subchapter 5D April 13, 2015 Water Management Strategies for Water Users by County Draft
Table 5D-26: Hemphill County Water Management Plan
Water User Group Current Supplies Need Proposed Water Management Strategies
Canadian Ogallala aquifer No Conservation County-Other Ogallala aquifer No None
Irrigation Ogallala aquifer No Irrigation conservation
Livestock Ogallala aquifer and local supply (stock ponds) No None
Manufacturing Ogallala aquifer No None Mining Ogallala aquifer No None
Steam Electric None - -
5D.12 Hutchinson County
Hutchinson County is located in the center of the PWPA along the Canadian River break, with Lake Meredith located in the southwestern part of the county. The Ogallala aquifer underlies most of the county. The largest city in Hutchinson County is Borger.
The entities in Hutchinson County obtain their water from the Ogallala aquifer and CRMWA. Borger receives water from CRMWA and is also a wholesale water provider because it provides considerable supplies to manufacturing water users. The water supply plan for Borger is discussed in Chapter 5C, but is also included in the summary of this section for completeness.
Hutchinson County is projected to have a small need beginning in 2020 and increasing to over 7,000 acre-feet by 2070. Most of this need is associated with the City of Borger and its customers (manufacturing). The City of Stinnett and TCW Water Supply Corporation are projected to have needs over the planning period.
5D.12.1 City of Borger
The City of Borger is a wholesale water provider. The city currently obtains water from CRMWA and multiple well fields. Borger provides a significant portion of the manufacturing supplies in Hutchinson County and some water to manufacturing users in Carson County. Borger is currently developing additional groundwater to serve its retail and wholesale customers. With these new supplies Borger has sufficient water to meet the projected needs over the planning period. The recommended water
5-94

Subchapter 5D April 13, 2015 Water Management Strategies for Water Users by County Draft
management strategies for the City of Borger are water conservation, additional groundwater and contractual supplies from CRMWA. Discussion of these strategies is found in Section 5C.3.
5D.12.2 City of Stinnett
The City of Stinnett currently obtains its water supply from the Ogallala aquifer. Due to declining well production of the city’s current well field, Stinnett will need to develop additional supplies before 2050. Projected needs for Stinnett range from 115 acre-feet in 2050 to 216 acre-feet in 2070. These needs can be met through additional groundwater development to replace reductions in capacities. As a member of the PDRA, Stinnett may be interested in developing a regional transmission system to use water from Palo Duro Reservoir. This strategy is evaluated for PDRA in Chapter 5C. The potential water management strategies for Stinnett include:
• Municipal Conservation (see Section 5B.1)
• Drill Additional Groundwater Well
• Develop PDRA Transmission System (See Section 5C.6)
Drill Additional Groundwater Wells
This strategy assumes that one new well will be drilled to provide approximately 225 acre-feet per year. Treatment associated with this strategy is minimal and most likely includes chlorine disinfection. This well is assumed to be approximately 380 feet below the surface. It is assumed the new well would be drilled near the City’s existing wells. Well field piping would be installed to connect to the current transmission system to the city. There is no additional transmission to the city.
Time Intended to Complete
The wells will be completed prior to 2050.
Quantity, Reliability and Cost
The quantity of water from these strategies should be able to produce 225 acre-feet per year with average well capacities of 625 gpm. Reliability of Ogallala supplies is moderate since availability depends on other water users. For cost purposes, it is assumed that the new wells would be located within the existing well field. The capital cost for the additional groundwater well is approximately $0.9 million.
Environmental Issues
No significant environmental impact is expected for this strategy.
Impact on Water Resources and Other Management Strategies
The increased demands on the Ogallala will continue to deplete the storage in the aquifer. To prolong the life of this water resource, other users may need to reduce their demands.
5-95

Subchapter 5D April 13, 2015 Water Management Strategies for Water Users by County Draft
Impact on Agriculture and Natural Resources
No significant impact on agricultural or natural resources is expected for the recommended strategies.
Other Relevant Factors
There are no other identified relevant factors.
Develop PDRA Transmission System
The Palo Duro Reservoir transmission project is an alternative strategy for Stinnett. The project would have little impact on the environment, agricultural or other natural resources. Once the pipeline route is established, a more detailed analysis of the impacts should be considered. No interbasin transfer permits would be required for the Palo Duro transmission project. The use of this supply might decrease lake levels and impact recreation uses on the lake from time to time. No other impacts are expected from this project. Stinnett would expect to have a capital cost of $7.5 million associated with their portion of the project. This project is evaluated for the PDRA in Chapter 5C.
The recommended strategies for Stinnett are shown in Table 5D-27.
Table 5D-27: Recommended Water Strategies for Stinnett (ac-ft/yr)
Capital Cost ($ Millions) 2020 2030 2040 2050 2060 2070
Need 0 0 0 115 165 216 Recommended Strategies Municipal Conservation $0 37 38 37 37 37 37 New Wells $0.9 0 0 0 225 225 225 Total $0.9 37 38 37 262 262 262
5D.12.3 TCW Supply
The TCW Supply supplies water to the City of Sanford and currently obtains its water supply from the Ogallala aquifer in Hutchinson County. It also has an emergency connection with the city of Borger. Based on the availability of the TCW’s current wells, the water provider will need to develop additional supplies by 2020. Projected needs for TCW Supply range from 75 acre-feet in 2020 to 569 acre-feet in 2070. To meet these needs, TCW Supply would need to expand its well field or purchase water from Borger. The potential water management strategies include:
• Municipal Conservation (see Section 5B.1)
• Drill Additional Groundwater Well
• Purchase water from Borger
Drill Additional Groundwater Wells
5-96

Subchapter 5D April 13, 2015 Water Management Strategies for Water Users by County Draft
This strategy assumes that 2 new wells will be drilled to provide approximately 350 acre-feet per year. Treatment associated with this strategy is minimal and most likely includes chlorine disinfection. These wells are assumed to be approximately 575 feet below the surface. It is uncertain where the new wells will be located. For planning purposes, it is assumed that the wells would be located within 2 miles of TCW Supply’s distribution system. A 12-inch transmission pipeline and pump station are included in this strategy.
Time Intended to Complete
The wells will be completed prior to 2020. It is likely that the wells may be installed in phases; however, for planning purposes, the costs and supplies are shown for the full strategy.
Quantity, Reliability and Cost
The quantity of water from this strategy should be able to produce 575 acre-feet per year with average well capacities of 360 gpm. Reliability of Ogallala supplies is moderate since availability depends on other water users. The capital cost for the additional groundwater well is approximately $3.9 million, and includes the purchase of additional water rights. If TCW Supply can utilize its existing infrastructure, the costs would likely be less.
Environmental Issues
No significant environmental impact is expected for this strategy.
Impact on Water Resources and Other Management Strategies
The increased demands on the Ogallala will continue to deplete the storage in the aquifer. To prolong the life of this water resource, other users may need to reduce their demands.
Impact on Agriculture and Natural Resources
It is uncertain whether TCW Supply already holds sufficient groundwater rights or whether additional rights would need to be obtained. It is assumed if water rights are purchased from agricultural or rural water users, it would be on a willing buyer-willing seller basis. No significant impact on agricultural and natural resources is expected for this strategy.
Other Relevant Factors
There are no other identified relevant factors.
Purchase Water from Borger
This strategy assumes TCW Supply would purchase the needed supply from the City of Borger. The water supplier has a connection to Borger’s system and has purchased water from Borger in the past. This strategy could be implemented independently for the entire need or for a portion of TCW’s projected
5-97

Subchapter 5D April 13, 2015 Water Management Strategies for Water Users by County Draft
need. Borger is planning to develop additional groundwater and has sufficient supplies to serve TCW Supply. (Borger’s strategies are discussed in Chapter 5C.) It is uncertain whether infrastructure improvements would be required to provide the full amount of the projected need. For this plan, it is assumed that capital improvements would be needed at an estimated cost of $250,000. This is an alternate strategy for TCW Supply.
Table 5D-28: Recommended Water Strategies for TCW Supply (ac-ft/yr)
Capital Cost ($ Millions) 2020 2030 2040 2050 2060 2070
Need 75 251 375 466 535 569 Recommended Strategies Municipal Conservation $0 58 59 59 59 59 59 New Wells $3.9 575 575 575 575 575 575 Total $3.9 633 634 634 634 634 634
5D.12.4 Hutchinson County Manufacturing
Hutchinson County manufacturers currently obtain water directly from the Ogallala aquifer in Hutchinson County and from the City of Borger, including direct reuse. Hutchinson County manufacturing users have needs ranging from nearly 860 to 4,416 acre-feet per year beginning in 2030 due to increasing demands and limited supplies from Borger. As Borger develops strategies to meet its demands, the needs for manufacturing in Hutchinson County will be met. The City of Borger is a wholesale water provider. The strategies recommended for Borger are discussed in Section 5C.3.
5D.12.5 Hutchinson County Summary
Hutchinson County can fully meet its projected needs through the development of water strategies by the wholesale water providers, Borger and CRMWA, the development of additional groundwater in the Ogallala, and conservation. While irrigation does not a need over the planning period, it is recommended that conservation measures identified in Chapter 5B be implemented to preserve the groundwater supplies for future use. Table 5D-29 shows the recommended water plan for Hutchinson County.
Table 5D-29: Hutchinson County Water Management Plan
Water User Group Current Supplies Need Proposed Water Management Strategies
Borger Ogallala aquifer and CRMWA system Yes
Municipal Conservation, new wells in Ogallala and contractual supplies
from CRMWA Fritch Ogallala aquifer No Municipal conservation
Stinnett Ogallala aquifer No Municipal conservation, new well in Ogallala
5-98
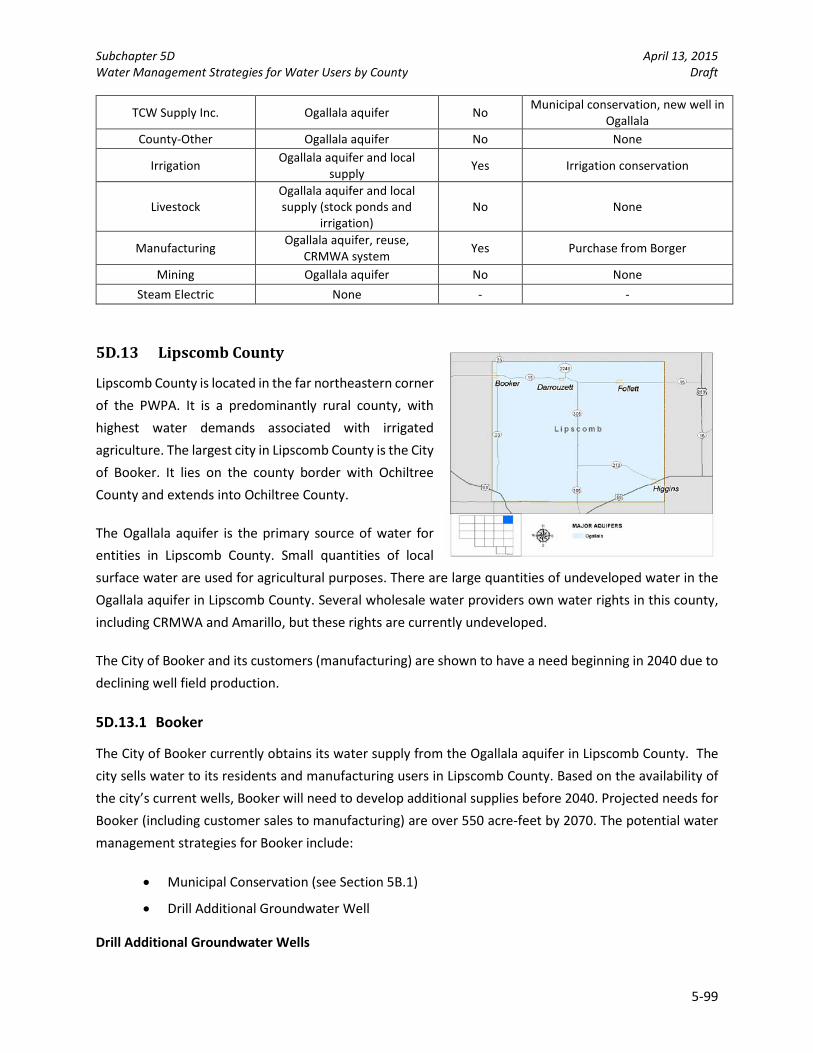
Subchapter 5D April 13, 2015 Water Management Strategies for Water Users by County Draft
TCW Supply Inc. Ogallala aquifer No Municipal conservation, new well in Ogallala
County-Other Ogallala aquifer No None
Irrigation Ogallala aquifer and local supply Yes Irrigation conservation
Livestock Ogallala aquifer and local supply (stock ponds and
irrigation) No None
Manufacturing Ogallala aquifer, reuse, CRMWA system Yes Purchase from Borger
Mining Ogallala aquifer No None Steam Electric None - -
5D.13 Lipscomb County
Lipscomb County is located in the far northeastern corner of the PWPA. It is a predominantly rural county, with highest water demands associated with irrigated agriculture. The largest city in Lipscomb County is the City of Booker. It lies on the county border with Ochiltree County and extends into Ochiltree County.
The Ogallala aquifer is the primary source of water for entities in Lipscomb County. Small quantities of local surface water are used for agricultural purposes. There are large quantities of undeveloped water in the Ogallala aquifer in Lipscomb County. Several wholesale water providers own water rights in this county, including CRMWA and Amarillo, but these rights are currently undeveloped.
The City of Booker and its customers (manufacturing) are shown to have a need beginning in 2040 due to declining well field production.
5D.13.1 Booker
The City of Booker currently obtains its water supply from the Ogallala aquifer in Lipscomb County. The city sells water to its residents and manufacturing users in Lipscomb County. Based on the availability of the city’s current wells, Booker will need to develop additional supplies before 2040. Projected needs for Booker (including customer sales to manufacturing) are over 550 acre-feet by 2070. The potential water management strategies for Booker include:
• Municipal Conservation (see Section 5B.1)
• Drill Additional Groundwater Well
Drill Additional Groundwater Wells
5-99

Subchapter 5D April 13, 2015 Water Management Strategies for Water Users by County Draft
This strategy assumes that 2 new wells will be drilled to provide approximately 550 acre-feet per year. Treatment associated with this strategy is minimal and most likely includes chlorine disinfection. These wells are assumed to be approximately 480 feet below the surface. The new wells will be drilled near the City’s existing wells. Well field piping will be installed to connect to the current collection system. There is no additional transmission to the city.
Time Intended to Complete
The wells will be completed prior to 2040.
Quantity, Reliability and Cost
The quantity of water from these strategies should be able to produce 550 acre-feet per year with average well capacities of 500 gpm. Reliability of Ogallala supplies is high since there is large quantities of undeveloped supplies. The capital cost for the additional groundwater wells is approximately $1.5 million.
Environmental Issues
No significant environmental impact is expected for this strategy.
Impact on Water Resources and Other Management Strategies
The increased demands on the Ogallala will continue to deplete the storage in the aquifer in the vicinity of the new wells. These impacts are expected to be minor.
Impact on Agriculture and Natural Resources
No significant impact on agricultural or natural resources is expected for the recommended strategies. It is assumed that the new wells will be located near the city and not in agricultural areas.
Other Relevant Factors
There are no other identified relevant factors.
Table 5D-30: Recommended Water Strategies for Booker (ac-ft/yr)
Capital Cost ($ Millions) 2020 2030 2040 2050 2060 2070
Need 0 0 100 333 456 575 Recommended Strategies Municipal Conservation $0 15 17 18 19 20 21 New Well $1.5 550 550 550 560 Total $1.5 15 17 568 569 570 581
5-100

Subchapter 5D April 13, 2015 Water Management Strategies for Water Users by County Draft
5D.13.2 Lipscomb County Manufacturing
Lipscomb County manufacturers currently get water supply from the Ogallala aquifer in Lipscomb County and from the City of Booker. The needs identified for manufacturing users in Lipscomb County are associated with the City of Booker. As Booker develops strategies to meet its demands, the needs for manufacturing in Lipscomb County will be met. The recommended strategies for additional supply include purchasing water from Booker.
5D.13.3 Lipscomb County Summary
Lipscomb County has plenty of undeveloped water in the Ogallala aquifer. The needs identified for users in the county are associated with expected declines in production of existing wells. With further development of water from the Ogallala aquifer, Lipscomb County can fully meet its projected water needs. While irrigation does not a need over the planning period, it is recommended that conservation measures identified in Chapter 5B be implemented to preserve the groundwater supplies for future use. Conservation is not recommended for County-Other because there is no specific sponsor. Table 5D-31 shows the recommended water plan for Lipscomb County.
Table 5D-31: Lipscomb County Water Management Plan
Water User Group Current Supplies Need Proposed Water Management Strategies
Booker Ogallala aquifer Yes Municipal conservation, new wells in Ogallala
County-Other Ogallala aquifer No None
Irrigation Ogallala aquifer and Canadian River No Irrigation conservation
Livestock Ogallala aquifer and local supply (stock ponds and
irrigation) No None
Manufacturing Ogallala aquifer Yes Purchase from Booker Mining Ogallala aquifer No None
Steam Electric None - -
5-101

Subchapter 5D April 13, 2015 Water Management Strategies for Water Users by County Draft
5D.14 Moore County
Moore County is located in northwest portion of the PWPA. It is one of the four larger irrigation counties in the region. Agricultural water use accounts for 90 percent of the water used in the county. The largest city in Moore County is Dumas with a population of over 16,000.
The Ogallala aquifer provides nearly all of the water supplies in Moore County. The cities of Cactus, Dumas and Sunray are member cities of the PDRA, but they currently do not receive water from PDRA. Due to the competition for water, Moore County is shown to have a need of about 2,600 acre-feet per year in 2020 and increasing to 20,760 acre-feet per year by 2070. Irrigation and manufacturing are the uses with the largest needs, but municipal use also shows need beginning in 2020.
5D.14.1 Cactus
The City of Cactus in Moore County is a member of the PDRA and a wholesale water provider to manufacturing users in Moore County. The current supply for Cactus is the Ogallala aquifer in Moore County. Cactus is expected to need additional water supplies beginning in 2020 to serve its municipal and industrial customers. The recommended water management strategies for the City of Cactus are water conservation and development of additional groundwater from the Ogallala. Discussion of these strategies is found in Section 5C.4.
5D.14.2 Dumas
The City of Dumas is located in Moore County and is the largest member city of the PDRA. Currently, Dumas obtains its water supply from its own wells in the Ogallala aquifer in Moore County. Dumas is expected to need additional water to meet its demand throughout the planning period (2020-2070). By 2070, the projected needs for Dumas are over 4,400 acre-feet per year. Dumas has approximately 27,800 acre-feet of undeveloped groundwater rights in Hartley County that will be used to meet its need. To provide the full 4,400 acre-feet by 2070, the city may need to acquire additional water rights. The city intends to fully meet its projected demands with groundwater. As an alternative, Dumas may participate in the Palo Duro transmission project.
The potential water management strategies for Dumas include:
• Municipal Conservation (see Section 5B.1)
• Drill Additional Groundwater Well
• Develop PDRA Transmission System (See Section 5C.6)
5-102

Subchapter 5D April 13, 2015 Water Management Strategies for Water Users by County Draft
Drill Additional Groundwater Wells
This strategy assumes that 9 new wells would be drilled to provide approximately 4,500 acre-feet per year, and are assumed to produce water from approximately 440 feet below the surface. Treatment associated with this strategy is minimal and most likely includes chlorine disinfection. The new wells will be drilled near the City’s existing wells in Hartley County. Well field piping will be installed to connect to the current collection system. It is assumed that the existing pipeline is sufficient to transport the water to the city, but a booster pump station may be needed.
Time Intended to Complete
Some of the additional wells will be completed by 2020. This project will likely be implemented in phases, with new wells coming on line as needed. For this plan, the strategy is shown in two phases.
Quantity, Reliability and Cost
The quantity of water from these strategies should be able to produce 4,500 acre-feet per year with average well capacities of 690 gpm. Reliability of Ogallala supplies is moderate to moderate-low since availability depends on other water users and the well field is located in heavily irrigated area. For cost purposes, it is assumed that the new wells would be located within the existing well field. The capital cost for the additional groundwater well is approximately $12.5 million.
Environmental Issues
No significant environmental impact is expected for this strategy. The City already owns the water rights and no transmission system is included in this strategy.
Impact on Water Resources and Other Management Strategies
The increased demands on the Ogallala will continue to deplete the storage in the aquifer. To be able to use this water resource, other users will need to reduce their demands. There is insufficient water available in Moore County in the later decades without the reduction in irrigation water use associated with irrigation conservation. This strategy may impact other strategies that plan to develop Ogallala aquifer supplies in Moore County.
Impact on Agriculture and Natural Resources
Moderate impacts to agricultural use due to competition for water in the later decades. No significant impact on natural resources is expected for the recommended strategy. If additional water rights are needed, this strategy may reduce the irrigated acreage for farming. It is assumed that any purchase of water rights would be on a willing buyer-willing seller basis.
Other Relevant Factors
There are no other identified relevant factors.
5-103

Subchapter 5D April 13, 2015 Water Management Strategies for Water Users by County Draft
Develop PDRA Transmission System
As a member of the PDRA, Dumas may be interested in developing a regional transmission system to use water from Palo Duro Reservoir. The Palo Duro Reservoir transmission project is an alternative strategy for Dumas. The project would have very little impact on the environment, agricultural or other natural resources. Once the pipeline route is established, a more detailed analysis of the impacts should be considered. No interbasin transfer permits would be required for the Palo Duro transmission project. The use of this supply might decrease lake levels and impact recreation uses on the lake from time to time. No other impacts are expected from this project. Dumas is expected to have a capital cost of $45.6 million associated with their portion of the project. This project is fully evaluated in Chapter 5C for PDRA.
Table 5D-32: Recommended Water Strategies for Dumas (ac-ft/yr)
Capital Cost ($ Millions) 2020 2030 2040 2050 2060 2070
Need 290 1,021 1,785 2,679 3,550 4,437 Recommended Strategies Municipal Conservation $0 133 152 171 190 210 231 New Wells $12.5 2,000 2,000 2,000 4,500 4,500 4,500 Total $12.5 2,079 2,086 2,093 4,600 4,607 4,613
5D.14.3 Sunray
The City of Sunray currently obtains its water supply from the Ogallala aquifer in Moore County, and is also a member of PDRA. The projected needs for Sunray are 232 acre-feet per year in 2020 and increasing to 847 acre-feet per year by 2070. To meet these needs Sunray will need to develop additional groundwater. Alternatively, the city could also participate in the PDRA transmission project to use water from Palo Duro Reservoir.
The potential water management strategies for Sunray include:
• Municipal Conservation (see Section 5B.1)
• Drill Additional Groundwater Well
• Develop PDRA Transmission System (See Section 5C.6)
Drill Additional Groundwater Wells
To fully meet its needs Sunray will need to develop additional supply totaling approximately 850 acre-feet of water per year. Presently, Sunray owns 764 acre-feet of water rights within one mile from the City. At this time, Sunray does not have intentions of acquiring additional water rights. However, this strategy assumes that Sunray will purchase an additional water rights to account for water developed from this strategy.
5-104

Subchapter 5D April 13, 2015 Water Management Strategies for Water Users by County Draft
This strategy assumes that three new wells will be drilled near the City’s existing wells and will produce water approximately 355 feet below the surface. Two miles of well field piping 8-inches in diameter will be installed to connect to the current collection system. The strategy accounts for the construction of a new 0.2 million gallon storage tank to increase Sunray’s current storage capacity. Minimal treatment such as chlorine disinfection is required for municipal use.
Time Intended to Complete
At least one of the additional wells will be completed by 2030. This project will likely be implemented in phases, with new wells coming on line as needed. For this plan, the strategy is shown in one phase.
Quantity, Reliability and Cost
The quantity of water from these strategies should be able to produce 850 acre-feet per year with average well capacities of 470 gpm. Reliability of Ogallala supplies is moderate to moderate-low since availability depends on other water users. For cost purposes, it is assumed that the new wells would be located near the existing wells. The capital cost for the additional groundwater well is approximately $3.5 million.
Environmental Issues
No significant environmental impact is expected for this strategy. There is no transmission system included in this strategy.
Impact on Water Resources and Other Management Strategies
The increased demands on the Ogallala will continue to deplete the storage in the aquifer. To provide sufficient quantities of water in the later planning decades, other users will need to reduce their demands. It is assumed that irrigation water savings associated with irrigation conservation makes sufficient water available for this strategy.
Impact on Agriculture and Natural Resources
No significant impact on agricultural or natural resources is expected for this strategy based on the relative quantity. If additional water rights are needed, this strategy may reduce the irrigated acreage for farming. It is assumed that any purchase of water rights would be on a willing buyer-willing seller basis.
Other Relevant Factors
There are no other identified relevant factors.
Develop PDRA Transmission System
As a member of the PDRA, Sunray is interested in developing a regional transmission system to use water from Palo Duro Reservoir. The Palo Duro Reservoir transmission project is an alternative strategy for Sunray. The project would have very little impact on the environment, agricultural or other natural
5-105

Subchapter 5D April 13, 2015 Water Management Strategies for Water Users by County Draft
resources. Once the pipeline route is established, a more detailed analysis of the impacts should be considered. No interbasin transfer permits would be required for the Palo Duro transmission project. The use of this supply might decrease lake levels and impact recreation uses on the lake from time to time. No other impacts are expected from this project. Sunray is expected to have a capital cost of $9.4 million associated with their portion of the project.
Table 5D-33: Recommended Water Strategies for Sunray (ac-ft/yr)
Capital Cost ($ Millions) 2020 2030 2040 2050 2060 2070
Need 0 232 501 633 752 847 Recommended Strategies Municipal Conservation $0 37 42 46 52 57 63 New Wells $3.5 0 850 850 850 850 850 Total $3.5 39 892 893 894 895 896
5D.14.4 Moore County- Other
Moore County-Other consists of rural water users that live outside of an incorporated town or in a town with a population less than 500 people. Moore County-Other is shown to have a small need beginning in 2050. The maximum amount of the needs is 30 acre-feet per year. Some water is provided to County-Other users from the City of Dumas. The majority of Moore County-Other supply is from unincorporated rural wells in the Ogallala aquifer. There is a projected increase in demands in Moore County, which is expected to be provided in part by the local cities and in part by additional rural wells. The additional demand for County-Other provided by the cities is addressed with each city. For the remaining unmet demand, water conservation and additional wells in the Ogallala aquifer are the recommended strategies for Moore County-Other.
The potential water management strategies for Moore County-Other include:
• Municipal Conservation (see Section 5B.1)
• Drill Additional Groundwater Well
Drill Additional Groundwater Wells
This strategy assumes that one new well will be drilled near the location of need. Since County-Other is an aggregated water user group, the number of wells and locations are difficult to assess. For purposes of this plan, the strategy has no transmission and minimal well field piping. Treatment such as chlorine disinfection is required for municipal use.
Time Intended to Complete
This strategy will be in place by 2050.
5-106

Subchapter 5D April 13, 2015 Water Management Strategies for Water Users by County Draft
Quantity, Reliability and Cost
The quantity of water from these strategies should be able to produce 100 acre-feet per year with average well capacities of 175 gpm. Reliability of Ogallala supplies is moderate since availability depends on other water users. The capital cost for the additional groundwater well is approximately $0.4 million.
Environmental Issues
No significant environmental impact is expected for this strategy. There is no transmission system included in this strategy.
Impact on Water Resources and Other Management Strategies
The increased demands on the Ogallala will continue to deplete the storage in the aquifer. To prolong the life of this water resource, water conservation is also recommended.
Impact on Agriculture and Natural Resources
At the level of additional water development, no significant impact on agricultural or natural resources is expected for the recommended strategies.
Other Relevant Factors
There are no other identified relevant factors.
Table 5D-34: Recommended Water Strategies for Moore County-Other (ac-ft/yr)
Capital Cost ($ Millions) 2020 2030 2040 2050 2060 2070
Need 0 0 0 13 21 30 Recommended Strategies Municipal Conservation $0 14 15 17 19 21 23 New Wells $0.4 0 0 0 100 100 100 Total $0.4 14 15 17 119 121 123
5D.14.5 Moore County Manufacturing
The manufacturing needs in Moore County range from 1,877 to 7,746 acre-feet per year over the planning period. These needs are associated with needs for the City of Cactus, which will be met through the City of Cactus’ water management strategies. The City of Cactus is a wholesale water provider and water management strategies for this entity are discussed in Section 5C.4.
5D.14.6 Moore County Irrigation
The irrigation needs in Moore County range from about 3,900 to nearly 6,200 acre-feet per year over the planning period. These needs can be fully met through conservation. A summary of the projected water
5-107

Subchapter 5D April 13, 2015 Water Management Strategies for Water Users by County Draft
needs and strategies for Moore County is shown in Table 5D-35. The irrigation conservation strategy is discussed in Section 5B.2.
Table 5D-35: Recommended Water Strategies for Moore County Irrigation (ac-ft/yr)
Capital Cost ($ Millions) 2020 2030 2040 2050 2060 2070
Need 0 0 0 0 3,882 6,171 Recommended Strategies Irrigation Conservation $01 13,308 24,120 41,895 47,571 52,037 55,406
Total $0 13,308 24,120 41,895 47,571 52,037 55,406 1 Irrigation conservation costs are determined on an annual basis as shown in 5B.2
5D.14.7 Moore County Summary
The preferred source of water for Moore County is the Ogallala aquifer. This source is heavily used by current users, such that by 2070, the undeveloped supply in the entire county is estimated at 1,100 acre-feet per year. This is not enough water to fully meet the county’s projected needs. Conservation provides a means to balance the water supplies among users. Irrigation conservation can save over 50,000 acre-feet pear year of Ogallala water by 2060 in Moore County. Some of this water savings would become available to other users. Collectively, the municipal water users are expected to develop approximately 11,000 acre-feet per year of new supplies from the Ogallala in Moore County. This water is proposed to come from the irrigation water conservation savings. With active conservation, Moore County can meet the projected water needs. The water plan for Moore County is shown in Table 5D-36.
Table 5D-36: Moore County Water Management Plan
Water User Group Current Supplies Need Proposed Water Management Strategies
Cactus Ogallala aquifer Yes New wells in Ogallala, Municipal conservation
Dumas Ogallala aquifer Yes New wells in Ogallala, Municipal conservation
Sunray Ogallala aquifer Yes New wells in Ogallala, Municipal conservation
County-Other Ogallala aquifer Yes New wells in Ogallala, Municipal conservation
Irrigation Ogallala and Dockum aquifers, Canadian River and reuse Yes Irrigation conservation
Livestock Ogallala aquifer and local supply (stock ponds) No None
Manufacturing Ogallala aquifer Yes Purchase from Cactus Mining Ogallala aquifer No None
Steam Electric Ogallala aquifer No None
5-108

Subchapter 5D April 13, 2015 Water Management Strategies for Water Users by County Draft
5D.15 Ochiltree County
Ochiltree County is located on the Texas-Oklahoma border in the northern part of the PWPA. The largest city is Perryton, with a population over 9,500. The primary source of water in Ochiltree County is the Ogallala aquifer. Only about one-fourth of the available supply in the county has been developed. There is sufficient water to meet the county’s projected water needs. The City of Perryton is shown to have a need starting in 2020 due to declining production of its well field.
5D.15.1 Perryton
The City of Perryton currently obtains its water from the Ogallala aquifer in Ochiltree County. The city is showing a need of nearly 2,800 acre-feet per year by 2070. Some of this need may be able to be met through conservation, but Perryton will need to develop additional groundwater supplies. The city is developing additional supplies from the Ogallala aquifer to help meet the growing water demands and replace production losses of the existing well field. The potential water management strategies for Perryton include:
• Municipal Conservation (see Section 5B.1)
• Drill Additional Groundwater Well
Drill Additional Groundwater Wells
This strategy assumes that 8 new wells would be drilled to provide approximately 2,800 acre-feet per year, and the wells are assumed to produce water from approximately 530 feet below the surface. Treatment associated with this strategy is minimal and most likely includes chlorine disinfection. It is assumed that the new wells will be drilled near the city’s existing wells in Ochiltree County, but the exact location is uncertain or if the city has sufficient water rights to expand its existing well field. For this plan, it is assumed that a new well field will be developed within two miles of Perryton’s existing infrastructure. The strategy includes a 2-mile 18-inch pipeline to transport the water to the city.
Time Intended to Complete
Some of the additional wells will be completed by 2020. This project will likely be implemented in phases, with new wells coming on-line as needed. For this plan, the strategy is shown in two phases.
5-109

Subchapter 5D April 13, 2015 Water Management Strategies for Water Users by County Draft
Quantity, Reliability and Cost
The quantity of water from these strategies should be able to produce 2,800 acre-feet per year with average well capacities of 490 gpm. Reliability of Ogallala supplies is high. The capital cost for the additional groundwater well is approximately $10.6 million.
Environmental Issues
No significant environmental impact is expected for this strategy.
Impact on Water Resources and Other Management Strategies
The increased demands on the Ogallala will continue to deplete the storage in the aquifer. There are sufficient undeveloped water in the Ogallala aquifer in Ochiltree County.
Impact on Agriculture and Natural Resources
No significant impact on agricultural or natural resources is expected for the recommended strategies. If additional water rights are needed, this strategy may reduce the irrigated acreage for farming. It is assumed that any purchase of water rights would be on a willing buyer-willing seller basis.
Other Relevant Factors
There are no other identified relevant factors.
Table 5D-37: Recommended Water Strategies for Perryton (ac-ft/yr)
Capital Cost ($ Millions) 2020 2030 2040 2050 2060 2070
Need 478 963 1,438 1,877 2,341 2,786 Recommended Strategies Municipal Conservation $0 85 90 96 103 111 119 New Wells $10.6 1,400 1,400 1,400 2,800 2,800 2,800 Total $10.6 1,546 1,561 1,578 3,002 3,020 3,040
5D.15.2 Ochiltree County Summary
Ochiltree County has plenty of undeveloped water in the Ogallala aquifer. The needs identified for the City of Perryton are associated with expected declines in production of existing wells and increases in demands. With further development of water from the Ogallala aquifer, Ochiltree County can fully meet its projected water needs. While irrigation does not have a need over the planning period, it is recommended that conservation measures identified in Chapter 5B be implemented to preserve the groundwater supplies for future use. Conservation is not recommended for County-Other because there is no specific sponsor. Table 5D-38 shows the recommended water plan for Ochiltree County.
5-110

Subchapter 5D April 13, 2015 Water Management Strategies for Water Users by County Draft
Table 5D-38: Ochiltree County Water Management Plan
Water User Group Current Supplies Need Proposed Water Management Strategies
Perryton Ogallala aquifer Yes Conservation, New wells in Ogallala aquifer
County-Other Ogallala aquifer No None Irrigation Ogallala aquifer No Irrigation conservation
Livestock Ogallala aquifer and local supply (stock ponds) No None
Manufacturing None - - Mining Ogallala aquifer No None
Steam Electric None - - 5D.16 Oldham County
Oldham County is located in the far southwestern part of the region. The county borders New Mexico to the west and the Llano-Estacado Region to the south. Oldham is a rural county, with demands totaling about 6,200 acre-feet per year. A geologic break in the Ogallala aquifer occurs in Oldham County, resulting in large non-productive areas in the county. The largest city in Oldham County is the City of Vega, with a population of less than 1,000.
Most of the water supply in Oldham County is obtained from the Ogallala and Dockum aquifers. The county has sufficient supplies to meet the projected demands through the planning period. Conservation is recommended for the City of Vega and irrigation use. Water saved through these measures can be used for future needs. Conservation measures are discussed in Chapter 5B. Table 5D-39 shows the recommended water plan for Oldham County.
Table 5D-39: Oldham County Water Management Plan
Water User Group Current Supplies Need Proposed Water Management Strategies
Vega Ogallala aquifer No Municipal Conservation County-Other Ogallala and Dockum aquifers No None
Irrigation Ogallala and Dockum aquifers No Irrigation conservation
Livestock Ogallala and Dockum aquifers and local supply (stock ponds) No None
Manufacturing None - - Mining Ogallala and Dockum aquifers No None
Steam Electric None - -
5-111

Subchapter 5D April 13, 2015 Water Management Strategies for Water Users by County Draft
5D.17 Potter County
Potter County is located along the southern boundary of the Canadian River Basin. The Canadian River runs through Potter County and flows into Lake Meredith to the northeast. A geologic break in the Ogallala aquifer occurs in Potter County, resulting in large non-productive areas in the county. Amarillo is the largest city in Potter County with a total population over 200,000, of which slightly more than half is located in Potter County. The remaining population is in Randall County.
Most of the demands in Potter County are associated with the City of Amarillo and Steam Electric Power. Amarillo obtains much of its water supplies from outside of the county through CRMWA and multiple well fields. All of the Steam Electric Power demands are met from reuse from Amarillo. The remaining in-county water users obtain water from the Ogallala and Dockum aquifers. There is some additional reuse and local supplies used for irrigated agriculture and livestock use.
Potter County is found to have a projected need of over 39,000 acre-feet per year, of which is mostly associated with the City of Amarillo. County-Other and some manufacturing water use will not be served by Amarillo and strategies will need to be developed.
5D.17.1 Amarillo
The City of Amarillo is a water user group and a wholesale water provider in the PWPA. The current sources of water include well fields in the Ogallala aquifer, reuse, and purchasing surface water and groundwater from the Canadian River Municipal Water Authority (CRMWA). The recommended strategies for the City of Amarillo include water conservation, the development of Phase 2 of the Potters County well field, expanding the Carson County well field, and development of the Roberts County well field. Additional information regarding Amarillo’s recommended strategies is found in Section 5C.2.
5D.17.2 Potter County – Other
The demands for Potter County-Other increase by about 1,700 acre-feet per year by 2070. The projected needs are approximately 680 acre-feet per year in 2020, increasing to over 2,500 acre-feet per year by 2070 for the Red and Canadian basins combined. Small water supply corporations supply a portion of these demands. The majority of Potter County-Other supply is from unincorporated rural wells in the Ogallala aquifer. It is anticipated that this pattern will continue over the planning period, and it is assumed that as demands increase, additional rural municipal wells will be installed. However, there is not sufficient undeveloped groundwater supplies to meet all of the projected need for County-Other and other users. It is assumed that additional wells will be developed in the Dockum and Ogallala aquifers for
5-112

Subchapter 5D April 13, 2015 Water Management Strategies for Water Users by County Draft
a total supply of 1,600 acre-feet per year. This results in an unmet need of about 500 acre-feet per year, after conservation. If Amarillo is willing, Amarillo could sell water to Potter County-Other. This has not been confirmed with the city.
The potential water management strategies for Potter County-Other include:
• Municipal Conservation (see Section 5B.1)
• Drill Additional Groundwater Well in Ogallala aquifer
• Drill Additional Groundwater Well in Dockum aquifer
5-113

Subchapter 5D April 13, 2015 Water Management Strategies for Water Users by County Draft
Drill Additional Groundwater Wells in Ogallala aquifer
This strategy assumes that 15 new wells will be drilled near the location of need. Since County-Other is an aggregated water user group, the number of wells and locations are difficult to assess. For purposes of this plan, the strategy has no transmission and minimal well field piping. Treatment such as chlorine disinfection is required for municipal use.
Time Intended to Complete
This strategy will be in place by 2020. Wells will be drilled as needed.
Quantity, Reliability and Cost
The quantity of water from this strategy should be able to produce 900 acre-feet per year with average well capacities of 70 gpm. Water is assumed to be produced from approximately 240 feet below the ground surface. Reliability of Ogallala supplies is low to moderate since there is limited supplies and competition for the water. The capital cost for the additional groundwater well is approximately $4.
Environmental Issues
No significant environmental impact is expected for this strategy. There is no transmission system included in this strategy.
Impact on Water Resources and Other Management Strategies
The increased demands on the Ogallala will continue to deplete the storage in the aquifer. The supply amount assumed for this strategy respects the MAG limits and should not impact other strategies. To prolong the life of this water resource, water conservation is also recommended.
Impact on Agriculture and Natural Resources
There is little agricultural use in Potter County. Therefore, no significant impact on agricultural or natural resources is expected from this strategy.
Other Relevant Factors
There are no other identified relevant factors.
Drill Additional Groundwater Wells in Dockum aquifer
This strategy assumes that 12 new wells will be drilled near the location of need. Since County-Other is an aggregated water user group, the number of wells and locations are difficult to assess. For purposes of this plan, the strategy has no transmission and minimal well field piping. Treatment such as chlorine disinfection is required for municipal use.
5-114

Subchapter 5D April 13, 2015 Water Management Strategies for Water Users by County Draft
Time Intended to Complete
This strategy will be in place by 2020. Wells will be drilled as needed.
Quantity, Reliability and Cost
The quantity of water from these strategies should be able to produce 700 acre-feet per year with average well capacities of 70 gpm. Water is assumed to be produced from approximately 250 feet below the ground surface. Reliability of Dockum supplies is low to moderate since there is limited supplies and competition for the water. The capital cost for the additional groundwater well is approximately $3.3.
Environmental Issues
No significant environmental impact is expected for this strategy. There is no transmission system included in this strategy.
Impact on Water Resources and Other Management Strategies
The increased demands on the Dockum will continue to deplete the storage in the aquifer. The supply amount assumed for this strategy respects the MAG limits and should not impact other strategies.
Impact on Agriculture and Natural Resources
There is little agricultural use in Potter County. Therefore, no significant impact on agricultural or natural resources is expected from this strategy.
Other Relevant Factors
There are no other identified relevant factors.
Table 5D-40: Recommended Water Strategies for Potter County-Other (ac-ft/yr)
Capital Cost ($ Millions) 2020 2030 2040 2050 2060 2070
Need 683 956 1,262 1,583 1,953 2,548 Recommended Strategies Conservation $0 266 291 318 347 379 413 New Wells (Dockum) $3.3 700 700 700 700 700 700
New Wells (Ogallala) $4 0 900 900 900 900 900
Total $7.3 966 1,891 1,918 1,947 1,979 2,013
5D.17.3 Potter County Manufacturing
The current supplies for manufacturing in Potter County include self-supplied Ogallala water and water purchased from Amarillo. Much of the water for manufacturing is currently supplied by the City of
5-115

Subchapter 5D April 13, 2015 Water Management Strategies for Water Users by County Draft
Amarillo via contracts to Tyson and ASARCO, Inc. The projected needs for manufacturing are 2,000 acre-feet in 2020 and, increasing to 9,600 acre-feet in 2070. Of these needs, Amarillo is expected to meet up to 4,000 acre-feet per year in 2070. The remaining shortage would be met with new strategies. Potentially feasible strategies for manufacturing are limited due to the availability of local groundwater and competition for these supplies. There is some Ogallala water available in early decades but none after 2050. Considering these limitations the potential water management strategies for Potter County Manufacturing include:
• Purchase water from Amarillo
• Purchase direct reuse water from Amarillo
Table 5D-41: Recommended Water Strategies for Potter County Manufacturing (ac-ft/yr)
Capital Cost ($ Millions) 2020 2030 2040 2050 2060 2070
Need 2,099 3,611 5,239 6,714 8,130 9,633 Recommended Strategies Purchase from Amarillo 4,000 4,000 4,000 4,000 4,000 4,000 Purchase reuse water from Amarillo $57.7 0 0 5,700 5,700 5,700 5,700
Total $39.0 4,000 4,000 9,700 9,700 9,700 9,700
5D.17.4 Potter County Summary
Potter County has a projected need of over 38,500 acre-feet by 2070. Most of this need is associated with the City of Amarillo and will be met through their strategies which are discussed in Section 5C.2. The remainder of the need will be met by municipal conservation, drilling of additional wells and contractual supplies from CRMWA. Manufacturing needs will be met with purchases from Amarillo for potable and reuse supplies. While irrigation does not have a projected need, conservation is recommended. The recommended water plan for Potter County is shown in Table 5D-42. Table 5D-43 shows a small unmet need to Potter County-Other in 2070.
5-116

Subchapter 5D April 13, 2015 Water Management Strategies for Water Users by County Draft
Table 5D-42: Potter County Water Management Plan
Water User Group Current Supplies Need Proposed Water Management Strategies
Amarillo CRMWA system Ogallala aquifer Yes
Potter, Roberts and Carson Counties well fields, Municipal conservation, and contracted
supplies from CRMWA
County-Other Ogallala and Dockum aquifers Yes New wells in Ogallala and Dockum, Municipal conservation
Irrigation Ogallala aquifer, local supply and reuse No Irrigation conservation
Livestock Ogallala and Dockum aquifers and local supply (stock ponds) No None
Manufacturing Ogallala aquifer & CRMWA system Yes Purchase from Amarillo
Mining Ogallala aquifer No None
Steam Electric Ogallala aquifer, CRMWA system and reuse No None
Table 5D-43: Unmet Water Needs in Potter County (ac-ft/yr)
Water User Group 2020 2030 2040 2050 2060 2070
County-other 0 0) 0 0 0 (535)
5D.18 Randall County
Randall County is located in the southern portion of the PWPA. Amarillo is a major population center for the County. Slightly less than half of Amarillo’s 210,000 people reside in Randall County. The remaining portion of the population live in Potter County. Other towns in Randall County include Canyon and Lake Tanglewood. A small portion of Happy falls in Randall County but it is being planned for the Llano Estacado Region, where it is primarily located.
Current sources of water include the Ogallala Aquifer, reuse, and supplies from CRMWA’s system. Several water users show needs over the planning period due to increasing demands and declining water levels over time within the user’s existing well fields. Needs are projected for Amarillo, Canyon, Lake Tanglewood, County-Other and Manufacturing.
5-117

Subchapter 5D April 13, 2015 Water Management Strategies for Water Users by County Draft
5D.18.1 Amarillo
The City of Amarillo is a water user group and a wholesale water provider in Region A. The current sources of water include well fields in the Ogallala aquifer, reuse, and purchasing surface water and groundwater from CRMWA. The recommended strategies for the City of Amarillo include water conservation, the development of the Potter County Phase II well field, expansion of Carson County well field, and development of the Roberts County well field. Additional information regarding Amarillo’s recommended strategies is found in Section 5C.2.
5D.18.2 Canyon
Canyon currently buys water from the City of Amarillo, as well as using groundwater from its own wells in the Ogallala and Dockum aquifers. Canyon is shown to have needs beginning in 2020 with a projected need of 4,313 acre-feet per year by 2070. The potential water management strategies for Canyon include:
• Municipal Conservation (see Section 5B.1)
• Drill Additional Groundwater Wells in Randall County
Drill Additional Groundwater Wells in Randall County
The City is in the process of expanding their existing Kim Road Well Field and developing the Rockwell Road Well Field at the writing of this plan. It is likely that these wells will produce from the Dockum aquifer. However, there is insufficient supplies from the Dockum based on the MAG values to fully meet the city’s projected needs. As a result the city would also need to utilize water from the Ogallala aquifer. For the purposes of this plan, it is estimated that 9 wells will be drilled in the Dockum and Ogallala aquifers by 2070 to provide an estimated 4,300 acre-feet of additional water supply.
Time Intended to Complete
The City is currently in the process of developing and constructing a significant portion of this supply now. For planning purposes, the strategy cost and supplies are developed in one phase by 2020. However, the city may choose to drill the wells in phases.
Quantity, Reliability, and Cost
The quantity of water from this strategy is 4,300 acre-feet and should be sufficient to meet the City’s needs. The reliability of the additional supply from groundwater is moderate. There is competition for groundwater in Randall County which can impact the long-term reliability of this source. The capital cost for additional infrastructure is estimated at $11.6 million with a unit cost of water at $425 per acre-foot.
Environmental Issues
No significant environmental impacts are expected as a result of drilling the additional wells.
5-118

Subchapter 5D April 13, 2015 Water Management Strategies for Water Users by County Draft
Impact on Water Resources and Other Management Strategies
Long-term water quality of the Ogallala and Dockum aquifer in Randall County is unknown. Throughout much of the aquifer, groundwater withdrawals exceed the amount of recharge, and water levels have declined consistently through time. This strategy will place additional demands on these sources, which will continue to deplete available storage. The strategy is not expected to have significant impacts on other management strategies.
Impact on Agriculture and Natural Resources
No significant impact on agricultural or natural resources is expected for the recommended strategies.
Other Relevant Factors
There are no other relevant factors associated with these strategies.
Table 5D-44: Recommended Water Strategies for Canyon (ac-ft/yr)
Capital Cost ($ Millions) 2020 2030 2040 2050 2060 2070
Need 1,009 1,589 2,176 2,770 3,779 4,313 Recommended Strategies Municipal Conservation 127 142 156 171 187 203 New Wells $11.6 1,400 2,100 2,800 2,800 3,800 4,300 Total $11.6 1,527 2,242 2,956 2,971 3,987 4,503
5D.18.3 Lake Tanglewood
The City of Lake Tanglewood currently obtains its water supply from the Ogallala aquifer in Randall County. The City has a need of 172 acre-feet in 2020, reaching its peak need of 284 acre-feet by 2070. This need is due to declining supplies from their current well field. Potentially feasible water management strategies include:
• Municipal Conservation (see Section 5B.1)
• Drill Additional Groundwater Wells
Drill Additional Groundwater Well
The City is need of additional water supplies. For planning purposes, this strategy consists of two new 150 gpm wells and associated collection piping. Additionally, a 3 mile 8-inch transmission line and small pump station were included. These wells would produce water from approximately 150 feet below the surface. Minimal treatment such as chlorine disinfection will be required.
5-119

Subchapter 5D April 13, 2015 Water Management Strategies for Water Users by County Draft
Time Intended to Complete
This project is assumed to be online by 2020 for planning purposes. The city may choose drill the wells in phases if necessary.
Quantity, Reliability, and Cost
The quantity of supply available from this strategy is 300 acre-feet. The reliability of this supply is considered moderate due to competition from other water users. The capital cost for the additional groundwater and associated infrastructure is $3.0 million.
Environmental Issues
No significant environmental impact is expected for the recommended strategy. Once the specific locations of additional wells and alignments associated with infrastructure are identified, a detailed evaluation to determine environmental impacts, if any, will need to be performed.
Impact on Water Resources and Other Management Strategies
The increased demands on the Ogallala aquifer will continue to deplete the available storage. This strategy respects the MAG limits for the Ogallala aquifer in Randall County and is not expected to have any impacts other management strategies. However, there may be competition for water among users in Randall County.
Impact on Agriculture and Natural Resources
No significant impact on agricultural or natural resources is expected for the recommended strategy.
Other Relevant Factors
There are no other identified relevant factors.
Table 5D-45: Recommended Water Strategies for Lake Tanglewood (ac-ft/yr)
Capital Cost ($ Millions) 2020 2030 2040 2050 2060 2070
Need 172 200 225 248 266 284 Recommended Strategies Municipal Conservation $0 25 24 24 24 24 24 New Wells $3.0 300 300 300 300 300 300 Total $3.0 326 328 330 331 333 335
5D.18.4 Randall County - Other
The demands in Randall County for county-other municipal supply are expected to increase significantly from approximately 640 acre-feet per year to 2,600 acre-feet per year. The current supply to Randall
5-120

Subchapter 5D April 13, 2015 Water Management Strategies for Water Users by County Draft
County-Other is primarily the Ogallala aquifer. A small amount of supply comes from the Dockum aquifer, and a small quantity of water is provided from the City of Amarillo to the Palo Duro Canyon State park for municipal use. Groundwater is limited in parts of the county, with some residential wells in northeast Randall County experiencing significant reductions in production. To meet the projected growth in demands, the potentially feasible water management strategies for Randall County-Other are:
• Municipal Conservation (see Section 5B.1)
• Drill Additional Groundwater Wells
Drill Additional Groundwater Wells
To meet these projected needs, groundwater wells will likely need to be expanded and/or improved to access deeper water. This groundwater recommended strategy assumes that additional water rights are already owned by the individuals and includes the development of 8 new wells. The 8 new wells would be drilled to provide approximately 2,800 acre-feet per year and are assumed to produce water approximately 500 feet below the surface.
Time Intended to Complete
This strategy would be completed by 2020. Individuals will likely develop wells on an as needed basis, but the strategy costs and supplies are developed in one phase for planning purposes.
Quantity, Reliability and Cost
The quantity of water from these strategies should be sufficient. Reliability of Ogallala supplies is moderate since availability depends on other water users. The capital cost for additional groundwater wells is approximately $5.3 million.
Environmental Issues
No significant environmental impact is expected for the recommended strategies.
Impact on Water Resources and Other Management Strategies
The increased demands on the Ogallala will continue to deplete the storage in the aquifer. To prolong the life of this water resource, other users may need to reduce their demands.
Impact on Agriculture and Natural Resources
This strategy may reduce the irrigated acreage for farming as additional water rights acreage is purchased. This acreage could be used for dry land farming if needed, but may require crop changes.
Other Relevant Factors
None identified.
5-121

Subchapter 5D April 13, 2015 Water Management Strategies for Water Users by County Draft
Table 5D-46: Recommended Water Strategies for Randall County-Other (ac-ft/yr)
Capital Cost ($ Millions) 2020 2030 2040 2050 2060 2070
Need 637 978 1,339 1,731 2,172 2,638 Recommended Strategies Municipal Conservation $0 143 158 173 189 207 225 New Wells $5.3 400 700 1,200 2,600 2,600 2,800 Total $5.3 543 858 1,373 2,789 2,807 3,025
5D.18.5 Randall County Manufacturing
Randall County manufacturers currently get water supply from the Ogallala aquifer in Randall County and from the City of Amarillo’s supplies. Randall County manufacturing users have needs ranging from about 40 to 620 acre-feet per year beginning in 2020 due to increasing demands and limited supplies from Amarillo. Potentially feasible water management strategies considered for Randall County Manufacturing include:
• Drill Additional Groundwater Wells
Drill Additional Groundwater Wells
To meet the projected needs for manufacturing, groundwater wells will likely need to be expanded and/or improved to access additional water. This groundwater strategy assumes that additional water rights are already owned by the individual manufacturers and includes the development of four new wells. The four new wells would be drilled to provide approximately 620 acre-feet per year and are assumed to produce water approximately 500 feet below the surface.
Time Intended to Complete
This strategy would be completed by 2020. Manufacturers will likely develop these wells on a case by case basis as they are needed. However, for the purposes of this plan, this strategy and the costs were developed as one phase.
Quantity, Reliability and Cost
The quantity of water from these strategies should be sufficient. Each well is estimated to produce 100 gpm. Reliability of Ogallala supplies is moderate since availability depends on competition from other water users. The capital cost for additional groundwater wells is approximately $1.5 million.
5-122

Subchapter 5D April 13, 2015 Water Management Strategies for Water Users by County Draft
Environmental Issues
No significant environmental impact is expected for the recommended strategies. Once the specific locations of additional wells and alignments associated with infrastructure are identified, a detailed evaluation to determine environmental impacts, if any, will need to be performed.
Impact on Water Resources and Other Management Strategies
The increased demands on the Ogallala will continue to deplete the storage in the aquifer. To prolong the life of this water resource, other users may need to reduce their demands.
Impact on Agriculture and Natural Resources
This strategy may reduce the irrigated acreage for farming as additional water rights acreage is purchased. This acreage could be used for dry land farming if needed, but may require crop changes.
Other Relevant Factors
None identified.
Table 5D-47: Recommended Water Strategies for Randall County Manufacturing (ac-ft/yr)
Capital Cost ($ Millions) 2020 2030 2040 2050 2060 2070
Need 41 169 295 401 508 619 Recommended Strategies New Wells $1.5 620 620 620 620 620 620 Total $1.5 620 620 620 620 620 620
5D.18.6 Randall County Summary
Randall County has a projected need of over 28,000 acre-feet by 2070. Most of this need is associated with the City of Amarillo and will be met through their strategies which are discussed in Section 5C.2. The remainder of the need will be met by municipal conservation and drilling of additional wells in the Ogallala Aquifer in Randall County. While irrigation does not have a projected need, conservation is recommended to reduce the demands on the limited resource in Randall County. The recommended water plan for Randall County is shown in Table 5D-48.
5-123

Subchapter 5D April 13, 2015 Water Management Strategies for Water Users by County Draft
Table 5D-48: Randall County Water Management Plan
Water User Group Current Supplies Need Proposed Water Management Strategies
Amarillo Ogallala aquifer and CRMWA system Yes
Potter Phase II, Carson and Roberts Counties well fields, Municipal
conservation
Canyon Ogallala aquifer and CRMWA system Yes New wells in Ogallala, Municipal
conservation
Lake Tanglewood Ogallala aquifer No New wells in Ogallala
County-Other Ogallala & Dockum aquifers and CRMWA system Yes New wells in Ogallala, Conservation
Irrigation Ogallala aquifer, Red River and reuse No Irrigation conservation
Livestock Ogallala & Dockum aquifers and local supply (stock ponds) No None
Manufacturing Ogallala aquifer & CRMWA system Yes New wells in Ogallala, Purchase
from Amarillo
Mining Ogallala aquifer No None
Steam Electric None - -
5D.19 Roberts County
Roberts County is located in the northeastern portion of the PWPA. The population of Roberts County is about 1,000 people of which, 600 live in Miami. Nearly all of its water supply is derived from the Ogallala aquifer. Small amounts of surface water are used from the Canadian Run-of-River for irrigation as well as small amounts from livestock local supplies for ranching operations.
Roberts County is water rich and has plenty of water in storage in the Ogallala aquifer to meet the County’s water demands. In addition to demands stemming from within the county, groundwater from Robert’s county is also used to supply customers of CRMWA including Amarillo. CRMWA holds a large quantity of water rights in Roberts County and plans to expand their existing well field. Additional information on CRMWA and their strategies can be found in Section 5C.1.1. Roberts County has ample supply to support all current and future projected demands. The only strategy recommended for Roberts County is irrigation conservation.
5-124

Subchapter 5D April 13, 2015 Water Management Strategies for Water Users by County Draft
Table 5D-49: Roberts County Water Management Plan
Water User Group Current Supplies Need Proposed Water Management Strategies
Miami Ogallala aquifer No None
County-Other Ogallala aquifer No None
Irrigation Ogallala aquifer and reuse No Irrigation conservation
Livestock Ogallala aquifer and local supply (stock ponds) No None
Manufacturing None - -
Mining Ogallala aquifer No None
Steam Electric None - -
5D.20 Sherman County
Sherman County is located in the northwestern part of the PWPA. Stratford is the largest city in Sherman County with a total population of approximately 2,200, which accounts for about two thirds of the County’s total population.
Sherman County is one of the larger irrigation water users in the region. The primary source of water in the county is the Ogallala aquifer. Smaller quantities of local Canadian Run-of-River and local livestock supply are also used in the county.
There is plenty of water available from the Ogallala aquifer in Sherman County, but the use is concentrated in the heavily irrigated areas, which may result in great competition and some water declines over time. However, there are no projected needs over the planning period. Irrigation conservation is recommended as a way to preserve water for future use. A summary of the water plan for Sherman County is shown in Table 5D-50.
5-125

Subchapter 5D April 13, 2015 Water Management Strategies for Water Users by County Draft
Table 5D-50: Sherman County Water Management Plan
Water User Group Current Supplies Need Proposed Water Management Strategies
Stratford Ogallala aquifer No None
County-Other Ogallala aquifer No None
Irrigation Ogallala aquifer & local supply No Irrigation conservation
Livestock Ogallala aquifer and local supply (irrigation and stock ponds) No None
Manufacturing None - -
Mining Ogallala aquifer No None
Steam Electric None - -
5D.21 Wheeler County
Wheeler County is located on the eastern edge of the PWPA. Most of the water supplies for Wheeler County are derived from the Ogallala aquifer. However, the Blaine, as well as other undefined aquifers, also contribute to the water supply. A small amount of reuse water is used for irrigation. Irrigation demands in Wheeler County also use Red River supplies.
Shamrock is the largest city in Wheeler County with a population of nearly 2,000 people. Shamrock shows no needs over the planning period. The next largest city is Wheeler, with a population of about 1,600 people. Wheeler is the only entity to show a need in the county.
5D.21.1 Wheeler
The City of Wheeler is shown to have a water need beginning in 2020 and reaching a peak need of 483 acre-feet per year by 2070. This need is due to declining water levels in the City’s current well field. The City of Wheeler is evaluating a groundwater source in the Ogallala aquifer to back up its current supplies.
The potential strategies for Wheeler are:
• Municipal Conservation (see Section 5B.1)
• Drill Additional Groundwater Wells
5-126

Subchapter 5D April 13, 2015 Water Management Strategies for Water Users by County Draft
Drill Additional Groundwater Well
City of Wheeler is to develop additional groundwater from the Ogallala aquifer with new wells and associated transmission. For planning purposes, it is assumed that 2 new wells and associated well field piping will be necessary to meet the City’s water needs. These 2 new wells will provide approximately 500 acre-feet per year and will produce water approximately 150 feet below the surface. Minimal treatment such as chlorine disinfection will be required.
Time Intended to Complete
This strategy would be completed by 2020. The City may elect to drill the wells in phases if needed, but the strategy costs and supplies are developed for one phase.
Quantity, Reliability, and Cost
The quantity and reliability of water from this source is expected to be approximately 400 gpm, and provide up to 500 acre-feet per year. Reliability of Ogallala supplies is high to moderate. There is plenty of supply in Wheeler County, but there may be potential competing demands. The capital cost for the additional groundwater wells and collection piping is $2.8 million.
Environmental Issues
Groundwater development from this source is expected to cause minimal environmental impacts.
Impact on Water Resources and Other Management Strategies
This strategy is assumed to have a minimal impact on the Ogallala aquifer and other surrounding water resources.
Impact on Agriculture and Natural Resources
No significant impact on agricultural or natural resources is expected for the recommended strategy.
Other Relevant Factors
There are no other identified relevant factors.
Table 5D-51: Recommended Water Strategies for Wheeler (ac-ft/yr)
Capital Cost ($ Millions) 2020 2030 2040 2050 2060 2070
Need 184 249 308 365 412 453 Recommended Strategies Municipal Conservation $0 15 15 16 16 17 18 New Wells $2.8 500 500 500 500 500 500 Total $2.8 544 545 546 547 549 550
5-127

Subchapter 5D April 13, 2015 Water Management Strategies for Water Users by County Draft
5D.21.2 Wheeler County Summary
Wheeler County has a total projected water need of 453 acre-feet per year, all of which is associated with the City of Wheeler. The county’s primary source of water, Ogallala aquifer has over 100,000 acre-feet per year of water that is not currently developed and could be used to meet water needs. With development of additional Ogallala supplies, there are no needs.
Table 5D-52: Wheeler County Water Management Plan
Water User Group Current Supplies Need Proposed Water Management Strategies
Shamrock Ogallala aquifer No None
Wheeler Ogallala aquifer Yes Conservation, New wells in Ogallala aquifer
County-Other Ogallala, Blaine, Seymour and Other aquifers No None
Irrigation Ogallala, Blaine, Seymour, Other aquifers and reuse No Irrigation conservation
Livestock Ogallala, Blaine, Seymour, Other aquifers and local supply (stock
ponds) No None
Manufacturing None - - Mining Ogallala aquifers No None
Steam Electric None - -
5-128