06-06-2013_4784812000 nam ve song elliot va dieu gi se xay ra trong the ky 21 - copy.pdf
TRANSCRIPT

12,000 YEARS OF ELLIOTT WAVES
AND
WHAT THIS MEANS FOR THE 21ST CENTURY
BY Joseph M. Miller
Daan Joubert
Marion Butler
[email protected] Comments, corrections or questions can be sent to any or all of the authors at the email addresses listed above.
© COPYRIGHT 1999 BY THE AUTHORS
ALL RIGHTS RESERVED
INTRODUCTION
The information in the article that you are preparing to read is breaking new ground in
the long-term analysis of human development. This project is an ambitious effort
designed to show that the upward direction of human development over many
millennia has taken place in a series of structured up and down cycles (or waves, in
Elliott terminology).
The Elliott Principle says that Elliott Waves of varying degree can be observed in
organized markets such as the DJIA or the S&P 500. These waves can cover hours,
days, weeks, months or years. Prior to Elliott's death, he talked and wrote about a
large wave that he called a Grand Super Cycle Wave (GSC), which lasted up to 300
years and was the largest wave discussed by him. During the research for this article,
the authors found evidence that larger waves were evident when longer and longer
periods of human history were examined.
An earlier work concerning this topic covered a shorter period from approximately
1600 AD to 2000 AD. In researching the shorter time period the concept of an X-
wave that consists of 5 full GSC waves was introduced. It became apparent the
analysis raised important questions which could only be answered by broadening the
time span even further to include a great deal of earlier history.

The authors learned when they examined human development from the end of the last
Ice Age in about 10,000BC through to 2000AD, that there was evidence of several
large Elliott Waves. These larger waves have been designated as follows: an X Wave
that lasts 800 to 1,000 years and is composed of five complete Grand Super Cycle
Waves; a Y Wave that lasts from 2,500 to 3,000 years and is composed of five
complete X Waves; and a Z Wave that lasts from 8,000 to10,000 years and is
composed of five complete Y Waves.
The reason for taking the longer-term view is to adequately interpret just where we are
in the wave structure at the end of the Twentieth Century. More importantly, without
this additional information, it was impossible to develop a picture of where we are
headed as we enter the 21st Century. It is really the search for an answer to this latter
question that guided the work presented here.
Most research concerning the Elliott Principle has pertained to the last 150 years, and
has been based on the value of equities as presented in stock market averages. The
reasons for this include the fact that such averages have only been available in a
reliable form for that period of time. Further, for typical investment decisions it was
not necessary to go any farther back in time to gain additional perspective of where
stock values had been and where they might be heading.
In our much more ambitious project, stretching further back in time, we were faced
with the problem of how to evaluate the position and timing of past cycles (waves)
when there was no viable stock market average to guide us. The only choice we
uncovered as usable was a combination of history and archeological evidence. The
authors encountered some problems in using this type of data to analyze past cycles
(waves) prior to about 1850. A critical reader, especially readers who have a working
knowledge of the Elliott Principle, need to take especial note of the problems the
authors faced and the limitations these placed on our analysis.
It was not until circa 3000 BC that writing came into existence. Prior to that time
archeological records are our only source of information, and of consequence are
imprecise to say the least. After circa 3000BC written accounts of events are available
and over time became more accurate. Even so, many important periods such as the
Roman period still pose factual problems because many of the histories of Rome were
not written until as late as 300 to 200 BC and covered all of Roman history from the
establishment of Rome in circa 750 BC. Much detail was lost and many dates and
important historical events were only approximately pinned down due to the time
lapse between the historical events and their written record.
One obvious problem this posed to the authors was in ascertaining the starting and
ending dates for cycles (waves) with any degree of precision. In the absence of market

related data the authors assumed that the rise and fall of empires and civilizations are
good approximations for the peaks and troughs in the economic cycle of the region
under review, which initially consisted largely of the Middle East and Europe. Also,
this meant that time became a more important characteristic for deciding on cycles
than the actual level of economic activity or of market prices, which are prominent in
the analysis of more recent market action.
At this point a direct quote from Nature's Law is appropriate. "(Elliott) Waves of
different degrees occur whether or not recording machinery is present". The recording
machinery Elliott was talking about was a viable stock market average. In spite of the
fact that adequate recording machinery was not available prior to circa 1850, it is the
opinion of the authors that the data as available and presented in this article displays
remarkable adherence to the Elliott Principle and its rules over a span of 12,000 years.
Our conclusion is that there are relatively few instances where it appears the Elliott
Principle has been found wanting, and these do not warrant dismissing the other
evidence that confirms the working of the Elliott Principle over the last 12,000 years.
The foregoing is especially true when the difficulty of obtaining precise dates is taken
into consideration.
An obvious question a reader may have is, "This is ancient history. Is any of this
important?" As our analysis progressed, it became more and more clear that this study
is in fact very important.
The reason is that Elliott Theorists have observed that we are ending a Grand Super
Cycle Impulse Wave in the period from 1998 to 2000. During the research by the
authors of this work a question arose. Is the GSC Wave now nearing its end the first,
second or third impulse GSC Wave in the next higher degree wave, the X Wave? The
answer to this question will determine the depth and duration of the coming
correction.
Much additional data had to be accumulated and digested to learn the answer. This
search took us back to the end of the last Ice Age and uncovered the waves described
above. This research has convinced the authors that in this period of time just prior to
the 21st Century, the GSC Wave being completed is the third complete GSC Impulse
Wave of an X Wave which started in about 1000AD.
When a wave of any degree ends, the Elliott Principle says we can expect a correction
of that wave commensurate with the degree of the wave ending. It makes a great deal
of difference to a market observer in 1999 to know that we are not just ending a GSC
Wave, but also an X Wave.

This is important because our study of history shows that a reasonable correction for a
GSC Wave lasts about 40 to 60 years. However, for an X Wave the duration of the
correction appears to be 100 years or more. Obviously, even the shorter correction
will boggle the minds of current market participants who have been taught by market
action over the last few decades to expect bear markets of only a few days, weeks or
months.
The data and history used in this discussion will concentrate on Western Civilization,
starting in the Middle East and progressing through Greek, Roman, European, English
and finally United States history. Readers who are unfamiliar with the Elliott Wave
Principle will perhaps have difficulty following the wave sequences described in the
text. To overcome this difficulty, an elementary discussion of the Principle has been
included in Appendix A. We recommend to those who are unfamiliar with the Elliott
Principle to not dwell on the intricacies of the wave sequences, but to focus on the
conclusions drawn by the authors based on their study of the Principle. If this
monograph stimulates your interest in the subject, there are several good books you
can read for a more complete understanding of the Principle.
Many readers will perhaps have a tendency to dismiss the findings and conclusions
drawn by the authors in this article. The reasons for this are several. The most obvious
will be that the Principle itself is too esoteric. Another reason is many people distrust
technical analysis in any form, and this Principle relies heavily on technical analysis.
Still other market participants are just too optimistic, have too much faith in
technology and the future of humankind to listen to any long term bearish arguments.
It is the opinion of the authors, after much research and thoughtful consideration, to
say to the reader that they ignore the message the Elliott Wave Principle and this
article are sending to them at their peril.
A study of history clearly indicates that humankind has progressed over time in a
series of up and down periods (waves). The story of human development is certainly
not an unbroken upward movement. There have been many regressive periods that
have interrupted the upward path. There is every reason to believe that future events
will repeat and confirm this type of up and down movement in human development.
Various studies have shown the Elliott Wave Principle to have been operative over
many decades. The results of the study you are about to read indicate that the Elliott
Wave Principle is apparent in the entire 12,000-year span of human history that is the
theme of this study. Using this knowledge allows the authors to reach some very
interesting conclusions about the future of human activity and the Western stock
markets and economies as we go into the Twenty First Century. These will be
discussed in subsequent parts of the article.

(C) 1999 By The Authors
All rights reserved
SETTING THE STAGE
Why should we care about the long-term outlook for the stock market?
First let's discuss what we mean by "Long Term". Most people consider long term to
be a few years at the most. Most businessmen seem to be preoccupied with the next
quarter and at the outside, next year. Long term as used by us in this article will be
much longer. Twelve thousand years long, which makes this effort a very ambitious
undertaking.
Now let's go back to why we should be interested in these long-term periods of
history. "History repeats itself," is a common saying. A study of the Elliott Wave
Principle lends validity to this statement, as we will endeavor to demonstrate here. As
the reader will appreciate, obtaining reliable data for stock market series going back
over many years is difficult. Fortunately, there is reasonably reliable data available,
which can be used going back several hundred years. There is also a large body of
human history going back to the beginning of civilization, which we can draw upon.
Readers who understand the Elliott Principle know that when we look at the larger
degree waves and see the simple and elegant eight-wave structure, we must realize
this is less true when we try to analyze the smaller degree waves. We find in the
smaller degree waves a great deal of diversity which is often difficult to fit into the
wave pattern. We also find that there is a great deal of variation in corrective waves,
which Elliott and his followers tried to codify.
In addition, fifth waves can become extension waves of a bull trend. When this occurs
it usually surprises and confuses Elliott analysts. This makes accurate wave analysis a
risky business from a forecasting point of view. This problem has tripped up most
practitioners of the Principle at one time or another, with embarrassing results. This
very thing happened in 1995 when a fifth wave became an extension wave.
Extension waves are typical of major blow-off in the markets, at times becoming a
complete market bubble with all the signs typical of such developments. Our first
discussion therefore hinges on more recent history to illustrate that we are
experiencing extension waves and, therefore, that we are in the process of a market
blow-off. This leads to the conclusion that global markets, which have been largely
sustained and driven by Wall Street and American imports, are due to enter a major
correction, again lead by events on Wall Street.
The question of how large this correction might be is evaluated later.
THE CURRENT GRAND SUPER CYCLE WAVE
It is fortunate for our purposes of examining the current Grand Super Cycle (GSC)
that we have stock market data series of increasing validity as we progress through the
cycle. It makes our task easier and gives it greater validity. A GSC wave is made up
of lower order Super Cycle (SC) waves and these in turn consist of the next lower
order Cycle (C) waves.
The current Grand Super Cycle is usually taken to begin around 1775-1785. We
should take note of the fact this is the time period when the United States of America
was born. On August 25, 1941, Elliott wrote a letter concerning the market from 1776
to 1941. The Super Cycle Waves which compose the present Grand Super Cycle as
described by Elliott are as follows:
Super Cycle Wave 1 1776-1850
Super Cycle Wave 2 1850-1857
Super Cycle Wave 3 1857-1929
Super Cycle Wave 4 1929-1932?
The intervening years from 1932 to 1941 were difficult stock market years and the
interpretation of those years by various Elliott Principle practitioners varies. That is
why a question mark was placed after 1932 in Wave 4. With greater hindsight gained
from market action since 1941, it appears we can take the question mark away and say
the Super Cycle Wave 5 did in fact begin in 1932. When it will end requires a great
deal of discussion.
There is not reliable enough data to break down Super Cycle Waves 1 and 2 of the
current Grand Super Cycle Wave into their component waves. However, starting just
prior to the beginning of Super Cycle Wave 3 in 1857, a reliable data series was
started. It was the Axe-Houghton Composite Index. Using this index, Elliott broke
down Super Cycle Wave 3 into the following Cycle Waves:
Cycle Wave 1 1857-1864
Cycle Wave 2 1864-1877
Cycle Wave 3 1877-1881
Cycle Wave 4 1881-1896
Cycle Wave 5 1896-1929
It is at this point of our discussion that we need to introduce the concept of an Elliott
Extension. The reason for this is that Cycle Wave 5 from 1896 to 1929 contained a
five-wave extension as described below:

Cycle Wave 5 (Extension Wave 1) 1896-1899
Cycle Wave 5 (Extension Wave 2) 1899-1907
Cycle Wave 5 (Extension Wave 3) 1907-1909
Cycle Wave 5 (Extension Wave 4) 1909-1921
Cycle Wave 5 (Extension Wave 5) 1921-1929
Elliott describes in a letter dated May 3, 1944, how Extension Wave 5 of Cycle Wave
5 (1921-1929) also became an extended wave of five waves, which ended in a
colossal blow off in the fifth wave of this sequence between 1927 and 1929. Figure 1
shown below gives us a picture of Super Cycle Wave 3, with its component waves.
FIGURE 1
Super Cycle wave 3 consists of 5 Cycle waves (I) to (V). Cycle wave (V)
in turn is made up of 5 extension waves, I to V. The fifth extension wave,
V, also consists of 5 extension waves, 1 to 5.
Super Cycle Wave 4, which was the corrective wave for the entire bull market from
1857 to 1929, turned out to be fast, violent, traumatic, and ushered in a very bad
period for America. We will not dwell on that point since there are many sources of
information on that period of American History.
We are now ready to attack Super Cycle Wave 5 (1932-????). Figure 2 below displays
the yearly price range for the Dow Jones Industrial Average from 1900 to the top
made in early 1999. Please note the y-axis is logarithmic scale.

FIGURE 2
Bar chart of Dow Jones Industrial Index, 1900-1999
From Figure 2, we can clearly see the cycle waves making up Super Cycle Wave 5
break down as follows:
Cycle Wave 1 1932-1937
Cycle Wave 2 1937-1942
Cycle Wave 3 1942-1966
Cycle Wave 4 1966-1974
Cycle Wave 5 1974 – 1999/2000?
Cycle Wave 5 (1974 –1999/2000?), brings us closer to a period of stock market
history familiar to many current stock traders. Cycle waves consist of what Elliott
termed Primary Waves and the five Primary Waves that make up Cycle Wave 5 are as
follows:
Primary Wave 1 1974-1976
Primary Wave 2 1976-1982
Primary Wave 3 1982-1986
Primary Wave 4 1986-1987
Primary Wave 5 1987-1999/2000?
Figure 3 below gives us a schematic picture of Super Cycle Wave 5 (1932-1999?).
Readers should note at this point in our discussion that the same basic schematic was

used for both Super Cycle Waves 3 and 5 (Figures 1 and 3). The Elliott Wave
Principle does indeed seem to have form and structure.
FIGURE 3
Super Cycle wave 5 of the current Grand Super cycle breaks down into
Cycle waves (I) to (V). The extensions take place as described in Figure
1.
We can further see from Figure 3 that Primary Wave 5 (1987-1999?), of Cycle Wave
5 (1974-1999?), of Super Cycle Wave 5 (1932-1999?), started from the low made in
1987. This point is emphasized because of its great significance – we are approaching
the end of the fifth waves of three orders of waves. It is also very important to
recognize that we are therefore in the process of ending a Grand Super Cycle Wave
(GSC – the largest wave Elliott recognized). This implies a sizable correction is ahead
of us – greater than the one that followed the 1929 Crash. More on that important
topic is to come later.
The wave action from 1994 to 1998 is complex and may find differing counts by
various Elliott analysts. For example, many analysts treat the July 1998 top in the
Dow as the end of wave 5 of the Cycle and Super Cycle. The correction that started
with the virtual collapse of the Russian financial system then becomes a major A
wave correction. This is followed by a rising B wave that exceeded the high of the
previous fifth wave. This constitutes an irregular top, which is also, a sign of a market
blow off. Alternative counts try to fit the end of wave 5 to the highs reached in 1999.

Using any of these wave designations does not in any way change the fact that all of
the evidence points to the end of a Grand Super Cycle in the 1998-2000 time frame,
and therefore to a major correction just ahead.
Table 1 shown below, lists the important waves from 1780 to the present time in 1999
in terms of Grand Super Cycle, Super Cycle and Cycle waves.
TABLE 1
This table shows the elements of the most recent Grand Super Cycle
wave which is indicated as GSC?, where '?' can be 1, 3 or 5. Each wave
with its components in a column to the right is shown with start and end
dates and duration in years. More recent waves are shown in greater
detail. In the next part of this monograph we will determine whether this
is the 1st, 3rd or 5th grand super cycle wave of the present X-wave.
Even though the Table does not show this clearly, it is of great importance to
remember that the bull trend concluded with Extension Waves. In the Elliott
Principle, an Extension Cycle is evidence of a highly speculative market.
As was mentioned earlier, there are also striking similarities (in Elliott terms as well
as other criteria) in stock market behavior between the period of 1921-1929 and 1987-
1998(9).
IMPLICATIONS
Indications suggest there is a very high probability that over the period 1998-2000 we
have come to the end of a Grand Super Cycle Elliott Wave, the largest size wave
Elliott listed in his wave descriptions. The bull phase of this cycle started about 1776
and has lasted over two hundred years. When the bull phase of any cycle ends, the

logical conclusion is that we are going to start the bear (correction) phase associated
with this cycle. Each correction phase of any cycle degree is commensurate with the
preceding bull phase it is correcting.
We are ending a Grand Super Cycle Bull Market, so we can expect at the very least a
Grand Super Cycle Bear Market Correction.
The question now to be discussed is whether this is a GSC1, GSC3 or GSC5 wave of
the larger X-wave. If the current GSC wave is a GSC1 or GSC3, the correction will be
shorter and of less intensity than the correction which would occur at the end of the
GSC5 wave. We must realize any GSC correction is bound to be worse than the one at
the end of the previous Super Cycle in 1929.
If we are dealing with a GSC5 wave, the correction would be more extensive as it
would also come at the end of the next higher order X-wave.
(C) 1999 By The Authors
All rights reserved
12,000 YEARS OF ELLIOTT WAVES
Part 3: The current X-wave.
A SECOND STARTING POINT
We are going to use as our second starting point a historical period that most
historians can agree upon, both in timing and in its impact on human endeavor - the
Renaissance. From this vantage point we are going to work backward in time and then
go forward in our effort to place ourselves at the proper spot in the current Elliott
Wave sequence.
The term Renaissance, which describes the period of European history from about
1400AD to 1720AD, is derived from the French word for rebirth, and originally
referred to the revival of the values and artistic styles of classical antiquity. Voltaire in
the 18th century classified the Renaissance in Italy as one of the great ages of human
cultural achievement. In the 19th century, Jules Michelet and Jakob Burckhardt
popularized the idea of the Renaissance as a distinct historical period heralding the
modern age, characterized by the rise of the individual, the birth of scientific inquiry,
geographical exploration, and the growth of secular values.

This historical evidence allows us to theorize that the estimated 320-year period of the
Renaissance can be categorized as a Grand Super Cycle in the Elliott Wave scheme of
things. Historical facts of the following type bolster this belief. The Black Death
(bubonic and pneumonic plague), which devastated Europe in the mid-14th century
and reduced its population by as much as one-third, created chaotic economic
conditions. Labor became scarce, industries contracted, and the economy stagnated. It
is logical to theorize that this downward adjustment in economic progress with a
duration of about 50 years can be designated as a Grand Super Cycle Wave correction
– either a wave 2 or a wave 4.
To find out which it is, we have to go further back in history. The long period of
human expansion from the end of the Dark Ages in about 1000AD until it was ended
by the plague in about 1350AD, also has a duration of about 350 years. It is thus
logical to believe that this period can be designated as another Grand Super Cycle
impulse wave.
By comparison with what appears to be a normal Grand Super Cycle Wave correction
of about 50-60 years, the extended period of 663 years of the Dark Ages appears far
too long to be a mere Grand Super Cycle correction. Therefore, we can conclude it is
a correction of at least the next higher degree, which we have termed the X-wave. We
therefore concluded that the period of expansion following the Dark Ages has to be
Grand Super Cycle Wave 1 of a new X-wave at least, with the decline in economic
activity as a result of the plague as Grand Super Cycle Wave 2 – the first corrective
wave of the current X-wave.
This analysis then allows us to logically designate the Renaissance as Grand Super
Cycle Wave 3 in the forgoing sequence. Additional evidence that the Renaissance was
Grand Super Cycle Wave 3 is the way it ended in about 1720, when a speculative
blow off of gigantic proportions occurred, events that are typical of either a wave 3 or
wave 5.
The end of the final bull phase of the Renaissance Grand Super Cycle 3 is so
important for us to understand, and of such important historical significance, we are
going to discuss it in detail. The story involves a man named John Law. He was born
in April 1671, and died Mar. 21, 1729. He was a Scottish financier whose brilliant but
overly speculative banking and stock market projects in France during LOUIS XV's
minority created a spectacular but short-lived economic boom.
Law persuaded the near-bankrupt French government to test his theory that state
credit schemes based on public confidence could greatly increase national wealth. In
1716 his government-chartered General Bank began to issue paper currency and
provide low-interest loans to businesses. At the same time Law's Company of the

West, organized in 1717, sold 100 million livres of stock based on the potential wealth
of its monopoly over France's Louisiana Territory (the MISSISSIPPI SCHEME,
which later became the INFAMOUS MISSISSIPPI BUBBLE).
By 1720, Law was controller general of finance in France. In that year he merged his
bank and company into a vast financial organization that assumed control of state
debts, coinage, and taxation. During the final stages of the speculative bubble that
developed from his policies and actions, prices rose in a spectacular fashion. It all
ended in panic public selling later in the year of 1720, which destroyed the entire
scheme. The idea of state banking was discredited for nearly a century, and Law
became a disgraced and bankrupt exile. For his efforts, he won the title of The Father
of Paper Money.
Concurrently in England, a similar scenario was being played out. The South Sea
Bubble is the name given to a speculative boom in England that also collapsed in
1720. The South Sea Company founded for trade in 1711 caused this financial
disaster. Stock in the company sold well, and by 1718 investors were receiving 100
percent interest. In 1720 the company proposed and Parliament accepted that it take
over much of the national debt. This move created a wave of speculation in the
company's stock, which rose from 128.5 pounds in January to 1,000 pounds in
August. In September the bubble burst. Stocks plummeted, banks failed, and investors
were ruined. A reader who wishes to learn more about this fascinating era can do so
by obtaining a book titled Extraordinary Popular Delusions and the Madness of
Crowds by Charles Mackay.
These twin disasters on each side of the English Channel marked the end of the bull
phase of Grand Super Cycle Wave 3 and ushered in Grand Super Cycle Wave 4, a
downward correction wave. Our knowledge of these waves must be entirely based on
historical evidence, since there are no readily available records of equity prices for the
period of the Renaissance. It is instructive to note this final (bull) phase of the Grand
Super Cycle 3 ended in the Mississippi Bubble in France and the South Sea Bubble in
England. Both have been described since then as notorious periods of excessive
speculative activity.
The aftermath of these bubbles left finance in extreme disrepute during the corrective
phase following the Renaissance Grand Super Cycle, which lasted from 1720 until
approximately 1775-1785 (GSC Wave 4). At this point we should especially take note
of the length of time required to overcome the excesses brought about at the end of
this Grand Super Cycle. It required about 60 years, at least one full generation
(perhaps more like two generations based on life expectancy at that time) before the
correction ended and a new GSC impulse wave could begin (GSC Wave 5).

Since we are again at the end of a GSC wave, this is the least duration we could
reasonably expect for the correction that is soon to be on us. What we can expect at
the end of a GSC5 wave, must await further analysis.
THE X-WAVE AND BEYOND
We have seen that the period of the Dark Ages was followed by three periods of about
350 years duration that correspond to three Grand Super Cycle impulse waves,
separated by relatively brief corrections of about 60 years duration – one correction at
the time of the Plague and the second correction as a result of the major speculative
bubbles in France and in England in the 18th century.
The duration of the Dark Ages was very much longer than these GSC corrections – so
much longer in fact that it has to be at least the next higher order X-wave correction,
or even of higher order. We can therefore assume that the start of the first GSC wave
in about 1000 AD was also the beginning of the next higher order X-wave.
This enables us to put together the schedule of the current X-wave, as follows:
GSC 1: 1000 – 1350
GSC 2: 1350 – 1400
GSC3: 1400 – 1720
GSC4: 1720 – 1780
GSC5: 1780 - 1999
Observe that this X-wave has a duration of exactly 1000 years, substantially longer
than the 350 years or so of Elliott's longest wave, the Grand Super Cycle.
The major components of the X-wave are shown in Figure 5 below.

FIGURE 5
The X-wave and its components
One of the keys to the further analysis of human history in terms of Elliott waves lies
in the duration of the Dark Ages. At more than 650 years, this period is far too long to
be merely an X-wave correction. It has to be at least a correction at the end of a Y-
wave, which then implies that the current X-wave that started in 1000 AD is X1 of a
new Y-wave. This also implies that the coming correction is not simply going to be a
GSC correction wave, such as at the time of the Plague or after the Mississippi and
South Sea bubbles; it will be more substantial and of longer duration.
This means that the current state of the markets deserve closer examination before we
continue the examination of the whole 12000 year history of settled human
civilization.
A MORE IN DEPTH ANALYSIS
Let's get some much-needed perspective of where we are and where we have been in
stock market prices. In July of 1998 the DJIA soared over the 9000 level and has since
gone over 11000. Many stock market pundits remark that the future looks rosy with
few problems lurking on the horizon. They predict continuing higher prices. Some
expect the DJIA to climb to 15000 or even 20000. We have seen this index surge over
11,000 since July 1998, while other broader indices have not been able to top their
1998 highs.
Looking back to as recently as early 1995, the DJIA had not breached the 4000 level,
which is obviously more than 50% lower than the peak in 1998. Needless to say, for

various reasons the DJIA advanced over 100% in a little over three years. A
spectacular achievement (evidence of an Elliott Extension in the market and extreme
speculation and overvaluation). In late 1996 while the DJIA was still under 7000,
Alan Greenspan issued his famous warning that the United States stock market was
displaying "Irrational Exuberance". The market swooned a little, and then continued
to race upward for another two years, gaining another roughly 50% in the process.
What allowed this to happen? Let's remember we have been in a Grand Super Cycle
bullish mode since about 1776, when the United States was born. The country grew
ever stronger and richer during the 220 odd years since that time. By the 1940's the
US had grown to the point where it was able to become the dominant power in the
world during and after WW II. Our riches and power continued to build during the
Cold War until by the last two decades of the Twentieth Century the United States
was the colossus of the world. A famous Wall Street personality, Abbey Cohen, in the
late 1990's described the economy of the United States as being similar to a loaded
crude oil supertanker cruising through the ocean. Which implies the United States has
so much bullish momentum built up that it would be as hard to stop or to change its
upward course as a supertanker (which is indeed very difficult).
The growth of the United States and attitudes like those of Abbey Cohen were the
causes for the explosive move up in the DJIA. This view is simplistic, and does not
account for other important factors which aided and abetted the rise such as the
computer revolution. Space will not allow a full discussion of all aspects of the
matters touched on in this article. The important point we need to make is that the
final upward surge in the last two decades of the 20th Century is the culmination of
220 odd years of economic growth and business activity. It constitutes an
unsustainable euphoria and enthusiasm for stocks, and deserves the description of a
"Bubble Economy"
This situation is comparable to the speculative frenzy described in the period leading
up to 1720 in the South Sea and Mississippi Bubbles, or the speculative frenzy of
1927-1929. The implication of this is that we can logically expect these speculative
excesses to be corrected by a major bear market move. This is all the more true since
we are not only completing a Grand Super Cycle of over 200 years, but are
completing the final Grand Super Cycle of an X-Wave which has very serious
implications. Namely a bear market correction which will be very deep and probably
over 100 years in length.
We must now ask ourselves what conditions have changed to stop this bull market, if
in fact it has changed from bull to bear. Our judgment based on Elliott analysis, Dow
Theory analysis, and other evidence, tells us that 1998 was the culmination of the
Grand Super Cycle which started over 200 years ago. Others disagree. Time will tell.

Looking back to 1994-95, some analysts felt the market had already reached the top at
that time. There was evidence which suggested that was the case. What was missed
was the supertanker analogy, and the fact that you don't turn a supertanker or a 200
plus year bull market around quickly. It takes time and work (quite often, as in this
case, such time and work takes on the aspects of a BUBBLE Market). There are times
when no specific trigger is needed to stop a bull market. The bull market just
continues upward until it loses momentum and starts to slide back down.
In the period of 1997-9, however, there were and still are many conditions in the US
and around the world, which have contributed to a market top. We will not try to
enumerate all of these items, because we feel certain anyone interested enough to read
this article is already aware of these items of concern. One item that needs mentioning
(But by no means the only one) is the Year 2000 Computer Date Problem, and how
that can perhaps initiate or exacerbate the bear market to come. This impact of the
Y2K problem may overshadow all of the other preceding problems in order of
magnitude.
At or near the end of a cycle, psychology plays a critical role. Let's look at something
Greenspan has said: "the fate of the markets is in the hand(s) of psychology". The
psychology at the end of a Grand Super Cycle bull market is without question,
insanely bullish and positive. Logic would say this is even more the situation at the
end of a higher level X-Wave. That bullish psychology may well be starting to
weaken. As a bear market progresses along its inevitable path, the bearish psychology
will build until a point down the road is reached when no one in their right mind
wants to own stocks. It is that attitude which held sway between 1720 and 1776 and
that extended the correction to over a generation of humans. Is there any reason why
something similar or worse won't happen again? Based on Elliott analysis we think it
will. The all-important question is how long will the bear market last and how low
will it go. In Part 5 we discuss some factors that could be implicated in the coming
long term bear market.
There is a quote we want to share with you that comes from Richard Russell, who
writes an authoritative stock market letter based on Dow Theory. Russell's warning:
"In a bear market, whatever can go wrong will go wrong. This adage explains why
bear markets often end up lower (more costly) than anyone thinks possible at their
inception."
Let's revisit Abbey Cohen and her supertanker analogy. It appears the supertanker US
stock market spent the spring and summer of 1998 slowing down, stopping, and
reversing direction. The rally from the lows made in the last half of 1998 was aided by
Federal Reserve policy when they were forced to bail out Long Term Capital
Management. Despite reaching new highs during 1999, in what we believe to be an

Elliott irregular top, that rally shows signs of weakening, and we may be on the verge
of another major downward move in stock prices.
Will the supertanker stock market and economy go down as persistently as it went up?
The question is, why not? We believe psychology will be just as bearish an influence
on the way down as it was bullish on the way up. That will be especially true when
psychology turns from bullish to bearish which is something that always happens at
turning points of this type. We feel certain there will be disagreement on this, so, only
time will tell. We do feel there is some very persuasive additional evidence for the
pessimism expressed above. It is code named Y2K.
Our supertanker economy stalled in mid 1998 for many reasons, some we have
mentioned. However, we have only slightly begun to feel the negative impact of Y2K
as this article is being written. We are not going to discuss Y2K in great detail
because the scope of the subject is too large to add to this narrative. If the reader is
unfamiliar with the problem we suggest you immediately get current information and
bring yourself up to date quickly.
In our considered opinion, Y2K will most likely turn out to be one of the biggest
problems civilization has faced since the beginning of recorded history on a global
scale. It will likely be the trigger, if another is needed, that could propel the world into
a chaotic and violent bear market worthy of the previous Grand Super Cycle (1776-
1998) and X-Wave (1000-2000) bull market it will correct. If the problems and
disruptions Y2K can inflict on humankind turn out to be anywhere near as bad as the
pessimists predict, and this trouble is piled on top of a world economy and world
stock markets already in trouble and headed lower, we can see the negative
ramifications. It will pay prudent individuals to monitor both Y2K and the current
stock market developments closely. People who live through the next few years
without taking reasonable precautions will fare much worse than those that do.
There is ample evidence that this market is way too high and should have a large
correction. As to how low the DJIA will go, we turn to the Elliott Principle. It says a
decline from this Grand Super Cycle Wave and X-Wave can and should ultimately
drop to 1000 points or below. The reader, who questions this, can go to the Elliott
writings for confirmation. This prediction is based on 1999 nominal dollars. If the
value of the dollar changes either up or down, that will alter the value of the DJIA in
nominal dollars at the time of the low. This is not an effort to hedge the prediction. On
the contrary, it is meant to clarify the situation.
What are prudent precautions people can take, you may ask? There are several. First
to preserve wealth one should exit most stock market investments. This will be hard
for many to do. In the last twenty years at the very least, the investing public has been

bombarded with the notion that the way to financial Valhalla is to buy stocks and keep
them for the long pull. It is easy to see why such an investment philosophy would take
hold during the fifth wave of a Super Cycle, which also is ending the fifth wave of a
Grand Super Cycle.
The problem here is that the wisdom of the "Buy and Hold" philosophy is based on
historical performance. If the bull market standpoint itself is history (evidence
suggests it is), then this "Buy and Hold" philosophy is all wrong. This suggests a
prudent individual will unlearn "Buy and Hold" and replace it with "Get Out and Stay
Out" until the start of the next bull market which history says will be a long time in
coming.
Where do you put the money you take from stocks? The answer to this question is
always very difficult. In the looming bear market it is further complicated by the Y2K
problem, which may change everything. The authors are not going to discuss in detail
the merits of various alternative investments to the stock market. It is again not within
the scope of this article. We will simply mention some possible alternative
investments and leave it to the reader to do his or her own research on what to do.
Some possibilities are bonds, cash, gold and other hard money assets, food and other
emergency supplies, and real estate, to name a few obvious choices. (A comment from
Richard Russell on the value of cash in a bear market: "In a bear market cash acts
almost like a short position since cash will buy more and more stocks as the bear
market progresses and equities decline").
There are undoubtedly other possibilities we do not know about. In all of your
considerations about alternative investments, one very important consideration to keep
firmly in mind is the vulnerability of fiat paper currencies. Recent history has
witnessed the extreme depreciation of various fiat paper currencies around the world.
All fiat paper currencies are vulnerable to one degree or another. This includes the US
dollar, which is a fiat paper currency whether we want to believe it or not. The
investment world during the next few years is going to be extremely dangerous to
your wealth, as well as your mental and physical health. Keep in mind that one way
governments could try to ameliorate the effects of the soon to come long term bear
market would be by printing money – a course of action that could result in serious
inflation and loss of purchasing power.
A GSC correction lasts about 50-60 years. We are looking now at not just a GSC bear
correction, but a correction commensurate with an X-Wave.
A review of Table 2 in the next part shows that history tells us a normal correction for
an X-Wave is 100 years or more. The implication we see from this information is that
we can expect a very deep and extended drop in stock prices from the apparent top

being completed in 1998-2000. More on that later. In addition, the correction should
severely depress the global economy for a period of many years (100 or more). From
the evidence of the Elliott count it is unreasonable to believe this correction will be
over in a few months, years or even a decade or two. We are correcting too long and
too large a cycle for it to be over in a hurry, or without inflicting major pain. Not
happy implications. However unhappy the implications may be, the evidence
presented in this article make them realistic.
SUMMARY
As we approach the end of the 20th Century, we find the world's economies,
currencies, stock markets, and politics in disarray. Leadership in world affairs is sadly
lacking. Both the IMF and the World Bank have fallen on hard times and dropped into
disfavor. When we evaluate the United States Stock Market with these facts in the
background, it should not come as a surprise to anyone that there is credible evidence
of a looming turn downward in stock market direction and psychology.
We have in fact tried very diligently to show in this article that there is good evidence
to suggest such a market turnaround from bull to bear is upon us. In addition we have
gone to great lengths to demonstrate the bear market we are facing is going to be
much more severe than 1987, 1974, or even 1929. We have stated our reasons to
suggest the bear market will resemble the bear market period between 1720 and 1776,
a period of a generation in length and of great severity in degree of market and
business decline. We have discussed why this bear market can be even worse that just
previously described, since we are ending an X-Wave. These are sobering thoughts to
contemplate in our current bullish and positive environment.
These are dire possibilities. This places us at a point where we must ask ourselves this
question: How much validity does the Elliott Wave Principle have and how seriously
should people take these horrible prospects? Based on our study of the Elliott
Principle over several decades, we can say the Principle has great enough validity to
convince us to watch its signals carefully and pay attention to them. Each reader will
have to decide how much weight to give the Elliott Principle, after examining the
evidence presented in this article, as well as other sources. We should all keep in mind
that Elliott Wave interpretations can change over time as more data is amassed and
evaluated. We feel fairly certain that any practitioner of this Principle has had to
change an analysis at sometime in his or her career.
The last item to cover in this summary is to remind ourselves that in a serious bear
market, which can last for many years, a "Buy and Hold" policy is not prudent
(contrary to popular belief as fostered by the Wall Street Community). A more
prudent approach is to exit most stock market investments and replace them with

alternative investments. Each investor must decide for himself or herself the best
course of action to take after careful consideration of the facts.
Let us reiterate one last time. The investment world during the next few years is going
to be extremely dangerous to your wealth, as well as your health.
BEYOND THE COMING BAD TIMES
It is terribly important at this phase of our analysis to go back to a thought that may
have gotten misplaced in all of the bearish gloom of the recent paragraphs. Each
correction wave, of any degree, does not go as low as the low of the previous cycle.
The correction only approaches the previous low. A most important and positive
thought to remember is that after the correction, the upward progress of humankind
resumes and new highs will ultimately be made.
If we remember that at the end of this century we are ending the first X-Wave of the
new Y-Wave of Z3-Wave, then we can look forward to the beginning of the third X-
Wave of this Y-Wave after a correction wave (X2) has been completed. This suggests
we are on one side of a valley of human achievement, and that once we have
negotiated the difficult valley, we can look forward to better times and new highs of
advancement on the other side. The end of civilization is not upon us, just a rather
lengthy pause in the upward march of civilization. Unfortunately, most people in 1999
can only see the beautiful highlands on the other side of the valley, and do not realize
there is a deep abyss to negotiate between where they now stand and the beautiful
future that is painted for humankind in the 21ST Century and beyond.
(C) 1999 By The Authors
All rights reserved
12,000 YEARS OF ELLIOTT WAVES
Part 4: Elliott Waves over the past 12000 years
Table 2 below shows the full extent of Elliott waves from 10000 BCE. The notes that
follow discuss the work that underlies this presentation of history.
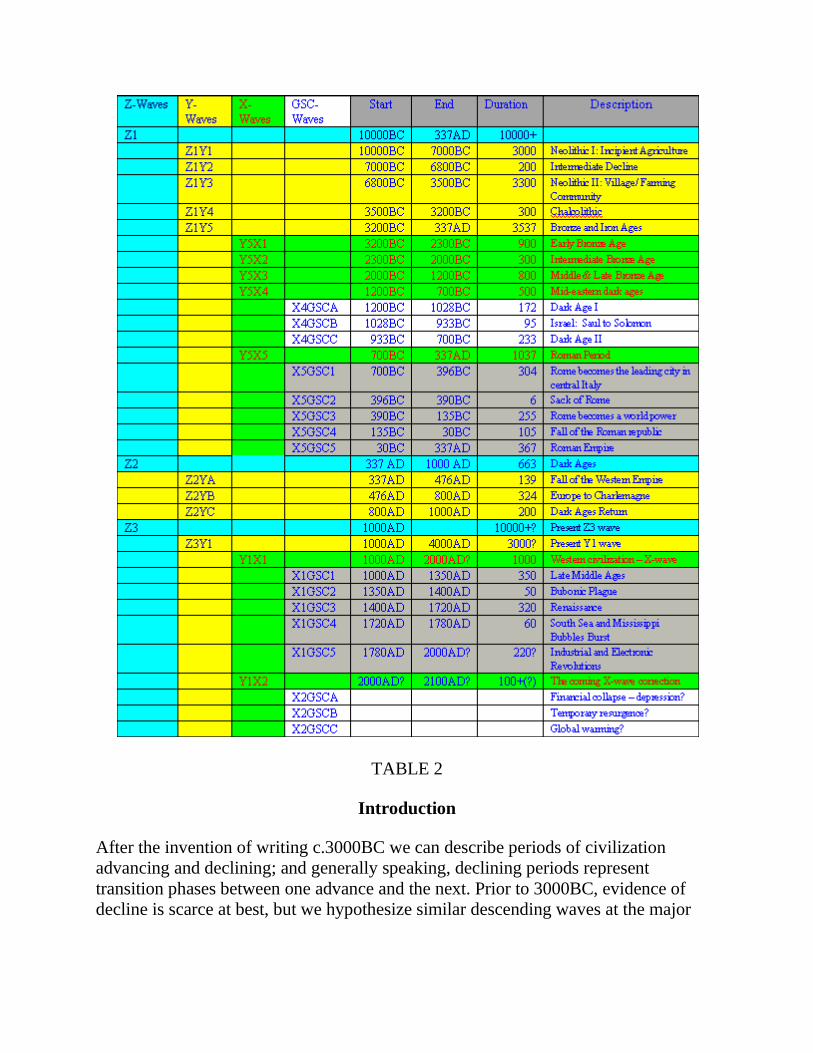
TABLE 2
Introduction
After the invention of writing c.3000BC we can describe periods of civilization
advancing and declining; and generally speaking, declining periods represent
transition phases between one advance and the next. Prior to 3000BC, evidence of
decline is scarce at best, but we hypothesize similar descending waves at the major
transition points between ascending waves of pre-history, based on the evidence of
later periods.
The earliest Sumerian literature, the Epic of Gilgamesh written soon after 3000BC, is
a semi-legendary account of a Sumerian king of Uruk, who lived a century or two
before the epic was written. The prior destruction of civilization is a central theme of
the epic, with tablet X describing a quest for the survivor of the Flood, and tablet XI
describing the Flood. Thus, the earliest human literature lends credence to the
hypothesis of pre-historic declines.
The ancient Egyptians also believed that civilizations rise and fall, as evidenced by
this passage in Socrates' discourse with Timaeus : "Thereupon one of the (Egyptian)
priests , who was of very great age, said, O Solon, Solon, you Hellenes are never
anything but children, and there is not an old man among you.
Solon in return asked what he meant.
I mean to say, he replied, that in mind you are all young; there is no old opinion
handed down among you by ancient tradition, nor any science which is hoary with
age. And I will tell you why. There have been, and will be again, many destructions of
mankind arising out of many causes; the greatest have been brought by the action of
fire and water, and other lesser ones by innumerable other causes."
Readers may view the outlook of this work as negative or fatalistic, but this is not our
intent. As for the charge of fatalism, history proves that strong individuals can buck
the prevailing trend, with examples shown here: Ramses III in Egypt, Tiglath-pileser I
in Assyria, and Marcus Aurelius in Rome. As for the charge of negativity, it should be
noted that whether a decline is caused by weaknesses in the preceding advance or by
forces external to that advance, the declining period lays the foundation for the next
upward wave. Therefore, these declines appear critically important to human
development.
One final note about dating. The abbreviation "c." (as in c.2000BC) means circa or
"roughly", and dates become rougher and less reliable the farther back we look. Even
in cases where "c." is omitted, it cannot be assumed that dates are exact. Different
sources give conflicting dates for the reigns of various kings, for example, and there
are numerous other dating problems. Our goal has been to achieve the maximum
accuracy possible, given these limitations, but we cannot be certain of the ancient
wave counts as presented, only the general pattern.
Z1: c.10000BC to 337AD.

This great ascending wave encompasses the period from the beginning of the
Neolithic Revolution to the height of the Roman Empire, a span of some 10,000 years.
Z1Y1 to Z1Y3: c.10000BC to c.3500BC. The Neolithic Age
During the Neolithic Revolution mankind began the domestication of plants and
animals, enabling the production of sufficient food to allow free time for other
pursuits. Neolithic man developed through two levels, each lasting some three
millenia, 1) Incipient Agriculture, and 2) The Village/Farming Community Level,
representing waves Z1Y1 and Z1Y3 respectively.
Z1Y1: c.10,000BC to c.7000BC. Incipient Agriculture
During this period man developed pottery, weaving, and improved tools, abandoning
the flint tools of the Old Stone Age for ground stone tools. Domesticated dog bones
have been found from c.8700BC.
Z1Y2: c.7000BC to 6800BC. Intermediate Decline
We hypothesize a period of decline between the two levels of the Neolithic, based on
evidence of decline at the later transition points. Based on the length of declines of
later X and Y waves, we judge that Z1Y2 must have lasted at least two to three
centuries. Because human progress in Z1Y1 was slow and modest, the depth of the
decline may also have been modest, leaving little or no evidence in the archaeological
record.
The Wave Principle suggests, furthermore, that Z1Y1 and Z1Y3, preceding and
following Z1Y2, were composed of lesser waves (X waves, grand super cycles
(GSCs), and super cycles (SCs). It is impossible for us to identify these smaller waves
and their associated declines, but we do understand the causes of decline during the
Neolithic. This is because the agricultural revolution brought a number of risks with
it, including:
1. Degradation of the soil. Overgrazing and failure to rotate crops caused
many of the earliest settled areas to become desolate regions even to this day. Much of the world's deserts are man-made.
2. Disease. Increasing human populations in closer proximity brought the risk of epidemic.
3. Famine. Man became dependant on weather. Crops were also at risk
from insects and other animals.

4. Pollution. Towns developed long before sanitation.
5. Loss of freedom. Freedom of movement was lost in the transition from nomadic to sedentary life.
6. Security problems. Sedentary life creates wealth, which in turn creates
security risks. The development of town walls testifies to this threat,
particularly from nomadic groups on the fringes of civilization. This was
a primary cause of the Bronze Age declines, and persisted as a threat at
least through the Mongol conquests in the 13th century AD.
7. Class strife. Sedentary life creates economic classes. This can lead to
oppression of the lower classes by the elites (evidenced in Gilgamesh) and uprisings by the lower classes against the elites.
Z1Y3: c.6800BC to c.3500BC. Village/Farming Community Level
Farming villages appeared first in the Fertile Crescent, then in Egypt c.5000BC.
Fertile Crescent phases are as follows:
1. Jarmo Phase (Iraq) by c.6750BC. Cultural exchanges existed over
hundreds of miles. Man was domesticating wheat, barley, pea, sheep, cattle, goats, pigs, and horses.
2. Hassunan Phase, to c.4800BC. Advanced architecture, larger villages,
improved and more aesthetic pottery.
3. Halafian Phase. Round "tholos" style houses, possible copper
metallurgy.
4. Eriduan Phase. Recognizable temple made of mudbrick.
5. Ubaidian Phase. Before c.4000BC. Threshold of urban life. Town-sized sites. Temples display some monumentality.
Z1Y4: c.3500 to c.3200BC. Chalcolithic
This transition between the Neolithic and Bronze Ages was a period of incipient
copper use, for decorations, tools, and weapons. Reference materials show an
extremely wide range of dates for the Chalcolithic, because a handful of metal objects
date from well before 3500BC. We have defined this period narrowly, corresponding
to the Two Kingdoms period in Egypt.

1. Sumeria (c.3200BC): Jemdat Nasr Period. A mildly declining
archaeological period prior to the reign of Gilgamesh that is associated
with the Flood legend.
2. Egypt (c.3500BC-c.3200BC): Upper and Lower Egypt were frequently at war with each other.
3. Anatolia (c.3500BC-3200BC): Sites from this period are more fortified
than previously and were often destroyed by violence (eg. Mersin and
Hacilar).
Z1Y5: c.3200BC to 337AD. Bronze and Iron Ages
Man learned to make bronze by mixing tin with copper, launching civilization to new
heights. Iron was discovered by the Hittites in the latter years of their empire and
maintained as a closely guarded secret. With the disintegration of the Hittites
c.1200BC, the use of iron spread to other countries, coinciding with the advent of a
long dark age.
Z1Y5X1: c.3200BC to c.2300BC. Early Bronze Age
1. Sumeria (c.3200BC-2325BC): While the emergence of Sumer can be
traced to c.4000BC or before, Bronze Age Sumeria ran from c.3200BC
to 2325BC. Sumeria reached the peak of its power under the reign of
Lugalzaggasi 2350BC to 2325BC, bordering the Mediterranean Sea and
Persian Gulf.
2. Egypt (c.3200BC-2281BC): Dynasties I-VI (Proto Dynastic and Old
Kingdom Periods). Menes, the first true historical figure, founded the
first dynasty by uniting Upper and Lower Egypt c.3200BC. This period
reached its peak during Dynasty VI, with trading , exploratory, and
military expeditions well beyond Egypt's borders. This superficial
greatness masked great underlying stresses, however, due primarily to
high taxation and over-centralization of power.
3. Anatolia (c.3200BC-c.2100BC): Local areas were consolidated under
the rule of kings. Troy levels I and II date from this period. Troy II was a
powerful fortress during the majority of the early Bronze Age. It rests
upon the ruins of a lesser settlement that may date from the late Chalcolithic.
Z1Y5X2: c.2300BC to c.2000BC. Intermediate Bronze Age

1. Sumeria (2325BC-c.2000BC): Sumeria was conquered at the height of
its power in 2325BC by Sargon of Akkad. The Sumerians temporarily
reasserted themselves c.2100BC during a period of turmoil throughout
Mesopotamia. Descending Elliott waves exhibit an A (down) B (up) C
(down) pattern, and the reassertion of the Sumerians c.2100BC may
represent the B wave of X2 for them. The Sumerians ceased to exist as a distinct people c.2000BC.
2. Egypt (2281BC-2050BC): Dynasties VII-X (First Intermediate Period).
Discontent and a spirit of rebellion at the end of wave X1 led to
destruction of the old order. Dynasty VII, which opened this period, was
an oligarchy of 70 men who ruled for a mere 70 days. Wave X2 is
characterized by banditry and internecine warfare, foreign invasion and
temporary occupation of the Delta, plunder of burial sites and decline of
religion, and a major transfer of wealth, impoverishing many nobles and
enriching some commoners. Not surprisingly, the writing of this period expresses a longing for the better days of the bygone era.
3. Anatolia (c.2100BC-c.1900BC): Dates are particularly hazy here. Many
of the early Bronze Age towns were looted and destroyed by 2000BC,
including Troy II. Troy levels III-V, associated with this period, had
smaller walls than Troy II. Small houses were confined within narrow lanes.
Z1Y5X3: c.2000BC to c.1200BC. Middle and Late Bronze Ages
1. S. Mesopotamia (c.2000BC-c.1200BC): The First Babylonian Empire
was founded c.2000BC, containing many cultural elements of the earlier Sumerians. It existed until c.1200BC.
2. N. Mesopotamia (c.2000BC-c.1200BC): The emergence of Assyria
dates from c.3000BC, but the period of their military development was
from c.2000BC to c.1200BC. (Assyrians invented the sword in this period.)
3. Egypt (2050BC-1167BC): Dynasties XI-XIX (ended 1200BC). After a
period of revival and another decline, Egypt achieved the height of its
power under the reign of Thutmosis III 1491BC-1449BC. The last great
pharoah was Ramses III 1198BC-1167BC, the second pharoah of Dynasty XX.

4. E. Anatolia (c.2000BC-c.1200BC): The Hittites existed as a people from
c.2000BC to c.1200BC. They developed in three phases, allowing us to
describe their grand super cycles roughly as GSC1&2) Early Hittites
c.2000BC-c.1700BC, GSC3&4) Hittite Kingdom c.1700BC-c.1430BC, and GSC5) Hittite Empire c.1430BC-c.1200BC.
5. W. Anatolia (c.1900BC-1200BC): Troy VI, founded c.1900BC, had
walls 16 feet thick, with several gates and towers. Buildings were
pretentious with numerous pillars and columns still in evidence.
Destroyed by earthquake c.1300BC, it was rebuilt as Troy VIIa, which is
considered the Troy of Homer's Iliad.
6. Greece (c.1900BC-c.1200BC): Achaean invaders conquered Greece
c.1900BC, establishing their principle city at Mycenae. They were conquered in turn by invading Dorians between 1200BC and 1100BC.
7. Crete (c.1950BC-c.1200BC): Middle and Late Minoan. The earliest
inhabitants of Crete date from c.3000BC, with Bronze Age villages
dating from c.2500BC. A sudden urbanization c.1950BC (probably
brought by Semitic peoples) began the Middle Minoan period , which is
considered the start of true Minoan civilization. Initially Minoan Crete
held sovereignty or influence over the Achaean Greeks, and a joint
culture developed between the two. Control passed to Greek hands
c.1400BC (destruction of Knossos) and Homer relates that King
Idumeneus of Crete fought under King Agamemnon of Mycenae at Troy
(c.1200BC).
8. Italy: c.2000BC the ancestors of the Latins brought the Bronze Age to
the peninsula.
Z1Y5X4: c.1200BC to 700BC. Early Iron Age - The First Dark Age
The advent of the Iron Age coincided with collapse of the Bronze Age civilizations.
Z1Y5X4A: c.1200BC to 1028BC. Early Dark Age - Destruction of the Bronze Age
Cultures
1. S. Mesopotamia: The First Babylonian Empire was destroyed by the
Hittites and/or Assyrians c.1200BC.
2. N. Mesopotamia: Assyrian power declined from c.1230BC to 1116BC.
Under the leadership of Tiglath-pileser I (1116BC-1093BC) Assyria

became the dominant state in the Middle East. Decline continued starting around 1050BC as a migratory wave of nomads swept the region.
3. Egypt: Invasion by Peoples of the Sea c.1200BC at the start of Dynasty
XX. Ramses III (1198BC-1167BC) repelled the invasion, as well as
threats from the Philistines and Libyans. This was a temporary respite, as Egypt began a long decline after Ramses' death.
4. E. Anatolia: The Hittites were destroyed c.1200BC by invasion of
Peoples of the Sea from the Aegean, and attacks from the mountainous Gashga tribes.
5. W. Anatolia: Troy VIIa was destroyed by fire c.1200BC.
6. Greece: Achaean culture destroyed by invading Dorians c.1200BC.
Athens alone survived. Mycenae was reoccupied by Achaeans, but destroyed by 1100BC.
Z1Y5X4B: 1028BC to 933BC. Israel - The Reigns of Saul, David, and Solomon
A corrective wave such as X4, massive both in depth and duration, should evidence a
discernable upward wave B in its center; and it is exactly at this point that the Bible
describes the wealth and glory of Solomon's reign in Israel (I Kings, Chapter 10).
Z1Y5X4C: 933BC to 700BC. Dark Age Continues
1. Mesopotamia: Assyria experienced a resurgence under Ashurnasirpal II
and Shalmaneser II (883BC-824BC), followed by continued decline
under weak successors. As this period was drawing to a close, Assyria
reached the height of its power under Tiglath-pileser III (745BC-
727BC). The Fall of Assyria was 612BC.
2. Egypt: Decline continued during this period. Conquered by Ethiopia c.730BC.
3. Greece: Early formation of the states that later comprised Classical Greece.
Z1Y5X5: 700BC to 337AD. The Roman X Wave - from the founding of Rome to
Constantine
Around 700BC, mankind resumed its upward march. Carthage was founded in the 8th
century; and as mentioned above, Assyria reached its peak in the decades leading up

to 700BC. The emergence of the Medes was near the beginning of this X wave; and
Persian history from Cyrus (559BC-530BC) to Xenophon's Anabasis/revolt of Cyrus
the Younger (401BC-400BC) completes the first grand super cycle (GSC1) of X5.
The New Babylonian Empire (612BC to 538BC) had its existence entirely within
GSC1, representing the third super cycle (SC3) of that grand super cycle. Spartan
history from Lycurgus (c.700BC) through the Peloponnesian War (ended 404BC)
corresponds with GSC1, and this grand super cycle also corresponds with Athenian
history from the end of monarchy in 683BC to the end of the Peloponnesian War. The
period of Olympic Games 776BC-393AD corresponds roughly with X5.
A critical phase of monetary history, the development of coinage, also corresponds
with GSC1 of X5. The first royal mint was established in Lydia c.700BC producing
the first crude coins made of electrum, a natural alloy of gold and silver. By the end of
GSC1, coinage dominated Mediterranean commerce, having reached the peak of
engraving and artistic quality. During GSC1, annual world silver production was
about 1.5 million ounces, with 2/3 coming from the Laurium mines near Athens.
From the standpoint of monetary history, GSC1 ended in 407BC, during the
Peloponnesian War. Sparta captured Laurium and freed 20,000 slaves there, thus
severing Athens from her money supply. Athens responded by issuing silver-plated
bronze coinage (406BC-405BC) and the populace began hoarding silver, the first
known application of Gresham's Law.
Because Roman history serves as the precursor to European history, we will follow
the wave patterns after 700BC through Rome. We have used DuPuy & DuPuy, The
Encyclopedia of Military History (p.12) as the authority on the founding date of the
city, as opposed to the more traditional date of 753BC. Better histories are available
for this X wave, allowing us to identify the super cycles and grand super cycles that
compose it.
GSC1: 700BC to 396BC. Rome becomes the leading city in central Italy
SC1 (700BC-c.600BC): Century of warfare with Etruscan neighbors.
SC2 (c.600BC): Defeat by the Etruscans.
SC3 (c.600BC-509BC): Prosperity under the Tarquins (Etruscan Kings).
SC4 (509BC-496BC): Revolt. Establishment of the Roman Republic in 509. Struggles
with relatives of the Tarquins attempting to regain the throne.
SC5 (496BC-396BC): Expansion of Rome. Rome became the leading city in central
Italy with the destruction of the Veii in 396BC
GSC2: 396BC to 390BC. The sack of Rome

In 390BC Rome was sacked by the Gauls, who occupied the city for months. The
Gauls failed to capture the citadel, which housed the Roman treasury, because the
cackle of geese warned the Romans of impending attack. In gratitude, a shrine was
dedicated to Juno Moneta, goddess of warning, and from this event we get the words
"mint" and "money".
GSC3: 390BC to 135BC. Rome becomes a world power
Rome continued its growth in three phases with many setbacks and near disasters
along the way, 1) the consolidation of Latium by 343BC, 2) The consolidation of Italy
by 265BC, and 3) the achievement of world power status by 146BC.
SC1 (390BC-343BC): Consolidation of Latium. Establishment of a Latin
confederacy.
SC2 (343BC-338BC): Uprising of Latin allies in the Latin War 340BC-338BC.
SC3 (338BC-265BC): Consolidation of Italy was completed with the conquest of
Rhegium in 270BC, and defeat of a Samnite uprising soon afterward.
SC4 (265BC-242BC): Early defeats in the First Punic War (Carthage). By 249BC
Rome had suffered four major disasters at sea losing over 200,000 men and 700
warships to storms alone. With the fleet rebuilt in 242BC, Carthage was defeated in
241BC. This victory provided Rome with her first province overseas, in western
Sicily (at the start of SC5).
SC5 (241BC-135BC): Rome becomes a world power. With the defeats of Macedonia,
Greece (Achaean War) and Carthage (Third Punic War), all in 146BC, Rome became
mistress of the Mediterranean world.
GSC4: 135BC to 30BC. Fall of the Roman Republic
Just as Rome achieved world power status she was ripped apart by internal disorders
and class warfare. This chaotic period includes the First Servile War 135BC-132BC,
assassination of the democratic tribune Tiberius Gracchus in 133BC, Revolt of
Fregellae (Roman allies) 124BC, Second Servile War 104BC-99BC, the Social War
91BC-88BC, Roman Civil War (Marius/democrats vs Sulla/aristocrats) 88BC-82BC,
Third Servile War (Spartacus) 73BC-71BC, the insurrection of Cataline during
Cicero's consulship 63BC, the Great Roman Civil War (Caesar/democrats vs Pompey
/aristocrats 50BC-44BC, Wars of the Second Triumvirate (following Caesar's
assassination) 43BC-34BC, assassination of Cicero by agents of the Second
Triumvirate, and the War of Octavian Against Anthony 33BC-30BC, all of which led
to the fall of the republic.
GSC5: 30BC to 337AD. The Roman Empire through Constantine
The Pax Romana period 30BC-162AD comprises the first 3 super cycles of GSC5.
The Julian Dynasty and the chaos following Nero's death comprise SC1 and SC2.
SC1 (30BC-54AD): Early Pax Romana, from Augustus to Claudius. This super cycle
also corresponds to the gold standard established by Augustus.
SC2 (54AD-69AD). Nero (54-68AD) plus the Year of Four Emperors (69AD). Nero
is known for his persecution of Christians, and for the burning of Rome as part of his
city planning scheme. He also ended the gold standard of Augustus, reducing the
weight and fineness of silver coinage, and the weight of gold coinage.
SC3 (69AD-162AD): Later Pax Romana, from Vespasian to the beginning of the
Eastern War.
SC4 (162AD-268AD): Decline of Empire. Marcus Aurelius (161AD-180AD) was the
best and last of the five "good" emperors of the Pax Romana. With his death in
180AD, the empire was clearly in decline, but the Pax Romana is considered to end in
162AD, since Marcus spent virtually his entire reign fending off external threats to the
empire.
SC5 (268AD-337AD): Revival under the Illyrian Emperors through Constantine.
Z2: 337AD to 1000AD. Correction Wave for Z1
Interpreting this wave is crucial to understanding 1999 from an Elliott Wave
standpoint. From 1000 to 1999 civilization has advanced for a millenium, and it is
fairly easy to define this as an X-wave composed of 5 grand super cycle waves. But is
the current X-wave the first X-wave of the current Y-wave, or could it be the third or
fifth X-wave?
A key to answering this question lies in the length and severity of the decline that
preceded 1000. This decline continued for seven centuries, which is too long to
represent the correction of the Roman X Wave, a mere 1000-year advance. This must
be the correction of a higher order wave, either Y or Z. Our interpretation, looking at
all of the advances and declines of mankind, is that this wave corrected the entire
10,000 years that preceded it. Therefore, we judge the present X-wave (1000-1999) as
the first X-wave of the first Y-wave of Z3.
Z2A: 337AD to 476AD. Fall of the Western Empire
After Constantine the decline of empire continued until the abdication of Romulus
Augustus, the last emperor, in 476. By 366 Roman money was so debased that the
government refused to accept its own coinage in payment of taxes. The city of Rome
was sacked by the Vandals in 455, and by 476 the western empire was no more than a
pitiful shell. This A wave corrected the entire Roman X Wave (Z1Y5X5).

Z2B: 476AD to 800AD. Early European History to Charlemagne
This period marked the early development of European states culminating in the
crowning of Charlemagne as Holy Roman Emperor in 800. At the height of the B
wave, as we would expect, there is some faint semblance of the former glory of Rome.
Charlemage played a role for Christendom in Z2B similar to Solomon's role for the
ancient world in Z1Y5X4B, providing a brief moment of glory in the midst of an
otherwise bleak age. The Vikings began raiding Europe in 809, near the end of
Charlemagne's reign (771-814).
Z2C: 800AD to 1000AD. The Dark Ages
The Encyclopaedia of Military History (p.243) says this about the period: "This, the
darkest period of the Middle Ages, was characterized by aimless and anarchic strife."
This final horrible decline corrected not only X5 (Roman history), but the prior X and
Y waves of Z1 as well.
Z3: 1000AD to c.11000AD. Present Z Wave
"The farther back one looks, the farther in the future one may see," Winston Churchill.
Z3Y1: 1000AD to c.4000AD. Present Y Wave.
Z3Y1X1: 1000AD to c.2000AD. Present X Wave: Modern Man
Description of this period is contained in Parts 2 and 3. Additional notes follow.
GSC1: 1000AD to 1350AD. Late Middle Ages
Coalescence of European states, particularly England and France. Rise of the Italian
maritime powers: Venice, Genoa, and Pisa. Because the Renaissance (GSC3) began in
Italy, we will follow the Italian wave patterns in GSC1.
SC1 (1000-1096): Venice dominated the Adriatic after defeat of Dalmatian pirates in
1000 and capture of Bari from the Moslems 1002. Pisa and Genoa drove the Moslems
from Sardinia 1005-1016.
SC2 (1097-1102): Venice lost the Dalmatian coast during a war with Hungary.
SC3 (1102-1170): Pisa at the height of its power in the 1100s.
SC4 (1171-1196): Venetian setbacks. Defeated in war with Byzantium 1171. Failed
efforts to retake Dalmatia 1172-1196.
SC5 (1197-1359): Commercial rivalry of Genoa and Venice. The Republic of

Florence issued the gold florin in 1252, the first European gold coin since the fall of
Rome. Genoese nobles overthrown 1359 and replaced with an elected Doge.
GSC2: 1350AD to 1400AD. The Black Death (Bubonic and Pneumonic Plague)
Southern Europe was stricken in 1347, with Western Europe stricken in 1348 and
Northern Europe stricken in 1349. By the end of 1350 two thirds of all Europeans had
contracted the plague with a mortality rate of 50%, resulting in 25 million deaths.
Europe was struck by succeeding waves every few years through 1398, with declining
mortality rates in each wave. Local outbreaks continued into the 1700s. The epidemic
was a disaster economically in the latter half of the 14th century as inflation raged and
commerce ground to a near halt during the acute labor shortage. During this period
there were mass mental aberrations, agrarian revolts, a moral decline, and a reduced
level of education.
GSC3: 1400AD to 1720AD. Renaissance
SC1 (1400-1479): Early Renaissance SC2 (1479-1495): Setbacks for the Italian states
1. Venice: declined following defeat by the Turks and loss of territory in
1479.
2. Naples: French invasion 1494-1495.
3. Rome: Reign of Pope Alexander VI 1492-1495. His son, Caesar Borgia,
wrecked the power of the wealthy families of Rome.
4. Pisa: Failed to regain independence from Florence.
SC3 (1491-1588): The Spanish Century, from the unification of Spain under
Ferdinand and Isabella (conquest of Granada) in 1491 to the Spanish Armada in 1588.
Colonization of the New World. The Colombian (cultural) Exchange. Spanish
dominance of Europe.
SC4 (1588-1618): Spanish power went into decline after the Armada. Banking
crisis/bank failures in northern Italy in the late 1500s.
SC5 (1619-1720): The Century of Fiat Credit. Venice established a state bank, Banco
della Piazzo del Rialto, in response to the Italian banking crisis. Venice then invented
fiat credit in 1619 by creating another bank, Banco del Giro, with credit against the
state rather than a deposit of specie. The Bank of England was established 1693 near
the end of the super cycle. Holland's Tulipmania was during this super cycle, and the
South Sea Bubble and Mississippi Scheme brought the period to a close.
GSC4: 1720AD to 1780AD. South Sea and Mississippi Bubbles Burst

The dates chosen for GSC4 correspond to the bear market in England following the
collapse of the South Sea Bubble in 1720. In France, the collapse of the Mississippi
Scheme the same year led to great financial distress. By the reign of Louis XVI (1774-
1791), the worsening financial crisis and a succession of finance ministers culminated
in the calling of the States-General in 1789 to address the problem. We consider the
French Revolution, beginning with the calling of the States-General, to be the start of
GSC5 in France.
GSC5: 1780AD to c.2000AD. Industrial and Electronic Revolutions
In England, GSC5 commenced in 1780, and this grand super cycle represents
American history from 1776 to present.
Bibliography
Books Abbott, Jacob. Julius Caesar. Philadelphia: Henry Altemus Co., 1900.
Aurelius, Marcus. Meditations. Roslyn, New York: Walter J. Black, Inc., 1945.
Cicero. Selected Works. New York: Penguin Classics, 1960.
Collier's Encyclopedia, 1968.
Dupuy, R.E. and Dupuy, T.N. The Encyclopedia of Military History. New York: Harper & Row,
1970.
Einhard and Notker the Stammerer. Two Lives of Charlemagne. New York: Penguin Books,
1969.
Gardner, John and Maier, John. Gilgamesh. New York: Random House, 1984.
Gibbon, Edward. Decline and Fall of the Roman Empire vol. I. New York: Random House.
Plato. Selected Dialogues. Ed. Edith Hamilton and Huntington Cairnes. N.Y.: Random House,
1961.
Holy Bible, King James Version.
Homer. The Iliad, tr. Samuel Butler, ed. Louise R. Loomis. Roslyn, N.Y.: Walter J. Black, Inc.,
1942.
Hoppe, Donald. How to Invest in Gold Stocks and Avoid the Pitfalls. New Rochelle: Arlington,
1972.
Lamb, Harold. Hannibal. New York: Bantam Books, 1958.
MacKay, Charles. Extraordinary Popular Delusions and the Madness of Crowds. London:
Richard Bentley, 1841.
McCullough, Colleen. The First Man in Rome. New York: Avon Books, 1990.
Mignet, F. History of the French Revolution From 1789 to 1814. New York: E.P. Dutton & Co.,
1926.
Platt, Colin. The English Mediaeval Town. London: Granada Publishing, 1979
Plutarch. Fall of the Roman Republic. New York: Penguin Classics, 1958.
Rollin, Charles. Rollin's Ancient History. London: 1839.
Sallust. Jugurthine War/Conspiracy of Cataline. New York: Penguin Classics, 1963.
Thucidides. The Peloponnesian War, tr. Crawley. New York: Random House, 1951.
West, Willis. Ancient History to the Death of Charlemagne. Boston: Allyn & Bacon, 1902.

Xenophon. Cyropaedia, tr. Walter Miller. New York: Putnam's Sons, 1925.
Principle Internet Sources Agriculture and Husbandry.
http://www.ukans.edu/kansas/medieval/100/sections/03AGRICU.HTM
Agricultural Revolution. http://www.wsu.edu:8001/vwsu/gened/learn-modules/top_agrev/4-
Agriculture/agriculture1.html
Ancient/Classical History. http://ancienthistory.about.com/education/ancienthistory/mbody.htm
Ancient Economics. http://ancienthistory.about.com/education/ancienthistory/msub11.htm
Ancient Egyptian History. http://watson.org/rivendell/historyegypt.html
Ancient Mesopotamia.
http://campus.northpark.edu/history/WebChron/MiddleEast/AncMesopot.html
Armstrong, Martin A. Monetary History of the World. http://www.pei-intl.com
Assyrian History. http://webhome.idirect.com/~ashur/AssyrianHistoryMainPage_II.htm
Bronze Age. http://devlab.dartmouth.edu/history/bronze_age
Chalcolithic, Bronze, and Iron Ages. http://www.imj.org.il/archaeology/ages.html
Guardian's Egypt. http://guardians.net/egypt
Hittites. http://www.turkishnews.com/DiscoverTurkey/anatolia/history.html
Sumerian Archaeological Sites. http://primenet.com/~seagoat/sumerian/map.htm
Siren, Christopher. Sumerian Mythology FAQ. http://pubpages.unh.edu/~cbsiren/sumer-faq.html
Stearns, Peter, Adas, Michael, and Schwartz, Stuart. The Agrarian Revolution and the Birth of
Civilization. http://www.stetson.edu/~psteeves/classes/agrrevolution.html
Sumer. http://crystalinks.com/sumerian.html
Timelines. http://ancienthistory.about.com/library/bl/bl_time_neareast_babylonia.htm
(C) 1999 By The Authors
All rights reserved
12,000 YEARS OF ELLIOTT WAVES
Part 5: Potential causes of an X-wave correction starting in the new millenium
Introduction
According to the long term Elliott wave count presented in the body of this document,
we are at the brink of a new Dark Age – longer than the periods of substantially
reduced economic activity that characterized the corrective waves that occurred earlier
during the current Z3Y1X1 wave, yet not nearly as long as the substantial interregnum
that followed the Fall of Rome at the end of wave Z1.
The first of the two corrective waves of the Z3Y1X1 wave occurred as a consequence
of the Bubonic Plague that swept through Europe during the 14th century. The second

of the two corrective waves followed the stock market bubbles of the early 18th
century. These have been estimated at lasting only 50 and 60 years respectively. On
the other hand, it required almost 700 years for Western Civilization to get back into
gear again after the vacuum left by the decline of the Roman Empire – represented as
the interregnum between the end of wave Z1 and the beginning of wave Z3 in about
1000 AD.
As a rough estimate, the Elliott count predicts a period of ranging from about 100 to
perhaps as long as 200 years of declining economic activity before the nadir is
reached and a new sustainable upswing begins. Most of us today have never
experienced a true bear market and hardly remember even the best approximation of
such a market we have had; namely that extended sideways drift from 1966 through to
1982 – from the time when the Dow Jones index first breached 1000 points until it
finally could penetrate that barrier and begin the long, sustained bull market that has
only now approached its peak.
During that mainly sideways trend there were four occasions of steep bear trends of
which the worst was the 40%+ decline from 1972 to the end of 1974. Compare that
40%+ decline with the approximately 90% decline reached during the aftermath of the
1929 Crash, and the almost decade long Depression that followed, and it is clear the
40% bear market spread over not even two years is for Americans the best example of
a down trending stock market in recent memory. Even during the better remembered
events of October 1987 the overall decline on Wall Street was only about 35%+, and
the bull market resumed its steeply rising trend after less than 4 months. Today, on
any long term chart of the Dow Jones or S&P500, what happened in October 1987
and its aftermath appears as hardly a blip within the 1982-1999 bull market.
No wonder we cannot begin to imagine a bear market that just might last the better
part of two centuries. Yet, as will be shown below, this grim outlook might not be all
that farfetched if certain already established trends are carried through to what may
well be a feasible scenario of events.
Even if this deeply gloomy future, strongly suggested by the Elliott analysis, does not
materialize, there is some evidence to suggest that at least the next few decades may
not present such smooth sailing as we would otherwise look forward to enjoy. And the
effects of the potential trauma may last long enough to severely inhibit the
circumstances our children and perhaps even their children will experience.
The following factors are discussed as potential causes or, at best, contributing factors
to the situation foreseen in the Elliott analysis: the Y2K problem; the high level of
debt, particularly in the USA; global instabilities; global warming and/or depleting oil
reserves. These factors are listed in the order in which they can be expected to appear
and have effect. It so happens that the order in which they were mentioned is also
likely to reflect their duration and the degree to which they could contribute to an
episode of the magnitude of an X-wave correction.
1. The Y2K problem.
Nobody really knows how severe the Y2K problem will be and how long its effects
will be felt – or even if there really are going to be any significant effects into the
Year 2000.
Expert opinion ranges from a smooth transition into the new 'digital' millenium – the
true historical millenium will only commence in 2001 – with relatively minor and
isolated hiccups of no great consequence, to severe interruption of world trade and
other mishaps that are expected to trigger a long lasting depression. At one extreme of
the anticipation spectrum, a large part of the general populace are either unaware of
the potential risk or uncaring about what the year 2000 could bring, and thus
completely unprepared if anything should go wrong. People at the other end of the
spectrum are busy digging bunkers and assembling the food, water and armaments
they perceive as necessary for survival in the utter chaos that could erupt due to
computer glitches as we transition to the new millennium.
Perhaps the biggest real threat of Y2K is that it is going to take place at a critical
moment for many markets. In the US and in Europe equity prices are near their all-
time highs, which make markets sensitive to shocks. Price/earnings rations in the US
are well above previous high levels attained during strong bull markets and thus imply
that investors expect strong earnings growth during years to come. Elsewhere,
markets are either in the process of regaining the confidence of investors following
turbulence over the past 2 years, or they are resting on quite unstable foundations as
the economies they reflect are subjected to all kinds of stresses and strains.
With the US market in the stratosphere on prospects of sustained growth, with most
Asian economies barely settled on the path to recovery, and with Latin America and
the old Iron Curtain countries hovering on the brink of major economic dislocations,
the global economy can do without new shocks for the time being. To what degree
Y2K could be such a shock is difficult to anticipate. It is not really necessary to
speculate, though, as we will know soon enough.
2. Debt
On a global level debt has risen to levels not considered possible in earlier times.

We know that in Japan the banking system is even now in dire straits because of high
levels of debt that initially were justified on the grounds of the wealth implicit in the
high prices of equities on the Tokyo stock market as well as the extremely high
valuations placed on real estate. During the 90's the equity and real estate bubbles
popped to devastate the Japanese financial system. Absurdly low interest rates have
left Japanese citizens no other option than to save every Yen they can in order to
provide for an increasingly uncertain future. With consumer spending contracting all
the time to sustain the savings drive, the Japanese economy has entered a deflationary
spiral that is yet to end.
The US has entered much the same kind of over-valued market environment, if
perhaps not to the same degree as had been the case in Japan in the late 80's. Property
prices in many areas of the US have risen sharply in recent years. Exploiting the
situation, many house-owners have substantially increased their mortgages, thereby
obtaining funds to purchase durable goods and to invest on the stock market. At the
same time, they have added substantially to the overall amount of debt.
As the value of household investments on Wall Street increased by leaps and bounds
over the past 5 years, this rapidly growing private wealth provided collateral for
further loans that helped to fuel spending on consumer goods – thus adding
substantially to the trade deficit in the process – as well as releasing new funds that
could be channeled back into Wall Street to keep the bull market roaring ahead.
In this way, the self-fulfilling prediction of sustained economic growth was good for
Wall Street, while the strong equity market in turn provided the funds flow to keep
consumer spending at a high level and thus keep the economy in high gear. This circle
of events has now reached a degree of interactiveness that might make it impossible
for the equity market to wind down gracefully.
If consumer spending is reduced, the current high PE ratios of the stocks will no
longer be justified and equity prices would begin to fall. If prices decline, the
collateral value of household investments decrease and the more highly leveraged
people are compelled to sell to reduce their level of debt. By doing so they add supply
to Wall Street, forcing prices even lower. Falling equity prices in turn reduces the
amount of debt-funded consumer spending that can be afforded even further. Earnings
forecasts turn pessimistic as consumer spending is no longer increasing as steeply as
before and anticipated PE ratios rise further, putting more pressure on equity prices,
causing these to dip further and even more people have to sell some of their holdings
in order to reduce exposure to debt. Soon the market is spiraling downwards in a
steepening and sustained bear trend.

Potential shocks that could trigger this chain of events range from actions based on
Y2K fears, as mentioned above, to actual Y2K problems and the disruption of world
trade. However, shocks could arise from an unexpected direction – good news. For
example, if a sharp resurgence in Asian economies definitely gets under way, or when
Latin American and other markets currently perceived as high risk return to
equilibrium, such inherently good news could also be bad news for Wall Street.
Any one of these events could trigger an outflow of funds from the US into the
promising new markets. This would reverse the "flight to a safe haven" of the past two
years, which have substantially improved the liquidity of US markets and thus helped
to make the above cycle of wealth creation and consumer spending possible. This
inflow of funds also supported the US dollar and the strong dollar helped to keep
these funds invested in the United States.
Even a partial withdrawal by foreigners from US market will put equity and bond
prices under pressure, much as the reaction to a significant shock to the markets
would do. As before, this would serve to reduce the amount of collateral borrowers
can obtain from their stock holdings. Further selling becomes imperative and, as
discussed earlier, events follow each other in a descending spiral that rapidly
accelerates until prices plummet steeply in pure panic.
It could be argued that should the Federal Reserve supply liquidity to the market to
offset any repatriation of funds by foreigners, this might later be viewed as having
added even more explosive to an already volatile situation. The vacuum left by
repatriation would have to be filled from domestic sources of funds, which implies a
greater degree of investment on Wall Street by American residents. This medicine
worked wonders in the aftermath of the July-September sell-off on Wall Street in the
wake of the Russian crisis. At the time a large injection of liquidity by the Federal
Reserve, coupled to multiple cuts in interest rates, was first reflected in extremely
heavy turnover on Wall Street during September and into October as panicking sellers
were met by optimistic buyers with pockets full of borrowed funds. The latter
triumphed and the Dow gained almost 50% during the next few months. Whether this
would work again at present elevated levels of consumer debt is difficult to judge.
One other factor to keep in mind is that if a deflationary spiral does begin in the US,
the result will probably be deeper and more lasting than was the case for Japan and the
other troubled Asian economies. They enjoyed the advantage of an "importer of last
resort", as the US economy remained voracious in its demand for imported goods,
while their own economies languished. On the other hand, US manufacturers and
exporters will not enjoy a similar advantage if they should experience severe problems
at home.

A comparison with what has happened in Asia and elsewhere and using that example
as a reason for saying the US should at least do as well as these countries have done
over the past few years, might thus be too optimistic a view. A collapse of the US
economy would have more severe global effects than what have been experienced so
far, would affect the US itself to a greater degree than what has happened in other
countries and thirdly, would last much longer before a recovery can begin than was
the case in most other countries.
The events that would be unleashed on the world should this collapse come to pass
will find a fertile breeding ground in the current international political arena and
precipitate even more serious problems, as described below.
3. Nodes of instability.
After the Iron Curtain rusted through, it was widely believed that the world was now
due to enter a period of stability and relief from the threat of nuclear war. Since then
there has been military intervention in Iraq and recently in Kosovo – which, despite
the apparent limited extent of these conflicts consumed military resources at a far
greater rate than any previous conflict – and also many other skirmishes in out of the
way places nobody pays any real attention to, probably because the media find it
inconvenient to cover these adventures in such difficult to get to places.
More recently, however, new nodes of instability have flared up, mostly not for the
first time. What has changed however is that in some cases the threats on both sides of
these face-offs have escalated to a degree not experienced since the Cold War. India
and Pakistan have fought wars over Kashmir ever since the partition in the late 1940's
in the wake of the British retreat from India.
However, now they are two nuclear powers who have recently engaged in a war in
extremely difficult terrain where conventional warfare can only achieve limited
success. For either of the two combatants the temptation to exploit the nuclear option
could easily become irresistible.
North Korea is strongly suspected of also having become a nuclear power. Why else
would they be on the brink of testing ballistic missiles with a range of thousands of
kilometers? The expense of building and deploying such missiles in limited numbers
makes no sense if they are armed with only conventional explosives. While relations
with South Korea is still far from satisfactory, the North sits with internal problems of
such severity that the classical antidote to the threat of an uprising might just seem
attractive, namely to seek a casus belli and begin a war that would take people's minds
off their own problems and focus their attention on the 'common enemy'.

Tensions between China and Taiwan have reached breaking point, with statements
and misstatements from Taiwan threatening severance of the umbilical cord that, at
least in the dreams of many Chinese, still bind the island to the mainland. Secession
from "China" by the island nation is likely to be treated in much the same way the
North reacted to a similar action by the Confederacy in the United States, more than
120 years ago. Then the result was the devastating American Civil War.
This is not the place to speculate about the ramifications of a Chinese attack on
Taiwan – presumably in reaction to Taiwanese intentions to formalize what is already
in effect, namely secession from mainland China. It seems more than likely, though,
that countries that have signed treaties with Taiwan will have to intervene to a greater
of lesser extent, with unknown consequences.
If a major disruption of global financial systems should occur, such as can result from
events discussed above, there would clearly be a need for the Great Powers to salvage
what they could and to use all available resources to contain the damage that is being
done. This just possibly might be seen by one of the contestants in any of these
potential theatres of war as an opportunity to take precipitate action, in the belief that
once completed it will be seen as a fait accompli by the rest of a world too concerned
about internal problems to get involved in some remote corner of the world, where the
outcome will be uncertain at best.
Nevertheless, once such a step has been taken it will have repercussions elsewhere,
triggering similar action from other parties in similar confrontational situations and
spreading havoc on an increasing scale to involve many more peoples than the
original combatants. As legends have it, once Pandora's Box has been opened it is
impossible to reverse the action or to avoid the consequences.
In the wings, too, is waiting another phenomenon that could also serve to disrupt the
status quo and perhaps precipitate rash action from affected people, including the use
of force to get hold of dwindling resources.
4. Global warming
Much has been written about global warming during the past decade or so. Initially,
speculation about a trend that could have widespread and very grave consequences
was made out as merely the nightmares of the doomsayers who crop up in every
generation. When it became clear that there has been a definite trend since about 1980
for the average annual global temperature to keep rising, there initially was a rear
guard action that tried to ascribe this trend to more complete coverage of the globe
and the improved statistics this has made possible.

It is now clear that since 1980 the world has experienced the warmest 20 years since
good global climate measurements first became available in about the 1860's – and
since 1990 the warmest 10 years over this period have occurred. Over the past 20
years the sustained increase in average global temperature has been so marked that it
no longer can be wished away.
Proponents of the global warming hypothesis used to look at an increase in hothouse
gasses as the cause of this phenomenon. They have modeled the biosphere extensively
on super computers and these results indicate that warming is likely. However, so far
the results tended to be ambiguous and very sensitive to the basic assumptions that are
inserted in the models. More reliable evidence comes from historical data.
The study of an ice core extracted from the Antarctic polar cap and going back over
400,000 years has shown, firstly, that there is a good correlation between the
concentration of hothouse gasses and global temperatures and, secondly, that the
current concentration of these gasses are by far the highest within the span of the
record contained in that ice core. If the relationship between the concentration of
hothouse gasses and higher global temperature remain in place, a warmer global
climate will become a reality.
At the moment the warming trend has become so marked that it outstrips the
predictions of the computer models. Either the basic assumptions reflected in the
models are way off or another factor has entered the equation. One explanation now
being sought elsewhere has its origin outside the earth. Evidence was reported that
suggests the sun has been 'heating up' for some time now, and that recent higher
average temperatures are – at least in part – the result of absorption of the increased
radiated energy by the earth.
While the sun is known to be approaching a more energetic phase, as evident from the
increased incidence of sun spots, this warming of the sun would have to be
abnormally conspicuous to influence temperatures within the terrestrial atmosphere to
the degree that is being experienced. During previous peaks in the 11-year solar cycle,
no similar marked effect was experienced.
If the evidence of solar warming is confirmed, two possibilities exist. Firstly, the
heating up is associated with the solar 11-year cycle and should soon disappear again.
In that case, the risk is that global weather patterns are changed substantially through
the course of the next few warm years, with widespread and probably mostly harmful
effects on many aspects of human life, including many crop failures.
The second possibility is that the increased temperature of the sun is not linked to the
solar 11-year cycle, but is a different phenomenon of which there is one known

example from the not too distant past. If so, this development could easily be the
cause of the surprisingly long duration of the next X-wave correction that is
anticipated from the Elliott count.
In the late 1600's the sun decreased its level of radiation for a period of about 60
years. The effect of the cooler sun was a "little ice age", during which, for example,
the Thames in London froze solid for much of the winter – something that has not
happened since then. If the rising energy output of the sun is a warning that we are
now due to experience a period of similar duration of a substantially hotter sun,
weather patterns can be expected to show changes of equal or even greater magnitude
than 300 years ago.
Evidence from Antarctic ice cores shows another disturbing fact. At various times
over the past 400 thousand years of intermittent glaciation there have been periods of
sudden warming, with a gain of as much as 10 degrees centigrade in a matter of about
50 years or less. This by far outstrips the effect of hothouse gasses as modeled by
supercomputers.
The cause of these events is not known, but a recurrence of those events might now be
taking place, seeing that we have had 20 years of warmer temperatures and secondly
that the process appears to be speeding up.
What the changes in global weather patterns will be and how they will affect the areas
suitable for crop production and the yields obtained from them are very difficult to
estimate. Yet, it can be expected that even slight reductions in crop yields will have an
effect on an already over-populated earth. Just thinking of what will happen if drought
and other changes in the global climate pattern severely reduce the production of food,
even in isolated years, raises a nightmare all of its own.
5. Reduction in oil supplies.
During the 1970's much was made of the coming oil crisis as available resources were
depleted. Massive exploration succeeded in the discovery of a number of new oil
fields and suddenly the picture looked promising well into the 21st century. These
successes have dulled any remaining pessimism to the extent that few people are now
really concerned about the possibility of oil running out. If exploration should
discover no new fields and oil should become scarce, it will happen long after most
people living today are dead. It is a problem for future generations, not for the
decision-makers of today.
Yet, in seeking a possible cause or factors that could contribute to the extended
decline in economic activity predicated in the long wave Elliott model, the depletion

of oil reserves has to be considered. It might not have immediate effect, but could kick
in much later after early and temporary shocks have already set the stage for what is to
follow. For example, the episode anticipated in the Elliott model could begin with a
collapse in the US equity market with or without a real Y2K global crisis. Such events
would trigger a lasting depression, which would be exacerbated by any reductions in
food production as a result of changed weather patterns.
If oil supplies begin to dwindle during or even subsequent to these developments, the
extent and duration of the depression would be magnified. The automobile market and
the private transport system are likely to feel the effects early on as oil and oil
derivatives become scarce and ever more expensive. Nuclear energy could in time fill
the void left in the production of electricity by the reduction of oil supplies, but the
lead time to provide nuclear generated electricity is long – the more so now that the
building of new nuclear power stations has been politically unacceptable in many
countries for so many years. However, apart from transportation and the generation of
electricity there are many other uses of fossil fuels in a developed economy where it
would be less easy to find substitutes.
For example, without a ready supply of oil or natural gas much of the chemical
industry would grind to a halt or have to find substantially more expensive
alternatives. Coal could fill this void, but at substantial inconvenience and cost to
industry.
While even less quantifiable and immediate than the currently observable rising
pattern in global temperature, it is true that oil reserves are finite and will one day run
out if current consumption continues. Depletion of oil reserves therefore has to be
considered as one of the likely contributing factors in the search for reasons to explain
what the Elliot long wave analysis anticipates for the next 100 years and more.
6. Global warming and the use of fossil fuels
As mentioned earlier, indications from annual global temperatures are that some
degree of warming is already under way.
Despite uncertainty of exactly what its effects on the weather are likely to be, one
thing is certain. If it should happen that the incidence of cyclones and hurricanes,
extreme heat waves or extended and extreme freezing spells, either drought or a
superabundance of rain, on a global scale increase to where people's lives are
disrupted or threatened and where the effect on food production begins to pose a
threat to personal survival, people will react as they have always done in the past in
similar circumstances.

We have experienced such scares as the Tylenol sabotage in the US, the reaction to
the fear of salmonella eggs in Britain and development of the BSE panic in Europe
and in Britain, and others. It is clear that when people become suitably apprehensive
about their own safety, they tend to behave in near irrational fashion to neutralize the
threat.
And always there are some politicians with an eye on the main chance who stand
ready to fan and then to exploit these fears.
If the effects of global warming should begin to assume major proportions, with
indications that the situation could get a lot worse before it gets better, the search will
be on for a scapegoat to carry the blame and to offer a solution to the problem – which
will not be too difficult to find!
Media exposure over the years has established in the public mind a direct link
between the burning of fossil fuels and global warming, through its release of
hothouse gases. In this scheme of things, the use of the internal combustion engine has
been given place of prominence. Since political pressure has caused the end of
expansion in nuclear power generation, fossil fuels have increasingly been used to
generate electricity.
If conditions should deteriorate to where enough people become scared enough, there
will be a rush among politicians to be the first on the bandwagon to push for sharp and
punishing reductions in the use of fossil fuels in transportation and, when this
provides no instant solution to the problem, for the generation of electricity too. In due
course, many other factors that can add to the hothouse effect will also be included in
what could become a total ban on activities we today take for granted and consider
essential to a civilized life.
As the situation becomes more critical, most probably because on occasion food is in
very short supply, the level of panic will rise to where measures instituted to limit or
turn around the rise in global temperatures will cut deeply into the level of economic
activity of all industrialized countries. And the crowds are likely to cheer whenever a
smokestack ceases to exhale black smoke, even though it means the factory goes
silent and people lose their jobs.
If a crisis of this nature should develop, it will require decades to scale down suspect
activities and even more decades to get the economy into gear again.
If the use of fossil fuels for the generation of electricity is banned, or even just sharply
reduced, there is no alternative source of energy ready to take over. Even if nuclear
energy gets the green light again, it would take decades from the time the go-ahead is

given before the whole process from site selection, design and construction is
completed to where power is downloaded into the electricity grid.
The use of the automobile might suddenly be seen as a lot worse than smoking
cigarettes, because the perceived effects of vehicle emissions will not be viewed as
requiring years to make themselves felt; the effects will be current, visibly with us
right then. The fact that what is being experienced happens to be the accumulated
effects of many decades of high industrial and other activity will be disregarded in the
public mind; only one matter will be relevant, and that is to eradicate the source of the
problem, hothouse gases.
While in this scenario oil supplies do not run out, strict curbs on the use of petroleum
products may have much the same effect.
Again, this scenario is not presented as a prediction, but as a plausible development
should global warming begin to affect food production in particular, and weather
patterns in general, to a degree that presents a threat to life and property. As with oil
reserves, this scenario does not so much apply to the immediate future, but these
considerations could play a significant role in extending any near term reduction in
economic activity over the much longer time horizon implied by the Elliott long wave
analysis.
7. Conclusions
It bears repetition to state that while the above factors can potentially contribute to the
kind of future that emerges from the Elliott long wave analysis, the discussion is not a
detailed prediction of what will happen, nor does it provide an exhaustive list of
possible reasons why the substantial correction implied by that model should come to
pass.
Please observe that the events postulated here are in the domain of the real world –
they either have a significant probability of occurrence, or conceivably could even
already be beginning to affect our lives. We have avoided other possible causes of
global doom and gloom favored by some of the more extreme doomsayers and
catastrophe prophets. We began this Appendix with the question whether there exists
any reason or reasons that might cause an extended (more than just a few decades)
correction in the upward curve of civilization as predicated by the Elliott model. This
objective has been served. There is indeed a range of factors that could contribute to a
substantial period of depression and worse.
The situation is not clear-cut. Opinions on what may or may not happen will be
divided and different people will assign widely divergent probabilities to the

occurrence of these events. Further, while some of these developments, particularly
those anticipated to take effect over the near term, will almost surely take place, it is
uncertain to what degree they will disrupt normal day to day life and economic
activities.
This list of events and developments that could conceivably bring about the full extent
of the anticipated corrective wave is not exhaustive. However, should history later
show that the third millenium started off with exactly the extended corrective X-wave
anticipated by the Elliott long wave model, then one fact is clear: one or more of the
events described above will be in place shortly after the beginning of the third
millenium.
(C) 1999 By The Authors
All rights reserved
12,000 YEARS OF ELLIOTT WAVES
Appendix A: Introduction to Elliott Wave Theory.
R. N. Elliott was a businessman during the early part of the Twentieth Century. He
traveled widely throughout the Americas and during these travels he developed a
serious illness that caused him to interrupt his work and travels. During his
convalescence, he turned his attention to the stock market. In his study of the stock
market, he discovered a sequence of waves, which reoccurred in stock market trading
over time.
Elliott refined his studies and published the results first in a monograph titled The
Wave Principle in 1938. He published more on his Principle in a series of articles in
theFinancial World during 1939. He added to the body of literature on his Principle by
publishing another monograph in 1946 titled Nature's Law, plus various Interpretive
Letters between 1938 and 1947. He died in 1948.
By the time Elliott wrote Nature's Law, he had reached a point where he was
convinced the waves and Principle he had discovered was not only present in
organized financial markets, but also in all human endeavors and development. He
wrote the following: "Nature's Law has always functioned in every human activity.
Waves of different degrees occur whether or not recording machinery is present.
When the machinery described below is present, the patterns of waves are perfected
and become visible to the experienced eye."
The machinery he described was a viable stock market average. Such averages have
only been available for about 150 years. It is the authors' faith in this belief that has

been the motivating force in expanding the years covered in this Elliott Wave analysis
of history, from a few hundred to 12000 years. This fact is vital if the reader is to
understand the purpose and the importance of the conclusions drawn from this work.
Elliott empirically derived the Elliott Wave Principle. It came into being after long
study of stock market movements. He discovered form and structure in stock price
movements, which no one before him had observed. The form and structure he
uncovered is both simple and elegant in its basic manifestation. He discovered that all
stock market movements take place in eight waves or sequences. Each wave in this
sequence is a move by the index that occupies a predetermined position in terms of
direction and duration in relation to the other 7 waves of the sequence.
The eight waves consist of five waves that typically form a bull market, which is then
followed by a corrective phase (or bear market) that consists of three waves. The form
and structure of this discovery is displayed in the chart below (Figure A1).
Figure A1
You can see that the bull market phase of five waves consists of three waves up
(Waves 1,3, and 5), with two corrective waves down (waves 2 and 4). This is
followed by three waves down in the bear phase of the cycle, completing the eight-
wave sequence. He further discovered that these eight wave sequences appeared one
after another and became part of a larger wave sequence. Elliott after making this
discovery decided he needed to find a name for these waves of differing degree. He
started by naming the smallest wave he observed a subminuette wave, and continued
naming these waves in order of rising magnitude as follows:
subminuette
minuette
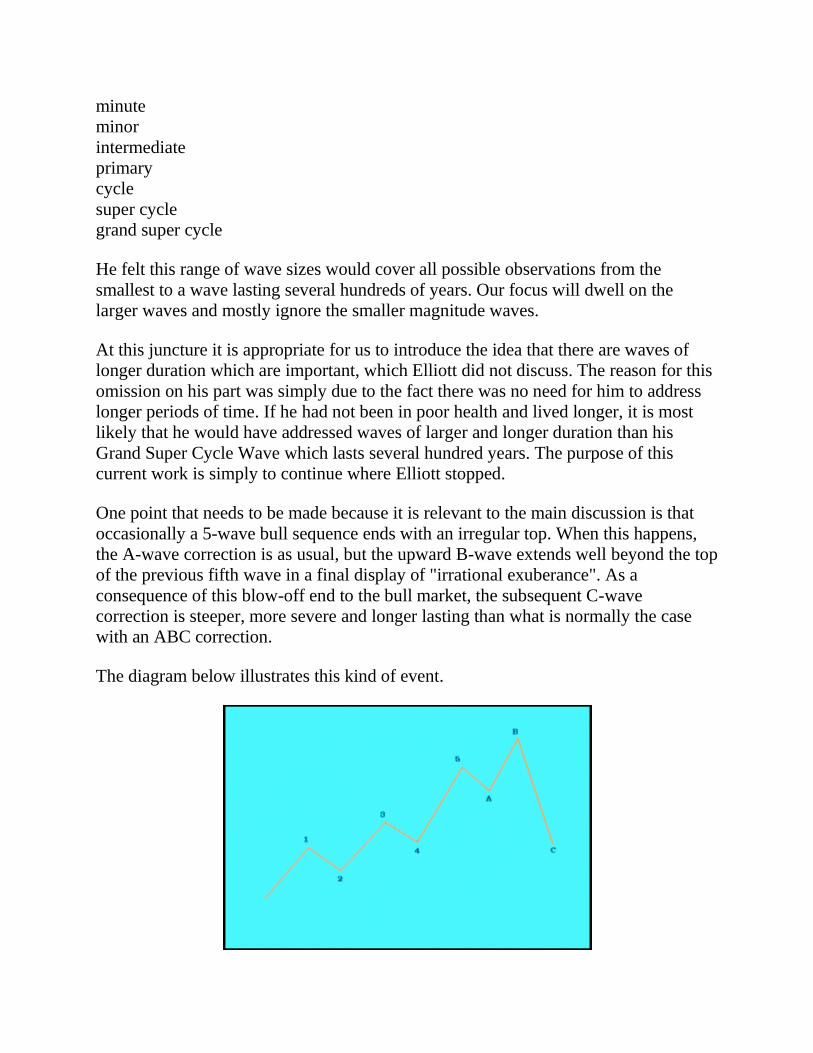
minute
minor
intermediate
primary
cycle
super cycle
grand super cycle
He felt this range of wave sizes would cover all possible observations from the
smallest to a wave lasting several hundreds of years. Our focus will dwell on the
larger waves and mostly ignore the smaller magnitude waves.
At this juncture it is appropriate for us to introduce the idea that there are waves of
longer duration which are important, which Elliott did not discuss. The reason for this
omission on his part was simply due to the fact there was no need for him to address
longer periods of time. If he had not been in poor health and lived longer, it is most
likely that he would have addressed waves of larger and longer duration than his
Grand Super Cycle Wave which lasts several hundred years. The purpose of this
current work is simply to continue where Elliott stopped.
One point that needs to be made because it is relevant to the main discussion is that
occasionally a 5-wave bull sequence ends with an irregular top. When this happens,
the A-wave correction is as usual, but the upward B-wave extends well beyond the top
of the previous fifth wave in a final display of "irrational exuberance". As a
consequence of this blow-off end to the bull market, the subsequent C-wave
correction is steeper, more severe and longer lasting than what is normally the case
with an ABC correction.
The diagram below illustrates this kind of event.

FIGURE A2
We can conclude at this juncture of our work that Elliott's Principle suggests the stock
market expands and contracts in line with a set structure (form). Bull (upward) waves
start at the end of a three-wave correction and progress upward in a five-wave
structure. This is followed by a three-wave bear (downward) corrective structure. The
empirical evidence on which the Elliott Principle is based indicates that prices do not
return to the low point of the previous 8 wave sequence, prices only approach the
previous low. This phenomenon indicates the pathway of humankind is ever upward.
A happy thought.
These eight wave sequences build up into eight wave patterns of larger degree which
can ultimately expand to include scores of years, hundreds of years, and even
thousands of years. It is the goal of this article to show how these waves fit together in
a logical structure, which has relevance to historical facts. We will endeavor to
determine where we have been and where we are now in this sequence of large waves,
and then draw some conclusions about what this may portend for future human
history and stock market movements.
More detailed information can be obtained on the Elliott Wave Principle in the
following sources:
Books
Prechter, Robert R. Jr. The Major Works of R.N. Elliott. New Classics Library
Frost and Prechter. Elliott Wave Principle. New Classics Library
Other books can be found by searching at amazon.com or other bookstore websites.
Internet Resources
http://home.netvigator.com/~pcwonghk/ew
http://www.ozsurf.net.au/elliott/correc
http://www.gamesdomain.com/directd/pc/windows/edutainment/ewt2_2.html
http://www.elliottwave.com/basics1.htm
Other web resources can be obtained by searching on the web.
(C) 1999 By The Authors
All rights reserved