07 calibration
TRANSCRIPT
7/28/2019 07 Calibration
http://slidepdf.com/reader/full/07-calibration 1/10

7/28/2019 07 Calibration
http://slidepdf.com/reader/full/07-calibration 2/10
l i n e a
r r a n g e
analyte amount
r e s p o n s e
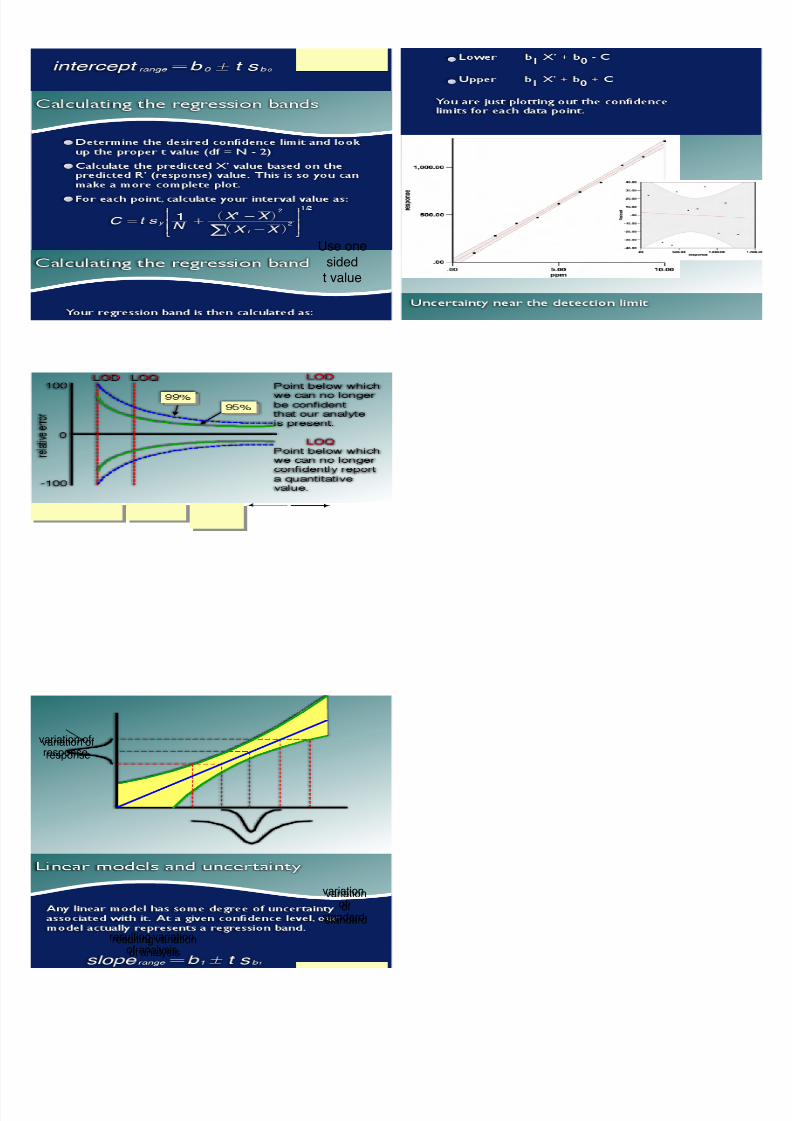
LOD
LOQLOL
LODlimit of detection
LOQlimit of quantitation
LOLlimit of linearity
LODlimit of detection
LOQlimit of quantitation
LOLlimit of linearity
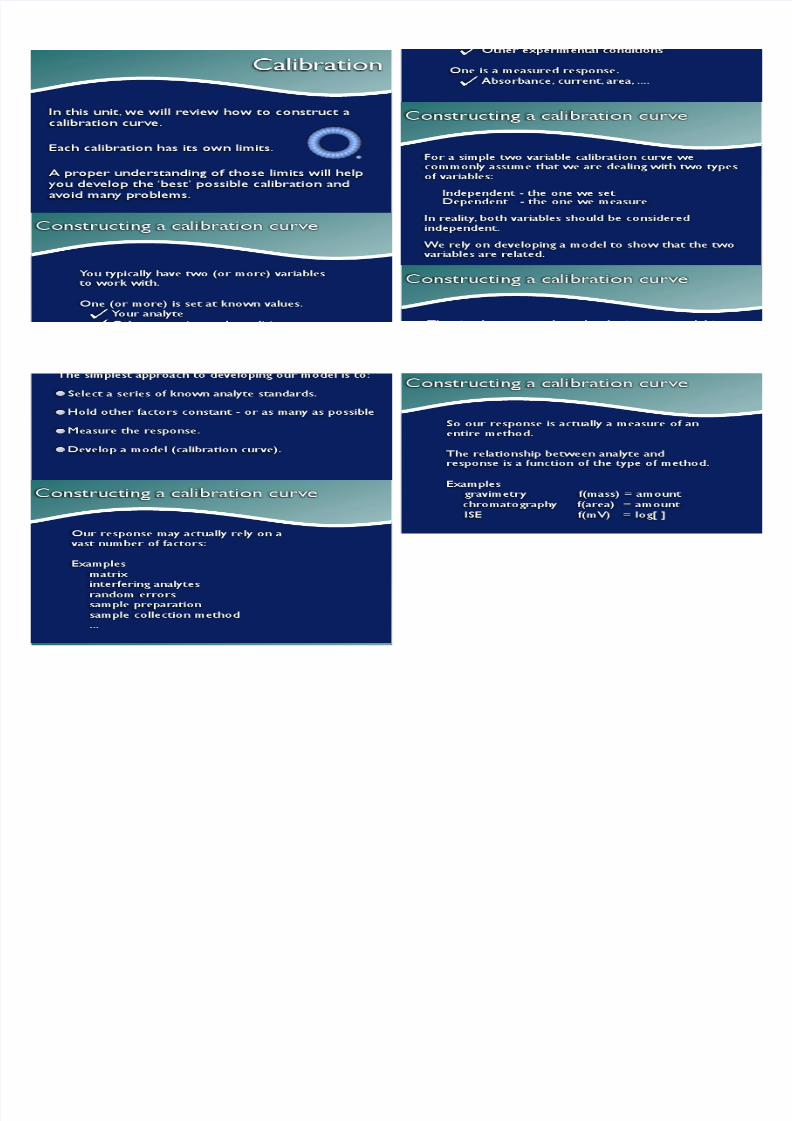
Most methods have a fixed rangewhere the relationship betweenresponse and analyte amount is valid.
R =b 1X +b 0+e
R =response
b 1 =slopeparameter
X =Standard value
b 0 =intercept parameter
e =residualerror
s b 0
2=
N X i -X ^ h2
!s Y
2
X 2
!
s b 12=
X i -X ^ h2
!
s Y 2
s e 2=
N -2^ h
Y i -Y ^ h2
! -b 12
X i -X ^ h2
!
7/28/2019 07 Calibration
http://slidepdf.com/reader/full/07-calibration 3/10
Use one
sided
t value
variation of
response
variation of
response
resulting variationof analysis
resulting variation
of analysis
variation
of
standard
variation
of
standard

7/28/2019 07 Calibration
http://slidepdf.com/reader/full/07-calibration 4/10
-2000
0
2000
4000
6000
8000
10000
12000
0 20 40 60 80 100 120

7/28/2019 07 Calibration
http://slidepdf.com/reader/full/07-calibration 5/10
0
200
400
600
800
1000
1200
1400
1600
1800
2000
0 2 4 6 8 10 12 14 16 18 20
Concentration
N o i s e
+ / - 2 0 0 0
0
20
40
60
80
100
120
140
160
180
0 0.2 0.4 0.6 0.8 1 1.2 1.4 1.6 1.8
Concentration
N o i s e
+ / - 1 0 0
This residu
plot indicat
a reasonab
fit of the da
to the mode
This residua
plot indicate
a reasonab
fit of the dat
to the mode

7/28/2019 07 Calibration
http://slidepdf.com/reader/full/07-calibration 6/10
-2000
0
2000
4000
6000
8000
10000
12000
0 20 40 60 80 100 120
N o i s e
+ / - 2 0 0 0
Concentration
Regression of Noise +/- 2000 by Concentration(R !=0.965)
-2000
0
2000
4000
6000
8000
10000
12000
0 20 40 60 80 100 120
N o i s e
+ / - 1 0 0
Concentration
Regression of Noise +/- 100 by Concentration(R !=1.000)

7/28/2019 07 Calibration
http://slidepdf.com/reader/full/07-calibration 7/10
Regression of MPG by Weight, tons
5
10
15
20
25
30
35
40
1.5 2 2.5 3 3.5 4 4.5
Weight, tons
M
P G

7/28/2019 07 Calibration
http://slidepdf.com/reader/full/07-calibration 8/10
It’s clear that there
are two different
types of samples s
simple calibration
model won’t work
This was a candida
for ANCOVA,
7/28/2019 07 Calibration
http://slidepdf.com/reader/full/07-calibration 9/10
Octane # / Standardized residuals
-2
-1.5
-1
-0.5
0
0.5
1
1.5
2
83 85 87 89 91 93
Octane #
S t a n d a r d i z e d
r e s i d u a l s
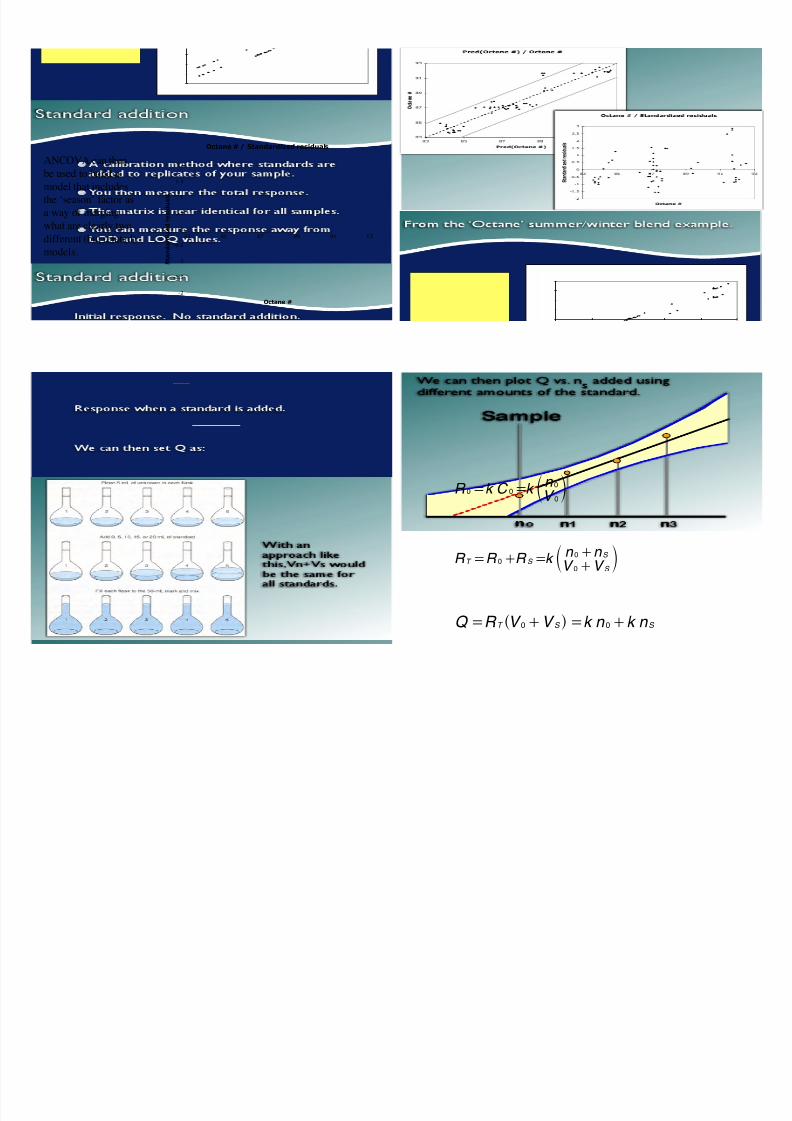
ANCOVA can then
be used to build a
model that includes
the ‘season’ factor asa way of merging
what are clearly two
different (but related)
models.
R 0=k C 0=k V 0
n 0c m
R T =R 0+R S =k V 0+V S
n 0+n S c m
Q =R T V 0+V S ^ h =k n 0+k n S
7/28/2019 07 Calibration
http://slidepdf.com/reader/full/07-calibration 10/10