07 may 2005naic dc chapter1 evaluating company management presented by: ty hughes naic dc chapter
TRANSCRIPT
07 May 2005 NAIC DC Chapter 1
Evaluating Company Management
Presented by:Ty HughesNAIC DC Chapter

07 May 2005 NAIC DC Chapter 2
What is NAIC?
National Association of Investors Corporation NAIC teaches individuals how to become
successful strategic long-term investors NAIC investors use fundamental analysis to
study common stocks Websites:
www.better-investing.org www.naicdc.org
07 May 2005 NAIC DC Chapter 3
NAIC Principles
Invest a fixed amount regularly for the long term
Reinvest all of your earnings Invest only in good quality growth companies Diversify (by company size and by industries)
07 May 2005 NAIC DC Chapter 4
Measuring Managerial Ability
Objective tests of managerial ability are few and rather unscientific. … The most convincing proof of capable management lies in a superior comparative record over a period of time….
– Graham and Dodd
07 May 2005 NAIC DC Chapter 5
What To Look For in Management A management that has been tested by
competition in both good and bad times A management whose sales and profits are
expanding at a geometric rate A management that will have stronger and
bigger businesses in five years Beware of management that is riding an
industry wave or product cycle – George Nicholson
07 May 2005 NAIC DC Chapter 6
Management Report Card
SSG serves as a tool to review skills and quality of company management
How is the management performing? Section 2 of the SSG offers important
insights: Pretax profits margins Return on equity Percent debt to equity (Toolkit and Stock Analyst)
07 May 2005 NAIC DC Chapter 7
Evaluating Management with the SSG Consistent and increasing growth in revenues
Section 1 of the SSG (Visual Analysis) Consistent and increasing growth in earnings
Section 1 of the SSG (Visual Analysis) Consistent or increasing pre-tax profit margin
Section 2a of the SSG Consistent or increasing return on equity
Section 2b of the SSG
07 May 2005 NAIC DC Chapter 8
Pre-Tax Profits
Line 2a of the SSG Pre-Tax Profits =
Revenues - Expenses Revenues - Cost of goods Sold - Overhead
Are they stable, rising or falling? How do they compare to competitors or
industry average? What is the future PTP trend likely to be?
07 May 2005 NAIC DC Chapter 9
Factors that Reduce Profits
Increasing expenses: Rising raw material costs Rising labor costs Rising marketing expenses
Lower demand for products or services Pricing pressure from competitors Products going off patent
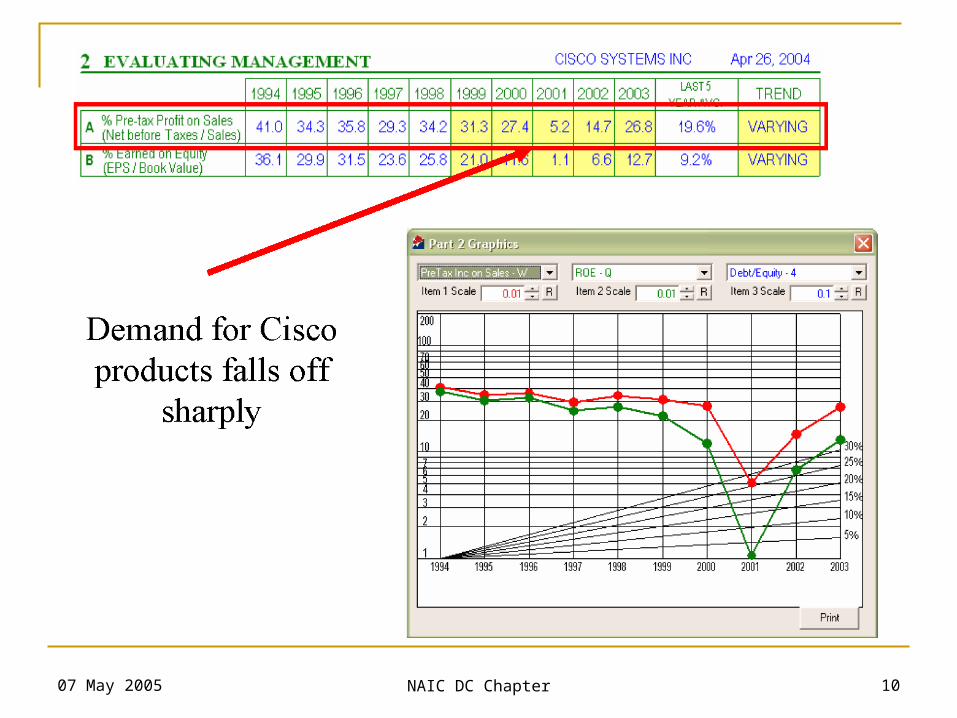
07 May 2005 NAIC DC Chapter 10
07 May 2005 NAIC DC Chapter 11
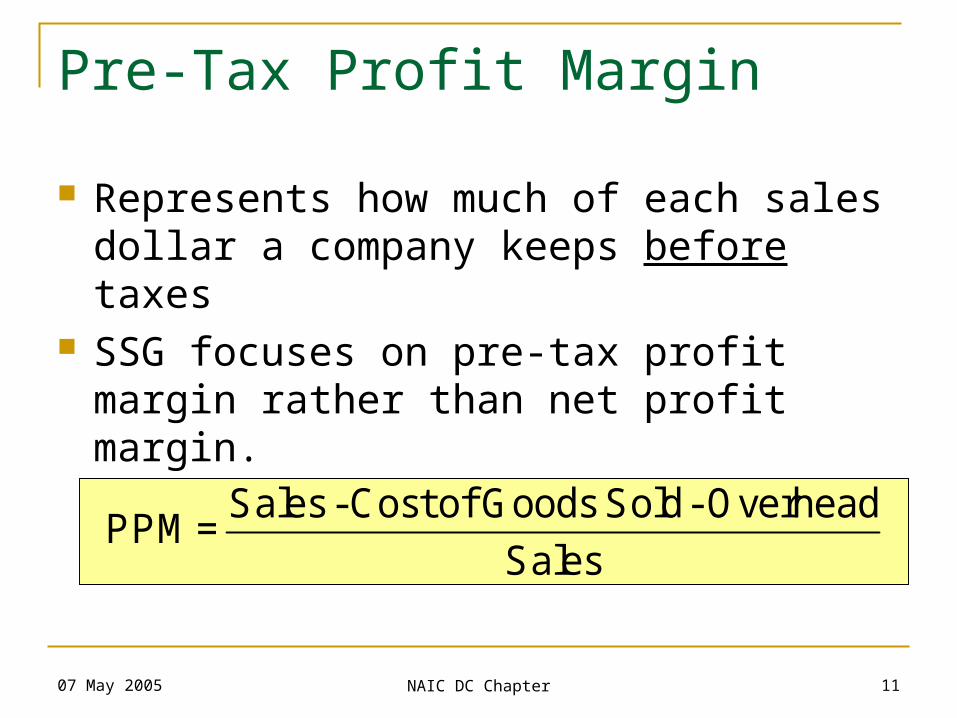
Pre-Tax Profit Margin
Represents how much of each sales dollar a company keeps before taxes
SSG focuses on pre-tax profit margin rather than net profit margin. Tax rates change from time to time
Sales -Cost of Goods Sold- OverheadPPM =
Sales
07 May 2005 NAIC DC Chapter 12
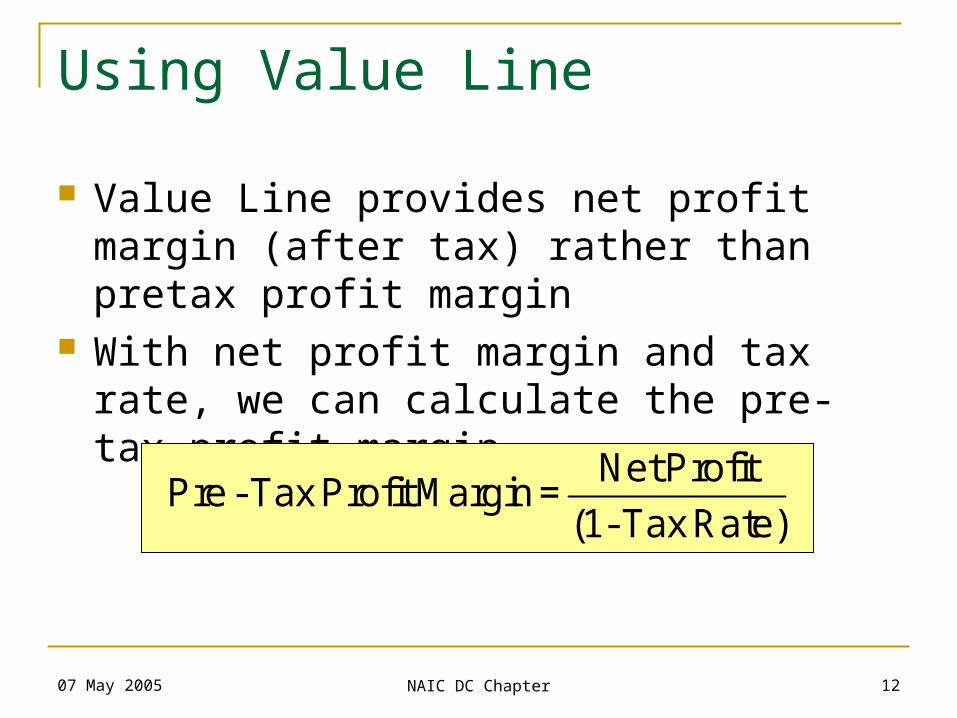
Using Value Line
Value Line provides net profit margin (after tax) rather than pretax profit margin
With net profit margin and tax rate, we can calculate the pre-tax profit margin
Net ProfitPre - Tax Profit Margin =
(1- Tax Rate)
07 May 2005 NAIC DC Chapter 13
Looking for Consistency
Look for a steady upward trend that is above average for the industry
Be skeptical of above average profit margins that make a big jump
Consistent numbers year after year might mean either peak efficiency or stagnation
Look for correlation with consistent and increasing revenues and earnings

07 May 2005 NAIC DC Chapter 14
Examples
#1 – Lowe’s Companies:
#2 – Orthodontic Centers of America:
07 May 2005 NAIC DC Chapter 15
Examples
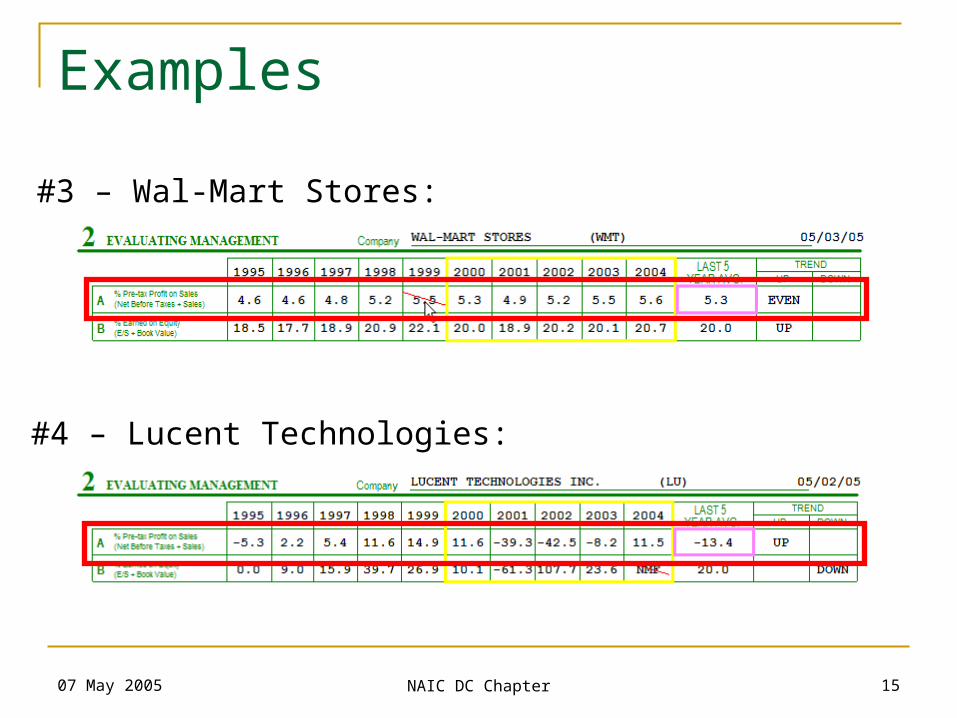
#3 – Wal-Mart Stores:
#4 – Lucent Technologies:
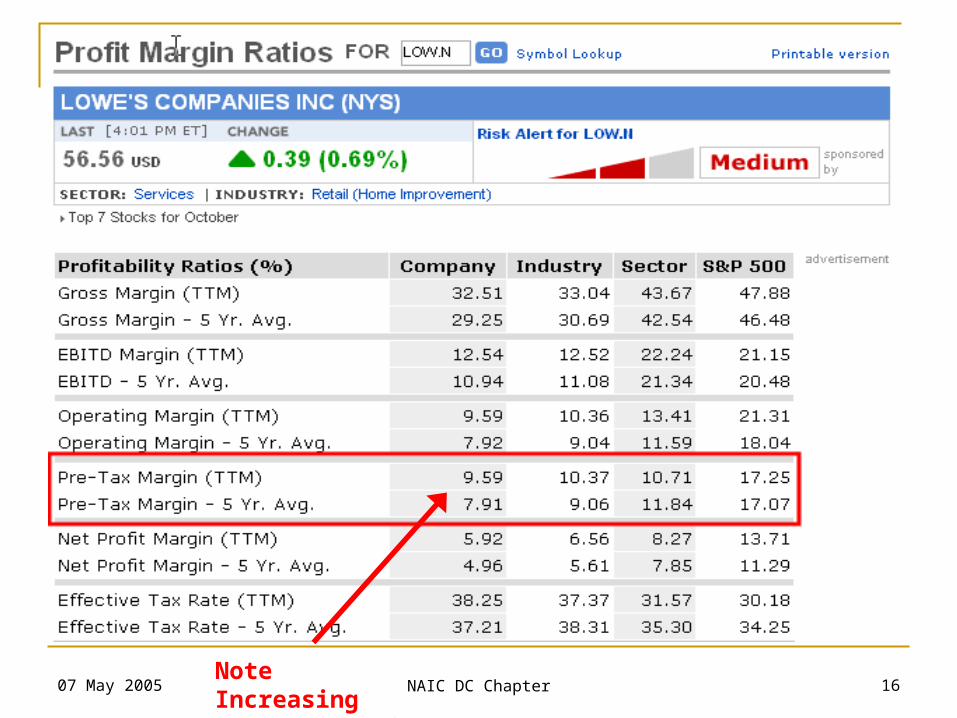
07 May 2005 NAIC DC Chapter 16Note Increasing Pre-Tax Margin
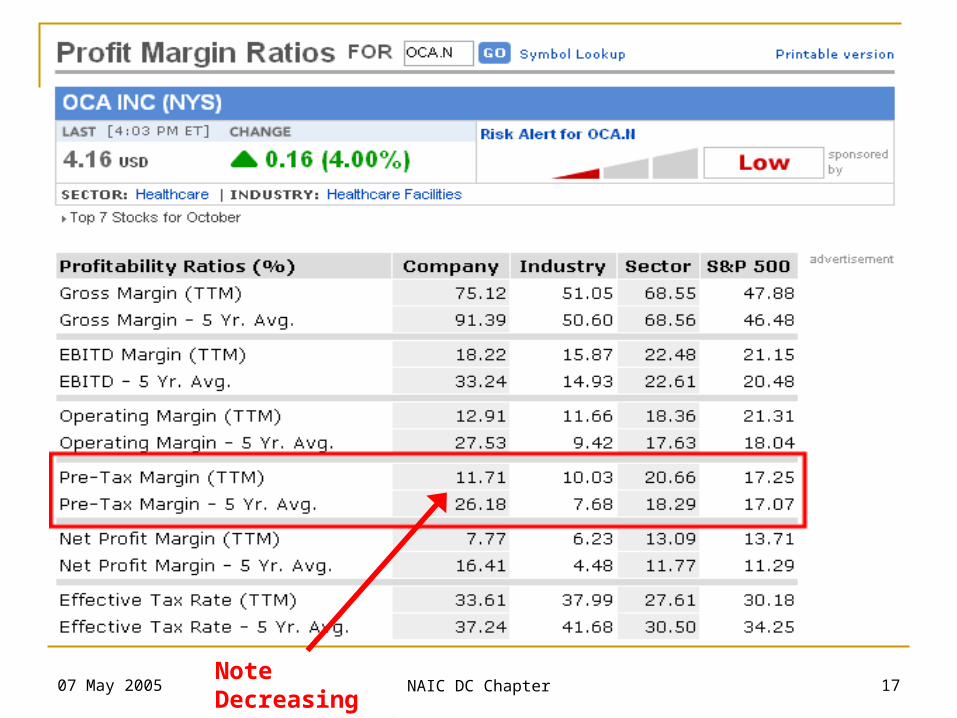
07 May 2005 NAIC DC Chapter 17Note Decreasing Pre-Tax Margin
07 May 2005 NAIC DC Chapter 18
A few More Examples
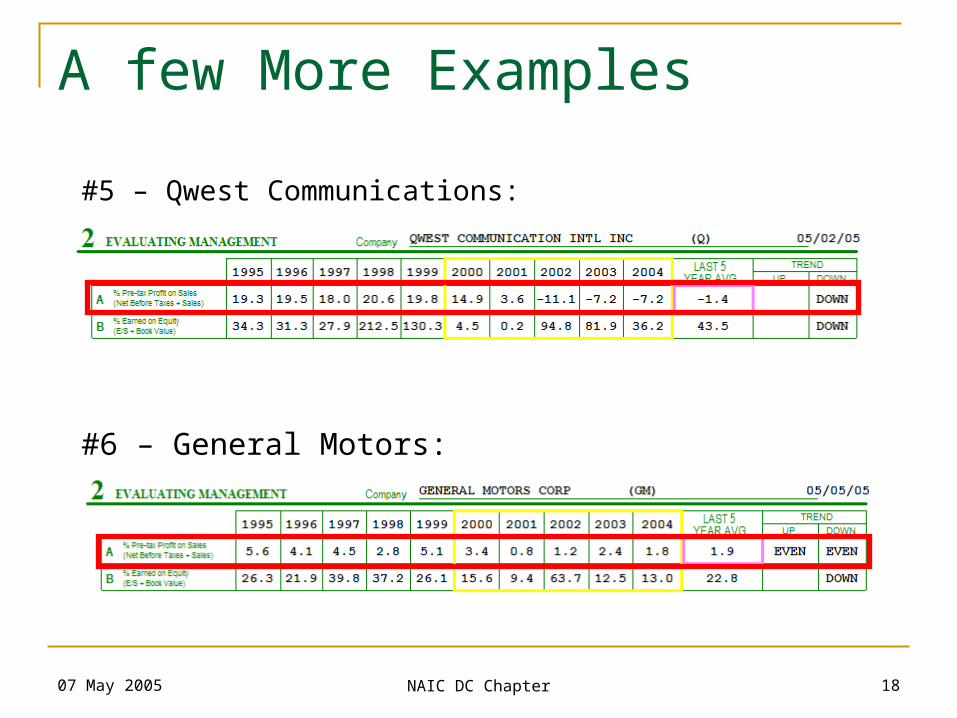
#5 – Qwest Communications:
#6 – General Motors:
07 May 2005 NAIC DC Chapter 19
What Profit Margins Tell Us
Efficiency of management in earning money for each dollar of sales
Comparing profit margins within an industry helps find the best company
Reduced profit margins may suggest additional competition or increased costs
Declining profit margins can provide an early warning indicator of declining earnings

07 May 2005 NAIC DC Chapter 20
Understanding Profit Margins Pre-tax profit margins varies with industry
Grocery – 3.5% Retail Specialty – 9% Insurance (Property & Casualty) – 14% S&P 500 – 17% Major Drugs – 24% Software & Programming – 27%
Always compare a company’s profit margins with its industry peers and competitors
07 May 2005 NAIC DC Chapter 21
What ROE Means
A measure of how well a company has used reinvested earnings to generate additional earnings
ROE is the key financial factor in defining the growth potential of the company from internal sources
07 May 2005 NAIC DC Chapter 22
Return on Equity
Line 2b of the SSG Measures management’s skill in profitability,
asset management, and financial leverage Profitability is major driver, so usually tracks PTP
Is ROE stable, rising or falling? How does company compare to competitors,
industry average or market in general? Average ROE for S&P 500 is around 15% Generally, anything above 10% is good

07 May 2005 NAIC DC Chapter 23
Calculating ROE
Two ways of calculating ROE: EPS ÷ Book Value Net Income ÷ Equity
Two variations of equity/book value Use end of year book value Use start of year book value
NAIC Stock Analyst & Investor’s Toolkit support both options
07 May 2005 NAIC DC Chapter 24
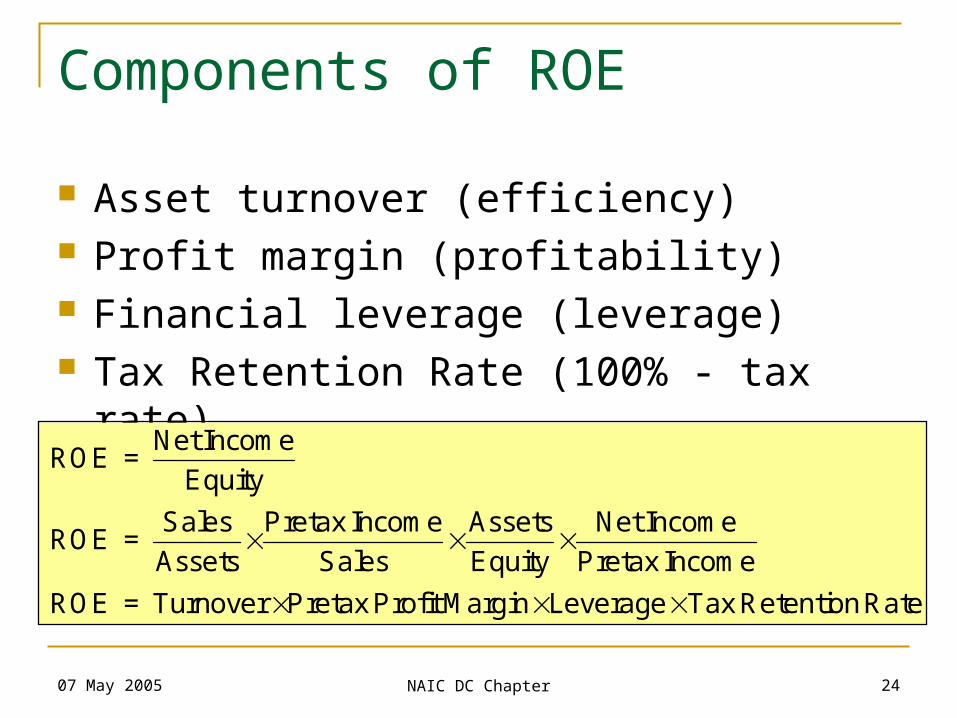
Components of ROE
Asset turnover (efficiency) Profit margin (profitability) Financial leverage (leverage) Tax Retention Rate (100% - tax rate)
Net IncomeROE =
Equity
Sales Pretax Income Assets Net IncomeROE =
Assets Sales Equity Pretax Income
ROE = Turnover Pretax Profit Margin Leverage Tax Retention Rate
07 May 2005 NAIC DC Chapter 25
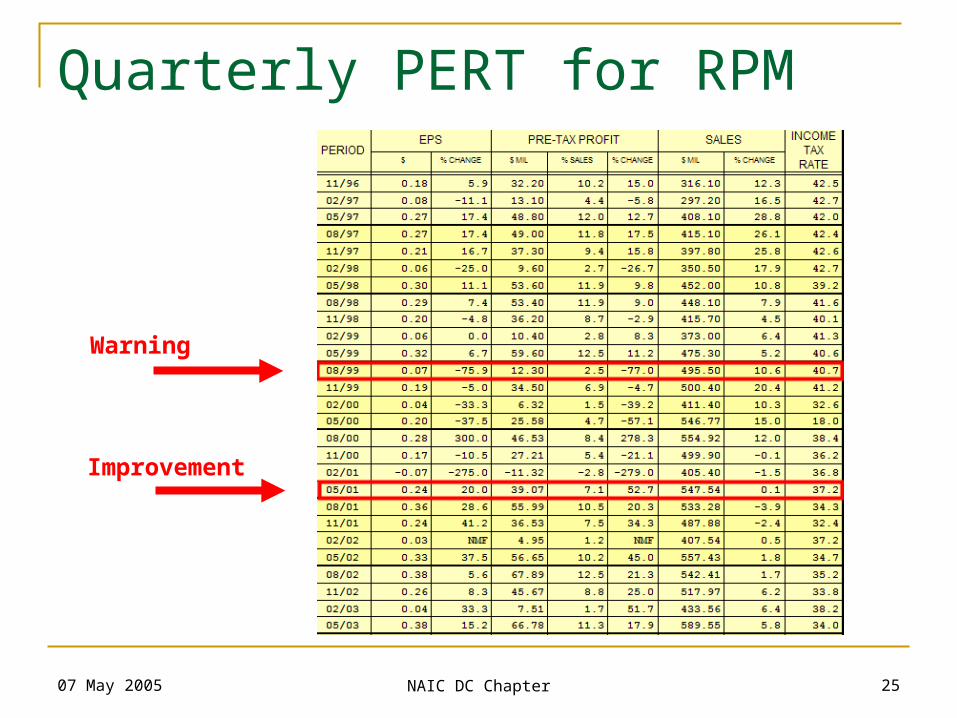
Quarterly PERT for RPM
Warning
Improvement
07 May 2005 NAIC DC Chapter 26
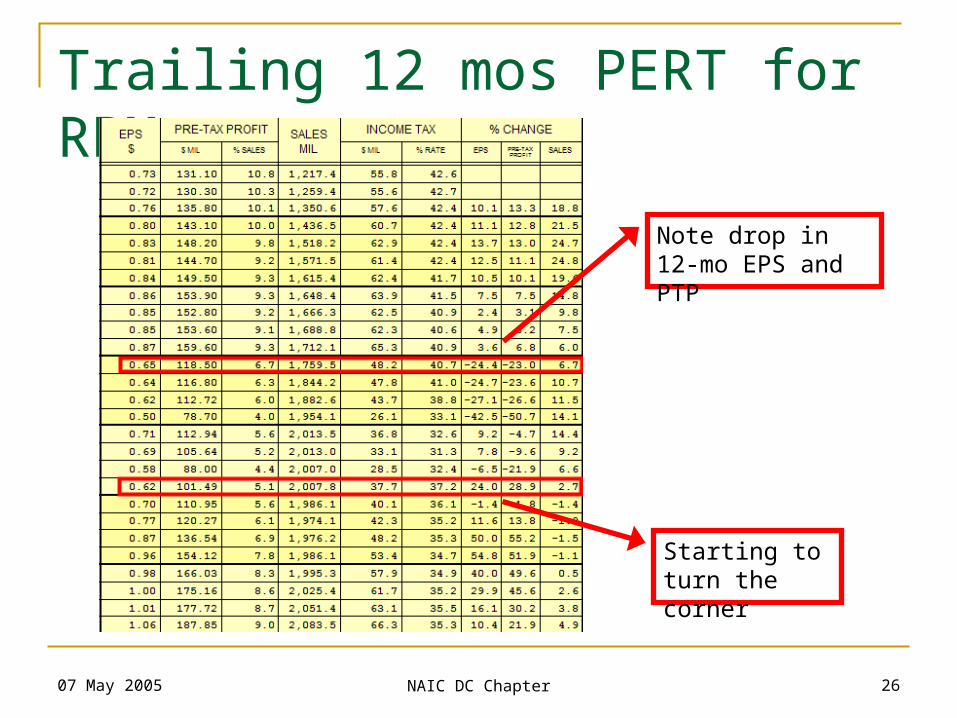
Trailing 12 mos PERT for RPM
Note drop in 12-mo EPS and PTP
Starting to turn the corner
07 May 2005 NAIC DC Chapter 27
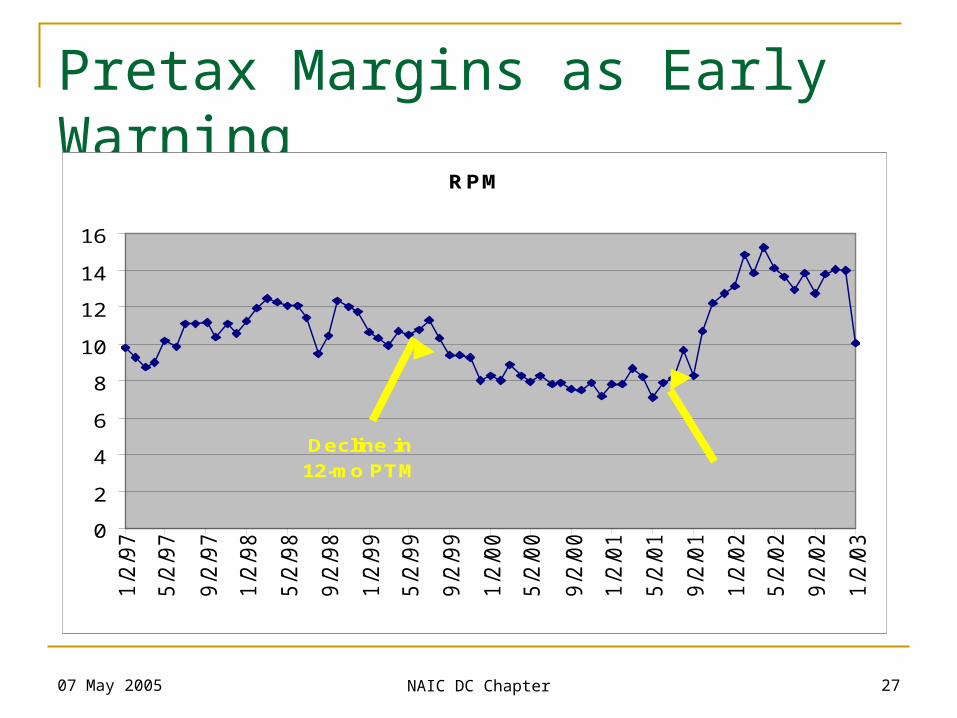
Pretax Margins as Early Warning
RPM
0
2
4
6
8
10
12
14
16
1/2
/97
5/2
/97
9/2
/97
1/2
/98
5/2
/98
9/2
/98
1/2
/99
5/2
/99
9/2
/99
1/2
/00
5/2
/00
9/2
/00
1/2
/01
5/2
/01
9/2
/01
1/2
/02
5/2
/02
9/2
/02
1/2
/03
Decline in
12-mo PTMTTM PTM and Net
Profit Increase

07 May 2005 NAIC DC Chapter 28
Changes in Net Profit and PTM
Lucent (LU)
0
10
20
30
40
50
60
4/4/
96
8/4/
96
12/4
/96
4/4/
97
8/4/
97
12/4
/97
4/4/
98
8/4/
98
12/4
/98
4/4/
99
8/4/
99
12/4
/99
4/4/
00
8/4/
00
12/4
/00
4/4/
01
8/4/
01
12/4
/01
4/4/
02
8/4/
02
Net Profit declines 47%
PTM falls from 14% to 2%
07 May 2005 NAIC DC Chapter 29
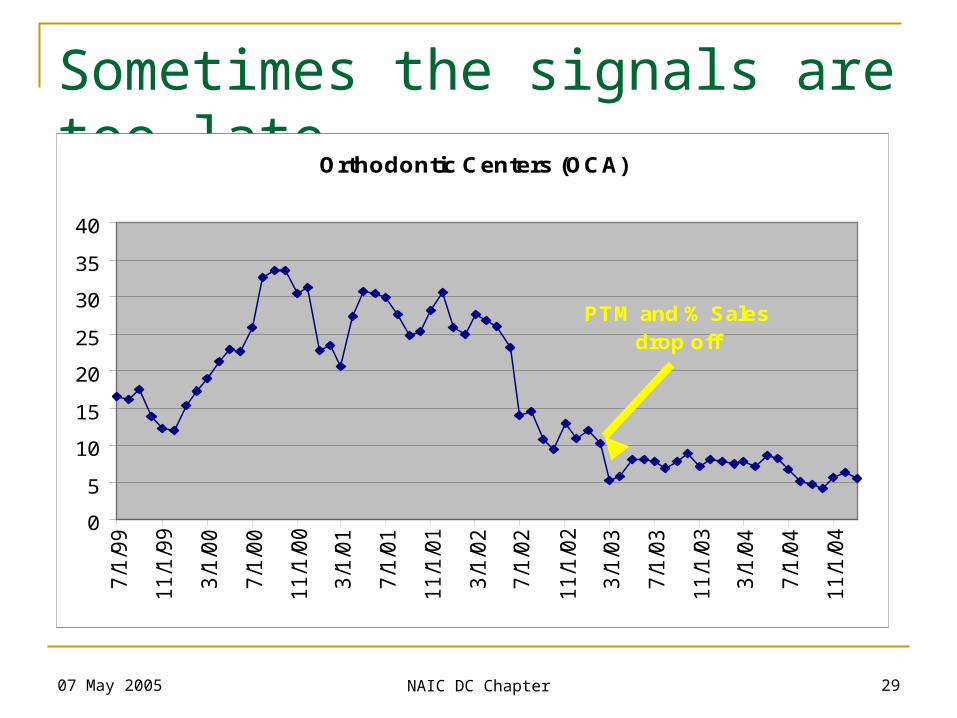
Sometimes the signals are too late
Orthodontic Centers (OCA)
0
5
10
15
20
25
30
35
40
7/1
/99
11/1
/99
3/1
/00
7/1
/00
11/1
/00
3/1
/01
7/1
/01
11/1
/01
3/1
/02
7/1
/02
11/1
/02
3/1
/03
7/1
/03
11/1
/03
3/1
/04
7/1
/04
11/1
/04
PTM and % Sales
drop off
07 May 2005 NAIC DC Chapter 30
ROE and Potential Internal Growth Average rate of return earned on earnings
reinvested in the business Theoretical limit on growth without financing Also called the “Implied” or “Sustainable
Growth Rate” of a company ROE can be used to determine potential
earnings growth of company without borrowing Return on Equity x Earnings Retention Rate Generally, use 5-year average for ROE
07 May 2005 NAIC DC Chapter 31
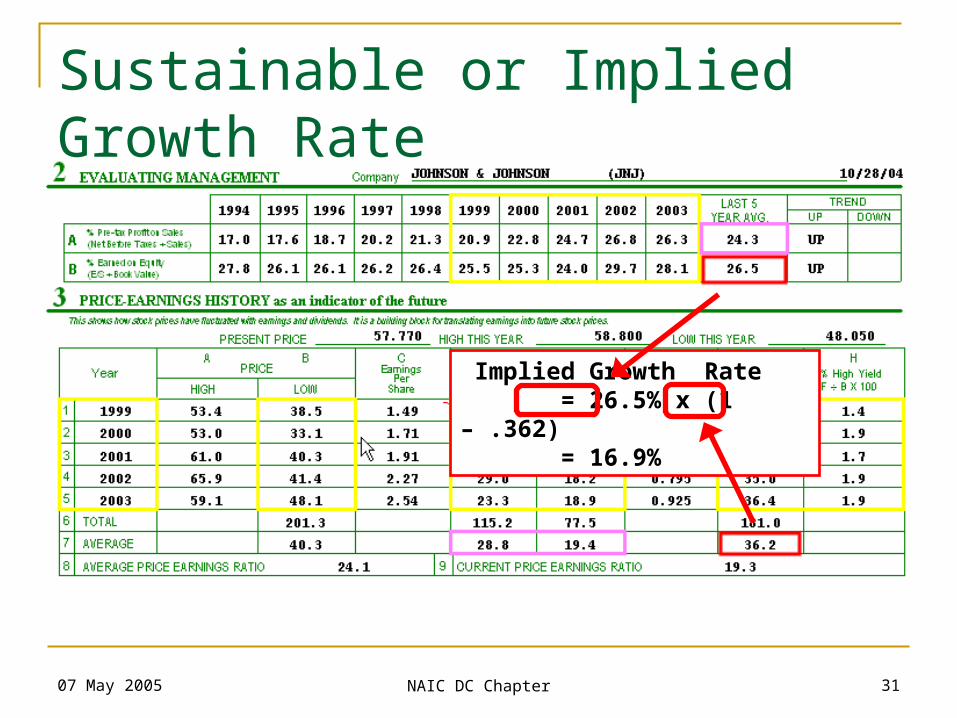
Sustainable or Implied Growth Rate
Implied Growth Rate = 26.5% x (1 – .362) = 16.9%
07 May 2005 NAIC DC Chapter 32
How to Assess ROE
Return on Equity is a measure of management’s efficiency in earning profits on shareholder investment and reinvestment
Higher is better, all other things equal An upward trend over time is positive Stability at 15% or higher is acceptable Recent downtrends of two or more years are
a serious “red flag”
07 May 2005 NAIC DC Chapter 33
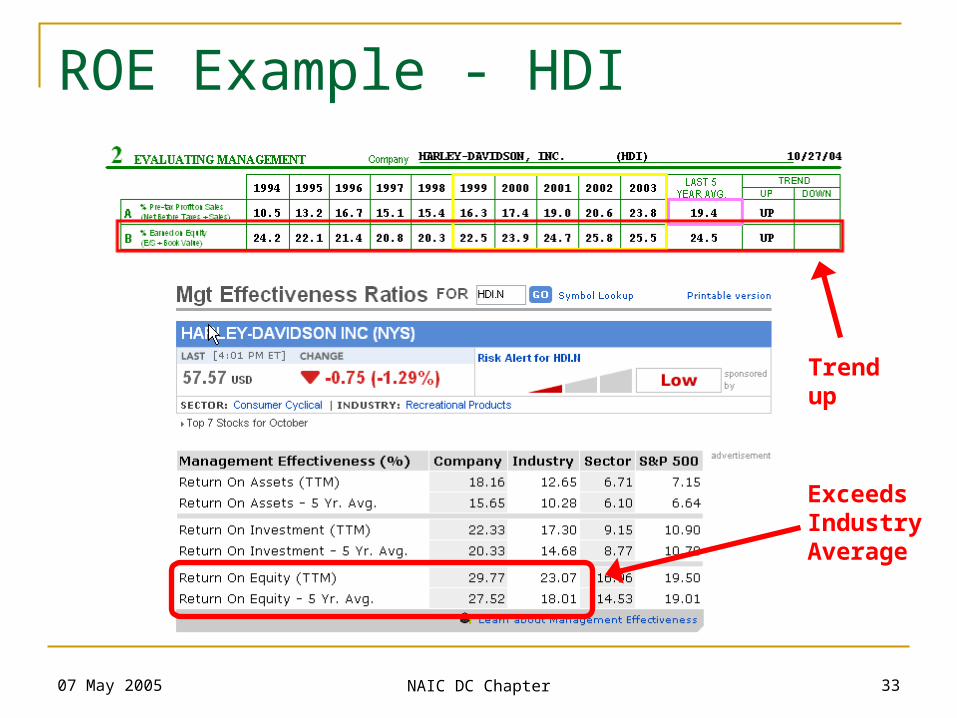
ROE Example - HDI
Exceeds IndustryAverage
Trendup
07 May 2005 NAIC DC Chapter 34
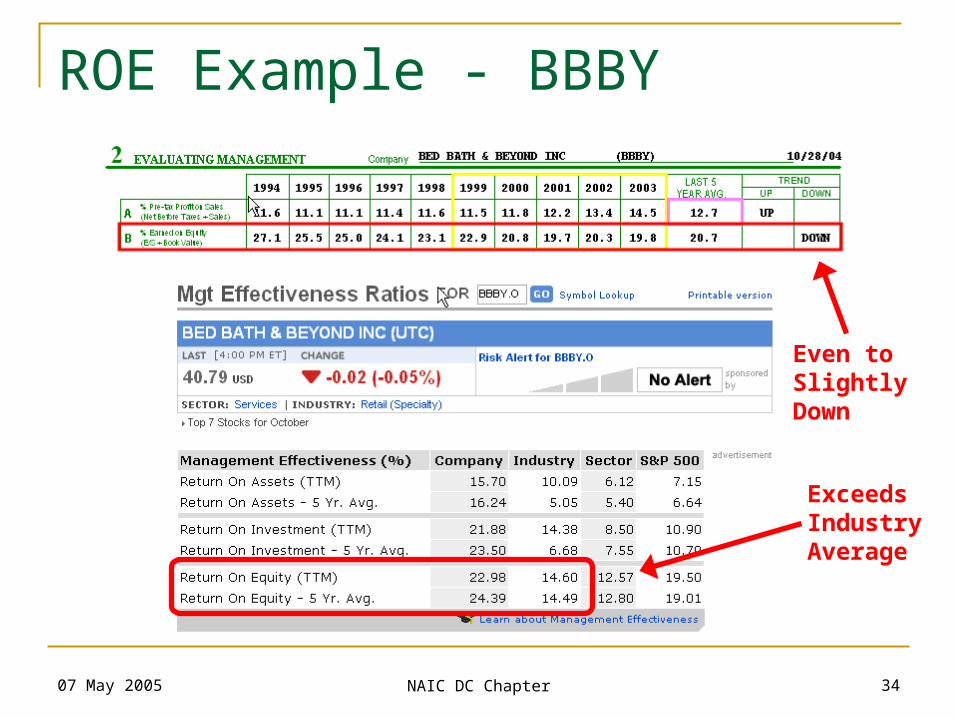
ROE Example - BBBY
Exceeds IndustryAverage
Even toSlightly Down
07 May 2005 NAIC DC Chapter 35
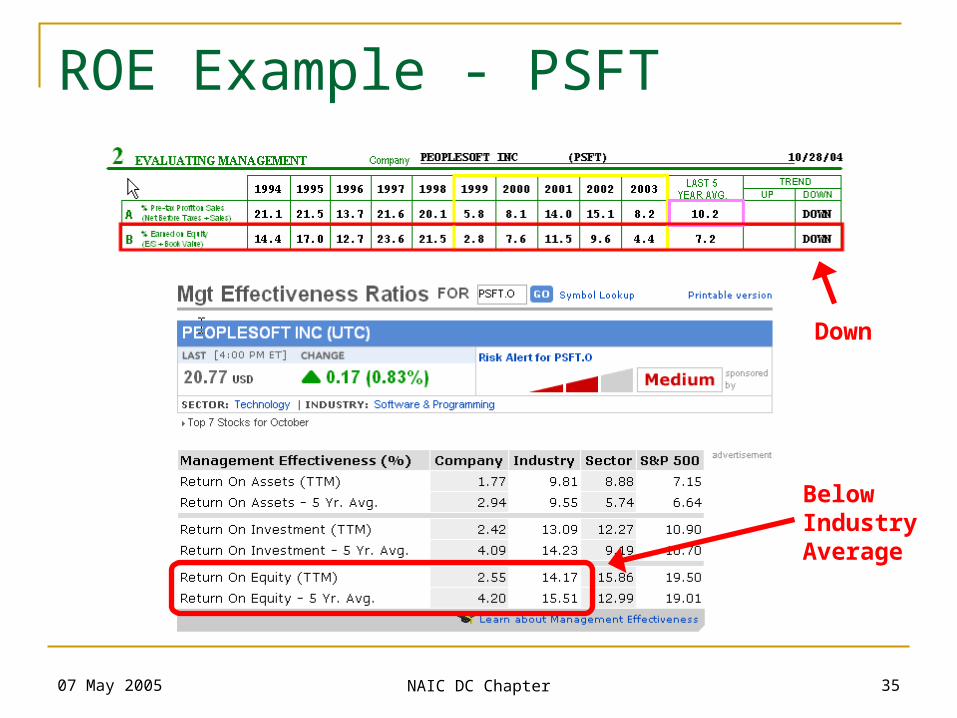
ROE Example - PSFT
BelowIndustryAverage
Down
07 May 2005 NAIC DC Chapter 36
Review
Use Section 1 to assess revenue and earnings growth for consistency and growth
Use Section 2 to assess pretax profit margins and ROE (consistent or growing)
Look at with industry peers Cross check quality
Value Line Financial Strength (B+ or better) and Earnings predictability (85 or better)
S&P “Investability Quotient” Rating (85 or better)
07 May 2005 NAIC DC Chapter 37
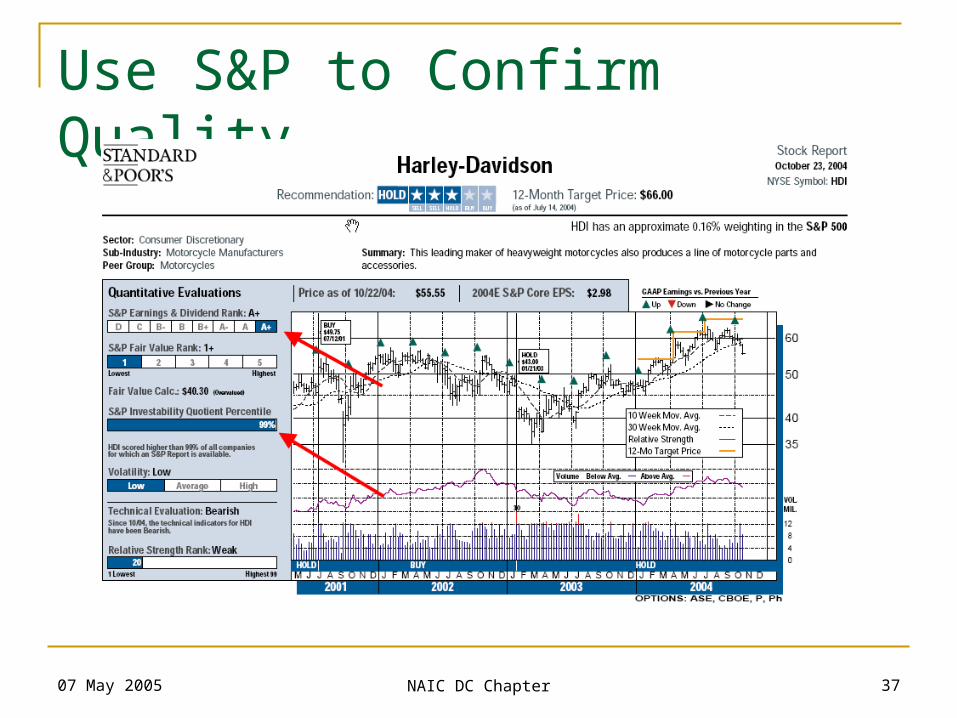
Use S&P to Confirm Quality
07 May 2005 NAIC DC Chapter 38
Value Line Quality Indicators
Earnings Predictability—a measure of the reliability of an earnings forecast. The most reliable forecasts tend to be those with the highest rating (100); the least reliable (5).
Financial Strength Rating—a relative measure of financial strength of the companies reviewed by Value Line. The relative ratings range from A++ (strongest) down to C (weakest), in nine steps.
07 May 2005 NAIC DC Chapter 39
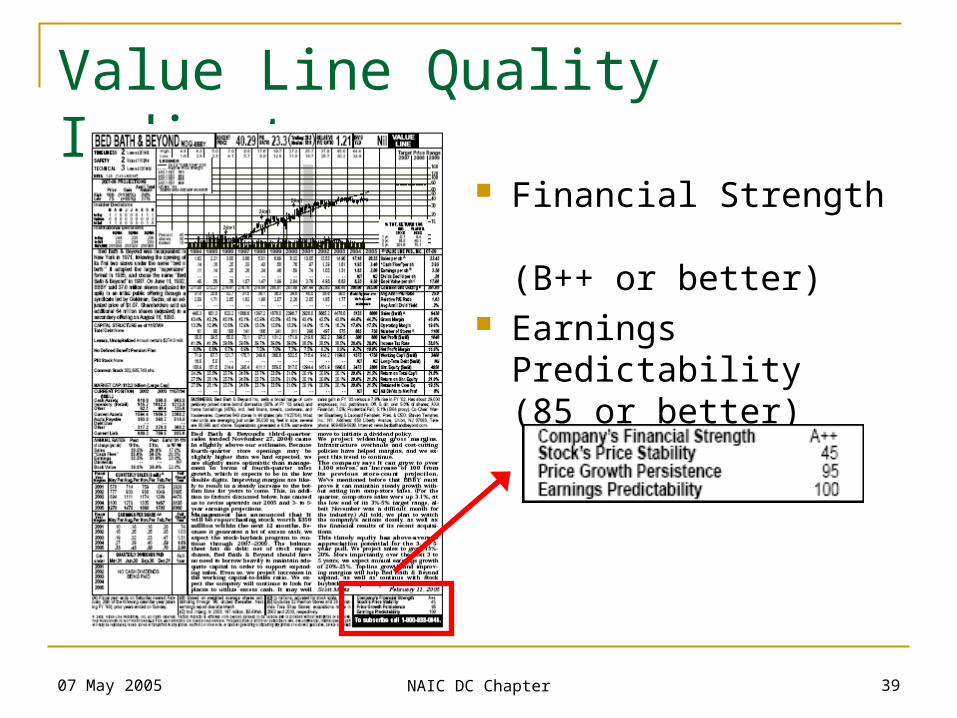
Value Line Quality Indicators
Financial Strength (B++ or better)
Earnings Predictability(85 or better)
07 May 2005 NAIC DC Chapter 40
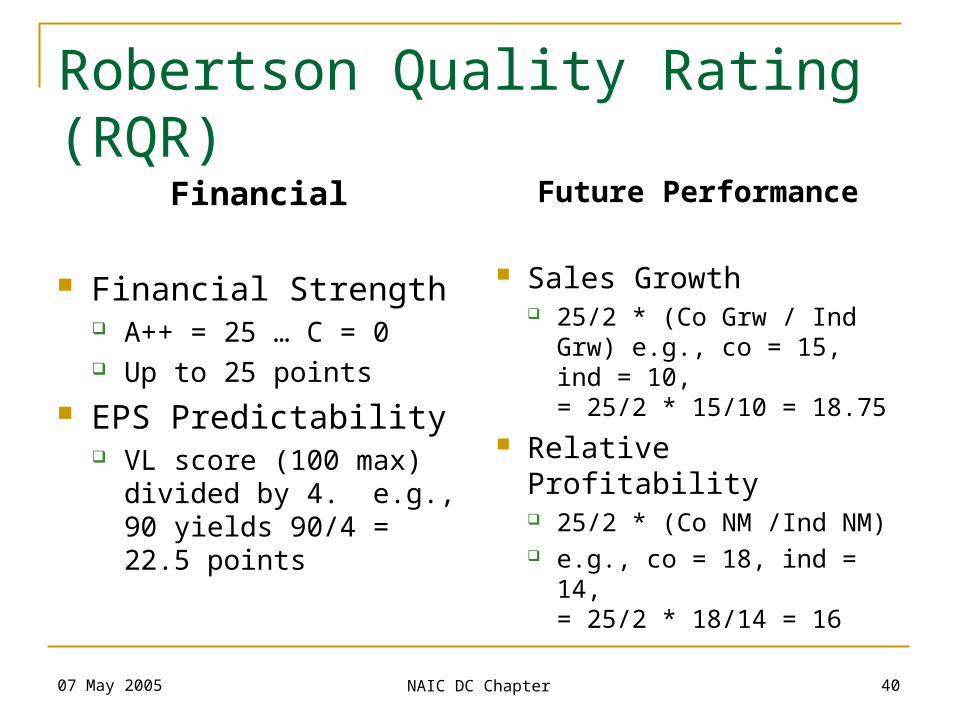
Robertson Quality Rating (RQR)
Financial
Financial Strength A++ = 25 … C = 0 Up to 25 points
EPS Predictability VL score (100 max)
divided by 4. e.g., 90 yields 90/4 = 22.5 points
Future Performance
Sales Growth 25/2 * (Co Grw / Ind Grw)
e.g., co = 15, ind = 10, = 25/2 * 15/10 = 18.75
Relative Profitability 25/2 * (Co NM /Ind NM) e.g., co = 18, ind = 14,
= 25/2 * 18/14 = 16

07 May 2005 NAIC DC Chapter 41
RQR for BBBY
Financial Financial Strength
A++ = 25 EPS Predictability
100 = 25
25+25+20.6+22.2 = 92.8
Future Performance Sales Growth
Retail (special lines) (17 / 10.3)* (25/2) 20.6
Relative Profitability (11 / 6.2)* (25/2) 22.2
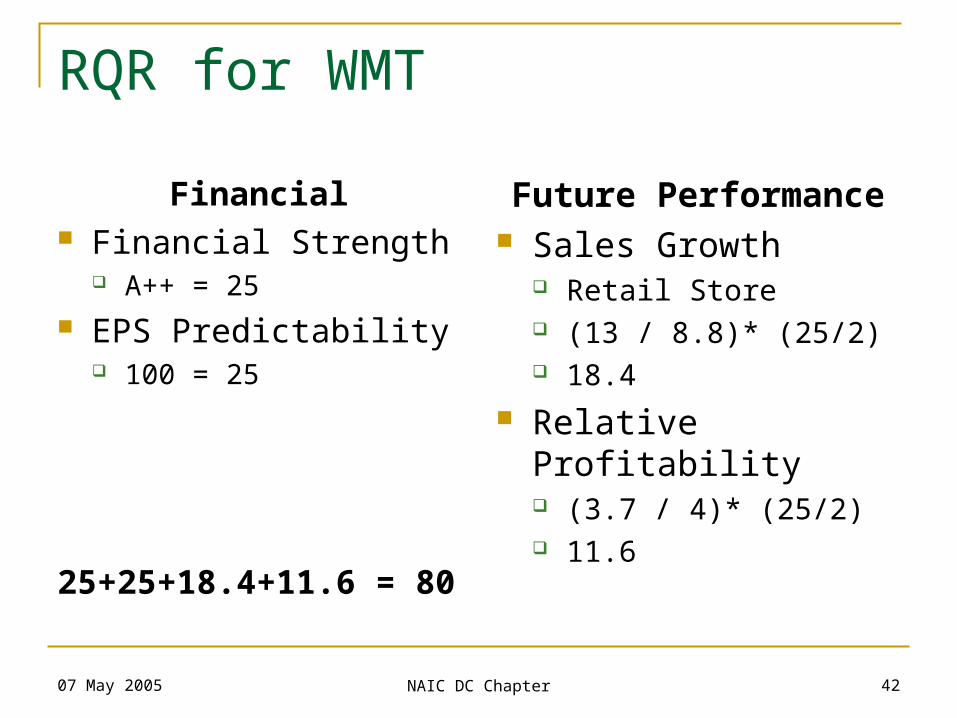
07 May 2005 NAIC DC Chapter 42
RQR for WMT
Financial Financial Strength
A++ = 25 EPS Predictability
100 = 25
25+25+18.4+11.6 = 80
Future Performance Sales Growth
Retail Store (13 / 8.8)* (25/2) 18.4
Relative Profitability (3.7 / 4)* (25/2) 11.6
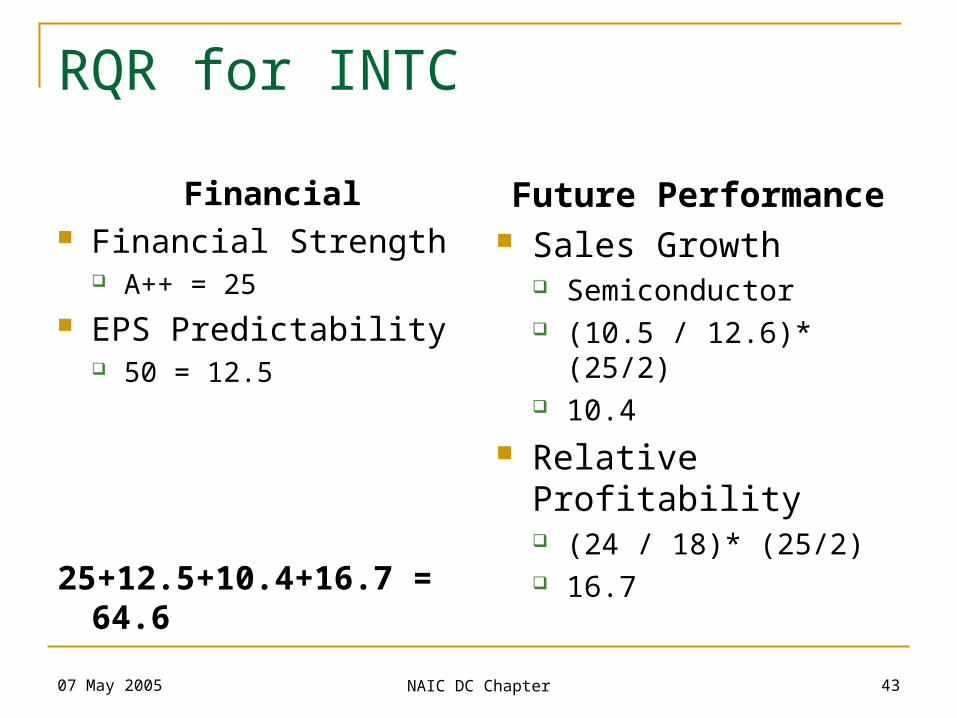
07 May 2005 NAIC DC Chapter 43
RQR for INTC
Financial Financial Strength
A++ = 25 EPS Predictability
50 = 12.5
25+12.5+10.4+16.7 = 64.6
Future Performance Sales Growth
Semiconductor (10.5 / 12.6)* (25/2) 10.4
Relative Profitability (24 / 18)* (25/2) 16.7

07 May 2005 NAIC DC Chapter 44
RQR for GM
Financial Financial Strength
B = .25 * 30 = 7.5 EPS Predictability
35 = .25 * 35 = 12.5
7.5+12.5+5.1+5.1 = 30.2
Future Performance Sales Growth
Semiconductor (1.5 / 3.7)* (25/2) 5.1
Relative Profitability (2.0 / 4.9)* (25/2) 5.1
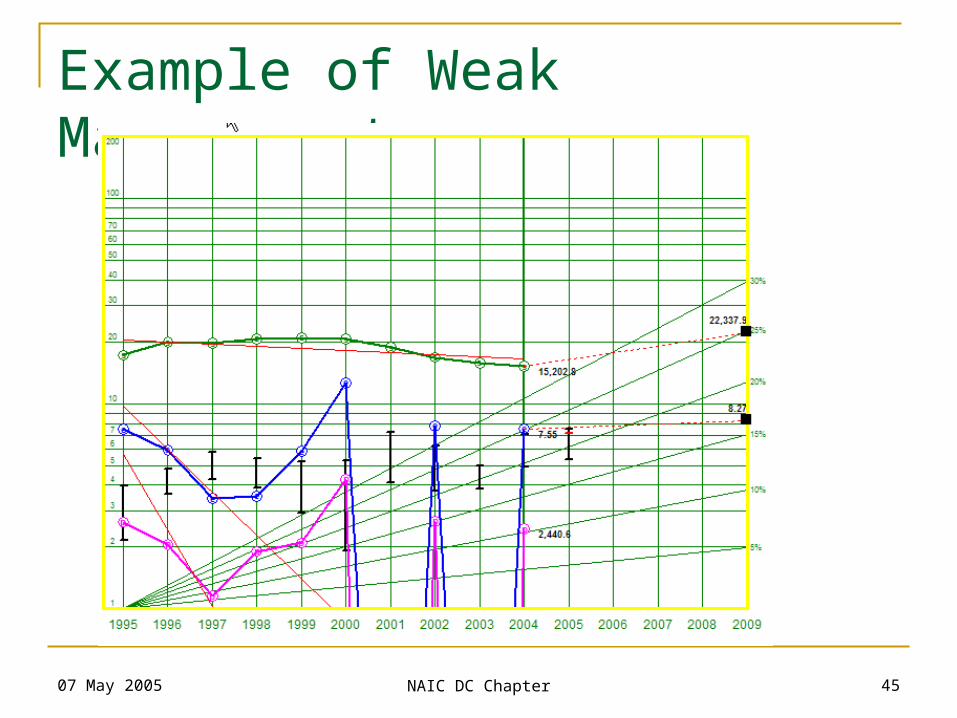
07 May 2005 NAIC DC Chapter 45
Example of Weak Management
07 May 2005 NAIC DC Chapter 46
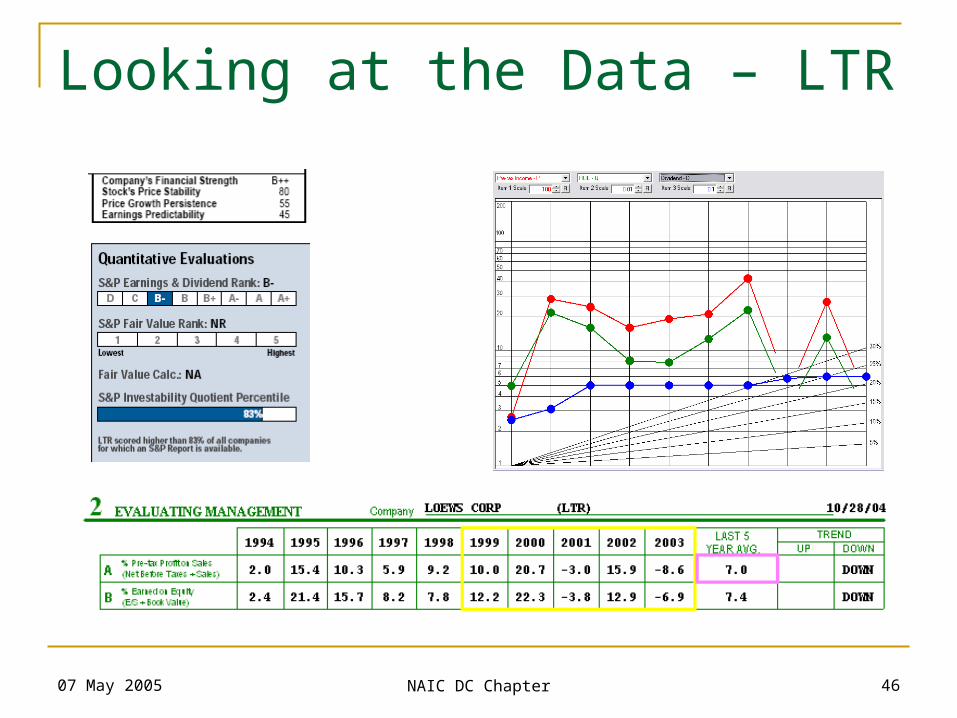
Looking at the Data – LTR

07 May 2005 NAIC DC Chapter 47
Example of Solid Management
07 May 2005 NAIC DC Chapter 48
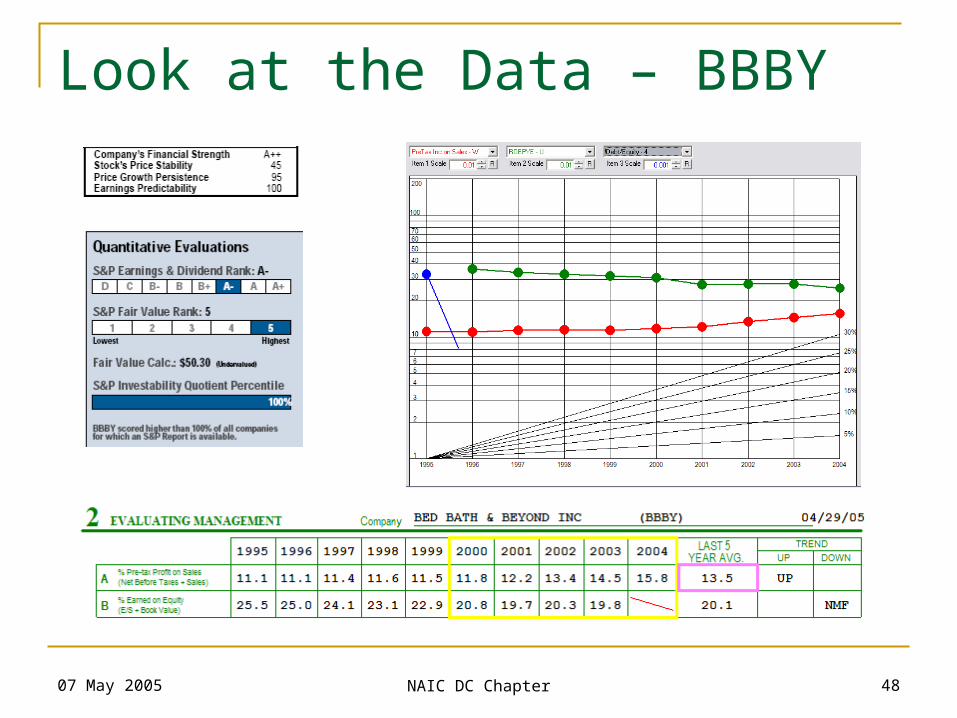
Look at the Data – BBBY
07 May 2005 NAIC DC Chapter 49
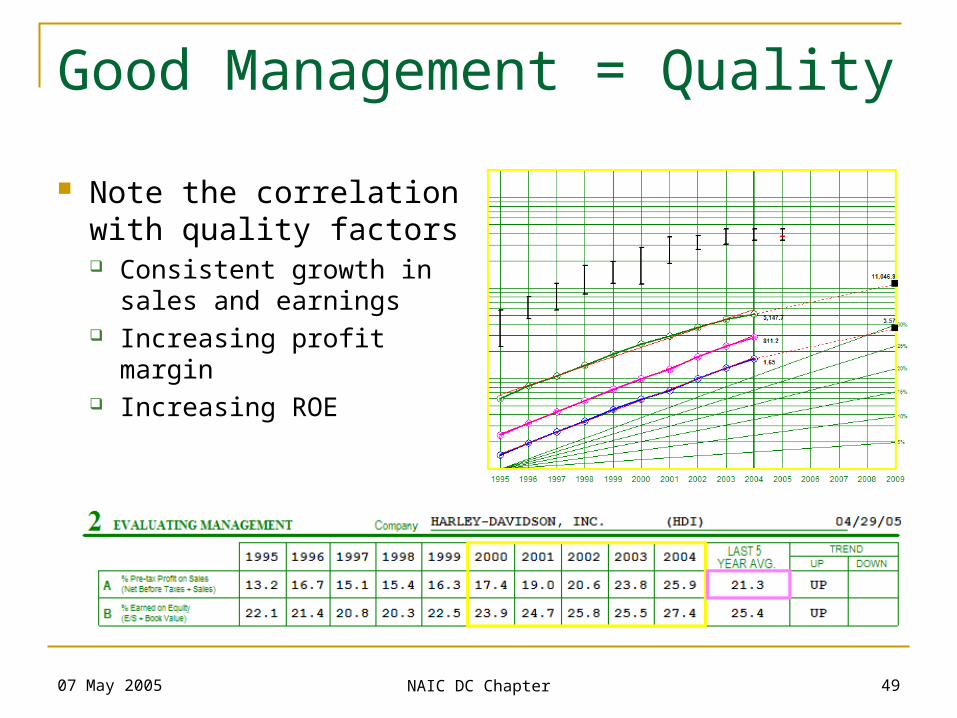
Good Management = Quality
Note the correlation with quality factors Consistent growth in
sales and earnings Increasing profit margin Increasing ROE
07 May 2005 NAIC DC Chapter 50
Finding Quality Management
Software Programs NAIC Prospector AAII Stock Investor Pro Microsoft Money Website
Screening is just that – a screen Further research and analysis is always
required
07 May 2005 NAIC DC Chapter 51
Screening for Quality
ROE > Industry ROE ROE > 10% EPS Growth > Industry EPS Growth Sales Growth > Industry Sales Growth Historical EPS and Rev Growth > 10% Consistent EPS Growth or (R2 > 0.9) Revenues > $100 million At least five years of public data

07 May 2005 NAIC DC Chapter 52
Translating to Prospector
07 May 2005 NAIC DC Chapter 53
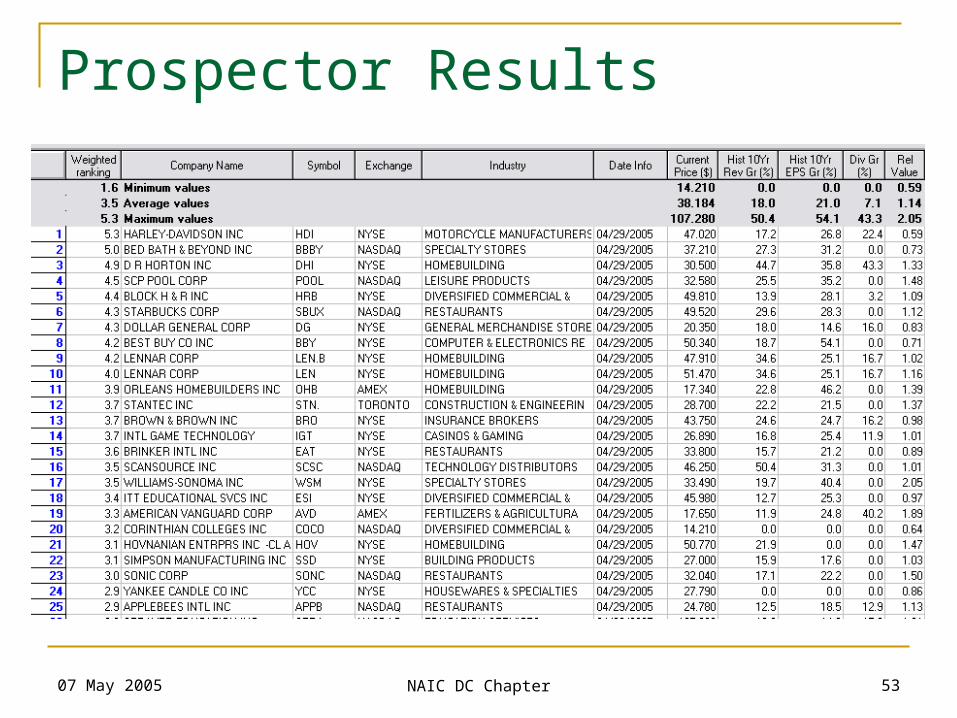
Prospector Results
07 May 2005 NAIC DC Chapter 54
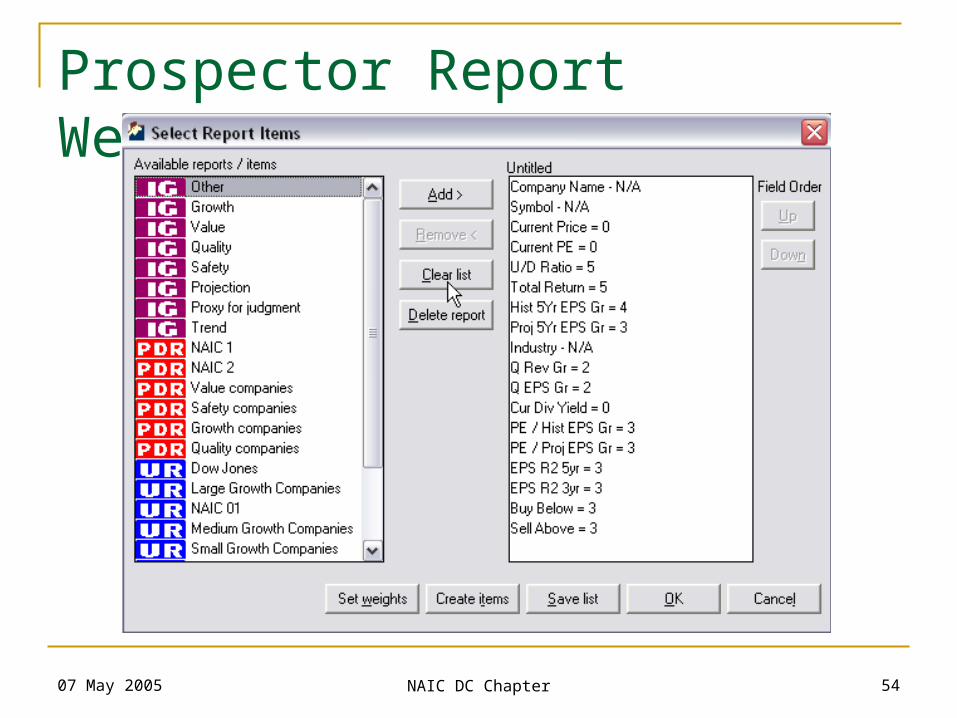
Prospector Report Weighting
07 May 2005 NAIC DC Chapter 55
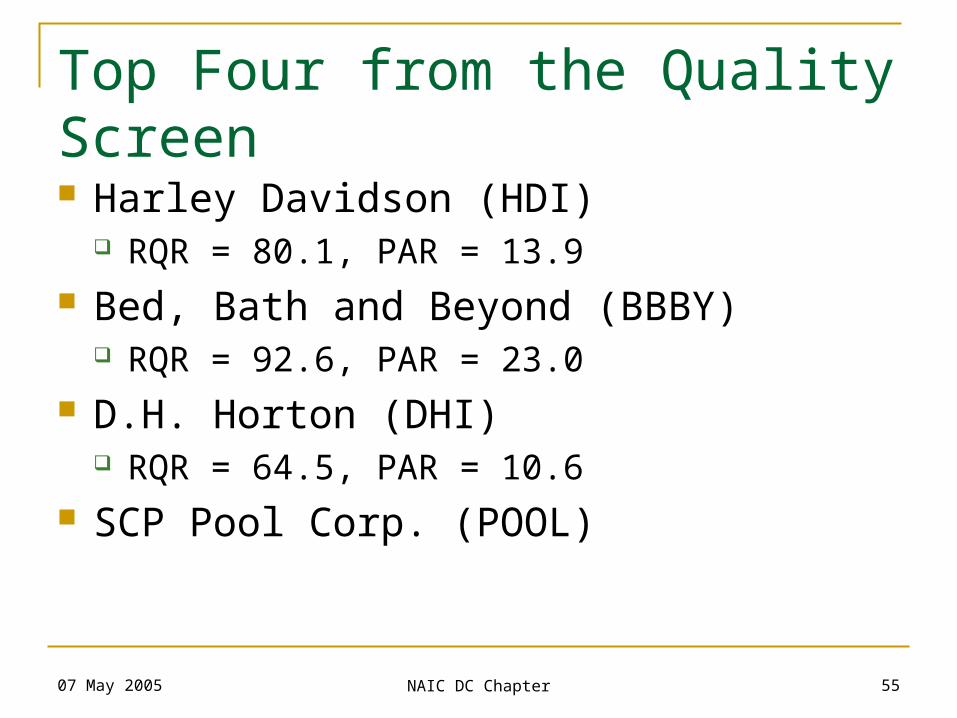
Top Four from the Quality Screen Harley Davidson (HDI)
RQR = 80.1, PAR = 13.9 Bed, Bath and Beyond (BBBY)
RQR = 92.6, PAR = 23.0 D.H. Horton (DHI)
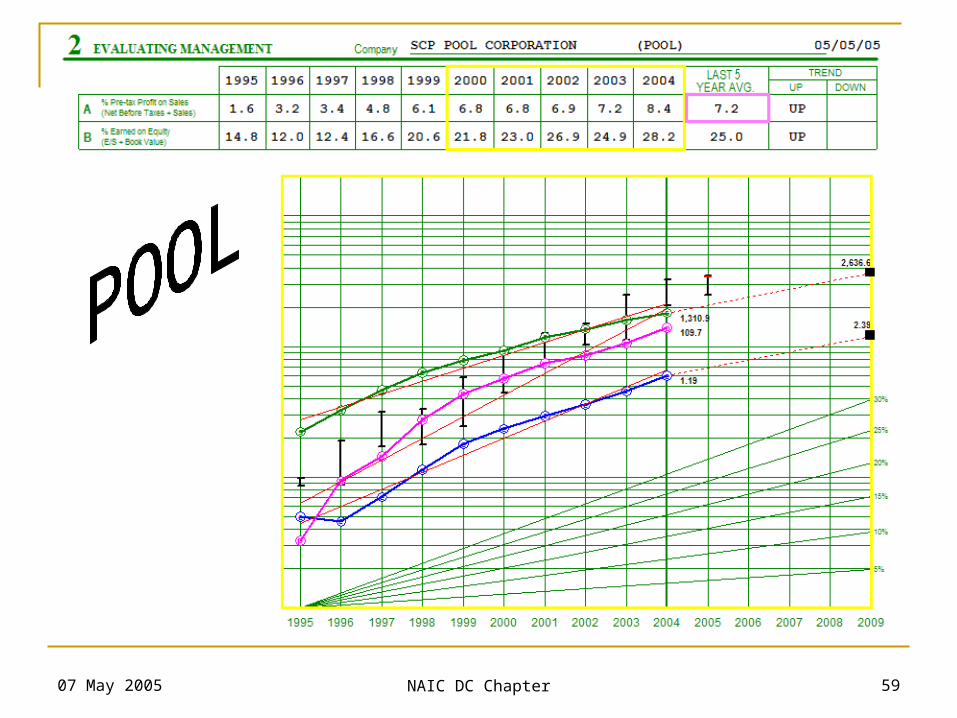
RQR = 64.5, PAR = 10.6 SCP Pool Corp. (POOL)
07 May 2005 NAIC DC Chapter 56
07 May 2005 NAIC DC Chapter 57

07 May 2005 NAIC DC Chapter 58
07 May 2005 NAIC DC Chapter 59

07 May 2005 NAIC DC Chapter 60
On-line Resources
NAIC – OPS Data for SSGs Available with NAIC membership
Reuters – www.investor.reuters.com Value Line – www.valueline.com S&P Reports – Most on-line brokers provide

07 May 2005 NAIC DC Chapter 61
Recommended Reading
Evaluating Management by Amy Rauch-Neilson www.better-investing.org/articles/bi/120/1000
Determining the Quality of Management by Nancy Isaacs www.better-investing.org/articles/bi/11/108
Quality: A Measure of Excellence by Mark Robertson www.better-investing.org/articles/web/4654
07 May 2005 NAIC DC Chapter 62
Conclusion
Any final questions? You can contact me at:
Ty Hughes – [email protected]://tyhughes.net/moosepond
Better Investing!