0706 v8 eds summaries - bay of plentymonitoring.boprc.govt.nz/monitoredsites/summary.pdf · 4...
TRANSCRIPT

Environment Bay of Plenty i
Contents
Chapter 1: Introduction ......................................................................................1
1.1 Background ......................................................................................................1
1.2 Natural Environment Regional Monitoring Network ..........................................1
1.3 Report Structure ...............................................................................................2
Chapter 2: Methodology.....................................................................................3
2.1 Monitoring Networks .........................................................................................3
2.2 Data Collection - (methods and instrumentation)..............................................5
2.3 Data Processing .............................................................................................12
2.4 Data Analysis..................................................................................................18
Chapter 3: Data Summaries............................................................................21
3.1 Air Quality Data Summaries ...........................................................................21
3.2 Meteorological Data Summaries.....................................................................57
3.3 Manual Rainfall Data Summaries ...................................................................77
3.4 Automatic Rainfall Data Summaries .............................................................133
3.5 River Flow Data Summaries .........................................................................193
3.6 River Level Data Summaries ........................................................................329
3.7 Lake Level Data Summaries.........................................................................421
3.8 Groundwater Level Data Summaries............................................................475
3.9 Water Temperature Data Summaries ...........................................................509


1
Chapter 1: Introduction While every care has been taken to ensure the results contained within this report are factual and accurate, it is important that users are aware of the limitations of the data. Due to the vast amount of data contained within this report it is possible that errors may be present or updates may have occurred since the production of this report. For this reason users of the data are advised to consult with the recording authority where appropriate. Data users are cautioned regarding the use of the information contained in this report for decisions that concern personal or public safety, or the conduct of business that involves monetary or operational consequences without first contacting the appropriate recording authority for the data.
Environment Bay of Plenty and its employees, while providing this information in good faith, accepts no responsibility for any loss, damage, injury in value to any person, service or otherwise resulting from its use.
The limitations of data are sometimes described in the relevant comment files attached to the calculated data summaries. These comments may not be the full extent of all comments relating to the data and users of the data should contact the recording authority responsible for the data.
1.1 Background
The data summaries concept was developed as part of the Hydrology Data Overview Report (Environment B.O.P, 1991). During the compilation of that report a number of users of hydrometric data were surveyed to determine their requirements. That feedback became the foundation for the data summaries contained in this report.
1.2 Natural Environment Regional Monitoring Network
Operation of the Natural Environment Regional Monitoring Network (NERMN) is an important function of Environment Bay of Plenty and many of the stations summarised in this report are part of that network.
Part IV, section 35(1) and 35(2a) of the Resource Management Act, (1991) directs Regional Councils to "gather such information, and or undertake or commission such research, and monitor the state of the whole or any part of the environment of its region or district to the extent that is appropriate, as is necessary to carry out effectively its functions under the Act".
A number of NERMN stations are operated by the National Institute of Water and Atmospheric Research Ltd (NIWA). The recording authority is acknowledged within the relevant data summary, and any questions related to the NIWA data should be directed to that authority.
The summaries contained within this report include both NERMN and non-NERMN stations.

2 Environmental Publication 2007/06
1.3 Report Structure
This report summarises air quality, meteorological, rainfall, river flow, river level, lake level, groundwater level, and water temperature. The order of presentation provided in Chapter Three is shown in Table 1.3.
Table 1.3 Report Structure
Network: Air Quality Sub-order: Particulate Carbon monoxide Hydrogen sulphide Sub-sub-order:
Sites are presented in site number order so neighbouring sites (geographically) are presented on pages adjacent to each other.
Network: Meteorological Sub-order: Wind speed Wind direction Air Temperature Sub-sub-order:
Sites are presented in site number order so neighbouring sites (geographically) are presented on pages adjacent to each other.
Network: Rainfall Sub-order: Manual Automatic Sub-sub-order:
Sites are presented in site number order so neighbouring sites (geographically) are presented on pages adjacent to each other.
Network: Flow Monitoring Sub-order: River Flow Sub-sub-order:
Sites are presented in site number order so neighbouring sites (geographically) are presented on pages adjacent to each other.
Network: Water Level Monitoring Sub-order: River Level Lake Level Groundwater Level Sub-sub-order:
Sites are presented in site number order so neighbouring sites (geographically) are presented on pages adjacent to each other.
Network: Water Temperature Monitoring Sub-order: Water
Temperature
Sub-sub-order:
Sites are presented in site number order so neighbouring sites (geographically) are presented on pages adjacent to each other.

3
Chapter 2: Methodology The data contained in this report has been derived from a variety of instruments, methods and standards. The methods are described here in order that some understanding of the origin and limitations of the data may be achieved.
Environmental Data Services implements internal auditing procedures, with verification by external review. Approximately 97% of the Environment Bay of Plenty data contained in this report has undergone this auditing process. NIWA data has been audited using their registered auditing procedures. In each case the extent of auditing is detailed in the individual data summaries.
2.1 Monitoring Networks
The Environment Bay of Plenty Natural Environment Regional Monitoring network was not initiated until July 1990. Prior to this date there were in operation a number of groups of stations that represented hydrometric 'networks'.
2.1.1 Air quality monitoring stations
Environment Bay of Plenty air quality monitoring includes measurement of particulate matter less than 10 microns (PM10), carbon monoxide (CO), hydrogen sulphide (H2S), nitrogen oxide (NO) and sulphur dioxide (SO2). Long term monitoring stations have been established in Tauranga, Rotorua, Pongakawa and Whakatane. In conjunction with the long-term stations, a portable caravan has been constructed to house PM10 and CO measurement instrumentation, which allows for short term impact and compliance monitoring at various locations throughout the Bay of Plenty.
A summary of the air quality stations provided in the report is provided in Table 3.1. The ‘ID No.’ given in that table refers to the reference location displayed on Figure 3.1.
2.1.2 Meteorological stations
Environment Bay of Plenty presently has seven meteorological stations monitoring wind and air temperature. Four of these stations have recently been installed as part of the air quality monitoring network and have limited data at this time. Of the other three, one is located at Edgecumbe in the Environment Bay of Plenty drainage works yard, another is located at the Pererika Street air quality monitoring station in Rotorua and a third at the Otumoetai air quality monitoring station in Tauranga. A fourth station was operational from May 1993 to June 1997 located at the Te Teko racecourse on the Rangitaiki Plains.
Wind record from three NIWA meteorological stations has also been included for completeness. These meteorological stations are located at Tauranga Airport, Rotorua Airport and Whakatane Airport.

4 Environmental Publication 2007/06
A summary of the meteorological stations and the parameters they measure is given in Table 3.2. The ‘ID No.’ given in that table refers to the reference location displayed on Figure 3.2.
2.1.3 Rainfall monitoring stations
The rainfall monitoring networks operated by Environment Bay of Plenty are more widely distributed and have greater periods of record than other environmental parameters. The rainfall networks are subdivided into two types (manual and automatic) depending on the type of recording mechanism operated.
(a) Manual Raingauges
Daily manual raingauges are read once per day (usually between 0700 and 0900 hours) by voluntary raingauge readers. The data is generally reliable and in some cases the length of record is significant.
A summary of these raingauges is given in Table 3.3. The ‘ID No.’ given in that table refers to the reference location displayed on Figure 3.3.
(b) Automatic Raingauges
Automatic raingauges commonly record at intervals of 15 minutes and are therefore able to record intensities of short rainfall events. Data is stored electronically, which makes automatic raingauges ideal for remote locations.
A summary of these raingauges is given in Table 3.4. The ‘ID No.’ given in that table refers to the reference location displayed on Figure 3.4.
2.1.4 Flow monitoring stations
The flow monitoring network contains both Environment Bay of Plenty and NIWA stations. The operator of each station is acknowledged in the individual data summary details.
The river flow monitoring stations are normally derived from river level data and hence these stations also form part of the river level monitoring network (Section 2.1.5). In some cases summaries have not been carried out due to inadequate data quality, missing record, uncertified data, or insufficient length of record. A summary of river flow stations is given in Table 3.5.
2.1.5 River level monitoring stations
River level monitoring stations are operated as part of Environment Bay of Plenty’s flood warning and monitoring function. Also included in this network are a number of stations that are operated to gather river level data for use in engineering design and other investigations. The designated purpose for each station is detailed in the individual station summary.
A summary of the river level monitoring stations is given in Table 3.6. The ‘ID No.’ given in that table refers to the reference location displayed on Figure 3.6.
2.1.6 Lake level monitoring stations
There are approximately 25 lakes within the Bay of Plenty region - excluding large ponds and lagoons. Of those, 12 are monitored by Environment Bay of Plenty as at December 2005.

Environment Bay of Plenty 5
Monitoring of Lake Rotorua and Lake Rotoiti has occurred at a number of stations operated by both NIWA and Environment Bay of Plenty. Datasets from the various stations have been combined to form a continuous dataset where appropriate.
A summary of lake level monitoring stations is given in Table 3.7. The ‘ID No.’ given in that table refers to the reference location displayed on Figure 3.7.
2.1.7 Groundwater level monitoring stations
The network of groundwater monitoring stations was not well developed until the late 1980's.
A summary of the groundwater level monitoring stations is given in Table 3.8. The ‘ID No.’ given in that table refers to the reference location displayed on Figure 3.8.
2.1.8 Water temperature monitoring stations
Automatic water temperature monitoring stations are generally used for scientific investigation and/or compliance monitoring purposes.
A summary of the water temperature monitoring stations is given in Table 3.9. The ‘ID No.’ given in that table refers to the reference location displayed on Figure 3.9.
2.2 Data Collection - (methods and instrumentation)
For detailed information regarding the topics of data collection in Section 2.2 refer to the EDS Air Monitoring Office Practice Manual (1999), EDS Office Practice Manual, (1998) and EDS Field Practice Manual, (1998).
2.2.1 Air quality data collection
In general, several instruments are installed at each air quality station for measurement of various parameters. Each parameter is described in detail in the following subsections. Table 2.2.1 details the equipment used and other relevant information.
Table 2.2.1 Air Quality Equipment
Parameter Equipment Range Accuracy Servicing PM10 TEOM 0 - 500μg/m3 ±1.5μg/m3 Annual
PM10 Partisol Unlimited (dependant on pump performance) ±0.00001g Annual
CO ML9830 0-50ppm 0.1ppm or 1% of
reading, which ever is greater
Annual
H2S MDA 7100 0 – 5000ppb ±5% Annual

6 Environmental Publication 2007/06
Environment Bay of Plenty uses two different PM10 measuring systems in its monitoring programme. The Tapered Element Oscillating Microbalance (TEOM) analysers provide continuous data. The Partisol analysers are manually operated and record only one data point for a 24-hour period.
(a) Continuous particulate data collection
Environment Bay of Plenty uses the TEOM Series 1400A ambient particulate monitor manufactured by Rupprecht and Patashnick. This instrument has a USEPA equivalency method designation EQPM-1090-079.
The TEOM Series 1400A PM10 monitor is a gravimetric instrument i.e. it draws ambient air through a filter at a constant flow rate, continuously ‘weighing’ the filter and calculating mass concentrations.
Measured values are transmitted as an analogue signal to a data logger. Two-second data from the instrument is averaged over a 10-minute period by the logger and stored in memory. These 10-minute averages are then used in the calculation of 24-hour averages, which can then be compared to MfE Ambient Air Quality guidelines.
(b) Manual particulate data collection
Environment Bay of Plenty uses the Partisol Model 2000, air sampler manufactured by Rupprecht and Patashnick. This instrument has a USEPA reference method designation RFPS-0694-098.
The Partisol Sampler is set up to collect particulate matter on a standard 47 mm filter for 24-hour periods from midnight to midnight. The filters used in this procedure are conditioned and weighed before exposure, and then conditioned and weighed again after exposure to determine the mass of particulate collected during the 24-hour exposure period. Weighing is undertaken on a semi-micro balance with a resolution of 0.00001g. The Partisol hardware stores the data relevant to each 24-hour collection period in its internal data logger for viewing and retrieval. Stored information includes the total volume of air passing through the filter, total collection time, average temperature and average pressure during the collection period.
(c) Carbon monoxide data collection
Environment Bay of Plenty uses a ML9830 Carbon Monoxide infrared analyser manufactured by Monitor Labs, USA. This instrument has a USEPA reference method designation RFCA-0992-088.
In the infrared analyser, broadband radiation is passed through a gas cell containing the air sample and the amount of light absorbed by carbon monoxide is compared against a reference beam.
As with the TEOM the data from the carbon monoxide instrument is collected and stored on a data logger.

Environment Bay of Plenty 7
(d) Hydrogen sulphide data collection
Environment Bay of Plenty initially used a MDA Scientific 7100 monitor manufactured by Zellweger Analytics, USA. This instrument has no USEPA reference or equivalency method designation.
Hydrogen sulphide (H2S) was measured by the change in colour of a lead acetate impregnated tape (chemcassette). Ambient air passes through an external particulate filter and Teflon sampling line into the gas-sampling head. Sampled air passes through the tape, which changes colour. The rate of colour change is dependent on the concentration of the gas present. Gas concentrations are determined by the amount of light reflected from the surface of the tape. Averaged data was sent from the instrument to the data logger.
In 2005 the instrumentations was changed so that H2S is measured by converting the H2S to SO2 via a high temperature (275 to 1000 degrees Celsius) thermal oxidiser. An SO2 analyser is then used to determine the concentration of the contaminant and report it as H2S.
The SO2 analyser uses UV fluorescence to determine the concentration of gas. Detail can be found in the ML9850B Sulphur Dioxide Analyser Operation and Service Manual.
2.2.2 Meteorological data collection
Several sensors are installed at each meteorological station for measurement of various parameters including, wind speed, wind direction, wind deviation, wind gust, relative humidity, and temperature. Table 2.2.2 details the equipment used and other relevant information.
Table 2.2.2 Meteorological Equipment
Equipment Parameter Range Accuracy Calibration & Servicing
Vector A101M Wind Speed & Gusts 0.2 - 75 m/s
1% full range output (10-55m/s)
10 Hz per m/s ±2% Bi-annual service
Vector W200P Wind Direction & Deviation 360° ±2°in wind >5m/s Bi-annual service
Air Temperature -20 - 70°C ±0.2°C from 0 - 60°C Bi-annual service
Skye 2031 Relative Humidity 0 – 100% < 2% over full
range Rotronic standard Bi-annual service
2.2.3 Rainfall Data Collection
Rainfall has been measured and recorded using a variety of instruments. These instruments are detailed in Table 2.2.3.

8 Environmental Publication 2007/06
Table 2.2.3 Raingauge Types
Name Description Recording Mechanism
Recording Frequency Reading Accuracy
Marquis 600 Plastic manual gauge Manual reader Normally daily To nearest 0.2mm1
Marquis 1000 Plastic manual gauge Manual reader Normally daily To nearest 0.2mm1
Lambrecht Siphoning raingauge Ink trace on chart Continuous Varies
TB3 Tipping bucket Data logger 15 minutes 0.5mm
OTA Tipping bucket Data logger 15 minutes 0.5mm
Note 1. Reading accuracy varies with the effectiveness of the individual raingauge reader
2.2.4 Flow Data Collection
The predominant water level recording configurations for streams and rivers is the ‘float-well’ or ‘pressure transducer’ station as described in Section 2.2.5. Flow stations differ from level stations in that the level data needs to be converted to flow data. This conversion is carried out in two stages as described below:
(a) Flow gaugings
Discharge (Q) is calculated by measuring cross sectional area (A) and velocity (V) and applying Equation 1:
VAQ ×= (1)
Area measurements (width * mean depth) are calculated using a measuring tape and depth rod. Velocity measurements are determined using velocity (current) meters selected according to the conditions being measured.
Flow gaugings are generally based on 15 to 20 velocity profiles, 15 to 20 depth/width readings, and are normally accurate to within ±8%. This error is calculated in accordance with ISO 5168. Flow gaugings are carried out at all flow monitoring stations on a regular basis (normally monthly) in addition to special gaugings carried out during periods of high or low flows.
(b) Rating Curves
Flow stations record water level. To derive a continuous flow record it is necessary to measure stream flows at a range of stream levels. In this way it is possible to build a relationship (rating curve) between level and flow. The coordinates of the rating curve are stored in a computer so that continuous water level measurements can be converted into continuous water flow measurements.
Changes in rating curves occur as a result of changes in the relationship between water level and flow and are usually caused by channel erosion or deposition of bed material.

Environment Bay of Plenty 9
2.2.5 Water level data collection
There are two forms of water level recording system currently in use by Environment Bay of Plenty. The predominant water level recording configuration is the ‘float-well’ station (Figure 2.2.5). This system works on the basis of achieving an equivalent water level within a stilling well and uses a float and counterweight system connected to a recording instrument. In this way, accurate water level measurements can be made using electronic data loggers. Measurement accuracy using the float-well system is commonly ± 3 mm, but may vary depending on the structure design.
An alternative water level recording system consists of a pressure transducer connected to a data logger. Pressure transducers measure the pressure of water above a certain point and covert this to an equivalent depth of water. Measurement accuracy of pressure transducer installations is commonly ± 10 mm, but may vary depending on the equipment installed.
Recent improvements in technology and cost effectiveness have allowed the use of radar and ultrasonic sensors to measure the height of a water surface below a transducer. Measurement accuracy of ultrasonic and radar transducer installations is commonly ±10mm.

10 Environmental Publication 2007/06
Figure 2.2.5 Typical Float-well Recording System
Environment Bay of Plenty 11
In earlier years Foxboro chart recorders were more prevalent. Foxboro recorders use a pressure bulb sensor, with accuracy being dependant upon the range of the instrument. Foxboro chart recorders were considered quite suitable for recording flood levels. By December 1995 all Foxboro recorders had been removed from Environment Bay of Plenty stations.
(a) River level
The float-well recording system is the preferred method for river level monitoring at Environment Bay of Plenty due to its high accuracy. Where channel morphology or station access prohibits the installation of a float-well structure, pressure transducers or radar are commonly used. At some river level stations pressure transducers are also used as backup sensors.
(b) Lake level
Lake level data collection is generally based on the float-well system with this being the common installation of the 1950's and 1960's. Problems have occurred when lake levels drop below the level of the lowest intake pipe for the stilling well. In these situations stilling wells have been lowered, or pressure transducers installed.
Pressure transducers have been used at various times since the mid 1980's. They were originally used as backup sensors, but as the reliability and accuracy of these instruments has improved they have been used as primary sensors.
Sampling intervals for lake levels have varied over the years. In the early years (pre. 1960) sampling intervals were often daily. In some cases records were kept for several years, stopped for several years, then restarted. The sampling interval since the 1960's has varied between 15 minutes, 30 minutes and 60 minutes. During periods when a chart recorder was used, the data was manually extracted from the charts at varying intervals ranging from hourly to daily.
(c) Groundwater level
In earlier years, the predominant recording configuration for measuring groundwater levels was based on the float-well system similar to that shown in Figure 2.2.5, except that the stilling well is replaced by a bore casing. In most cases the floats were made with reduced diameters so they would fit down the boreholes.
In the mid 1980's pressure transducers became available for measuring water levels and are now the preferred method of measurement. Pressure transducers have a diameter of approximately 40mm, which makes them ideal for use down boreholes; they are also very suitable for use in artesian bores. Pressure transducers are coupled to a data logger.
2.2.6 Water temperature data collection
The data collection stations contained in this report measure water temperatures in geothermal streams and the Tauranga Harbour. The equipment used at each station is determined by the temperatures to be measured as well as their desired accuracy. Each station summary describes the equipment used.

12 Environmental Publication 2007/06
2.2.7 Data capture rates
The value of a dataset is determined by the quantity of its data values as well as by the quality of those data values. A measure of quantity is the data capture rate (%). The rates are a measure of the percent of record captured within the period summarised. A station with no missing record will have a data capture rate of 100%, while a station with 30% missing record will have a data capture rate of 70%. The data capture rates for the data summarised in this report are provided in the relevant sections of Chapter 3. In some cases, reasons for particularly low capture rates may be explained in the relevant comments pages within the data summary.
2.3 Data Processing
The method adopted by Environment Bay of Plenty for converting field data to computer-stored data is by use of the Tideda (Time Dependant Data) software. The Tideda is used to process, edit, store, display, and analyse data. Tideda processes fall into five general categories:
(a) Data entry from sources such as a keyboard, punch-tape reader, data logger memory, laptop and telemetry.
(b) Data editing processes which allow the user to correct, copy, delete, transform, or edit data.
(c) Data manipulation processes using 'PSIM'.
(d) Data analysis processes to produce mean daily, weekly, monthly, and annual data. Distributions (% of time that a value is equalled or exceeded) are also produced using the PDIST process.
(e) Data presentation processes to display data as lists, tables and plots/charts.
2.3.1 Air quality data processing
(a) PM10 (continuous)
For continuous PM10 data 10 minute average data is recorded. Raw data (in ppm) is retrieved from the station.
Data is removed for the period of the station visit where the instrument is stopped for maintenance (i.e. filter change, inlet cleaning). Spikes are given special attention and commented where appropriate. A mass calibration is performed when the instrument is shifted and during the annual service visit.
(b) PM10 (24 hour)
The raw data for the Partisol 24 hour PM10 sampler is calculated from the difference between the pre- and post- weighing of the exposed 47mm filter.
The collected weight is calculated from subtracting the average of three pre weights from the average of three post weights. The collected weight is then divided by the volume of sampled air to determine the dust concentration.
No direct calibrations are required at the processing stage. Temperature, pressure and flow calibrations are carried out during the annual inspection. These are set to USEPA standards.
Environment Bay of Plenty 13
As part of the data quality assurance leak checks are performed on a 3 monthly basis.
(c) Carbon monoxide
Raw data (in ppm) is retrieved from the station. For carbon monoxide sensors, two sets of data are recorded, each having its own parameter number:
• 10 minute averages of carbon monoxide
• auto zero/span calibration data
Data is also adjusted based on the results of the zero/span calibrations.
(d) Hydrogen sulphide
Raw data is retrieved from the station. Calibrations are performed when the required and the difference between the zero and the span is compared for consistency. No adjustment is made to the data unless there is greater than 20% difference calculated between the expected zero-span difference and the measured zero-span difference.
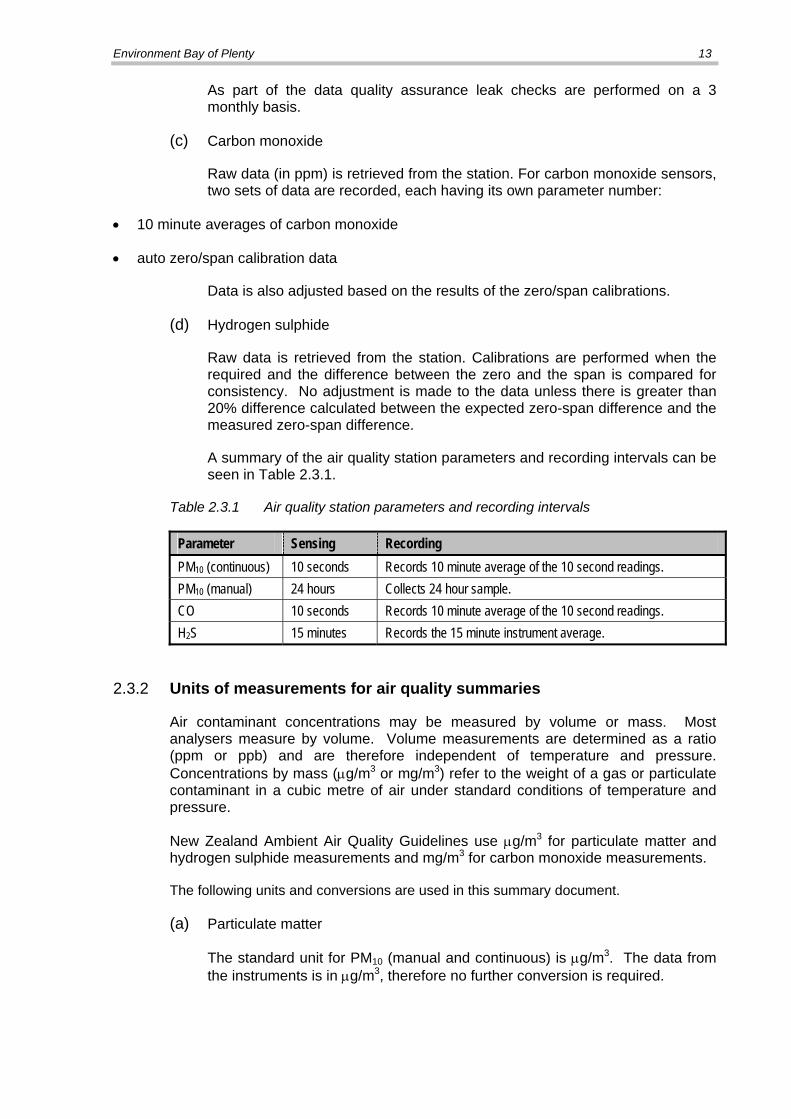
A summary of the air quality station parameters and recording intervals can be seen in Table 2.3.1.
Table 2.3.1 Air quality station parameters and recording intervals
Parameter Sensing Recording PM10 (continuous) 10 seconds Records 10 minute average of the 10 second readings. PM10 (manual) 24 hours Collects 24 hour sample. CO 10 seconds Records 10 minute average of the 10 second readings. H2S 15 minutes Records the 15 minute instrument average.
2.3.2 Units of measurements for air quality summaries
Air contaminant concentrations may be measured by volume or mass. Most analysers measure by volume. Volume measurements are determined as a ratio (ppm or ppb) and are therefore independent of temperature and pressure. Concentrations by mass (μg/m3 or mg/m3) refer to the weight of a gas or particulate contaminant in a cubic metre of air under standard conditions of temperature and pressure.
New Zealand Ambient Air Quality Guidelines use μg/m3 for particulate matter and hydrogen sulphide measurements and mg/m3 for carbon monoxide measurements.
The following units and conversions are used in this summary document.
(a) Particulate matter
The standard unit for PM10 (manual and continuous) is μg/m3. The data from the instruments is in μg/m3, therefore no further conversion is required.

14 Environmental Publication 2007/06
(b) Carbon monoxide
The standard unit for CO is mg/m3. The data from the instrument is in ppm, therefore a conversion has to be applied. The conversion factor is calculated using Equation 1.
nRTPV =
rMmn =
∴ RT
PMVm r= (1)
where:
P = atmospheric pressure (kPa)
V = volume that gas occupies (m3)
R = universal gas constant (8.314 J/K mol)
T = temperature (K)
m = mass of gas (g)
Mr = relative molecular mass (28 for CO, 34 for H2S) (g/mol)
For carbon monoxide the conversion factor from ppm to mg/m3 is 1.25 at 0°C and 1 Atm pressure.
(c) Hydrogen sulphide
The standard unit for H2S is μg/m3. Data from the instrument is in ppb, therefore a conversion has to be applied. Calculation of the conversion factor is determined by Equation 1 with Mr = 34. The resulting factor for conversion from ppb to μg/m3 is 1.52 at 0°C and 1 Atm. pressure.
The New Zealand Ambient Air Quality Guideline uses 0°C and 1 Atm. pressure as the standard temperature and pressure for calculating conversion factors. These temperature and pressure values have been used in this summary document.
2.3.3 Averaging standards for air quality summaries
The following Table 2.3.3 lists standards that have been used when calculating values for this report.
Table 2.3.3 Averaging times and periods used in this report.
Ambient Parameter Averaging Time Averaging Period
PM10 Fixed 24 hour CO Fixed 1 hour H2S Fixed 1 hour
Environment Bay of Plenty 15
Hourly average calculations in this report use the standard method of calculation using values (10 minute averages) recorded during the hour preceding the stated time.
For 24 hour values the averaging time is fixed between midnight and midnight and all 10 minute values in that period have been used.
Annual values have been calculated in the same way as 24 hour values. The interval over which the annual calculation was made will be listed with the calculated value.
2.3.4 Environmental performance indicators (EPI)
Environmental performance indicators (EPI) for air quality can be used to measure and report on the state of our air environment.
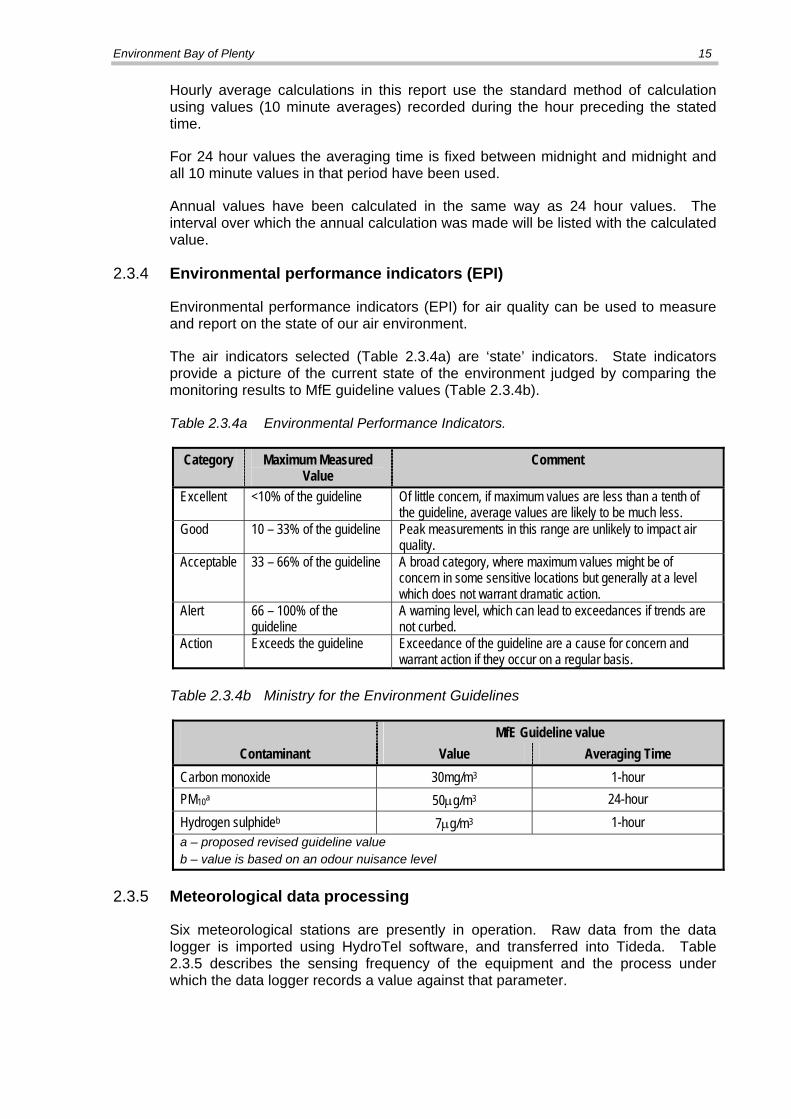
The air indicators selected (Table 2.3.4a) are ‘state’ indicators. State indicators provide a picture of the current state of the environment judged by comparing the monitoring results to MfE guideline values (Table 2.3.4b).
Table 2.3.4a Environmental Performance Indicators.
Category Maximum Measured Value
Comment
Excellent <10% of the guideline Of little concern, if maximum values are less than a tenth of the guideline, average values are likely to be much less.
Good 10 – 33% of the guideline Peak measurements in this range are unlikely to impact air quality.
Acceptable 33 – 66% of the guideline A broad category, where maximum values might be of concern in some sensitive locations but generally at a level which does not warrant dramatic action.
Alert 66 – 100% of the guideline
A warning level, which can lead to exceedances if trends are not curbed.
Action Exceeds the guideline Exceedance of the guideline are a cause for concern and warrant action if they occur on a regular basis.
Table 2.3.4b Ministry for the Environment Guidelines
MfE Guideline value Contaminant Value Averaging Time
Carbon monoxide 30mg/m3 1-hour PM10a 50μg/m3 24-hour Hydrogen sulphideb 7μg/m3 1-hour a – proposed revised guideline value b – value is based on an odour nuisance level
2.3.5 Meteorological data processing
Six meteorological stations are presently in operation. Raw data from the data logger is imported using HydroTel software, and transferred into Tideda. Table 2.3.5 describes the sensing frequency of the equipment and the process under which the data logger records a value against that parameter.

16 Environmental Publication 2007/06
Table 2.3.5 Meteorological Station parameters and recording intervals
Parameter Sensing Recording
Wind speed 6 seconds Records 10 minute average of the 6 second readings.
Wind gust 6 seconds Records highest 6 second wind speed per 10 minutes.
Wind direction 6 seconds Records 10 minute average of the 6 second readings. Data is reported in degrees true.
Wind deviation 6 seconds Records a ten minute standard deviation using the 6 sec. wind direction values. Std. deviation based on Yamartino algorithm.
Relative humidity 6 seconds Records 10 minute average of the 6 second readings.
Temperature 6 seconds Records 10 minute average of the 6 second readings.
2.3.6 Rainfall data processing
(a) Manual raingauges
As most manual raingauges are read between 0700 and 0900 hours each morning it is common practice for New Zealand Meteorological Service rainfall readings to be recorded against the previous day i.e. against the day in which the majority of the 24 hours falls. For all Environment Bay of Plenty daily manual rainfall data the data is stored against the date and time of the reading and is not backdated to the previous day. Daily rainfall data is manually entered to a Tideda file as incremental data.
(b) Automatic raingauges
Automatic rainfall is processed according to the method of collection. Two forms of automatic, or intensity, gauges have been used by Environment Bay of Plenty and its predecessors.
(c) Lambrecht raingauges
Lambrecht raingauges are continuous chart recorders. It is possible therefore to collect rainfall intensity data from these instruments by ‘digitising’ or manually reading off the charts. By December 1995 no Lambrecht gauges were in use by Environment Bay of Plenty
(d) Tipping bucket raingauges
There are two brands of tipping bucket raingauges used by Environment Bay of Plenty. The OTA raingauge was the only brand of tipping bucket raingauge in use until 1995 when the TB3 raingauge became a suitable alternative to the OTA.
Tipping bucket raingauges are volumetric gauges, attached to data loggers, which are commonly recording at 15 minute intervals, therefore able to give 15 minute intensity data. They are also used to provide daily, monthly, and annual totals. Bothe the OTA and TB3 raingauges have a typical resolution of 0.5mm.

Environment Bay of Plenty 17
2.3.7 Flow data processing
River flow is derived from the water level record by use of a rating curve established through flow gauging and stage height relationships. Rating curve coordinates are stored in the Tideda station file, allowing the water level to be ‘rated’ to give continuous flow measurements.
2.3.8 Water level data processing
(a) River level
Stream and river level data has been collected via chart recorders, punch tape recorders, or electronic data loggers. The common sampling interval for water level data is 15 minutes. Data processing methods are dependant on the type of recording instrument used. Chart digitising, tape readers, telemetry and laptop downloading provide methods of transferring data from recorders to Tideda.
River levels are recorded in terms of the staff gauge at each station. The staff gauges are levelled in terms of Moturiki Datum and river levels can therefore be provided in a common datum (Moturiki Datum - millimetres above mean sea level).
(b) Lake level
The procedure for the processing of lake level data is very similar to that used for stream data and is dependant upon the type of recording station and equipment in use.
The sampling interval of lake levels has varied over time. In the early years lake levels were recorded daily at some stations. Continuous records began in the 1930's and after this time a 60 minute sampling interval was common. At some stations 60 minute punch tape recorders were replaced with chart recorders. Data extracted from chart recorders was of varying accuracy and frequency. In more recent years the chart recorders were replaced with data loggers and a 30 minute sampling interval has become the norm.
Lake levels are recorded in terms of the staff gauge at each station. The staff gauges are levelled in terms of Moturiki Datum and lake levels can therefore be provided in a common datum (Moturiki Datum - millimetres above mean sea level).
(c) Groundwater Level
The procedure for the processing of groundwater level data is very similar to that used for river level and lake level data and is dependant upon the type of recording station and equipment used. The common sampling interval for groundwater level data is 15 minutes.
The more common groundwater recorders used were the chart recorder, pressure transducer connected to a data logger, or float and counterweight connected to punch-tape recorder. In more recent years data loggers and pressure transducers have become the norm.

18 Environmental Publication 2007/06
2.3.9 Water temperature data processing
The method of data capture of water temperature data is dependant upon the type of recording station and equipment used. Descriptions of the equipment and data loggers at each station are outlined with the presented data in Section 3. The common sampling interval for water temperature data is 15 minutes.
2.4 Data Analysis
2.4.1 Data parameters reported
The data parameters reported are defined as follows:
(a) Mean value is the mean value for the period of data summarised.
(a) Median value is the value, which is equalled or exceeded 50 % of the time.
(b) Mean Summer value is the mean value for the months of January and February, as well as December of the previous year.
(c) Mean Autumn value is the mean value for the months of March, April, and May.
(d) Mean Winter value is the mean value for the months of June, July, and August.
(e) Mean Spring value is the mean value for the months of September, October, and November.
(f) Specific Mean flow is calculated from the mean flow analysed for the period, divided by the catchments area above the flow measuring station. The flow is expressed in litres per second per square kilometre.
(g) Mean annual minimum is the mean of the individual minimum instantaneous values recorded for each year of the period of record summarised.
(h) Minimum 7 day low value is the lowest 7 day value measured for the period for the period of record analysed. A 7 day value is defined as the mean value for any 7 consecutive days.
(i) Mean annual 7 day low value is the mean of the individual 7 day low values calculated for each year of the period of record analysed. A 7 day value is defined as the mean value for any 7 consecutive days.
(j) Annual 7 day low value of a 5 year return period is the 7 day low value which has a 20 % probability of occurring in any one year. A 7 day value is defined as the mean value for any 7 consecutive days.
(k) Annual 7 day low value of a 10 year return period is the 7 day low value which has a 10 % probability of occurring in any one year. A 7 day value is defined as the mean value for any 7 consecutive days.
(l) Mean annual peak value is the mean of the annual maximum values for the period of record analysed.

Environment Bay of Plenty 19
(m) Annual peak value of a 5 year return period is the maximum value which has a 20 % probability of being exceeded in any one year.
(n) Annual peak value of a 10 year return period is the maximum value which has a 10 % probability of being exceeded in any one year.
(o) Annual peak value of a 50 year return period is the maximum value which has a 2 % probability of being exceeded in any one year.
(p) Annual peak value of a 100 year return period is the maximum value which has a 1 % probability of being exceeded in any one year.
(q) Minimum value is the minimum instantaneous recorded value for the period of record analysed.
(r) Maximum value is the maximum instantaneous value recorded for the period of record analysed.
(s) The value distributions provided indicate the value, which is equalled or exceeded for the given percentages of time. For example, the 90% value is that value which is equalled or exceeded 90% of the time for the period of record analysed.
2.4.2 Data analysis methodology
The software packages Tideda v4.1.10 and Microsoft Office Excel 2003 v11 were used to analyse the data record summarised in this report. The choice of software for data analysis was based on the respective strengths of the software. For example, Tideda was used where high speed processing of data was useful (e.g. distributions and frequency analysis), whereas Excel contains useful graphical and data tabulation facilities.
Tideda was used to calculate distribution data (flow and level), as well as maximum and minimum instantaneous data values.
Frequency analyses were predominantly derived using the FRED (Frequency Distribution) package within Tideda. This process selects a sample of data from the extrema, computes L-moments of the sample and then the parameters in a specified distribution formula so that it has the same lower order moments, then graphs and tabulates the distribution. Some of the analyses were developed by the Technical Services section of Environment Bay of Plenty for flood and infrastructure management using alternative packages.
Return periods are presented for up to twice the period of record. This means that a station with 15 years of record will have a 20 year return period flood figure, but no 50 year return period figure.
Excel was utilised to produce tabular and graphical presentation of the analysed data. Where flow plots are presented, flows are displayed in litres per second. Level plots are displayed in millimetres above mean sea level.
In the presentation plots, trends in the data are indicated using a 5 year moving average.


21
Chapter 3: Data Summaries
3.1 Air Quality Data Summaries
The air quality data summaries in this chapter are provided in the following sequences of 3 pages per station:
Page 1 Provides general information regarding the station, such as its location, instrument types, start of record, etc.
Page 2 Displays the data summary information
Page 3 Graphical presentation of a selection of parameters provided in Page 2.
The ID No. in Table 3.1 indicates the order in which individual station data summaries are provided in this report.
Table 3.1 Air Quality Monitoring Stations
ID Number
Page No.
Site Parameter Period of Audit
Data Capture Rate (%)
1 23 Otumoetai Road, Tauranga PM10 1998-2005 91 1 27 Otumoetai Road, Tauranga CO 1998-2005 83 2 31 Pererika Street, Rotorua PM10 1998-2005 94 2 35 Pererika Street, Rotorua CO 1998-2005 95 3 39 Arawa Street, Rotorua H2S 1998-2004 87 4 43 Ti Street, Rotorua H2S 1998-2004 81 5 47 Pongakawa PM10 1998-2005 98 6 51 Quay Street, Whakatane PM10 1998-2005 99


Environment Bay of Plenty 23


Environment Bay of Plenty 25
Environment Bay of Plenty Particulate Matter Recording Station
Parameter PM10 Station Otumoetai Road Site Number 2161 NZMS 260 Reference U14: 868 862 Recorder Type TEOM Altitude 63 metres Start of Record December 1997 Data Capture Rate 91% Data Summary From January 1998 To December 2005 Data Audited From To General Comments The site was initially situated on the Telecom exchange building property, on corner of Darragh and Otumoetai Road, on 25 July 2003 the site was shifted across the road onto the Otumoetai Primary School sports field. The site was installed 05/11/97. PM10 is measured by a TEOM with a PM10 size selective inlet. Measurements are calculated (10 minute average) from the mass concentration output. Instrument serial number is 97-0520
SITE LOCATION
PM10 at Otumoetai Road, Tauranga

26 Environmental Publication 2007/06
Environment Bay of Plenty PM10 Summary
Date Compiled March 2007 Site Number 2161 Compiled by Glenn Ellery Parameter PM10 Equipment Type TEOM Station Otumoetai Road NZMS 260 Reference U14: 868 862 Period of Summary 1998 to 2005 MfE guideline 50μg/m3 for 24hours
Statistical Summary (μg/m3) 24 hour fixed average
Mean PM10 13.0 Mean Summer PM10 13.9 Median PM10 12.6 Mean Autumn PM10 12.7 Maximum PM10 34.4 Mean Winter PM10 12.8 Mean Spring PM10 12.4
Monthly Statistics (μg/m3) 24 hour fixed average
Jan Feb Mar Apr May Jun Jul Aug Sep Oct Nov Dec Mean 14.8 13.7 13.6 12.1 12.1 13.3 12.5 12.6 12.2 12.7 12.4 13.9
Max. 34.4 29.6 31.6 30.5 28.1 28.5 23.1 30.0 25.8 26.1 28.6 31.0
Annual Statistics (μg/m3) 24 hour fixed average
Year Mean Maximum Date Year Mean Maximum Date 1998 14.4 28.4 24/03/1998 2002 12.6 23.6 26/03/2002 1999 13.4 34.1 05/01/1999 2003 12.4 23.7 29/06/2003 2000 13.2 25.8 09/02/2000 2004 13.4 28.8 22/04/2004 2001 12.0 24.4 27/08/2001 2005 12.1 23.8 06/02/2005
EPI - Indicator Comparisons Category Percentage of MfE guideline % of time in category
Action 100%+ 0 Alert 66-100% 0
Acceptable 33-66% 18 Good 10-33% 81
Excellent <10% 1

Environment Bay of Plenty 27
Otumoetai Road, Tauranga - Particulate Matter (PM10).24 hour average data - EPI categories for PM10 standard.
0%
10%
20%
30%
40%
50%
60%
70%
80%
90%
100%
1998 1999 2000 2001 2002 2003 2004 2005
Year
% o
f Tim
e
Action (100+%)Alert (66-100%)Acceptable (33-66%)Good (10-33%)Excellent (<10%)
Monthly Particulate Matter (PM10) - 24 hour fixed average
0
5
10
15
20
25
30
35
40
Janu
ary
Febr
uary
Mar
ch
Apr
il
May
June
July
Aug
ust
Sep
tem
ber
Oct
ober
Nov
embe
r
Dec
embe
r
Month
PM10
(ug/
m3 )
MaximumMean
PM10 at Otumoetai


Environment Bay of Plenty 29
Environment Bay of Plenty Carbon Monoxide Recording Station
Parameter Carbon monoxide Station Otumoetai Road
Site Number 2160 NZMS 260 Reference U14: 868 862
Recorder Type ML 9830 analyser Altitude 63 metres
Start of Record December 1997 Data Capture Rate 83%
Data Summary From January 1998 To December 2005
Data Audited From To General Comments The site was initially situated on the Telecom exchange building property, on corner of Darragh and Otumoetai Road, in ?? the site was shifted across the road onto the Otumoetai Primary School sports field. The site was installed 05/11/97. The carbon monoxide instrument is a Monitor Labs ML9830 carbon monoxide instrument serial number 97-0322 purchased from Ecotech, Australia. The instrument was installed on 03/12/97. Missing record in September 1998 due to correlation wheel fault. Missing record from December 1998 to May 1999 due to instrument being used in portable caravan for ‘peak site’ monitoring. Missing record from 27/7/00 105000 to 15/9/00 154000 due to an instrument fault. Initial detection that something was malfunctioning was during the inspection of the downloaded data on 1000815, manual span calibration showed a depressed level. Timed calibrations showed a negative drift. Fittings, tubing and valves were checked for leaks. Sample inlet was also checked for obstructions. Instrument was reset to sample measure. Instrument required system reset and appeared to stabilise. Instrument was returned to site on 15/9/00. Missing record in September 2000 due to faulty infrared source in analyser. Infrared source replaced.
SITE LOCATION
Carbon Monoxide at Otumoetai Road

30 Environmental Publication 2007/06
Environment Bay of Plenty Carbon Monoxide Summary
Date Compiled March 2007 Site Number 2160 Compiled by G R Ellery Parameter Carbon monoxide Equipment Type Infra-red analyser Station Otumoetai NZMS 260 Reference U14: 868 862 Period of Summary 1998 to 2005 MfE guideline 30mg/m3 for 1hour
Statistical Summary (mg/m3) 1 hour fixed average
Mean Annual Carbon Monoxide 0.11 Mean Summer Carbon Monoxide 0.04 Median Carbon Monoxide 0.02 Mean Autumn Carbon Monoxide 0.13 Maximum Carbon Monoxide 4.00 Mean Winter Carbon Monoxide 0.23 Mean Spring Carbon Monoxide 0.07
Monthly Extremes (mg/m3) 1 hour fixed average
Jan Feb Mar Apr May Jun Jul Aug Sep Oct Nov Dec Mean 0.03 0.05 0.07 0.11 0.18 0.25 0.21 0.21 0.1 0.06 0.05 0.04
Max 2.52 1.62 2.36 2.83 3.55 4.00 3.18 4.00 2.31 2.34 2.23 1.49
Annual Statistics (mg/m3)
1 hour fixed average Year Mean Maximum Date Year Mean Maximum Date 1998 0.17 4.00 05/06/1998 2002 0.09 2.99 31/05/2002 1999 0.14 3.18 07/07/1999 2003 0.12 3.80 24/06/2003 2000 0.06 3.23 21/06/2000 2004 0.11 2.88 15/06/2004 2001 0.09 3.13 12/06/2001 2005 0.13 4.32 05/08/2005
EPI - Indicator Comparisons Category Percentage
of MfE guideline
% of time in guideline category
Action 100%+ 0 Alert 66-100% 0
Acceptable 33-66% 0 Good 10-33% 0.01
Excellent <10% 99.99

Environment Bay of Plenty 31
Carbon monoxide - 1 hour fixed average
0.0
0.5
1.0
1.5
2.0
2.5
3.0
3.5
4.0
4.5
1998 1999 2000 2001 2002 2003 2004 2005
Year
CO
(mg/
m3 )
MaximumMean
Carbon monoxide - 1 hour fixed average
0.0
0.5
1.0
1.5
2.0
2.5
3.0
3.5
4.0
Janu
ary
Febr
uary
Mar
ch
Apr
il
May
June
July
Aug
ust
Sep
tem
ber
Oct
ober
Nov
embe
r
Dec
embe
r
Month
CO
(mg/
m3 )
MaximumMean
Carbon Monoxide at Otumoetai


Environment Bay of Plenty 33
Environment Bay of Plenty Particulate Matter Recording Station
Parameter PM10 Station Pererika Street Site Number 2166 NZMS 260 Reference U16: 942 352 Recorder Type TEOM Altitude 262 metres Start of Record December 1997 Data Capture Rate 94% Data Summary From January 1998 To December 2005 Data Audited From To General Comments The site is situated on the old Telecom depot property, Pererika Street. The shed was divided from the main shed with walls and a new roof. The room has an air conditioning unit, which was installed 30/10/97. The power supply was sourced from the adjacent Telecom Building. PM10 is measured by a TEOM with a PM10 size selective inlet. Measurements are calculated (10 minute average) from the mass concentration output. Instrument serial number is 97-0520.
SITE LOCATION
PM10 at Pererika Street, Rotorua

34 Environmental Publication 2007/06
Environment Bay of Plenty PM10 Summary
Date Compiled March 2007 Site Number 2166 Compiled by Glenn Ellery Parameter PM10 Equipment Type TEOM Station Pererika NZMS 260 Reference U16: 942 352 Period of Summary 1998 to 2005 MfE guideline 50μg/m3 for 24hours
Statistical Summary (μg/m3) 24 hour fixed average
Mean PM10 12.7 Mean Summer PM10 11.4 Median PM10 11.4 Mean Autumn PM10 12.9 Maximum PM10 57.1 Mean Winter PM10 15.8 Mean Spring PM10 11.0
Monthly Statistics (μg/m3) 24 hour fixed average
Jan Feb Mar Apr May Jun Jul Aug Sep Oct Nov Dec Mean 11.8 12.0 12.6 12.1 14.0 17.4 15.8 14.5 11.5 10.4 10.5 10.8
Max. 33.4 21.7 48.6 26.7 35.6 42.4 57.1 33.7 30.3 21.0 25.3 51.6
Annual Statistics (μg/m3)
24 hour fixed average Year Mean Maximum Date Year Mean Maximum Date 1998 14.0 51.6 16/12/1998 2002 13.0 48.6 08/03/2002 1999 13.8 40.9 01/07/1999 2003 12.8 57.1 15/07/2003 2000 12.2 35.9 19/06/2000 2004 12.0 40.0 26/06/2004 2001 11.8 38.2 07/06/2001 2005 12.0 37.7 02/07/2005
EPI - Indicator Comparisons Category Percentage of MfE guideline % of time in category
Action 100%+ 1 Alert 66-100% 5
Acceptable 33-66% 22 Good 10-33% 66
Excellent <10% 7

Environment Bay of Plenty 35
Pererika St, Rotorua - Particulate Matter (PM10).24 hour average data - EPI categories for PM10 standard.
0%
10%
20%
30%
40%
50%
60%
70%
80%
90%
100%
1998 1999 2000 2001 2002 2003 2004 2005
Year
% o
f Tim
e
Action (100+%)Alert (66-100%)Acceptable (33-66%)Good (10-33%)Excellent (<10%)
Monthly Particulate Matter (PM10) - 24 hour fixed average
0.0
10.0
20.0
30.0
40.0
50.0
60.0
Janu
ary
Febr
uary
Mar
ch
Apr
il
May
June
July
Aug
ust
Sep
tem
ber
Oct
ober
Nov
embe
r
Dec
embe
r
Month
PM
10 (u
g/m
3 )
MaximumMean
PM10 at Pererika Street


Environment Bay of Plenty 37
Environment Bay of Plenty Carbon Monoxide Recording Station
Parameter Carbon monoxide Station Pererika Street
Site Number 2165 NZMS 260 Reference U16: 942 352
Recorder Type ML 9830 Altitude 262 metres
Start of Record December 1997 Data Capture Rate 95%
Data Summary From January 1998 To December 2005
Data Audited From To
General Comments
The site is situated on the old Telecom works depot property, off Pererika Street. The shed was divided from the main shed with walls and a new roof this work was done by Brian Coppell, Mark Stringfellow and Shane Iremonger. The room has an air conditioning unit, which was installed 30/10/97. The power supply was sourced from the Telecom Building. The carbon monoxide instrument is a Monitor Labs ML9830 carbon monoxide instrument serial number 97-0322 purchased from Ecotech, Australia. The instrument was purchased with the internal zero span valves to allow for automatic response checking of the instrument. The instrument was installed on 03/12/97. Missing data in April 1998 and April/May 2000 are the result of component failure within the infrared analyser.
SITE LOCATION Carbon Monoxide at Pererika St, Rotorua

38 Environmental Publication 2007/06
Environment Bay of Plenty Carbon Monoxide Summary
Date Compiled March 2007 Site Number 2165 Compiled by G R Ellery Parameter Carbon monoxide Equipment Type Infra-red analyser Station Otumoetai NZMS 260 Reference U16: 942 352 Period of Summary 1998 to 2005 MfE guideline 30mg/m3 for 1hour
Statistical Summary (mg/m3) 1 hour fixed average
Mean Annual Carbon Monoxide 0.15 Mean Summer Carbon Monoxide 0.02 Median Carbon Monoxide 0.01 Mean Autumn Carbon Monoxide 0.14 Maximum Carbon Monoxide 6.12 Mean Winter Carbon Monoxide 0.40 Mean Spring Carbon Monoxide 0.07
Monthly Extremes (mg/m3) 1 hour fixed average
Jan Feb Mar Apr May Jun Jul Aug Sep Oct Nov Dec Mean 0.02 0.03 0.04 0.13 0.30 0.44 0.42 0.35 0.12 0.03 0.02 0.02
Max 0.71 1.73 2.03 3.19 6.12 5.81 5.97 5.71 2.68 2.40 2.72 0.94
Annual Statistics (mg/m3)
1 hour fixed average Year Mean Maximum Date Year Mean Maximum Date 1998 0.16 4.66 05/06/1998 2002 0.14 4.78 31/05/2002 1999 0.20 5.97 01/07/1999 2003 0.15 4.68 15/07/2003 2000 0.10 4.77 29/06/2000 2004 0.13 4.34 22/07/2004 2001 0.20 5.81 14/06/2001 2005 0.13 6.12 20/05/2005
EPI - Indicator Comparisons Category Percentage
of MfE guideline
% of time in guideline category
Action 100%+ 0 Alert 66-100% 0
Acceptable 33-66% 0 Good 10-33% 0.5
Excellent <10% 99.5

Environment Bay of Plenty 39
Carbon monoxide - 1 hour fixed average
0.0
1.0
2.0
3.0
4.0
5.0
6.0
7.0
1998 1999 2000 2001 2002 2003 2004 2005
Year
CO
(mg/
m3 )
MaximumMean
Carbon monoxide - 1 hour fixed average
0.0
1.0
2.0
3.0
4.0
5.0
6.0
7.0
Janu
ary
Febr
uary
Mar
ch
Apr
il
May
June
July
Aug
ust
Sep
tem
ber
Oct
ober
Nov
embe
r
Dec
embe
r
Month
CO
(mg/
m3 )
MaximumMean
Carbon Monoxide at Pererika Street


Environment Bay of Plenty 41
Environment Bay of Plenty Hydrogen Sulphide Recording Station
Parameter Hydrogen Sulphide Station Arawa Street Site Number 2158 NZMS 260 Reference U16: 952 357 Recorder Type Paper tape analyser Altitude 310 metres Start of Record January 1998 Data Capture Rate 87% Data Summary From January 1998 To December 2004 Data Audited From To General Comments MDA Scientific 7100 continuous toxic gas monitor serial number 5310. A hydrides tape rated 2-5000ppb is used in this instrument. The instrument sampling is initiated by a 5volt trigger from the Campbell CR10 logger. It will then sample for 10 minutes or less depending on ambient H2S concentrations. Data is logged from an analog output from the 7100 every 15 minutes. The values that are logged are averages derived by the 7100. Site Closed 4 April 2005
SITE LOCATION Hydrogen Sulphide at Arawa Street, Rotorua

42 Environmental Publication 2007/06
Environment Bay of Plenty Hydrogen Sulphide Summary
Date Compiled March 2007 Site Number 2158 Compiled by Glenn Ellery Parameter Hydrogen Sulphide Equipment Type Paper tape analyser Station Arawa Street, Rotorua NZMS 260 Reference U16: 952 357 Period of Summary 1998 to 2005
Statistical Summary (μg/m3) 1 hour fixed average
Mean Hydrogen Sulphide 73 Mean Summer Hydrogen Sulphide 50 Median Hydrogen Sulphide 24 Mean Autumn Hydrogen Sulphide 81 Maximum Hydrogen Sulphide 4200 Mean Winter Hydrogen Sulphide 96 Mean Spring Hydrogen Sulphide 65
Monthly Statistics (μg/m3) 1 hour fixed average
Jan Feb Mar Apr May Jun Jul Aug Sep Oct Nov Dec Mean 53 70 71 93 79 110 100 85 80 43 67 43
Max. 1927 2665 2719 3873 1670 4200 3238 1723 2188 2068 3526 1485
Annual Statistics (μg/m3)
1 hour fixed average Year Mean Maximum Date Year Mean Maximum Date 1998 101 2437 20/02/1998 2002 63 4200 21/06/2002 1999 101 3238 1/07/1999 2003 60 2327 8/06/2003 2000 60 2665 9/02/2000 2004 42 2188 18/09/2004 2001 69 2602 17/07/2001

Environment Bay of Plenty 43
Hydrogen Sulphide - 1 hour fixed average
0
500
1000
1500
2000
2500
3000
3500
4000
4500
Janu
ary
Febr
uary
Mar
ch
Apr
il
May
June
July
Aug
ust
Sep
tem
ber
Oct
ober
Nov
embe
r
Dec
embe
r
Month
H 2S
(ug/
m3 )
MaximumMean
Hydrogen Sulphide - 1 hour fixed average
0
500
1000
1500
2000
2500
3000
3500
4000
4500
1998 1999 2000 2001 2002 2003 2004
Year
H 2S
(ug/
m3 )
MaximumMean
Hydrogen Sulphide at Arawa Street, Rotorua


Environment Bay of Plenty 45
Environment Bay of Plenty Hydrogen Sulphide Recording Station
Parameter Hydrogen Sulphide Station Ti Street Site Number 2156 NZMS 260 Reference U16: 954 347 Recorder Type Paper tape analyser Altitude 300 metres Start of Record December 1997 Data Capture Rate 81% Data Summary From January 1998 To December 2004 Data Audited From To General Comments MDA Scientific 7100 continuous toxic gas monitor serial number 5310. A hydrides tape rated 2-5000ppb is used in this instrument. The instrument sampling is initiated by a 5volt trigger from the Campbell CR10 logger. It will then sample for 10 minutes or less depending on ambient H2S concentrations. Data is logged from an analog output from the 7100 every 15 minutes. The values that are logged are averages derived by the 7100. Site closed 3 April 2005
SITE LOCATION
Hydrogen Sulphide at Ti Street, Rotorua

46 Environmental Publication 2007/06
Environment Bay of Plenty Hydrogen Sulphide Summary
Date Compiled March 2007 Site Number 2156 Compiled by Glenn Ellery Parameter Hydrogen Sulphide Equipment Type Paper tape analyser Station Ti Street, Rotorua NZMS 260 Reference U16: 952 357 Period of Summary 1998 to 2005
Statistical Summary (μg/m3) 1 hour fixed average
Mean Hydrogen Sulphide 146 Mean Summer Hydrogen Sulphide 130 Median Hydrogen Sulphide 63 Mean Autumn Hydrogen Sulphide 166 Maximum Hydrogen Sulphide 3952 Mean Winter Hydrogen Sulphide 182 Mean Spring Hydrogen Sulphide 110
Monthly Statistics (μg/m3) 1 hour fixed average
Jan Feb Mar Apr May Jun Jul Aug Sep Oct Nov Dec Mean 118 156 160 175 160 190 181 161 133 116 90 116
Max. 2148 1804 2006 2337 1956 1797 2725 2122 3363 1919 3952 2099
Annual Statistics (μg/m3)
1 hour fixed average Year Mean Maximum Date Year Mean Maximum Date 1998 183 2006 10/03/1998 2002 168 2337 21/04/2002 1999 189 1919 06/10/1999 2003 92 3952 28/11/2003 2000 111 1446 04/04/2000 2004 131 2725 02/07/2004 2001 154 1804 23/02/2001

Environment Bay of Plenty 47
Hydrogen Sulphide - 1 hour fixed average
0
500
1000
1500
2000
2500
3000
3500
4000
4500
Janu
ary
Febr
uary
Mar
ch
Apr
il
May
June
July
Aug
ust
Sep
tem
ber
Oct
ober
Nov
embe
r
Dec
embe
r
Month
H 2S
(ug/
m3 )
MaximumMean
Hydrogen Sulphide - 1 hour fixed average
0
500
1000
1500
2000
2500
3000
3500
4000
4500
1998 1999 2000 2001 2002 2003 2004
Year
H 2S
(ug/
m3 )
MaximumMean
Hydrogen Sulphide at Ti Street, Rotorua


Environment Bay of Plenty 49
Environment Bay of Plenty Particulate Matter Recording Station
Parameter PM10 Station Pongakawa Site Number 2174 NZMS 260 Reference V15: 172 637 Recorder Type Partisol Altitude 102 metres Start of Record December 1997 Data Capture Rate 98% Data Summary From January 1998 To December 2005 Data Audited From To General Comments Site consisted initially of a Partisol hub and satellite. Serial numbers 9704-77 and 9704-79 respectively. Units are mounted in a small shed, with sampling heads approximately 2 metres above the shed roof. On the 31/05/99 a second satellite sampler was installed. In 2004 a Sequential Partisol was installed and the existing hub and satellites removed. Sampler is set to monitor on a six day cycle. Samples are for 24 hours.
SITE LOCATION PM10 at Pongakawa Road

50 Environmental Publication 2007/06
Environment Bay of Plenty PM10 Summary
Date Compiled March 2007 Site Number 2174 Compiled by Glenn Ellery Parameter PM10 Equipment Type Partisol Station Pongakawa NZMS 260 Reference V15: 172 637 Period of Summary 1998 to 2005 MfE guideline 50μg/m3 for 24hours
Statistical Summary (μg/m3) 24 hour fixed
Mean PM10 10.6 Mean Summer PM10 13.3 Median PM10 9.6 Mean Autumn PM10 10.1 Maximum PM10 49.1 Mean Winter PM10 6.7 Mean Spring PM10 10.9
Monthly Statistics (μg/m3) 24 hour fixed
Jan Feb Mar Apr May Jun Jul Aug Sep Oct Nov Dec Max. 44.5 31.1 32.1 30.8 30.9 20.8 22.2 19.6 21.2 21.6 44.8 49.1
Annual Statistics (μg/m3)
24 hour fixed Year Mean Maximum Date Year Mean Maximum Date 1998 12.7 44.5 14/01/1998 2002 10.1 25.0 0/11/2002 1999 11.4 27.6 20/03/1999 2003 8.6 30.8 10/04/2003 2000 13.0 44.8 12/11/2000 2004 9.5 21.6 31/10/2004 2001 11.3 49.1 19/12/2001 2005 8.1 32.1 25/03/2005
EPI - Indicator Comparisons Category Percentage of MfE guideline % of time in category
Action 100%+ 0 Alert 66-100% 1
Acceptable 33-66% 11 Good 10-33% 70
Excellent <10% 18

Environment Bay of Plenty 51
Pongakawa - Particulate Matter (PM10).24 hour average data - EPI categories for PM10 standard.
0%
10%
20%
30%
40%
50%
60%
70%
80%
90%
100%
1998 1999 2000 2001 2002 2003 2004 2005Year
% o
f Tim
e
Action (100+%)Alert (66-100%)Acceptable (33-66%)Good (10-33%)Excellent (<10%)
Monthly Maximum Particulate Matter (PM10) - 24 hour values
0.0
10.0
20.0
30.0
40.0
50.0
60.0
Janu
ary
Febr
uary
Mar
ch
Apr
il
May
June July
Aug
ust
Sep
tem
ber
Oct
ober
Nov
embe
r
Dec
embe
r
Month
PM10
(ug/
m3 )
Maximum
PM10 at Pongakawa


Environment Bay of Plenty 53
Environment Bay of Plenty Particulate Matter Recording Station
Parameter PM10 Station Quay Street Site Number 2176 NZMS 260 Reference W15: 616 535 Recorder Type Partisol Altitude 10 metres Start of Record December 1997 Data Capture Rate 99% Data Summary From January 1998 To December 2005 Data Audited From To General Comments Site is situated on the roof of the Regional Council headquarters in Whakatane. Site consists of a Partisol hub. The unit is mounted on a frame, with the sampling head approximately 2.2 metres above the roof. On 12/07/99 site was moved from adjacent Catchment Building roof to the roof of the Environment Bay of Plenty building, approximately 60 metres to the east. Sampler is set to monitor on a six day cycle. Samples are for 24 hours.
SITE LOCATION PM10 at Quay Street Whakatane

54 Environmental Publication 2007/06
Environment Bay of Plenty PM10 Summary
Date Compiled March 2007 Site Number 2176 Compiled by Glenn Ellery Parameter PM10 Equipment Type Partisol Station Quay Street NZMS 260 Reference W15: 616 535 Period of Summary 1998 to 2005 MfE guideline 50μg/m3 for 24hours
Statistical Summary (μg/m3) 24 hour fixed
Mean PM10 14.1 Mean Summer PM10 15.9 Median PM10 13.2 Mean Autumn PM10 13.8 Maximum PM10 56.9 Mean Winter PM10 13.2 Mean Spring PM10 12.8
Monthly Statistics (μg/m3) 24 hour fixed
Jan Feb Mar Apr May Jun Jul Aug Sep Oct Nov Dec Max. 37.3 42.0 30.8 30.6 53.0 37.1 37.1 27.8 37.8 34.3 25.3 56.9
Annual Statistics (μg/m3)
24 hour fixed Year Mean Maximum Date Year Mean Maximum Date 1998 19.2 53.0 23/05/1998 2002 14.1 56.9 13/12/2002 1999 14.0 37.8 07/09/1999 2003 12.3 35.2 29/06/2003 2000 14.7 31.4 29/06/2000 2004 12.4 37.3 20/01/2004 2001 13.5 45.0 03/05/2001 2005 12.3 42.0 15/02/2005
EPI - Indicator Comparisons Category Percentage of MfE guideline % of time in category
Action 100%+ 0 Alert 66-100% 1
Acceptable 33-66% 25 Good 10-33% 68
Excellent <10% 5

Environment Bay of Plenty 55
Quay St, Whakatane - Particulate Matter (PM10).24 hour average data - EPI categories for PM10 standard.
0%
10%
20%
30%
40%
50%
60%
70%
80%
90%
100%
1998 1999 2000 2001 2002 2003 2004 2005
Year
% o
f Tim
e
Action (100+%)Alert (66-100%)Acceptable (33-66%)Good (10-33%)Excellent (<10%)
Monthly Maximum Particulate Matter (PM10) - 24 hour values
0.0
10.0
20.0
30.0
40.0
50.0
60.0
Janu
ary
Febr
uary
Mar
ch
Apr
il
May
June July
Aug
ust
Sep
tem
ber
Oct
ober
Nov
embe
r
Dec
embe
r
Month
PM10
(ug/
m3 )
Maximum
PM10 at Quay Street Whakatane


Environment Bay of Plenty 57
3.2 Meteorological Data Summaries
The meteorological data summaries in this chapter are provided in the following sequences of 3 pages per site:
Page 1 Provides general information regarding the site, such as its location, instrument types, start of record, etc.
Page 2 Displays the data summary information
Page 3 Graphical presentation of a selection of parameters provided in Page 2.
The ID No. in Table 3.2 indicates the order in which individual site data summaries are provided in this report.
Table 3.2 Meteorological Monitoring Sites
ID Number Page No. Site Period of Audit Data Capture Rate (%)
1 57 Tauranga Aero AWS 1992-2005 - 2 61 Rotorua Aero AWS 1992-2005 - 3 65 Edgecumbe 1992-2005 98 4 69 Whakatane Aero AWS 1991-2005 -


Environment Bay of Plenty 59

Environment Bay of Plenty 61
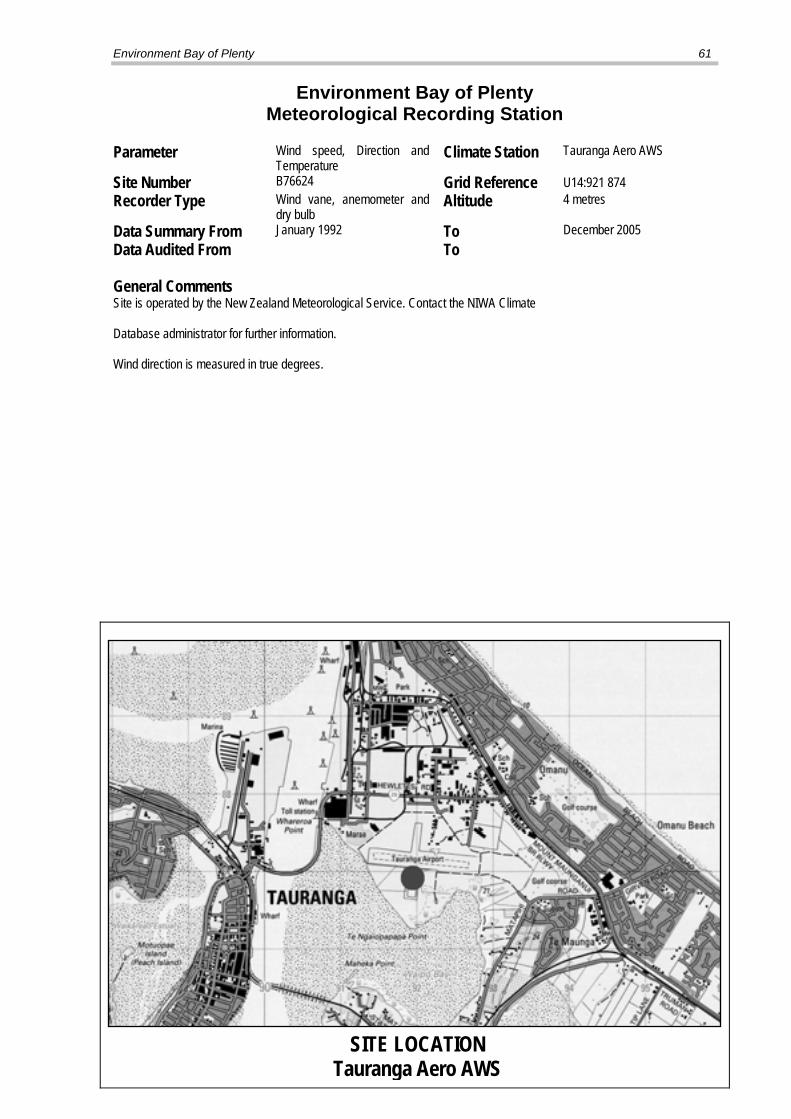
Environment Bay of Plenty Meteorological Recording Station
Parameter Wind speed, Direction and
Temperature Climate Station Tauranga Aero AWS
Site Number B76624 Grid Reference U14:921 874 Recorder Type Wind vane, anemometer and
dry bulb Altitude 4 metres
Data Summary From January 1992 To December 2005 Data Audited From To General Comments Site is operated by the New Zealand Meteorological Service. Contact the NIWA Climate Database administrator for further information. Wind direction is measured in true degrees.
SITE LOCATION Tauranga Aero AWS

62 Environmental Publication 2007/06
Environment Bay of Plenty Meteorological Summary
Date Complied March 2007 Site Number B76624 Compiled by G R Ellery Climate Station Tauranga Aero AWS Equipment Type Vane, Anemometer, Dry bulb Height Above Ground 10 metres Metric Map Reference U14: 921 874 Altitude (metres) 4 metres Period of Summary 1991 to 2005
Statistical Summary Wind speed (kph) Prevailing Direction (True) Temperature (°C)
Mean 13 Annual West Mean 14.7 Median 13 Summer West Median 14.8 Mean Summer 15 Autumn Southwest Mean Summer 18.7 Mean Autumn 12 Winter Southwest Mean Autumn 15.7 Mean Winter 13 Spring West Mean Winter 10.6 Mean Spring 15 Mean Spring 13.6 Maximum 59 Minimum -0.4 Maximum 30.0
Monthly Temperature Statistics (°C) Jan Feb Mar Apr May Jun Jul Aug Sep Oct Nov Dec Minimum 6.0 8.0 5.4 3.3 2.2 -0.4 0.0 0.6 1.0 0.9 4.0 4.4 Median 19.3 19.8 18.1 15.7 13.8 11.4 10.8 11.0 12.4 14.3 15.8 18.0
Maximum 29.0 30.0 27.3 24.3 23.0 20.2 19.3 18.1 22.0 23.0 27.4 28.1 Mean 19.2 19.6 17.8 15.3 13.4 11.0 10.3 10.5 12.1 13.9 15.5 17.8
Annual Wind Speed and Direction Frequency (% of time)
Direction (true) 0.2-10.0 kph 10.1-20.0 kph 20.1-30.0 kph 30.1 + kph Total
N 3.4 5.2 2.2 0.3 11.2
NE 2.4 3.7 1.3 0.1 7.5
E 2.8 2.9 1.5 0.3 7.5
SE 3.3 2.6 1 0.1 7.1
S 6.7 1.7 0.4 0 8.7
SW 8.3 7.3 3.7 0.7 20
W 4.5 8.1 7.4 2.3 22.2
NW 2.5 3.6 1.3 0.1 7.6
Total 33.9 35.1 18.8 4 91.8

Environment Bay of Plenty 63
Monthly Mean, Minimum and Maximum Temperature
-5.0
0.0
5.0
10.0
15.0
20.0
25.0
30.0
35.0
Jan
Feb
Mar
April
May
June
July
Aug
Sept
Oct
Nov
Dec
Month
Tem
pera
ture
(o C)
Mean
Minimum
Maximum
Climate Station at Tauranga Aero AWS
3
Annual Windrose
0.2-10.0
10.1-20.0 20.1-30.0 30.1 +
kph
Calm0 5 10
Percent
2
Summer Windrose
0.2-10.0
10.1-20.0 20.1-30.0 30.1 +
kph
Calm0 5 10
Percent
4
Autumn Windrose
0.2-10.0
10.1-20.0
20.1-30.0
30.1 +
kph
Calm0
5
10
Percent
3
Winter Windrose
0.2-10.0
10.1-20.0 20.1-30.0 30.1 +
kph
Calm0 5 10
Percent
1
Spring Windrose
0.2-10.0
10.1-20.0
20.1-30.0
30.1 +
kph
Calm0
5
10
15
Percent


Environment Bay of Plenty 65
Environment Bay of Plenty Meteorological Recording Station
Parameter Wind speed, Direction and
Temperature Climate Station Rotorua Aero AWS
Site Number B86133 Grid Reference U16: 009 388 Recorder Type Wind vane, anemometer and
dry bulb Altitude 287 metres
Data Summary From January 1992 To December 2005 Data Audited From To General Comments Site is operated by the New Zealand Meteorological Service. Contact the NIWA Climate Database administrator for further information. Wind direction is measured in true degrees.
SITE LOCATION Rotorua Aero AWS

66 Environmental Publication 2007/06
Environment Bay of Plenty Meteorological Summary
Date Complied March 2007 Site Number B86133 Compiled by G R Ellery Climate Station Rotorua Aero AWS Equipment Type Vane, Anemometer, Dry bulb Height Above Ground 10 metres Metric Map Reference U16: 009 388 Altitude (metres) 287 metres Period of Summary 1992 to 2005
Statistical Summary Wind speed (kph) Prevailing Direction (True) Temperature (°C)
Mean 13 Annual South Mean 12.4 Median 11 Summer Northeast Median 12.5 Mean Summer 14 Autumn South Mean Summer 16.8 Mean Autumn 11 Winter South Mean Autumn 13.3 Mean Winter 12 Spring West Mean Winter 8.2 Mean Spring 14 Mean Spring 11.4 Maximum 70 Minimum -5.0 Maximum 29.0
Monthly Temperature Statistics (°C) Jan Feb Mar Apr May Jun Jul Aug Sep Oct Nov Dec Minimum 2.9 2.1 0.5 -2.0 -2.0 -4.3 -4.0 -5.0 -2.0 -2.3 -1.0 -0.2 Median 17.1 17.7 16.0 13.5 11.7 9.4 8.7 8.8 10.2 12.1 13.8 16.0
Maximum 29.0 29.0 26.1 23.0 20.2 19.0 16.3 17.4 19.1 23.0 25.0 27.0 Mean 17.2 17.5 15.5 12.9 11.0 8.6 7.9 8.0 9.8 11.8 13.4 15.9
Annual Wind Speed and Direction Frequency (% of time)
Direction (true) 0.2-10.0 kph 10.1-20.0 kph 20.1-30.0 kph 30.1 + kph Total
N 3.3 5.4 2.8 0.6 12.2
NE 4.9 5.8 2 0.4 13.1
E 3.9 0.8 0.3 0 4.9
SE 4.2 1.5 0.9 0.2 6.9
S 9.2 5.3 2.1 0.4 16.9
SW 4.7 7.2 2.7 0.2 14.8
W 3.1 6.3 5.5 1 15.9
NW 3 2.3 1.1 0.2 6.7
Total 36.4 34.6 17.3 3.1 91.4

Environment Bay of Plenty 67
Monthly Mean, Minimum and Maximum Temperature
-5.0
0.0
5.0
10.0
15.0
20.0
25.0
30.0
Jan
Feb
Mar
April
May
June
July
Aug
Sept
Oct
Nov
Dec
Month
Tem
pera
ture
(o C)
Mean
Minimum
Maximum
Climate Station at Rotorua Aero AWS
3
Annual Windrose
0.3-10.0 10.1-20.0 20.1-30.0 30.1 +
kph
Calm 0
5
10
Percent
1
Summer Windrose
0.3-10.0 10.1-20.0 20.1-30.0 30.1 +
kph
Calm0
5
10 Percent
3
Autumn Windrose
0.3-10.0
10.1-20.0
20.1-30.0
30.1 +
kph
Calm0
5
10
Percent
5
Winter Windrose
0.3-10.0 10.1-20.0 20.1-30.0 30.1 +
kph
Calm0
5
10
Percent 1
Spring Windrose
0.3-10.0
10.1-20.0
20.1-30.0
30.1 +
kph
Calm0
5
10
Percent


Environment Bay of Plenty 69
Environment Bay of Plenty Meteorological Recording Station
Parameter Wind speed, Direction and
Temperature Climate Station Edgecumbe Meteorological
Site Number 2120, 2121 & 2125 Grid Reference V15: 465 508 Recorder Type Wind vane, anemometer and
CS107 temperature sensor Altitude 6 metres
Data Summary From January 1992 To December 2005 Data Audited From January 1992 To December 2005 General Comments Site is operated by Environment Bay of Plenty as part of its Natural Environment Regional Monitoring Network. Recorders are a Vector A101M anemometer and Vector W200P wind vane connected to a Campbell CR10 datalogger.
An iQuest DS4483 logger was installed in May 2004 to replace the Campbell CR10. The anemometer and vane are mounted on a 10 metre high pole at the Environment Bay of Plenty Edgecumbe depot. Both wind speed and direction are measured every 6 seconds with an average recorded every 10 minutes. The highest 6 second measurement in each 10 minute period is recorded as a wind gust against the 10 minute period in which it occurred. Wind speed and direction statistics presented are for 10 minute averages only. Please contact Environment Bay of Plenty for wind gust data. Wind direction is measured in true degrees.
SITE LOCATION Edgecumbe Meteorological

70 Environmental Publication 2007/06
Environment Bay of Plenty Meteorological Summary
Date Complied March 2007 Site Number B76995 Compiled by G R Ellery Climate Station Edgecumbe Meteorological Equipment Type Vane, Anemometer, CS107 Height Above Ground 10 metres Metric Map Reference W15: 546 568 Altitude (metres) 6 metres Period of Summary 1992 to 2005
Statistical Summary Wind speed (kph) Prevailing Direction (True) Temperature (°C)
Mean 10.2 Annual South Mean 14.8 Median 9.1 Summer North Median 15.1 Mean Summer 10.6 Autumn South Mean Summer 19.0 Mean Autumn 9.2 Winter South Mean Autumn 15.9 Mean Winter 9.5 Spring South Mean Winter 10.1 Mean Spring 11.1 Mean Spring 13.8 Maximum 58.2 Minimum -2.1 Maximum 33.6
Monthly Temperature Statistics (°C) Jan Feb Mar Apr May Jun Jul Aug Sep Oct Nov Dec Minimum 6.6 5.8 6.3 0.5 -0.6 -2.1 -1.8 -0.9 -0.9 1.1 2.4 4.1 Median 19.9 20.3 18.7 16.1 13.6 10.8 10.1 10.4 12.7 14.8 16.2 18.8
Maximum 32.2 33.6 31.1 27.7 23.6 23.6 20.5 23.6 25.8 26.8 29.8 32.9 Mean 19.4 19.9 18.1 15.5 13.2 10.4 9.7 10.1 12.2 14.3 15.8 18.3
Annual Wind Speed and Direction Frequency (% of time)
Direction (true) 0.2-10.0 kph 10.1-20.0 kph 20.1-30.0 kph 30.1 + kph Total
N 3.5 7.1 2.2 0.3 13.1
NE 4.1 2.8 1 0.2 8.1
E 4.3 1.2 0.2 0 5.8
SE 3.4 1.6 0.4 0 5.4
S 13.4 8.9 1.1 0.1 23.4
SW 15.6 5.2 0.5 0 21.4
W 6.2 4.3 0.6 0 11.1
NW 4.3 4.1 1.6 0.2 10.1
Total 55 35.2 7.6 0.8 98.5

Environment Bay of Plenty 71
Monthly Mean, Minimum and Maximum Temperature
-5.0
0.0
5.0
10.0
15.0
20.0
25.0
30.0
35.0
Jan
Feb
Mar
April
May
June
July
Aug
Sept
Oct
Nov
Dec
Month
Tem
pera
ture
(o C)
Mean
Minimum
Maximum
Climate Station at Edgecumbe Meteorological
2
Autumn Windrose
0.2-10.0
10.1-20.0
20.1-30.0
30.1 +
kph
Calm0
5
10
15
Percent
1
Winter Windrose
0.2-10.0 10.1-20.0 20.1-30.0 30.1 +
kph
Calm 0 5 10 15 20
Percent 1
Spring Windrose
0.2-10.0
10.1-20.0
20.1-30.0
30.1 +
kph
Calm0
5
10
Percent
2
Summer Windrose
0.2-10.0
10.1-20.0 20.1-30.0 30.1 +
kph
Calm0
5
10
Percent
1
Annual Windrose
0.2-10.0 10.1-20.0 20.1-30.0 30.1 +
kph
Calm0
5
10
15
Percent

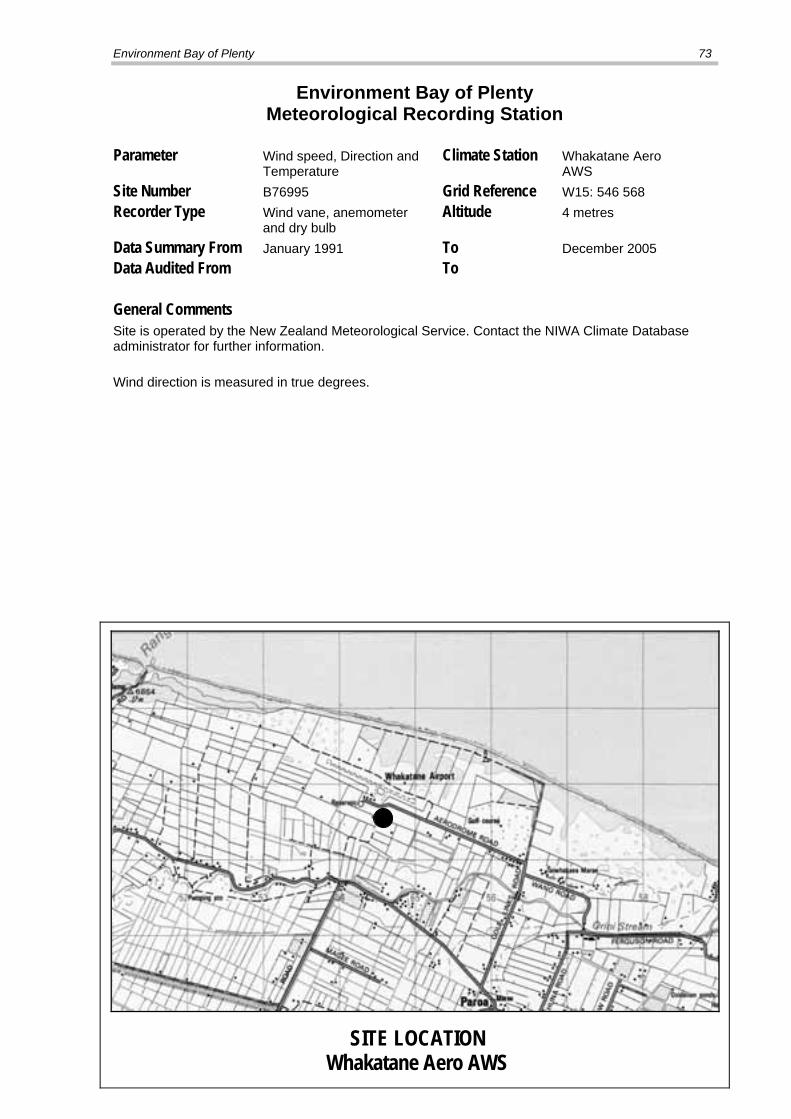
Environment Bay of Plenty 73
Environment Bay of Plenty Meteorological Recording Station
Parameter Wind speed, Direction and
Temperature Climate Station Whakatane Aero
AWS Site Number B76995 Grid Reference W15: 546 568 Recorder Type Wind vane, anemometer
and dry bulb Altitude 4 metres
Data Summary From January 1991 To December 2005 Data Audited From To General Comments Site is operated by the New Zealand Meteorological Service. Contact the NIWA Climate Database administrator for further information. Wind direction is measured in true degrees.
SITE LOCATION Whakatane Aero AWS

74 Environmental Publication 2007/06
Environment Bay of Plenty Meteorological Summary
Date Complied March 2007 Site Number B76995 Compiled by G R Ellery Climate Station Whakatane Aero AWS Equipment Type Vane, Anemometer, Dry bulb Height Above Ground 10 metres Metric Map Reference W15: 546 568 Altitude (metres) 4 metres Period of Summary 1991 to 2005
Statistical Summary Wind speed (kph) Prevailing Direction (True) Temperature (°C)
Mean 10 Annual South Mean 13.9 Median 9 Summer North Median 14.3 Mean Summer 11 Autumn Southwest Mean Summer 18.4 Mean Autumn 9 Winter Southwest Mean Autumn 14.7 Mean Winter 9 Spring West Mean Winter 9.3 Mean Spring 11 Mean Spring 13.1 Maximum 48 Minimum -3.2 Maximum 31.0
Monthly Temperature Statistics (°C) Jan Feb Mar Apr May Jun Jul Aug Sep Oct Nov Dec Minimum 4.8 3.8 1.5 0.1 -1.0 -3.2 -3.0 -2.5 -1.0 -1.2 1.0 3.6 Median 19.3 19.8 17.8 15.0 12.6 10.0 9.7 9.9 12.1 14.3 15.8 18.0 Maximum 30.1 31.0 27.2 24.2 23.0 19.0 19.0 19.3 24.0 26.0 30.0 28.4 Mean 18.9 19.2 17.1 14.3 12.1 9.4 9.0 9.4 11.4 13.6 15.2 17.5
Annual Wind Speed and Direction Frequency (% of time)
Direction (true) 0.2-10.0 kph 10.1-20.0 kph 20.1-30.0 kph 30.1 + kph Total
N 4.5 6.7 1.6 0.2 13
NE 2.6 2.9 0.9 0.1 6.5
E 2.4 1.8 0.4 0.1 4.7
SE 6 1.4 0.1 0 7.5
S 15.7 2.8 0.4 0 18.8
SW 13.6 4.8 0.5 0 18.9
W 7.3 5.4 1.2 0.2 14
NW 3.6 6.7 2.1 0.1 12.5
Total 55.6 32.6 7.3 0.6 96.1

Environment Bay of Plenty 75
Monthly Mean, Minimum and Maximum Temperature
-5.0
0.0
5.0
10.0
15.0
20.0
25.0
30.0
35.0
Jan
Feb
Mar
April
May
June
July
Aug
Sept
Oct
Nov
Dec
Month
Tem
pera
ture
(o C)
Mean
Minimum
Maximum
Climate Station at Whakatane Aero AWS
1
Summer Windrose
0.2-10.0 10.1-20.0 20.1-30.0 30.1 +
kph
Calm 0
5
10
Percent
2
Autumn Windrose
0.2-10.0
10.1-20.0
20.1-30.0
30.1 +
kph
Calm0
5
10
15
Percent
3
Winter Windrose
0.2-10.0 10.1-20.0 20.1-30.0 30.1 +
kph
Calm 0
5
10
Percent 1
Spring Windrose
0.2-10.0
10.1-20.0
20.1-30.0
30.1 +
kph
Calm0
5
10
Percent
2
Annual Windrose
0.2-10.0 10.1-20.0 20.1-30.0 30.1 +
kph
Calm0
5
10
Percent


Environment Bay of Plenty 77
3.3 Manual Rainfall Data Summaries
The manual rainfall data summaries in this chapter are provided in the following sequences of 2 pages per station:
Page 1 Provides general information regarding the station, such as its location, instrument types, start of record, etc.
Page 2 Displays the data summary information. Within each summary additional rainfall depths have been included for a range of durations. The software package used to determine these values is the High Intensity Rainfall Design System (HIRDS) version 1.50b. This software has been written by the Climate Analysis and Application section of the National Institute of Water and Atmospheric Research Ltd. The application was written to provide estimates of rainfall depth and their standard errors which are calculated for a range of average reoccurrence intervals and storm durations for defined locations. For further information see Thompson (1993).
The ID No. in Table 3.3 indicates the order in which individual station data summaries are provided in this report.
Table 3.3 Manual Rainfall Monitoring Stations
ID Number Page No.
Raingauge Location Period of Audit Data Capture Rate (%)
1 75 Marshall, P Katikati 1963-2005 100 2 77 Wallingford, R Upper Kaimai 1995-2005 88 3 79 Tauranga City Sewage Plant 1970-2005 100 4 81 Phoenix Heights Mt Maunganui 2000-2005 100 5 83 Cooke, N Te Maunga Road 1980-2002 98 6 85 Verwey, C & C Te Puke 1980-2005 100 7 87 Kaimai Hydro McLaren Falls 1968-1994 99 8 89 Sewell, J & S McLaren Falls Rd 1968-1999 88 9 91 Winters, B M Ohauiti Rd 1980-2005 98 10 93 Waite, B T Rangiuru Rd 1980-2005 100 11 95 Pendegrast, L Mangatoi Rd 1969-2005 89 12 97 Coleman, K Kaharoa 1968-1986 77 13 99 McDonald, L Maungaroa Station 1997-2005 100 14 101 Ohiwa Oyster Farm Ohiwa Harbour 1992-2005 94 15 103 Scott, W Ohakana Island 1984-2005 99 16 105 Taylor, A Ohope 1978-2005 100 17 107 Compton, R Ohope 1997-2005 94 18 109 Wood, B Lottin Point 1964-2005 100 19 111 Wright, J Okere Falls 1975-2005 97 20 113 Wright, A B Rotoma 1964-2003 93 21 115 CHH Tasman Kawerau 1955-2005 95 22 117 Wilson, P & S L. Okareka 1966-2005 91 23 119 Darby, C Taneatua 1962-2005 100 24 121 Hall, A Waimana Gorge 1980-2000 100 25 123 De Wit, C Otara Rd 1980-2002 97 26 125 Savage, I F Waimana 1972-2005 100


Environment Bay of Plenty 79


Environment Bay of Plenty 81
Environment Bay of Plenty Manual Rainfall Recording Station
Raingauge Marshall, P Location Katikati
Site Number 755903 Grid Reference T13: 692 050
Recorder Type Manual Altitude 25 metres
Start of Record 1 January 1963 Data Capture Rate 100%
Data Summary From 1 January 1963 To December 2005
Data Audited From 1 January 1963 To December 2005 General Comments Site was operated by Environment Bay of Plenty as part of its Natural Environment Regional Monitoring Network. This site became part of the network on 25 September 1996.
Rainfall from January 1963 to July 1997 was recorded by Mr Harray, T. Gauge was read daily at 0900.
From 1 August 1997 to 31 January 2002 rainfall was recorded by Mr Marshall, P. Gauge was read daily at 0900.
Site closed 1 February 2002 as property was sold. Replacement site 754906 recorded by Mr Suckling, T of Katikati.
SITE LOCATION Marshall, P. at Katikati

82 Environmental Publication 2007/06
Environment Bay of Plenty Manual Rainfall Summary
Date Complied November 2006 Site Number 755903 Compiled by Charl Naude Raingauge Marshall, P. Metric Map Reference T13: 692 050 Location Katikati Altitude 25 metres Catchment Kauri Point Period of Summary 1963 to 2005
Rainfall Totals (mm) Mean Annual Rainfall 1595 Mean Summer Rainfall 343 Summer Rainfall as % of Annual 22 Mean Autumn Rainfall 418 Autumn Rainfall as % of Annual 26 Mean Winter Rainfall 479 Max. 24 hr fall (on 27/02/1966) 250 Winter Rainfall as % of Annual 30 Max 48 hr fall (on 20/03/1987) 302 Mean Spring Rainfall 354 Max 72 hr fall (on 19/03/1987) 313 Spring Rainfall as % of Annual 22
Rainfall Intensities (mm) (Depth-Duration Frequency) EV1 Probability Weighted Moments (HIRDS Ver 1.50b)
Return Period (years) 2 5 10 20 50 100 Duration 24 hours 108 (131) 142 (175) 173 (204) 205 (231) 251 (267) 48 hours 142 (163) 179 (217) 211 (252) 245 (287) 290 (331) 72 hours 155 (180) 193 (240) 226 (280) 259 (318) 302 (367)
Monthly Statistics (mm)
Jan Feb Mar Apr May Jun Jul Aug Sep Oct Nov Dec Ann Min 12 6 17 41 29 46 37 28 35 15 28 18 312 Median 97 121 134 121 139 160 145 144 114 98 109 109 1491 Mean 97 124 147 137 130 171 158 149 132 108 115 127 1595 Max 346 348 453 391 288 374 384 290 253 293 285 333 4038
Annual Summary Year Total (mm) Rain Days Year Total (mm) Rain Days Year Total (mm) Rain Days 1978 1473 144 1986 1262 147 1994 1570 175
1979 1890 160 1987 1637 148 1995 1949 188
1980 1503 168 1988 1626 177 1996 2000 175
1981 1845 162 1989 1901 175 1997 1438 166
1982 936 135 1990 1635 167 1998 1705 175
1983 1484 150 1991 1239 178 1999 1438 167
1984 1375 151 1992 1767 163 2000 Incomplete Record
1985 1746 166 1993 1134 160 2001 1618 169

Environment Bay of Plenty 83
Environment Bay of Plenty Manual Rainfall Recording Station
Raingauge Wallingford, R. Location Upper Kaimai Site Number 758905 Grid Reference U15: 727 699 Recorder Type Manual Altitude 274 metres Start of Record July 1994 Data Capture Rate 88 % Data Summary From 1 January 1995 To December 2005 Data Audited From 12 July 1994 To December 2005 General Comments Site is operated by Environment Bay of Plenty as part of its Natural Environment Regional Monitoring Network.
Gauge is read daily at 0900.
Missing record from 1 January 2005 to 31 April 2005.
SITE LOCATION
Wallingford, R. at Upper Kaimai

84 Environmental Publication 2007/06
Environment Bay of Plenty Manual Rainfall Summary
Date Complied November 2006 Site Number 758905 Compiled by Charl Naude Raingauge Wallingford, R. Metric Map Reference U15: 727 699 Location Upper Kaimai Altitude 275 metres Catchment Wairoa Period of Summary 1995 to 2005
Rainfall Totals (mm) Mean Annual Rainfall 2284 Mean Summer Rainfall 486 Summer Rainfall as % of Annual 21 Mean Autumn Rainfall 577 Autumn Rainfall as % of Annual 25 Mean Winter Rainfall 645 Max. 24 hr fall (on 30/04/1999) 200 Winter Rainfall as % of Annual 28 Max 48 hr fall (on 04/11/1999) 320 Mean Spring Rainfall 574 Max 72 hr fall (on 04/11/1999) 354 Spring Rainfall as % of Annual 25
Rainfall Intensities (mm) (Depth-Duration Frequency) EV1 Probability Weighted Moments (HIRDS Ver 1.50b)
Return Period (years) 2 5 10 20 50 100 Duration 24 hours 113 (188) 141 (251) 166 (292) 48 hours 157 (234) 200 (311) 240 (362) 72 hours 173 (259) 220 (345) 264 (402)
Monthly Statistics (mm)
Jan Feb Mar Apr May Jun Jul Aug Sep Oct Nov Dec Ann
Min 49 17 24 80 154 93 67 100 92 90 105 92 963
Median 117 167 154 257 190 213 249 182 170 203 171 204 2277
Mean 118 169 133 224 215 225 230 188 197 174 202 209 2284
Max 211 461 235 442 380 409 491 297 331 236 610 441 4544
Annual Summary
Year Total (mm) Rain Days Year Total (mm) Rain Days Year Total (mm) Rain Days
1982 1990 1998 2431 186
1983 1991 1999 2263 163
1984 1992 2000 2105 184
1985 1993 2001 2421 219
1986 1994 2002 1776 226
1987 1995 2734 206 2003 2099 248
1988 1996 2397 199 2004 2756 221
1989 1997 1852 157 2005 Incomplete Record

Environment Bay of Plenty 85
Environment Bay of Plenty Manual Rainfall Recording Station
Raingauge Tauranga City Location Seawage Plant Site Number 766101 Grid Reference U14: 892 872 Recorder Type Manual Altitude 5 metres Start of Record January 1970 Data Capture Rate 100 % Data Summary From January 1970 To December 2005 Data Audited From January 1970 To December 2005 General Comments Site is operated by Environment Bay of Plenty as part of its Natural Environment Regional Monitoring Network.
Gauge is read daily at 0900.
SITE LOCATION Tauranga City at Sewage Plant

86 Environmental Publication 2007/06
Environment Bay of Plenty Manual Rainfall Summary
Date Complied November 2006 Site Number 766101 Compiled by Charl Naude Raingauge Tauranga City Metric Map Reference U14: 892 872 Location Sewage Plant Altitude 5 metres Catchment Tauranga Harbour Period of Summary 1970 to 2005
Rainfall Totals (mm) Mean Annual Rainfall 1245 Mean Summer Rainfall 255 Summer Rainfall as % of Annual 20 Mean Autumn Rainfall 349 Autumn Rainfall as % of Annual 28 Mean Winter Rainfall 365 Max 24 hr fall (on 18/05/2005) 230 Winter Rainfall as % of Annual 29 Max 48 hr fall (on 19/03/1979) 270 Mean Spring Rainfall 277 Max 72 hr fall (on 19/03/1979) 304 Spring Rainfall as % of Annual 22
Rainfall Intensities (mm) (Depth-Duration Frequency) EV1 Probability Weighted Moments (HIRDS Ver 1.50b)
Return Period (years) 2 5 10 20 50 100 Duration 24 hours 93 (109) 124 (145) 155 (169) 192 (192) 251 (222) 48 hours 118 (135) 161 (180) 202 (210) 248 (238) 315 (275) 72 hours 126 (150) 171 (200) 216 (233) 269 (264) 352 (305)
Monthly Statistics (mm)
Jan Feb Mar Apr May Jun Jul Aug Sep Oct Nov Dec Ann Min 8 8 18 15 29 38 24 38 37 11 22 18 266 Median 57 72 93 95 85 121 127 111 89 85 78 82 1095 Mean 72 88 118 123 106 124 126 112 102 91 84 99 1245 Max 250 274 478 392 461 237 314 212 266 240 226 261 3611
Annual Summary Year Total (mm) Rain Days Year Total (mm) Rain Days Year Total (mm) Rain Days 1982 854 141 1990 1224 142 1998 1327 128 1983 1133 143 1991 1116 163 1999 1124 138 1984 1057 158 1992 1277 138 2000 1219 140 1985 1420 159 1993 861 134 2001 1560 161 1986 957 136 1994 1206 154 2002 862 158 1987 1193 132 1995 1690 179 2003 1116 161 1988 1164 163 1996 1478 163 2004 1441 169 1989 1342 153 1997 993 133 2005 1481 176

Environment Bay of Plenty 87
Environment Bay of Plenty Manual Rainfall Recording Station
Raingauge Phoenix Heights Location Mount Maunganui
Site Number 766205 Grid Reference U14: 937 858
Recorder Type Manual Altitude 15 metres
Start of Record May 1999 Data Capture Rate 100 %
Data Summary From January 2000 To December 2005
Data Audited From May 1999 To December 2005 General Comments Site is operated by Environment Bay of Plenty as part of its Natural Environment Regional Monitoring Network.
Gauge is read daily at 0800.
SITE LOCATION Phoenix Heights at Mount Maunganui

88 Environmental Publication 2007/06
Environment Bay of Plenty Manual Rainfall Summary
Date Complied November 2006 Site Number 766205 Compiled by Charl Naude Raingauge Phoenix Heights Metric Map Reference U14: 937 858 Location Mount Maunganui Altitude 15 metres Catchment Tauranga Harbour Period of Summary 2000 to 2005
Rainfall Totals (mm) Mean Annual Rainfall 1260 Mean Summer Rainfall 318 Summer Rainfall as % of Annual 25 Mean Autumn Rainfall 398 Autumn Rainfall as % of Annual 31 Mean Winter Rainfall 278 Max 24 hr fall (on 18/05/2005) 237 Winter Rainfall as % of Annual 22 Max 48 hr fall (on 17/05/2005) 304 Mean Spring Rainfall 277 Max 72 hr fall (on 17/05/2005) 306 Spring Rainfall as % of Annual 22
Rainfall Intensities (mm) (Depth-Duration Frequency) EV1 Probability Weighted Moments (HIRDS Ver 1.50b)
Return Period (years) 2 5 10 20 50 100 Duration 24 hours 104 (105) 149 (140) 199 (163) 48 hours 125 (130) 185 (173) 248 (202) 72 hours 131 (144) 191 (192) 256 (224)
Monthly Statistics (mm)
Jan Feb Mar Apr May Jun Jul Aug Sep Oct Nov Dec Ann Min 19 10 19 19 65 55 45 58 76 61 41 58 526 Median 63 72 60 169 127 118 107 76 96 117 65 148 1218 Mean 58 107 70 157 174 102 99 93 91 113 67 129 1260 Max 105 237 131 294 497 123 181 189 99 203 115 246 2420
Annual Summary Year Total (mm) Rain Days Year Total (mm) Rain Days Year Total (mm) Rain Days 1982 1990 1998 1983 1991 1999 1984 1992 2000 1202 135 1985 1993 2001 1470 170 1986 1994 2002 931 145 1987 1995 2003 1064 153 1988 1996 2004 1336 151 1989 1997 2005 1556 148

Environment Bay of Plenty 89
Environment Bay of Plenty Manual Rainfall Recording Station
Raingauge Cooke, N Location Te Maunga Road
Site Number 767201 Grid Reference U14: 971 845
Recorder Type Manual Altitude 10 metres
Start of Record January 1980 Data Capture Rate 98 %
Data Summary From January 1980 To December 2002
Data Audited From January 1980 To May 2003 General Comments Site is operated by Environment Bay of Plenty as part of its Natural Environment Regional Network Monitoring Network.
Gauge is read daily at 0900.
Site closed May 2003.
SITE LOCATION
Cooke, N. at Te Maunga Road

90 Environmental Publication 2007/06
Environment Bay of Plenty Manual Rainfall Summary
Date Complied November 2006 Site Number 767201 Compiled by Charl Naude Raingauge Cooke, N. Metric Map Reference U14: 971 845 Location Te Maunga Road Altitude 10 metres Catchment Tauranga Harbour Period of Summary 1980 to 2002
Rainfall Totals (mm) Mean Annual Rainfall 1281 Mean Summer Rainfall 278 Summer Rainfall as % of Annual 22 Mean Autumn Rainfall 337 Autumn Rainfall as % of Annual 26 Mean Winter Rainfall 379 Max. 24 hr fall (on 09/04/2000) 146 Winter Rainfall as % of Annual 30 Max 48 hr fall (on 20/03/1987) 172 Mean Spring Rainfall 286 Max 72 hr fall (on 19/03/1987) 174 Spring Rainfall as % of Annual 22
Rainfall Intensities (mm) (Depth-Duration Frequency) EV1 Probability Weighted Moments (HIRDS Ver 1.50b)
Return Period (years) 2 5 10 20 50 100 Duration 24 hours 86 (103) 108 (137) 127 (159) 144 (181) 48 hours 106 (127) 132 (169) 153 (197) 172 (224) 72 hours 115 (141) 141 (188) 159 (219) 175 (248)
Monthly Statistics (mm)
Jan Feb Mar Apr May Jun Jul Aug Sep Oct Nov Dec Ann Min 8 4 35 21 44 39 27 31 24 15 30 19 297 Median 80 78 95 129 87 119 130 121 87 94 89 72 1181 Mean 90 88 106 139 91 127 131 119 96 97 93 104 1281 Max 257 309 295 346 239 285 331 214 185 257 212 252 3182
Annual Summary Year Total (mm) Rain Days Year Total (mm) Rain Days Year Total (mm) Rain Days 1979 Incomplete Record 1987 1225 115 1995 1818 168 1980 1363 142 1988 1298 148 1996 1565 149 1981 Incomplete Record 1989 1467 159 1997 1086 132 1982 1016 113 1990 1376 140 1998 1308 130 1983 1991 1177 156 1999 1112 119 1984
Incomplete Record Incomplete Record 1992 1362 141 2000 1252 139
1985 1508 137 1993 862 125 2001 1644 166 1986 1084 123 1994 1198 143 2002 972 137

Environment Bay of Plenty 91
Environment Bay of Plenty Manual Rainfall Recording Station
Raingauge Verwey, C & C Location Te Puke
Site Number 767304 Grid Reference U14: 021 764
Recorder Type Manual Altitude 15 metres
Start of Record December 1979 Data Capture Rate 100 %
Data Summary From January 1980 To December 2005
Data Audited From December 1979 To December 2005
General Comments Site is operated by Environment Bay of Plenty as part of its Natural Environment Regional Monitoring Network.
Rainfall from December 1979 to June 2002 was read by Collins, HM. Gauge was read daily at 0700.
Rainfall from 13 June 2002 is recorded by Verwey, C & C. Gauge is read daily at 0700.
SITE LOCATION Verwey, C & C at Te Puke

92 Environmental Publication 2007/06
Environment Bay of Plenty Manual Rainfall Summary
Date Complied November 2006 Site Number 767304 Compiled by Charl Naude Raingauge Verwey, C & C Metric Map Reference U14: 021 764 Location Te Puke Altitude 15 metres Catchment Kaituna Period of Summary 1980 to 2005
Rainfall Totals (mm) Mean Annual Rainfall 1428 Mean Summer Rainfall 380 Summer Rainfall as % of Annual 22 Mean Autumn Rainfall 377 Autumn Rainfall as % of Annual 26 Mean Winter Rainfall 420 Max 24 hr fall (on 09/04/2000) 173 Winter Rainfall as % of Annual 29 Max 48 hr fall (on 17/05/2005) 226 Mean Spring Rainfall 326 Max 72 hr fall (on 16/05/2005) 235 Spring Rainfall as % of Annual 23
Rainfall Intensities (mm) (Depth-Duration Frequency) EV1 Probability Weighted Moments (HIRDS Ver 1.50b)
Return Period (years) 2 5 10 20 50 100 Duration 24 hours 95 (107) 121 (143) 143 (167) 166 (189) 197 (219) 48 hours 127 (133) 157 (177) 181 (207) 204 (235) 232 (271) 72 hours 137 (148) 168 (197) 191 (229) 211 (260) 236 (301)
Monthly Statistics (mm)
Jan Feb Mar Apr May Jun Jul Aug Sep Oct Nov Dec Ann Min 12 15 18 26 51 57 24 49 47 16 26 17 358 Median 78 86 111 125 106 139 135 125 100 95 89 95 1284 Mean 93 100 120 139 116 145 146 125 108 116 102 118 1428 Max 319 285 333 369 412 345 357 285 230 303 223 284 3745
Annual Summary Year Total (mm) Rain Days Year Total (mm) Rain Days Year Total (mm) Rain Days 1982 1124 110 1990 1560 141 1998 1390 130 1983 1416 111 1991 1290 163 1999 1174 130 1984 1377 135 1992 1481 139 2000 1376 129 1985 1671 130 1993 933 132 2001 1724 162 1986 1198 117 1994 1288 155 2002 993 147 1987 1372 105 1995 1906 160 2003 1354 146 1988 1438 135 1996 1658 155 2004 1640 150 1989 1738 164 1997 1223 125 2005 1657 137

Environment Bay of Plenty 93
Environment Bay of Plenty Manual Rainfall Recording Station
Raingauge Kaimai Hydro Location McLaren Falls Road
Site Number 768002 NZMS 260 Reference U14:778 733
Recorder Type Manual Altitude 95 metres
Start of Record October 1967 Data Capture Rate 99%
Data Summary From January 1968 To December 1995
Data Audited From October 1967 To December 1995 General Comments Site was operated by Environment Bay of Plenty as part of its Natural Environment Regional Monitoring Network.
Gauge was read daily at 0900.
Site was closed in September 1995 and gauge moved to Ruahihi Power Station.
SITE LOCATION Kaimai Hydro at McLaren Falls Road

94 Environmental Publication 2007/06
Environment Bay of Plenty Manual Rainfall Summary
Date Compiled April 2001 Site Number 768002 Compiled by Leanne Bodle Raingauge Kaimai Hydro NZMS 260 Reference U14:778 733 Location McLaren Falls Road Altitude 95 metres Catchment Wairoa Period of Summary 1968 to 1994
Rainfall Totals (mm) Mean Annual Rainfall 1919 Mean Summer Rainfall 385 Summer Rainfall as % of Annual 21 Mean Autumn Rainfall 484 Autumn Rainfall as % of Annual 25 Mean Winter Rainfall 564 Max. 24 hr. fall (on 13/08/1970) 179 Winter Rainfall as % of Annual 29 Max. 48 hr. fall (on 20/03/1987) 247 Mean Spring Rainfall 486 Max. 72 hr. fall (on 07/03/1972) 257 Spring Rainfall as % of Annual 25
Rainfall Intensities (mm) Depth-Duration Frequency EV1 Probability Weighted Moments (HIRDS)
Return Period (years) 2 5 10 20 50 100 Duration 24 hours 108 (171) 134 (227) 151 (265) 167 (301) 48 hours 148 (212) 187 (282) 214 (329) 240 (373) 72 hours 165 (235) 211 (313) 242 (364) 271 (414)
Monthly Statistics (mm) Jan Feb Mar Apr May Jun Jul Aug Sep Oct Nov Dec Ann. Min. 14 11 25 40 34 87 46 34 65 26 45 20 1419 Median 98 115 134 149 139 186 165 188 157 147 133 141 1974 Mean 109 121 175 156 153 197 168 199 173 167 146 155 1919 Max. 329 361 526 287 300 371 316 426 349 518 349 299 2427
Annual Summary Year Total (mm) Rain Days Year Total (mm) Rain Days Year Total (mm) Rain Days 1972 1967 188 1980 1638 176 1988 2064 150 1973 1584 183 1981 2167 179 1989 2299 141 1974 2197 182 1982 Incomplete Record 1990 2173 100 1975 1734 198 1983 1993 143 1991 1698 146 1976 2089 181 1984 1710 145 1992 1981 157 1977 1783 153 1985 1945 141 1993 1419 154 1978 1606 134 1986 1754 116 1994 1810 154 1979 2416 152 1987 1775 131 1995 Incomplete Record
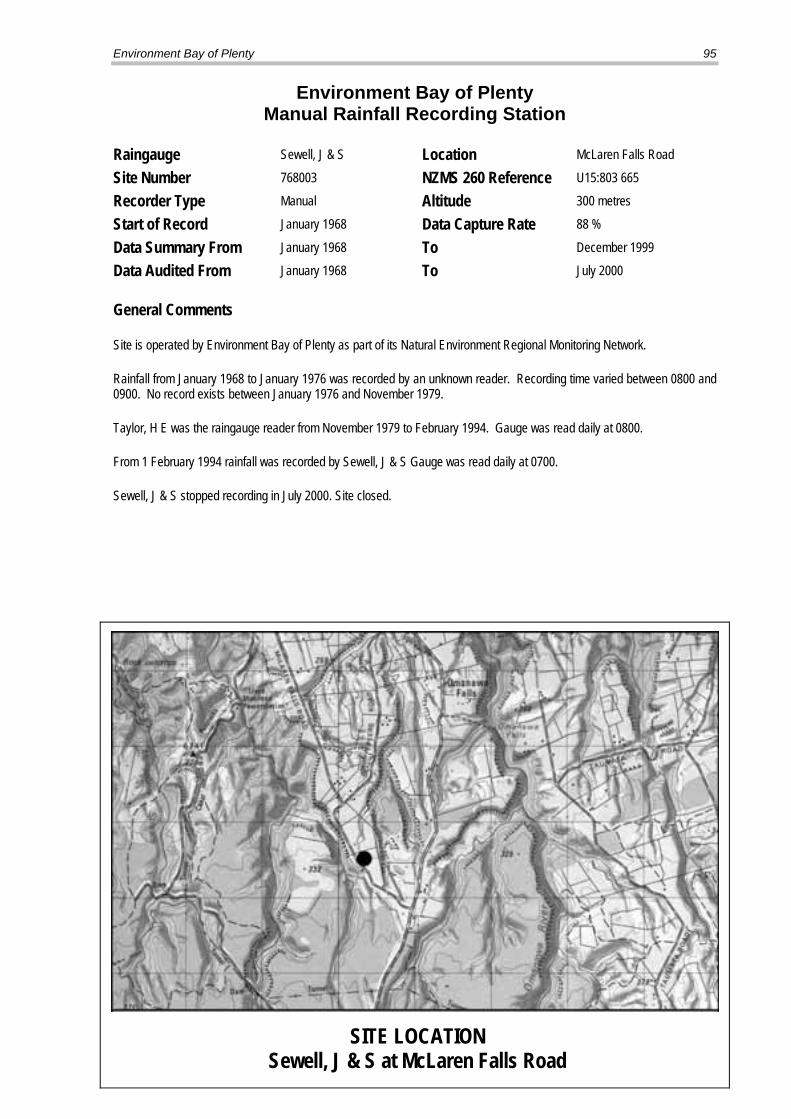
Environment Bay of Plenty 95
Environment Bay of Plenty Manual Rainfall Recording Station
Raingauge Sewell, J & S Location McLaren Falls Road
Site Number 768003 NZMS 260 Reference U15:803 665
Recorder Type Manual Altitude 300 metres
Start of Record January 1968 Data Capture Rate 88 %
Data Summary From January 1968 To December 1999
Data Audited From January 1968 To July 2000 General Comments Site is operated by Environment Bay of Plenty as part of its Natural Environment Regional Monitoring Network.
Rainfall from January 1968 to January 1976 was recorded by an unknown reader. Recording time varied between 0800 and 0900. No record exists between January 1976 and November 1979.
Taylor, H E was the raingauge reader from November 1979 to February 1994. Gauge was read daily at 0800.
From 1 February 1994 rainfall was recorded by Sewell, J & S Gauge was read daily at 0700.
Sewell, J & S stopped recording in July 2000. Site closed.
SITE LOCATION Sewell, J & S at McLaren Falls Road

96 Environmental Publication 2007/06
Environment Bay of Plenty Manual Rainfall Summary
Date Compiled April 2001 Site Number 768003 Compiled by Leanne Bodle Raingauge Sewell, J & S NZMS 260 Reference U15: 803 665 Location McLaren Falls Road Altitude 300 metres Catchment Wairoa Period of Summary 1968 to 1999
Rainfall Totals (mm) Mean Annual Rainfall 2062 Mean Summer Rainfall 427 Summer Rainfall as % of Annual 21 Mean Autumn Rainfall 497 Autumn Rainfall as % of Annual 24 Mean Winter Rainfall 602 Max 24 hr fall (on 13/08/1970) 179 Winter Rainfall as % of Annual 29 Max 48 hr fall (on 20/03/1987) 243 Mean Spring Rainfall 536 Max 72 hr fall (on 02/01/1986) 277 Spring Rainfall as % of Annual 26
Rainfall Intensities (mm) Depth-Duration Frequency EV1 Probability Weighted Moments (HIRDS)
Return Period (years) 2 5 10 20 50 100 Duration 24 hours 110 (178) 152 (237) 179 (277) 205 (314) 239 (363) 48 hours 149 (221) 192 (294) 221 (343) 248 (390) 284 (450) 72 hours 163 (245) 213 (327) 246 (380) 278 (432) 319 (499)
Monthly Statistics (mm) Jan Feb Mar Apr May Jun Jul Aug Sep Oct Nov Dec Ann. Min. 15 10 40 48 28 98 57 56 74 28 58 35 1520 Median 126 117 143 144 157 198 184 213 182 139 146 151 2080 Mean 135 118 169 169 159 205 179 218 189 178 169 174 2062 Max. 515 324 457 390 336 386 514 433 349 554 508 328 2493
Annual Summary Year Total (mm) Rain Days Year Total (mm) Rain Days Year Total (mm) Rain Days 1977 Incomplete Record 1985 2213 148 1993 1573 145 1978 Incomplete Record 1986 1996 138 1994 1995 170 1979 Incomplete Record 1987 2003 152 1995 2482 220 1980 1520 192 1988 2332 172 1996 2229 204 1981 1944 168 1989 2319 174 1997 1766 180 1982 Incomplete Record 1990 2266 173 1998 2273 176 1983 2199 157 1991 1786 164 1999 2092 155 1984 1903 155 1992 2180 179 2000

Environment Bay of Plenty 97
Environment Bay of Plenty Manual Rainfall Recording Station
Raingauge Winters, B M Location Ohauiti Road
Site Number 768103 Grid Reference U14: 903 728
Recorder Type Manual Altitude 310 metres
Start of Record January 1980 Data Capture Rate 98 %
Data Summary From January 1980 To December 2005
Data Audited From January 1980 To December 2005 General Comments Site is operated by Environment Bay of Plenty as part of its Natural Regional Monitoring Network.
Gauge is read daily at 0800.
SITE LOCATION Winters, B M at Ohauiti Road

98 Environmental Publication 2007/06
Environment Bay of Plenty Manual Rainfall Summary
Date Complied November 2006 Site Number 768103 Compiled by Charl Naude Raingauge Winters, B M Metric Map Reference U14: 903 728 Location Ohauiti Road Altitude 310 metres Catchment Tauranga Harbour Period of Summary 1980 to 2005
Rainfall Totals (mm) Mean Annual Rainfall 2096 Mean Summer Rainfall 471 Summer Rainfall as % of Annual 23 Mean Autumn Rainfall 502 Autumn Rainfall as % of Annual 24 Mean Winter Rainfall 580 Max 24 hr fall (on 09/01/2003) 217 Winter Rainfall as % of Annual 28 Max 48 hr fall (on 09/01/2003) 287 Mean Spring Rainfall 527 Max 72 hr fall (on 08/01/2003) 353 Spring Rainfall as % of Annual 26
Rainfall Intensities (mm) (Depth-Duration Frequency) EV1 Probability Weighted Moments (HIRDS Ver 1.50b)
Return Period (years) 2 5 10 20 50 100 Duration 24 hours 141 (139) 169 (185) 190 (216) 209 (245) 230 (283) 48 hours 189 (172) 228 (230) 259 (267) 288 (304) 322 (351) 72 hours 218 (191) 264 (255) 296 (297) 322 (337) 348 (389)
Monthly Statistics (mm)
Jan Feb Mar Apr May Jun Jul Aug Sep Oct Nov Dec Ann Min 7 21 12 29 48 67 9 49 64 34 54 22 416 Median 102 147 156 162 141 190 215 179 146 142 138 149 1866 Mean 137 164 154 180 168 200 200 181 177 184 169 181 2096 Max 458 389 465 502 410 443 577 424 534 561 516 424 5703
Annual Summary Year Total (mm) Rain Days Year Total (mm) Rain Days Year Total (mm) Rain Days 1982 1587 80 1990 2216 116 1998 2422 124 1983 2220 118 1991 1644 119 1999 2140 139 1984 1903 138 1992 1928 122 2000 1976 139 1985 2490 133 1993 1329 108 2001 2471 163 1986 1979 145 1994 1689 133 2002 1649 141 1987 2074 120 1995 2573 165 2003 2227 141 1988 2158 132 1996 2156 130 2004 2155 139 1989 2560 146 1997 1791 125 2005 2056 148

Environment Bay of Plenty 99
Environment Bay of Plenty Manual Rainfall Recording Station
Raingauge Waite, B T Location Rangiuru Road
Site Number 768307 Grid Reference U15: 029 639
Recorder Type Manual Altitude 150 metres
Start of Record January 1980 Data Capture Rate 100 %
Data Summary From January 1980 To December 2005
Data Audited From January 1980 To December 2005
General Comments Site is operated by Environment Bay of Plenty as part of its Natural Environment Regional Monitoring Network.
Gauge is read daily at 0700.
SITE LOCATION Waite, B T at Rangiuru Road

100 Environmental Publication 2007/06
Environment Bay of Plenty Manual Rainfall Summary
Date Complied December 2006 Site Number 768307 Compiled by Charl Naude Raingauge Waite, B T Metric Map Reference U15: 029 639 Location Rangiuru Road Altitude 150 metres Catchment Mangorewa Period of Summary 1980 to 2005
Rainfall Totals (mm) Mean Annual Rainfall 2046 Mean Summer Rainfall 439 Summer Rainfall as % of Annual 22 Mean Autumn Rainfall 504 Autumn Rainfall as % of Annual 25 Mean Winter Rainfall 594 Max 24 hr fall (on 02/05/1999) 260 Winter Rainfall as % of Annual 29 Max 48 hr fall (on 01/05/1999) 364 Mean Spring Rainfall 494 Max 72 hr fall (on 30/04/1999) 364 Spring Rainfall as % of Annual 24
Rainfall Intensities (mm) (Depth-Duration Frequency) EV1 Probability Weighted Moments (HIRDS Ver 1.50b)
Return Period (years) 2 5 10 20 50 100 Duration 24 hours 131 (144) 161 (191) 188 (223) 215 (253) 252 (292) 48 hours 166 (178) 201 (237) 238 (276) 282 (314) 356 (363) 72 hours 182 (198) 224 (263) 264 (307) 309 (348) 375 (402)
Monthly Statistics (mm)
Jan Feb Mar Apr May Jun Jul Aug Sep Oct Nov Dec Ann Min 11 18 47 37 45 81 51 61 75 35 29 35 525 Median 115 133 173 179 126 190 197 202 151 121 143 162 1892 Mean 135 139 160 185 153 202 193 208 168 169 168 167 2046 Max 431 400 373 441 415 420 578 473 322 556 530 356 5294
Annual Summary Year Total (mm) Rain Days Year Total (mm) Rain Days Year Total (mm) Rain Days 1982 1534 141 1990 2291 163 1998 2231 154 1983 2108 147 1991 1709 168 1999 2243 157 1984 1738 159 1992 1973 171 2000 1856 165 1985 2262 161 1993 1417 173 2001 2547 185 1986 1823 159 1994 1838 173 2002 1350 167 1987 2005 144 1995 2648 196 2003 1989 180 1988 2356 176 1996 2108 175 2004 2470 178 1989 2562 191 1997 1665 163 2005 2102 178

Environment Bay of Plenty 101
Environment Bay of Plenty Manual Rainfall Recording Station
Raingauge Pendergrast, L Location Mangatoi Road
Site Number 769203 Grid Reference U15: 935 614
Recorder Type Manual Altitude 380 metres
Start of Record August 1968 Data Capture Rate 89 %
Data Summary From January 1969 To December 2005
Data Audited From August 1969 To December 2005 General Comments Site is operated by Environment Bay of Plenty as part of its Natural Environment Regional Monitoring Network.
Gauge is read daily at 0900.
SITE LOCATION Pendergrast, J at Mangatoi Road

102 Environmental Publication 2007/06
Environment Bay of Plenty Manual Rainfall Summary
Date Complied December 2006 Site Number 769203 Compiled by Charl Naude Raingauge Pendergrast, J Metric Map Reference U15: 935 614 Location Mangatoi Road Altitude 380 metres Catchment Waiari Period of Summary 1969 to 2005
Rainfall Totals (mm) Mean Annual Rainfall 2131 Mean Summer Rainfall 456 Summer Rainfall as % of Annual 22 Mean Autumn Rainfall 522 Autumn Rainfall as % of Annual 25 Mean Winter Rainfall 618 Max 24 hr fall (on 04/12/1983) 272 Winter Rainfall as % of Annual 28 Max 48 hr fall (on 06/12/1983) 353 Mean Spring Rainfall 539 Max 72 hr fall (on 06/12/1983) 392 Spring Rainfall as % of Annual 25
Rainfall Intensities (mm) (Depth-Duration Frequency) EV1 Probability Weighted Moments (HIRDS Ver 1.50b)
Return Period (years) 2 5 10 20 50 100 Duration 24 hours 119 (156) 148 (208) 173 (242) 197 (275) 227 (317) 48 hours 159 (193) 203 (257) 239 (300) 273 (340) 316 (393) 72 hours 185 (214) 236 (285) 276 (332) 314 (378) 359 (436)
Monthly Statistics (mm)
Jan Feb Mar Apr May Jun Jul Aug Sep Oct Nov Dec Ann Min 8 16 19 22 54 75 56 46 63 40 52 51 502 Median 122 129 163 166 147 226 196 183 149 166 136 171 1954 Mean 127 152 171 175 171 222 187 206 196 186 158 180 2131 Max 311 477 581 547 395 404 466 583 520 486 499 473 5742
Annual Summary Year Total (mm) Rain Days Year Total (mm) Rain Days Year Total (mm) Rain Days 1982 1400 111 1990 2073 151 1998 2194 153 1983 2108 139 1991 1737 159 1999 2189 159 1984 1760 156 1992 2053 160 2000 1963 152 1985 2034 145 1993 1563 184 2001 2100 171 1986 1976 150 1994 2015 163 2002 1448 152 1987 1762 127 1995 2777 174 2003 2180 168 1988 2096 144 1996 2213 166 2004 2369 168 1989 2103 163 1997 1653 134 2005 2200 152

Environment Bay of Plenty 103
Environment Bay of Plenty Manual Rainfall Recording Station
Raingauge Coleman, K Location Kaharoa
Site Number 769302 NZMS 260 Reference U15: 012 544
Recorder Type Manual Altitude 270 metres
Start of Record January 1968 Data Capture Rate 77%
Data Summary From January 1968 To March 1986
Data Audited From To General Comments Site is operated by Environment Bay of Plenty as part of its Natural Environment Regional Monitoring Network. No rainfall was recorded between January 1976 and December 1979.
Gauge was read daily at 0900.
Site closed on 31 March 1986. No replacement.
SITE LOCATION Coleman, K at Kaharoa

104 Environmental Publication 2007/06
Environment Bay of Plenty Manual Rainfall Summary
Date Compiled April 2001 Site Number 769302 Compiled by Leanne Bodle Raingauge Coleman, K NZMS 260 Reference U15: 012 544 Location Kaharoa Altitude 270 metres Catchment Kaituna Period of Summary 1968 to 1986
Rainfall Totals (mm) Mean Annual Rainfall 2166 Mean Summer Rainfall 461 Summer Rainfall as % of Annual 21 Mean Autumn Rainfall 538 Autumn Rainfall as % of Annual 25 Mean Winter Rainfall 634 Max 24 hr fall (on 13/08/1970) 239 Winter Rainfall as % of Annual 29 Max 48 hr fall (on 13/08/1970) 279 Mean Spring Rainfall 533 Max 72 hr fall (on 16/04/1974) 295 Spring Rainfall as % of Annual 25
Rainfall Intensities (mm) Depth-Duration Frequency EV1 Probability Weighted Moments (HIRDS)
Return Period (years) 2 5 10 20 50 100 Duration 24 hours 121 (133) 163 (178) 190 (207) 216 (235) 48 hours 163 (165) 216 (220) 251 (257) 284 (291) 72 hours 186 (183) 249 (244) 291 (285) 331 (323)
Monthly Statistics (mm) Jan Feb Mar Apr May Jun Jul Aug Sep Oct Nov Dec Ann. Min. 29 23 29 44 72 82 50 38 87 17 34 80 1502 Median 136 96 160 155 171 251 147 181 156 128 132 202 2239 Mean 154 118 188 191 159 258 145 231 203 180 150 189 2166 Max. 458 283 541 399 298 446 253 549 418 613 397 334 2863
Annual Summary Year Total (mm) Rain Days Year Total (mm) Rain Days Year Total (mm) Rain Days 1962 1970 2494 150 1978 Incomplete Record 1963 1971 1863 161 1979 Incomplete Record 1964 1972 1911 114 1980 Incomplete Record 1965 1973 1596 151 1981 Incomplete Record 1966 1974 2330 159 1982 1502 110 1967 1975 Incomplete Record 1983 2239 115 1968 2309 180 1976 Incomplete Record 1984 1801 116 1969 2118 115 1977 Incomplete Record 1985 2269 110

Environment Bay of Plenty 105
Environment Bay of Plenty Manual Rainfall Recording Station
Raingauge McDonald, L Location Maungaroa Station
Site Number 777701 Grid Reference Y14: 320 720
Recorder Type Manual Altitude 60 metres
Start of Record 21 October 1996 Data Capture Rate 100 %
Data Summary From January 1997 To December 2005
Data Audited From January 1997 To December 2005 General Comments Site is operated by Environment Bay of Plenty as part of its Natural Environment Regional Monitoring Network.
Gauge is read daily at 0800.
SITE LOCATION McDonald, L at Maungaroa Station

106 Environmental Publication 2007/06
Environment Bay of Plenty Manual Rainfall Summary
Date Complied December 2006 Site Number 777701 Compiled by Charl Naude Raingauge McDonald, L Metric Map Reference Y14: 320 720 Location Maungaroa Station Altitude 60 metres Catchment Kereu Period of Summary 1997 to 2005
Rainfall Totals (mm) Mean Annual Rainfall 2558 Mean Summer Rainfall 518 Summer Rainfall as % of Annual 21 Mean Autumn Rainfall 625 Autumn Rainfall as % of Annual 24 Mean Winter Rainfall 796 Max 24 hr fall (on 30/12/2004) 243 Winter Rainfall as % of Annual 31 Max 48 hr fall (on 07/12/2001) 296 Mean Spring Rainfall 62 Max 72 hr fall (on 07/12/2001) 354 Spring Rainfall as % of Annual 24
Rainfall Intensities (mm) (Depth-Duration Frequency) EV1 Probability Weighted Moments (HIRDS Ver 1.50b)
Return Period (years) 2 5 10 20 50 100 Duration 24 hours 150 (136) 198 (182) 239 (212) 48 hours 236 (169) 280 (225) 301 (262) 72 hours 269 (188) 331 (250) 362 (291)
Monthly Statistics (mm)
Jan Feb Mar Apr May Jun Jul Aug Sep Oct Nov Dec Ann Min 21 52 86 24 106 141 123 126 79 94 75 102 1029 Median 126 154 173 197 302 356 230 215 221 228 162 221 2585 Mean 117 164 165 208 247 301 278 217 219 206 196 240 2558 Max 220 371 268 403 403 466 620 355 384 326 526 598 4939
Annual Summary Year Total (mm) Rain Days Year Total (mm) Rain Days Year Total (mm) Rain Days 1982 1990 1998 2936 153 1983 1991 1999 2861 170 1984 1992 2000 2232 169 1985 1993 2001 2971 200 1986 1994 2002 2397 184 1987 1995 2003 2642 198 1988 1996 2004 3258 201 1989 1997 1966 151 2005 1775 196

Environment Bay of Plenty 107
Environment Bay of Plenty Manual Rainfall Recording Station
Raingauge Oyster Farm Location Ohiwa
Site Number 779003 Grid Reference W15: 671 497
Recorder Type Manual Altitude 5 metres
Start of Record 1 January 1992 Data Capture Rate 94 %
Data Summary From 1 January 1992 To December 2005
Data Audited From 1 January 1992 To December 2005
General Comments Site is operated by Environment Bay of Plenty as part of its Natural Environment Monitoring Network.
Gauge is read daily at 0800.
Data for period 1 October 2002 to 30 April 2003 lost by raingauge reader due to flooding.
Data missing for period 1 November 2003 to 2 January 2004.
SITE LOCATION Oyster Farm at Ohiwa
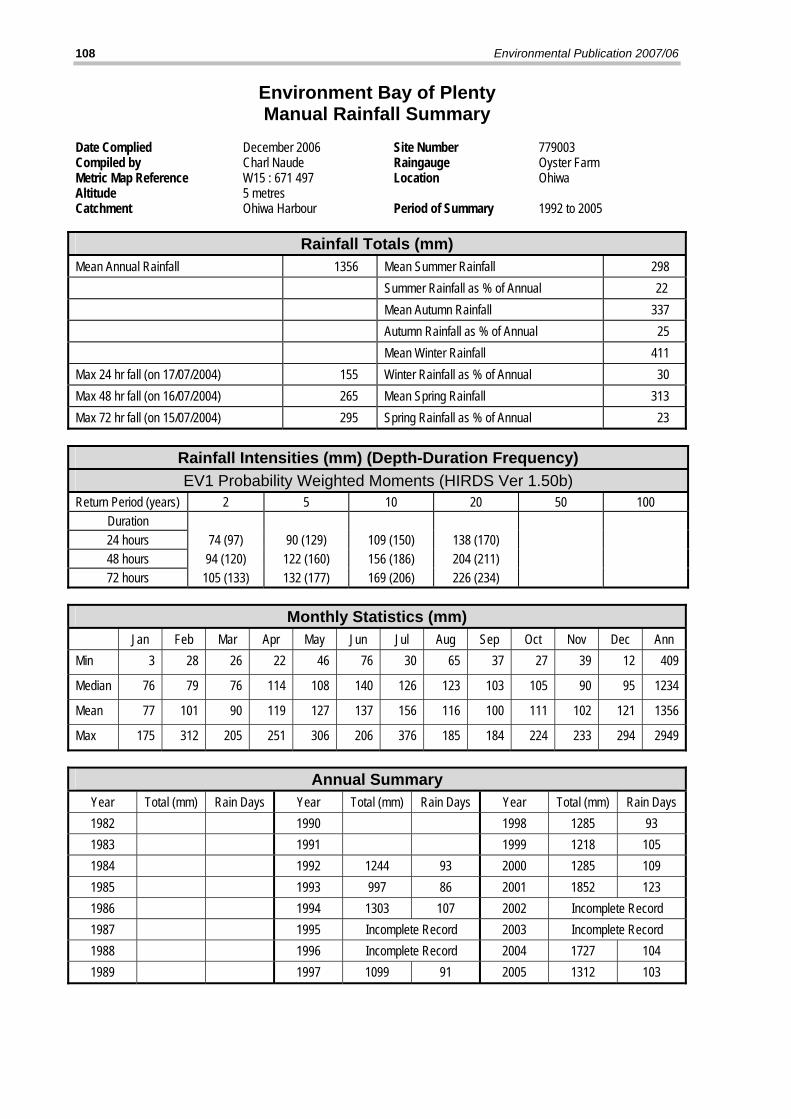
108 Environmental Publication 2007/06
Environment Bay of Plenty Manual Rainfall Summary
Date Complied December 2006 Site Number 779003 Compiled by Charl Naude Raingauge Oyster Farm Metric Map Reference W15 : 671 497 Location Ohiwa Altitude 5 metres Catchment Ohiwa Harbour Period of Summary 1992 to 2005
Rainfall Totals (mm) Mean Annual Rainfall 1356 Mean Summer Rainfall 298 Summer Rainfall as % of Annual 22 Mean Autumn Rainfall 337 Autumn Rainfall as % of Annual 25 Mean Winter Rainfall 411 Max 24 hr fall (on 17/07/2004) 155 Winter Rainfall as % of Annual 30 Max 48 hr fall (on 16/07/2004) 265 Mean Spring Rainfall 313 Max 72 hr fall (on 15/07/2004) 295 Spring Rainfall as % of Annual 23
Rainfall Intensities (mm) (Depth-Duration Frequency) EV1 Probability Weighted Moments (HIRDS Ver 1.50b)
Return Period (years) 2 5 10 20 50 100 Duration 24 hours 74 (97) 90 (129) 109 (150) 138 (170) 48 hours 94 (120) 122 (160) 156 (186) 204 (211) 72 hours 105 (133) 132 (177) 169 (206) 226 (234)
Monthly Statistics (mm)
Jan Feb Mar Apr May Jun Jul Aug Sep Oct Nov Dec Ann Min 3 28 26 22 46 76 30 65 37 27 39 12 409
Median 76 79 76 114 108 140 126 123 103 105 90 95 1234
Mean 77 101 90 119 127 137 156 116 100 111 102 121 1356
Max 175 312 205 251 306 206 376 185 184 224 233 294 2949
Annual Summary
Year Total (mm) Rain Days Year Total (mm) Rain Days Year Total (mm) Rain Days 1982 1990 1998 1285 93 1983 1991 1999 1218 105 1984 1992 1244 93 2000 1285 109 1985 1993 997 86 2001 1852 123 1986 1994 1303 107 2002 Incomplete Record 1987 1995 Incomplete Record 2003 Incomplete Record 1988 1996 Incomplete Record 2004 1727 104 1989 1997 1099 91 2005 1312 103

Environment Bay of Plenty 109
Environment Bay of Plenty Manual Rainfall Recording Station
Raingauge Scott, W Location Ohakana Island
Site Number 779004 Grid Reference W15: 679 494
Recorder Type Manual Altitude 10 metres
Start of Record October 1983 Data Capture Rate 99 %
Data Summary From January 1984 To December 2005
Data Audited From October 1983 To December 2005 General Comments Site is operated by Environment Bay of Plenty as part of its Natural Environment Regional Monitoring Network.
Gauge is read daily at 0900.
SITE LOCATION Scott, W at Ohakana Island

110 Environmental Publication 2007/06
Environment Bay of Plenty Manual Rainfall Summary
Date Complied December 2006 Site Number 779004 Compiled by Charl Naude Raingauge Scott, W Metric Map Reference W15: 679 494 Location Ohakana Island Altitude 10 metres Catchment Ohiwa Harbour Period of Summary 1984 to 2005
Rainfall Totals (mm) Mean Annual Rainfall 1254 Mean Summer Rainfall 297 Summer Rainfall as % of Annual 24 Mean Autumn Rainfall 288 Autumn Rainfall as % of Annual 23 Mean Winter Rainfall 378 Max 24 hr fall (on 17/07/2004) 151 Winter Rainfall as % of Annual 30 Max 48 hr fall (on 16/07/2004) 243 Mean Spring Rainfall 290 Max 72 hr fall (on 15/07/2004) 272 Spring Rainfall as % of Annual 23
Rainfall Intensities (mm) (Depth-Duration Frequency) EV1 Probability Weighted Moments (HIRDS Ver 1.50b)
Return Period (years) 2 5 10 20 50 100 Duration 24 hours 85 (102) 108 (136) 126 (158) 142 (179) 48 hours 104 (126) 134 (168) 160 (196) 188 (223) 72 hours 111 (140) 139 (187) 167 (217) 199 (247)
Monthly Statistics (mm)
Jan Feb Mar Apr May Jun Jul Aug Sep Oct Nov Dec Ann Min 5 23 18 22 18 53 21 51 30 25 40 9 315 Median 94 75 87 88 96 122 122 101 75 95 72 90 1117 Mean 88 96 94 92 101 124 134 118 92 107 92 116 1254 Max 232 325 246 198 321 254 333 306 165 235 189 323 3127
Annual Summary Year Total (mm) Rain Days Year Total (mm) Rain Days Year Total (mm) Rain Days 1982 1990 1167 94 1998 1130 95 1983 1991 1037 47 1999 1222 94 1984 1391 123 1992 1403 78 2000 1088 67 1985 1305 135 1993 860 64 2001 1650 108 1986 1267 113 1994 Incomplete Record 2002 958 100 1987 1033 107 1995 1397 98 2003 1237 127 1988 953 110 1996 1476 91 2004 1554 127 1989 1228 121 1997 1394 74 2005 1357 121

Environment Bay of Plenty 111
Environment Bay of Plenty Manual Rainfall Recording Station
Raingauge Taylor, W A Location Ohope
Site Number 779005 Grid Reference W15: 666 510
Recorder Type Manual Altitude 5 metres
Start of Record January 1978 Data Capture Rate 100 %
Data Summary From January 1978 To December 2005
Data Audited From January 1978 To December 2005 General Comments Site is operated by Environment Bay of Plenty as part of its Natural Environment Regional Monitoring Network.
Gauge is read daily at 0900.
SITE LOCATION Taylor, W A at Ohope

112 Environmental Publication 2007/06
Environment Bay of Plenty Manual Rainfall Summary
Date Complied December 2005 Site Number 779005 Compiled by Charl Naude Raingauge Taylor, W A Metric Map Reference W15: 666 510 Location Ohope Altitude 5 metres Catchment Ohiwa Harbour Period of Summary 1978 to 2005
Rainfall Totals (mm) Mean Annual Rainfall 1283 Mean Summer Rainfall 286 Summer Rainfall as % of Annual 22 Mean Autumn Rainfall 312 Autumn Rainfall as % of Annual 25 Mean Winter Rainfall 385 Max 24 hr fall (on 17/07/2004) 167 Winter Rainfall as % of Annual 30 Max 48 hr fall (on 16/07/2004) 282 Mean Spring Rainfall 300 Max 72 hr fall (on 15/07/2004) 310 Spring Rainfall as % of Annual 23
Rainfall Intensities (mm) (Depth-Duration Frequency) EV1 Probability Weighted Moments (HIRDS Ver 1.50b)
Return Period (years) 2 5 10 20 50 100 Duration 24 hours 82 (97) 106 (129) 125 (150) 142 (170) 162 (197) 48 hours 102 (120) 132 (160) 160 (186) 189 (211) 231 (244) 72 hours 109 (133) 140 (177) 169 (206) 202 (234) 250 (271)
Monthly Statistics (mm)
Jan Feb Mar Apr May Jun Jul Aug Sep Oct Nov Dec Ann Min 5 21 32 22 21 53 21 47 35 25 38 9 329 Median 91 79 101 99 100 135 118 105 87 99 85 86 1184 Mean 82 95 106 103 102 138 135 110 99 106 95 111 1283 Max 232 342 420 227 302 267 380 216 165 221 226 339 3336
Annual Summary Year Total (mm) Rain Days Year Total (mm) Rain Days Year Total (mm) Rain Days 1982 842 123 1990 1178 84 1998 1311 122 1983 1001 117 1991 1155 74 1999 1304 138 1984 1391 123 1992 1497 141 2000 1250 126 1985 1305 125 1993 1016 125 2001 1822 141 1986 1265 112 1994 1378 146 2002 1004 119 1987 1033 107 1995 1576 158 2003 1298 134 1988 944 104 1996 1663 148 2004 1688 140 1989 1248 117 1997 1305 124 2005 1317 131

Environment Bay of Plenty 113
Environment Bay of Plenty Manual Rainfall Recording Station
Raingauge Compton, R Location Ohope Site Number 779102 Grid Reference W15: 7020 4976 Recorder Type Manual Altitude 5 metres Start of Record January 1997 Data Capture Rate 94 % Data Summary From January 1997 To December 2005 Data Audited From January 1997 To December 2005 General Comments Site operated by Environment Bay of Plenty as part of its Natural Environment Regional Monitoring Network.
Gauge is read daily at 0730.
SITE LOCATION Compton, R at Ohope

114 Environmental Publication 2007/06
Environment Bay of Plenty Manual Rainfall Summary
Date Complied December 2006 Site Number 779102 Compiled by Charl Naude Raingauge Compton, R Metric Map Reference W15: 7020 4976 Location Ohope Altitude 5 metres Catchment Ohiwa Harbour Period of Summary 1997 to 2005
Rainfall Totals (mm) Mean Annual Rainfall 1362 Mean Summer Rainfall 300 Summer Rainfall as % of Annual 21 Mean Autumn Rainfall 358 Autumn Rainfall as % of Annual 26 Mean Winter Rainfall 408 Max 24 hr fall (on 18/07/2004) 145 Winter Rainfall as % of Annual 29 Max 48 hr fall (on 17/07/2004) 255 Mean Spring Rainfall 336 Max 72 hr fall (on 16/07/2004) 289 Spring Rainfall as % of Annual 24
Rainfall Intensities (mm) (Depth-Duration Frequency) EV1 Probability Weighted Moments (HIRDS Ver 1.50b)
Return Period (years) 2 5 10 20 50 100 Duration 24 hours 72 (98) 84 (130) 101 (151) 48 hours 100 (121) 129 (161) 168 (188) 72 hours 112 (134) 142 (179) 183 (208)
Monthly Statistics (mm)
Jan Feb Mar Apr May Jun Jul Aug Sep Oct Nov Dec Ann Min 12 28 52 20 53 54 68 56 44 52 46 72 557 Median 116 59 91 90 146 159 125 87 80 109 88 109 1259 Mean 78 73 96 97 140 144 159 96 103 136 104 137 1362 Max 137 185 181 208 310 217 368 138 179 245 223 290 2680
Annual Summary Year Total (mm) Rain Days Year Total (mm) Rain Days Year Total (mm) Rain Days 1982 1990 1998 1338 113 1983 1991 1999 1331 130 1984 1992 2000 Incomplete Record 1985 1993 2001 Incomplete Record 1986 1994 2002 Incomplete Record 1987 1995 2003 Incomplete Record 1988 1996 2004 1734 139 1989 1997 1555 118 2005 1303 127
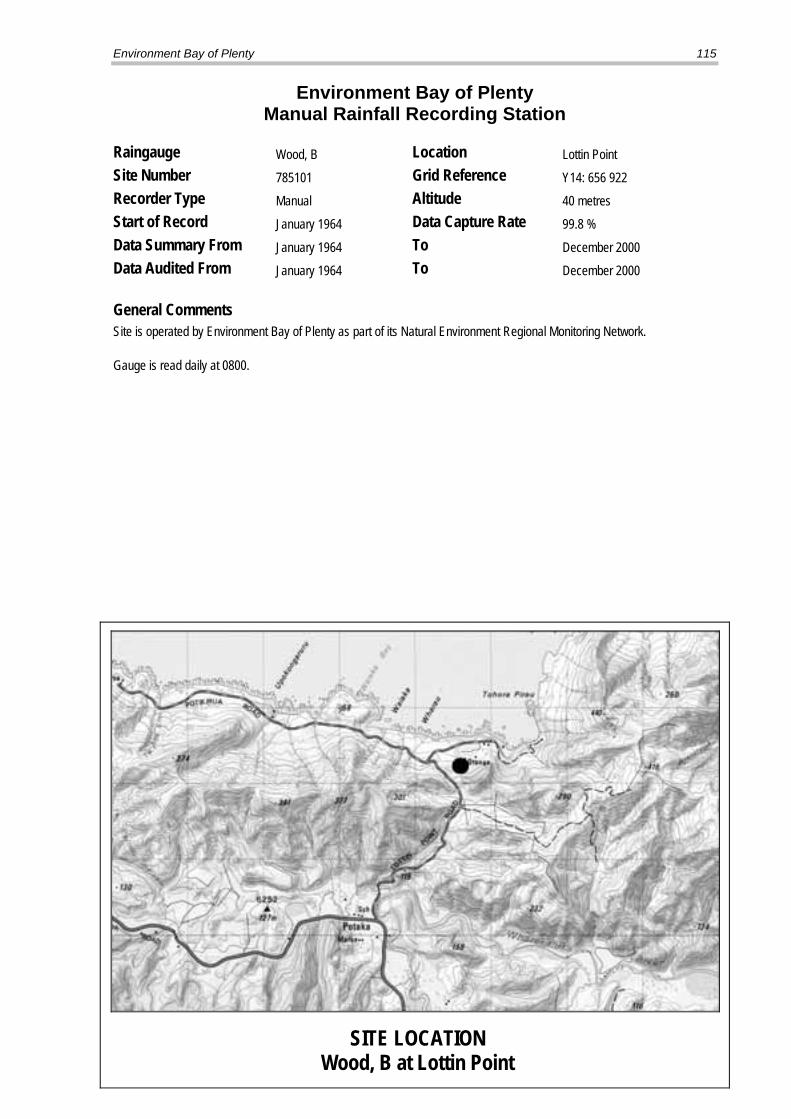
Environment Bay of Plenty 115
Environment Bay of Plenty Manual Rainfall Recording Station
Raingauge Wood, B Location Lottin Point Site Number 785101 Grid Reference Y14: 656 922 Recorder Type Manual Altitude 40 metres Start of Record January 1964 Data Capture Rate 99.8 % Data Summary From January 1964 To December 2000 Data Audited From January 1964 To December 2000 General Comments Site is operated by Environment Bay of Plenty as part of its Natural Environment Regional Monitoring Network.
Gauge is read daily at 0800.
SITE LOCATION Wood, B at Lottin Point

116 Environmental Publication 2007/06
Environment Bay of Plenty Manual Rainfall Summary
Date Complied December 2005 Site Number 785101 Compiled by Charl Naude Raingauge Wood, B Metric Map Reference Y14: 656 922 Location Lottin Point Altitude 40 metres Catchment Wharekahika Period of Summary 1964 to 2005
Rainfall Totals (mm) Mean Annual Rainfall 1650 Mean Summer Rainfall 318 Summer Rainfall as % of Annual 19 Mean Autumn Rainfall 405 Autumn Rainfall as % of Annual 25 Mean Winter Rainfall 538 Max 24 hr fall (on 07/03/1988) 296 Winter Rainfall as % of Annual 32 Max 48 hr fall (on 07/03/1988) 417 Mean Spring Rainfall 392 Max 72 hr fall (on 06/03/1988) 519 Spring Rainfall as % of Annual 24
Rainfall Intensities (mm) (Depth-Duration Frequency) EV1 Probability Weighted Moments (HIRDS Ver 1.50b)
Return Period (years) 2 5 10 20 50 100 Duration 24 hours 106 137 170 207 269 48 hours 142 187 229 275 342 72 hours 159 207 255 307 392
Monthly Statistics (mm)
Jan Feb Mar Apr May Jun Jul Aug Sep Oct Nov Dec Ann Min 9 0 14 37 35 41 19 31 46 31 33 5 301 Median 101 69 125 114 131 176 173 172 138 102 111 89 1503 Mean 102 113 142 123 138 181 173 178 155 116 118 111 1650 Max 213 463 541 362 290 346 411 422 337 305 328 445 4462
Annual Summary Year Total (mm) Rain Days Year Total (mm) Rain Days Year Total (mm) Rain Days 1982 1404 86 1990 1437 79 1998 1719 108 1983 1298 93 1991 1150 101 1999 1792 108 1984 1748 92 1992 1733 116 2000 1330 120 1985 1524 93 1993 1277 90 2001 1976 129 1986 1563 92 1994 1755 123 2002 1361 115 1987 1837 98 1995 2069 116 2003 2183 133 1988 2026 74 1996 2278 122 2004 2014 125 1989 1757 88 1997 1306 101 2005 1455 117

Environment Bay of Plenty 117
Environment Bay of Plenty Manual Rainfall Recording Station
Raingauge Wright, J H Location Okere Falls Road Site Number 860303 Grid Reference U15: 039 484 Recorder Type Manual Altitude 280 metres Start of Record September 1974 Data Capture Rate 97 % Data Summary From January 1975 To December 2005 Data Audited From September 1974 To December 2005
General Comments Site is operated by Environment Bay of Plenty as part of its Natural Environment Regional Monitoring Network.
Gauge is read daily at 0800.
SITE LOCATION Wright, J H at Okere Falls Road

118 Environmental Publication 2007/06
Environment Bay of Plenty Manual Rainfall Summary
Date Complied December 2006 Site Number 860303 Compiled by Charl Naude Raingauge Wright, J H Metric Map Reference U15: 039 484 Location Okere Falls Road Altitude 280 metres Catchment Kaituna Period of Summary 1975 to 2005
Rainfall Totals (mm) Mean Annual Rainfall 1927 Mean Summer Rainfall 422 Summer Rainfall as % of Annual 22 Mean Autumn Rainfall 460 Autumn Rainfall as % of Annual 24 Mean Winter Rainfall 562 Max 24 hr fall (on 28/02/2004) 199 Winter Rainfall as % of Annual 29 Max 48 hr fall (on 04/11/1999) 268 Mean Spring Rainfall 480 Max 72 hr fall (on 04/11/1999) 327 Spring Rainfall as % of Annual 25
Rainfall Intensities (mm) (Depth-Duration Frequency) EV1 Probability Weighted Moments (HIRDS Ver 1.50b)
Return Period (years) 2 5 10 20 50 100 Duration 24 hours 111 (116) 132 (154) 145 (180) 154 (204) 162 (236) 48 hours 148 (144) 182 (191) 205 (223) 223 (253) 242 (292) 72 hours 168 (159) 214 (212) 249 (247) 278 (281) 310 (324)
Monthly Statistics (mm)
Jan Feb Mar Apr May Jun Jul Aug Sep Oct Nov Dec Ann Min 3 15 18 13 37 89 46 51 67 27 38 37 441 Median 113 125 146 149 149 193 196 166 149 146 119 164 1815 Mean 117 146 148 155 154 193 193 172 160 170 151 168 1927 Max 389 419 502 413 429 390 544 389 305 523 605 355 5263
Annual Summary Year Total (mm) Rain Days Year Total (mm) Rain Days Year Total (mm) Rain Days 1982 1457 151 1990 2051 170 1998 2244 163 1983 2048 174 1991 1737 159 1999 2234 154 1984 1817 177 1992 1814 172 2000 1887 171 1985 2199 187 1993 1328 137 2001 2307 188 1986 1875 176 1994 1788 164 2002 1292 158 1987 1552 151 1995 2681 187 2003 1829 177 1988 2144 183 1996 2030 168 2004 2381 171 1989 2247 196 1997 1558 154 2005 2024 171

Environment Bay of Plenty 119
Environment Bay of Plenty Manual Rainfall Recording Station
Raingauge Wright, A B Location Lake Rotoma
Site Number 860503 Grid Reference V15: 233 438
Recorder Type Manual Altitude 330 metres
Start of Record July 1963 Data Capture Rate 93 %
Data Summary From January 1964 To November 2003
Data Audited From January 1964 To November 2003 General Comments Site was operated by Environment Bay of Plenty as part of its Natural Environment Regional Monitoring Network.
Gauge was read daily at 0800.
No rainfall data collected from December 2003 to November 2004.
Site closed 2 November 2004.
SITE LOCATION Wright, A B at Lake Rotoma
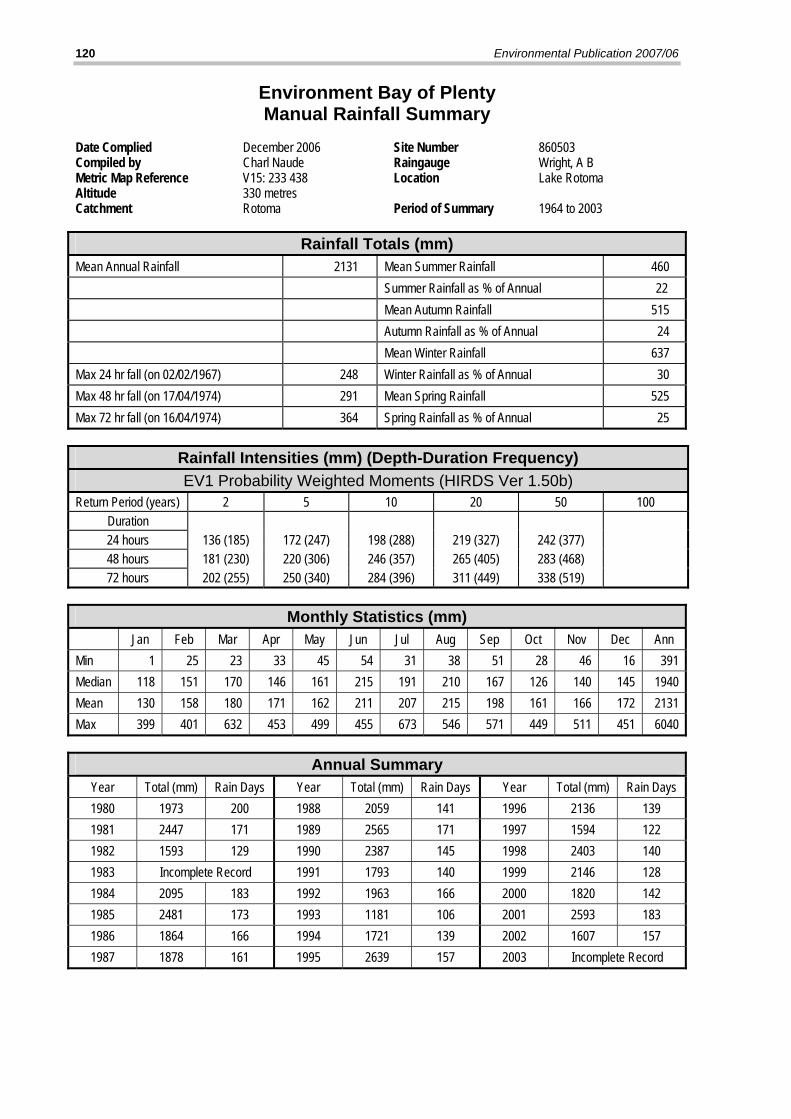
120 Environmental Publication 2007/06
Environment Bay of Plenty Manual Rainfall Summary
Date Complied December 2006 Site Number 860503 Compiled by Charl Naude Raingauge Wright, A B Metric Map Reference V15: 233 438 Location Lake Rotoma Altitude 330 metres Catchment Rotoma Period of Summary 1964 to 2003
Rainfall Totals (mm) Mean Annual Rainfall 2131 Mean Summer Rainfall 460 Summer Rainfall as % of Annual 22 Mean Autumn Rainfall 515 Autumn Rainfall as % of Annual 24 Mean Winter Rainfall 637 Max 24 hr fall (on 02/02/1967) 248 Winter Rainfall as % of Annual 30 Max 48 hr fall (on 17/04/1974) 291 Mean Spring Rainfall 525 Max 72 hr fall (on 16/04/1974) 364 Spring Rainfall as % of Annual 25
Rainfall Intensities (mm) (Depth-Duration Frequency) EV1 Probability Weighted Moments (HIRDS Ver 1.50b)
Return Period (years) 2 5 10 20 50 100 Duration 24 hours 136 (185) 172 (247) 198 (288) 219 (327) 242 (377) 48 hours 181 (230) 220 (306) 246 (357) 265 (405) 283 (468) 72 hours 202 (255) 250 (340) 284 (396) 311 (449) 338 (519)
Monthly Statistics (mm)
Jan Feb Mar Apr May Jun Jul Aug Sep Oct Nov Dec Ann Min 1 25 23 33 45 54 31 38 51 28 46 16 391 Median 118 151 170 146 161 215 191 210 167 126 140 145 1940 Mean 130 158 180 171 162 211 207 215 198 161 166 172 2131 Max 399 401 632 453 499 455 673 546 571 449 511 451 6040
Annual Summary Year Total (mm) Rain Days Year Total (mm) Rain Days Year Total (mm) Rain Days 1980 1973 200 1988 2059 141 1996 2136 139 1981 2447 171 1989 2565 171 1997 1594 122 1982 1593 129 1990 2387 145 1998 2403 140 1983 Incomplete Record 1991 1793 140 1999 2146 128 1984 2095 183 1992 1963 166 2000 1820 142 1985 2481 173 1993 1181 106 2001 2593 183 1986 1864 166 1994 1721 139 2002 1607 157 1987 1878 161 1995 2639 157 2003 Incomplete Record

Environment Bay of Plenty 121
Environment Bay of Plenty Manual Rainfall Recording Station
Raingauge Carter Holt Harvey Tasman Location Kawerau
Site Number 860701 Grid Reference V15:361 409
Recorder Type Manual Altitude 50 metres
Start of Record March 1954 Data Capture Rate 95 %
Data Summary From January 1954 To December 2005
Data Audited From March 1954 To December 2005
General Comments Site is operated by Environment Bay of Plenty as part of its Natural Environment Regional Monitoring Network.
Gauge is read daily at 0700.
SITE LOCATION Carter Holt Harvey Tasman at Kawerau

122 Environmental Publication 2007/06
Environment Bay of Plenty Manual Rainfall Summary
Date Complied July 2006 Site Number 860701 Compiled by G R Ellery Raingauge Carter Holt Harvey Tasman Metric Map Reference V15: 361 409 Location Kawerau Altitude 50 metres Catchment Tarawera Period of Summary 1955 to 2005
Rainfall Totals (mm) Mean Annual Rainfall 172 Mean Summer Rainfall 397 Summer Rainfall as % of Annual 23 Mean Autumn Rainfall 439 Autumn Rainfall as % of Annual 25 Mean Winter Rainfall 491 Max. 24 hr fall (on 13/08/1970) 211 Winter Rainfall as % of Annual 28 Max 48 hr fall (on 13/08/1970) 247 Mean Spring Rainfall 402 Max 72 hr fall (on 260 Spring Rainfall as % of Annual 24
Rainfall Intensities (mm) (Depth-Duration Frequency) EV1 Probability Weighted Moments (HIRDS)
Return Period (years) 2 5 10 20 50 100 Duration 24 hours 108 (156) 132 (208) 152 (242) 171 (275) 196 (317) 48 hours 136 (193) 168 (258) 193 (300) 218 (341) 250 (394) 72 hours 152 (215) 189 (286) 219 (333) 247 (378) 284 (437)
Monthly Quartiles and Extremes (mm)
Jan Feb Mar Apr May Jun Jul Aug Sep Oct Nov Dec Ann Min 1 8 24 7 32 22 38 36 35 13 31 13 949 Mean 108 136 144 136 159 170 161 160 147 145 110 153 1725 Max 348 473 475 342 509 391 379 451 332 465 376 400 2781
Annual Summary Year Total (mm) Rain Days Year Total (mm) Rain Days Year Total (mm) Rain Days 1982 1174 159 1990 1846 207 1998 Incomplete Record 1983 Incomplete Record 1991 1411 200 1999 Incomplete Record 1984 1482 172 1992 1650 194 2000 949 127 1985 Incomplete Record 1993 1039 172 2001 2024 186 1986 Incomplete Record 1994 1381 181 2002 1124 148 1987 1590 185 1995 2488 219 2003 1866 163 1988 1594 205 1996 Incomplete Record 2004 2369 164 1989 2019 212 1997 Incomplete Record 2005 1852 156

Environment Bay of Plenty 123
Environment Bay of Plenty Manual Rainfall Recording Station
Raingauge Wilson, P & S Location Lake Okareka Site Number 861302 Grid Reference U16: 034 310 Recorder Type Manual Altitude 360 metres Start of Record January 1966 Data Capture Rate 91 % Data Summary From January 1966 To December 2005 Data Audited From January 1966 To December 2005 General Comments Site is operated by Environment Bay of Plenty as part of its Natural Environment Regional Monitoring Network.
Rainfall from January 1966 to December 1970 was recorded by Beckett, J S. Gauge was read daily at 0800.
No record exists between December 1970 and March 1973 due to gauge reader leaving.
Rainfall from March 1973 to July 1990 was recorded by Turner, J. Gauge was read daily at 0900.
No record exists between July 1990 and June 1991 due to gauge reader leaving.
Rainfall from June 1991 to July 1996 was recorded by Mercer. Gauge was read daily at 0700.
Rainfall from August 1996 is recorded by Wilson, P & S. Gauge is read daily at 0800.
Rainfall data from 1 January 2005 to 31 March 2005 not used, as suspected to be inaccurate.
For the purposes of Data Summary, all data for this site was converted to be read at theoretical time of 0800.
SITE LOCATION Wilson, P & S at Lake Okareka

124 Environmental Publication 2007/06
Environment Bay of Plenty Manual Rainfall Summary
Date Complied December 2006 Site Number 861302 Compiled by Charl Naude Raingauge Wilson, P & S Metric Map Reference U16: 034 310 Location Lake Okareka Altitude 360 metres Catchment Lake Okareka Period of Summary 1966 to 2005
Rainfall Totals (mm) Mean Annual Rainfall 1529 Mean Summer Rainfall 352 Summer Rainfall as % of Annual 23 Mean Autumn Rainfall 367 Autumn Rainfall as % of Annual 24 Mean Winter Rainfall 439 Max 24 hr fall (on 22/01/1966) 155 Winter Rainfall as % of Annual 29 Max 48 hr fall (on 22/01/1966) 185 Mean Spring Rainfall 372 Max 72 hr fall (on 02/01/1986) 229 Spring Rainfall as % of Annual 24
Rainfall Intensities (mm) (Depth-Duration Frequency) EV1 Probability Weighted Moments (HIRDS Ver 1.50b)
Return Period (years) 2 5 10 20 50 100 Duration 24 hours 80 (121) 101 (162) 120 (188) 139 (214) 166 (247) 48 hours 106 (151) 132 (201) 155 (234) 178 (265) 211 (307) 72 hours 119 (167) 149 (222) 176 (259) 204 (294) 244 (340)
Monthly Statistics (mm)
Jan Feb Mar Apr May Jun Jul Aug Sep Oct Nov Dec Ann Min 10 4 5 31 39 47 17 32 54 8 47 55 349 Median 92 117 103 125 124 155 148 128 130 108 107 142 1479 Mean 98 115 112 122 132 152 143 137 138 122 113 145 1529 Max 336 295 353 274 317 263 290 267 261 332 260 290 3538
Annual Summary Year Total (mm) Rain Days Year Total (mm) Rain Days Year Total (mm) Rain Days 1982 1158 170 1990 Incomplete Record 1998 1489 122 1983 1399 173 1991 Incomplete Record 1999 1552 141 1984 1551 186 1992 1459 206 2000 1492 155 1985 1565 176 1993 1102 165 2001 1680 152 1986 1529 175 1994 1620 200 2002 1374 136 1987 1353 175 1995 2013 237 2003 1459 117 1988 1714 189 1996 Incomplete Record 2004 Incomplete Record 1989 1780 188 1997 1443 118 2005 Incomplete Record

Environment Bay of Plenty 125
Environment Bay of Plenty Manual Rainfall Recording Station
Raingauge Darby, C Location Taneatua Site Number 870005 Grid Reference W15: 614 414 Recorder Type Manual Altitude 15 metres Start of Record May 1961 Data Capture Rate 100 % Data Summary From January 1962 To December 2005 Data Audited From May 1961 To December 2005 General Comments Site is operated by Environment Bay of Plenty as part of its Natural Environment Regional Monitoring Network.
Gauge is read daily at 0900.
SITE LOCATION Darby, C at Taneatua

126 Environmental Publication 2007/06
Environment Bay of Plenty Manual Rainfall Summary
Date Complied December 2006 Site Number 870005 Compiled by Charl Naude Raingauge Darby, C Metric Map Reference W15: 614 414 Location Taneatua Altitude 15 metres Catchment Waimana Period of Summary 1962 to 2005
Rainfall Totals (mm) Mean Annual Rainfall 1610 Mean Summer Rainfall 352 Summer Rainfall as % of Annual 22 Mean Autumn Rainfall 408 Autumn Rainfall as % of Annual 25 Mean Winter Rainfall 477 Max 24 hr fall (on 30/12/2004) 200 Winter Rainfall as % of Annual 30 Max 48 hr fall (on 16/07/2004) 332 Mean Spring Rainfall 375 Max 72 hr fall (on 15/07/2004) 366 Spring Rainfall as % of Annual 23
Rainfall Intensities (mm) (Depth-Duration Frequency) EV1 Probability Weighted Moments (HIRDS Ver 1.50b)
Return Period (years) 2 5 10 20 50 100 Duration 24 hours 108 (121) 131 (161) 148 (188) 163 (213) 180 (247) 48 hours 141 (150) 172 (200) 198 (233) 224 (265) 258 (306) 72 hours 154 (167) 189 (222) 219 (258) 248 (294) 286 (339)
Monthly Statistics (mm)
Jan Feb Mar Apr May Jun Jul Aug Sep Oct Nov Dec Ann Min 2 8 17 17 34 45 18 38 45 23 5 8 260 Median 90 101 117 125 123 160 147 153 120 98 98 113 1443 Mean 99 118 140 131 134 161 159 153 136 123 117 138 1610 Max 260 337 553 316 324 302 447 414 295 343 378 331 4298
Annual Summary Year Total (mm) Rain Days Year Total (mm) Rain Days Year Total (mm) Rain Days 1982 1053 97 1990 1321 96 1998 1874 111 1983 1306 115 1991 1323 114 1999 1770 90 1984 1343 127 1992 1670 126 2000 1455 90 1985 1728 124 1993 989 121 2001 2240 135 1986 1385 111 1994 1427 109 2002 1128 101 1987 1160 107 1995 1986 132 2003 1852 119 1988 1421 121 1996 1894 121 2004 2412 135 1989 1363 120 1997 1549 110 2005 1444 111

Environment Bay of Plenty 127
Environment Bay of Plenty Manual Rainfall Recording Station
Raingauge Hall, A R Location Waimana Gorge Site Number 870006 NZMS 260 Reference W16: 639 379 Recorder Type Manual Altitude 25 metres Start of Record May 1979 Data Capture Rate 100% Data Summary From January 1980 To February 2000 Data Audited From May 1979 To February 2000 General Comments
Site is operated by Environment Bay of Plenty as part of its Natural Environment Regional Monitoring Network. Gauge was read daily at 0730. Site closed in February 2000.
SITE LOCATION Hall, A R at Waimana Gorge

128 Environmental Publication 2007/06
Environment Bay of Plenty Manual Rainfall Summary
Date Compiled April 2001 Site Number 870006 Compiled by Shane Iremonger Raingauge Hall, A R NZMS 260 Reference W16: 639 379 Location Waimana Gorge Altitude 25 metres Catchment Waimana Period of Summary 1980 to 2000
Rainfall Totals (mm) Mean Annual Rainfall 1783 Mean Summer Rainfall 386 Summer Rainfall as % of Annual 21 Mean Autumn Rainfall 406 Autumn Rainfall as % of Annual 23 Mean Winter Rainfall 532 Max. 24 hr. fall (on 25/01/1986) 177 Winter Rainfall as % of Annual 30 Max. 48 hr. fall (on 09/12/1983) 196 Mean Spring Rainfall 459 Max. 72 hr. fall (on 08/12/1983) 244 Spring Rainfall as % of Annual 26
Rainfall Intensities (mm) Depth-Duration Frequency EV1 Probability Weighted Moments (HIRDS)
Return Period (years) 2 5 10 20 50 100 Duration 24 hours 118 (124) 152 (166) 174 (193) 176 (219) 48 hours 148 (154) 190 (205) 217 (239) 243 (272) 72 hours 162 (171) 204 (228) 231 (265) 258 (301)
Monthly Statistics (mm) Jan Feb Mar Apr May Jun Jul Aug Sep Oct Nov Dec Ann. Min. 14 15 51 39 34 69 20 37 40 21 50 11 1223 Median 126 109 121 139 113 175 160 133 147 120 144 124 1821 Mean 125 107 144 144 118 191 178 163 154 143 162 154 1783 Max. 321 250 305 345 221 320 495 369 305 380 370 390 2247
Annual Summary Year Total (mm) Rain Days Year Total (mm) Rain Days Year Total (mm) Rain Days 1980 1604 176 1988 2072 149 1996 1974 114 1981 2088 177 1989 1729 130 1997 1504 125 1982 1263 105 1990 1885 140 1998 1998 113 1983 1865 130 1991 1653 126 1999 1798 114 1984 1664 159 1992 1885 125 2000 Incomplete Record 1985 2214 128 1993 1223 105 2001 1986 1844 118 1994 1714 136 2002 1987 1566 122 1995 2247 168 2003

Environment Bay of Plenty 129
Environment Bay of Plenty Manual Rainfall Recording Station
Raingauge DeWit, C Location Otara Road
Site Number 870304 Grid Reference X16: 932 375
Recorder Type Manual Altitude 60 metres
Start of Record November 1979 Data Capture Rate 97 %
Data Summary From January 1981 To March 2002
Data Audited From November 1979 To March 2002
General Comments Site is operated by Environment Bay of Plenty as part of its Natural Environment Regional Monitoring Network.
Rainfall from November 1979 to May 2000 was recorded by Brown, M. Gauge read daily at 0800.
Rainfall from June 2000 to August 2000 was recorded by DeWit, C. Gauge read daily at 0800.
Site closed in August 2000.
Site reopened September 2000. Rainfall recorded by Edwardson, T until 31 May 2002.
Rainfall data from 1 April 2002 to 31 May 2002 not used, as suspected to be inaccurate.
Site closed 1 June 2002.
SITE LOCATION DeWit, C at Otara Road

130 Environmental Publication 2007/06
Environment Bay of Plenty Manual Rainfall Summary
Date Complied December 2006 Site Number 870304 Compiled by Charl Naude Raingauge DeWit, C Metric Map Reference X16: 932 375 Location Otara Road Altitude 60 metres Catchment Otara Period of Summary 1980 to 2002
Rainfall Totals (mm) Mean Annual Rainfall 1876 Mean Summer Rainfall 396 Summer Rainfall as % of Annual 21 Mean Autumn Rainfall 445 Autumn Rainfall as % of Annual 24 Mean Winter Rainfall 547 Max 24 hr fall (on 21/04/1985) 195 Winter Rainfall as % of Annual 29 Max 48 hr fall (on 20/04/1985) 233 Mean Spring Rainfall 480 Max 72 hr fall (on 09/07/1998) 241 Spring Rainfall as % of Annual 26
Rainfall Intensities (mm) (Depth-Duration Frequency) EV1 Probability Weighted Moments (HIRDS Ver 1.50b)
Return Period (years) 2 5 10 20 50 100 Duration 24 hours 120 (148) 145 (197) 161 (230) 174 (261) 48 hours 156 (184) 186 (244) 207 (285) 225 (323) 72 hours 169 (204) 198 (271) 218 (316) 235 (359)
Monthly Statistics (mm)
Jan Feb Mar Apr May Jun Jul Aug Sep Oct Nov Dec Ann Min 9 23 37 34 0 87 14 62 69 63 69 31 497 Median 118 111 118 176 130 198 166 180 166 159 132 150 1805 Mean 125 114 144 160 136 191 167 186 156 157 170 169 1876 Max 345 245 330 362 283 384 457 380 304 294 357 385 4125
Annual Summary Year Total (mm) Rain Days Year Total (mm) Rain Days Year Total (mm) Rain Days 1979 Incomplete Record 1987 1781 117 1995 2376 155 1980 Incomplete Record 1988 1546 114 1996 2194 125 1981 Incomplete Record 1989 2042 129 1997 1733 110 1982 1415 118 1990 2088 135 1998 2004 113 1983 1757 109 1991 1956 141 1999 126 1984 1785 105 1992 1980 137 2000 Incomplete Record 1985 1781 96 1993 1183 119 2001 1772 109 1986 2128 120 1994 1808 133 2002 Incomplete Record

Environment Bay of Plenty 131
Environment Bay of Plenty Manual Rainfall Recording Station
Raingauge Savage, I F Location Waimana
Site Number 871102 Grid Reference W16: 705 302
Recorder Type Manual Altitude 70 metres
Start of Record January 1972 Data Capture Rate 100 %
Data Summary From January 1972 To December 2005
Data Audited From January 1972 To December 2005 General Comments Site operated by Environment Bay of Plenty as part of its Natural Environment Regional Monitoring Network.
Gauge is read daily at 0800.
SITE LOCATION Savage, I F at Waimana

132 Environmental Publication 2007/06
Environment Bay of Plenty Manual Rainfall Summary
Date Complied December 2006 Site Number 871102 Compiled by Charl Naude Raingauge Savage, I F Metric Map Reference W16: 705 302 Location Waimana Altitude 70 metres Catchment Waimana Period of Summary 1972 to 2005
Rainfall Totals (mm) Mean Annual Rainfall 1584 Mean Summer Rainfall 349 Summer Rainfall as % of Annual 22 Mean Autumn Rainfall 389 Autumn Rainfall as % of Annual 25 Mean Winter Rainfall 453 Max 24 hr fall (on 18/07/2004) 163 Winter Rainfall as % of Annual 29 Max 48 hr fall (on 17/07/2004) 280 Mean Spring Rainfall 395 Max 72 hr fall (on 16/07/2004) 323 Spring Rainfall as % of Annual 25
Rainfall Intensities (mm) (Depth-Duration Frequency) EV1 Probability Weighted Moments (HIRDS Ver 1.50b)
Return Period (years) 2 5 10 20 50 100 Duration 24 hours 110 (123) 132 (164) 147 (191) 158 (216) 170 (250) 48 hours 133 (152) 166 (203) 194 (236) 222 (268) 258 (310) 72 hours 143 (169) 177 (225) 208 (262) 242 (298) 292 (344)
Monthly Statistics (mm)
Jan Feb Mar Apr May Jun Jul Aug Sep Oct Nov Dec Ann Min 6 15 44 30 33 63 12 34 45 19 29 27 357 Median 105 83 106 134 121 153 147 145 131 122 101 106 1454 Mean 105 108 130 136 121 153 153 143 133 134 130 138 1584 Max 287 444 444 351 270 298 495 318 269 328 410 328 4242
Annual Summary Year Total (mm) Rain Days Year Total (mm) Rain Days Year Total (mm) Rain Days 1982 1328 127 1990 1702 131 1998 1859 137 1983 1496 124 1991 1614 143 1999 1874 151 1984 1415 122 1992 1466 130 2000 1459 147 1985 1499 131 1993 1025 116 2001 2244 151 1986 1607 127 1994 1521 124 2002 1285 126 1987 1425 121 1995 2167 163 2003 1662 146 1988 1400 130 1996 1849 132 2004 2162 122 1989 1672 131 1997 1491 122 2005 1202 97

Environment Bay of Plenty 133
3.4 Automatic Rainfall Data Summaries
The automatic rainfall data summaries in this chapter are provided in the following sequences of 2 pages per station:
Page 1 Provides general information regarding the station, such as its location, instrument types, start of record, etc.
Page 2 Displays the data summary information. Within each summary additional rainfall depths have been included for a range of durations. The software package used to determine these values is the High Intensity Rainfall Design System (HIRDS) version 1.50b. This software has been written by the Climate Analysis and Application section of the National Institute of Water and Atmospheric Research Ltd. The application was written to provide estimates of rainfall depth and their standard errors which are calculated for a range of average reoccurrence intervals and storm durations for defined locations. For further information see Thompson (1993).
The ID No. in Table 3.4 indicates the order in which individual station data summaries are provided in this report.
Table 3.4 Automatic Rainfall Monitoring Stations
ID Number
Page No.
Raingauge Location Period of Audit
Data Capture Rate (%)
1 129 Tuapiro Woodlands Rd. 1994-2005 98 2 131 Waipapa Goodalls Rd. 1992-2005 99 3 133 Te Puna Stannett 1991-2005 100 4 135 Kaituna Te Matai 1990-2005 99 5 137 Mangorewa Mangorewa 1986-2005 91 6 139 Mangorewa Kaharoa 1986-2005 99 7 141 Kaituna Whakarewarewa 1900-2005 100 8 143 Pongakawa Pongakawa 1997-2005 100 9 145 Ohinekoao Herepuru Rd. 2002-2005 100
10 147 Tumurau Lagoon 2002-2005 100 11 149 Tarawera Awakaponga 1990-2005 98 12 151 Rangitaiki Thornton 1990-2005 100 13 153 Rangitaiki Te Teko 1990-2005 100 14 155 Rangitaiki Kokomoka 1996-2005 100 15 157 Whakatane Tarapounamu 1990-2005 100 16 159 Whakatane Huitieke 1979-2005 94 17 161 Whakatane Huiarau Summit 1976-2005 99 18 163 Waimana Ranger Station 1997-2005 100 19 165 Waimana Olgilvie Bridge 1989-2005 89 20 167 Otara Town Wharf 1997-2005 93 21 169 Waioeka Gorge Mouth 1990-2005 100 22 171 Waioeka Cableway 1990-2005 99 23 173 Waioeka Koranga 1980-2005 81 24 175 Otara Browns Bridge 1990-2005 100 25 177 Otara Tutaetoko 1990-2005. 97 26 179 Pakihi Pakihi Station 1976-2005 86 27 181 Pakihi Rakanui Link 1992-2005 99 28 183 Haparapara Haparapara 1997-2005 100


Environment Bay of Plenty 135


Environment Bay of Plenty 137
Environment Bay of Plenty Automatic Rainfall Recording Station
Raingauge Tuapiro Location Woodlands Road Site Number 755811 Grid Reference T13: 661 057 Recorder Type Tipping Bucket Altitude 30 metres Start of Record Data Capture Rate 98% Data Summary From January 1994 To December 2005 Data Audited From May 1993 To December 2005
General Comments Site is operated by Environment Bay of Plenty as part of its Natural Environment Regional Monitoring Network.
OTA tipping bucket shifted from top of aerial pole down to ground-level after recorder was destroyed during Cyclone Fergus.
Periods of missing or synthetic record may occur in this dataset. Users are advised to contact the recording authority for further details.
SITE LOCATION Tuapiro at Woodlands Road

138 Environmental Publication 2007/06
Environment Bay of Plenty Automatic Rainfall Summary
Date Complied November 2006 Site Number 755811 Compiled by G R Ellery Raingauge Tuapiro Metric Map Reference T13: 661 057 Location Woodlands Road Altitude 30 metres Catchment Tauranga Harbour Period of Summary 1994 to 2005
Rainfall Totals (mm) Mean Annual Rainfall 1892 Mean Summer Rainfall 418 Summer Rainfall as % of Annual 22 Mean Autumn Rainfall 481 Max. 1 hr fall (on 25/03/2005) 75 Autumn Rainfall as % of Annual 25 Max. 12 hr fall (on 30/12/1996) 157 Mean Winter Rainfall 559 Max. 24 hr fall (on 3/12/1998) 189 Winter Rainfall as % of Annual 30 Max 48 hr fall (on 11/02/2001) 216 Mean Spring Rainfall 455 Max 72 hr fall (on 11/02/2001) 223 Spring Rainfall as % of Annual 24
Rainfall Intensities (mm) (Depth-Duration Frequency) EV1 Probability Weighted Moments (HIRDS Ver 1.50b)
Return Period (years) 2 5 10 20 50 100 Duration 1 hour 31 (34) 39 (48) 48 (56) 58 (64)
12 hours 105 (108) 128 (143) 147 (167) 164 (190) 24 hours 140 (146) 170 (194) 191 (226) 207 (257) 48 hours 173 (181) 198 (240) 211 (280) 219 (318) 72 hours 180 (200) 206 (267) 220 (311) 229 (353)
Monthly Statistics (mm)
Jan Feb Mar Apr May Jun Jul Aug Sep Oct Nov Dec Ann Min 25 22 10 32 84 77 68 92 68 74 48 25 625 Median 120 124 99 185 138 171 253 122 138 147 125 124 1746 Mean 111 166 134 188 156 167 232 156 155 145 156 148 1914 Max 211 470 300 435 296 251 431 287 336 231 358 359 3965
Annual Summary Year Total (mm) Rain Days Year Total (mm) Rain Days Year Total (mm) Rain Days 1982 1990 1998 2128 141 1983 1991 1999 1648 148 1984 1992 2000 Incomplete Record 1985 1993 2001 2007 198 1986 1994 1974 165 2002 1480 171 1987 1995 2266 191 2003 1790 182 1988 1996 Incomplete Record 2004 1840 178 1989 1997 Incomplete Record 2005 1888 183

Environment Bay of Plenty 139
Environment Bay of Plenty Automatic Rainfall Recording Station
Raingauge Waipapa Location Goodall Road. Site Number 757901 Grid Reference U14:737 824 Recorder Type Tipping bucket Altitude 240 metres Start of Record November 1991 Data Capture Rate 99% Data Summary From January 1992 To December 2005 Data Audited From November 1991 To December 2005 General Comments OTA tipping bucket installed on roof of water tower by NIWA, Rotorua on 7 November 1991. Site was handed back from NIWA on 1 July 1992 and is now operated by Environment Bay of Plenty as part of its Natural Environment Regional Monitoring Network. Periods of missing or synthetic record may occur in this dataset. Users are advised to contact the recording authority for further details.
SITE LOCATION Waipapa at Goodall Road

140 Environmental Publication 2007/06
Environment Bay of Plenty Automatic Rainfall Summary
Date Complied G R Ellery Site Number 757901 Compiled by November 2006 Raingauge Waipapa Metric Map Reference U14: 737 824 Location Goodall Road. Altitude 240 metres Catchment Tauranga Harbour Period of Summary 1992 to 2005
Rainfall Totals (mm) Mean Annual Rainfall 2048 Mean Summer Rainfall 460 Summer Rainfall as % of Annual 22 Mean Autumn Rainfall 545 Max. 1 hr fall (on 29/04/2004) 55 Autumn Rainfall as % of Annual 27 Max. 12 hr fall (on 30/04/1999) 149 Mean Winter Rainfall 598 Max. 24 hr fall (on 28/04/2004) 188 Winter Rainfall as % of Annual 29 Max 48 hr fall (on 27/04/2004) 247 Mean Spring Rainfall 499 Max 72 hr fall (on 26/04/2004) 248 Spring Rainfall as % of Annual 24
Rainfall Intensities (mm) (Depth-Duration Frequency) EV1 Probability Weighted Moments (HIRDS Ver 1.50b)
Return Period (years) 2 5 10 20 50 100 Duration 1 hour 33 (43) 42 (59) 50 (70) 58 (80)
12 hours 97 (128) 118 (171) 134 (199) 151 (226) 24 hours 133 (166) 156 (221) 174 (257) 191 (292) 48 hours 167 (205) 202 (274) 228 (319) 252 (362) 72 hours 181 (228) 213 (303) 236 (353) 257 (401)
Monthly Statistics (mm)
Jan Feb Mar Apr May Jun Jul Aug Sep Oct Nov Dec Ann Min 25 18 14 28 119 88 60 95 84 76 58 30 695 Median 129 149 134 177 177 215 243 169 170 189 124 172 2048 Mean 114 170 134 205 203 204 216 173 171 182 146 183 2101 Max 244 474 341 460 359 309 477 281 319 341 462 458 4525
Annual Summary Year Total (mm) Rain Days Year Total (mm) Rain Days Year Total (mm) Rain Days 1982 1990 1998 2324 164 1983 1991 1999 2102 165 1984 1992 Incomplete Record 2000 1909 170 1985 1993 1560 158 2001 2473 187 1986 1994 1937 189 2002 1676 174 1987 1995 Incomplete Record 2003 2135 183 1988 1996 Incomplete Record 2004 2426 181 1989 1997 1716 166 2005 2275 170

Environment Bay of Plenty 141
Environment Bay of Plenty Automatic Rainfall Recording Station
Raingauge Te Puna Location Stannett Site Number 766002 Grid Reference U14:792 890 Recorder Type Tipping bucket Altitude 10 metres Start of Record September 1990 Data Capture Rate 100% Data Summary From January 1991 To December 2005 Data Audited From September 1990 To December 2005 General Comments
Site is operated by Environment Bay of Plenty as part of its Natural Environment Regional Monitoring Network. OTA tipping bucket is located on the roof of the groundwater recorder hut. Periods of missing or synthetic record may occur in this dataset. Users are advised to contact the recording authority for further details.
SITE LOCATION Te Puna at Stannett

142 Environmental Publication 2007/06
Environment Bay of Plenty Automatic Rainfall Summary
Date Complied November 2006 Site Number 766002 Compiled by G R Ellery Raingauge Te Puna Metric Map Reference U14:792 890 Location Stannett Altitude 10 metres Catchment Tauranga Harbour Period of Summary 1991 to 2005
Rainfall Totals (mm) Mean Annual Rainfall 1330 Mean Summer Rainfall 300 Summer Rainfall as % of Annual 23 Mean Autumn Rainfall 355 Max. 1 hr fall (on 29/04/2004) 51 Autumn Rainfall as % of Annual 27 Max. 12 hr fall (on 9/04/2000) 133 Mean Winter Rainfall 381 Max. 24 hr fall (on 28/04/2004) 153 Winter Rainfall as % of Annual 29 Max 48 hr fall (on 27/04/2004) 202 Mean Spring Rainfall 292 Max 72 hr fall (on 26/04/2004]) 208 Spring Rainfall as % of Annual 22
Rainfall Intensities (mm) (Depth-Duration Frequency) EV1 Probability Weighted Moments (HIRDS Ver 1.50b)
Return Period (years) 2 5 10 20 50 100 Duration 1 hour 32 (33) 40 (45) 45 (54) 50 (62)
12 hours 83 (98) 102 (130) 115 (152) 126 (172) 24 hours 101 (126) 123 (168) 139 (195) 153 (222) 48 hours 120 (156) 147 (208) 166 (242) 182 (275) 72 hours 124 (173) 153 (231) 175 (269) 195 (305)
Monthly Statistics (mm)
Jan Feb Mar Apr May Jun Jul Aug Sep Oct Nov Dec Ann Min 27 18 16 37 34 31 45 63 39 25 39 12 386 Median 78 111 74 132 96 128 154 100 104 86 79 102 1244 Mean 77 118 91 144 119 123 149 105 107 97 90 112 1332 Max 146 282 202 323 286 187 321 204 208 224 227 260 2870
Annual Summary Year Total (mm) Rain Days Year Total (mm) Rain Days Year Total (mm) Rain Days 1982 1990 1998 1417 128 1983 1991 1138 141 1999 1186 127 1984 1992 1428 140 2000 1224 130 1985 1993 883 128 2001 1499 161 1986 1994 1355 149 2002 976 159 1987 1995 1679 165 2003 1394 166 1988 1996 1631 152 2004 1547 166 1989 1997 1082 130 2005 1508 156

Environment Bay of Plenty 143
Environment Bay of Plenty Automatic Rainfall Recording Station
Raingauge Kaituna Location Te Matai Site Number 768301 Grid Reference U14:060 736 Recorder Type Tipping Bucket Altitude 10 metres Start of Record July 1989 Data Capture Rate 99% Data Summary From January 1990 To December 2005 Data Audited From July 1989 To December 2005
General Comments Site is operated by Environment Bay of Plenty as part of its Natural Environment Regional Monitoring Network.
From July 1989 to March 1990 rainfall was stored by a Jepsen Slave at varying intervals, commonly 4 hours. Jepsen Slave was replaced by an Aquitel Remote on 21 March 1990, recording at 15 minute intervals. OTA tipping bucket is installed on the roof of the water recorder tower.
Periods of missing or synthetic record may occur in this dataset. Users are advised to contact the recording authority for further details.
SITE LOCATION Kaituna at Te Matai

144 Environmental Publication 2007/06
Environment Bay of Plenty Automatic Rainfall Summary
Date Complied November 2006 Site Number 768301 Compiled by G R Ellery Raingauge Kaituna Metric Map Reference U14: 060 736 Location Te Matai Altitude 10 metres Catchment Kaituna Period of Summary 1990 to 2005
Rainfall Totals (mm) Mean Annual Rainfall 1313 Mean Summer Rainfall 256 Summer Rainfall as % of Annual 19 Mean Autumn Rainfall 365 Max. 1 hr fall (on 27/06/1990) 69 Autumn Rainfall as % of Annual 28 Max. 12 hr fall (on 27/06/1990) 181 Mean Winter Rainfall 421 Max. 24 hr fall (on 17/05/2005) 231 Winter Rainfall as % of Annual 32 Max 48 hr fall (on 17/05/2005) 260 Mean Spring Rainfall 291 Max 72 hr fall (on 15/05/2005) 289 Spring Rainfall as % of Annual 22
Rainfall Intensities (mm) (Depth-Duration Frequency) EV1 Probability Weighted Moments (HIRDS Ver 1.50b)
Return Period (years) 2 5 10 20 50 100 Duration 1 hour 31 (29) 40 (40) 48 (48) 59 (55)
12 hours 90 (92) 117 (122) 141 (142) 166 (162) 24 hours 108 (119) 137 (158) 164 (184) 195 (209) 48 hours 121 (147) 145 (196) 172 (229) 206 (260) 72 hours 129 (163) 158 (218) 190 (253) 228 (288)
Monthly Statistics (mm)
Jan Feb Mar Apr May Jun Jul Aug Sep Oct Nov Dec Ann Min 24 14 9 32 31 35 41 50 44 39 28 13 360 Median 73 74 93 143 91 125 151 107 85 89 69 92 1193 Mean 73 89 100 144 120 132 164 122 100 109 82 98 1332 Max 179 247 200 407 417 269 344 319 212 262 188 266 3310
Annual Summary Year Total (mm) Rain Days Year Total (mm) Rain Days Year Total (mm) Rain Days 1982 1990 Incomplete Record 1998 1236 109 1983 1991 1281 150 1999 1005 117 1984 1992 1465 138 2000 1219 127 1985 1993 928 132 2001 1551 145 1986 1994 1440 158 2002 930 126 1987 1995 1928 168 2003 1200 129 1988 1996 1367 146 2004 1444 145 1989 1997 1190 119 2005 1508 133

Environment Bay of Plenty 145
Environment Bay of Plenty Automatic Rainfall Recording Station
Raingauge Mangorewa Location Mangorewa Site Number 768310 Grid Reference U15:043 633 Recorder Type Tipping bucket Altitude 100 metres Start of Record September 1985 Data Capture Rate 91% Data Summary From January 1986 To December 2005 Data Audited From September 1985 To December 2005
General Comments Site is operated by Environment Bay of Plenty as part of its Natural Environment Regional Monitoring Network.
Rainfall from September 1985 to September 1987 was from a manual gauge read daily at 0700. Rainfall from September 1987 to November 1990 was stored by a Jepsen Slave at varying intervals, commonly 4 hours. Jepsen Slave was replaced by a data logger on 22 November 1990, recording at 15 minute intervals. OTA tipping bucket is installed on the roof of the radio hut on the hill above the Mangorewa water recorder site.
Periods of missing or synthetic record may occur in this dataset. Users are advised to contact the recording authority for further details.
SITE LOCATION Mangorewa at Mangorewa

146 Environmental Publication 2007/06
Environment Bay of Plenty Automatic Rainfall Summary
Date Complied November 2006 Site Number 768310 Compiled by G R Ellery Raingauge Mangorewa Metric Map Reference U15: 043 633 Location Mangorewa Altitude 100 metres Catchment Mangorewa Period of Summary 1986 to 2005
Rainfall Totals (mm) Mean Annual Rainfall 1814 Mean Summer Rainfall 355 Summer Rainfall as % of Annual 20 Mean Autumn Rainfall 438 Max. 1 hr fall (on 01/05/1999) 74 Autumn Rainfall as % of Annual 24 Max. 12 hr fall (on 01/05/1999) 219 Mean Winter Rainfall 476 Max. 24 hr fall (on 30/04/1999) 276 Winter Rainfall as % of Annual 26 Max 48 hr fall (on 30/04/1999) 283 Mean Spring Rainfall 430 Max 72 hr fall (on 29/04/1999) 283 Spring Rainfall as % of Annual 24
Rainfall Intensities (mm) (Depth-Duration Frequency) EV1 Probability Weighted Moments (HIRDS Ver 1.50b)
Return Period (years) 2 5 10 20 50 100 Duration 1 hour 32 (33) 47 (46) 60 (54) 73 (62)
12 hours 103 (108) 141 (143) 173 (167) 204 (190) 24 hours 137 (141) 180 (188) 214 (219) 245 (249) 48 hours 158 (175) 201 (233) 235 (272) 267 (309) 72 hours 179 (194) 223 (259) 258 (301) 290 (342)
Monthly Statistics (mm)
Jan Feb Mar Apr May Jun Jul Aug Sep Oct Nov Dec Ann Min 7 18 14 15 12 12 63 65 60 44 42 22 374 Median 94 99 103 151 150 143 169 139 146 148 85 97 1524 Mean 93 135 110 162 164 140 182 151 142 158 131 128 1696 Max 181 389 232 400 456 235 519 378 261 303 407 301 4062
Annual Summary Year Total (mm) Rain Days Year Total (mm) Rain Days Year Total (mm) Rain Days 1982 1990 Incomplete Record 1998 1811 123 1983 1991 1345 146 1999 1849 138 1984 1992 Incomplete Record 2000 1571 135 1985 1993 Incomplete Record 2001 2217 152 1986 Incomplete Record 1994 Incomplete Record 2002 1130 130 1987 Incomplete Record 1995 2410 176 2003 1811 146 1988 Incomplete Record 1996 1791 149 2004 2146 144 1989 Incomplete Record 1997 Incomplete Record 2005 1871 148

Environment Bay of Plenty 147
Environment Bay of Plenty Automatic Rainfall Recording Station
Raingauge Mangorewa Location Kaharoa Link Site Number 860205 Grid Reference U15:971 493 Recorder Type Tipping bucket Altitude 420 metres Start of Record September 1985 Data Capture Rate 99% Data Summary From January 1986 To December 2005 Data Audited From September 1985 To December 2005
General Comments Site is operated by Environment Bay of Plenty as part of its Natural Environment Regional Monitoring Network.
Rainfall from September 1985 to July 1987 was from a manual gauge read daily.
Rainfall from July 1987 to September 1992 was measured by an OTA tipping bucket and stored by a Jepsen Slave at varying intervals, commonly 4 hours. Jepsen Slave was replaced by an Aquitel Remote on 3 September 1992, recording at 15 minute intervals. Raingauge moved from original site at the end of Hoko Road, on 14 August 1989. OTA tipping bucket is installed on the roof of the Environment Bay of Plenty radio link hut.
Periods of missing or synthetic record may occur in this dataset. Users are advised to contact the recording authority for further details.
SITE LOCATION Mangorewa at Kaharoa Link
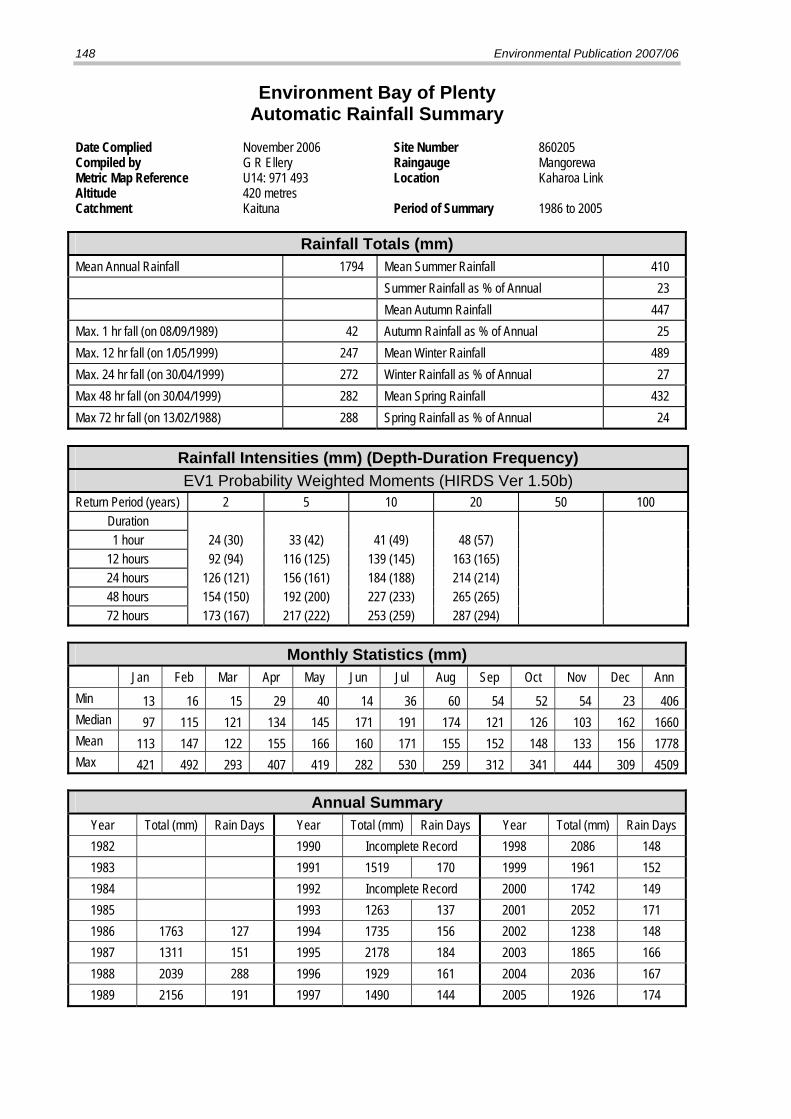
148 Environmental Publication 2007/06
Environment Bay of Plenty Automatic Rainfall Summary
Date Complied November 2006 Site Number 860205 Compiled by G R Ellery Raingauge Mangorewa Metric Map Reference U14: 971 493 Location Kaharoa Link Altitude 420 metres Catchment Kaituna Period of Summary 1986 to 2005
Rainfall Totals (mm) Mean Annual Rainfall 1794 Mean Summer Rainfall 410 Summer Rainfall as % of Annual 23 Mean Autumn Rainfall 447 Max. 1 hr fall (on 08/09/1989) 42 Autumn Rainfall as % of Annual 25 Max. 12 hr fall (on 1/05/1999) 247 Mean Winter Rainfall 489 Max. 24 hr fall (on 30/04/1999) 272 Winter Rainfall as % of Annual 27 Max 48 hr fall (on 30/04/1999) 282 Mean Spring Rainfall 432 Max 72 hr fall (on 13/02/1988) 288 Spring Rainfall as % of Annual 24
Rainfall Intensities (mm) (Depth-Duration Frequency) EV1 Probability Weighted Moments (HIRDS Ver 1.50b)
Return Period (years) 2 5 10 20 50 100 Duration 1 hour 24 (30) 33 (42) 41 (49) 48 (57)
12 hours 92 (94) 116 (125) 139 (145) 163 (165) 24 hours 126 (121) 156 (161) 184 (188) 214 (214) 48 hours 154 (150) 192 (200) 227 (233) 265 (265) 72 hours 173 (167) 217 (222) 253 (259) 287 (294)
Monthly Statistics (mm)
Jan Feb Mar Apr May Jun Jul Aug Sep Oct Nov Dec Ann Min 13 16 15 29 40 14 36 60 54 52 54 23 406 Median 97 115 121 134 145 171 191 174 121 126 103 162 1660 Mean 113 147 122 155 166 160 171 155 152 148 133 156 1778 Max 421 492 293 407 419 282 530 259 312 341 444 309 4509
Annual Summary Year Total (mm) Rain Days Year Total (mm) Rain Days Year Total (mm) Rain Days 1982 1990 Incomplete Record 1998 2086 148 1983 1991 1519 170 1999 1961 152 1984 1992 Incomplete Record 2000 1742 149 1985 1993 1263 137 2001 2052 171 1986 1763 127 1994 1735 156 2002 1238 148 1987 1311 151 1995 2178 184 2003 1865 166 1988 2039 288 1996 1929 161 2004 2036 167 1989 2156 191 1997 1490 144 2005 1926 174

Environment Bay of Plenty 149
Environment Bay of Plenty Automatic Rainfall Recording Station
Raingauge Kaituna Location Whakarewarewa Site Number 861204 Grid Reference U16:959 328 Recorder Type Tipping Bucket Altitude 300 metres Start of Record January 1900 Data Capture Rate 100% Data Summary From January 1900 To December 2005 Data Audited From January 1900 To December 2005 General Comments Periods of missing or synthetic record occur throughout the data set. Users are advised to contact the recording authority for further details.
Meteorological service record discontinued from 820131 240000 to 920908. Data for this period has been derived from nearby raingauges. Between 820131 080000 and 840101 080000 data has been derived from nearby NIWA, Rotorua raingauge (B86128) situated approximately 2.0 kilometres to the north west of Whakarewarewa. The two gauges have been correlated (76 rain days used) with correlation coefficient = 0.916 and standard error = 5mm.
New raingauge installed by Environment Bay of Plenty on 8/09/1992. This gauge was installed approximately 100 metres from the original Whakarewarewa site and is therefore considered an equal replacement for the original station. The new site consists of an OTA tipping bucket raingauge and data logger set to record at 15 minute intervals. A volumetric record of monthly totals is also collected.
SITE LOCATION Kaituna at Whakarewarewa

150 Environmental Publication 2007/06
Environment Bay of Plenty Automatic Rainfall Summary
Date Complied November 2006 Site Number 861204 Compiled by G R Ellery Raingauge Kaituna Metric Map Reference U16: 965 332 Location Whakarewarewa Altitude 300 metres Catchment Kaituna Period of Summary 1900 to 2005
Rainfall Totals (mm) Mean Annual Rainfall 1428 Mean Summer Rainfall 337 Summer Rainfall as % of Annual 23 Mean Autumn Rainfall 354 Max. 1 hr fall (on 6/09/2002) 83 Autumn Rainfall as % of Annual 25 Max. 12 hr fall (on 1/05/1999) 165 Mean Winter Rainfall 396 Max. 24 hr fall (on 1/02/1967) 180 Winter Rainfall as % of Annual 28 Max 48 hr fall (on 1/12/1974) 227 Mean Spring Rainfall 348 Max 72 hr fall (on 15/04/1974) 238 Spring Rainfall as % of Annual 24
Rainfall Intensities (mm) (Depth-Duration Frequency) EV1 Probability Weighted Moments (HIRDS Ver 1.50b)
Return Period (years) 2 5 10 20 50 100 Duration 1 hour 26 (29) 35 (40) 45 (48) 60 (55)
12 hours 70 (90) 92 (119) 116 (139) 144 (158) 24 hours 86 (116) 108 (154) 127 (180) 145 (204) 172 (236) 193 (259) 48 hours 112 (144) 138 (191) 161 (223) 184 (253) 214 (292) 238 (322) 72 hours 127 (149_ 156 (199) 180 (232) 203 (263) 232 (324) 253 (357)
Monthly Statistics (mm)
Jan Feb Mar Apr May Jun Jul Aug Sep Oct Nov Dec Ann Min 1 2 7 13 0 30 14 16 23 24 15 12 157 Median 85 90 95 103 107 137 126 121 105 115 97 111 1292 Mean 102 110 104 118 128 139 128 126 119 124 106 120 1424 Max 345 329 393 494 455 329 363 300 312 330 271 345 4266
Annual Summary Year Total (mm) Rain Days Year Total (mm) Rain Days Year Total (mm) Rain Days 1982 995 214 1990 1525 264 1998 1522 153 1983 1418 197 1991 1273 252 1999 1291 140 1984 1116 160 1992 1406 248 2000 1285 133 1985 1467 202 1993 1076 147 2001 1430 151 1986 1356 234 1994 1379 135 2002 1155 142 1987 1336 210 1995 1791 172 2003 1282 163 1988 1511 237 1996 1548 156 2004 1454 155 1989 1646 280 1997 1369 145 2005 1349 163

Environment Bay of Plenty 151
Environment Bay of Plenty Automatic Rainfall Recording Station
Raingauge Pongakawa Location Pongakawa Site Number 769402 Grid Reference V15: 164 603 Recorder Type Tipping bucket Altitude 55 metres Start of Record 26 June 1996 Data Capture Rate 100% Data Summary From 1 January 1997 To 31 December 2005 Data Audited From 26 June 1996 To 31 December 2005 General Comments
Site is operated by Environment Bay of Plenty as part of its Natural Environment Regional Monitoring Network. Periods of missing or synthetic record may occur in this dataset. Users are advised to contact the recording authority for further details.
SITE LOCATION Pongakawa at Pongakawa

152 Environmental Publication 2007/06
Environment Bay of Plenty Automatic Rainfall Summary
Date Complied November 2006 Site Number 769402 Compiled by G R Ellery Raingauge Pongakawa Metric Map Reference V15: 164 603 Location Pongakawa Altitude 55 metres Catchment Pongakawa Period of Summary 1997 to 2005
Rainfall Totals (mm) Mean Annual Rainfall 1443 Mean Summer Rainfall 294 Summer Rainfall as % of Annual 20 Mean Autumn Rainfall 402 Max. 1 hr fall (on 06/04/2003) 44 Autumn Rainfall as % of Annual 28 Max. 12 hr fall (on 06/04/2003) 146 Mean Winter Rainfall 409 Max. 24 hr fall (on 05/04/2003) 155 Winter Rainfall as % of Annual 28 Max 48 hr fall (on 17/05/2005) 167 Mean Spring Rainfall 338 Max 72 hr fall (on 17/05/2005) 203 Spring Rainfall as % of Annual 23
Rainfall Intensities (mm) (Depth-Duration Frequency) EV1 Probability Weighted Moments (HIRDS Ver 1.50b)
Return Period (years) 2 5 10 20 50 100 Duration 1 hour 34 (33) 40 (45) 44 (53)
12 hours 80 (103) 100 (137) 118 (159) 24 hours 103 (134) 125 (178) 145 (207) 48 hours 137 (166) 157 (221) 169 (257) 72 hours 149 (184) 179 (245) 200 (285)
Monthly Statistics (mm)
Jan Feb Mar Apr May Jun Jul Aug Sep Oct Nov Dec Ann Min 26 0 14 17 52 68 46 43 63 41 30 64 464 Median 69 66 118 153 133 155 142 95 119 136 84 109 1379 Mean 71 97 110 128 161 151 158 97 120 129 89 130 1441 Max 145 302 186 214 339 223 392 157 196 243 184 268 2849
Annual Summary Year Total (mm) Rain Days Year Total (mm) Rain Days Year Total (mm) Rain Days 1982 1990 1998 1504 134 1983 1991 1999 1394 149 1984 1992 2000 1113 135 1985 1993 2001 1775 166 1986 1994 2002 1084 133 1987 1995 2003 1475 143 1988 1996 2004 1807 157 1989 1997 1161 114 2005 1676 158

Environment Bay of Plenty 153
Environment Bay of Plenty Automatic Rainfall Recording Station
Raingauge Ohinekoao Location Harris Saddle Site Number 769705 Grid Reference V15: 362 593 Recorder Type Tipping Bucket Altitude 310 metres Start of Record 4 October 2001 Data Capture Rate 100% Data Summary From 1 January 2002 To 31 December 2005 Data Audited From 4 October 2001 To 31 December 2005 General Comments Site is operated by Environment Bay of Plenty as part of its Natural Environment Regional Monitoring Network.
Periods of missing or synthetic record may occur in this dataset. Users are advised to contact the recording authority for further details.
Note that the data summary is for four years only, so no depth-duration frequency data are provided.
SITE LOCATION Ohinekoao at Harris Saddle

154 Environmental Publication 2007/06
Environment Bay of Plenty Automatic Rainfall Summary
Date Complied November 2006 Site Number 769705 Compiled by G R Ellery Raingauge Ohinekoao Metric Map Reference V15: 362 593 Location Harris Saddle Altitude 310 metres Catchment Period of Summary 2002 to 2005
Rainfall Totals (mm) Mean Annual Rainfall 1617 Mean Summer Rainfall 321 Summer Rainfall as % of Annual 20 Mean Autumn Rainfall 466 Max. 1 hr fall (on 18/05/2005) 44 Autumn Rainfall as % of Annual 29 Max. 12 hr fall (on 18/05/2005) 154 Mean Winter Rainfall 462 Max. 24 hr fall (on 18/05/2005) 262 Winter Rainfall as % of Annual 29 Max 48 hr fall (on 17/05/2005) 316 Mean Spring Rainfall 369 Max 72 hr fall (on 17/05/2005) 349 Spring Rainfall as % of Annual 22
Rainfall Intensities (mm) (Depth-Duration Frequency) EV1 Probability Weighted Moments (HIRDS Ver 1.50b)
Return Period (years) 2 5 10 20 50 100 Duration 1 hour
12 hours 24 hours 48 hours 72 hours
Monthly Statistics (mm)
Jan Feb Mar Apr May Jun Jul Aug Sep Oct Nov Dec Ann Min 0 80 22 25 64 106 49 85 81 61 36 0 609 Median 61 88 134 149 265 195 264 113 121 210 97 88 1785 Mean 60 155 95 132 236 156 196 107 112 175 82 80 1586 Max 141 300 144 220 544 215 329 124 159 271 121 211 2779
Annual Summary Year Total (mm) Rain Days Year Total (mm) Rain Days Year Total (mm) Rain Days 1982 1990 1998 1983 1991 1999 1984 1992 2000 1985 1993 2001 1986 1994 2002 1287 128 1987 1995 2003 1290 140 1988 1996 2004 2043 151 1989 1997 2005 1850 146

Environment Bay of Plenty 155
Environment Bay of Plenty
Automatic Rainfall Recording Station
Raingauge Tumurau Location Lagoon Site Number 769704 Grid Reference V15: 383 523 Recorder Type Tipping Bucket Altitude 15 metres Start of Record 24 July 2001 Data Capture Rate 100% Data Summary From 1 January 2002 To 31 December 2005 Data Audited From 24 July 2001 To 31 December 2005 General Comments This site is operated by Environment Bay of Plenty for maintenance of the Tumurau wetland levels.
Periods of missing or synthetic record may occur in this dataset. Users are advised to contact the recording authority for further details.
Note that the data summary is for four years only, so no depth-duration frequency data are provided.
SITE LOCATION Tumurau at Lagoon
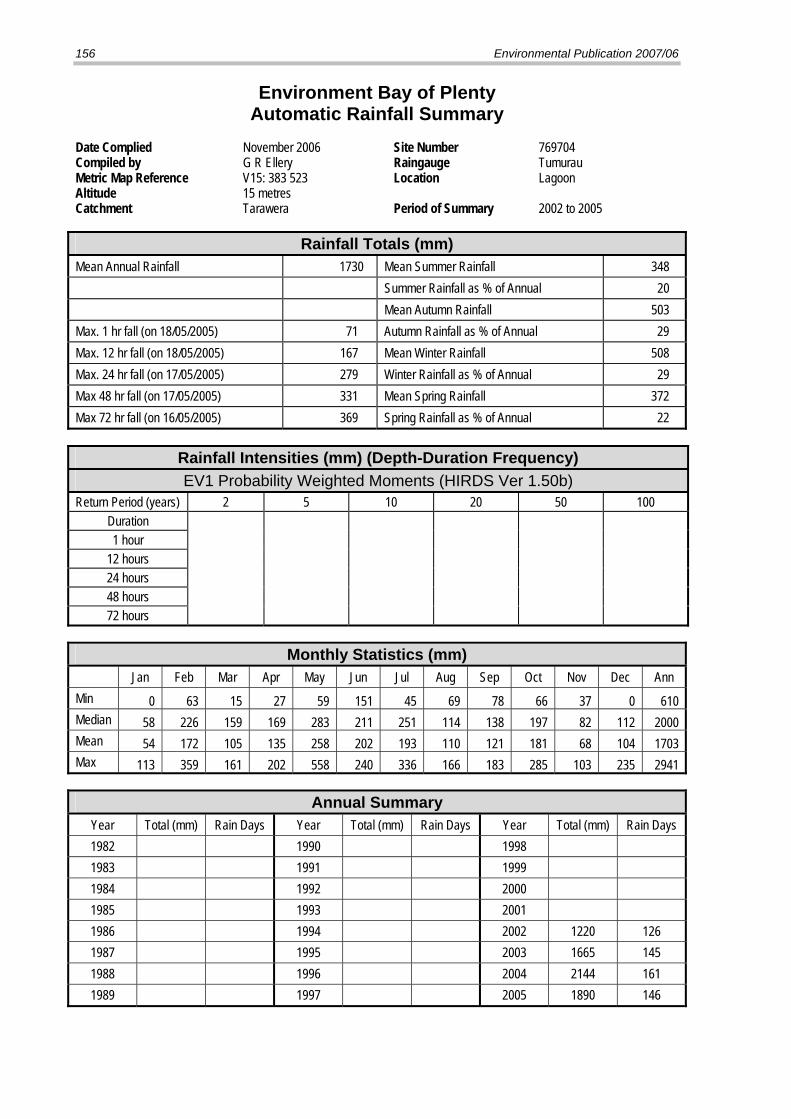
156 Environmental Publication 2007/06
Environment Bay of Plenty Automatic Rainfall Summary
Date Complied November 2006 Site Number 769704 Compiled by G R Ellery Raingauge Tumurau Metric Map Reference V15: 383 523 Location Lagoon Altitude 15 metres Catchment Tarawera Period of Summary 2002 to 2005
Rainfall Totals (mm) Mean Annual Rainfall 1730 Mean Summer Rainfall 348 Summer Rainfall as % of Annual 20 Mean Autumn Rainfall 503 Max. 1 hr fall (on 18/05/2005) 71 Autumn Rainfall as % of Annual 29 Max. 12 hr fall (on 18/05/2005) 167 Mean Winter Rainfall 508 Max. 24 hr fall (on 17/05/2005) 279 Winter Rainfall as % of Annual 29 Max 48 hr fall (on 17/05/2005) 331 Mean Spring Rainfall 372 Max 72 hr fall (on 16/05/2005) 369 Spring Rainfall as % of Annual 22
Rainfall Intensities (mm) (Depth-Duration Frequency) EV1 Probability Weighted Moments (HIRDS Ver 1.50b)
Return Period (years) 2 5 10 20 50 100 Duration 1 hour
12 hours 24 hours 48 hours 72 hours
Monthly Statistics (mm)
Jan Feb Mar Apr May Jun Jul Aug Sep Oct Nov Dec Ann Min 0 63 15 27 59 151 45 69 78 66 37 0 610 Median 58 226 159 169 283 211 251 114 138 197 82 112 2000 Mean 54 172 105 135 258 202 193 110 121 181 68 104 1703 Max 113 359 161 202 558 240 336 166 183 285 103 235 2941
Annual Summary Year Total (mm) Rain Days Year Total (mm) Rain Days Year Total (mm) Rain Days 1982 1990 1998 1983 1991 1999 1984 1992 2000 1985 1993 2001 1986 1994 2002 1220 126 1987 1995 2003 1665 145 1988 1996 2004 2144 161 1989 1997 2005 1890 146

Environment Bay of Plenty 157
Environment Bay of Plenty Automatic Rainfall Recording Station
Raingauge Tarawera Location Awakaponga Site Number 769701 Grid Reference V15:412 555 Recorder Type Tipping bucket Altitude 10 metres Start of Record August 1989 Data Capture Rate 98% Data Summary From January 1990 To December 2005 Data Audited From August 1989 To December 2005 General Comments
Site is operated by Environment Bay of Plenty as part of its Natural Environment Regional Monitoring Network. OTA tipping bucket is installed on the roof of the water recorder tower. Periods of missing or synthetic record may occur in this dataset. Users are advised to contact the recording authority for further details.
SITE LOCATION Tarawera at Awakaponga

158 Environmental Publication 2007/06
Environment Bay of Plenty Automatic Rainfall Summary
Date Complied November 2006 Site Number 769701 Compiled by G R Ellery Raingauge Tarawera Metric Map Reference V15: 412 555 Location Awakaponga Altitude 10 metres Catchment Tarawera Period of Summary 1990 to 2005
Rainfall Totals (mm) Mean Annual Rainfall 1236 Mean Summer Rainfall 255 Summer Rainfall as % of Annual 21 Mean Autumn Rainfall 324 Max. 1 hr fall (on 18/05/2005) 95 Autumn Rainfall as % of Annual 26 Max. 12 hr fall (on 18/05/2005) 198 Mean Winter Rainfall 385 Max. 24 hr fall (on 17/05/2005) 307 Winter Rainfall as % of Annual 31 Max 48 hr fall (on 17/05/2005) 361 Mean Spring Rainfall 272 Max 72 hr fall (on 16/05/2005) 386 Spring Rainfall as % of Annual 22
Rainfall Intensities (mm) (Depth-Duration Frequency) EV1 Probability Weighted Moments (HIRDS Ver 1.50b)
Return Period (years) 2 5 10 20 50 100 Duration 1 hour 32 (31) 42 (43) 54 (51) 68 (58)
12 hours 81 (84) 105 (112) 127 (131) 151 (148) 24 hours 92 (107) 116 (143) 145 (167) 185 (189) 48 hours 106 (133) 142 (177) 183 (207) 238 (235) 72 hours 112 (148) 149 (197) 194 (229) 256 (260)
Monthly Statistics (mm)
Jan Feb Mar Apr May Jun Jul Aug Sep Oct Nov Dec Ann Min 19 11 28 1 20 36 30 54 36 44 26 8 313 Median 83 68 79 122 89 126 139 108 91 99 75 99 1178 Mean 77 83 82 114 127 114 152 116 88 92 93 97 1235 Max 171 238 175 221 544 207 310 236 180 172 239 240 2933
Annual Summary Year Total (mm) Rain Days Year Total (mm) Rain Days Year Total (mm) Rain Days 1982 1990 1265 133 1998 1386 110 1983 1991 1160 123 1999 1298 125 1984 1992 Incomplete Record 2000 1297 127 1985 1993 638 93 2001 1552 142 1986 1994 1197 128 2002 812 118 1987 1995 Incomplete Record 2003 963 129 1988 1996 1470 135 2004 1678 146 1989 1997 1027 107 2005 1563 129

Environment Bay of Plenty 159
Environment Bay of Plenty Automatic Rainfall Recording Station
Raingauge Rangitaiki Location Thornton Site Number 769810 Grid Reference W15:507 576 Recorder Type Tipping bucket Altitude 10 metres Start of Record September 1989 Data Capture Rate 100% Data Summary From January 1990 To December 2005 Data Audited From September 1989 To December 2005 General Comments
Site is operated by Environment Bay of Plenty as part of its Natural Environment Regional Monitoring Network. OTA tipping bucket is installed on top of water level recorder. Periods of missing or synthetic record may occur in this dataset. Users are advised to contact the recording authority for further details.
SITE LOCATION Rangitaiki at Thornton

160 Environmental Publication 2007/06
Environment Bay of Plenty Automatic Rainfall Summary
Date Complied November 2006 Site Number 769810 Compiled by G R Ellery Raingauge Rangitaiki Metric Map Reference W15: 507 576 Location Thornton Altitude 10 metres Catchment Rangitaiki Period of Summary 1990 to 2005
Rainfall Totals (mm) Mean Annual Rainfall 1294 Mean Summer Rainfall 254 Summer Rainfall as % of Annual 20 Mean Autumn Rainfall 329 Max. 1 hr fall (on 14/05/2004) 65 Autumn Rainfall as % of Annual 25 Max. 12 hr fall (on 30/12/1996) 188 Mean Winter Rainfall 426 Max. 24 hr fall (on 29/12/1996) 220 Winter Rainfall as % of Annual 33 Max 48 hr fall (on 31/05/1997) 225 Mean Spring Rainfall 285 Max 72 hr fall (on 30/05/1997) 234 Spring Rainfall as % of Annual 22
Rainfall Intensities (mm) (Depth-Duration Frequency) EV1 Probability Weighted Moments (HIRDS Ver 1.50b)
Return Period (years) 2 5 10 20 50 100 Duration 1 hour 29 (27) 38 (37) 48 (43) 59 (50)
12 hours 123 (73) 157 (97) 186 (113) 216 (128) 24 hours 107 (93) 138 (124) 168 (144) 203 (164) 48 hours 123 (115) 157 (154) 186 (179) 216 (203) 72 hours 135 (128) 171 (170) 202 (199) 232 (226)
Monthly Statistics (mm)
Jan Feb Mar Apr May Jun Jul Aug Sep Oct Nov Dec Ann Min 2 11 15 5 11 38 17 53 28 37 23 7 247 Median 62 79 90 135 89 122 153 96 97 105 74 100 1202 Mean 65 83 93 125 110 144 161 118 94 111 81 109 1294 Max 204 307 244 281 335 432 332 306 168 223 201 423 3456
Annual Summary Year Total (mm) Rain Days Year Total (mm) Rain Days Year Total (mm) Rain Days 1982 1990 1260 132 1998 1222 109 1983 1991 1113 121 1999 1028 119 1984 1992 1312 129 2000 1109 111 1985 1993 939 102 2001 1196 109 1986 1994 1373 119 2002 752 101 1987 1995 1785 148 2003 1226 129 1988 1996 2317 131 2004 1273 125 1989 1997 1541 120 2005 1267 117

Environment Bay of Plenty 161
Environment Bay of Plenty
Automatic Rainfall Recording Station Raingauge Rangitaiki Location Te Teko Site Number 860710 Grid Reference V15:435 445 Recorder Type Tipping bucket Altitude 10 metres Start of Record September 1989 Data Capture Rate 100% Data Summary From January 1990 To December 2005 Data Audited From September 1989 To December 2005 General Comments Site is operated by Environment Bay of Plenty as part of its Natural Environment Regional Monitoring Network. An OTA tipping bucket is installed on the roof of the water recorder tower.
Periods of missing or synthetic record may occur in this dataset. Users are advised to contact the recording authority for further details.
SITE LOCATION Rangitaiki at Te Teko

162 Environmental Publication 2007/06
Environment Bay of Plenty Automatic Rainfall Summary
Date Complied November 2006 Site Number 860710 Compiled by G R Ellery Raingauge Rangitaiki Metric Map Reference V15: 435 445 Location Te Teko Altitude 10 metres Catchment Lower Rangitaiki Period of Summary 1990 to 2005
Rainfall Totals (mm) Mean Annual Rainfall 1237 Mean Summer Rainfall 266 Summer Rainfall as % of Annual 22 Mean Autumn Rainfall 322 Max. 1 hr fall (on 18/05/2005) 95 Autumn Rainfall as % of Annual 26 Max. 12 hr fall (on 18/05/2005) 157 Mean Winter Rainfall 378 Max. 24 hr fall (on 17/05/2005) 259 Winter Rainfall as % of Annual 31 Max 48 hr fall (on 17/05/2005) 310 Mean Spring Rainfall 270 Max 72 hr fall (on 16/05/2005) 336 Spring Rainfall as % of Annual 22
Rainfall Intensities (mm) (Depth-Duration Frequency) EV1 Probability Weighted Moments (HIRDS Ver 1.50b)
Return Period (years) 2 5 10 20 50 100 Duration 1 hour 31 (36) 44 (50) 58 (59) 73 (68)
12 hours 86 (99) 110 (132) 130 (153) 151 (174) 24 hours 104 (126) 133 (168) 163 (196) 197 (222) 48 hours 121 (157) 160 (208) 201 (243) 252 (276) 72 hours 126 (174) 168 (231) 214 (269) 273 (306)
Monthly Statistics (mm)
Jan Feb Mar Apr May Jun Jul Aug Sep Oct Nov Dec Ann Min 0 8 7 8 27 71 44 39 43 13 26 1 287 Median 64 80 77 153 85 126 141 102 91 88 62 79 1148 Mean 69 97 82 125 114 123 144 108 96 95 80 96 1229 Max 193 375 165 281 437 222 397 255 213 192 229 269 3228
Annual Summary Year Total (mm) Rain Days Year Total (mm) Rain Days Year Total (mm) Rain Days 1982 1990 1236 128 1998 1313 114 1983 1991 1215 126 1999 1144 115 1984 1992 1304 123 2000 947 106 1985 1993 788 111 2001 1755 141 1986 1994 1196 131 2002 896 113 1987 1995 1591 146 2003 1137 131 1988 1996 1331 126 2004 1533 135 1989 1997 996 103 2005 1408 123
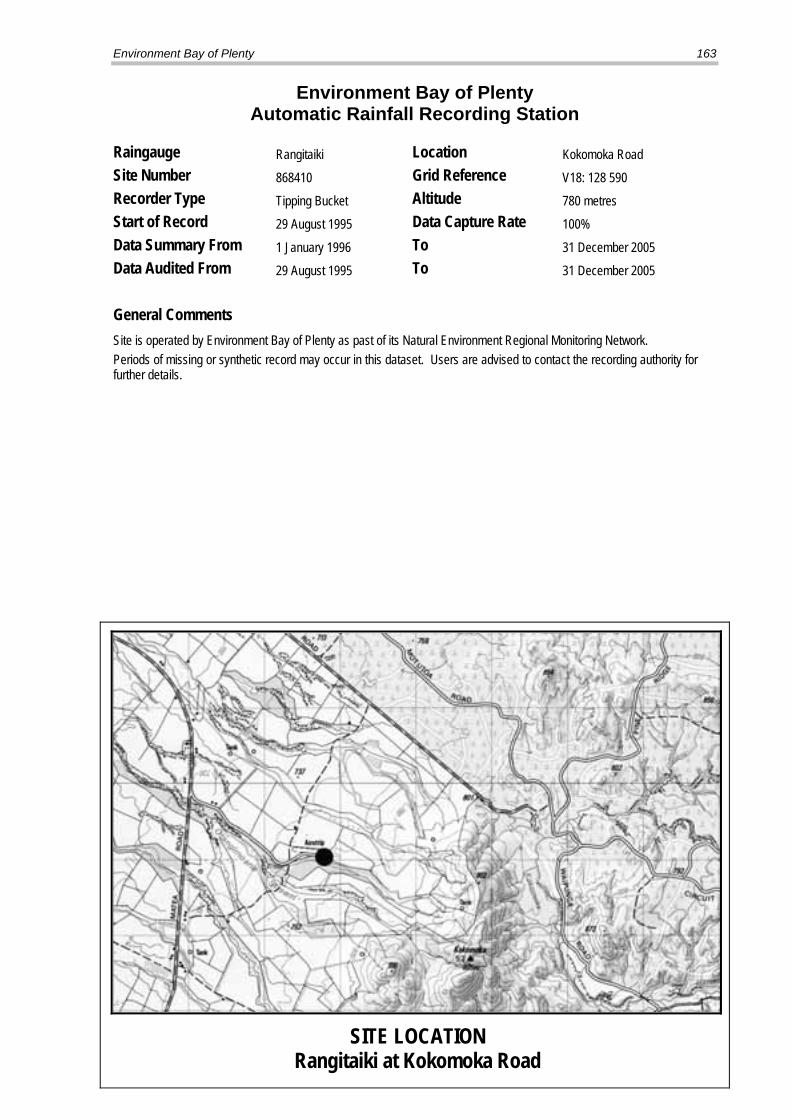
Environment Bay of Plenty 163
Environment Bay of Plenty Automatic Rainfall Recording Station
Raingauge Rangitaiki Location Kokomoka Road Site Number 868410 Grid Reference V18: 128 590 Recorder Type Tipping Bucket Altitude 780 metres Start of Record 29 August 1995 Data Capture Rate 100% Data Summary From 1 January 1996 To 31 December 2005 Data Audited From 29 August 1995 To 31 December 2005 General Comments
Site is operated by Environment Bay of Plenty as past of its Natural Environment Regional Monitoring Network. Periods of missing or synthetic record may occur in this dataset. Users are advised to contact the recording authority for further details.
SITE LOCATION Rangitaiki at Kokomoka Road

164 Environmental Publication 2007/06
Environment Bay of Plenty Automatic Rainfall Summary
Date Complied November 2006 Site Number 868410 Compiled by G R Ellery Raingauge Rangitaiki Metric Map Reference V18: 158 590 Location Kokomoka Road Altitude 780 metres Catchment Rangitaiki Period of Summary 1996 to 2005
Rainfall Totals (mm) Mean Annual Rainfall 1425 Mean Summer Rainfall 350 Summer Rainfall as % of Annual 25 Mean Autumn Rainfall 307 Max. 1 hr fall (on 9/04/1997) 38 Autumn Rainfall as % of Annual 22 Max. 12 hr fall (on 8/04/1997) 105 Mean Winter Rainfall 404 Max. 24 hr fall (on 8/04/1997) 108 Winter Rainfall as % of Annual 28 Max 48 hr fall (on 16/07/2004) 148 Mean Spring Rainfall 365 Max 72 hr fall (on 15/07/2004) 153 Spring Rainfall as % of Annual 26
Rainfall Intensities (mm) (Depth-Duration Frequency) EV1 Probability Weighted Moments (HIRDS Ver 1.50b)
Return Period (years) 2 5 10 20 50 100 Duration 1 hour 28 (23) 33 (32) 37 (39)
12 hours 60 (70) 74 (93) 87 (109) 24 hours 82 (93) 93 (124) 102 (145) 48 hours 98 (116) 110 (154) 122 (180) 72 hours 125 (129) 141 (171) 151 (199)
Monthly Statistics (mm)
Jan Feb Mar Apr May Jun Jul Aug Sep Oct Nov Dec Ann Min 54 20 30 30 73 51 69 59 31 61 47 64 589 Median 99 107 81 90 113 136 149 106 116 138 107 163 1405 Mean 101 102 91 95 118 140 158 103 121 127 118 149 1423 Max 231 258 177 153 166 231 344 140 236 205 220 224 2585
Annual Summary Year Total (mm) Rain Days Year Total (mm) Rain Days Year Total (mm) Rain Days 1982 1990 1998 1511 181 1983 1991 1999 1394 173 1984 1992 2000 1315 168 1985 1993 2001 1389 188 1986 1994 2002 1338 183 1987 1995 2003 1434 177 1988 1996 1616 198 2004 1729 196 1989 1997 1285 174 2005 1237 179

Environment Bay of Plenty 165
Environment Bay of Plenty Automatic Rainfall Recording Station
Raingauge Tarapounamu Location Summit Site Number 866801 Grid Reference V17:473 803 Recorder Type Tipping bucket Altitude 750 metres Start of Record April 1989 Data Capture Rate 100% Data Summary From January 1990 To December 2005 Data Audited From April 1989 To December 2005
General Comments
Station is jointly operated by Environment Bay of Plenty and NIWA, Rotorua. OTA tipping bucket is installed on roof of recorder hut.
SITE LOCATION Tarapounamu at Summit

166 Environmental Publication 2007/06
Environment Bay of Plenty Automatic Rainfall Summary
Date Complied November 2006 Site Number 866801 Compiled by G R Ellery Raingauge Tarapounamu Metric Map Reference V17: 473 803 Location Summit Altitude 750 metres Catchment Whakatane Period of Summary 1990 to 2005
Rainfall Totals (mm) Mean Annual Rainfall 1712 Mean Summer Rainfall 384 Summer Rainfall as % of Annual 22 Mean Autumn Rainfall 370 Max. 1 hr fall (on 19/01/1995) 39 Autumn Rainfall as % of Annual 22 Max. 12 hr fall (on 17/07/2004) 89 Mean Winter Rainfall 521 Max. 24 hr fall (on 16/07/2004) 151 Winter Rainfall as % of Annual 30 Max 48 hr fall (on 16/07/2004) 215 Mean Spring Rainfall 437 Max 72 hr fall (on 15/07/2004) 238 Spring Rainfall as % of Annual 26
Rainfall Intensities (mm) (Depth-Duration Frequency) EV1 Probability Weighted Moments (HIRDS Ver 1.50b)
Return Period (years) 2 5 10 20 50 100 Duration 1 hour 24 (23) 28 (31) 32 (37) 36 (42)
12 hours 72 (82) 81 (110) 87 (128) 92 (145) 24 hours 91 (113) 104 (150) 116 (175) 129 (198) 48 hours 107 (140) 128(186) 148 (217) 172 (246) 72 hours 120 (155) 141 (206) 164 (240) 192 (273)
Monthly Statistics (mm)
Jan Feb Mar Apr May Jun Jul Aug Sep Oct Nov Dec Ann Min 0 5 23 39 73 95 44 40 61 55 87 4 526 Median 93 123 99 135 140 199 163 148 140 152 154 170 1716 Mean 91 126 100 132 135 188 180 149 152 135 151 156 1695 Max 169 279 226 230 216 317 478 286 307 242 281 283 3314
Annual Summary Year Total (mm) Rain Days Year Total (mm) Rain Days Year Total (mm) Rain Days 1982 1990 1732 187 1998 1851 152 1983 1991 1890 201 1999 1620 183 1984 1992 1725 214 2000 1446 175 1985 1993 1263 167 2001 1737 184 1986 1994 1645 205 2002 1584 201 1987 1995 2009 204 2003 1671 190 1988 1996 1690 196 2004 2158 218 1989 1997 1745 175 2005 1625 198

Environment Bay of Plenty 167
Environment Bay of Plenty Automatic Rainfall Recording Station
Raingauge Whakatane Location Huitieke Link Site Number 873002 Grid Reference W17:607 075 Recorder Type Tipping bucket Altitude 280 metres Start of Record April 1977 Data Capture Rate 94% Data Summary From January 1978 To December 2005 Data Audited From April 1977 To December 2005
General Comments Site is operated by Environment Bay of Plenty as part of its Natural Environment Regional Monitoring Network.
Rainfall from April 1977 to August 1987 was measured by an OTA tipping bucket and recorded as daily totals via a phone calling system.
Rainfall from August 1987 to June 1990 was measured by an OTA tipping bucket and recorded by a Jepsen Slave at varying intervals, commonly 4 hours. Jepsen Slave was replaced by an Aquitel Remote on 14 June 1990, recording at 15 minute intervals. OTA tipping bucket is installed on the roof of the radio hut on the hill above the water level recorder.
Periods of missing or synthetic record may occur in this dataset. Users are advised to contact the recording authority for further details.
SITE LOCATION Whakatane at Huitieke Link

168 Environmental Publication 2007/06
Environment Bay of Plenty Automatic Rainfall Summary
Date Complied November 2006 Site Number 873002 Compiled by G R Ellery Raingauge Whakatane Metric Map Reference W17: 607 075 Location Huitieke Altitude 280 metres Catchment Whakatane Period of Summary 1979 to 2005
Rainfall Totals (mm) Mean Annual Rainfall 1572 Mean Summer Rainfall 360 Summer Rainfall as % of Annual 23 Mean Autumn Rainfall 351 Max. 1 hr fall (on 7/12/2001) 36 Autumn Rainfall as % of Annual 22 Max. 12 hr fall (on 6/04/2003) 132 Mean Winter Rainfall 478 Max. 24 hr fall (on 16/07/2004) 169 Winter Rainfall as % of Annual 30 Max 48 hr fall (on 16/07/2004) 231 Mean Spring Rainfall 435 Max 72 hr fall (on 15/07/2004) 301 Spring Rainfall as % of Annual 28
Rainfall Intensities (mm) (Depth-Duration Frequency) EV1 Probability Weighted Moments (HIRDS Ver 1.50b)
Return Period (years) 2 5 10 20 50 100 Duration 1 hour 19 (29) 26 (40) 31 (47) 34 (54)
12 hours 74 (93) 94 (124) 108 (145) 120 (164) 24 hours 107 (125) 125 (166) 138 (194) 150 (220) 48 hours 132 (155) 159 (206) 182 (240) 205 (273) 72 hours 144 (172) 176 (229) 207 (267) 242 (303)
Monthly Statistics (mm)
Jan Feb Mar Apr May Jun Jul Aug Sep Oct Nov Dec Ann Min 6 3 20 28 13 40 45 18 72 24 47 33 349 Median 83 122 110 113 120 174 145 151 156 151 120 171 1616 Mean 88 117 116 109 123 173 163 139 153 150 133 159 1623 Max 238 342 238 209 266 313 500 309 281 370 365 303 3734
Annual Summary Year Total (mm) Rain Days Year Total (mm) Rain Days Year Total (mm) Rain Days 1982 1064 167 1990 Incomplete Data 1998 1902 157 1983 1533 196 1991 1508 163 1999 1728 140 1984 1564 195 1992 Incomplete Data 2000 971 109 1985 Incomplete Data 1993 1110 121 2001 1929 153 1986 Incomplete Data 1994 Incomplete Data 2002 1237 135 1987 Incomplete Data 1995 Incomplete Data 2003 1656 139 1988 Incomplete Data 1996 Incomplete Data 2004 2229 169 1989 Incomplete Data 1997 Incomplete Data 2005 1504 166

Environment Bay of Plenty 169
Environment Bay of Plenty Automatic Rainfall Recording Station
Raingauge Whakatane Location Huiarau Summit Site Number 876002 Grid Reference W18:628 786 Recorder Type Tipping bucket Altitude 1170 metres Start of Record March 1975 Data Capture Rate 99% Data Summary From January 1976 To December 2005 Data Audited From March 1975 To December 2005 General Comments Site is operated by Environment Bay of Plenty as part of its Natural Environment Regional Monitoring Network.
Rainfall from March 1975 to August 1987 was measured by an OTA tipping bucket and recorded as daily totals via a phone calling system. OTA tipping bucket is installed on the roof of the concrete recorder tank.
Rainfall from August 1987 to August 1991 was measured by an OTA tipping bucket and recorded by a Jepsen Slave at varying intervals, commonly 4 hours.
Jepsen Slave was replaced by an Aquitel Remote on 14 August 1991, recording at 15 minute intervals.
Periods of missing or synthetic record may occur in this dataset. Users are advised to contact the recording authority for further details.
SITE LOCATION Huiarau at Summit

170 Environmental Publication 2007/06
Environment Bay of Plenty Automatic Rainfall Summary
Date Complied November 2006 Site Number 876002 Compiled by G R Ellery Raingauge Whakatane Metric Map Reference W18: 628 786 Location Huiarau Summit Altitude 1170 metres Catchment Whakatane Period of Summary 1976 to 2005
Rainfall Totals (mm) Mean Annual Rainfall 2500 Mean Summer Rainfall 529 Summer Rainfall as % of Annual 21 Mean Autumn Rainfall 607 Max. 1 hr fall (on 9/05/1988) 55 Autumn Rainfall as % of Annual 24 Max. 12 hr fall (on 19/04/1985) 121 Mean Winter Rainfall 703 Max. 24 hr fall (on 8/05/1988) 260 Winter Rainfall as % of Annual 28 Max 48 hr fall (on 18/04/1985) 316 Mean Spring Rainfall 616 Max 72 hr fall (on 17/04/1985) 338 Spring Rainfall as % of Annual 25
Rainfall Intensities (mm) (Depth-Duration Frequency) EV1 Probability Weighted Moments (HIRDS Ver 1.50b)
Return Period (years) 2 5 10 20 50 100 Duration 1 hour 16 (19) 26 (26) 35 (31)
12 hours 77 (72) 101 (96) 124 (112) 24 hours 111 (101) 141 (134) 172 (156) 208 (177) 48 hours 144 (125) 176 (166) 210 (193) 248 (220) 72 hours 165 (138) 199 (184) 232 (214) 268 (244)
Monthly Statistics (mm)
Jan Feb Mar Apr May Jun Jul Aug Sep Oct Nov Dec Ann Min 3 34 43 62 63 102 85 45 97 92 84 20 730 Median 122 158 174 169 206 245 212 194 201 193 203 219 2296 Mean 143 168 184 195 224 259 240 199 209 211 198 213 2443 Max 339 396 393 485 395 503 535 320 415 425 363 500 5069
Annual Summary Year Total (mm) Rain Days Year Total (mm) Rain Days Year Total (mm) Rain Days 1982 2138 273 1990 Incomplete Record 1998 2293 213 1983 2414 271 1991 2519 219 1999 2364 234 1984 3681 271 1992 2392 259 2000 2428 227 1985 3095 288 1993 1777 215 2001 2587 230 1986 1946 295 1994 Incomplete Record 2002 2628 230 1987 2324 251 1995 Incomplete Record 2003 2333 240 1988 2862 228 1996 2488 232 2004 2575 227 1989 2881 238 1997 2042 212 2005 2232 230

Environment Bay of Plenty 171
Environment Bay of Plenty Automatic Rainfall Recording Station
Raingauge Waimana Location Ranger Station Site Number 870201 Grid Reference W16:696 153 Recorder Type Tipping Bucket Altitude 118 metres Start of Record April 1996 Data Capture Rate 100% Data Summary From January 1997 To December 2005 Data Audited From April 1996 To December 2005
General Comments This site is operated by Environment Bay of Plenty as part of its Natural Environment Regional Monitoring Network and replaces the previous site Waimana at Ogilvie Bridge which was situated 2.5 kilometres further upstream and which closed on 1/04/1996.
Missing record from 2/07/1998 064500 to 7/07/1998 141500 due to site being destroyed by flood.
Periods of missing or synthetic record may occur in this dataset. Users are advised to contact the recording authority for further details.
SITE LOCATION Waimana at Ranger Station

172 Environmental Publication 2007/06
Environment Bay of Plenty Automatic Rainfall Summary
Date Complied November 2006 Site Number 870201 Compiled by G R Ellery Raingauge Waimana Metric Map Reference W16: 696 153 Location Ranger Station Altitude 118 metres Catchment Waimana Period of Summary 1997 to 2005
Rainfall Totals (mm) Mean Annual Rainfall 2170 Mean Summer Rainfall 432 Summer Rainfall as % of Annual 20 Mean Autumn Rainfall 493 Max. 1 hr fall (on 6/04/2003) 47 Autumn Rainfall as % of Annual 23 Max. 12 hr fall (on 6/04/2003) 199 Mean Winter Rainfall 666 Max. 24 hr fall (on 1/07/1998) 239 Winter Rainfall as % of Annual 31 Max 48 hr fall (on 9/07/1998) 354 Mean Spring Rainfall 578 Max 72 hr fall (on 9/07/1998) 413 Spring Rainfall as % of Annual 27
Rainfall Intensities (mm) (Depth-Duration Frequency) EV1 Probability Weighted Moments (HIRDS Ver 1.50b)
Return Period (years) 2 5 10 20 50 100 Duration 1 hour 32 (33) 39 (45) 46 (54)
12 hours 117 (108) 150 (144) 182 (168) 24 hours 181 (145) 216 (193) 236 (224) 48 hours 207 (179) 265 (239) 312 (278) 72 hours 221 (199) 293 (265) 359 (309)
Monthly Statistics (mm)
Jan Feb Mar Apr May Jun Jul Aug Sep Oct Nov Dec Ann Min 0 13 22 15 94 122 63 69 129 104 54 17 702 Median 82 122 149 172 227 273 184 176 206 183 144 159 2077 Mean 82 156 139 159 192 245 262 154 221 187 172 180 2149 Max 165 392 269 249 293 343 840 240 414 340 519 362 4426
Annual Summary Year Total (mm) Rain Days Year Total (mm) Rain Days Year Total (mm) Rain Days 1982 1990 1998 2846 158 1983 1991 1999 2391 163 1984 1992 2000 1947 165 1985 1993 2001 2324 172 1986 1994 2002 1808 158 1987 1995 2003 2034 167 1988 1996 2004 2774 183 1989 1997 1773 151 2005 1632 172

Environment Bay of Plenty 173
Environment Bay of Plenty Automatic Rainfall Recording Station
Raingauge Waimana Location Ogilvie Bridge Site Number 873703 Grid Reference W16:704 128 Recorder Type Tipping bucket Altitude 150 metres Start of Record August 1988 Data Capture Rate 89% Data Summary From January 1989 To December 1995 Data Audited From August 1988 To April 1996 General Comments Site was operated by Environment Bay of Plenty as part of its Natural Environment Regional Monitoring Network.
Rainfall from August 1987 to October 1991 was measured by an OTA tipping bucket and recorded by a Jepsen Slave at varying intervals, commonly 4 hours. Jepsen Slave was replaced by an Aquitel Remote on 1 October 1991, recording at 15 minute intervals. OTA tipping bucket was installed on the roof of the radio shed. Site has a Meteorological Service number B87313.
SITE LOCATION Waimana at Ogilvie Bridge
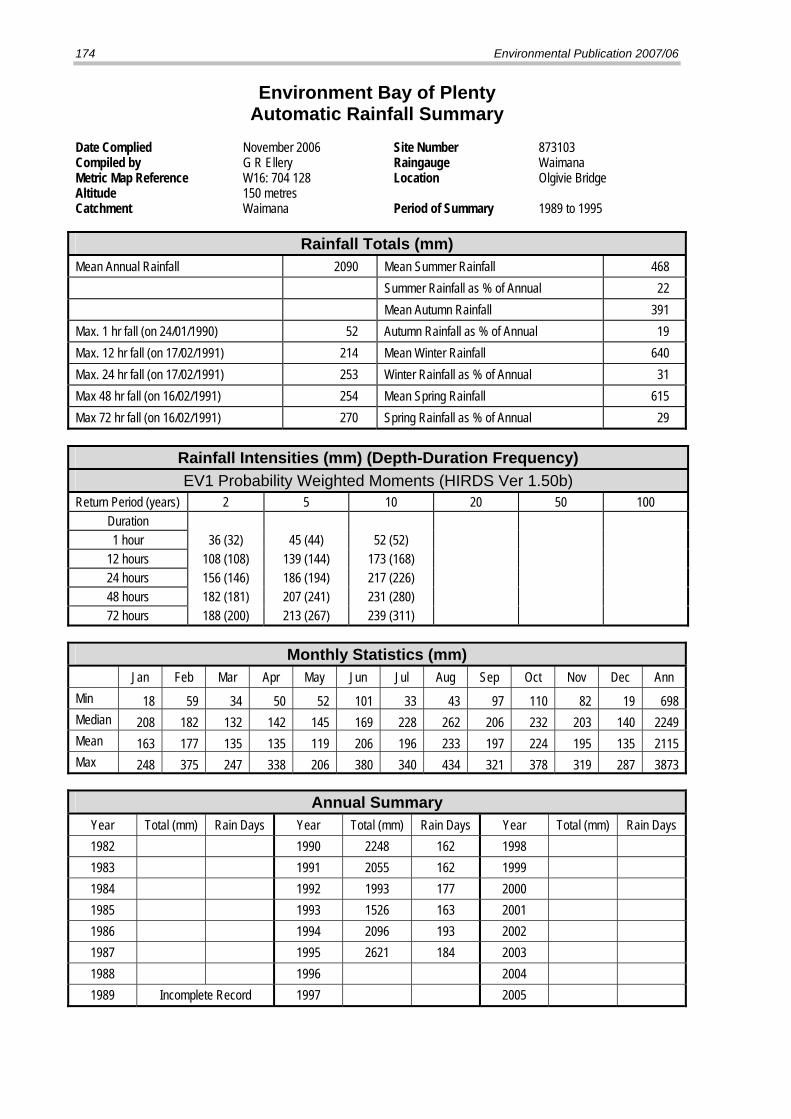
174 Environmental Publication 2007/06
Environment Bay of Plenty Automatic Rainfall Summary
Date Complied November 2006 Site Number 873103 Compiled by G R Ellery Raingauge Waimana Metric Map Reference W16: 704 128 Location Olgivie Bridge Altitude 150 metres Catchment Waimana Period of Summary 1989 to 1995
Rainfall Totals (mm) Mean Annual Rainfall 2090 Mean Summer Rainfall 468 Summer Rainfall as % of Annual 22 Mean Autumn Rainfall 391 Max. 1 hr fall (on 24/01/1990) 52 Autumn Rainfall as % of Annual 19 Max. 12 hr fall (on 17/02/1991) 214 Mean Winter Rainfall 640 Max. 24 hr fall (on 17/02/1991) 253 Winter Rainfall as % of Annual 31 Max 48 hr fall (on 16/02/1991) 254 Mean Spring Rainfall 615 Max 72 hr fall (on 16/02/1991) 270 Spring Rainfall as % of Annual 29
Rainfall Intensities (mm) (Depth-Duration Frequency) EV1 Probability Weighted Moments (HIRDS Ver 1.50b)
Return Period (years) 2 5 10 20 50 100 Duration 1 hour 36 (32) 45 (44) 52 (52)
12 hours 108 (108) 139 (144) 173 (168) 24 hours 156 (146) 186 (194) 217 (226) 48 hours 182 (181) 207 (241) 231 (280) 72 hours 188 (200) 213 (267) 239 (311)
Monthly Statistics (mm)
Jan Feb Mar Apr May Jun Jul Aug Sep Oct Nov Dec Ann Min 18 59 34 50 52 101 33 43 97 110 82 19 698 Median 208 182 132 142 145 169 228 262 206 232 203 140 2249 Mean 163 177 135 135 119 206 196 233 197 224 195 135 2115 Max 248 375 247 338 206 380 340 434 321 378 319 287 3873
Annual Summary Year Total (mm) Rain Days Year Total (mm) Rain Days Year Total (mm) Rain Days 1982 1990 2248 162 1998 1983 1991 2055 162 1999 1984 1992 1993 177 2000 1985 1993 1526 163 2001 1986 1994 2096 193 2002 1987 1995 2621 184 2003 1988 1996 2004 1989 Incomplete Record 1997 2005

Environment Bay of Plenty 175
Environment Bay of Plenty Automatic Rainfall Recording Station
Raingauge Otara Location Town Wharf Site Number 872101 Grid Reference W15:861 467 Recorder Type Tipping Bucket Altitude 20 metres Start of Record January 1996 Data Capture Rate 93% Data Summary From January 1997 To December 2005 Data Audited From June 1996 To December 2005
General Comments Site is operated by Environment Bay of Plenty as part of its Natural Environment Regional Monitoring Network.
TB3 tipping bucket is on the roof of the Opotiki Coastguard building.
Periods of missing or synthetic record may occur in this dataset. Users are advised to contact the recording authority for further details.
SITE LOCATION Otara at Town Wharf

176 Environmental Publication 2007/06
Environment Bay of Plenty Automatic Rainfall Summary
Date Complied November 2006 Site Number 872101 Compiled by G R Ellery Raingauge Otara Metric Map Reference W15: 861 468 Location Town Wharf Altitude 20 metres Catchment Otara Period of Summary 1997 to 2005
Rainfall Totals (mm) Mean Annual Rainfall 1175 Mean Summer Rainfall 281 Summer Rainfall as % of Annual 24 Mean Autumn Rainfall 298 Max. 1 hr fall (on 16/05/1996) 43 Autumn Rainfall as % of Annual 25 Max. 12 hr fall (on 2/06/1997) 119 Mean Winter Rainfall 390 Max. 24 hr fall (on 1/06/1997) 148 Winter Rainfall as % of Annual 33 Max 48 hr fall (on 16/07/2004) 176 Mean Spring Rainfall 241 Max 72 hr fall (on 15/07/2004 ) 217 Spring Rainfall as % of Annual 21
Rainfall Intensities (mm) (Depth-Duration Frequency) EV1 Probability Weighted Moments (HIRDS Ver 1.50b)
Return Period (years) 2 5 10 20 50 100 Duration 1 hour 29 (28) 36 (38) 41 (45)
12 hours 75 (76) 93 (102) 109 (118) 24 hours 93 (101) 116 (134) 136 (156) 48 hours 104 (125) 133 (166) 160 (194) 72 hours 116 (138) 149 (184) 182 (215)
Monthly Statistics (mm)
Jan Feb Mar Apr May Jun Jul Aug Sep Oct Nov Dec Ann Min 1 10 5 33 29 54 32 44 34 39 34 50 365 Median 70 63 95 84 85 146 133 106 80 81 68 87 1098 Mean 61 96 103 82 110 157 133 97 88 86 68 127 1208 Max 134 292 193 137 223 328 277 163 172 159 150 325 2553
Annual Summary Year Total (mm) Rain Days Year Total (mm) Rain Days Year Total (mm) Rain Days 1982 1990 1998 1114 124 1983 1991 1999 1116 128 1984 1992 2000 1059 138 1985 1993 2001 1511 140 1986 1994 2002 959 108 1987 1995 2003 1190 135 1988 1996 2004 1492 132 1989 1997 Incomplete Record 2005 961 123

Environment Bay of Plenty 177
Environment Bay of Plenty Automatic Rainfall Recording Station
Raingauge Waioeka Location Mouth of Gorge Site Number 781310 Grid Reference W16: 862 365 Recorder Type Tipping Bucket Altitude 40 metres Start of Record December 1989 Data Capture Rate 100% Data Summary From January 1990 To December 2005 Data Audited From December 1989 To December 2005 General Comments Site is operated by Environment Bay of Plenty as part of its Natural Environment Regional Monitoring Network. OTA tipping bucket is installed on the roof of the water level recorder hut.
Periods of missing or synthetic record may occur in this dataset. Users are advised to contact the recording authority for further details.
SITE LOCATION Waioeka at Mouth of Gorge

178 Environmental Publication 2007/06
Environment Bay of Plenty Automatic Rainfall Summary
Date Complied November 2006 Site Number 781310 Compiled by G R Ellery Raingauge Waioeka Metric Map Reference W16: 862 365 Location Mouth of Gorge Altitude 40 metres Catchment Waioeka Period of Summary 1990 to 2005
Rainfall Totals (mm) Mean Annual Rainfall 1567 Mean Summer Rainfall 338 Summer Rainfall as % of Annual 22 Mean Autumn Rainfall 376 Max. 1 hr fall (on 23/03/1997) 38 Autumn Rainfall as % of Annual 24 Max. 12 hr fall (on 6/04/2003) 112 Mean Winter Rainfall 467 Max. 24 hr fall (on 16/02/2001) 144 Winter Rainfall as % of Annual 30 Max 48 hr fall (on 15/07/2004) 182 Mean Spring Rainfall 386 Max 72 hr fall (on 15/07/2004) 233 Spring Rainfall as % of Annual 25
Rainfall Intensities (mm) (Depth-Duration Frequency) EV1 Probability Weighted Moments (HIRDS Ver 1.50b)
Return Period (years) 2 5 10 20 50 100 Duration 1 hour 28 (35) 33 (49) 36 (58) 39 (66)
12 hours 77 (107) 91 (143) 103 (166) 113 (189) 24 hours 100 (143) 118 (190) 133 (222) 145 (252) 48 hours 120 (177) 142 (236) 159 (275) 175 (312) 72 hours 130 (197) 157 (262) 182 (305) 208 (346)
Monthly Statistics (mm)
Jan Feb Mar Apr May Jun Jul Aug Sep Oct Nov Dec Ann Min 14 22 43 19 48 73 12 57 52 58 41 31 470 Median 86 95 112 129 126 162 152 119 124 114 99 115 1433 Mean 91 111 116 128 129 166 159 140 130 135 123 139 1567 Max 221 329 236 274 244 340 335 264 336 334 236 319 3468
Annual Summary Year Total (mm) Rain Days Year Total (mm) Rain Days Year Total (mm) Rain Days 1982 1990 1573 138 1998 1522 137 1983 1991 1740 153 1999 1334 140 1984 1992 1644 137 2000 1449 149 1985 1993 937 116 2001 1996 159 1986 1994 1436 146 2002 1352 141 1987 1995 1948 170 2003 1812 154 1988 1996 1843 152 2004 1864 153 1989 1997 1332 130 2005 1304 155

Environment Bay of Plenty 179
Environment Bay of Plenty
Automatic Rainfall Recording Station Raingauge Waioeka Location Cableway Site Number 872301 Grid Reference W16:876 219 Recorder Type Tipping bucket Altitude 70 metres Start of Record December 1989 Data Capture Rate 99% Data Summary From January 1990 To December 2005 Data Audited From December 1989 To December 2005 General Comments Site is operated by Environment Bay of Plenty as part of its Natural Environment Regional Monitoring Network.
OTA tipping bucket is installed on the roof of the water level recording tower.
Periods of missing or synthetic record may occur in this dataset. Users are advised to contact the recording authority for further details.
SITE LOCATION Waioeka at Cableway

180 Environmental Publication 2007/06
Environment Bay of Plenty Automatic Rainfall Summary
Date Complied November 2006 Site Number 872301 Compiled by G R Ellery Raingauge Waioeka Metric Map Reference W16: 876 219 Location Cableway Altitude 70 metres Catchment Waioeka Period of Summary 1990 to 2005
Rainfall Totals (mm) Mean Annual Rainfall 2439 Mean Summer Rainfall 491 Summer Rainfall as % of Annual 20 Mean Autumn Rainfall 551 Max. 1 hr fall (on 22/05/1996) 45 Autumn Rainfall as % of Annual 23 Max. 12 hr fall (on 17/02/1991) 192 Mean Winter Rainfall 740 Max. 24 hr fall (on 17/02/1991) 263 Winter Rainfall as % of Annual 30 Max 48 hr fall (on 9/07/1998) 308 Mean Spring Rainfall 669 Max 72 hr fall (on 8/07/1998) 391 Spring Rainfall as % of Annual 27
Rainfall Intensities (mm) (Depth-Duration Frequency) EV1 Probability Weighted Moments (HIRDS Ver 1.50b)
Return Period (years) 2 5 10 20 50 100 Duration 1 hour 28 (34) 33 (47) 38 (56) 43 (64)
12 hours 128 (118) 152 (157) 171 (183) 188 (208) 24 hours 171 (160) 203 (213) 227 (248) 249 (282) 48 hours 207 (198) 245 (264) 272 (308) 397 (349) 72 hours 233 (220) 284 (293) 326 (341) 367 (387)
Monthly Statistics (mm)
Jan Feb Mar Apr May Jun Jul Aug Sep Oct Nov Dec Ann Min 0 14 30 41 52 112 20 72 101 81 75 1 599 Median 97 169 154 214 246 275 222 228 268 231 158 162 2424 Mean 120 181 156 184 207 258 245 233 235 235 202 178 2434 Max 266 400 299 298 367 456 814 487 395 517 489 401 5189
Annual Summary Year Total (mm) Rain Days Year Total (mm) Rain Days Year Total (mm) Rain Days 1982 1990 Incomplete Record 1998 3066 149 1983 1991 2364 163 1999 2805 152 1984 1992 2124 140 2000 2200 150 1985 1993 1609 132 2001 2796 165 1986 1994 2203 159 2002 1988 155 1987 1995 Incomplete Record 2003 2782 176 1988 1996 Incomplete Record 2004 2895 169 1989 1997 Incomplete Record 2005 1636 148

Environment Bay of Plenty 181
Environment Bay of Plenty Automatic Rainfall Recording Station
Raingauge Waioeka Location Koranga Site Number 874304 Grid Reference W17:886 025 Recorder Type Tipping bucket Altitude 940 metres Start of Record August 1976 Data Capture Rate 81% Data Summary From January 1977 To December 2005 Data Audited From August 1976 To December 2005 General Comments Site is operated by Environment Bay of Plenty as part of its Natural Environment Regional Monitoring Network.
Rainfall from August 1976 to January 1990 is from a daily manual raingauge Meteorological Service number (B87431) located at NZMS 260 reference W17: 880 003.
An OTA tipping bucket connected to a data logger was installed on 11 January 1990. The OTA tipping bucket is located on top of a post adjacent to the recorder hut, approximately 1.5 metres above ground level.
Periods of missing or synthetic record may occur in this dataset. Users are advised to contact the recording authority for further details.
SITE LOCATION Koranga at Koranga Station

182 Environmental Publication 2007/06
Environment Bay of Plenty Automatic Rainfall Summary
Date Complied November 2006 Site Number 874304 Compiled by G R Ellery Raingauge Waioeka Metric Map Reference W17: 886 025 Location Koranga Altitude 940 metres Catchment Waioeka Period of Summary 1980 to 2005
Rainfall Totals (mm) Mean Annual Rainfall 2148 Mean Summer Rainfall 474 Summer Rainfall as % of Annual 22 Mean Autumn Rainfall 479 Max. 1 hr fall (on 8/12/2001) 38 Autumn Rainfall as % of Annual 22 Max. 12 hr fall (on 17/02/1991) 192 Mean Winter Rainfall 628 Max. 24 hr fall (on 17/02/1991) 241 Winter Rainfall as % of Annual 29 Max 48 hr fall (on 9/07/1998) 279 Mean Spring Rainfall 587 Max 72 hr fall (on 8/07/1998) 345 Spring Rainfall as % of Annual 27
Rainfall Intensities (mm) (Depth-Duration Frequency) EV1 Probability Weighted Moments (HIRDS Ver 1.50b)
Return Period (years) 2 5 10 20 50 100 Duration 1 hour 22 (29) 30 (40) 35 (47) 39 (54)
12 hours 98 (101) 128 (135) 151 (157) 172 (179) 24 hours 143 (139) 176 (185) 201 (215) 224 (245) 48 hours 172 (172) 203 (229) 228 (267) 251 (303) 72 hours 204 (191) 244 (254) 273 (296) 297 (336)
Monthly Statistics (mm)
Jan Feb Mar Apr May Jun Jul Aug Sep Oct Nov Dec Ann Min 35 19 25 25 68 94 32 50 86 48 61 32 575 Median 137 137 133 138 216 250 172 170 200 198 163 185 2099 Mean 151 137 151 143 181 226 202 195 206 205 178 188 2163 Max 352 370 372 285 308 404 791 365 447 433 395 462 4984
Annual Summary Year Total (mm) Rain Days Year Total (mm) Rain Days Year Total (mm) Rain Days 1982 Incomplete Record 1990 2082 181 1998 Incomplete Record 1983 Incomplete Record 1991 2225 188 1999 2358 178 1984 Incomplete Record 1992 2023 200 2000 2113 176 1985 Incomplete Record 1993 1531 168 2001 2289 199 1986 Incomplete Record 1994 2209 192 2002 1829 177 1987 Incomplete Record 1995 2516 205 2003 2440 189 1988 2342 205 1996 2431 180 2004 2518 188 1989 2262 213 1997 1792 160 2005 1747 184

Environment Bay of Plenty 183
Environment Bay of Plenty Automatic Rainfall Recording Station
Raingauge Otara Location Browns Bridge Site Number 781410 Grid Reference X16:930 376 Recorder Type Tipping Bucket Altitude 38 metres Start of Record December 1989 Data Capture Rate 100% Data Summary From January 1990 To December 2005 Data Audited From December 1989 To December 2005 General Comments Site is operated by Environment Bay of Plenty as part of its Natural Environment Regional Monitoring Network.
The OTA tipping bucket is installed on the roof of the water level recorder.
Periods of missing or synthetic record may occur in this dataset. Users are advised to contact the recording authority for further details.
SITE LOCATION Otara at Browns Bridge

184 Environmental Publication 2007/06
Environment Bay of Plenty Automatic Rainfall Summary
Date Complied November 2006 Site Number 781410 Compiled by G R Ellery Raingauge Otara Metric Map Reference X16: 930 376 Location Browns Bridge Altitude 38 metres Catchment Otara Period of Summary 1990 to 2000
Rainfall Totals (mm) Mean Annual Rainfall 1601 Mean Summer Rainfall 333 Summer Rainfall as % of Annual 21 Mean Autumn Rainfall 402 Max. 1 hr fall (on 18/06/1997) 41 Autumn Rainfall as % of Annual 25 Max. 12 hr fall (on 21/05/1996) 119 Mean Winter Rainfall 486 Max. 24 hr fall (on 30/12/1996) 180 Winter Rainfall as % of Annual 30 Max 48 hr fall (on 15/07/2004) 187 Mean Spring Rainfall 382 Max 72 hr fall (on 8/07/1998) 206 Spring Rainfall as % of Annual 24
Rainfall Intensities (mm) (Depth-Duration Frequency) EV1 Probability Weighted Moments (HIRDS Ver 1.50b)
Return Period (years) 2 5 10 20 50 100 Duration 1 hour 30 (34) 35 (47)_ 39 (56) 42 (64)
12 hours 89 (103) 101(138) 110 (160) 117 (182) 24 hours 115 (138) 134 (183) 148 (214) 162 (243) 48 hours 139 (171) 160 (227) 174 (265) 185 (301) 72 hours 149 (189) 174 (252) 192 (294) 206 (334)
Monthly Statistics (mm)
Jan Feb Mar Apr May Jun Jul Aug Sep Oct Nov Dec Ann Min 4 15 63 13 44 75 7 61 53 49 46 22 452 Median 79 101 106 160 116 172 182 137 135 122 109 108 1527 Mean 92 106 124 140 135 180 165 137 131 125 128 139 1602 Max 215 241 244 354 258 360 367 275 282 210 323 344 3473
Annual Summary Year Total (mm) Rain Days Year Total (mm) Rain Days Year Total (mm) Rain Days 1982 1990 1615 141 1998 1578 122 1983 1991 1700 155 1999 1856 131 1984 1992 1625 140 2000 1623 138 1985 1993 952 117 2001 1890 146 1986 1994 1320 131 2002 1311 134 1987 1995 2002 173 2003 1560 148 1988 1996 1852 152 2004 1947 151 1989 1997 1448 125 2005 1339 172

Environment Bay of Plenty 185
Environment Bay of Plenty Automatic Rainfall Recording Station
Raingauge Otara Location Tutaetoko Site Number 871302 Grid Reference X16: 926 280 Recorder Type Tipping Bucket Altitude 790 metres Start of Record December 1989 Data Capture Rate 97% Data Summary From January 1990 To December 2005 Data Audited From January 1990 To December 2005 General Comments
Site is operated by Environment Bay of Plenty as part of its Natural Environment Regional Monitoring Network. TB3 Tipping bucket is installed on a pole approximately 1 metre above ground level, 4 metres north west of the recorder hut. Periods of missing or synthetic record may occur in this dataset. Users are advised to contact the recording authority for further details.
SITE LOCATION Otara at Tutaetoko

186 Environmental Publication 2007/06
Environment Bay of Plenty Automatic Rainfall Summary
Date Complied November 2006 Site Number 871302 Compiled by G R Ellery Raingauge Otara Metric Map Reference X16: 926 280 Location Tutaetoko Altitude 790 metres Catchment Otara Period of Summary 1990 to 2005
Rainfall Totals (mm) Mean Annual Rainfall 2382 Mean Summer Rainfall 525 Summer Rainfall as % of Annual 22 Mean Autumn Rainfall 530 Max. 1 hr fall (on 23/03/1997) 38 Autumn Rainfall as % of Annual 22 Max. 12 hr fall (on 17/02/1991) 197 Mean Winter Rainfall 704 Max. 24 hr fall (on 17/02/1991) 264 Winter Rainfall as % of Annual 30 Max 48 hr fall (on 16/02/1991) 264 Mean Spring Rainfall 627 Max 72 hr fall (on 16/02/1191) 289 Spring Rainfall as % of Annual 26
Rainfall Intensities (mm) (Depth-Duration Frequency) EV1 Probability Weighted Moments (HIRDS Ver 1.50b)
Return Period (years) 2 5 10 20 50 100 Duration 1 hour 30 (36) 34 (50) 36 (59) 38 (68)
12 hours 104 (120) 125 (160) 142 (186) 160 (212) 24 hours 142 (162) 174 (215) 203 (251) 233 (285) 48 hours 180 (200) 211 (267) 234 (311) 254 (353) 72 hours 201 (222) 237 (296) 265 (345) 292 (391)
Monthly Statistics (mm)
Jan Feb Mar Apr May Jun Jul Aug Sep Oct Nov Dec Ann Min 44 31 65 17 38 97 23 68 113 119 80 35 730 Median 127 161 157 184 240 242 207 229 207 221 180 186 2341 Mean 152 178 164 168 194 227 233 239 216 219 194 201 2385 Max 301 368 262 380 308 381 615 466 434 365 443 460 4783
Annual Summary Year Total (mm) Rain Days Year Total (mm) Rain Days Year Total (mm) Rain Days 1982 1990 Incomplete Record 1998 2650 179 1983 1991 2601 158 1999 2602 185 1984 1992 2607 159 2000 2453 196 1985 1993 1697 139 2001 2675 203 1986 1994 2478 185 2002 2027 197 1987 1995 Incomplete Record 2003 2576 219 1988 1996 2499 179 2004 2776 208 1989 1997 1815 172 2005 1895 208

Environment Bay of Plenty 187
Environment Bay of Plenty Automatic Rainfall Recording Station
Raingauge Pakihi Location Pakihi Station Site Number 871410 Grid Reference X16:979 325 Recorder Type Tipping Bucket Altitude 80 metres Start of Record March 1970 Data Capture Rate 86% Data Summary From January 1976 To December 2005 Data Audited From November 1989 To December 2005
General Comments Site is operated by Environment Bay of Plenty as part of its Natural Environment Regional Monitoring Network.
Rainfall from March 1970 to June 1986 is from Meteorological Service daily raingauges (B87141 and B87142). There is no record between October 1970 and March 1976, or June 1986 and March 1990.
An OTA tipping bucket and Aquitel Remote was installed on 1 November 1989, recording at 15 minute intervals. The OTA tipping bucket is installed on top of a pole supporting the swing bridge on the right bank of the Pakihi Stream.
Periods of missing or synthetic record may occur in this dataset. Users are advised to contact the recording authority for further details. Synthetic data is based on comparisons with the following sites: Manual daily reader (870304), Otara at Browns Bridge (781410) and Pakihi at Rakanui Link (872507).
SITE LOCATION Pakihi at Pakihi Station

188 Environmental Publication 2007/06
Environment Bay of Plenty Automatic Rainfall Summary
Date Complied November 2006 Site Number 871410 Compiled by G R Ellery Raingauge Pakihi Metric Map Reference X16:979 325 Location Pakihi Station
Altitude 80 metres Catchment Otara Period of Summary 1976 t0 2005
Rainfall Totals (mm) Mean Annual Rainfall 2229 Mean Summer Rainfall 482 Summer Rainfall as % of Annual 22 Mean Autumn Rainfall 563 Max. 1 hr fall (on 12/01/2002) 44 Autumn Rainfall as % of Annual 25 Max. 12 hr fall (on 22/01/1989) 159 Mean Winter Rainfall 599 Max. 24 hr fall (on 10/03/1979) 230 Winter Rainfall as % of Annual 27 Max 48 hr fall (on 11/11/1978)) 368 Mean Spring Rainfall 590 Max 72 hr fall (on 10/11/1978) 371 Spring Rainfall as % of Annual 26
Rainfall Intensities (mm) (Depth-Duration Frequency) EV1 Probability Weighted Moments (HIRDS Ver 1.50b)
Return Period (years) 2 5 10 20 50 100 Duration 1 hour 24 (37) 34 (51) 41 (60) 46 (60) 51 (81)
12 hours 106 (118) 130 (157) 145 (182) 158 (182) 171 (239) 24 hours 148 (158) 182 (210) 204 (245) 227 ( 245) 254 (321) 48 hours 188 (196) 236 (260) 276 (303) 314 (303) 364 (398) 72 hours 203 (217) 253 (289) 295 (337) 338 (337) 395 (441)
Monthly Statistics (mm)
Jan Feb Mar Apr May Jun Jul Aug Sep Oct Nov Dec Ann Min 0 18 71 7 11 96 9 6 77 44 84 1 424 Median 121 139 148 204 172 213 183 163 202 169 173 180 2066 Mean 119 167 182 191 186 236 186 174 197 195 200 194 2226 Max 277 484 627 428 419 549 419 360 393 506 418 504 5384
Annual Summary Year Total (mm) Rain Days Year Total (mm) Rain Days Year Total (mm) Rain Days 1982 1815 141 1990 Incomplete Record 1998 Incomplete Record 1983 2454 146 1991 2269 172 1999 2728 148 1984 2582 164 1992 2228 164 2000 2328 147 1985 2009 143 1993 1409 133 2001 2847 161 1986 Incomplete Record 1994 2157 165 2002 1989 147 1987 Incomplete Record 1995 2081 172 2003 2720 156 1988 Incomplete Record 1996 Incomplete Record 2004 2517 160 1989 Incomplete Record 1997 2006 145 2005 1628 153

Environment Bay of Plenty 189
Environment Bay of Plenty Automatic Rainfall Recording Station
Raingauge Pakihi Location Rakanui Site Number 872507 Grid Reference X16:064 216 Recorder Type Tipping bucket Altitude 715 metres Start of Record May 1991 Data Capture Rate 99% Data Summary From January 1992 To December 2005 Data Audited From May 1991 To December 2005 General Comments
Site is operated by Environment Bay of Plenty as part of its Natural Environment Regional Monitoring Network. Periods of missing or synthetic record may occur in this dataset. Users are advised to contact the recording authority for further details.
SITE LOCATION Pakihi at Rakanui Link

190 Environmental Publication 2007/06
Environment Bay of Plenty Automatic Rainfall Summary
Date Complied November 2006 Site Number 872507 Compiled by G R Ellery Raingauge Pakihi Metric Map Reference X16: 064 216 Location Rakanui Altitude 715 metres Catchment Pakihi Period of Summary 1992 to 2005
Rainfall Totals (mm) Mean Annual Rainfall 2035 Mean Summer Rainfall 421 Summer Rainfall as % of Annual 21 Mean Autumn Rainfall 474 Max. 1 hr fall (on 13/012004) 34 Autumn Rainfall as % of Annual 23 Max. 12 hr fall (on 3/10/2003) 114 Mean Winter Rainfall 593 Max. 24 hr fall (on 30/03/1996) 134 Winter Rainfall as % of Annual 29 Max 48 hr fall (on 7/02/1996) 167 Mean Spring Rainfall 546 Max 72 hr fall (on 9/07/1998) 214 Spring Rainfall as % of Annual 27
Rainfall Intensities (mm) (Depth-Duration Frequency) EV1 Probability Weighted Moments (HIRDS Ver 1.50b)
Return Period (years) 2 5 10 20 50 100 Duration 1 hour 27 (28) 31 (38) 33 (45) 34 (51)
12 hours 77 (92) 90 (122) 102 (142) 112 (161) 24 hours 106 (126) 118 (168) 126 (195) 132 (222) 48 hours 134 (156) 154 (208) 166 (242) 176 (275) 72 hours 159 (173) 185 (230) 202 (268) 215 (305)
Monthly Statistics (mm)
Jan Feb Mar Apr May Jun Jul Aug Sep Oct Nov Dec Ann Min 12 31 58 26 79 101 19 57 80 104 97 45 709 Median 95 119 158 152 186 223 202 147 175 166 178 155 1956 Mean 89 140 153 137 180 236 197 158 184 192 172 176 2014 Max 176 293 269 234 267 382 452 298 434 364 257 431 3857
Annual Summary Year Total (mm) Rain Days Year Total (mm) Rain Days Year Total (mm) Rain Days 1982 1990 1998 2228 177 1983 1991 1999 2229 196 1984 1992 1912 196 2000 2004 182 1985 1993 1283 164 2001 2115 206 1986 1994 1758 182 2002 1941 192 1987 1995 1830 190 2003 2488 224 1988 1996 2566 203 2004 2333 204 1989 1997 1855 177 2005 1949 210

Environment Bay of Plenty 191
Environment Bay of Plenty Automatic Rainfall Recording Station
Raingauge Haparapara Location Haparapara Site Number 778801 Grid Reference Y15: 368 615 Recorder Type Tipping Bucket Altitude 1040 metres Start of Record 20 June 1996 Data Capture Rate 100% Data Summary From 1 January 1997 To 31 December 2005 Data Audited From 20 June 1996 To 31 December 2005 General Comments Site is operated by Environment Bay of Plenty as part of its Natural Environmental Monitoring Network.
Periods of missing or synthetic record may occur in this dataset. Users are advised to contact the recording authority for further details.
SITE LOCATION Haparapara at Haparapara

192 Environmental Publication 2007/06
Environment Bay of Plenty Automatic Rainfall Summary
Date Complied November 2006 Site Number 778801 Compiled by G R Ellery Raingauge Haparapara Metric Map Reference Y15: 368 615 Location Haparapara Altitude 1040 Catchment Haparapara Period of Summary 1997 to 2005
Rainfall Totals (mm) Mean Annual Rainfall 4400 Mean Summer Rainfall 812 Summer Rainfall as % of Annual 18 Mean Autumn Rainfall 1031 Max. 1 hr fall (on 30/12/1996) 42 Autumn Rainfall as % of Annual 23 Max. 12 hr fall (on 08/12/2001) 234 Mean Winter Rainfall 1364 Max. 24 hr fall (on 08/12/2001) 344 Winter Rainfall as % of Annual 31 Max 48 hr fall (on 07/12/2001) 570 Mean Spring Rainfall 1194 Max 72 hr fall (on 07/12/2001) 627 Spring Rainfall as % of Annual 27
Rainfall Intensities (mm) (Depth-Duration Frequency) EV1 Probability Weighted Moments (HIRDS Ver 1.50b)
Return Period (years) 2 5 10 20 50 100 Duration 1 hour 34 (44) 39 (61) 42 (72)
12 hours 184 (128) 206 (170) 227 (198) 24 hours 264 (174) 301 (231) 332 (269) 48 hours 341 (215) 415 (287) 491 (334) 72 hours 412 (239) 497 (318) 572 (370)
Monthly Statistics (mm)
Jan Feb Mar Apr May Jun Jul Aug Sep Oct Nov Dec Ann Min 74 45 103 44 187 225 189 190 145 244 179 187 1812 Median 192 213 272 313 495 605 355 376 387 485 329 343 4365 Mean 183 242 259 299 463 540 479 338 403 454 339 393 4392 Max 332 572 450 539 704 858 1397 476 774 658 676 962 8398
Annual Summary Year Total (mm) Rain Days Year Total (mm) Rain Days Year Total (mm) Rain Days 1982 1990 1998 6178 208 1983 1991 1999 4572 202 1984 1992 2000 3408 193 1985 1993 2001 4701 217 1986 1994 2002 4054 206 1987 1995 2003 4889 212 1988 1996 2004 4909 213 1989 1997 3852 202 2005 3039 231

Environment Bay of Plenty 193
3.5 River Flow Data Summaries
The river flow data summaries in this chapter are provided in the following sequences of 4 pages per station:
Page 1 Provides general information regarding the station, such as its location, instrument types, start of record, etc.
Page 2 Lists station comments that should be read in conjunction with the results of the data summary. Note that these comments are an edited selection of the full set of comments. Contact the recording authority for a full set of comments if required.
Page 3 Displays the Summary information.
Page 4 Graphical presentation of a selection of parameters provided in Page 3.
The ID No. in Table 3.5 indicates the order in which individual station data summaries are provided in this report.
Table 3.5 River Flow Monitoring Stations
ID Number
Page No.
River Site Period of Audit
Data Capture Rate (%)
1 187 Kauri Point Trib Tahawai Orchard 1991-1994 96 2 191 Tuapiro Woodlands Road 1985-2005 98 3 195 Waipapa Goodalls Road 1984-2005 98 4 199 Mangawhai Omokoroa 1972-2005 100 5 203 Wairoa Above Ruahihi 1991-2005 97 6 207 Wairoa Ruahihi Power Station 1994-2005 95 7 211 Kopurereroa S.H.29 1994-2005 99 8 215 Waimapu McCarrolls 1991-2005 97 9 219 Raparapahoe Above Drop Structure 1992-2005 96
10 223 Waiari Muttons 1967-1994 96 11 227 Mangorewa Saunders Farm 1968-2005 99 12 231 Kaituna Te Matai 1956-2005 97 13 235 Kaituna Taaheke 1906-2005 98 14 239 Ngongotaha S.H.5 Bridge 1976-2005 100 15 243 Utuhina S.H.5 Bridge 1968-1996 97 16 247 Puarenga F.R.I 1976-1996 98 17 251 Puarenga Hemo Gorge 1983-1996 100 18 255 Roto-a-tamaheke Path 1985-2000 98 19 259 Te Kokonga Bathhouse 1985-2000 95 20 263 Pongakawa Old Coach Road 1998-2005 97 21 267 Tarawera Awakaponga 1949-2005 99 22 271 Tarawera Lake Outlet 1972-2005 100 23 275 Rangitaiki Te Teko 1949-2005 100 24 279 Rangitaiki Murupara 1949-2005 98 25 283 Whirinaki Galatea 1953-2005 96 26 287 Whakatane Whakatane 1957-2005 100 27 291 Waimana Gorge 1951-1979 98 28 295 Waimana Ranger Station 1996-2005 100 29 299 Waimana Olgilvies Bridge 1969-1995 99 30 303 Nukuhou Quarry 1991-2005 98

194 Environmental Publication 2007/06
ID Number
Page No.
River Site Period of Audit
Data Capture Rate (%)
31 307 Waioeka Cableway 1959-2005 95 32 311 Otara Browns Bridge 1980-2005 90 33 315 Motu Houpoto 1958-2005 99

Environment Bay of Plenty 195

Environment Bay of Plenty 197
Environment Bay of Plenty River Flow Recording Station
River Kauri Point Tributary Site Tahawai Orchard Site Number 13309 Grid Reference T13:693 066 Start of Record May 1990 Data Capture Rate 96% Data Summary From January 1991 To December 1994 Data Audited From May 1990 To December 1994 Equipment History Float/counterweight system with shaft encoder. 1mm resolution. Comments on Stage/Discharge Ratings
Control is by insensitive artificial weir. Ratings available to convert stage (mm) to flow (l/s).
General Comments
Site was operated by Environment Bay of Plenty as part of its investigation of the Tauranga Harbour
SITE LOCATION Kauri Point Tributary at Tahawai Orchard

198 Environmental Publication 2007/06
Station Comments Kauri Point Tributary at Tahawai Orchard. Site Number 13309, on River Number 133000. The local recording authority is Environment Bay of Plenty The control is by an artificial weir. Site installed as part of Environment Bay of Plenty investigations of the Tauranga harbour. 30/05/90 - Plywood weir and recording tower installed. 21/06/90 - Water found to be overtopping stopbank upstream of weir. Low bank raised slightly to force flow through weir. 02/08/90 - Low bank raised again slightly. 27/03/92 - Missing record from 920327 at 134600 to 920409 at 123000 due to recorder malfunction. 10/05/92 - Missing record from 920510 at 083000 to 920511 at 140000 due to recorder malfunction. 28/07/92 - Missing record from 920728 at 210000 to 920810 at 091500 due to recorder malfunction. 18/01/94 - Wooden retaining wall installed on the right bank between recorder and weir to stop erosion from cattle. 25/02/94 - Missing record from 940225 at 124500 to 940323 at 161500 due to tape not being able to be processed. 23/03/94 - Wooden retaining wall installed on the left bank, upstream of weir to stop erosion from cattle. Also missing record from 940225 131500 to 940323 150000 due to tape being ripped. 22/10/94 - Missing record from 941022 at 173000 to 941025 at 133000 due to recorder malfunction. 24/11/94 - Missing data from 941124 at 221500 to 941125 at 135800 due to recorder failure. 01/02/95 - Missing record from 950201 at 131500 to 950208 at 083000 due to recorder time error. 07/06/95 - Missing record from 950607 at 023000 to 950626 at 114500 due to battery voltage dropping too low. 25/07/95 - Site closed on 950725 141500, recorder and stilling well removed. Plywood weir considered to have been an insensitive weir structure. There are periods of missing record throughout the data set. In some cases gaps have been replaced with synthetic data derived from comparison with Tuapiro at Woodlands Road (13310) and rainfall records.
For additional information, please see recording authority.

Environment Bay of Plenty 199
Environment Bay of Plenty Hydrological Flow Summary
Date Complied June 2006 Site Number 13309 Compiled by Glenn Ellery River Kauri Point Tributary Station Tahawai Orchard Metric Map Reference T13:693 066 Catchment Area (km2) 2.6 Period of Summary 1991 to 1994
Statistical Summary Flow (l/s)
Minimum Flow 0.9 Maximum Flow 2456.5 Mean Annual Minimum Flow 1.8 Mean Annual Maximum Flow 1372.6 Mean Flow 46.3 Mean Summer Flow 28.2 Median Flow 27.6 Mean Autumn Flow 18.0 Mean Specific Flow (/km2) 17.8 Mean Winter Flow 75.3 Mean Spring Flow 61.6 Low Flow Distribution Fit Gumbel Peak Flow Distribution Fit Gumbel 7 day Low Flow (Minimum) 2.1 Peak Flow (5 yr Return) 2300 7 Day Low Flow (Mean Annual) 2.7 Peak Flow (10 yr Return) 7 day Low Flow (5 yr Return) 2.1 Peak Flow (20 yr Return) 7 Day Low Flow (10 yr Return) Peak Flow (50 yr Return) Peak Flow (100 yr Return)
Annual Summaries Flow (l/s) Flow (l/s) Year
Minimum Mean Maximum Year
Minimum Mean Maximum 1980 1993 1.8 25.6 310 1981 1994 3.1 71.5 2456 1982 1995 1983 1996 1984 1997 1985 1998 1986 1999 1987 2000 1988 2001 1989 2002 1990 2003 1991 1.4 29.6 354 2004 1992 0.9 61.6 2370 2005
Flow Distribution Flow (l/s)
Percentiles 0 1 2 3 4 5 6 7 8 9 0 2457 294 227 195 164 144 130 120 113 108 10 103 99 94 90 87 84 82 79 76 75 20 73 71 69 67 65 63 61 60 58 56 30 54 53 52 50 48 47 46 45 43 42 40 40 39 37 36 35 33 32 31 30 29 50 28 26 25 24 23 22 21 20 19 18 60 17 16 15 14 13 12 12 11 11 10 70 9 9 9 8 8 8 7 7 7 6 80 6 6 6 5 5 5 5 5 4 4 90 4 4 4 3 3 3 3 2 2 2 100 1

200 Environmental Publication 2007/06
0
500
1000
1500
2000
2500
3000
1990 1991 1992 1993 1994 1995
Year
Flow
(l/s
)
Maximum Flow
0
0.5
1
1.5
2
2.5
3
3.5
1990 1991 1992 1993 1994 1995
Year
Flow
(l/s
)
Minimum Flow
0
10
20
30
40
50
60
70
80
1990 1991 1992 1993 1994 1995
Year
Flow
(l/s
)
Mean Flow
05
101520253035404550
1990 1991 1992 1993 1994 1995
Year
Flow
(l/s
)
Mean Autumn Flow
0
20
40
60
80
100
120
1990 1991 1992 1993 1994 1995
Year
Flow
(l/s
)
Mean Winter Flow
0
20
40
60
80
100
120
1990 1991 1992 1993 1994 1995
Year
Flow
(l/s
)
Mean Spring Flow
0
10
20
30
40
50
60
1990 1991 1992 1993 1994 1995
Year
Flow
(l/s
)
Mean Summer Flow
Kauri Point Tributary at Tahawai Orchard

Environment Bay of Plenty 201
Environment Bay of Plenty River Flow Recording Station
River Tuapiro Site Woodlands Road Site Number 13310 Grid Reference T13:661 057 Start of Record February 1984 Data Capture Rate 98% Data Summary From January 1995 To December 2005 Data Audited From February 1984 To December 2005 Equipment History Float/counterweight system with shaft encoder. 1mm resolution. Comments on Stage/Discharge Ratings Control is by concrete ford. Stream overtops channel and floods surrounding paddocks at high flows. Ratings available to convert stage (mm) to flow (l/s).
General Comments Site is operated by Environment Bay of Plenty as part of its Natural Environmental Monitoring Network.
SITE LOCATION Tuapiro at Woodlands Road

202 Environmental Publication 2007/06
Station Comments Tuapiro River at Woodlands Road. Site Number 13310, on River Number 133000. The local recording authority is Environment Bay of Plenty. The control is by a stable concrete ford, some movement in bottom end of ratings due to holes through ford filling up and clearing themselves. Spot gaugings carried out since 690318. L&S and recording tower installed 840202. Continuous water level records begin 840202 154500. Top of ford is approximately 0.94 metres on gauge. Bottom of culverts through ford at approximately 0.46 metres on gauge. Ramp corrections applied on numerous occasions since site installed due to debris collecting on ford during flood events. 02/02/84 - Records commenced on 840202 154500. Equipment is a 10 metre L&S digital recorder having a stage ratio of 1mm of stage/mm recorded and a time punch out of 15 minutes. 22/05/84 - Missing record from 840522 at 063000 to 840713 at 140000 due to L&S recorder jamming. 13/07/84 - Missing record from 840713 at 234500 to 840720 at 131500 due to float tape coming off roller. 02/06/86 - Missing record from 860602 at 074500 to 860709 at 124500 due to battery voltage dropping too low to record 11/01/88 - Missing record from 880111 at 120000 to 880125 at 130000 due to L&S recorder jamming. 02/11/89 - Missing record from 891102 at 213000 to 891107 at 123000 due to L&S recorder malfunctioning. 09/12/92 - Missing record from 921209 at 104500 to 921222 at 143000 due to battery voltage dropping too low to record. 13/09/95 - Missing record from 950913 at 063000 to 950920 at 140000 due to aquitel remote failure. 16/01/96 - Missing record from 960116 at 011500 to 960117 at 104500 due to aquitel remote having cold started. 24/01/96 - Missing record from 960124 at 174500 to 960131 at 100000 due to aquitel remote having crashed. 11/02/96 - Missing record from 960211 at 093000 to 960214 at 121500 due to aquitel remote having locked up. 12/03/96 - Missing record from 960312 at 044500 to 960314 at 131500 due to aquitel remote having crashed. 15/03/96 - Missing record from 960315 at 070000 to 960320 at 111500 due to aquitel remote having crashed. 30/12/96 - Missing record 961230 at 174500 to 970107 at 150000 due to upstream suspension bridge being destroyed in flood and washing onto recorder, demolishing recorder hut. 18/10/97 - Missing record from 971018 at 060000 to 971021 at 113000 due to aquitel failure. 27/07/98 - Missing record from 980727 at 151500 to 980729 at 113000 due to aquitel failure. 21/04/00 - Missing record from 1000421 at 114500 to 1000427 at 234500 due to rats chewing through power cables. 12/01/02 - Missing record from 1020112 53000 to 1020113 60000 due to deterioration of comms quality. 07/09/04 - Missing record from 20040907 093000 to 20040907 153000 due to communications problems (faulty GPRS unit).
For additional information, please see recording authority.

Environment Bay of Plenty 203
Environment Bay of Plenty Hydrological Flow Summary
Date Complied June 2006 Site Number 13310 Compiled by Glenn Ellery River Tuapiro Station Woodlands Road Metric Map Reference T13:661 057 Catchment Area (km2) 39.05 Period of Summary 1985 to 2005
Statistical Summary Flow (l/s)
Minimum Flow 230 Maximum Flow 140618 Mean Annual Minimum Flow 373 Mean Annual Maximum Flow 79989 Mean Flow 1867 Mean Summer Flow 1575 Median Flow 1013 Mean Autumn Flow 1505 Mean Specific Flow (/km2) 48 Mean Winter Flow 2651 Mean Spring Flow 1793 Low Flow Distribution Fit GEV Peak Flow Distribution Fit Gumbel GEV 7 day Low Flow (Minimum) 249 Peak Flow (5 yr Return) 105600 107300 7 Day Low Flow (Mean Annual) 375 Peak Flow (10 yr Return) 126400 126100 7 day Low Flow (5 yr Return) 331 Peak Flow (20 yr Return) 143400 143000 7 Day Low Flow (10 yr Return) 302 Peak Flow (50 yr Return) Peak Flow (100 yr Return)
Annual Summaries Flow (l/s) Flow (l/s) Year
Minimum Mean Maximum Year
Minimum Mean Maximum 1980 1993 359 1231 32114 1981 1994 356 1919 81351 1982 1995 320 2097 124385 1983 1996 482 2322 133137 1984 1997 372 1667 77722 1985 376 2182 90458 1998 366 2030 75831 1986 380 1447 77052 1999 427 1410 49903 1987 319 1652 127673 2000 315 1550 68514 1988 451 2264 62990 2001 276 2544 73528 1989 466 3129 109285 2002 430 1376 52092 1990 437 1710 59094 2003 389 1931 112552 1991 230 1222 28316 2004 385 1560 44546 1992 396 2141 58601 2005 303 1836 140618
Flow Distribution Flow (l/s)
Percentiles 0 1 2 3 4 5 6 7 8 9 0 140618 14661 9424 7185 5963 5256 4773 4413 4151 3942 10 3759 3604 3453 3298 3129 2934 2743 2574 2437 2323 20 2219 2124 2042 1969 1900 1837 1776 1724 1675 1625 30 1581 1539 1500 1461 1423 1386 1352 1320 1289 1261 40 1233 1207 1182 1158 1134 1112 1092 1070 1051 1031 50 1013 994 978 960 943 926 910 895 881 866 60 851 837 825 811 798 785 772 760 748 735 70 722 710 699 686 673 659 646 633 621 610 80 598 586 573 559 546 533 521 511 499 487 90 475 464 451 438 425 413 399 379 352 323 100 230

204 Environmental Publication 2007/06
0
20000
40000
60000
80000
100000
120000
140000
160000
1985 1990 1995 2000 2005
Year
Flow
(l/s
)
Maximum Flow 5 per. Mov. Avg. (Maximum Flow )
0
100
200
300
400
500
600
1985 1990 1995 2000 2005
Year
Flow
(l/s
)
Minimum Flow 5 per. Mov. Avg. (Minimum Flow )
0
500
1000
1500
2000
2500
3000
3500
1985 1990 1995 2000 2005
Year
Flow
(l/s
)
Mean Flow 5 per. Mov. Avg. (Mean Flow )
0
500
1000
1500
2000
2500
3000
3500
4000
1985 1990 1995 2000 2005
Year
Flow
(l/s
)
Mean Autumn Flow 5 per. Mov. Avg. (Mean Autumn Flow )
0500
100015002000250030003500400045005000
1985 1990 1995 2000 2005
Year
Flow
(l/s
)
Mean Winter Flow 5 per. Mov. Avg. ( Mean Winter Flow )
0500
10001500200025003000350040004500
1985 1990 1995 2000 2005
Year
Flow
(l/s
)
Mean Spring Flow 5 per. Mov. Avg. ( Mean Spring Flow )
0500
100015002000250030003500400045005000
1985 1990 1995 2000 2005
Year
Flow
(l/s
)
Mean Summer Flow 5 per. Mov. Avg. ( Mean Summer Flow )
Tuapiro at Woodlands Road

Environment Bay of Plenty 205
Environment Bay of Plenty River Flow Recording Station
River Waipapa Site Goodalls Road Site Number 13805 Grid Reference U14:737 824 Start of Record May 1983 Data Capture Rate 98% Data Summary From January 1984 To December 2005 Data Audited From May 1983 To December 2005 Equipment History
Foxboro recorder installed on 25 May 1983. 28mm resolution. Float/counterweight system with shaft encoder installed 21 March 1984. 1mm resolution. Comments on Stage/Discharge Ratings Control is solid ignimbrite and concrete weir. Ratings available to convert stage (mm) to flow (l/s).
General Comments Site is operated by Environment Bay of Plenty as part of its Natural Environmental Monitoring Network. Site was operated by DSIR Rotorua between 18/12/87 and 01/07/92.
SITE LOCATION Waipapa at Goodalls Road

206 Environmental Publication 2007/06
Station Comments Waipapa Stream at Goodall Road. Site Number 13805, on River Number 13800. The local recording authority is Environment Bay of Plenty. 25/05/83 - 3 metre monthly Foxboro recorder installed on 830525 120000. Recorder has a time resolution of 281 minutes to 1mm recorded and a stage resolution of 28mm of stage to 1mm recorded. 21/03/84 - Missing record from 840321 131500 to 840406 143000 during which the Foxboro was removed and replaced by 100mm pulley L&S digital with a stage resolution of 1 mm and a recording interval of 15 minutes. A 4 metre long stainless steel cylinder and wooden recorder house installed on 840604. 22/05/84 - New concrete control installed on left bank of low flow channel. 01/06/84 - Due to a ripped tape no data was recorded for the period 840601 at 90000 to 840704 at 111300. 04/07/84 - Due to a recorder malfunction no data was recorded for the period 840704 at 111300 to 840720 at 121500 18/12/87 - Site handed over to Rotorua DSIR to operate. Site handed over to BOPRC to operate on 01/07/92. 19/10/93 - Concrete control extended on right bank. Water now flows through unconcreted gap in the middle of the stream until level gets above staff gauge reading 0.511, water then overtops concrete control. 10/04/95 - Missing record from 950410 at 220000 to 950419 at 123000. 07/06/95 - No data was recorded for the period 950607 at 41500 to 950607 at 164500 due battery failure. 28/06/98 - Missing record 960628 at 043000 to 960628 at 164500 due to battery failure. 14/09/98 - Missing record from 980914 at 051500 to 980917 at 030000 due to aquitel failure. 12/01/99 - Missing record from 990112 at 103000 to 990120 at 123000 due to power supply failure after solar panel being stolen. 28/08/00 - Missing record from 2000828 at 131500 to 2000905 at 114500 due to aquitel remote failure. 22/11/04 - Missing record from 20011122 at 173000 to 20011123 at 94500 due to aquitel remote being reset. 10/03/04 - Missing record from 20040310 at 154500 to 20040319 at 141500 due to incorrect data being removed. 10/04/04 - Missing record from 20040410 at 090000 to 20040422 at 141500 due to incorrect data being removed. 29/04/04 - Missing record from 20040429 at 020000 t0 20040501 at 034500 due to logger failure. 15/05/04 - Missing record from 20040515 014500 to 20040525 104500 due to Handar encoder failure. 16/07/04 - Missing record from 20040716 at 180000 to 20040721 at 104500 due to incorrect data being removed
For additional information, please see recording authority.

Environment Bay of Plenty 207
Environment Bay of Plenty Hydrological Flow Summary
Date Complied May 2006 Site Number 13805 Compiled by Glenn Ellery River Waipapa Station Goodalls Road Metric Map Reference U14:737 824 Catchment Area (km2) 8.5 Period of Summary 1984 to 2005
Statistical Summary Flow (l/s)
Minimum Flow 39 Maximum Flow 40361 Mean Annual Minimum Flow 59 Mean Annual Maximum Flow 24858 Mean Flow 485 Mean Summer Flow 406 Median Flow 236 Mean Autumn Flow 398 Mean Specific Flow (/km2) 57 Mean Winter Flow 683 Mean Spring Flow 508 Low Flow Distribution Fit GEV Peak Flow Distribution Fit Gumbel GEV 7 day Low Flow (Minimum) 40 Peak Flow (5 yr Return) 30400 30900 7 Day Low Flow (Mean Annual) 60 Peak Flow (10 yr Return) 34900 34800 7 day Low Flow (5 yr Return) 52 Peak Flow (20 yr Return) 39200 38200 7 Day Low Flow (10 yr Return) 47 Peak Flow (50 yr Return) Peak Flow (100 yr Return)
Annual Summaries Flow (l/s) Flow (l/s) Year
Minimum Mean Maximum Year
Minimum Mean Maximum 1980 1993 53 327 15948 1981 1994 53 501 19745 1982 1995 39 615 29712 1983 1996 84 506 20317 1984 56 337 40361 1997 59 421 20701 1985 78 504 25972 1998 54 622 35503 1986 56 424 23187 1999 59 547 36096 1987 40 377 28055 2000 44 426 22280 1988 63 508 17174 2001 56 611 29144 1989 56 686 17385 2002 67 333 15665 1990 58 531 23786 2003 58 457 24453 1991 58 327 13813 2004 44 564 29813 1992 78 517 30627 2005 77 523 27148
Flow Distribution Flow (l/s)
Percentiles 0 1 2 3 4 5 6 7 8 9 0 40361 4706 2781 2045 1700 1455 1270 1139 1041 964 10 897 842 798 761 722 686 652 622 595 570 20 550 530 513 498 484 472 460 448 437 424 30 410 396 383 372 361 351 342 332 324 316 40 307 299 292 284 276 269 261 255 248 242 50 236 230 224 220 215 210 206 202 197 194 60 190 186 183 179 176 172 169 166 163 159 70 156 152 149 147 143 140 137 134 131 127 80 124 121 118 114 111 108 104 101 98 94 90 91 87 84 80 77 74 70 67 62 56 100 39

208 Environmental Publication 2007/06
0
5000
10000
15000
20000
25000
30000
35000
40000
45000
1984 1989 1994 1999 2004
Year
Flow
(l/s
)
Maximum Flow 5 per. Mov. Avg. (Maximum Flow )
0
10
20
30
40
50
60
70
80
90
1984 1989 1994 1999 2004
Year
Flow
(l/s
)
Minimum Flow 5 per. Mov. Avg. (Minimum Flow )
0
100
200
300
400
500
600
700
800
1984 1989 1994 1999 2004
Year
Flow
(l/s
)
Mean Flow 5 per. Mov. Avg. (Mean Flow )
0
200
400
600
800
1000
1200
1984 1989 1994 1999 2004
Year
Flow
(l/s
)
Mean Autumn Flow 5 per. Mov. Avg. (Mean Autumn Flow )
0200400600800
1000120014001600
1984 1989 1994 1999 2004
Year
Flow
(l/s
)
Mean Winter Flow 5 per. Mov. Avg. ( Mean Winter Flow )
0
200
400
600
800
1000
1200
1984 1989 1994 1999 2004
Year
Flow
(l/s
)
Mean Spring Flow 5 per. Mov. Avg. ( Mean Spring Flow )
0
200
400
600
800
1000
1200
1400
1984 1989 1994 1999 2004
Year
Flow
(l/s
)
Mean Summer Flow 5 per. Mov. Avg. ( Mean Summer Flow )
Waipapa at Goodalls

Environment Bay of Plenty 209
Environment Bay of Plenty River Flow Recording Station
River Mangawhai Site Omokoroa Site Number 13901 Grid Reference U14: 767 877 Start of Record July 1972 Data Capture Rate 100% Data Summary From January 1972 To December 2005 Data Audited From January 1972 To December 2005 Equipment History 23/03/71: 5 foot range weekly Lea chart recorder. 21/05/74: 15 minute F&P digital recorder. 21/05/74: Backup 1.5 metre Foxboro chart recorder. 26/09/93: 10 metre range encoder & WRIC data logger. Comments on Stage/Discharge Ratings Site control is by shallow V-plate on upstream end of the approach apron to a square box culvert. The upper end of the rating curves has been derived using the MWD culvert manual hydraulic formula. The maximum discharge obtained from these curves appears very large. This has caused debate over whether they are correct. Please see the operating authority for further information. Ratings are available to convert Stage (mm) to Flow (l/s). General Comments Site is operated by NIWA, Rotorua. The site was established as a representative basin for the Tauranga Region.
SITE LOCATION Mangawhai at Omokoroa

210 Environmental Publication 2007/06
Station Comments Mangawhai River at Omokoroa. Site Number 13901, on River Number 139000. The local recording authority is NIWA, Rotorua. Control is by shallow v-plate on upstream end of the approach apron to a 1.5 metre square box culvert. The culvert becomes the control at an undefined level, although ratings indicate this occurs at approximately when culvert is full. The site was established as a representative basin for the Tauranga region. The upper end of the rating curves for this site have been derived using the MWD culvert manual hydraulic formula. Some discussion has taken place over whether or not these curves are correct as the maximum discharge appears rather large. The storm which occurred on 720511 produced a maximum rainfall intensity of 122mm in two hours. This figure when used in other runoff formula give results consistent with the rating. As there is no evidence of the culvert blocking we have assumed this flow actually occurred. 23/02/71 - Gaugings earlier than 710223 have been filed without a stage value as staff gauge was not installed until this date. Minor stage variations when measuring flows under 50 litres/sec result in large percentage deviations between gauged and rated flows due to the control shape. This is apparent in much of the listed gaugings with deviations greater than 20%, especially those measurements made prior to metrication of the staff gauge on 730312. 23/03/71 - Stage data has been manually obtained from Lea charts by taking chart heights, their associated dates and times at points where the hydrograph gradient changes. This method has given a "straight line" look to much of the filed data. 06/07/71 - Although no supporting documentation can be found, the memory of a staff member confirmed the weir plate originally installed was removed as it was considered too insensitive. The new plate installed has a 172 degree "v", is 0.152 metre deep at the middle with a 0.209 metre horizontal edge on either side. 05/06/81 - Diurnal fluctuations in the stage record became apparent from 810605 due to the increased sensitivity using 0 mm compression. These fluctuations are a catchment characteristic which are recorded on both instruments. 25/02/88 - Data from 880222 174500 to 880225 12300 affected by upstream dams and pumping. 30/10/93 - Data from 931030 231500 to 931031 044500 affected by upstream dams and pumping.
For additional information, please see recording authority.

Environment Bay of Plenty 211
Environment Bay of Plenty Hydrological Flow Summary
Date Complied November 2006 Site Number 13901 Compiled by G R Ellery River Mangawhai Station Omokoroa Metric Map Reference U14: 767 877 Catchment Area (km2) 2.95 Period of Summary 1972 to 2005
Statistical Summary Flow (l/s)
Minimum Flow 3 Maximum Flow 16540 Mean Annual Minimum Flow 9 Mean Annual Maximum Flow 3277 Mean Flow 69 Mean Summer Flow 42 Median Flow 40 Mean Autumn Flow 46 Mean Specific Flow (/km2) 23 Mean Winter Flow 109 Mean Spring Flow 77 Low Flow Distribution Fit GEV Peak Flow Distribution Fit GEV 7 day Low Flow (Minimum) 4 Peak Flow (5 yr Return) 4705 7 Day Low Flow (Mean Annual) 9 Peak Flow (10 yr Return) 6722 7 day Low Flow (5 yr Return) 7 Peak Flow (20 yr Return) 9106 7 Day Low Flow (10 yr Return) 5 Peak Flow (50 yr Return) 13014 Peak Flow (100 yr Return)
Annual Summaries Flow (l/s) Flow (l/s) Year
Minimum Mean Maximum Year
Minimum Mean Maximum 1980 11 51 1508 1993 9 36 887 1981 14 101 1463 1994 6 69 3612 1982 9 33 687 1995 8 93 1401 1983 3 72 4202 1996 13 92 5908 1984 14 49 2348 1997 11 54 3114 1985 9 64 1206 1998 5 77 4008 1986 8 58 7857 1999 9 55 1222 1987 4 49 6661 2000 7 62 1784 1988 15 62 1934 2001 11 93 3621 1989 12 112 1623 2002 11 46 433 1990 9 71 2526 2003 10 71 809 1991 9 51 1071 2004 12 84 5821 1992 3 74 3735 2005 9 83 5803
Flow Distribution Flow (l/s)
Percentiles 0 1 2 3 4 5 6 7 8 9 0 16540 435 305 253 221 200 183 171 161 152 10 146 140 134 129 124 120 115 111 107 103 20 100 97 93 90 88 85 83 80 78 75 30 73 70 68 67 64 62 60 58 57 55 40 54 52 51 49 48 47 45 44 43 41 50 40 39 38 37 36 35 34 33 33 32 60 31 30 29 29 28 27 27 26 25 25 70 24 23 23 22 21 21 20 19 19 18 80 18 17 17 16 15 15 14 14 13 13 90 12 12 11 11 10 10 9 8 7 6 100 3

212 Environmental Publication 2007/06
0
2000
4000
6000
8000
10000
12000
14000
16000
18000
1970 1975 1980 1985 1990 1995 2000 2005
Year
Flow
(l/s
)
Maximum Flow 5 per. Mov. Avg. (Maximum Flow )
0
2
4
6
8
10
12
14
16
1970 1975 1980 1985 1990 1995 2000 2005
Year
Flow
(l/s
)
Minimum Flow 5 per. Mov. Avg. (Minimum Flow )
0
20
40
60
80
100
120
1970 1975 1980 1985 1990 1995 2000 2005
Year
Flow
(l/s
)
Mean Flow 5 per. Mov. Avg. (Mean Flow )
020406080
100120140160180
1970 1975 1980 1985 1990 1995 2000 2005
Year
Flow
(l/s
)
Mean Autumn Flow 5 per. Mov. Avg. (Mean Autumn Flow )
0
50
100
150
200
250
1970 1975 1980 1985 1990 1995 2000 2005
Year
Flow
(l/s
)
Mean Winter Flow 5 per. Mov. Avg. (Mean Winter Flow )
020406080
100120140160180200
1970 1975 1980 1985 1990 1995 2000 2005
Year
Flow
(l/s
)
Mean Spring Flow 5 per. Mov. Avg. (Mean Spring Flow )
0
20
40
60
80
100
120
140
160
1970 1975 1980 1985 1990 1995 2000 2005
Year
Flow
(l/s
)
Mean Summer Flow 5 per. Mov. Avg. (Mean Summer Flow )
Mangawhai at Omokoroa

Environment Bay of Plenty 213
Environment Bay of Plenty River Flow Recording Station
River Wairoa Site Above Ruahihi Site Number 14130 Grid Reference U14:788 759 Start of Record September 1990 Data Capture Rate 97% Data Summary From January 1991 To December 2005 Data Audited From September 1990 To December 2005 Equipment History Pressure transducer. 10mm resolution. Comments on Stage/Discharge Ratings Site control is by natural boulder rapid. The high stage rating (>4.5 metres area velocity curves. Therefore it is provisional at best, and high flow figures should be used with caution. Ratings are available to convert Stage (mm) to Flow (l/s). General Comments When flow is combined with Wairoa at Power Station (14132), it gives a total flow for the Wairoa River downstream of the Ruahihi Power Station. Information is for use in Tauranga Harbour Investigations. Flow at this site is influenced by water released by Kaimai Hydropower. Site is operated by Environment Bay of Plenty as part of its Natural Environment Regional Monitoring Network.
SITE LOCATION Wairoa at Above Ruahihi

214 Environmental Publication 2007/06
Station Comments Wairoa River at Above Ruahihi. Site Number 14130, on River Number 141000. The local recording authority is Environment Bay of Plenty Flow past the site is influenced by water released from Lake McLaren by Kaimai Hydropower. Gaugings are carried out by slackline except for gaugings below stage height 700mm. Gaugings below 700mm are wading gauging downstream of Ngutukakariki Tributary. Wading gauging sections have a very irregular x-section. 03/09/90 - Records commenced at 900903 111500. Instruments installed at site were a Kainga data logger recording at 15 minute interval with a 10 metre range pressure transducer with a stage resolution of +/-20mm. 08/02/91 - Missing record from 910208 at 090000 to 910212 at 141500 due to the WRIC datalogger malfunctioning. 11/04/91 - Missing record from 910411 at 104500 to 910417 at 143000 due to power supply failure. 05/10/91 - Missing record from 911005 at 090200 to 911010 at 113000 due to battery failure. 26/11/91 - Wading gaugings after 911126 are carried out approximately 500 metres below S.H. 29 Bridge. This includes the two side streams, Ngutukakariki and Mangataratara tributaries. 18/03/92 - Missing record from 920318 at 020100 to 920409 at 140000 due to low battery voltage. 29/09/92 - Missing record from 920929 at 91500 to 921023 at 160000 due to low battery voltage. 10/11/93 - Missing record from 931110 at 093000 to 931125 at 140000 due to short in power supply of datalogger. 28/11/93 - Missing record from 931128 at 011500 to 931213 at 103000 due to low battery voltage. 10/08/94 - Missing record from 940810 at 100000 to 940825 at 111500 due to datalogger failure. 12/09/94 - A close scrutiny of gauging cards revealed low quality gauging data as a result of poor gauging site selection. Consequently gaugings on the following dates have been deleted from Tideda records: 900903, 900918, 901101, 901213, 910304, 910411, 910513, 910605, 910611, 910725, 910809, 911126, 930408, 930629, 930915, 931006, 931026, 931110, 931213, 940506, 940603, 940912. 11/06/96 - Missing record 960611 at 170000 to 960612 at 100000 due to fault with logger. 07/08/97 - Missing record for the period 970807 at 1030000 to 970717 at 102400 due to transducer mount slipping. 01/01/98 - Data from 980101 at 0 to 1001116 at 163000 should be used with caution as the pressure transducer was overreading on peaks and had increased sensitivity at low stages. Analysis of stage data and calibrated releases of water by Trustpower identify an increasing over estimation of recorded stage as stage increases. Analysis of raw recorded readings versus external readings gave the following relationship; ESG= 0.7789 x Raw recorded stage + 177mm (R2=0.9863). Stage values above 800mm were adjusted using this formulae to derive correct higher stage readings 16/07/98 - Missing record from 980716 at 034500 to 980609 at 114500 due to power supply failure. 05/05/99 - Missing record from 990505 at 161500 to 990615 at 113000 due to power supply failure. 21/07/00 - Missing record from 1000721 at 050000 to 1000811 at 123000 due to power supply failure. 12/10/04 - Missing record from 1041012 161500 to 1041012 231500 due to logger fault. 11/11/04 - Missing record from 1041111 163000 to 1041111 234500 due to logger fault.
For additional information, please see recording authority.

Environment Bay of Plenty 215
Environment Bay of Plenty Hydrological Flow Summary
Date Complied June 2006 Site Number 14130 Compiled by Glenn Ellery River Wairoa Station Above Ruahihi Metric Map Reference U14:788 759 Catchment Area (km2) 307.5 Period of Summary 1991 to 2005
Statistical Summary Flow (l/s)
Minimum Flow 279 Maximum Flow 454790 Mean Annual Minimum Flow 403 Mean Annual Maximum Flow 325144 Mean Flow 3875 Mean Summer Flow 3189 Median Flow 698 Mean Autumn Flow 3215 Mean Specific Flow (/km2) Mean Winter Flow 5313 Mean Spring Flow 3549 Low Flow Distribution Fit GEV Peak Flow Distribution Fit GEV 7 day Low Flow (Minimum) 374 Peak Flow (5 yr Return) 409500 7 Day Low Flow (Mean Annual) 442 Peak Flow (10 yr Return) 439200 7 day Low Flow (5 yr Return) 413 Peak Flow (20 yr Return) 458700 7 Day Low Flow (10 yr Return) 395 Peak Flow (50 yr Return) Peak Flow (100 yr Return)
Annual Summaries Flow (l/s) Flow (l/s) Year
Minimum Mean Maximum Year
Minimum Mean Maximum 1980 1993 398 2317 352641 1981 1994 365 4034 197153 1982 1995 388 5104 406699 1983 1996 433 4158 380446 1984 1997 410 3175 310721 1985 1998 365 5265 425500 1986 1999 378 5157 454790 1987 2000 279 2476 221103 1988 2001 420 4969 359420 1989 2002 435 2192 277410 1990 2003 440 3090 283641 1991 435 2347 145154 2004 463 5240 425334 1992 400 4254 295000 2005 433 4273 342149
Flow Distribution Flow (l/s)
Percentiles 0 1 2 3 4 5 6 7 8 9 0 454790 55510 30906 21513 18366 15906 14447 12561 10754 9356 10 8174 7234 6436 5737 5097 4505 3968 3481 3023 2620 20 2308 2044 1826 1632 1470 1335 1231 1152 1087 1040 30 1006 977 951 928 908 887 870 853 836 822 40 809 796 783 770 760 749 739 728 718 708 50 698 689 679 669 661 653 646 639 632 624 60 617 610 604 598 592 586 580 574 568 562 70 556 550 545 540 535 530 526 521 516 511 80 506 501 496 492 488 484 480 476 472 468 90 464 460 456 452 448 444 432 419 407 394 100 279

216 Environmental Publication 2007/06
050000
100000150000200000250000300000350000400000450000500000
1990 1992 1994 1996 1998 2000 2002 2004
Year
Flow
(l/s
)
Maximum Flow 5 per. Mov. Avg. (Maximum Flow )
0
50
100
150
200
250
300
350
400
450
500
1990 1992 1994 1996 1998 2000 2002 2004
Year
Flow
(l/s
)
Minimum Flow 5 per. Mov. Avg. (Minimum Flow )
0
1000
2000
3000
4000
5000
6000
1990 1992 1994 1996 1998 2000 2002 2004
Year
Flow
(l/s
)
Mean Flow 5 per. Mov. Avg. (Mean Flow )
0
2000
4000
6000
8000
10000
12000
1990 1992 1994 1996 1998 2000 2002 2004
Year
Flow
(l/s
)
Mean Autumn Flow 5 per. Mov. Avg. (Mean Autumn Flow )
0
2000
4000
6000
8000
10000
12000
14000
1990 1992 1994 1996 1998 2000 2002 2004
Year
Flow
(l/s
)
Mean Winter Flow 5 per. Mov. Avg. (Mean Winter Flow )
0
2000
4000
6000
8000
10000
12000
1990 1992 1994 1996 1998 2000 2002 2004
Year
Flow
(l/s
)
Mean Spring Flow 5 per. Mov. Avg. (Mean Spring Flow )
0
2000
4000
6000
8000
10000
12000
1990 1992 1994 1996 1998 2000 2002 2004
Year
Flow
(l/s
)
Mean Summer Flow 5 per. Mov. Avg. (Mean Summer Flow )

Environment Bay of Plenty 217
Environment Bay of Plenty River Flow Recording Station
River Wairoa Site Power Station Site Number 14132 Grid Reference U14:792 760 Start of Record July 1993 Data Capture Rate 95% Data Summary From January 1994 To December 2005 Data Audited From January 1994 To December 2005 Equipment History Campbell CR10 Datalogger Comments on Stage/Discharge Ratings The catchment area is unnatural due to storage and piping being carried out for the Power Station. Datalogger measures turbine output and converts it back to flow through turbine.
General Comments
The site is installed as a Regional Monitoring Station for measuring flow input into Tauranga Harbour. The site is operated by Environment Bay of Plenty as part of its Natural Environment Monitoring Network.
SITE LOCATION Wairoa at Power Station

218 Environmental Publication 2007/06
Station Comments Wairoa River at Ruahihi Power Station. Site Number 14132, on River Number 141000. The local recording authority is Environment Bay of Plenty The site is situated 12.5 kilometres from the river mouth. Recorder installed is a Campbell datalogger. Output is in megawatts from generator 1 and 2. Combined generator output is then converted to flow using a rating table held on the datalogger. 10/07/93 - Site opened 930710 083600. 25/10/95 - Record for the period 951025 at 114500 to 951219 at 104500 not Processed and may be missing record due to download file having Been corrupted. 08/10/99 - Missing record for the period 991008 at 093000 to 991217 at 133000 due to corrupted data. 12/09/00 - Missing record from 1000912 at 103000 to 1000926 at 020000. Data lost from logger memory. 28/11/01 - Missing record from 1011128 at 131500 to 1011223 at 010000. Data lost from logger memory. 10/05/02 - Missing record from 1020510 at 123000 to 1020605 at 121500. Logger scrambled. 03/10/02 - Missing record from 1021003 at 110000 to 1021028 at 230000. Data lost. 29/07/03 - Missing record from 1030729 at 133000 to 1030810 at 040000. Data lost from logger memory. Data imported from trust power. Only total generation data supplied therefore data split equally in 2 to fit generator 1 and 2. Use this data with caution 24/06/04 - Missing record from 1040624 at 201500 to 1040807 at 043000. Data lost due to communication failure during downloading, and not being able to reconnect to logger. Data then written over on logger. Data imported from Trust Power. Only total generation data supplied therefore data split equally in 2 to fit generator 1 and 2. Use this data with caution. 10/10/04 - Data for Generator 1 recorded as 0 between 20041010 220000 and 20041223 121500. This is due to generator being removed from generation for routine maintenance.
For additional information, please see recording authority.

Environment Bay of Plenty 219
Environment Bay of Plenty Hydrological Flow Summary
Date Complied June 2006 Site Number 14132 Compiled by Glenn Ellery River Wairoa Station Power Station Metric Map Reference U14:792 760 Catchment Area (km2) Period of Summary 1994 to 2005
Statistical Summary Flow (l/s)
Minimum Flow 0 Maximum Flow 28000 Mean Annual Minimum Flow 0 Mean Annual Maximum Flow 26148 Mean Flow 12100 Mean Summer Flow 3459 Median Flow 11140 Mean Autumn Flow 5546 Mean Specific Flow (/km2) Mean Winter Flow 11591 Mean Spring Flow 7033 Low Flow Distribution Fit GEV Peak Flow Distribution Fit GEV 7 day Low Flow (Minimum) 116 Peak Flow (5 yr Return) 26200 7 Day Low Flow (Mean Annual) 7192 Peak Flow (10 yr Return) 26700 7 day Low Flow (5 yr Return) 5729 Peak Flow (20 yr Return) 7 Day Low Flow (10 yr Return) 4153 Peak Flow (50 yr Return) Peak Flow (100 yr Return)
Annual Summaries Flow (l/s) Flow (l/s) Year
Minimum Mean Maximum Year
Minimum Mean Maximum 1980 1993 1981 1994 0 11515 25730 1982 1995 0 13110 25720 1983 1996 0 13410 25810 1984 1997 0 12214 25780 1985 1998 0 12627 25900 1986 1999 0 11611 26040 1987 2000 0 11842 25640 1988 2001 0 12053 25720 1989 2002 0 11047 25830 1990 2003 0 11676 28000 1991 2004 0 11111 28000 1992 2005 0 12878 25600
Flow Distribution Flow (l/s)
Percentiles 0 1 2 3 4 5 6 7 8 9 0 28000 25440 25334 25262 25195 25120 25049 24970 24862 24705 10 24379 23791 23395 23008 22404 22271 22194 22139 22098 22059 20 22022 21997 21964 21929 21898 21865 21825 21787 21728 21652 30 21309 20125 17957 14945 13490 13412 13381 13320 13264 13156 40 12904 12542 12339 12089 11691 11435 11257 11211 11190 11164 50 11140 11120 11101 11091 11075 11058 11039 11020 11006 10992 60 10972 10952 10930 10907 10893 10867 10835 10800 10754 10549 70 10160 9988 8473 4699 269 113 13 12 12 11 80 10 10 9 9 8 8 7 7 6 6 90 5 5 4 4 3 3 2 2 1 1 100 0

220 Environmental Publication 2007/06
25000
25500
26000
26500
27000
27500
28000
28500
1994 1996 1998 2000 2002 2004
Year
Flow
(l/s
)
Maximu Flow 5 per. Mov. Avg. (Maximu Flow )
0
0.1
0.2
0.3
0.4
0.5
0.6
0.7
0.8
0.9
1
1994 1996 1998 2000 2002 2004
Year
Flow
(l/s
)
Minimum Flow 5 per. Mov. Avg. (Minimum Flow )
0
2000
4000
6000
8000
10000
12000
14000
16000
1994 1996 1998 2000 2002 2004
Year
Flow
(l/s
)
Mean Flow 5 per. Mov. Avg. (Mean Flow )
0100020003000400050006000700080009000
1994 1996 1998 2000 2002 2004
Year
Flow
(l/s
)
Mean Autumn Flow 5 per. Mov. Avg. (Mean Autumn Flow )
02000400060008000
1000012000140001600018000
1994 1996 1998 2000 2002 2004
Year
Flow
(l/s
)
Mean Winter Flow 5 per. Mov. Avg. (Mean Winter Flow )
0
2000
4000
6000
8000
10000
12000
1994 1996 1998 2000 2002 2004
Year
Flow
(l/s
)
Mean Spring Flow 5 per. Mov. Avg. (Mean Spring Flow )
0
1000
2000
3000
4000
5000
6000
7000
8000
1994 1996 1998 2000 2002 2004
Year
Flow
(l/s
)
Mean Summer Flow 5 per. Mov. Avg. (Mean Summer Flow )

Environment Bay of Plenty 221
Environment Bay of Plenty River Flow Recording Station
River Kopurereroa Site S.H.29 Bridge Site Number 14302 Grid Reference U14:843 805 Start of Record October 1980 Data Capture Rate 99% Data Summary From January 1991 To December 2005 Data Audited From June 1990 To December 2005 Equipment History
23/10/80: 6 metre monthly Foxboro chart recorder. 01/09/81: 3 metre monthly Foxboro chart recorder. 30/01/86: All equipment removed from site. 16/06/86: 6 metre monthly Foxboro chart recorder. 02/08/90: 5 metre range P.T. & WRIC datalogger. 05/12/91: P.T. & WRIC remain as backup. Comments on Stage/Discharge Ratings Control is by natural channel. Numerous rating changes have occurred due to the nature of the control. Ratings are available to convert Stage (mm) to Flow (l/s).
General Comments The site was originally installed downstream of the bridge by the B.O.P.C.C. to collect flood level and flow data. The site is operated by Environment of Plenty as part of its Natural Environment Regional Monitoring Network. Upstream water extraction affects stage and flow records.
SITE LOCATION Kopurereroa at S.H.29 Bridge

222 Environmental Publication 2007/06
Station Comments Kopurereroa River at S.H.29 Bridge. Site Number 14302, on River Number 14300. The local recording authority is Environment Bay of Plenty. Site established on downstream side of S.H.29 Bridge. Site is affected by pumping extractions. Lambrecht rainfall recorder installed at Williams Road in September 1980 NZMS 260 reference U15:844 695 (later to be shifted along the road to NZMS 260 Reference U15:843 692). This rainfall site is called "Williams Road" and has a Meteorological Service number of B76812. 01/09/81 - Foxboro removed and a new foxboro installed with a range of 3.0 meter, monthly. Stage resolution of 28mm per 1mm recorded. Time resolution of 281 minutes per 1mm recorded. 19/06/85 - Foxboro recorder and staff gauges moved to upstream side of S.H.29 Bridge 16/06/86 - 6 meter monthly foxboro installed 860616 105959. Stage resolution of 57mm per 1mm recorded. Time resolution of 281 minutes per 1mm recorded 27/06/90 - Stage discharge ratings commence. 02/08/90 - Foxboro removed 900802 and a 5 metre range pressure transducer connected to a wric datalogger was installed. Stage resolution of 1mm and time resolution of 15 minutes. 05/12/91 - Site converted from pressure transducer with datalogger to a Leupold and Stevens. Stage resolution of 1mm and time resolution of 15 minutes. First tape commences 911205 at 150100. 26/12/91 - Missing record from 911226 at 021500 to 920110 at 115900 due to recorder failure. 22/05/96 - Missing data 960522 at 201500 to 960619 at 103000 due to float tape jamming. secondary data from transducer used to fill gap. 08/0//2003 - Major expansion of bridge crossing began sometime between 20030808 at 151500 and 20030908 at 134500. Works altered profile of banks upstream and downstream of bridge. Top end of rating is unlikely to change as bridge abutments controls were not changed, however medium stage height discharge relationship are altered due to bank profile changes. 08/09/03 - Missing record 20030908 at 134500 to 20030910 at 120000 due to memory overwrite. 31/08/04 - Missing record 20040831 at 123000 to 20040831 at 130000 due to lose of power during equipment install. 16/09/04 - Missing record 20040916 134500 to 153000 due to installation of new pt. 25/12/05 - Missing record 20051225 003000 to 20051228 211500 due to logger programme failure.
For additional information, please see recording authority.

Environment Bay of Plenty 223
Environment Bay of Plenty Hydrological Flow Summary
Date Complied July 2006 Site Number 14302 Compiled by Glenn Ellery River Kopurereroa Station S.H.29 Bridge Metric Map Reference U14:843 805 Catchment Area (km2) 60 Period of Summary 1994 to 2005
Statistical Summary Flow (l/s)
Minimum Flow 1093 Maximum Flow 19778 Mean Annual Minimum Flow 1337 Mean Annual Maximum Flow 11601 Mean Flow 1867 Mean Summer Flow 1689 Median Flow 1715 Mean Autumn Flow 1814 Mean Specific Flow (/km2) 31 Mean Winter Flow 2017 Mean Spring Flow 1834 Low Flow Distribution Fit GEV Peak Flow Distribution Fit GEV Gumbel 7 day Low Flow (Minimum) 1196 Peak Flow (5 yr Return) 16500 16700 7 Day Low Flow (Mean Annual) 1420 Peak Flow (10 yr Return) 20000 20600 7 day Low Flow (5 yr Return) 1336 Peak Flow (20 yr Return) 23400 24500 7 Day Low Flow (10 yr Return) 1281 Peak Flow (50 yr Return) Peak Flow (100 yr Return)
Flow Distribution
Flow (l/s) Percentiles 0 1 2 3 4 5 6 7 8 9
0 19778 5525 3947 3279 2891 2656 2513 2412 2334 2274 10 2227 2187 2153 2125 2100 2076 2054 2032 2011 1993 20 1977 1963 1949 1937 1923 1911 1900 1889 1879 1869 30 1860 1851 1842 1834 1826 1818 1810 1803 1796 1789 40 1782 1775 1769 1763 1756 1749 1742 1735 1728 1722 50 1715 1708 1701 1694 1687 1680 1674 1668 1662 1656 60 1649 1643 1637 1630 1624 1618 1612 1607 1601 1595 70 1590 1584 1578 1573 1567 1561 1555 1549 1543 1536 80 1530 1523 1516 1509 1502 1495 1487 1479 1472 1462 90 1452 1440 1429 1417 1403 1387 1368 1350 1327 1293 100 1093
Annual Summaries Flow (l/s) Flow (l/s) Year
Minimum Mean Maximum Year
Minimum Mean Maximum 1980 1993 1233 1572 4760 1981 1994 1215 1664 19778 1982 1995 1093 1831 17821 1983 1996 1475 2070 14765 1984 1997 1276 1988 8415 1985 1998 1297 1946 15816 1986 1999 1268 1953 9192 1987 2000 1391 1813 10976 1988 2001 1473 1944 17373 1989 2002 1377 1738 9052 1990 2003 1279 1856 9399 1991 1596 1964 5151 2004 1252 1821 13772 1992 1502 1862 7537 2005 1335 1991 10212
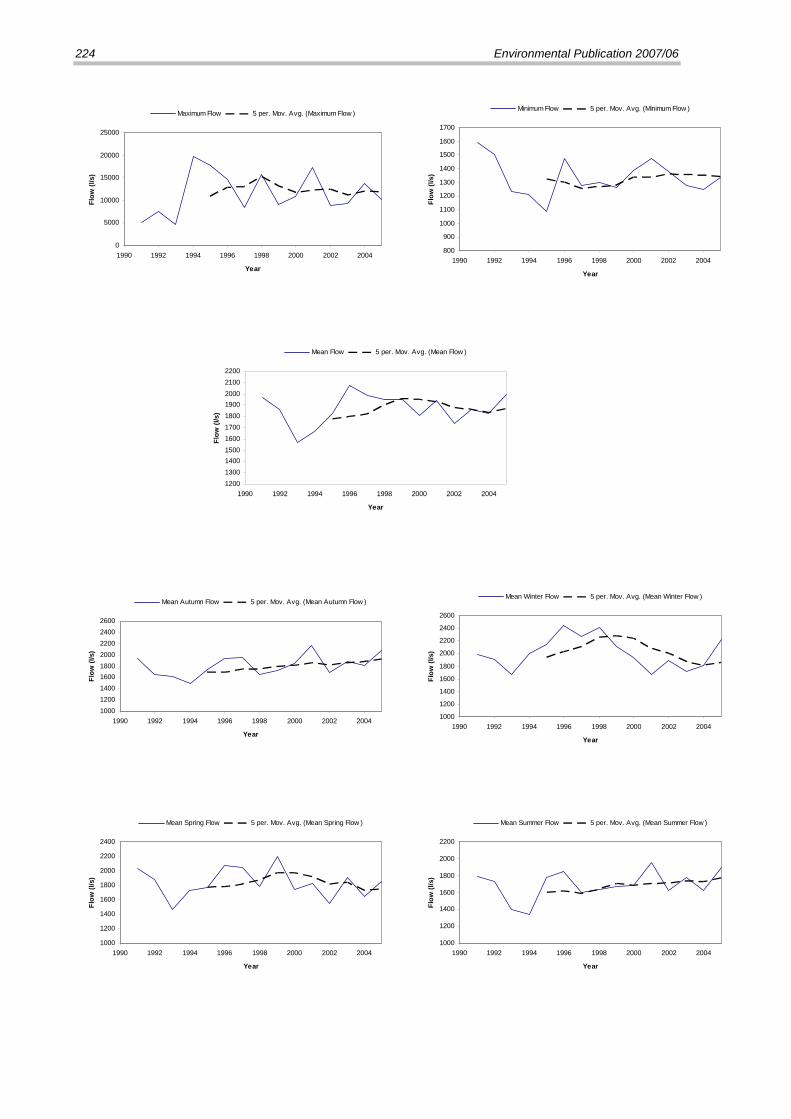
224 Environmental Publication 2007/06
0
5000
10000
15000
20000
25000
1990 1992 1994 1996 1998 2000 2002 2004
Year
Flow
(l/s
)
Maximum Flow 5 per. Mov. Avg. (Maximum Flow )
800
900
1000
1100
1200
1300
1400
1500
1600
1700
1990 1992 1994 1996 1998 2000 2002 2004
Year
Flow
(l/s
)
Minimum Flow 5 per. Mov. Avg. (Minimum Flow )
12001300140015001600170018001900200021002200
1990 1992 1994 1996 1998 2000 2002 2004
Year
Flow
(l/s
)
Mean Flow 5 per. Mov. Avg. (Mean Flow )
100012001400160018002000220024002600
1990 1992 1994 1996 1998 2000 2002 2004
Year
Flow
(l/s
)
Mean Autumn Flow 5 per. Mov. Avg. (Mean Autumn Flow )
1000
1200
1400
1600
1800
2000
2200
2400
2600
1990 1992 1994 1996 1998 2000 2002 2004
Year
Flow
(l/s
)
Mean Winter Flow 5 per. Mov. Avg. (Mean Winter Flow )
1000
1200
1400
1600
1800
2000
2200
2400
1990 1992 1994 1996 1998 2000 2002 2004
Year
Flow
(l/s
)
Mean Spring Flow 5 per. Mov. Avg. (Mean Spring Flow )
1000
1200
1400
1600
1800
2000
2200
1990 1992 1994 1996 1998 2000 2002 2004
Year
Flow
(l/s
)
Mean Summer Flow 5 per. Mov. Avg. (Mean Summer Flow )

Environment Bay of Plenty 225
Environment Bay of Plenty River Flow Recording Station
River Waimapu Site McCarrolls Farm Site Number 14410 Grid Reference U14: 871 768 Start of Record June 1990 Data Capture Rate 97% Data Summary From January 1991 To December 2005 Data Audited From June 1990 To December 2005 Equipment History
28/06/90: 5 metre range P.T. & WRIC datalogger. 20/05/93: Float with 15 minutes L&S digital recorder. 03/07/97: Float with Campbell CR500 datalogger. Comments on Stage/Discharge Ratings Control is by natural rock bed. Ratings available to convert stage (mm) to flow (l/s).
General Comments Site installed as part of the Tauranga Harbour investigations. Site was relocated 300 metres upstream in 1993. Site is operated by Environment Bay of Plenty as part of its Natural Environment Regional Monitoring Network.
SITE LOCATION Waimapu at McCarrolls Farm

226 Environmental Publication 2007/06
Station Comments Waimapu River at McCarrolls Farm. Site Number 14410, on River Number 144000. The local recording authority is Environment Bay of Plenty This station was installed in June 1990 by Environment Bay of Plenty as part of the Tauranga Harbour investigations project. 28/06/90 - Stream flow records for this site commence at 900628 130000. Kainga logger with a time resolution of 15 minutes and 5 metre range pressure transducer installed. 11/07/90 - Missing data from 900711 at 110000 to 900726 at 114500. Cause unknown. 08/08/90 - Missing record from 900808 at 111500 to 900823 at 113000. No data was recorded on datapak when viewed. 28/08/90 - Missing record from 900828 at 033000 to 900904 at 104500. Synthetic data based on comparisons with nearby site Kopurereroa at SH.29 (site no. 14302) has been inserted. 20/11/91 - Missing record from 911120 at 164500 to 911219 at 121500 was due to equipment failure. 24/01/92 - Missing record from 920124 at 094600 and 920210 at 090100. Equipment failure. 11/05/92 - Missing record from 920511 at 113000 to 920710 at 094500 due to equipment failure. 20/05/93 - Site moved approximately 300 metres upstream and upgraded from a WRIC logger/pressure transducer (lower site) to a new stilling well recorder station (upstream site). There will be a slight reduction in catchment area from 56.72 km2 to 56.6 km2. The site name (McCarrolls Farm) and site number (14410) will remain the same. The stage/discharge relationship will change. The move to the new site will not alter flows but will alter levels. Upstream records commence 930520 160000. Control is broad rock control and thus will not be prone to regular rating changes. Available low flow gauging section has a broad x-section with very slow velocities. New instrumentation consists of an L&S float recorder with a stage resolution of 1mm stage per 1 mm recorded and a time resolution of 15 minutes. 03/07/97 - Handar rotary encoder and Campbell CR500 datalogger installed. Recorder has a stage resolution of 1mm and time resolution of 15 minutes. 07/02/95 - Missing data from 950207 at 120000 to 950220 at 110000. Power supply failure. 29/06/96 - Missing record from 960629 at 114500 to 960715 at 101500 due to tape ripping on recorder. 10/06/97 - Missing record from 970610 at 111500 to 970619 at 120400 due to tape jamming. 03/07/97 - Handar rotary encoder and Campbell CR500 datalogger installed. Recorder has a stage resolution of 1mm and time resolution of 15 minutes. @@ 14410 1041215 213000 15/12/04 - Missing record from 1041215 213000 to 1041222 100000 due to encoder failure.

Environment Bay of Plenty 227
Environment Bay of Plenty Hydrological Flow Summary
Date Complied July 2006 Site Number 14410 Compiled by G R Ellery River Waimapu Station McCarrols Farm Metric Map Reference U14:871 768 Catchment Area (km2) 56.6 Period of Summary 1991 to 2005
Statistical Summary Flow (l/s)
Minimum Flow 621 Maximum Flow 139475 Mean Annual Minimum Flow 769 Mean Annual Maximum Flow 52991 Mean Flow 2129 Mean Summer Flow 1667 Median Flow 1448 Mean Autumn Flow 1809 Mean Specific Flow (/km2) 38 Mean Winter Flow 2988 Mean Spring Flow 1809 Low Flow Distribution Fit Gumbel Peak Flow Distribution Fit Gumbel GEV 7 day Low Flow (Minimum) 679 Peak Flow (5 yr Return) 52577 50258 7 Day Low Flow (Mean Annual) 764 Peak Flow (10 yr Return) 94203 93806 7 day Low Flow (5 yr Return) 721 Peak Flow (20 yr Return) 112112 115199 7 Day Low Flow (10 yr Return) 697 Peak Flow (50 yr Return) Peak Flow (100 yr Return)
Annual Summaries Flow (l/s) Flow (l/s) Year
Minimum Mean Maximum Year
Minimum Mean Maximum 1980 1993 621 1301 16871 1981 1994 701 1812 36831 1982 1995 711 2836 75845 1983 1996 826 2280 45300 1984 1997 751 1781 26582 1985 1998 708 2514 79186 1986 1999 877 2349 74327 1987 2000 795 2053 35968 1988 2001 830 2693 139475 1989 2002 780 1563 37839 1990 2003 769 2077 57143 1991 733 1683 19596 2004 860 2296 29988 1992 667 2179 59566 2005 905 2456 60342
Flow Distribution Flow (l/s)
Percentiles 0 1 2 3 4 5 6 7 8 9 0 139475 12601 8810 7133 6123 5433 4930 4552 4262 4024 10 3808 3610 3438 3282 3137 3012 2912 2807 2702 2611 20 2522 2449 2382 2310 2252 2196 2147 2101 2052 2012 30 1970 1932 1892 1857 1832 1798 1765 1741 1709 1686 40 1665 1642 1623 1597 1576 1553 1528 1506 1487 1470 50 1448 1429 1408 1395 1380 1362 1345 1331 1314 1298 60 1283 1266 1248 1231 1214 1198 1180 1164 1147 1129 70 1110 1092 1073 1057 1040 1025 1009 994 981 966 80 949 937 926 911 900 891 881 872 862 849 90 836 823 812 801 790 778 767 753 734 716 100 621

228 Environmental Publication 2007/06
0
20000
40000
60000
80000
100000
120000
140000
160000
1990 1992 1994 1996 1998 2000 2002 2004
Year
Flow
(l/s
)
Maximum Flow 5 per. Mov. Avg. (Maximum Flow )
500
550
600
650
700
750
800
850
900
950
1990 1992 1994 1996 1998 2000 2002 2004
Year
Flow
(l/s
)
Minimum Flow 5 per. Mov. Avg. (Minimum Flow )
0
500
1000
1500
2000
2500
3000
1990 1992 1994 1996 1998 2000 2002 2004
Year
Flow
(l/s
)
Mean Flow 5 per. Mov. Avg. (Mean Flow )
0
1000
2000
3000
4000
5000
6000
1990 1992 1994 1996 1998 2000 2002 2004
Year
Flow
(l/s
)
Mean Autumn Flow 5 per. Mov. Avg. (Mean Autumn Flow )
0
1000
2000
3000
4000
5000
6000
1990 1992 1994 1996 1998 2000 2002 2004
Year
Flow
(l/s
)
Mean Winter Flow 5 per. Mov. Avg. (Mean Winter Flow )
0
500
1000
1500
2000
2500
3000
3500
4000
1990 1992 1994 1996 1998 2000 2002 2004
Year
Flow
(l/s
)
Mean Spring Flow 5 per. Mov. Avg. (Mean Spring Flow )
0
500
1000
1500
2000
2500
3000
3500
1990 1992 1994 1996 1998 2000 2002 2004
Year
Flow
(l/s
)
Mean Summer Flow 5 per. Mov. Avg. (Mean Summer Flow )
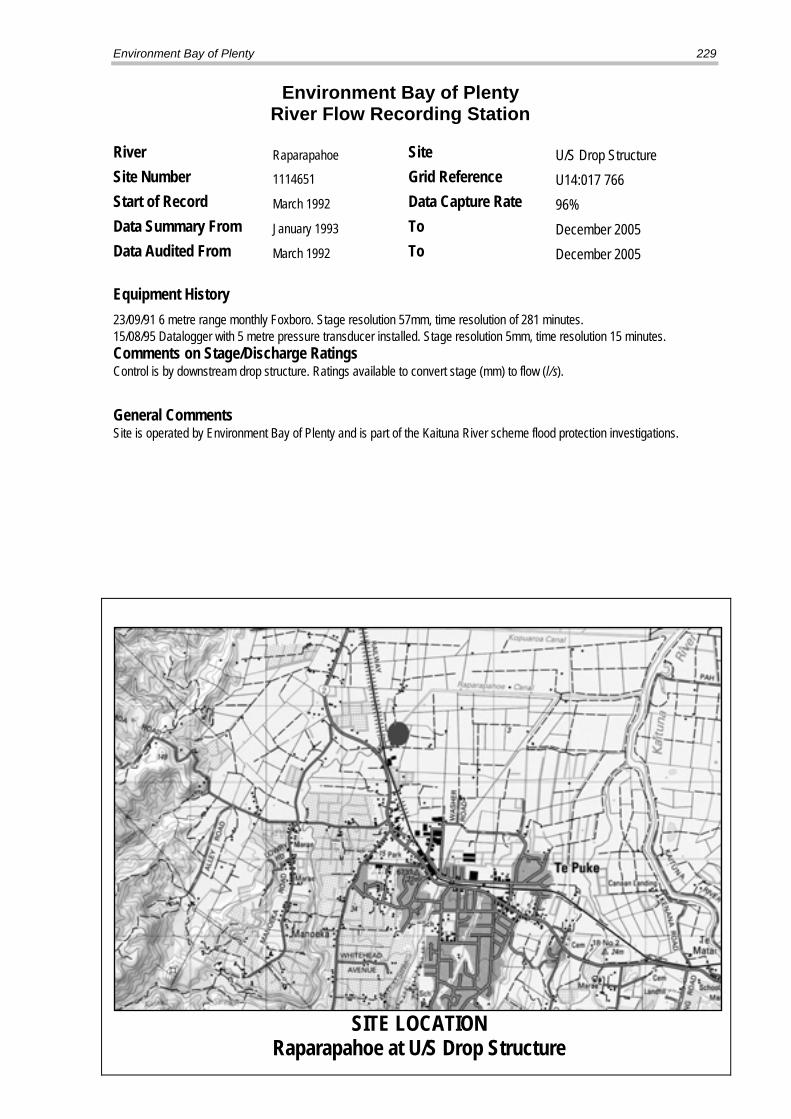
Environment Bay of Plenty 229
Environment Bay of Plenty River Flow Recording Station
River Raparapahoe Site U/S Drop Structure Site Number 1114651 Grid Reference U14:017 766 Start of Record March 1992 Data Capture Rate 96% Data Summary From January 1993 To December 2005 Data Audited From March 1992 To December 2005 Equipment History 23/09/91 6 metre range monthly Foxboro. Stage resolution 57mm, time resolution of 281 minutes. 15/08/95 Datalogger with 5 metre pressure transducer installed. Stage resolution 5mm, time resolution 15 minutes. Comments on Stage/Discharge Ratings Control is by downstream drop structure. Ratings available to convert stage (mm) to flow (l/s).
General Comments Site is operated by Environment Bay of Plenty and is part of the Kaituna River scheme flood protection investigations.
SITE LOCATION Raparapahoe at U/S Drop Structure

230 Environmental Publication 2007/06
Station Comments Raparapahoe at Drop Structure. Site Number 1114651, on River Number 146000. The site is situated 16.4 kilometres from mouth and replaces Raparapahoe at Manoeka Road Bridge (14630). The local recording authority is Environment Bay of Plenty. Drop structure was installed by Environment Bay of Plenty on 22/11/88. Top end rating based upon combination of flow gauging measurement along with output from Mike11modelled flow over drop structure. 23/09/91 - Site erected and 6 metre monthly Foxboro recorder installed. 15/08/95 - Foxboro recorder removed. Data logger with a time resolution of 15 minutes and a 5 metre pressure transducer with a stage resolution of 5mm installed. 18/10/91 - Missing record from 911018 at 090000 to 911120 at 093000 due to faulty recorder. 09/05/94 - Missing record 940509 at 122900 to 940624 at 103600 due to faulty recorder 16/07/94 - Missing record from 940716 at 80900 to 940811 at 122800 due to faulty recorder 18/09/94 - Missing record from 940918 at 120000 to 941012 at 132600 due to faulty recorder 22/11/94 - Missing record from 941122 at 145000 to 941213 at 134500 due to recorder malfunction. 24/12/94 - Missing record from 941224 at 050000 to 950110 at 151500 due to recorder malfunction. 29/06/97 - Missing record from 970629 at 051500 to 970711 at 120000 due to power supply failure. 08/02/98 - Missing record from 980208 at 121500 to 980217 at 140000 due to transducer being buried in silt. 13/07/98 - Missing record from 980713 at 203000 to 980717 at 091500 due to low battery. 13/07/98 - Data from 980713 at 203000 to 1000204 at 094500 affected by what appears to be a fault with the pressure transducer. Data should be used with caution. 04/06/99 - Missing record from 990604 at 140000 to 990609 at 134500 due to low battery. 18/02/00 - Missing record from 20000218 at 170000 to 20000229 at 113000 due to ISD pressure transducer being repaired. 08/05/02 - Missing record from 1020508 100000 to 1020513 114500. Unknown reason but gap coincides with 2002 annual inspection, may have accidently left power off. 19/06/02 - Missing record from 20020619 at 133000 to 20020703 at 101500 due to low battery. 04/08/04 - Missing record from 20040804 123000 to 20040807 154500. Gap coincides with inspection may have knocked off power lead. 20/07/04 - Missing record from 20050720 130000 to 20050722 130000 due to logger failure.

Environment Bay of Plenty 231
Environment Bay of Plenty Hydrological Flow Summary
Date Complied May 2006 Site Number 1114651 Compiled by Glenn Ellery River Raparapahoe Station U/S Drop Structure Metric Map Reference U14:017 766 Catchment Area (km2) 46.36 Period of Summary 1992 to 2005
Statistical Summary Flow (l/s)
Minimum Flow 249 Maximum Flow 77163 Mean Annual Minimum Flow 577 Mean Annual Maximum Flow 42440 Mean Flow 1852 Mean Summer Flow 1515 Median Flow 1284 Mean Autumn Flow 1706 Mean Specific Flow (/km2) 40 Mean Winter Flow 2350 Mean Spring Flow 1904 Low Flow Distribution Fit GEV Peak Flow Distribution Fit Assessed 7 day Low Flow (Minimum) 399 Peak Flow (5 yr Return) 53500 7 Day Low Flow (Mean Annual) 674 Peak Flow (10 yr Return) 66400 7 day Low Flow (5 yr Return) 574 Peak Flow (20 yr Return) 79300 7 Day Low Flow (10 yr Return) 498 Peak Flow (50 yr Return) Peak Flow (100 yr Return)
Annual Summaries Flow (l/s) Flow (l/s) Year
Minimum Mean Maximum Year
Minimum Mean Maximum 1980 1993 381 1117 9880 1981 1994 451 1432 33544 1982 1995 249 2260 59782 1983 1996 637 2020 45546 1984 1997 588 1586 22066 1985 1998 648 2080 42315 1986 1999 477 2212 73042 1987 2000 662 1981 47474 1988 2001 766 2556 77163 1989 2002 671 1442 23130 1990 2003 667 1498 46302 1991 2004 716 2005 38161 1992 352 1535 25223 2005 810 2056 50537
Flow Distribution Flow (l/s)
Percentiles 0 1 2 3 4 5 6 7 8 9 0 77163 11477 7616 6086 5170 4539 4103 3756 3494 3272 10 3101 2951 2809 2683 2572 2473 2386 2307 2238 2174 20 2112 2057 2008 1963 1925 1880 1840 1803 1769 1735 30 1706 1675 1649 1620 1596 1570 1544 1521 1501 1480 40 1461 1441 1420 1401 1383 1367 1350 1331 1315 1299 50 1284 1268 1256 1240 1227 1213 1200 1186 1174 1160 60 1147 1134 1123 1109 1098 1085 1074 1061 1050 1037 70 1024 1012 999 987 975 963 953 943 933 922 80 909 898 887 873 861 848 835 821 807 793 90 779 764 750 736 721 703 682 645 598 530 100 249
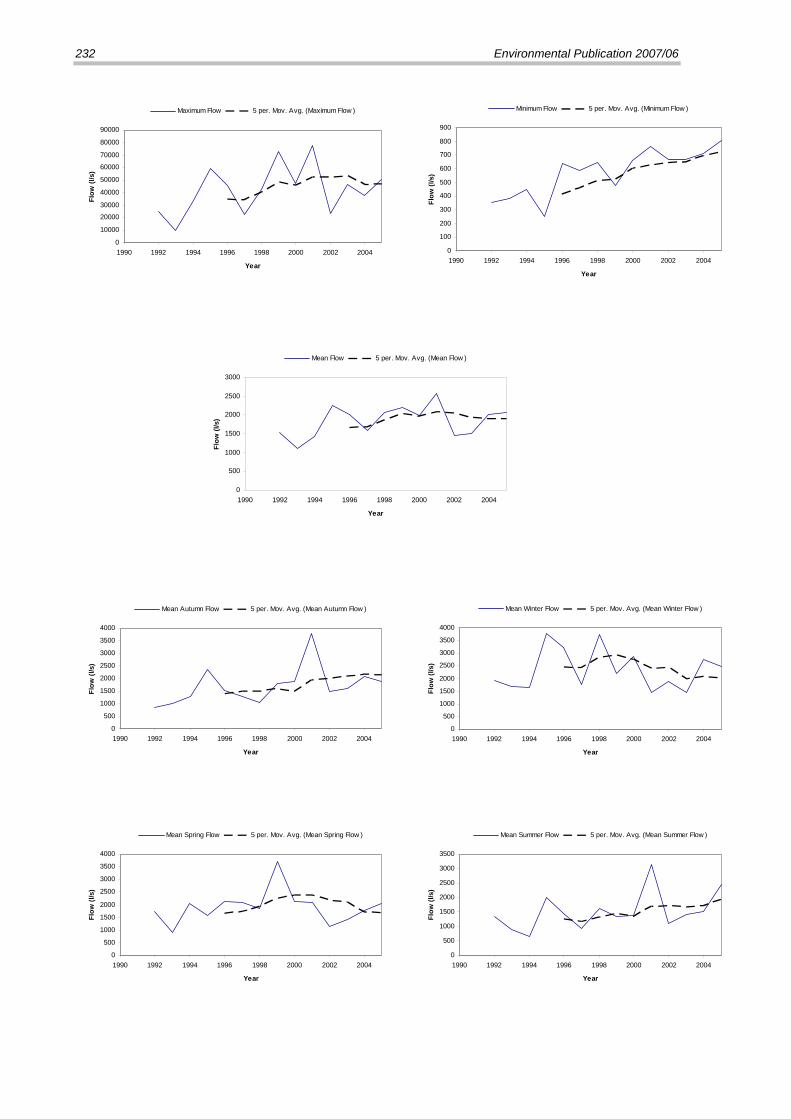
232 Environmental Publication 2007/06
0
10000
20000
30000
40000
50000
60000
70000
80000
90000
1990 1992 1994 1996 1998 2000 2002 2004
Year
Flow
(l/s
)
Maximum Flow 5 per. Mov. Avg. (Maximum Flow )
0
100
200
300
400
500
600
700
800
900
1990 1992 1994 1996 1998 2000 2002 2004
Year
Flow
(l/s
)
Minimum Flow 5 per. Mov. Avg. (Minimum Flow )
0
500
1000
1500
2000
2500
3000
1990 1992 1994 1996 1998 2000 2002 2004
Year
Flow
(l/s
)
Mean Flow 5 per. Mov. Avg. (Mean Flow )
0
500
1000
1500
2000
2500
3000
3500
4000
1990 1992 1994 1996 1998 2000 2002 2004
Year
Flow
(l/s
)
Mean Autumn Flow 5 per. Mov. Avg. (Mean Autumn Flow )
0
500
1000
1500
2000
2500
3000
3500
4000
1990 1992 1994 1996 1998 2000 2002 2004
Year
Flow
(l/s
)
Mean Winter Flow 5 per. Mov. Avg. (Mean Winter Flow )
0
500
1000
1500
2000
2500
3000
3500
4000
1990 1992 1994 1996 1998 2000 2002 2004
Year
Flow
(l/s
)
Mean Spring Flow 5 per. Mov. Avg. (Mean Spring Flow )
0
500
1000
1500
2000
2500
3000
3500
1990 1992 1994 1996 1998 2000 2002 2004
Year
Flow
(l/s
)
Mean Summer Flow 5 per. Mov. Avg. (Mean Summer Flow )

Environment Bay of Plenty 233
Environment Bay of Plenty River Flow Recording Station
River Waiari Site Muttons Site Number 14627 Grid Reference U14:034 706 Start of Record November 1966 Data Capture Rate 96% Data Summary From January 1967 To January 1995 Data Audited From January 1982 To July 1995 Equipment History
09/11/66: Staff gauge and chart recorder. 26/02/68: Float with F&P digital recorder. 21/01/79: Backup Foxboro chart recorder. 21/01/82: Float with L&S digital recorder. 10/02/82: Backup Foxboro removed. 29/3/94: P.T. & WRIC datalogger. Comments on Stage/Discharge Ratings Site control is by natural channel. Due to variable bed scour a number of railway irons have been driven into the bed to stabilise the control. The scouring has caused numerous rating changes at this site. Ratings are available to convert Stage (mm) to Flow (l/s). General Comments The local recording authority was the Hamilton Hydrological survey until 22/01/82. Site was operated by Environment Bay of Plenty as part of its Natural Environment Regional Monitoring Network. Fluctuations in water level are caused by water extraction upstream of the site for Te Puke’s potable water supply. Due to the lowering of the bed level the intake pipes have become inoperative. Initially a siphon system partially overcame this problem, then a pressure transducer was installed. Site closed in July 1995. NIWA now operates alternate site within the catchment.
SITE LOCATION Waiari at Muttons

234 Environmental Publication 2007/06
Station Comments Waiari at Muttons. Site Number 14627, on River Number 146030. The local recording authority is Environment Bay of Plenty Site is subject to large bed movements. Large changes in shape and position of ratings occur. 21/01/82 - Site handed over to B.O.P.C.C. on 820122. Instruments operating at the site 09/05/83 - Data from 830509 103000 to 850912 130000 is suspect at lower stages (less than 0.2 metres) due to the use of a siphon between the river and the stilling well. This was utilised as the intakes were out of the water at lower stages. 16/12/83 - Missing record 831216 at 144500 to 840211 at 063000 due to stilling well siltation problems. 12/02/84 - Missing record 840212 at 90000 to 840213 at 110000 due to stilling well siltation problems. 17/03/84 - Missing record 840317 at 240000 to 840331 at 143000 due to stilling well siltation problems. 04/04/84 - Missing record 840404 at 110000 to 840501 at 130000 due to stilling well siltation problems. 12/02/85 - Missing record from 850212 at 023000 to 850228 at 130000 due to stilling well intake problems 02/03 85 - Missing record from 850302 at 074500 to 850306 at 130000 due to recorder malfunction. 11/03/85 - Missing record from 850311 at 160000 to 850315 at 203000 due to recorder malfunction. 19/03/85 - Missing record from 850319 at 024500 to 850507 at 101500 due to recorder malfunction. 16/06/85 - Missing record from 850616 at 193000 to 850912 at 130000 due to power supply failure. 09/10/85 - Monthly 3 metre range Foxboro chart recorder chart recorder installed as backup recorder. Recorder has a stage resolution of 28mm per 1mm recorded and a 281 time resolution of minutes per 1mm recorded. 03/05/86 - Missing record from 860503 at 164500 to 860530 at 131500 due to tape running out. 06/05/87 - Due to extremely low water levels there is missing record between 870506 and 870628, and between 870702 and 870717 for low stage processing. 15/02/88 - Missing record from 880215 at 131500 to 880317 at 104500. Due to record data being obviously wrong. 29/06/88 - Missing record from 880629 150000 to 880724 at 034500. Due to water level being below intakes and intake siphon not functioning. 10/08/88 - Missing record from 880810 at 114500 to 880815 at 111400 due to tape being hooked around pulley at bottom. 28/10/91 - Missing record from 911028 at 153000 to 911112 at 102800 due to tape ripping in recorder. 26/08/93 - Extra railway irons installed into bed of stream at control to catch more debris and lift control level. 29/03/94 - WRIC datalogger data used as primary data from this date. This overcomes the syphoning problem encountered at this site due to water level dropping below the intake pipes. Backup Foxboro recorder removed. 03/09/94 - Missing record from 940903 at 204500 to 940913 at 003000. 29/10/94 - Missing record from 941029 at 013000 to 941110 at 114500 due to recorder failure 15/07/95 - Site closed and all instruments removed.
For additional information, please see recording authority.

Environment Bay of Plenty 235
Environment Bay of Plenty Hydrological Flow Summary
Date Complied July 2006 Site Number 14627 Compiled by G R Ellery River Waiari Station Muttons Metric Map Reference U14:034 706 Catchment Area (km2) 71.7 Period of Summary 1967 to 1994 Statistical Summary
Flow (l/s) Minimum Flow 2311 Maximum Flow 69735 Mean Annual Minimum Flow 3506 Mean Annual Maximum Flow 8865 Mean Flow 4039 Mean Summer Flow 3885 Median Flow 3823 Mean Autumn Flow 4009 Mean Specific Flow (/km2) 56 Mean Winter Flow 4154 Mean Spring Flow 3992 Low Flow Distribution Fit GEV Peak Flow Distribution Fit EV1/Pearson 7 day Low Flow (Minimum) 2453 Peak Flow (5 yr Return) 58000 7 Day Low Flow (Mean Annual) 3347 Peak Flow (10 yr Return) 72000 7 day Low Flow (5 yr Return) 2984 Peak Flow (20 yr Return) 86000 7 Day Low Flow (10 yr Return) 2767 Peak Flow (50 yr Return) 126000 Peak Flow (100 yr Return)
Annual Summaries Flow (l/s) Flow (l/s) Year
Minimum Mean Maximum Year
Minimum Mean Maximum 1969 4309 4602 6030 1982 3555 3769 4256 1970 4095 4430 7024 1983 3457 3741 5065 1971 4163 5051 10379 1984 3097 3400 6724 1972 4681 5408 19927 1985 3183 3367 3734 1973 3772 4255 6147 1986 3151 4977 30195 1974 3240 3691 12477 1987 3316 3865 10357 1975 3106 3856 22230 1988 2642 3111 4966 1976 3329 3711 4867 1989 2955 3932 10873 1977 3638 4016 5580 1990 3948 4546 7292 1978 3322 3517 3740 1991 3533 4015 6009 1979 3304 3799 7472 1992 2873 3567 8547 1980 3820 4257 6646 1993 2698 3049 4133 1981 3482 4068 10212 1994 2511 2881 4837
Flow Distribution Flow (l/s)
Percentiles 0 1 2 3 4 5 6 7 8 9 0 69735 8648 6336 5602 5305 5154 5075 5004 4943 4894 10 4848 4808 4768 4735 4708 4688 4669 4649 4638 4601 20 4552 4520 4493 4470 4428 4389 4348 4315 4293 4271 30 4250 4227 4204 4182 4162 4137 4114 4089 4064 4036 40 4011 3987 3966 3944 3926 3906 3888 3873 3859 3841 50 3823 3802 3781 3765 3746 3722 3700 3680 3661 3644 60 3631 3620 3608 3598 3587 3575 3562 3547 3532 3519 70 3506 3490 3479 3469 3458 3446 3432 3419 3401 3379 80 3357 3336 3309 3283 3258 3238 3219 3196 3174 3153 90 3129 3103 3068 3043 3006 2949 2893 2849 2796 2711 100 2311

236 Environmental Publication 2007/06
0
5000
10000
15000
20000
25000
30000
35000
1966 1971 1976 1981 1986 1991
Year
Flow
(l/s
)
Maximum Flow 5 per. Mov. Avg. (Maximum Flow )
2000
2500
3000
3500
4000
4500
5000
5500
6000
1966 1971 1976 1981 1986 1991
Year
Flow
(l/s
)
Minimum Flow 5 per. Mov. Avg. (Minimum Flow )
2000
2500
3000
3500
4000
4500
5000
5500
6000
1966 1971 1976 1981 1986 1991
Year
Flow
(l/s
)
Mean Flow 5 per. Mov. Avg. (Mean Flow )
0
1000
2000
3000
4000
5000
6000
1967 1972 1977 1982 1987 1992
Year
Flow
(l/s
)
Mean Autumn Flow 5 per. Mov. Avg. (Mean Autumn Flow )
0
1000
2000
3000
4000
5000
6000
1967 1972 1977 1982 1987 1992
Year
Flow
(l/s
)
Mean Winter Flow 5 per. Mov. Avg. (Mean Winter Flow )
0
1000
2000
3000
4000
5000
6000
1967 1972 1977 1982 1987 1992
Year
Flow
(l/s
)
Mean Spring Flow 5 per. Mov. Avg. (Mean Spring Flow )
0
1000
2000
3000
4000
5000
6000
1967 1972 1977 1982 1987 1992
Year
Flow
(l/s
)
Mean Summer Flow 5 per. Mov. Avg. (Mean Summer Flow )
Waiari at Muttons

Environment Bay of Plenty 237
Environment Bay of Plenty River Flow Recording Station
River Mangorewa Site Saunders Site Number 14628 Grid Reference U15: 047 632 Start of Record July 1967 Data Capture Rate 99% Data Summary From January 1968 To December 2005 Data Audited From May 1968 To December 2005 Equipment History Float/counterweight system with shaft encoder. 1mm resolution. Comments on Stage/Discharge Ratings Control is by stable natural channel. Ratings available to convert stage (mm) to flow (l/s).
General Comments Site was originally operated by the Hamilton Hydrological Survey until December 1981. Site is now operated by Environment Bay of Plenty as part of its Natural Environmental Monitoring Network.
SITE LOCATION Mangorewa at Saunders

238 Environmental Publication 2007/06
Station Comments Mangorewa River at Saunders Farm. Site Number 14628, on River Number 146050. Local recording authority is Environment Bay of Plenty. Sediment concentration has also been measured at this site. The site is situated 9.2 kilometres to confluence of the Kaituna River. The control is natural. 09/12/81 - Site handed over to B.O.P.C.C. on 811210. 30/04/91 - Site damaged by lightning. Recorder stopped causing missing record. Gap is from 910430 at 164501 to 910509 at 144600. 06/02/96 - Missing record from 960216 061500 to 960208 154500 due to Aquitel failure. 06/01/97 - Missing record from 970106 at 214500 to 970110 at 101500 due to faulty Leopold and Stevens recorder. 10/08/98 - Missing record from 980810 at 151500 to 980813 at 113000 due to Aquitel failure. 31/12/95 - Missing record from this site has been replaced with synthetic data derived from adjacent site Waiari at Muttons (14627) and rainfall records. 01/05/99 – This event was the highest recorded since the site was installed in 1967. Historical top end rating extrapolation has been used due to the lack of high stage gaugings (highest gauging is at 4125mm. Investigation of bed slope and cross-section proved inconclusive at defining the top end of the rating. However it is noted that the cross-section is rectangular in shape with vertical walls approximately 12 metres high, the upstream cross section is straight and the bed slope quite high. Discussions with NIWA, Rotorua staff also supported that in higher flood events velocities are high. Use derived peak flow with caution. This peak flow has not been used for flood frequency analysis due to uncertainty over derived flow. 07/09/00 - Missing record from 20000907 at 0444500 to 20000908 at 141500 due to Aquitel failure. 12/05/91 - Missing record from 20010512 at 93000 to 20010514 at 083000 due to Aquitel failure. 19/12/01 - Missing record from 20011219 at 53000 to 20011220 at 101500 due to Aquitel failure. 20/12/01 - Missing record from 20011220 at 104500 to 20020104 at 091500 due to Aquitel failure. 25/03/00 - Gaps affect the data set from 20050325 101500 to 20050428 104500 due to a lightening strike. 1: gap from 20050325 101500 to 20050404 123000 of 10.09 days 2: gap from 20050404 123000 to 20050413 143000 of 9.08 days 3: gap from 20050413 143000 to 20050418 130000 of 4.94 days 4: gap from 20050418 130000 to 20050418 161500 of 3.25 hours 5: gap from 20050418 161500 to 20050428 104500 of 9.77 days 6: gap from 20050518 124500 to 20050519 113000 of 22.75 hours 18/05/2005 - Missing record from 20050518 130000 to 20050519 113000 due to iQuest logger failure. 25/01/2006 - Missing record from 20060125 at 180000 to 20060125 at 114500 due to power failure.
For additional information, please see recording authority.

Environment Bay of Plenty 239
Environment Bay of Plenty Hydrological Flow Summary
Date Complied May 2006 Site Number 14628 Compiled by Glenn Ellery River Mangorewa Station Saunders Metric Map Reference U15:047 632 Catchment Area (km2) 178.7 Period of Summary 1968 to 2005 Statistical Summary
Flow (l/s) Minimum Flow 3591 Maximum Flow 834468 Mean Annual Minimum Flow 4498 Mean Annual Maximum Flow 157394 Mean Flow 6124 Mean Summer Flow 5777 Median Flow 5183 Mean Autumn Flow 5832 Mean Specific Flow (/km2) 29 Mean Winter Flow 6796 Mean Spring Flow 6117 Low Flow Distribution Fit Utilised Gumbel Peak Flow Distribution Fit Utilised GEV 7 day Low Flow (Minimum) 3607 Peak Flow (5 yr Return) 202200 7 Day Low Flow (Mean Annual) 4360 Peak Flow (10 yr Return) 259100 7 day Low Flow (5 yr Return) 4043 Peak Flow (20 yr Return) 318400 7 Day Low Flow (10 yr Return) 3867 Peak Flow (50 yr Return) 403000 Peak Flow (100 yr Return)
Annual Summaries Flow (l/s) Flow (l/s) Year
Minimum Mean Maximum Year
Minimum Mean Maximum 1980 4958 5953 38315 1993 3774 4652 101282 1981 4670 6002 193568 1994 3591 4760 87117 1982 4661 5634 73562 1995 3591 5995 218529 1983 3934 5755 222849 1996 5014 6394 127560 1984 4042 4923 100142 1997 4534 5886 64456 1985 4174 5779 117069 1998 4308 6184 201336 1986 4605 6339 313045 1999 4637 6842 834468 1987 4031 4915 87554 2000 4957 6109 83352 1988 3644 5588 264264 2001 4724 6116 166565 1989 4761 7036 61863 2002 4438 5350 135629 1990 5361 7195 295055 2003 3985 5032 58174 1991 4568 5785 34454 2004 3926 5568 157411 1992 3999 5335 75056 2005 4516 6028 91015
Flow Distribution Flow (l/s)
Percentiles 0 1 2 3 4 5 6 7 8 9 0 834468 24692 16465 12816 10963 9753 8993 8456 8040 7755 10 7571 7410 7311 7115 6928 6777 6670 6586 6503 6405 20 6307 6225 6149 6089 6034 5990 5950 5902 5848 5802 30 5763 5720 5684 5646 5606 5572 5537 5505 5473 5443 40 5415 5389 5363 5340 5316 5293 5270 5247 5224 5203 50 5183 5163 5144 5127 5110 5093 5074 5054 5032 5009 60 4989 4968 4947 4924 4903 4882 4860 4839 4818 4797 70 4775 4753 4730 4706 4680 4655 4632 4612 4589 4561 80 4532 4504 4476 4447 4418 4391 4362 4332 4302 4273 90 4247 4218 4183 4147 4111 4063 4008 3961 3854 3746 100 3591

240 Environmental Publication 2007/06
0
100000
200000
300000
400000
500000
600000
700000
800000
900000
1965 1970 1975 1980 1985 1990 1995 2000 2005
Year
Flow
(l/s
)
Maximum Flow 5 per. Mov. Avg. (Maximum Flow )
0
1000
2000
3000
4000
5000
6000
7000
1965 1970 1975 1980 1985 1990 1995 2000 2005
Year
Flow
(l/s
)
Minimum Flow 5 per. Mov. Avg. (Minimum Flow )
0100020003000400050006000700080009000
10000
1965 1970 1975 1980 1985 1990 1995 2000 2005
Year
Flow
(l/s
)
Mean Flow 5 per. Mov. Avg. (Mean Flow )
0
2000
4000
6000
8000
10000
12000
1965 1970 1975 1980 1985 1990 1995 2000 2005
Year
Flow
(l/s
)
Mean Autumn Flow 5 per. Mov. Avg. (Mean Autumn Flow )
0
2000
4000
6000
8000
10000
12000
1965 1970 1975 1980 1985 1990 1995 2000 2005
Year
Flow
(l/s
)
Mean Winter Flow 5 per. Mov. Avg. ( Mean Winter Flow )
0
2000
4000
6000
8000
10000
12000
1965 1970 1975 1980 1985 1990 1995 2000 2005
Year
Flow
(l/s
)
Mean Spring Flow 5 per. Mov. Avg. ( Mean Spring Flow )
0100020003000400050006000700080009000
10000
1965 1970 1975 1980 1985 1990 1995 2000 2005
Year
Flow
(l/s
)
Mean Summer Flow 5 per. Mov. Avg. ( Mean Summer Flow )
Mangorewa at Saunders

Environment Bay of Plenty 241
Environment Bay of Plenty River Flow Recording Station
River Kaituna Site Te Matai Site Number 14614 Grid Reference U14:063 727 Start of Record May 1955 Data Capture Rate 97% Data Summary From January 1956 To January 1981 Data Audited From To Equipment History
23/01/55: Staff gauge and chart recorder. 12/08/65: Float with F&P digital recorder. 06/08/86: 3 metre range Foxboro. 20/03/90: P.T. and Aquitel Remote. 01/11/99: IQuest logger. Comments on Stage/Discharge Ratings Control is by stable natural channel. Ratings available to convert stage (mm) to flow (l/s). General Comments This site recorded flow from May 1955 to January 1982 for the Hamilton Hydrological Survey. The site was transferred to the B.O.P.C.B. in January 1982, from this time tidal influences occurred as a result of the Kaituna flood control scheme. Site is now operated by Environment Bay of Plenty for flood monitoring purposes; flow discharge ratings for lower stages are no longer derived.
SITE LOCATION
Kaituna at Te Matai

242 Environmental Publication 2007/06
Station Comments Kaituna at Te Matai. Site Number 14614, on River Number 146000. The local recording authority is Environment Bay of Plenty. The site is situated 14.5 kilometres from the river mouth. Sediment concentration is also measured at the site. The gates at the outlet of Lake Rotoiti at Okere Falls act as an upstream control. Large changes in stage and flow occur when the settings on these gates are changed. 11/08/65 - Chart recorder replaced with F&P recorder on 650812. Recorder has a stage resolution of 1mm and a time resolution of 15 minutes. 16/08/67 - Synthetic record from 670816 to 670911 and from 680902 to 681001. Record derived from correlation with Waiari at Muttons. This period should not be used for flood analysis, daily mean discharges only. 02/07/68 - Synthetic record from 680702 to 681001. Record derived from correlation with Waiari at Muttons. This period should not be used for flood analysis, daily mean discharges only. 23/12/69 - Synthetic data from 691223 to 691231 16/09/72 - Synthetic data from 720916 to 720922. Record derived from correlation with Waiari at Muttons and rainfall data. 09/05/73 - Synthetic data from 730509 to 730511 04/03/79 - From 790304 at 163000 to 790305 104500 a straight line recession has been assumed as recorder was tampered with. No rain fell during this period. 26/08/80 - Missing record from 800826 134000 to 800905 100000 due to recorder malfunction. For an indication of flow during this period, refer to Mangorewa at Saunders (14628) and Kaituna at Lake Rotoiti outlet (14601). 120.9 mm of rain was recorded in Rotorua. 29/11/81 - Missing record from 811129 134500 to 811210 142700 due to recorder failure. 114.5mm of rain was recorded at Whakarewarewa during this period, with a maximum fall of 41.7mm on 811129. 07/01/82 - Site handed over to Bay of Plenty Catchment Board on 820107. 02/09/82 - Due to recorder failure there is synthetic data from 820902. This period, a gradual recession is considered adequate. F&P recorder removed from site due to water level dropping below the intake pipes. This drop was due to engineering work undertaken down stream of recorder, (Kaituna River scheme). 06/08/86 - 3 metre range Foxboro installed. 03/02/92 - Site shows a large fall in flow with minimum being reached at 240000. This is caused by the control gates at Okere Falls being shut to constrict flow. 01/11/99 - iQuest logger installed.
For additional information, please see recording authority.

Environment Bay of Plenty 243
Environment Bay of Plenty Hydrological Flow Summary
Date Complied July 2006 Site Number 14614 Compiled by Glenn Ellery River Kaituna Station Te Matai Metric Map Reference U14: 060 736 Catchment Area (km2) 948 Period of Summary 1956 to 1980 Statistical Summary
Flow (l/s) Minimum Flow 20576 Maximum Flow 376797 Mean Annual Minimum Flow 29158 Mean Annual Maximum Flow 134660 Mean Flow 39519 Mean Summer Flow 36448 Median Flow 37565 Mean Autumn Flow 37728 Mean Specific Flow (/km2) 42 Mean Winter Flow 41897 Mean Spring Flow 41300 Low Flow Distribution Fit GEV Peak Flow Distribution Fit Assessed 7 day Low Flow (Minimum) 22054 Peak Flow (5 yr Return) 170000 7 Day Low Flow (Mean Annual) 28953 Peak Flow (10 yr Return) 230000 7 day Low Flow (5 yr Return) 26043 Peak Flow (20 yr Return) 300000 7 Day Low Flow (10 yr Return) 24133 Peak Flow (50 yr Return) 405000 Peak Flow (100 yr Return)
Annual Summaries Flow (l/s) Flow (l/s) Year
Minimum Mean Maximum Year
Minimum Mean Maximum 1956 24007 44737 224948 1969 31358 42475 122601 1957 30866 39509 68766 1970 28151 48975 193508 1958 27897 36521 154611 1971 36281 44693 136916 1959 31483 39369 177694 1972 34949 34491 155502 1960 24798 37570 104438 1973 27582 34522 72036 1961 28844 36610 101073 1974 20576 37316 124306 1962 27948 49711 376797 1975 30539 38064 97964 1963 33790 44841 79632 1976 29835 34387 132161 1964 31483 38537 75547 1977 26552 30420 105818 1965 30658 37957 98454 1978 24946 35955 86451 1966 32565 42028 92400 1979 22371 33305 119597 1967 33695 43270 280009 1980 24483 42475 66165 1968 33281 42567 119116
Flow Distribution Flow (l/s)
Percentiles 0 1 2 3 4 5 6 7 8 9 0 376797 72035 63085 59319 57175 55530 54202 53116 52034 51164 10 50673 49969 49345 48671 48074 47541 47010 46527 46099 45626 20 45166 44711 44361 43995 43659 43282 42992 42670 42352 42087 30 41786 41526 41297 41033 40780 40530 40323 40097 39877 39688 40 39488 39279 39074 38871 38711 38521 38316 38126 37981 37779 50 37565 37369 37172 37021 36825 36660 36492 36330 36172 36067 60 35912 35747 35587 35429 35293 35182 35025 34865 34706 34556 70 34397 34296 34116 33927 33765 33635 33465 33282 33124 33022 80 32863 32669 32502 32356 32139 31897 31601 31308 30971 30579 90 30263 29835 29518 29122 28798 28346 27661 26831 26070 24807 100 20576

244 Environmental Publication 2007/06
0
50000
100000
150000
200000
250000
300000
350000
400000
1955 1960 1965 1970 1975 1980
Year
Flow
(l/s
)
Maximu Flow 5 per. Mov. Avg. (Maximu Flow )
0
5000
10000
15000
20000
25000
30000
35000
40000
1955 1960 1965 1970 1975 1980
Year
Flow
(l/s
)
Minimum Flow 5 per. Mov. Avg. (Minimum Flow )
0
10000
20000
30000
40000
50000
60000
1955 1960 1965 1970 1975 1980
Year
Flow
(l/s
)
Mean Flow 5 per. Mov. Avg. (Mean Flow )
0
10000
20000
30000
40000
50000
60000
1955 1960 1965 1970 1975 1980
Year
Flow
(l/s
)
Mean Autumn Flow 5 per. Mov. Avg. (Mean Autumn Flow )
0
10000
20000
30000
40000
50000
60000
1955 1960 1965 1970 1975 1980
Year
Flow
(l/s
)
Mean Winter Flow 5 per. Mov. Avg. (Mean Winter Flow )
0
10000
20000
30000
40000
50000
60000
1955 1960 1965 1970 1975 1980
Year
Flow
(l/s
)
Mean Spring Flow 5 per. Mov. Avg. (Mean Spring Flow )
0
10000
20000
30000
40000
50000
60000
1955 1960 1965 1970 1975 1980
Year
Flow
(l/s
)
Mean Summer Flow 5 per. Mov. Avg. (Mean Summer Flow )

Environment Bay of Plenty 245
Environment Bay of Plenty
River Flow Recording Station River Kaituna Site Taaheke Site Number 1114609 Grid Reference U15:035 499 Start of Record October 1981 Data Capture Rate 98% Data Summary From January 1906 To December 2000 Data Audited From NIWA To NIWA Equipment History 21/10/81: Float with L&S digital recorder 30/03/82: Backup Foxboro chart recorder. 26/07/93: Float with Kainga encoder and WRIC datalogger. Comments on Stage/Discharge Ratings Site control is by natural rock shelf. Ratings are available to convert Stage (mm) to Flow (l/s).
General Comments Site is operated by NIWA, Rotorua. Site was established in September 1981 due to commissioning of control gates which made flow measurement at the Lake Rotoiti at Outlet (14601) inoperable. Combining the records of both sites produces a historical flow record for the Kaituna. For the purposes of this data summary the sites have been combined, giving a complete flow record from 1906.
SITE LOCATION Kaituna at Taaheke

246 Environmental Publication 2007/06
Station Comments Kaituna River at Taaheke. Site Number 1114609, on River Number 146000. The local recording authority is NIWA, Rotorua. Control is by natural rock shelf. Site installed as a replacement flow site for Kaituna at Lake Rotoiti Outlet because of rating interference by Okere Falls control gates. 11/12/83 - Large fall and then rise in water level on 831211 from 100000 to 160000. Control gates upstream were closed and reopened during this period. 12/11/87 - Sudden changes in water level from 871112 80000 to 871112 170000 due to maintenance work on control gates at Lake Rotoiti Outlet. 20/10/92 - Biennial audit conducted on 921020. 22/02/94 - Data from 940222 84500 to 940228 173000 is an assumed straight line. Recorder tower was replaced during this period due to corrosion of lower cylinders. Kaituna at Lake Rotoiti, (14601) showed no fluctuations during the corresponding period. 29/01/05 – Vandals damaged gate control equipment so that Lake Rotoiti control gates closed completely. River flow was reduced to zero.
For additional information, please see recording authority.

Environment Bay of Plenty 247
Environment Bay of Plenty Hydrological Flow Summary
Date Complied December 2006 Site Number 1114609 Compiled by G R Ellery River Kaituna Station Taaheke Metric Map Reference U15: 035 499 Catchment Area (km2) 634 Period of Summary 1906 to 2005 Statistical Summary
Flow (l/s) Minimum Flow 6 Maximum Flow 57326 Mean Annual Minimum Flow 12711 Mean Annual Maximum Flow 32128 Mean Flow 20687 Mean Summer Flow 18814 Median Flow 20044 Mean Autumn Flow 17976 Mean Specific Flow (/km2) 33 Mean Winter Flow 22627 Mean Spring Flow 23285 Low Flow Distribution Fit GEV Peak Flow Distribution Fit Gumbel 7 day Low Flow (Minimum) 7113 Peak Flow (5 yr Return) 37800 7 Day Low Flow (Mean Annual) 12750 Peak Flow (10 yr Return) 42400 7 day Low Flow (5 yr Return) 10936 Peak Flow (20 yr Return) 46900 7 Day Low Flow (10 yr Return) 9832 Peak Flow (50 yr Return) 52600 Peak Flow (100 yr Return) 56900
Annual Summaries Flow (l/s) Flow (l/s) Year
Minimum Mean Maximum Year
Minimum Mean Maximum 1980 13422 20573 24736 1993 6189 17146 32946 1981 15282 21677 32194 1994 11531 18972 40403 1982 11798 19061 26642 1995 11960 24013 46472 1983 8293 17774 36224 1996 17186 25423 40529 1984 14243 18709 23794 1997 12296 21899 39275 1985 9425 19524 32158 1998 8412 22837 46377 1986 13097 21514 36650 1999 12392 22705 47365 1987 5621 16408 22872 2000 13114 21997 43395 1988 10717 19066 33653 2001 9555 22508 57326 1989 12367 25724 41625 2002 9673 19687 40905 1990 12777 24369 41251 2003 8113 18546 38483 1991 11936 20315 35886 2004 8067 22821 47780 1992 5545 19742 33528 2005 6 22322 39400
Flow Distribution Flow (l/s)
Percentiles 0 1 2 3 4 5 6 7 8 9 0 57326 37354 35142 33664 32568 31644 30757 30067 29446 28808 10 28169 27661 27289 26889 26589 26313 26055 25805 25571 25340 20 25156 24926 24724 24513 24273 24013 23798 23552 23368 23176 30 22998 22797 22611 22485 22308 22139 22041 21886 21774 21620 40 21484 21335 21206 21069 20908 20778 20633 20515 20357 20209 50 20044 19871 19749 19594 19443 19306 19201 19038 18909 18727 60 18559 18456 18324 18199 18112 17984 17877 17754 17626 17494 70 17330 17228 17063 16893 16758 16646 16485 16301 16120 16015 80 15828 15649 15461 15308 15120 14889 14719 14485 14256 14022 90 13739 13522 13278 13026 12848 12607 12328 11951 11077 9443 100 6

248 Environmental Publication 2007/06
0
10000
20000
30000
40000
50000
60000
70000
1905 1915 1925 1935 1945 1955 1965 1975 1985 1995 2005
Year
Flow
(l/s
)
Maximum Flow 5 per. Mov. Avg. (Maximum Flow )
0
5000
10000
15000
20000
25000
1905 1915 1925 1935 1945 1955 1965 1975 1985 1995 2005
Year
Flow
(l/s
)
Minimum Flow 5 per. Mov. Avg. (Minimum Flow )
0
5000
10000
15000
20000
25000
30000
35000
1905 1915 1925 1935 1945 1955 1965 1975 1985 1995 2005
Year
Flow
(l/s
)
Mean Flow 5 per. Mov. Avg. (Mean Flow )
0
5000
10000
15000
20000
25000
30000
35000
1905 1915 1925 1935 1945 1955 1965 1975 1985 1995 2005
Year
Flow
(l/s
)
Mean Autumn Flow 5 per. Mov. Avg. (Mean Autumn Flow )
0
5000
10000
15000
20000
25000
30000
35000
40000
1905 1915 1925 1935 1945 1955 1965 1975 1985 1995 2005
Year
Flow
(l/s
)
Mean Winter Flow 5 per. Mov. Avg. (Mean Winter Flow )
0
5000
10000
15000
20000
25000
30000
35000
40000
1905 1915 1925 1935 1945 1955 1965 1975 1985 1995 2005
Year
Flow
(l/s
)
Mean Spring Flow 5 per. Mov. Avg. (Mean Spring Flow )
0
5000
10000
15000
20000
25000
30000
35000
40000
1905 1915 1925 1935 1945 1955 1965 1975 1985 1995 2005
Year
Flow
(l/s
)
Mean Summer Flow 5 per. Mov. Avg. (Mean Summer Flow )
Kaituna at Taaheke

Environment Bay of Plenty 249
Environment Bay of Plenty River Flow Recording Station
River Ngongotaha Site S.H.5 Bridge Site Number 1014641 Grid Reference U15: 910 414 Start of Record May 1975 Data Capture Rate 100% Data Summary From January 1976 To December 2005 Data Audited From To Equipment History
20/05/75: Float with F&P digital recorder 13/04/84: Float with L&S digital recorder. 13/12/99: 5 metre P.T. with Kainga logger. Comments on Stage/Discharge Ratings Control at this site is by natural bed. Ratings are available to convert Stage (mm) to Flow (l/s).
General Comments Site is operated by NIWA, Rotorua.
SITE LOCATION Ngongotaha at S.H. 5 Bridge

250 Environmental Publication 2007/06
Station Comments Ngongotaha River at S.H. 5 Bridge. Site Number 1014641, on River Number 146074. Control is by natural bed. Approximately 800 metres upstream of recorder, Fish and Game New Zealand and Department of Conservation clean a fish trap causing small fluctuations in gauge height. Local recording authority is NIWA, Rotorua. 20/05/75 -Recorder installed on 750520 is a 10 metre range F&P digital recorder, having a stage ratio of 1mm of stage/mm recorded and a time punchout interval of 15 minutes. 13/04/84 -Recorder replaced on 840413 154500 by a 10 metre range L&S digital recorder, having a stage ratio of 1 mm of stage/mm recorded and a time punchout interval of 15 minutes. 24/09/85 -Telemetry installed on 850925. 09/11/87 -Growth of willow trees on the channel berm downstream of the recorder since 871109 051500 has caused the high stage range of rating curves to move to the left of previous curves. This reduction in channel efficiency is documented by photos taken since the site was first established. Some "crossing" of earlier curves has occurred. The lower end of these ratings remain similar in shape, but move up and down as a consequence of bed-level changes. 22/07/92 -Top end of ratings prior to this date have been drawn without evidence of gaugings and may require adjustment. Top end of ratings starting at this date have been drawn using gaugings on 900823 and 960522 which show a flatter top end than previously thought. 21/12/93 -The instability of the rating curve above 1.4 metres is caused by willow tree growth. 14/06/98 - Ratings have a change of shape due to the July 1998 floods. 13/12/99 -Kainga logger and Greenspan transducer installed as backup recorder. Pressure transducer has a 5 metre range and 10mm resolution. Logger has a 15 minute interval.
For additional information, please see recording authority.

Environment Bay of Plenty 251
Environment Bay of Plenty Hydrological Flow Summary
Date Complied G R Ellery Site Number 1014641 Compiled by November 2006 River Ngongotaha Station S.H. 5 Bridge Metric Map Reference U15: 910 414 Catchment Area (km2) 73.3 Period of Summary 1976 to 2005 Statistical Summary
Flow (l/s) Minimum Flow 919 Maximum Flow 44420 Mean Annual Minimum Flow 1178 Mean Annual Maximum Flow 23357 Mean Flow 1747 Mean Summer Flow 1669 Median Flow 1560 Mean Autumn Flow 1577 Mean Specific Flow (/km2) 24 Mean Winter Flow 1945 Mean Spring Flow 1804 Low Flow Distribution Fit GEV Peak Flow Distribution Fit GEV 7 day Low Flow (Minimum) 940 Peak Flow (5 yr Return) 32310 7 Day Low Flow (Mean Annual) 1115 Peak Flow (10 yr Return) 38000 7 day Low Flow (5 yr Return) 1013 Peak Flow (20 yr Return) 42920 7 Day Low Flow (10 yr Return) 960 Peak Flow (50 yr Return) 48560 Peak Flow (100 yr Return)
Annual Summaries Flow (l/s) Flow (l/s) Year
Minimum Mean Maximum Year
Minimum Mean Maximum 1980 1892 1460 6992 1993 1086 1389 21535 1981 2081 1438 28050 1994 925 1495 13360 1982 1634 1110 11500 1995 1196 2084 36447 1983 1356 919 29102 1996 1629 2248 41345 1984 1381 988 9422 1997 1397 1903 15532 1985 1483 965 16992 1998 1095 1995 33245 1986 1780 1157 44420 1999 1298 1795 23464 1987 1300 983 8182 2000 1036 1633 16490 1988 1568 936 17049 2001 1041 1725 33451 1989 2309 1646 14535 2002 1052 1546 39848 1990 2216 1622 28131 2003 991 1303 13429 1991 1716 1284 12633 2004 1051 1715 27624 1992 1665 1042 16042 2005 1207 1752 32428
Flow Distribution Flow (l/s)
Percentiles 0 1 2 3 4 5 6 7 8 9 0 44420 5501 4045 3406 3062 2828 2661 2534 2438 2361 10 2297 2246 2199 2158 2124 2091 2061 2038 2016 1995 20 1973 1953 1934 1915 1898 1881 1863 1847 1831 1815 30 1800 1786 1772 1758 1746 1734 1722 1709 1696 1683 40 1671 1659 1648 1636 1624 1614 1603 1592 1581 1570 50 1560 1550 1540 1528 1517 1505 1494 1483 1473 1463 60 1452 1442 1432 1422 1410 1400 1390 1379 1368 1358 70 1348 1338 1328 1319 1310 1299 1289 1278 1268 1258 80 1247 1237 1227 1216 1205 1194 1181 1170 1159 1148 90 1138 1126 1113 1100 1087 1071 1055 1038 1019 984 100 919

252 Environmental Publication 2007/06
05000
100001500020000250003000035000400004500050000
1975 1980 1985 1990 1995 2000 2005
Year
Flow
(l/s
)
Maximum Flow 5 per. Mov. Avg. (Maximum Flow )
0
200
400
600
800
1000
1200
1400
1600
1800
1975 1980 1985 1990 1995 2000 2005
Year
Flow
(l/s
)
Minimum Flow 5 per. Mov. Avg. (Minimum Flow )
0
500
1000
1500
2000
2500
1975 1980 1985 1990 1995 2000 2005
Year
Flow
(l/s
)
Mean Flow 5 per. Mov. Avg. (Mean Flow )
0
500
1000
1500
2000
2500
1975 1980 1985 1990 1995 2000 2005
Year
Flow
(l/s
)
Mean Autumn Flow 5 per. Mov. Avg. (Mean Autumn Flow )
0
500
1000
1500
2000
2500
3000
1975 1980 1985 1990 1995 2000 2005
Year
Flow
(l/s
)
Mean Winter Flow 5 per. Mov. Avg. (Mean Winter Flow )
0
500
1000
1500
2000
2500
3000
1975 1980 1985 1990 1995 2000 2005
Year
Flow
(l/s
)
Mean Spring Flow 5 per. Mov. Avg. (Mean Spring Flow )
0
500
1000
1500
2000
2500
3000
1975 1980 1985 1990 1995 2000 2005
Year
Flow
(l/s
)
Mean Summer Flow 5 per. Mov. Avg. (Mean Summer Flow )
Ngongotaha at S.H.5 Bridge

Environment Bay of Plenty 253
Environment Bay of Plenty River Flow Recording Station
River Utuhina Site S.H.5 Bridge Site Number 14610 Grid Reference U16: 943 365 Start of Record September 1967 Data Capture Rate 97% Data Summary From January 1968 To December 1996 Data Audited From January 1980 To April 1997 Equipment History 29/06/67: Foxboro chart recorder 13/10/75: Float with F&P digital recorder. 22/11/88: Float with L&S digital recorder. Comments on Stage/Discharge Ratings Control is by natural channel. Ratings available to convert stage (mm) to flow (l/s).
General Comments Site was initially installed by Water & Soil Division Hamilton. Site handed over to B.O.P.C.C. in January 1980. Daily fluctuations in water levels are caused by City Water Supply intake upstream at Hunt’s farm. Site is operated by Environment Bay of Plenty as part of its Natural Environment Regional Monitoring Network. Alternate site Utuhina at Depot Street (14637) opened September 2005 as part of Lake Rotorua water quality management.
SITE LOCATION Utuhina at S.H. 5 Bridge

254 Environmental Publication 2007/06
Station Comments Utuhina at S.H.5 Bridge. Site Number 14610, on River Number 146075. Local recording authority is Environment Bay of Plenty. Sediment concentrations are recorded. 03/10/75 - Synthetic data from 751003 to 751013. Record derived from correlation with Ngongotaha at SH.5 Bridge and Puarenga at FRI. 13/10/75 - Chart recorder replaced with F&P recorder on 751013. 02/01/80 -Site handed over to Bay of Plenty Catchment Commission on 800103. 15/03/81 - Due to recorder failure there is missing record between 810315 at 113000 and 810416 at 124500. 202 mm of rainfall was recorded at met B86124 raingauge during this period. 03/08/82 - Missing record from 820803 at 033000 to 820805 at 034500. 05/08/82 - Missing record from 820805 at 040000 to 820812 at 130000. 12/08/82 - Missing record from 820812 at 131500 to 820822 at 140000. 14/05/83 - Missing record from 830514 at 150000 to 830615 at 123000. 08/01/84 - Missing record from 840108 at 190000 to 840112 at 014500. 04/06/87 - Missing record from 870604 at 090000 to 870616 at 134500. 16/09/88 - Missing record from 880916 at 131500 to 880920 at 130000. 09/11/88 - Missing record from 881109 at 110000 to 881122 at 140000. 11/05/89 - Missing record from 890418 at 113000 to 890511 at 153000. 10/03/91 - Data from 910310 at 130000 to 910318 at 174500 was edited using edit option ramp. The ramping was carried out because of unnatural fluctuations in w/l caused by fishermen removing portions of the control. 01/12/92 - Missing record from 921201 at 100000 to 921201 at 120000. 23/02/93 - Missing record from 930223 at 101500 to 930223 at 114500. 14/04/93 - Missing record from 930414 at 1500 to 930416 at 123000. 02/06/96 - Missing record from 930602 at 121500 to 930602 at 133000. 22/03/94 - Missing record from 940322 at 115000 to 940322 at 130000. 15/06/96 - Missing record from 960615 at 174500 to 960617 141500. 03/04/97 - Site closed. Equipment removed. One cylinder remains buried with static tubes.
For additional information, please see recording authority.

Environment Bay of Plenty 255
Environment Bay of Plenty Hydrological Flow Summary
Date Complied July 2006 Site Number 14610 Compiled by G R Ellery River Utuhina Station S.H.5 Bridge. Metric Map Reference U16:943 365 Catchment Area (km2) 59.6 Period of Summary 1968 to 1996 Statistical Summary
Flow (l/s) Minimum Flow 896 Maximum Flow 47746 Mean Annual Minimum Flow 1207 Mean Annual Maximum Flow 19492 Mean Flow 1965 Mean Summer Flow 1765 Median Flow 1729 Mean Autumn Flow 1746 Mean Specific Flow (/km2) 33 Mean Winter Flow 2211 Mean Spring Flow 2138 Low Flow Distribution Fit GEV Peak Flow Distribution Fit Pearson 7 day Low Flow (Minimum) 999 Peak Flow (5 yr Return) 25600 7 Day Low Flow (Mean Annual) 1280 Peak Flow (10 yr Return) 32700 7 day Low Flow (5 yr Return) 1165 Peak Flow (20 yr Return) 42100 7 Day Low Flow (10 yr Return) 1088 Peak Flow (50 yr Return) 55000 Peak Flow (100 yr Return)
Annual Summaries Flow (l/s) Flow (l/s) Year
Minimum Mean Maximum Year
Minimum Mean Maximum 1971 1321 2941 25418 1984 1099 1761 17149 1972 1187 2478 18241 1985 1087 1686 12993 1973 1104 1869 13881 1986 980 1739 28403 1974 1197 2169 35509 1987 1003 1405 11100 1975 1415 2165 17017 1988 1051 1617 22488 1976 1374 2015 27383 1989 1411 2102 18408 1977 1218 1907 15600 1990 1445 2033 22759 1978 1063 1628 13251 1991 1265 1671 15874 1979 1155 2148 13733 1992 1423 1858 18702 1980 1326 1855 10196 1993 1263 1583 22790 1981 1357 1988 15569 1994 1181 1961 20454 1982 1072 1587 11498 1995 1227 2190 24785 1983 1067 1770 17493 1996 1346 2137 47746
Flow Distribution Flow (l/s)
Percentiles 0 1 2 3 4 5 6 7 8 9 0 47746 5528 4402 3891 3602 3390 3218 3077 2954 2851 10 2761 2678 2607 2547 2491 2440 2394 2354 2314 2277 20 2241 2210 2183 2154 2128 2106 2084 2063 2042 2021 30 2002 1982 1964 1946 1930 1913 1898 1884 1870 1858 40 1845 1834 1822 1811 1799 1787 1776 1764 1752 1741 50 1729 1718 1707 1696 1686 1676 1667 1658 1649 1639 60 1630 1620 1610 1600 1590 1580 1570 1561 1551 1542 70 1533 1524 1515 1507 1498 1489 1480 1471 1462 1453 80 1446 1438 1429 1419 1407 1395 1382 1368 1354 1340 90 1327 1313 1300 1284 1263 1238 1207 1179 1143 1109 100 896

256 Environmental Publication 2007/06
0
10000
20000
30000
40000
50000
60000
1968 1970 1972 1974 1976 1978 1980 1982 1984 1986 1988 1990 1992 1994 1996
Year
Flow
(l/s
)
Maximum Flow 5 per. Mov. Avg. (Maximum Flow )
0
200
400
600
800
1000
1200
1400
1600
1800
2000
1968 1970 1972 1974 1976 1978 1980 1982 1984 1986 1988 1990 1992 1994 1996
Year
Flow
(l/s
)
Minimum Flow 5 per. Mov. Avg. (Minimum Flow )
0
500
1000
1500
2000
2500
3000
3500
4000
1968 1970 1972 1974 1976 1978 1980 1982 1984 1986 1988 1990 1992 1994 1996
Year
Flow
(l/s
)
Mean Flow 5 per. Mov. Avg. (Mean Flow )
1000
1500
2000
2500
3000
3500
4000
1968 1970 1972 1974 1976 1978 1980 1982 1984 1986 1988 1990 1992 1994 1996
Year
Flow
(l/s
)
Mean Autumn Flow 5 per. Mov. Avg. (Mean Autumn Flow )
1000
1500
2000
2500
3000
3500
4000
1968 1970 1972 1974 1976 1978 1980 1982 1984 1986 1988 1990 1992 1994 1996
Year
Flow
(l/s
)
Mean Winter Flow 5 per. Mov. Avg. (Mean Winter Flow )
1000
1500
2000
2500
3000
3500
4000
1968 1970 1972 1974 1976 1978 1980 1982 1984 1986 1988 1990 1992 1994 1996
Year
Flow
(l/s
)
Mean Spring Flow 5 per. Mov. Avg. (Mean Spring Flow )
1000
1500
2000
2500
3000
3500
4000
1968 1970 1972 1974 1976 1978 1980 1982 1984 1986 1988 1990 1992 1994 1996
Year
Flow
(l/s
)
Mean Summer Flow 5 per. Mov. Avg. (Mean Summer Flow )

Environment Bay of Plenty 257
Environment Bay of Plenty River Flow Recording Station
River Puarenga Site F.R.I Site Number 14625 Grid Reference U16: 962 334 Start of Record May 1975 Data Capture Rate 98% Data Summary From January 1976 To January 1997 Data Audited From July 1991 To July 1997 Equipment History
06/05/75: Float with F&P digital recorder. 02/07/91: Float with L&S digital recorder. 13/07/92: Backup encoder and WRIC datalogger. Comments on Stage/Discharge Ratings Control is by natural channel and gabion baskets since February 1985. Ratings available to convert stage (mm) to flow (l/s).
General Comments This site was established in 1966 for pollution studies and water resources surveys. It was known as Whakarewarewa School. Independent pumping stations upstream cause daily fluctuations in the water level. Site transferred to B.O.P.C.C. in January 1980. Transferred to MWD in August 1982 for inclusion in the Rotorua Geothermal Monitoring programme. Site was transferred to Environment Bay of Plenty in July 1991 and is part of the Natural Environment Regional Monitoring Network. In July 1993 site operation was contracted to NIWA, Rotorua.
SITE LOCATION Puarenga at F.R.I.

258 Environmental Publication 2007/06
Station Comments Puarenga at F.R.I. Site Number 14625, on River Number 146076. The local recording authority is Environment Bay of Plenty. The station is situated 2.2 kilometres from mouth. The control is by natural bedrock. The site was established in 1966 for pollution studies and water resources surveys. There are flow gaugings only until a F&P digital recorder was installed 750505. Independent pumping stations upstream of the recorder cause daily fluctuations in water level, these may cause spikes when all pumps are operating at the same time. 01/01/76 -Annual minimum for 1976 shows up as being a spike, but is the result of pumping upstream of the recorder. 02/01/80 -Site transferred to Bay of Plenty Catchment Commission on 800103. 12/08/82 -Site transferred to Water and Soil Division, MWD, Rotorua for inclusion in the Rotorua Geothermal Monitoring programme. Also installed at this site is a temperature recorder. Data is filed under Site Number 2026 on the miscellaneous tape from 820922 at 153000. 01/01/85 - Annual minimum for 1985 shows up as being a spike and is a true event due to the action of pumping upstream of the recorder. 26/02/85 - Gabion baskets installed across stream to stabilize stream bed and act as control. Stream flow was raised 10 to 15 millimetres while baskets were being installed from 850226 081500 to 850226 114500. 07/10/88 - There is a change in the bottom end rating shape from 880312 230000 to 881007 010000 due to a change in the channel efficiency at the low stage as the result of weed growth on the channel bed. This has led to a slight improvement in channel efficiency further up the curve. 02/07/91 - Site handed over to Environment Bay of Plenty. 01/07/93 - Operation of site contracted out by Environment Bay of Plenty, to NIWA, Rotorua. 17/07/97 - Site closed and instruments removed. 04/10/05 – Site reopened. iQuest dalaogger and Handar shaft encoder installed. Time resolution 15 minutes, stage resolution 1 mm.
For additional information, please see recording authority.
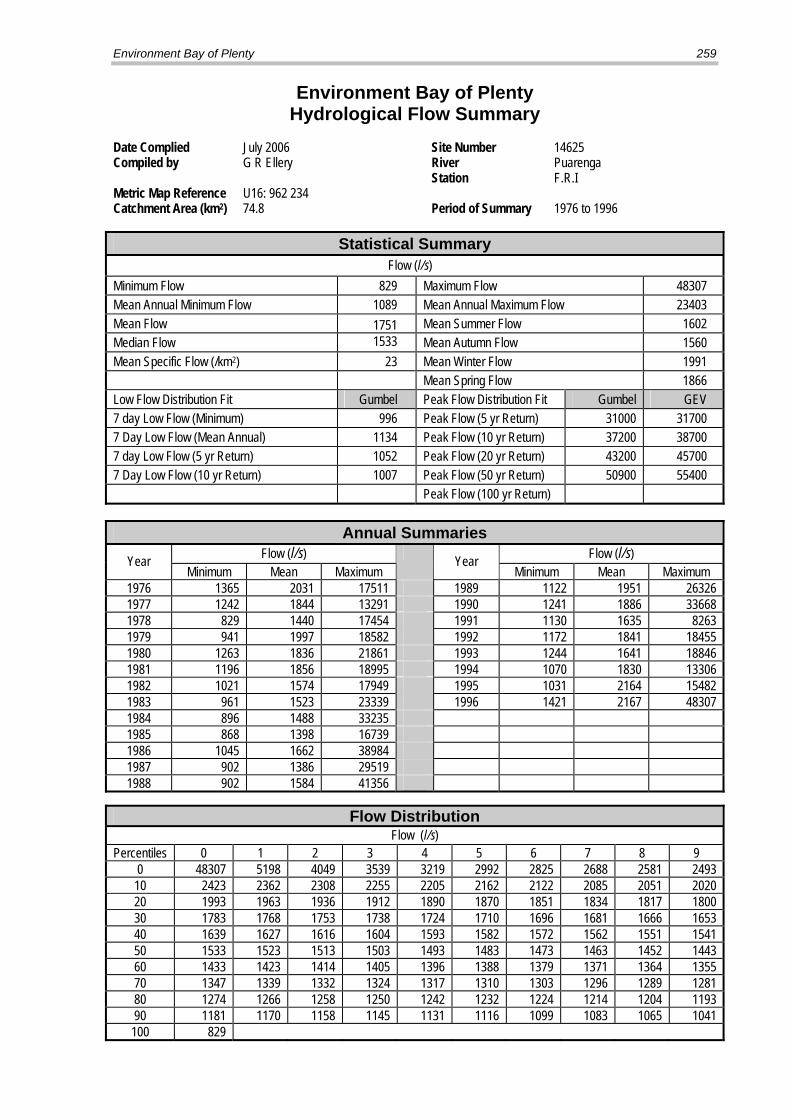
Environment Bay of Plenty 259
Environment Bay of Plenty Hydrological Flow Summary
Date Complied July 2006 Site Number 14625 Compiled by G R Ellery River Puarenga Station F.R.I Metric Map Reference U16: 962 234 Catchment Area (km2) 74.8 Period of Summary 1976 to 1996 Statistical Summary
Flow (l/s) Minimum Flow 829 Maximum Flow 48307 Mean Annual Minimum Flow 1089 Mean Annual Maximum Flow 23403 Mean Flow 1751 Mean Summer Flow 1602 Median Flow 1533 Mean Autumn Flow 1560 Mean Specific Flow (/km2) 23 Mean Winter Flow 1991 Mean Spring Flow 1866 Low Flow Distribution Fit Gumbel Peak Flow Distribution Fit Gumbel GEV 7 day Low Flow (Minimum) 996 Peak Flow (5 yr Return) 31000 31700 7 Day Low Flow (Mean Annual) 1134 Peak Flow (10 yr Return) 37200 38700 7 day Low Flow (5 yr Return) 1052 Peak Flow (20 yr Return) 43200 45700 7 Day Low Flow (10 yr Return) 1007 Peak Flow (50 yr Return) 50900 55400 Peak Flow (100 yr Return)
Annual Summaries Flow (l/s) Flow (l/s) Year
Minimum Mean Maximum Year
Minimum Mean Maximum 1976 1365 2031 17511 1989 1122 1951 26326 1977 1242 1844 13291 1990 1241 1886 33668 1978 829 1440 17454 1991 1130 1635 8263 1979 941 1997 18582 1992 1172 1841 18455 1980 1263 1836 21861 1993 1244 1641 18846 1981 1196 1856 18995 1994 1070 1830 13306 1982 1021 1574 17949 1995 1031 2164 15482 1983 961 1523 23339 1996 1421 2167 48307 1984 896 1488 33235 1985 868 1398 16739 1986 1045 1662 38984 1987 902 1386 29519 1988 902 1584 41356
Flow Distribution Flow (l/s)
Percentiles 0 1 2 3 4 5 6 7 8 9 0 48307 5198 4049 3539 3219 2992 2825 2688 2581 2493 10 2423 2362 2308 2255 2205 2162 2122 2085 2051 2020 20 1993 1963 1936 1912 1890 1870 1851 1834 1817 1800 30 1783 1768 1753 1738 1724 1710 1696 1681 1666 1653 40 1639 1627 1616 1604 1593 1582 1572 1562 1551 1541 50 1533 1523 1513 1503 1493 1483 1473 1463 1452 1443 60 1433 1423 1414 1405 1396 1388 1379 1371 1364 1355 70 1347 1339 1332 1324 1317 1310 1303 1296 1289 1281 80 1274 1266 1258 1250 1242 1232 1224 1214 1204 1193 90 1181 1170 1158 1145 1131 1116 1099 1083 1065 1041 100 829

260 Environmental Publication 2007/06
0
10000
20000
30000
40000
50000
60000
1976 1978 1980 1982 1984 1986 1988 1990 1992 1994 1996
Year
Flow
(l/s
)
Maximum Flow 5 per. Mov. Avg. (Maximum Flow )
0
200
400
600
800
1000
1200
1400
1600
1976 1978 1980 1982 1984 1986 1988 1990 1992 1994 1996
Year
Flow
(l/s
)
Minimum Flow 5 per. Mov. Avg. (Minimum Flow )
0
500
1000
1500
2000
2500
1976 1978 1980 1982 1984 1986 1988 1990 1992 1994 1996
Year
Flow
(l/s
)
Mean Flow 5 per. Mov. Avg. (Mean Flow )
0
500
1000
1500
2000
2500
1976 1978 1980 1982 1984 1986 1988 1990 1992 1994 1996
Year
Flow
(l/s
)
Mean Autumn Flow 5 per. Mov. Avg. (Mean Autumn Flow )
0
500
1000
1500
2000
2500
3000
3500
1976 1978 1980 1982 1984 1986 1988 1990 1992 1994 1996
Year
Flow
(l/s
)
Mean Winter Flow 5 per. Mov. Avg. (Mean Winter Flow )
0
500
1000
1500
2000
2500
3000
1976 1978 1980 1982 1984 1986 1988 1990 1992 1994 1996
Year
Flow
(l/s
)
Mean Spring Flow 5 per. Mov. Avg. (Mean Spring Flow )
0
500
1000
1500
2000
2500
1976 1981 1986 1991 1996
Year
Flow
(l/s
)
Mean Summer Flow 5 per. Mov. Avg. (Mean Summer Flow )
Puarenga at F.R.I

Environment Bay of Plenty 261
Environment Bay of Plenty River Flow Recording Station
River Puarenga Site Hemo Gorge Site Number 1114613 Grid Reference U16: 947 314 Start of Record August 1982 Data Capture Rate 100% Data Summary From January 1983 To December 1996 Data Audited From June 1991 To December 1996 Equipment History 05/08/82 : Float with F & P digital recorder 01/07/93: Float with L & S digital recorder Comments on Stage/Discharge Ratings Control is by stable natural bed rock. Ratings available to convert stage (mm) to flow (l/s). General Comments Site was transferred to B.O.P.R.C. in July 1991. This site is established for use in the Rotorua Geothermal Monitoring programme. Rotorua District Council have an automatic water pumping station upstream of the recorder causing diurnal fluctuation in the water level.
SITE LOCATION Puarenga at Hemo Gorge

262 Environmental Publication 2007/06
Station Comments Puarenga River at Hemo Gorge. Site Number 1114613, on River Number 146076. 09/10/85 - Site closed 851009 093000 28/06/91 - Site re-opened. 01/07/91 - Site control handed over to B.O.P.R.C. 01/07/93 - Site control contracted out to NIWA, Rotorua by Environment Bay of Plenty. Data processing carried out by NIWA to their standards. 17/07/97 - Site closed and instruments removed.
For additional information, please see recording authority.

Environment Bay of Plenty 263
Environment Bay of Plenty Hydrological Flow Summary
Date Complied July 2006 Site Number 1114613 Compiled by G R Ellery River Purenga Station Hemo Gorge Metric Map Reference U16 947 314 Catchment Area (km2) 72.8 Period of Summary 1983 to 1996 Statistical Summary
Flow (l/s) Minimum Flow 741 Maximum Flow 49416 Mean Annual Minimum Flow 941 Mean Annual Maximum Flow 21277 Mean Flow 1609 Mean Summer Flow 1427 Median Flow 1391 Mean Autumn Flow 1367 Mean Specific Flow (/km2) 22 Mean Winter Flow 1857 Mean Spring Flow 1759 Low Flow Distribution Fit Gumbel Peak Flow Distribution Fit Gumbel GEV 7 day Low Flow (Minimum) 807 Peak Flow (5 yr Return) 30238 29722 7 Day Low Flow (Mean Annual) 965 Peak Flow (10 yr Return) 7 day Low Flow (5 yr Return) 878 Peak Flow (20 yr Return) 7 Day Low Flow (10 yr Return) Peak Flow (50 yr Return) Peak Flow (100 yr Return)
Annual Summaries Flow (l/s) Flow (l/s) Year
Minimum Mean Maximum Year
Minimum Mean Maximum 1980 1993 1046 1469 17788 1981 1994 883 1648 12896 1982 1995 932 1929 15686 1983 774 1342 22677 1996 1306 2077 49416 1984 813 1331 32635 1997 1985 741 1263 15240 1998 1986 1999 1987 2000 1988 2001 1989 2002 1990 2003 1991 946 1653 7880 2004 1992 1026 1712 17271 2005
Flow Distribution Flow (l/s)
Percentiles 0 1 2 3 4 5 6 7 8 9 0 49416 4969 3924 3442 3136 2931 2753 2623 2512 2420 10 2337 2267 2209 2160 2117 2078 2037 2001 1963 1928 20 1896 1867 1839 1811 1787 1766 1747 1730 1712 1693 30 1676 1659 1641 1625 1610 1597 1580 1565 1551 1538 40 1525 1510 1495 1480 1466 1452 1438 1426 1414 1402 50 1391 1378 1366 1353 1339 1325 1311 1298 1285 1273 60 1262 1252 1243 1233 1224 1215 1208 1200 1193 1186 70 1179 1172 1165 1158 1152 1146 1139 1132 1124 1116 80 1106 1096 1087 1078 1068 1060 1052 1042 1032 1021 90 1010 999 984 971 960 949 937 924 909 881 100 741

264 Environmental Publication 2007/06
0
10000
20000
30000
40000
50000
60000
1982 1984 1986 1988 1990 1992 1994 1996
Year
Flow
(l/s
)
Maximum Flow
0
200
400
600
800
1000
1200
1400
1982 1984 1986 1988 1990 1992 1994 1996
Year
Flow
(l/s
)
Minimum Flow
0
500
1000
1500
2000
2500
1982 1984 1986 1988 1990 1992 1994 1996
Year
Flow
(l/s
)
Mean Flow
0
500
1000
1500
2000
2500
1982 1984 1986 1988 1990 1992 1994 1996
Year
Flow
(l/s
)
Mean Autumn Flow
0
500
1000
1500
2000
2500
3000
1982 1984 1986 1988 1990 1992 1994 1996
Year
Flow
(l/s
)
Mean Winter Flow
0
500
1000
1500
2000
2500
1982 1984 1986 1988 1990 1992 1994 1996
Year
Flow
(l/s
)
Mean Spring Flow
0200400600800
100012001400160018002000
1982 1984 1986 1988 1990 1992 1994 1996
Year
Flow
(l/s
)
Mean Summer Flow
Puarenga at Hemo Gorge

Environment Bay of Plenty 265
Environment Bay of Plenty River Flow Recording Station
River Roto-a-Tamaheke Site Path
Site Number 1114610 Grid Reference U16: 959 328 Start of Record February 1984 Data Capture Rate 98% Data Summary From January 1985 To December 2000 Data Audited From January 1990 To December 2000 Equipment History 29/02/84: Float/counterweight system with shaft encoder. 1mm resolution. Comments on Stage/Discharge Ratings Control is by 90 degree V-notch weir. Ratings available to convert stage (mm) to flow (l/s).
General Comments This site was installed by Rotorua Water Resource Survey as part of the Rotorua Geothermal Monitoring programme. Man-made interference to hot pools upstream of the recorder has affected data collected for short periods throughout the record. Roto-a-Tamaheke is one of two flow sites in this catchment. Te Kokonga at Bathhouse measures flow at the western outlet of Lake Roto-a-Tamaheke. Site was operated by NIWA, Rotorua. On the 02/07/91 it was handed over to Environment Bay of Plenty and is operated as part of its Natural Environment Regional Monitoring Network. In July 1993 operation of the site was contracted back to NIWA, Rotorua.
SITE LOCATION Roto-a-Tamaheke at Path

266 Environmental Publication 2007/06
Station Comments Roto-a-Tamaheke River at Path. Site Number 1114610, on River Number 146076. The local recording authority is Environment Bay of Plenty. The control is by 90 degree V-notch weir. The site has been installed as part of the Rotorua geothermal monitoring programme. This site is one of two flow sites in the catchment. The other, Te Kokonga at Bathhouse Site Number 1114615, measures the flow at the western end of Lake Roto-a-Tamaheke. There is also an automatic raingauge installed at this site, (861221). The rating curve is based on the formula q=1.34*h to the power of 2.48. Gaugings at the site are normally carried out at a narrow x-section approximately 1.5 metres above the V-notch. Lower flow gaugings have a reduced number of verticals and high associated uncertainty. 15/07/84 - Data from 840715 240000 to 841010 240000 shows high water level due to the western outlet of Roto-a-Tamaheke being blocked off, resulting in the entire discharge of the area flowing through the Roto-a-Tamaheke at Path site. 23/06/84 - Spikes occur throughout the dataset as a result of man made interference to hot pools upstream of the recorder. 28/10/89 - A dam was built between Spring 337 and 337/1 between 891028 and 891029 and the by pass between 337 and 428 was opened up. The dam between 337 and 337/1 was breached about 891206 with the by pass still being opened. Also a pipe was installed in Spring 426, below water level, through to 428 on 891111 and 891112. This pipe was blocked on 891113 by Water Resources Survey staff and has subsequently been removed. The above work was carried out by an interested member of the public. 30/08/90 - Missing record from 900830 161500 to 900911 090000 due to a board being stuck across the V-notch, this raised the stage by 32mm, an apparent 30% increase in flow. 24/06/91 - Missing record from 910624 150000 to 910626 160000 due to the recorder being removed to allow for the installation of a new recorder shed. 02/07/91 - Site handed over to Environment Bay of Plenty. 23/08/91 - Board put across weir. Water level artificially raised by 130mm at 134500. Board removed by DSIR on 910827 091500. Data has had 130 mm subtracted prior to corrections to external staff gauge. 29/09/91 - Board put across weir caused artificial rise in water level. Board removed on 911002 between 124500 and 130000. Data has been corrected to delete this artificially high stage. 06/02/92 - Culvert on south side of recorder was opened by persons unknown. When staff visited the site they closed the culvert prior to changing the tape. Processing of this tape (#5) has taken this into account. Relevelled internal plumbob and external staff gauge. Cleared silt from around intakes, water level inside tower rose 15mm. 23/12/93 - Between 931223 and 930108 outflow altered by a channel from Spring 426 being cut 400mm deeper, diverting flow from Spring from flowing over weir. 29/12/95 - Data from 951229 211500 to 960108 193000 was affected by the placement of a board across the mouth of the v-notch. It is not known if water was flowing under the board, it has been assumed not. The data has been corrected first using a rating to produce the correct flow for the recorded stage. Then the original rating, inverted, has been applied to obtain the correct stage. 08/02/96 - Board removed from v-notch. Rating change. 26/02/98 - Unusual stage plots on or around the 980226 are likely to be caused by alterations to hot springs above the recorder. The most likely of these is Spring 426, at about this time the outflow from the spring was diverted from the outflow channel into Spring 428, just above the site. 10/01/00 - Site closed.
For additional information, please see recording authority.

Environment Bay of Plenty 267
Environment Bay of Plenty Hydrological Flow Summary
Date Complied July 2006 Site Number 1114610 Compiled by G R Ellery River Roto-a-Tamaheke Station Path Metric Map Reference U16: 959 328 Catchment Area (km2) 0.45 Period of Summary 1985 to 2000 Statistical Summary
Flow (l/s) Minimum Flow 4 Maximum Flow 241 Mean Annual Minimum Flow 12 Mean Annual Maximum Flow 156 Mean Flow 28 Mean Summer Flow 30 Median Flow 27 Mean Autumn Flow 28 Mean Specific Flow (/km2) 62 Mean Winter Flow 26 Mean Spring Flow 27 Low Flow Distribution Fit Gumbel Peak Flow Distribution Fit Gumbel GEV 7 day Low Flow (Minimum) 4 Peak Flow (5 yr Return) 193 195 7 Day Low Flow (Mean Annual) 14 Peak Flow (10 yr Return) 224 228 7 day Low Flow (5 yr Return) 10 Peak Flow (20 yr Return) 253 261 7 Day Low Flow (10 yr Return) 8 Peak Flow (50 yr Return) Peak Flow (100 yr Return)
Annual Summaries Flow (l/s) Flow (l/s) Year
Minimum Mean Maximum Year
Minimum Mean Maximum 1980 1993 9 28 165 1981 1994 12 27 139 1982 1995 14 31 180 1983 1996 11 23 160 1984 1997 9 19 153 1985 6 25 68 1998 8 16 119 1986 11 30 235 1999 8 11 221 1987 10 36 167 2000 4 7 68 1988 22 42 241 2001 1989 21 45 147 2002 1990 26 44 166 2003 1991 17 36 138 2004 1992 11 32 130 2005
Flow Distribution Flow (l/s)
Percentiles 0 1 2 3 4 5 6 7 8 9 0 241 67 58 55 52 51 49 48 47 46 10 45 44 44 43 43 42 41 41 40 40 20 39 39 38 38 37 37 37 36 36 35 30 35 34 34 34 33 33 33 32 32 31 40 31 31 30 30 30 29 29 29 28 28 50 27 27 27 26 26 26 25 25 24 24 60 24 23 23 23 22 22 21 21 20 20 70 20 19 19 18 18 17 17 16 16 16 80 15 15 14 14 13 12 12 11 11 10 90 10 10 9 9 9 8 7 6 5 5 100 4

268 Environmental Publication 2007/06
0
50
100
150
200
250
300
1984 1986 1988 1990 1992 1994 1996 1998 2000
Year
Flow
(l/s
)
Maximum Flow 5 per. Mov. Avg. (Maximum Flow )
0
5
10
15
20
25
30
1984 1986 1988 1990 1992 1994 1996 1998 2000
Year
Flow
(l/s
)
Minimum Flow 5 per. Mov. Avg. (Minimum Flow )
05
101520253035404550
1984 1986 1988 1990 1992 1994 1996 1998 2000
Year
Flow
(l/s
)
Mean Flow 5 per. Mov. Avg. (Mean Flow )
05
101520253035404550
1984 1986 1988 1990 1992 1994 1996 1998 2000
Year
Flow
(l/s
)
Mean Autumn Flow 5 per. Mov. Avg. (Mean Autumn Flow )
05
101520253035404550
1984 1986 1988 1990 1992 1994 1996 1998 2000
Year
Flow
(l/s
)
Mean Winter Flow 5 per. Mov. Avg. (Mean Winter Flow )
05
101520253035404550
1984 1986 1988 1990 1992 1994 1996 1998 2000
Year
Flow
(l/s
)
Mean Spring Flow 5 per. Mov. Avg. (Mean Spring Flow )
0
10
20
30
40
50
60
1984 1986 1988 1990 1992 1994 1996 1998 2000
Year
Flow
(l/s
)
Mean Summer Flow 5 per. Mov. Avg. (Mean Summer Flow )
Roto-a-Tamaheke at Path

Environment Bay of Plenty 269
Environment Bay of Plenty River Flow Recording Station
River Te Kokonga Site Bathhouse Site Number 1114615 Grid Reference U16:956 328 Start of Record June 1984 Data Capture Rate 95% Data Summary From January 1985 To December 2000 Data Audited From January 1990 To December 2000 Equipment History Float/counterweight system with shaft encoder. 1mm resolution. Comments on Stage/Discharge Ratings Site control is by stainless steel pipe. Ratings are based on volumetric gaugings taken at the inlet to the Bathhouse. Ratings are available to convert Stage (mm) to Flow (l/s).
General Comments This site was installed by Rotorua Water Resource Survey as part of the Rotorua Geothermal Monitoring programme. Te Kokonga is one of two flow sites in this catchment. Roto-a-Tamaheke at Path measures flow at the eastern outlet of Lake Roto-a-Tamaheke. Site was operated by NIWA, Rotorua. On the 04/07/91 the site was handed over to Environment Bay of Plenty and is operated as part of its Natural Environment Regional Monitoring Network. In July 1993 site operation was contracted back to NIWA, Rotorua.
SITE LOCATION Te Kokonga at Bathhouse

270 Environmental Publication 2007/06
Station Comments Te Kokonga at Bathhouse. Site Number 1114615, on River Number 146076. The local recording authority is Environment Bay of Plenty. Control is by 300mm stainless steel pipe. Te Kokonga is one of two flow sites in the Roto-a-Tamaheke catchment - the other Tamaheke at Path measures the flow at the eastern outlet of Roto-a-Tamaheke. Water level at this site represents the level in the "control box". This control box has a 225mm inlet, from Roto-a-Tamaheke, which is controlled by the locals to supply their bathhouse. The outlet is via a 300mm pipe which acts as the control. The intake for the recorder tower also comes from this box. As a result of this manipulation by the locals, sudden changes in water level can occur, hence the data contains many spikes, a constant surge is also evident. Gaugings above are carried out by the volumetric method by measuring the fill time into a large drum (approximately 226 litres)in the bathhouse. There is a large scatter in the observed gaugings which is caused in part by the measurement procedure (timing errors) and derivation of gauge height. The majority of gaugings prior to 1997 had external staff gauge readings used for the gauge height. The staff gauge is housed within the box and is subject to turbulence and drawdown effects and is difficult to read. Due to the short time period available to carry out gaugings (imposed by owners of the bathhouse) there are no corresponding recorder readings to apply to these gaugings. Rating changes should not occur due to the nature of the control box, however there appears to have been some movement and may be identified by observing the long term changes in level of the downward spikes when the flow through the box is reduced to a trickle. 08/11/90 - Missing record from 901108 124500 to 901115 103000 due to Spring 328 being cleaned out of silt from around the control box, thus disrupting the intake pipe to the recorder tower. 26/10/90 - Last gauging by DSIR. 04/07/91 - Site taken over by B.O.P.R.C. on 910704. 17/06/92 - First B.O.P.R.C. Gauging at gauge height 1.220 metres and a flow indicative of a change in rating since the last gauging on 901026 by DSIR. This was confirmed by several gaugings on 920805. A number of fluctuations can be noted in the data, the most notable of which appears to occur on 910621. Investigation of this abnormal fluctuation (probably the result of human influence) suggests a link to the change in rating. A piece of wood was later (see comment of 920810) found to be jammed in the control box causing the rating change. A new rating (002) has therefore been filed at 910621. 10/08/92 - Board found jammed in control box was removed / thereby lowering the rating relationship. New rating filed at 920810 112500. This rating is not the same as the original rating. 01/07/93 - Operation of sites contracted out to NIWA Rotorua by Environment Bay of Plenty. 01/07/98 - Site operated by Environment Bay of Plenty. 10/01/01 - Site closed.
For additional information, please see recording authority.

Environment Bay of Plenty 271
Environment Bay of Plenty Hydrological Flow Summary
Date Complied July 2006 Site Number 1114615 Compiled by G R Ellery River Te Kokonga Station Bathhouse Metric Map Reference U16:956 328 Catchment Area (km2) 0.5 Period of Summary 1985 to 2000 Statistical Summary
Flow (l/s) Minimum Flow 0 Maximum Flow 66 Mean Annual Minimum Flow 1 Mean Annual Maximum Flow 50 Mean Flow 23 Mean Summer Flow 19 Median Flow 23 Mean Autumn Flow 22 Mean Specific Flow (/km2) 0.5 Mean Winter Flow 28 Mean Spring Flow 25 Low Flow Distribution Fit GEV Peak Flow Distribution Fit Gumbel 7 day Low Flow (Minimum) 3 Peak Flow (5 yr Return) 55 7 Day Low Flow (Mean Annual) 10 Peak Flow (10 yr Return) 59 7 day Low Flow (5 yr Return) 7 Peak Flow (20 yr Return) 63 7 Day Low Flow (10 yr Return) 6 Peak Flow (50 yr Return) Peak Flow (100 yr Return)
Annual Summaries Flow (l/s) Flow (l/s) Year
Minimum Mean Maximum Year
Minimum Mean Maximum 1980 1993 0 25 46 1981 1994 0 23 45 1982 1995 0 20 48 1983 1996 0 19 48 1984 1997 0 30 52 1985 1 22 57 1998 0 28 45 1986 2 21 54 1999 0 23 42 1987 1 20 49 2000 0 21 38 1988 2 22 51 2001 1989 2 24 49 2002 1990 1 25 66 2003 1991 0 21 59 2004 1992 0 25 48 2005
Flow Distribution Flow (l/s)
Percentiles 0 1 2 3 4 5 6 7 8 9 0 66 39 38 36 36 35 34 34 33 33 10 33 32 32 32 31 31 31 30 30 30 20 29 29 29 29 29 28 28 28 28 28 30 27 27 27 27 26 26 26 26 26 25 40 25 25 25 25 25 24 24 24 24 24 50 23 23 23 23 23 23 22 22 22 22 60 22 21 21 21 21 21 20 20 20 20 70 19 19 19 19 18 18 18 18 17 17 80 17 17 16 16 15 15 15 14 14 13 90 13 13 12 12 11 10 9 8 6 3 100 0

272 Environmental Publication 2007/06
0
10
20
30
40
50
60
70
1985 1987 1989 1991 1993 1995 1997 1999
Year
Flow
(l/s
)
Maximum Flow 5 per. Mov. Avg. (Maximum Flow )
0
1
2
3
4
5
1985 1987 1989 1991 1993 1995 1997 1999
Year
Flow
(l/s
)
Minimum Flow 5 per. Mov. Avg. (Minimum Flow )
0
5
10
15
20
25
30
35
1985 1987 1989 1991 1993 1995 1997 1999
Year
Flow
(l/s
)
Mean Flow 5 per. Mov. Avg. (Mean Flow )
0
5
10
15
20
25
30
35
1985 1987 1989 1991 1993 1995 1997 1999
Year
Flow
(l/s
)
Mean Autumn Flow 5 per. Mov. Avg. (Mean Autumn Flow )
0
5
10
15
20
25
30
35
40
1985 1987 1989 1991 1993 1995 1997 1999
Year
Flow
(l/s
)
Mean Winter Flow 5 per. Mov. Avg. (Mean Winter Flow )
0
5
10
15
20
25
30
35
1985 1987 1989 1991 1993 1995 1997 1999
Year
Flow
(l/s
)
Mean Spring Flow 5 per. Mov. Avg. (Mean Spring Flow )
0
5
10
15
20
25
30
1985 1987 1989 1991 1993 1995 1997 1999
Year
Flow
(l/s
)
Mean Summer Flow 5 per. Mov. Avg. (Mean Summer Flow )

Environment Bay of Plenty 273
Environment Bay of Plenty River Flow Recording Station
River Pongakawa Site Old Coach Road Site Number 14703 Grid Reference V15: 187 663 Start of Record June 1997 Data Capture Rate 97% Data Summary From January 1998 To December 2005 Data Audited From June 1997 To December 2005 Equipment History Float/counterweight system with shaft encoder. 1mm resolution. Comments on Stage/Discharge Ratings Control is by natural channel. Site is prone to significant weed growth during summer months that constricts channel width and changes ratings. Smoothed ratings are utilised to cater for the gradual weed growth over time. Bed is extremely mobile being made up of fine pumice gravels and sands. Ratings available to convert stage (mm) to flow (l/s). General Comments Site is operated by Environment Bay of Plenty as part of its Natural Environmental Monitoring Network.
SITE LOCATION Pongakawa at Old Coach Road

274 Environmental Publication 2007/06
Station Comments Pongakawa Old Coach Road. Site number is 14703 on river number. The site is situated at NZMS260 grid reference V15:187 663 and drains 50 km2. Site record has diurnal fluctuations which may be caused by land use in the upstream catchment or extraction for Pongakawa water supply. Site is prone to significant weed growth during summer months that constricts channel width and changes ratings. Smoothed ratings are utilised to cater for the gradual weed growth over time. Bed is extremely mobile being made up of fine pumice gravels and sands. 25/06/97 - Site installed. Datalogger is a CR500 with a recording interval of 15 minutes. Sensor is a handar rotary encoder with a stage resolution of 1mm. 11/03/99 - Missing record from 990311 at 083000 to 990319 at 040000 due to battery failure. 30/08/99 - Missing record from 990830 at 104500 to 990906 at 104500 due to battery failure. 31/01/00 - Missing record from 1000131 at 013000 to 1000215 at 114500 due to battery failure. 07/11/00 - Missing record from 1001107 at 91500 to 1001126 at 030000 due to memory overwrite on logger. 27/03/01 - Missing record from 1010327 234500 to 1010331 203000 due to logger failure. 20/06/01 - Missing record from 20010620 131500 to 20010623 173000 due to memory overwrite on logger. 15/02/02 - Missing record from 1020215 131500 to 1020216 090000 due to battery failure. 03/07/02 - Missing record from 1020703 123000 to 1020706 040000 due to memory overwrite on logger. 05/10/03 - Missing record from 20031005 240000 to 20031006 150000. Cause unknown. Assumed straight line recession. 1/12/03 - Missing record from 20031201 154500 to 20031205 120000 due to operator error. Power to logger likely to have been disrupted. 23/01/04 - Missing record from 20040123 141500 to 20040203 124500 due to operator error. Power to logger was disrupted. Logger was not reset. 17/03/04 - Missing record from 20040317 123000 to 20040323 064500. Logger downloaded late, causing data to be overwritten.
For additional information, please see recording authority.

Environment Bay of Plenty 275
Environment Bay of Plenty Hydrological Flow Summary
Date Complied July 2006 Site Number 14703 Compiled by G R Ellery River Pongakawa Station Old Coach Road Metric Map Reference V15: 185 462 Catchment Area (km2) 50 Period of Summary 1998 to 2005 Statistical Summary
Flow (l/s) Minimum Flow 3816 Maximum Flow 19202 Mean Annual Minimum Flow 4252 Mean Annual Maximum Flow 13125 Mean Flow 4679 Mean Summer Flow 4617 Median Flow 4617 Mean Autumn Flow 4758 Mean Specific Flow (/km2) 94 Mean Winter Flow 4711 Mean Spring Flow 4589 Low Flow Distribution Fit GEV Peak Flow Distribution Fit Gumbel 7 day Low Flow (Minimum) 3859 Peak Flow (5 yr Return) 16469 7 Day Low Flow (Mean Annual) 4345 Peak Flow (10 yr Return) 19202 7 day Low Flow (5 yr Return) 4126 Peak Flow (20 yr Return) 7 Day Low Flow (10 yr Return) 3930 Peak Flow (50 yr Return) Peak Flow (100 yr Return)
Annual Summaries Flow (l/s) Flow (l/s) Year
Minimum Mean Maximum Year
Minimum Mean Maximum 1980 1993 1981 1994 1982 1995 1983 1996 1984 1997 1985 1998 4291 4536 13170 1986 1999 4454 4736 7748 1987 2000 4378 4790 18797 1988 2001 4414 4967 19202 1989 2002 4479 4902 10383 1990 2003 4262 4668 11675 1991 2004 3816 4394 9483 1992 2005 3925 4443 14538
Flow Distribution Flow (l/s)
Percentiles 0 1 2 3 4 5 6 7 8 9 0 19202 5979 5437 5289 5226 5169 5130 5103 5072 5051 10 5033 5018 4999 4983 4962 4949 4934 4919 4907 4897 20 4887 4876 4865 4856 4849 4842 4833 4825 4818 4810 30 4801 4793 4784 4774 4764 4753 4740 4729 4718 4706 40 4696 4687 4679 4671 4661 4651 4644 4637 4630 4624 50 4617 4612 4604 4601 4594 4589 4585 4579 4574 4568 60 4563 4557 4551 4545 4541 4533 4526 4519 4510 4505 70 4497 4490 4485 4480 4474 4468 4464 4459 4453 4451 80 4445 4442 4437 4430 4423 4414 4405 4393 4379 4360 90 4340 4320 4295 4262 4213 4157 4120 4079 4028 3968 100 3816

276 Environmental Publication 2007/06
0
5000
10000
15000
20000
25000
1998 1999 2000 2001 2002 2003 2004 2005
Year
Flow
(l/s
)
Maximum Flow 5 per. Mov. Avg. (Maximum Flow )
3700
3800
3900
4000
4100
4200
4300
4400
4500
4600
1998 1999 2000 2001 2002 2003 2004 2005
Year
Flow
(l/s
)
Minimum Flow 5 per. Mov. Avg. (Minimum Flow )
4000
4200
4400
4600
4800
5000
5200
5400
1998 1999 2000 2001 2002 2003 2004 2005
Year
Flow
(l/s
)
Mean Autumn Flow 5 per. Mov. Avg. (Mean Autumn Flow )
4000
4200
4400
4600
4800
5000
5200
5400
1998 1999 2000 2001 2002 2003 2004 2005
Year
Flow
(l/s
)
Mean Winter Flow 5 per. Mov. Avg. (Mean Winter Flow )
4000
4200
4400
4600
4800
5000
5200
5400
1998 1999 2000 2001 2002 2003 2004 2005
Year
Flow
(l/s
)
Mean Spring Flow 5 per. Mov. Avg. (Mean Spring Flow )
4000
4200
4400
4600
4800
5000
5200
5400
1998 1999 2000 2001 2002 2003 2004 2005
Year
Flow
(l/s
)
Mean Summer Flow 5 per. Mov. Avg. (Mean Summer Flow )
Pongakawa at Old Coach Road
4300
4400
4500
4600
4700
4800
4900
5000
1998 1999 2000 2001 2002 2003 2004 2005
Year
Flow
(l/s
)
Mean Flow 5 per. Mov. Avg. (Mean Flow )

Environment Bay of Plenty 277
Environment Bay of Plenty River Flow Recording Station
River Tarawera Site Awakaponga Site Number 15302 Grid Reference V15: 412 559 Start of Record May 1948 Data Capture Rate 99% Data Summary From January 1949 To December 2005 Data Audited From July 1992 To December 2005 Equipment History 01/01/36: Staff gauge installed. 16/12/48: Kent chart recorder. 23/08/65: F&P digital recorder. 24/08/82: Backup Foxboro chart recorder. 15/06/92: Backup Foxboro removed. 01/07/92: Float with L&S digital recorder. 15/09/99: iQuest logger and Handar. 15/03/05: Sutron pressure transducer replaces Handar. Comments on Stage/Discharge Ratings Site has a natural control with the riverbed comprising sandy pumice. Ratings are available to convert Stage (mm) to Flow (l/s).
General Comments Site was operated by NIWA, Rotorua until 01/07/92. Use of draglines in the clearing of the river channel appears to have affected stage data for periods throughout the record. Drawn off by the Pulp and Paper mills causes frequent rises and falls in the stage record. Site is operated by Environment Bay of Plenty as part of its Natural Environment Regional Monitoring Network.
SITE LOCATION Tarawera at Awakaponga

278 Environmental Publication 2007/06
Station Comments Tarawera River at Awakaponga. Site Number 15302, on River Number 153000. The local recording authority is Environment Bay of Plenty. The site is situated 6.5 kilometres from the mouth. The control is by natural channel. The catchment area includes landlocked lakes: Rotomahana, Rerewhakaaitu, Okataina, Okareka, Tikitapu, and Rotokakahi totalling 243km2. The lower reaches of the Tarawera River where the water level recorder is located has a sandy pumice bed, which causes cross section changes on an hour by hour basis. The bed load travelling past the recorder site varies from two to four hundred tonnes per day. The changes in bed level have a direct effect on water levels at the site with the station never registering smooth recession curves. This combined with water extraction by the pulp and paper mills upstream causes the stage fluctuations that are apparent when the filed data has three millimetres or less compression applied. Dragline and earthquake effects are best seen in the variation due to major changes in water level slope through the reach. 28/05/48 - Data from 480528 to 541217 was obtained from weekly staff gauge readings. Some flood events over this period had an increased frequency of readings to establish peak heights and define hydrograph shapes. The staff gauge used for these readings was situated downstream of the present recorder location at the Railway Bridge. 01/01/73 - From 730101 the increased water draw off by the pulp and paper mills causes frequent large, rapid, rises and falls in the stage record. These fluctuations are responsible for a lag between some external and internal readings observed at the site. The rating change beginning 730723 at 150500 is due to a gradual increase in cross sectional area at the gauging site and is probably attributable to a reduction in sediment transport during a year which only produced 75% of the mean annual rainfall. This trend was reversed after a fresh in October, causing the rating curve to revert back to its previous position. 01/02/75 - Dragline operations observed in channel from February 1975, causing unusual shaped base flow recessions. 10/08/77 - Syphon intake installed on 770810 094500 to enable the recorder to operate below the invert level of the bottom intake. 02/03/87 - Data from 870302 133000 to 870303 133300 was filed from the Foxboro backup recorder as the digital recorder was badly affected by an earthquake. The order of the sequence of events between 134200 and 140300 is a guess only as they appear instantaneous on the Foxboro chart. 01/06/87 - Drag line clearing channel upstream and downstream of recorder from 870601 to 870721. This work appears to have affected the stage record from 870616. 03/02/88 - Dragline was observed clearing channel 880203 112400. This work appears to have affected the stage data from 880123. 29/04/92 - Missing record 920429 080000 to 920429 143000. 01/07/92 - Site handed over to Environment Bay of Plenty. Instrumentation L&S tape recorder with 1mm resolution, connected to an Aquitel Remote. 29/11/92 - Reduction in water level while Tasman pulp and paper mill shut effluent outfall gates for approximately 2 hours, while floating a boat stuck on an effluent pond bar. 15/12/94 - Missing record from 941215 231500 to 941216 084500 due to earthquake affecting recorder. 22/09/95 - Missing record from 950922 113000 to 950925 151500. 07/11/95 - Missing record from 951107 091600 to 951110 130000 due to float tape not being on pulleys. 24/11/96 - Data from 961124 0 to 961130 240000 shows the result of Tasman pulp and paper mill stopping their discharge into the river at Pipe Bridge. 15/11/ 97 - Missing record from 971115 124500 to 971117 130000. 15/03/2005 - Sutron Gas Purge system installed as replacement for Handar 436B encoder (primary stage recorder). Sensor has a resolution of +/-5mm and a recording interval of 15 minutes. Tower now sitting above normal water level.
For additional information, please see recording authority.

Environment Bay of Plenty 279
Environment Bay of Plenty Hydrological Flow Summary
Date Complied July 2006 Site Number 15302 Compiled by G R Ellery River Tarawera Station Awakaponga Metric Map Reference V15: 412 559 Catchment Area (km2) 906 Period of Summary 1949 to 2005 Statistical Summary
Flow (l/s) Minimum Flow 15186 Maximum Flow 92392 Mean Annual Minimum Flow 22824 Mean Annual Maximum Flow 54754 Mean Flow 30364 Mean Summer Flow 28664 Median Flow 29065 Mean Autumn Flow 28721 Mean Specific Flow (/km2) 34 Mean Winter Flow 32636 Mean Spring Flow 32361 Low Flow Distribution Fit GEV Peak Flow Distribution Fit Gumbel 7 day Low Flow (Minimum) 17079 Peak Flow (5 yr Return) 64000 7 Day Low Flow (Mean Annual) 22495 Peak Flow (10 yr Return) 72000 7 day Low Flow (5 yr Return) 20264 Peak Flow (20 yr Return) 79000 7 Day Low Flow (10 yr Return) 18938 Peak Flow (50 yr Return) 88000 Peak Flow (100 yr Return) 95000
Annual Summaries Flow (l/s) Flow (l/s) Year
Minimum Mean Maximum Year
Minimum Mean Maximum 1980 19727 25151 39111 1993 18614 22377 37221 1981 19472 26169 44205 1994 16478 21851 48445 1982 17899 24377 40218 1995 18107 28199 74188 1983 15669 23234 56265 1996 24023 30967 52184 1984 20155 24100 43496 1997 21550 27548 42957 1985 17752 28024 48989 1998 20389 29408 68882 1986 19116 27538 47410 1999 23241 30456 60018 1987 17985 23428 34225 2000 22740 28511 52685 1988 16936 22851 51708 2001 21597 29984 67521 1989 22908 31212 47289 2002 21922 27613 50335 1990 23094 28892 48101 2003 20521 25359 56501 1991 20691 25415 43023 2004 20821 29396 69919 1992 19185 24358 39691 2005 21783 28540 58739
Flow Distribution Flow (l/s)
Percentiles 0 1 2 3 4 5 6 7 8 9 0 92392 54801 50410 47993 46136 44575 43598 42559 41442 40507 10 39693 39016 38431 37913 37422 37013 36631 36245 35919 35621 20 35298 34948 34664 34363 34104 33858 33630 33389 33158 32958 30 32762 32549 32346 32129 31925 31734 31549 31353 31163 30975 40 30784 30595 30427 30255 30080 29890 29705 29518 29347 29206 50 29065 28909 28746 28602 28447 28310 28154 28012 27857 27710 60 27561 27414 27265 27117 26985 26841 26697 26543 26382 26229 70 26063 25902 25730 25564 25393 25229 25061 24885 24704 24530 80 24357 24183 23996 23803 23612 23422 23235 23045 22840 22620 90 22374 22121 21862 21591 21277 20895 20537 20040 19445 18605 100 15186

280 Environmental Publication 2007/06
0100002000030000400005000060000700008000090000
100000
1945 1955 1965 1975 1985 1995 2005
Year
Flow
(l/s
)
Maximum Flow 5 per. Mov. Avg. (Maximum Flow )
0
5000
10000
15000
20000
25000
30000
35000
1945 1955 1965 1975 1985 1995 2005
Year
Flow
(l/s
)
Minimum Flow 5 per. Mov. Avg. (Minimum Flow )
0
10000
20000
30000
40000
50000
60000
1945 1955 1965 1975 1985 1995 2005
Year
Flow
(l/s
)
Mean Flow 5 per. Mov. Avg. (Mean Flow )
0
10000
20000
30000
40000
50000
60000
1945 1955 1965 1975 1985 1995 2005
Year
Flow
(l/s
)
Mean Autumn Flow 5 per. Mov. Avg. (Mean Autumn Flow )
0
10000
20000
30000
40000
50000
60000
1945 1950 1955 1960 1965 1970 1975 1980 1985 1990 1995 2000 2005
Year
Flow
(l/s
)
Mean Winter Flow 5 per. Mov. Avg. (Mean Winter Flow )
0
10000
20000
30000
40000
50000
60000
1945 1955 1965 1975 1985 1995 2005
Year
Flow
(l/s
)
Mean Spring Flow 5 per. Mov. Avg. (Mean Spring Flow )
0
10000
20000
30000
40000
50000
60000
1945 1955 1965 1975 1985 1995 2005
Year
Flow
(l/s
)
Mean Summer Flow 5 per. Mov. Avg. (Mean Summer Flow )
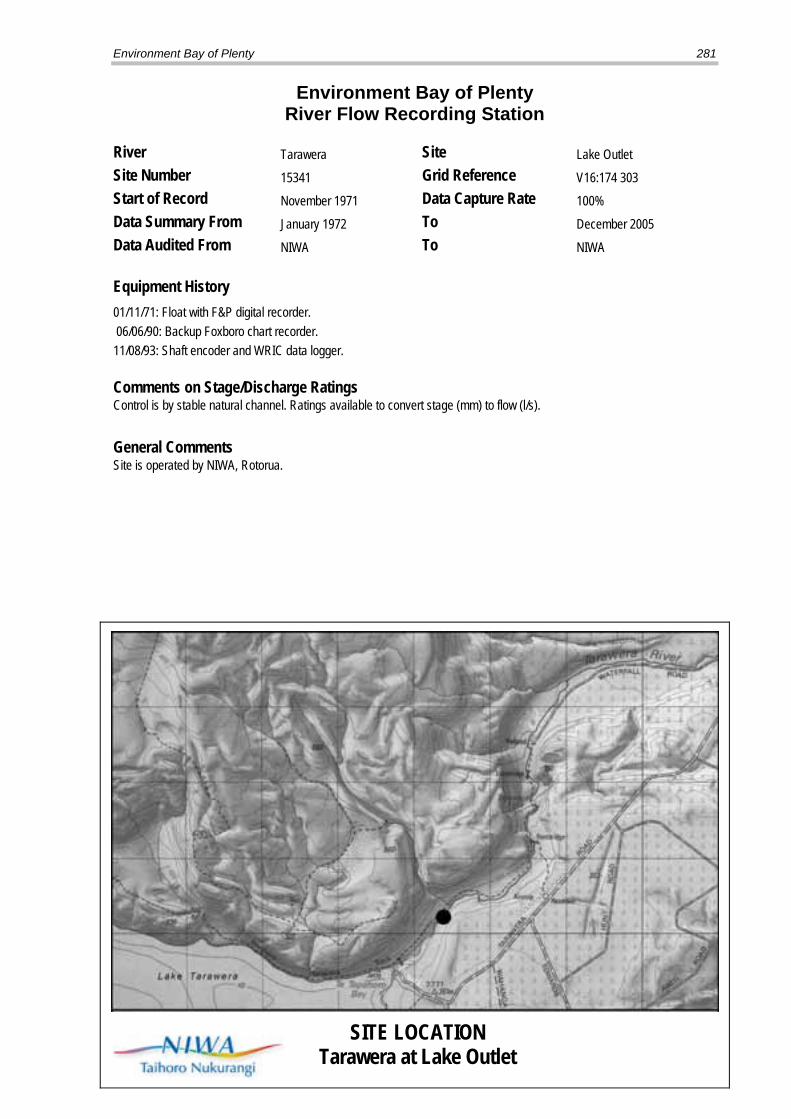
Environment Bay of Plenty 281
Environment Bay of Plenty River Flow Recording Station
River Tarawera Site Lake Outlet Site Number 15341 Grid Reference V16:174 303 Start of Record November 1971 Data Capture Rate 100% Data Summary From January 1972 To December 2005 Data Audited From NIWA To NIWA Equipment History
01/11/71: Float with F&P digital recorder. 06/06/90: Backup Foxboro chart recorder. 11/08/93: Shaft encoder and WRIC data logger. Comments on Stage/Discharge Ratings Control is by stable natural channel. Ratings available to convert stage (mm) to flow (l/s).
General Comments Site is operated by NIWA, Rotorua.
SITE LOCATION Tarawera at Lake Outlet

282 Environmental Publication 2007/06
Station Comments Tarawera River at Lake Outlet. Site Number 15341, on River Number 153000. The local recording authority is NIWA, Rotorua. Control is by natural channel. 31/12/95 - Periods of missing data have been filled with a synthetic record constructed by using a correlation with Lake Tarawera at Te Wairoa (15301).
For additional information, please see recording authority.

Environment Bay of Plenty 283
Environment Bay of Plenty Hydrological Flow Summary
Date Complied December 2006 Site Number 15341 Compiled by G R Ellery River Tarawera Station Lake Outlet Metric Map Reference V16: 174 303 Catchment Area (km2) 413 Period of Summary 1972 to 2005 Statistical Summary
Flow (l/s) Minimum Flow 3844 Maximum Flow 15678 Mean Annual Minimum Flow 4792 Mean Annual Maximum Flow 9748 Mean Flow 6700 Mean Summer Flow 6179 Median Flow 6546 Mean Autumn Flow 6084 Mean Specific Flow (/km2) 16 Mean Winter Flow 7070 Mean Spring Flow 7400 Low Flow Distribution Fit GEV Peak Flow Distribution Fit Gumbel 7 day Low Flow (Minimum) 4017 Peak Flow (5 yr Return) 10800 7 Day Low Flow (Mean Annual) 4686 Peak Flow (10 yr Return) 11700 7 day Low Flow (5 yr Return) 4387 Peak Flow (20 yr Return) 12500 7 Day Low Flow (10 yr Return) 4232 Peak Flow (50 yr Return) 13600 Peak Flow (100 yr Return)
Annual Summaries Flow (l/s) Flow (l/s) Year
Minimum Mean Maximum Year
Minimum Mean Maximum 1980 5002 6444 8303 1993 4073 5490 7832 1981 5108 6851 9518 1994 4073 6033 9722 1982 4534 6258 8492 1995 4231 6918 9932 1983 3844 5610 9575 1996 6081 7457 10125 1984 4578 5866 7613 1997 5319 7144 10009 1985 4709 6446 8755 1998 4495 7239 13163 1986 4733 6552 10125 1999 4765 7040 10828 1987 4495 5907 7363 2000 4660 6685 9007 1988 4225 6019 8475 2001 4739 6722 8988 1989 4095 7068 11133 2002 4792 6277 8325 1990 5023 6943 10893 2003 4254 5948 8381 1991 4545 6162 9118 2004 4360 6760 10125 1992 4129 6200 9025 2005 4470 6682 9381
Flow Distribution Flow (l/s)
Percentiles 0 1 2 3 4 5 6 7 8 9 0 15678 10116 9630 9373 9165 8984 8847 8730 8626 8528 10 8439 8361 8282 8210 8139 8070 8004 7940 7877 7815 20 7754 7692 7637 7583 7533 7488 7441 7395 7354 7311 30 7271 7228 7191 7157 7122 7084 7046 7009 6976 6945 40 6912 6877 6838 6798 6760 6721 6684 6648 6614 6580 50 6546 6512 6479 6446 6413 6381 6351 6321 6292 6263 60 6234 6206 6175 6148 6119 6091 6061 6030 6000 5969 70 5937 5905 5872 5842 5810 5776 5742 5705 5669 5633 80 5596 5556 5511 5467 5423 5380 5339 5294 5247 5204 90 5151 5100 5048 4983 4921 4852 4755 4649 4508 4346 100 3844

284 Environmental Publication 2007/06
2000
4000
6000
8000
10000
12000
14000
16000
18000
1970 1975 1980 1985 1990 1995 2000 2005
Year
Flow
(l/s
)
Maximum Flow 5 per. Mov. Avg. (Maximum Flow )
2000
3000
4000
5000
6000
7000
8000
1970 1975 1980 1985 1990 1995 2000 2005
Year
Flow
(l/s
)
Minimum Flow 5 per. Mov. Avg. (Minimum Flow )
2000
3000
4000
5000
6000
7000
8000
9000
10000
1970 1975 1980 1985 1990 1995 2000 2005
Year
Flow
(l/s
)
Mean Flow 5 per. Mov. Avg. (Mean Flow )
3000
4000
5000
6000
7000
8000
9000
10000
1985 1990 1995 2000 2005
Year
Flow
(l/s
)
Mean Autumn Flow 5 per. Mov. Avg. (Mean Autumn Flow )
3000
4000
5000
6000
7000
8000
9000
10000
1985 1990 1995 2000 2005
Year
Flow
(l/s
)
Mean Winter Flow 5 per. Mov. Avg. (Mean Winter Flow )
3000
4000
5000
6000
7000
8000
9000
10000
1985 1990 1995 2000 2005
Year
Flow
(l/s
)
Mean Spring Flow 5 per. Mov. Avg. (Mean Spring Flow )
3000
4000
5000
6000
7000
8000
9000
10000
1985 1990 1995 2000 2005
Year
Flow
(l/s
)
Mean Summer Flow 5 per. Mov. Avg. (Mean Summer Flow )
Tarawera at Lake Outlet

Environment Bay of Plenty 285
Environment Bay of Plenty River Flow Recording Station
River Rangitaiki Site Te Teko Site Number 15412 Grid Reference V15:435 448 Start of Record June 1948 Data Capture Rate 100% Data Summary From January 1949 To December 2005 Data Audited From NIWA To NIWA Equipment History
01/06/48: Staff gauge installed. 07/09/52: Kent chart recorder. 25/08/65: Float with F&P digital recorder. 08/03/88: Backup Foxboro chart recorder. Comments on Stage/Discharge Ratings Control is by natural channel. Ratings available to convert stage (mm) to flow (l/s).
General Comments Site is operated by NIWA, Rotorua. Record from June 1948 to October 1952 is from staff gauge at Edgecumbe Bridge, approximately 12 kilometres downstream. Water levels were affected by the filling of Lake Matahina in November 1966. Since then water levels have been affected by the dam operation. Flow recorded at Matahina Dam has been used as a backup.
SITE LOCATION Rangitaiki at Te Teko
286 Environmental Publication 2007/06
Station Comments Rangitaiki River at Te Teko. Site Number 15412, on River Number 154000. The local recording authority is NIWA, Rotorua. The site is situated 23 kilometres from the river mouth, and has a natural channel control. Sediment concentration is also measured at this site. 07/09/52 -Chart data was not filed until 521001. Charts have not been digitised so data filed are mainly one daily value. 24/11/66 -Stage values on 661125 and 661126 go below zero due to the filling of Lake Matahina. From now on water levels are affected by the Matahina Dam. 31/01/86 -Staff gauge zero lowered 1.0 metre. 02/03/87 -Stage record from 870302 133000 to 870302 160000 has been affected by an earthquake. The stage record has been filed as recorded although this may not produce true flows during the event. 04/03/88 - Missing record from 880304 123000 to 880308 121500 due to water level receding below bottom of intake pipe. Backup recorder installed to record water levels when stage drops below bottom intake. 31/05/88 -The unusual stage hydrograph during June and July 1988 was due to the Matahina Dam being refilled after maintenance work to the right bank abatement. 27/07/02 - Missing record from 27 July 2002 081500 to 29 July 2002 111500 due to vandals breaking into recorder house and smashing all recording equipment.
For additional information, please see recording authority.

Environment Bay of Plenty 287
Environment Bay of Plenty Hydrological Flow Summary
Date Complied December 2006 Site Number 15412 Compiled by G R Ellery River Rangitaiki Station Te Teko Metric Map Reference V15:435 448 Catchment Area (km2) 2893 Period of Summary 1949 to 2005
Statistical Summary Flow (l/s)
Minimum Flow 6200 Maximum Flow 769985 Mean Annual Minimum Flow 39176 Mean Annual Maximum Flow 260683 Mean Flow 70537 Mean Summer Flow 66010 Median Flow 61888 Mean Autumn Flow 59884 Mean Specific Flow (/km2) 24 Mean Winter Flow 84804 Mean Spring Flow 82052 Low Flow Distribution Fit GEV Peak Flow Distribution Fit Equally weighted TCEV, GEV &
GEV, Log Pearson III
7 day Low Flow (Minimum) 32563 Peak Flow (5 yr Return) 320000 7 Day Low Flow (Mean Annual) 41917 Peak Flow (10 yr Return) 410000 7 day Low Flow (5 yr Return) 38418 Peak Flow (20 yr Return) 505000 7 Day Low Flow (10 yr Return) 36339 Peak Flow (50 yr Return) 650000 Peak Flow (100 yr Return) 780000
Annual Summaries Flow (l/s) Flow (l/s) Year
Minimum Mean Maximum Year
Minimum Mean Maximum 1980 39638 68274 130903 1993 30378 49547 150866 1981 43212 74904 201712 1994 30134 63458 212771 1982 40926 59141 138947 1995 44563 84372 349119 1983 31800 60906 371180 1996 44773 80223 204713 1984 33814 60003 214429 1997 41833 63708 135306 1985 33302 63001 266043 1998 36892 75245 463810 1986 27568 72152 231431 1999 41195 68505 265245 1987 39238 56371 223114 2000 40238 58789 162335 1988 32826 61465 186769 2001 40288 66431 212780 1989 41982 77979 191557 2002 38685 62606 164865 1990 43087 72947 213252 2003 25596 56560 190192 1991 44762 65718 198288 2004 35694 84065 769985 1992 38387 63847 145804 2005 37880 64518 233677
Flow Distribution Flow (l/s)
Percentiles 0 1 2 3 4 5 6 7 8 9 0 769985 178903 152127 139800 132872 126449 121377 117330 113918 111026 10 108338 105603 103225 100983 98880 97042 95337 93659 92102 90656 20 89170 87743 86337 85068 83802 82588 81512 80379 79193 78166 30 77125 76150 75236 74366 73575 72800 72085 71337 70582 69793 40 69035 68278 67564 66875 66119 65411 64708 64047 63385 62689 50 62027 61404 60813 60230 59616 59053 58473 57904 57393 56861 60 56258 55710 55176 54621 54115 53543 52985 52472 51954 51427 70 50910 50430 50016 49608 49274 48956 48677 48427 48198 47953 80 47714 47444 47164 46871 46546 46225 45894 45507 45068 44616 90 44202 43617 43109 42561 41947 41197 40468 39639 38434 36107 100 6200

288 Environmental Publication 2007/06
0
100000
200000
300000
400000
500000
600000
700000
800000
900000
1945 1955 1965 1975 1985 1995 2005
Year
Flow
(l/s
)
Maximum Flow 5 per. Mov. Avg. (Maximum Flow )
0
10000
20000
30000
40000
50000
60000
1945 1955 1965 1975 1985 1995 2005
Year
Flow
(l/s
)
Minimum Flow 5 per. Mov. Avg. (Minimum Flow )
0
20000
40000
60000
80000
100000
120000
1945 1955 1965 1975 1985 1995 2005
Year
Flow
(l/s
)
Mean Flow 5 per. Mov. Avg. (Mean Flow )
0
20000
40000
60000
80000
100000
120000
1945 1955 1965 1975 1985 1995 2005
Year
Flow
(l/s
)
Mean Autmn Flow 5 per. Mov. Avg. (Mean Autmn Flow )
0
20000
40000
60000
80000
100000
120000
140000
160000
1945 1955 1965 1975 1985 1995 2005
Year
Flow
(l/s
)
Mean Winter Flow 5 per. Mov. Avg. (Mean Winter Flow )
0
20000
40000
60000
80000
100000
120000
140000
160000
1945 1955 1965 1975 1985 1995 2005
Year
Flow
(l/s
)
Mean Spring Flow 5 per. Mov. Avg. (Mean Spring Flow )
0
20000
40000
60000
80000
100000
120000
1945 1955 1965 1975 1985 1995 2005
Year
Flow
(l/s
)
Mean Summer Flow 5 per. Mov. Avg. (Mean Summer Flow )
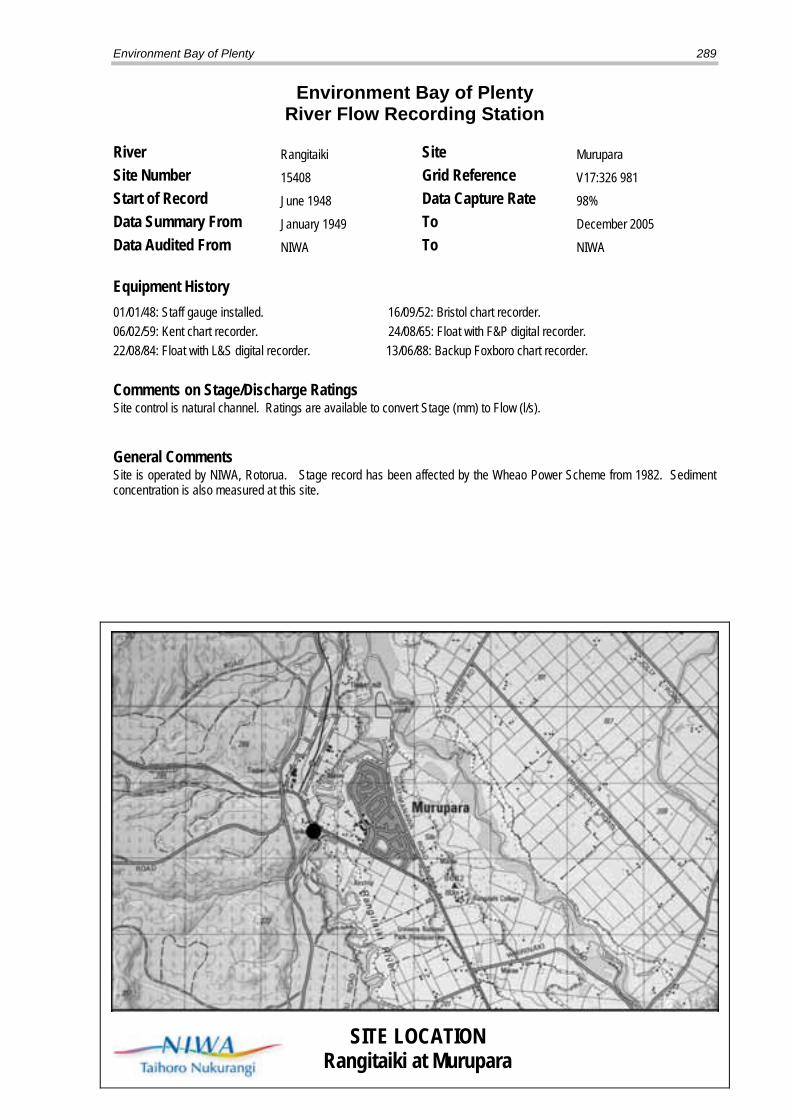
Environment Bay of Plenty 289
Environment Bay of Plenty River Flow Recording Station
River Rangitaiki Site Murupara Site Number 15408 Grid Reference V17:326 981 Start of Record June 1948 Data Capture Rate 98% Data Summary From January 1949 To December 2005 Data Audited From NIWA To NIWA Equipment History
01/01/48: Staff gauge installed. 16/09/52: Bristol chart recorder. 06/02/59: Kent chart recorder. 24/08/65: Float with F&P digital recorder. 22/08/84: Float with L&S digital recorder. 13/06/88: Backup Foxboro chart recorder. Comments on Stage/Discharge Ratings Site control is natural channel. Ratings are available to convert Stage (mm) to Flow (l/s).
General Comments Site is operated by NIWA, Rotorua. Stage record has been affected by the Wheao Power Scheme from 1982. Sediment concentration is also measured at this site.
SITE LOCATION Rangitaiki at Murupara

290 Environmental Publication 2007/06
Station Comments Rangitaiki River at Murupara. Site Number 15408, on River Number 154000. The local recording authority is NIWA, Rotorua. From April 1982 stage record is affected by the Wheao Power Scheme. Sediment concentration is also measured at the site. 01/01/48 Staff gauge installed 480101. Record from 480601 to 520915 is readings taken from daily staff gauge observations. Data for the period of daily readings is not completely reliable with the reader generally only reading the gauge to 0.1ft (30mm). 17/09/52 The stage record has been manually read from the Bristol charts at a rate of one point per day. From 520917 to 581215 during any period where the recorder has malfunctioned daily staff gauge readings have been filed. Record from 520917 to 650824 was checked against Whirinaki at Galatea (15410). This check showed only daily mean discharges should be used. The original charts are held by Works (Major Projects), Wellington, if any storm analysis is required. 01/10/70 - A lag between internal and external stage occurred from 701001 due to a bend in the intake pipe reducing its diameter and gravel deposition over the intakes caused by the change in channel alignment. The effect of gravel deposition is minimised by removing it from around the intakes half yearly or when required. 01/04/82 - Rapid stage fluctuations from April 1982 to December 1982 were caused by the Wheao power scheme construction and testing. 30/12/82 - Wheao power station head race collapse caused a very short sharp flood hydrograph on 821230. 14/12/83 - Wheao power scheme began influencing the stage record at Murupara after being rebuilt from December 1983. 31/12/95 -Periods of record may be replaced with synthetic data correlated from the following sites, Whirinaki at Galatea, (15410), Rangitaiki at Kopuriki (15413) and rainfall stations Minginui (Met B86671) and Waimihia (Met B6821).
For additional information, please see recording authority.

Environment Bay of Plenty 291
Environment Bay of Plenty Hydrological Flow Summary
Date Complied December 2006 Site Number 15408 Compiled by G R Ellery River Rangitaiki Station Murupara Metric Map Reference V17: 329 984 Catchment Area (km2) 1184 Period of Summary 1949 to 2005 Statistical Summary
Flow (l/s) Minimum Flow 7016 Maximum Flow 124339 Mean Annual Minimum Flow 13614 Mean Annual Maximum Flow 39459 Mean Flow 21446 Mean Summer Flow 22278 Median Flow 20608 Mean Autumn Flow 18719 Mean Specific Flow (/km2) 18 Mean Winter Flow 22305 Mean Spring Flow 24551 Low Flow Distribution Fit GEV Peak Flow Distribution Fit Pearson 7 day Low Flow (Minimum) 10722 Peak Flow (5 yr Return) 52000 7 Day Low Flow (Mean Annual) 14623 Peak Flow (10 yr Return) 62000 7 day Low Flow (5 yr Return) 12933 Peak Flow (20 yr Return) 73000 7 Day Low Flow (10 yr Return) 11930 Peak Flow (50 yr Return) 87000 Peak Flow (100 yr Return) 99000
Annual Summaries Flow (l/s) Flow (l/s) Year
Minimum Mean Maximum Year
Minimum Mean Maximum 1980 19966 24102 31672 1993 8270 17176 33161 1981 17743 24308 33280 1994 7016 19668 39577 1982 10451 19597 33143 1995 10155 25647 39498 1983 11436 16906 50552 1996 13261 25340 37110 1984 11303 18796 33282 1997 10793 19712 31143 1985 8358 15769 27122 1998 12104 22751 60317 1986 11382 20158 40615 1999 12991 20274 33286 1987 10761 17147 27791 2000 10601 16922 28168 1988 7197 19978 44761 2001 9581 17293 34649 1989 12489 24597 41882 2002 12788 19877 33782 1990 11493 22656 38133 2003 8075 16139 31985 1991 9903 20279 40481 2004 12952 27313 68260 1992 9525 20095 38397 2005 13912 18832 30685
Flow Distribution Flow (l/s)
Percentiles 0 1 2 3 4 5 6 7 8 9 0 124339 39518 36131 34495 33491 32736 32043 31467 30885 30311 10 29870 29346 28928 28524 28187 27811 27464 27162 26858 26592 20 26307 26052 25840 25568 25333 25123 24925 24723 24528 24343 30 24138 23932 23745 23580 23372 23185 23008 22817 22632 22438 40 22276 22109 21935 21731 21573 21413 21252 21060 20878 20734 50 20608 20460 20306 20104 19948 19764 19617 19418 19247 19129 60 18977 18855 18686 18523 18386 18230 18085 18005 17826 17658 70 17534 17383 17228 17036 16853 16717 16541 16364 16155 15976 80 15861 15727 15553 15365 15194 15123 14976 14767 14587 14380 90 14248 14071 13816 13590 13351 13052 12773 12547 12125 11728 100 7016
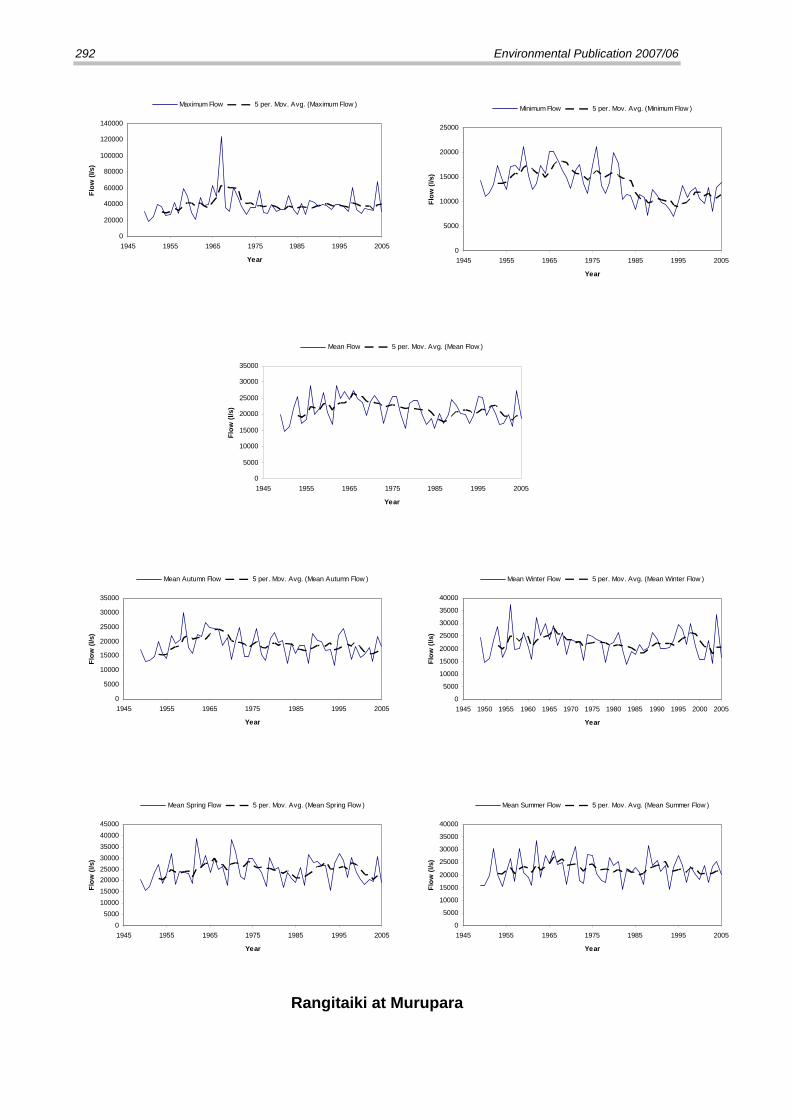
292 Environmental Publication 2007/06
0
20000
40000
60000
80000
100000
120000
140000
1945 1955 1965 1975 1985 1995 2005
Year
Flow
(l/s
)
Maximum Flow 5 per. Mov. Avg. (Maximum Flow )
0
5000
10000
15000
20000
25000
1945 1955 1965 1975 1985 1995 2005
Year
Flow
(l/s
)
Minimum Flow 5 per. Mov. Avg. (Minimum Flow )
0
5000
10000
15000
20000
25000
30000
35000
1945 1955 1965 1975 1985 1995 2005
Year
Flow
(l/s
)
Mean Autumn Flow 5 per. Mov. Avg. (Mean Autumn Flow )
0
5000
10000
15000
20000
25000
30000
35000
40000
1945 1950 1955 1960 1965 1970 1975 1980 1985 1990 1995 2000 2005
Year
Flow
(l/s
)
Mean Winter Flow 5 per. Mov. Avg. (Mean Winter Flow )
05000
1000015000200002500030000350004000045000
1945 1955 1965 1975 1985 1995 2005
Year
Flow
(l/s
)
Mean Spring Flow 5 per. Mov. Avg. (Mean Spring Flow )
0
5000
10000
15000
20000
25000
30000
35000
40000
1945 1955 1965 1975 1985 1995 2005
Year
Flow
(l/s
)
Mean Summer Flow 5 per. Mov. Avg. (Mean Summer Flow )
Rangitaiki at Murupara
0
5000
10000
15000
20000
25000
30000
35000
1945 1955 1965 1975 1985 1995 2005
Year
Flow
(l/s
)
Mean Flow 5 per. Mov. Avg. (Mean Flow )

Environment Bay of Plenty 293
Environment Bay of Plenty River Flow Recording Station
River Whirinaki Site Galatea Site Number 15410 Grid Reference V17:368 952 Start of Record December 1952 Data Capture Rate 96% Data Summary From January 1953 To December 2000 Data Audited From NIWA To NIWA Equipment History
03/12/52: Kent chart recorder 24/08/65: Float with F&P digital. 25/06/80: Backup Foxboro chart recorder 28/02/84: Float with L&S digital. 08/06/00: Sutron pressure sensor with Aquitel datalogger. Comments on Stage/Discharge Ratings Site control is natural channel. Ratings are available to convert Stage (mm) to Flow (l/s). General Comments Site is operated by NIWA, Rotorua. Sediment concentration is also measured at this site.
SITE LOCATION Whirinaki at Galatea
294 Environmental Publication 2007/06
Station Comments Whirinaki River at Galatea. Site Number 15410, on River Number 154000. The local recording authority is NIWA, Rotorua. Reduced Level lowered by 305mm on 670203. Sediment concentration is also measured at this site. 24/08/65 - Recorder installed on 650824 133000 is a F&P digital, recording at 3mm increments, and 15 minute time intervals. Intake pipe does not function properly from 650824 133000 to 651216 120000. Water levels may not be truly representative of river during this period. 26/02/73 - Recorder well, drained itself intermittently from 730226 to 730409. 04/03/76 - Fast drop in water level for brief periods between 760304 and 770302. This is due to downstream intake taking over from upstream intake. Bed slopes significantly between the two intakes, so that water level radically drops during this change of operation. Stage is corrected to the external upstream, but shape of recession has not been. 11/11/77 - Channel modified on 771111 through recorder and cableway sections to let water pass intakes uniformly, thereby eliminating fast drops in water levels. 28/02/84 - New recorder site established 500 metres upstream on 840228 154500. 27/02/85 - Due to removal of shingle from the control for channel alignment work by the Bay of Plenty Catchment Commission, an overall drop in water level of 20mm occurred between 850227 083000 and 850227 131500. 25/07/88 - During the flood of 25 and26 July 1988 the recorder structure sank 200mm. Rating curve 019 covers the change in reduced levels, with the recorder and staff gauges having a new Reduced Level, of 199.757 metres. 11/07/98 - Missing record from 980711 203000 to 980713 174500 due to the loss of the complete site and approximately 50 metres of river bank that the site was attached to during the flood at this time. 13/07/98 - Recorder replaced at the temporary site 980713 174500 by a Kainga Encoder with a range of 10 metres, a resolution of 1 mm, and a time interval of 15 minutes, connected directly to the Remote. Data is filed via telemetry. 08/06/2000 -Sutron sensor and yellow logger installed. Sutron set to mean over 10 seconds and the 0 - 5 volts output set to 0 - 5 metres. 13/12/2003 - Missing record from 13 December 2003 53000 to 15 December 2003 141500. The site had a lightening strike which disabled all instrumentation.
For additional information, please see recording authority.

Environment Bay of Plenty 295
Environment Bay of Plenty Hydrological Flow Summary
Date Complied December 2005 Site Number 15410 Compiled by G R Ellery River Whirinaki Station Galatea Metric Map Reference V17: 368 952 Catchment Area (km2) 534 Period of Summary 1953 to 2005 Statistical Summary
Flow (l/s) Minimum Flow 2588 Maximum Flow 386881 Mean Annual Minimum Flow 4780 Mean Annual Maximum Flow 114561 Mean Flow 14858 Mean Summer Flow 12515 Median Flow 11766 Mean Autumn Flow 10185 Mean Specific Flow (/km2) 28 Mean Winter Flow 19435 Mean Spring Flow 17363 Low Flow Distribution Fit GEV Peak Flow Distribution Fit EV1 7 day Low Flow (Minimum) 2896 Peak Flow (5 yr Return) 165000 7 Day Low Flow (Mean Annual) 4780 Peak Flow (10 yr Return) 215000 7 day Low Flow (5 yr Return) 4108 Peak Flow (20 yr Return) 265000 7 Day Low Flow (10 yr Return) 3706 Peak Flow (50 yr Return) 330000 Peak Flow (100 yr Return) 380000
Annual Summaries Flow (l/s) Flow (l/s) Year
Minimum Mean Maximum Year
Minimum Mean Maximum 1980 6661 15105 54513 1993 4061 9358 72666 1981 5992 15873 48892 1994 3830 16188 98984 1982 5332 9987 60069 1995 5658 18439 127616 1983 3249 12538 157618 1996 7308 17129 78372 1984 4933 12656 83433 1997 5404 13634 108755 1985 4708 12898 107110 1998 4182 16926 233311 1986 5466 16309 175737 1999 4008 13650 120777 1987 4577 10937 73875 2000 3384 11417 69345 1988 3989 16279 158611 2001 5048 15643 86638 1989 5264 17389 83847 2002 4578 14057 74100 1990 5222 17024 79882 2003 3384 13371 97723 1991 5273 13210 115123 2004 4934 22054 386881 1992 4767 14617 67765 2005 4620 13245 72829
Flow Distribution Flow (l/s)
Percentiles 0 1 2 3 4 5 6 7 8 9 0 386881 57165 46342 40712 37029 34329 32368 30747 29373 28230 10 27223 26253 25366 24525 23821 23146 22514 21944 21401 20855 20 20351 19855 19390 18937 18507 18117 17746 17408 17068 16724 30 16402 16105 15820 15575 15314 15040 14790 14549 14304 14070 40 13856 13633 13409 13192 12968 12750 12534 12329 12137 11959 50 11766 11569 11380 11189 11004 10825 10669 10495 10330 10157 60 9986 9803 9634 9456 9288 9144 8993 8853 8700 8548 70 8389 8244 8101 7951 7803 7665 7549 7431 7300 7168 80 7028 6895 6754 6614 6484 6372 6256 6141 6013 5881 90 5732 5580 5435 5335 5177 4985 4767 4526 4273 3926 100 2588

296 Environmental Publication 2007/06
0
50000
100000
150000
200000
250000
300000
350000
400000
450000
1950 1960 1970 1980 1990 2000
Year
Flow
(l/s
)
Maximum Flow 5 per. Mov. Avg. (Maximum Flow )
0
1000
2000
3000
4000
5000
6000
7000
8000
1950 1960 1970 1980 1990 2000
Year
Flow
(l/s
)
Minimum Flow 5 per. Mov. Avg. (Minimum Flow )
0
5000
10000
15000
20000
25000
1950 1960 1970 1980 1990 2000
Year
Flow
(l/s
)
Mean Autumn Flow 5 per. Mov. Avg. (Mean Autumn Flow )
05000
1000015000200002500030000350004000045000
1950 1955 1960 1965 1970 1975 1980 1985 1990 1995 2000 2005
Year
Flow
(l/s
)
Mean Winter Flow 5 per. Mov. Avg. (Mean Winter Flow )
0
5000
10000
15000
20000
25000
30000
35000
40000
1950 1960 1970 1980 1990 2000
Year
Flow
(l/s
)
Mean Spring Flow 5 per. Mov. Avg. (Mean Spring Flow )
0
5000
10000
15000
20000
25000
1950 1960 1970 1980 1990 2000
Year
Flow
(l/s
)
Mean Summer Flow 5 per. Mov. Avg. (Mean Summer Flow )
Whirinaki at Galatea
0
5000
10000
15000
20000
25000
1950 1960 1970 1980 1990 2000
Year
Flow
(l/s
)
Mean Flow 5 per. Mov. Avg. (Mean Flow )

Environment Bay of Plenty 297
Environment Bay of Plenty River Flow Recording Station
River Whakatane Site Whakatane Site Number 15514 Grid Reference W15:609 475 Start of Record July 1956 Data Capture Rate 100% Data Summary From January 1957 To December 2005 Data Audited From NIWA To NIWA Equipment History
31/07/56: Kent chart recorder 30/10/75: Float with F&P digital recorder. 23/07/87: Float with F&P digital and Aquitel Remote 06/01/94: Float with Encoder and Aquitel Remote. Comments on Stage/Discharge Ratings Site control is by natural sand-gravel bed that may be susceptible to bed level changes. Ratings are available to convert to Stage (mm) to Flow (l/s).
General Comments Site is operated by NIWA, Rotorua. Site is influenced by tidal effect that is apparent up to mean flow during spring tide events. Suspended sediment is also measured at this site.
SITE LOCATION Whakatane at Whakatane

298 Environmental Publication 2007/06
Station Comments Whakatane River at Whakatane. Site Number 15514, on River Number 155000. The local recording authority is NIWA, Rotorua. The site is situated 13.5 kilometres from the mouth and control is by downstream riffle. The natural river character has undergone major changes since the stations construction. Major flood protection works in the form of 10 year and 100 year return period stop banking, upstream and downstream channel diversion and straightening, and rip rap emplacement on the right bank adjacent to the recorder tower were undertaken from the mid 1960's. Large-scale gravel and sand abstraction has also occurred from the 1940's and is continuing today. The station is situated on the outside bank of a meander bend crest. The channel bed material is mixed sand-gravel and therefore the channel is susceptible to bed-level changes. Rating changes may also occur due to localised bank erosion and control modification due to floods or gravel extraction activities. The site is also influenced by a tidal effect, which is apparent up to mean flow during spring tide events. The effect tends to exaggerate river flows when the tidal peak elevates river levels. Suspended sediment concentration is also measured at this site. Data from 560731 150000 to 610119 240000 was reprocessed and archived at 960101. The original processing is archived on the miscellaneous file under site number 2215. A surge in the recorder tower and a small time lag between river and recorder tower levels occurs at periods of high stage. 31/12/60 -Many of the flood peaks from 1961 to 1975 recorded on Kent charts were verified by actual event observations and/or from floodmarks on the recorder tower. 27/05/83 -New gauging cableway commissioned on 830527 100000. 26/10/83 -Ten year stopbank overtopped approximately 2 kilometres upstream of recorder. 23/07/87 -Aquitel telemetry installed on 870723 140000 as additional backup recorder and for flood warning. Unless otherwise stated, from this date onwards backup data is obtained from the Aquitel remote unless that too is unavailable or erroneous. Periods where telemetered data is filed are not commented. 31/12/00 -Missing record from the principle recorder occurs throughout this data set. Backup chart records and telemetry data has been used where available. 02/05/2003 - Missing record from 2 May 2003 34501 to 5 May 2003 132959 due to a failure of the main recorder. The backup recorder also failed during this period.
For additional information, please see recording authority.

Environment Bay of Plenty 299
Environment Bay of Plenty Hydrological Flow Summary
Date Complied December 2006 Site Number 15514 Compiled by G R Ellery River Whakatane Station Whakatane Metric Map Reference W15: 609 475 Catchment Area (km2) 1557 Period of Summary 1957 to 2005 Statistical Summary
Flow (l/s) Minimum Flow 5758 Maximum Flow 2900990 Mean Annual Minimum Flow 10057 Mean Annual Maximum Flow 907869 Mean Flow 57274 Mean Summer Flow 43625 Median Flow 36176 Mean Autumn Flow 42013 Mean Specific Flow (/km2) 34 Mean Winter Flow 78456 Mean Spring Flow 65099 Low Flow Distribution Fit GEV Peak Flow Distribution Fit EV1 by Jenkins method
7 day Low Flow (Minimum) 6390 Peak Flow (5 yr Return) 1190000 7 Day Low Flow (Mean Annual) 10583 Peak Flow (10 yr Return) 1580000 7 day Low Flow (5 yr Return) 8760 Peak Flow (20 yr Return) 1960000 7 Day Low Flow (10 yr Return) 7654 Peak Flow (50 yr Return) 2450000 Peak Flow (100 yr Return) 2820000
Annual Summaries Flow (l/s) Flow (l/s) Year
Minimum Mean Maximum Year
Minimum Mean Maximum 1980 12832 48170 513564 1993 9206 31997 527026 1981 12619 64156 514677 1994 11433 57867 884174 1982 11026 38872 394890 1995 9157 75049 983283 1983 5787 62231 1155360 1996 14832 63734 711637 1984 17072 49383 837938 1997 10386 47773 798431 1985 11956 60485 805619 1998 6937 74778 2242940 1986 11909 62845 584823 1999 8491 59799 1260860 1987 11233 48705 826519 2000 9120 42490 429552 1988 9943 53433 887034 2001 11859 66828 920073 1989 10847 71811 713024 2002 10411 42778 555732 1990 12264 63192 826812 2003 7329 54564 819671 1991 10158 53811 869865 2004 11345 79792 2900990 1992 12146 54969 578940 2005 8798 46158 732145
Flow Distribution Flow (l/s)
Percentiles 0 1 2 3 4 5 6 7 8 9 0 2900990 369062 261210 212353 183980 163514 148400 136924 127919 120465 10 113559 107985 102786 98212 93962 90080 86452 83185 80034 77259 20 74610 72311 70128 68094 66126 64272 62494 60847 59341 57811 30 56452 55124 53862 52584 51347 50168 49069 48006 46895 45868 40 44830 43834 42839 41899 41012 40132 39288 38493 37717 36948 50 36176 35432 34704 34009 33336 32680 32023 31340 30708 30098 60 29491 28891 28339 27778 27202 26642 26105 25563 25018 24484 70 23958 23437 22904 22397 21911 21441 20998 20521 20041 19568 80 19096 18624 18141 17673 17216 16757 16302 15868 15416 14962 90 14486 13963 13441 12923 12391 11766 11126 10447 9634 8592 100 5758

300 Environmental Publication 2007/06
0
500000
1000000
1500000
2000000
2500000
3000000
3500000
1955 1965 1975 1985 1995 2005
Year
Flow
(l/s
)
Maximum Flow 5 per. Mov. Avg. (Maximum Flow )
0
2000
4000
6000
8000
10000
12000
14000
16000
18000
1955 1965 1975 1985 1995 2005
Year
Flow
(l/s
)
Minimum Flow 5 per. Mov. Avg. (Minimum Flow )
0
20000
40000
60000
80000
100000
120000
140000
1955 1965 1975 1985 1995 2005
Year
Flow
(l/s
)
Mean Autumn Flow 5 per. Mov. Avg. (Mean Autumn Flow )
020000400006000080000
100000120000140000160000180000200000
1955 1960 1965 1970 1975 1980 1985 1990 1995 2000 2005
Year
Flow
(l/s
)
Mean Winter Flow 5 per. Mov. Avg. (Mean Winter Flow )
0
20000
40000
60000
80000
100000
120000
140000
160000
1955 1965 1975 1985 1995 2005
Year
Flow
(l/s
)
Mean Spring Flow 5 per. Mov. Avg. (Mean Spring Flow )
0
20000
40000
60000
80000
100000
120000
1955 1965 1975 1985 1995 2005
Year
Flow
(l/s
)
Mean Summer Flow 5 per. Mov. Avg. (Mean Summer Flow )
Whakatane at Whakatane
0
20000
40000
60000
80000
100000
120000
1955 1965 1975 1985 1995 2005
Year
Flow
(l/s
)
Mean Flow 5 per. Mov. Avg. (Mean Flow )

Environment Bay of Plenty 301
Environment Bay of Plenty River Flow Recording Station
River Waimana Site Gorge Site Number 15511 Grid Reference W16: 366 644 Start of Record October 1950 Data Capture Rate 98% Data Summary From January 1951 To December 1980 Data Audited From To Equipment History
01/10/50: Staff gauge and chart recorder 29/08/69: Float with F&P digital recorder. 12/06/79: Float with L&S digital recorder 19/07/99: Float with Aquitel Remote. Comments on Stage/Discharge Ratings Site has a natural gravel control. Ratings cease on 27 November 1980. Ratings are available to convert Stage (mm) to Flow (l/s). General Comments This site recorded flow from October 1950 to November 1980 for the Hamilton Hydrological Survey. Site was handed over to B.O.P.C.C. on 03/01/81 and now operates for flood monitoring purposes.. Site is now operated by Environment Bay of Plenty as part of its Natural Environmental Monitoring Network.
SITE LOCATION Waimana at Gorge

302 Environmental Publication 2007/06
Station Comments Waimana River at Waimana Gorge. Site Number 15511, on River Number 155090. The local recording authority is Environment B·O·P. The site is situated 29.5 kilometres from mouth. The control is a natural gravel riverbed. 01/10/50 Stage/time data for the period 501001 to 660121 has been hand tabulated from the water level charts by Power Division staff at Head Office. In general not enough points have been taken off the charts to accurately define the shape of some hydrographs. Flood peaks have been tabulated but filed at times to suit the tabulation interval being used. Although there are some variations, tabulation intervals are: 501001 to 560101 3 hourly values 560101 to 610709 12 hourly values 610709 to 660121 6 hourly values With some 2 and 3 hourly values for these periods and in extreme cases, some daily mean discharges are 38% higher than they should be. In general the daily mean discharge are in error between +/-3%. 27/11/80 - Site changed from rated site to non-rated site on 801127. 26/11/80 - Fictitious rating for stage height only. For details see Environment B·O·P. 02/01/81 -Site handed over to B.O.P.C.C. on 810103. 19/07/91 - Aquitel logger installed for telemetered flood warning purposes.
31/12/95 - Periods of missing record and synthetic data occur throughout the data record. Some periods of missing record have been filled with synthetic data based on comparisons with some or all of the following sites. Meteorological gauges; Ruatoki (B87101), Matahi (B887212), Waimana (B87103), Ogilvie Bridge (873103), and water levels Whakatane at Whakatane (15514) and Waimana at Ogilvie Bridge (15536).

Environment Bay of Plenty 303
Environment Bay of Plenty Hydrological Flow Summary
Date Complied July 2006 Site Number 15511 Compiled by G R Ellery River Waimana Station Gorge Metric Map Reference W16: 642 375 Catchment Area (km2) 440 Period of Summary 1951 to 1979 Statistical Summary
Flow (l/s) Minimum Flow 1511 Maximum Flow 1112050 Mean Annual Minimum Flow 3580 Mean Annual Maximum Flow 373369 Mean Flow 19703 Mean Summer Flow 14172 Median Flow 12531 Mean Autumn Flow 17292 Mean Specific Flow (/km2) 45 Mean Winter Flow 26412 Mean Spring Flow 20874 Low Flow Distribution Fit GEV Peak Flow Distribution Fit GEV 7 day Low Flow (Minimum) 1822 Peak Flow (5 yr Return) 520000 7 Day Low Flow (Mean Annual) 3161 Peak Flow (10 yr Return) 670000 7 day Low Flow (5 yr Return) 2538 Peak Flow (20 yr Return) 820000 7 Day Low Flow (10 yr Return) 2238 Peak Flow (50 yr Return) 1050000 Peak Flow (100 yr Return) 1240000
Annual Summaries Flow (l/s) Flow (l/s) Year
Minimum Mean Maximum Year
Minimum Mean Maximum 1954 1838 12253 242267 1967 6457 22280 765130 1955 2797 18312 104550 1968 2868 16848 449216 1956 3078 22821 274431 1969 2773 15528 288074 1957 3897 11594 259062 1970 2968 28787 771690 1958 1511 26199 561022 1971 3701 24205 395893 1959 9511 22213 186751 1972 3018 13122 385831 1960 7917 26206 283812 1973 2933 10844 146662 1961 4606 14026 134141 1974 2688 19502 294009 1962 5393 34934 370273 1975 2168 17802 327458 1963 2555 19977 233043 1976 4567 22077 449891 1964 3590 26154 1112050 1977 2768 11560 185643 1965 3397 23286 677408 1978 2044 14796 401346 1966 3692 23505 398723 1979 3849 26532 504973
Flow Distribution Flow (l/s)
Percentiles 0 1 2 3 4 5 6 7 8 9 0 1112050 126608 89513 73273 63886 56936 51741 47666 44381 41472 10 38993 36856 35030 33420 32006 30791 29579 28457 27474 26673 20 25860 25108 24422 23797 23172 22552 21915 21302 20721 20141 30 19653 19224 18752 18281 17883 17434 17050 16698 16313 15919 40 15549 15229 14887 14552 14241 14000 13685 13367 13065 12819 50 12531 12243 11985 11725 11466 11198 10956 10726 10531 10332 60 10115 9904 9678 9468 9259 9031 8800 8601 8409 8199 70 7989 7774 7557 7369 7149 6921 6704 6532 6340 6151 80 5965 5804 5629 5452 5277 5090 4917 4727 4545 4348 90 4190 4054 3894 3729 3577 3422 3275 3123 2958 2535 100 1511

304 Environmental Publication 2007/06
Waimana at Gorge
0
200000
400000
600000
800000
1000000
1200000
1950 1955 1960 1965 1970 1975 1980
Year
Flow
(l/s
)
Maximum Flow 5 per. Mov. Avg. (Maximum Flow )
0
1000
2000
3000
4000
5000
6000
7000
8000
9000
10000
1950 1955 1960 1965 1970 1975 1980
Year
Flow
(l/s
)
Minimum Flow 5 per. Mov. Avg. (Minimum Flow )
0
5000
10000
15000
20000
25000
30000
35000
40000
1950 1955 1960 1965 1970 1975 1980
Year
Flow
(l/s
)
Mean Flow 5 per. Mov. Avg. (Mean Flow )
05000
1000015000200002500030000350004000045000
1950 1955 1960 1965 1970 1975 1980
Year
Flow
(l/s
)
Mean Autumn Flow 5 per. Mov. Avg. (Mean Autumn Flow )
0
10000
20000
30000
40000
50000
60000
1950 1955 1960 1965 1970 1975 1980
Year
Flow
(l/s
)
Mean Winter Flow 5 per. Mov. Avg. (Mean Winter Flow )
0
10000
20000
30000
40000
50000
60000
1950 1955 1960 1965 1970 1975 1980
Year
Flow
(l/s
)
Mean Spring Flow 5 per. Mov. Avg. (Mean Spring Flow )
05000
1000015000200002500030000350004000045000
1950 1955 1960 1965 1970 1975 1980
Year
Flow
(l/s
)
Mean Summer Flow 5 per. Mov. Avg. (Mean Summer Flow )

Environment Bay of Plenty 305
Environment Bay of Plenty River Flow Recording Station
River Waimana Site Ranger Station Site Number 15544 Grid Reference W16:642 375 Start of Record February 1995 Data Capture Rate 100% Data Summary From January 1996 To December 2005 Data Audited From February 1995 To December 2005 Equipment History
20/02/95: Kainga WRIC and Kainga encoder installed. 11/04/96: Kainga WRIC datalogger as backup. 02/09/99: DS-4483 logger installed with Sutron pressure sensor, with a CR500 and Kainga P.T. for backup. Comments on Stage/Discharge Ratings Site control is by a bedrock structure located across the channel 10 metres downstream of site. Ratings are available to convert Stage (mm) to Flow (l/s).
General Comments Site installed 950209 by Environment Bay of Plenty. Site is operated for flood monitoring purposes and is also part of the Natural Environment Regional Monitoring Network. Flood frequency data derived from combined Waimana at Olgilvie Bridge (site number 15536) and Waimana at Ranger station dataset.
SITE LOCATION Waimana at Ranger Station

306 Environmental Publication 2007/06
Station Comments Waimana River at Ranger Station. Site Number 15544, on River Number 155090. The site is situated 40.25 kilometres from the confluence with the Whakatane River and 62 kilometres from the mouth of the Whakatane River. NZMS 260 Reference W16:696 153. Drains 216 km2. The control is by a bedrock structure located across the channel 10 metres downstream of the site. 09/02/95 - Six steel cylinders bolted together with an aluminium recorder house. 20/02/95 - Kainga WRIC and Kainga shaft encoder installed. 11/04/96 - L&S recorder installed. Kainga WRIC data is used as backup. 02/07/98 - Missing record from 980702 64500 to 980707 123000 due to site being destroyed during flood event. Maximum water levels were pegged from floodmarks (on 3/7/98) with a level of 7.65 metres measured. 02/07/98 - Slope area gauging calculation (Gauging number 62) resulted in a discharge of 913.6 cumecs. Mean area was 245.724m2. A Mannings n of 0.035 was used in the calculation. This event raised the level of the bed by approximately 600mm. This addition of bed material completely buried the bedrock control. Removal of the bed material over time could result in a migration of the rating curves back to historical positions until the control takes effect again. 25/01/99 - Missing record from 990125 50000 to 990127 124500 due to new site installation. No rainfall was recorded at surrounding raingauges, a straight line recession was implemented. New equipment includes a Sutron Gas Bubbler P.T. (0-15 metre range). A Kainga PT 0-10 metre range. Logging is done via a CR500. 02/09/99 - DS-4483 logger installed with Sutron P.T. connected to it as the main recording instrument. CR500 with Kainga P.T. provides backup record. 29/09/03 - Missing record from 20030929 at 160000 to 20031002 at 134500 due to programme fault in logger. 26mm of rainfall fell over this period.
For additional information, please see recording authority.

Environment Bay of Plenty 307
Environment Bay of Plenty Hydrological Flow Summary
Date Complied July 2006 Site Number 15544 Compiled by G R Ellery River Waimana Station Ranger Station Metric Map Reference W16:642 375 Catchment Area (km2) 216 Period of Summary 1996 to 2005 Statistical Summary
Flow (l/s) Minimum Flow 1104 Maximum Flow 582848 Mean Annual Minimum Flow 1542 Mean Annual Maximum Flow 282295 Mean Flow 8816 Mean Summer Flow 6905 Median Flow 5427 Mean Autumn Flow 6386 Mean Specific Flow (/km2) 41 Mean Winter Flow 13026 Mean Spring Flow 10131 Low Flow Distribution Fit GEV Peak Flow Distribution Fit Gumbel GEV 7 day Low Flow (Minimum) 1231 Peak Flow (5 yr Return) 297000 279000 7 Day Low Flow (Mean Annual) 1423 Peak Flow (10 yr Return) 368000 361000 7 day Low Flow (5 yr Return) 1293 Peak Flow (20 yr Return) 435000 455000 7 Day Low Flow (10 yr Return) 1238 Peak Flow (50 yr Return) 522000 600000 Peak Flow (100 yr Return)
Annual Summaries Flow (l/s) Flow (l/s) Year
Minimum Mean Maximum Year
Minimum Mean Maximum 1980 1993 1981 1994 1982 1995 1983 1996 2809 9692 144453 1984 1997 1935 7512 244381 1985 1998 1517 11103 928862 1986 1999 1104 10075 330354 1987 2000 1649 6688 113726 1988 2001 1423 9620 293415 1989 2002 1110 6596 105058 1990 2003 1124 9364 178022 1991 2004 1516 11237 385656 1992 2005 1233 6304 99025
Flow Distribution Flow (l/s)
Percentiles 0 1 2 3 4 5 6 7 8 9 0 582848 60614 42158 34111 29468 25741 23132 21097 19445 18030 10 16901 15905 15011 14202 13479 12860 12294 11765 11314 10911 20 10516 10181 9871 9587 9318 9070 8835 8627 8424 8218 30 8034 7873 7715 7543 7384 7236 7097 6965 6839 6712 40 6583 6450 6318 6196 6076 5956 5844 5733 5623 5522 50 5427 5332 5225 5123 5024 4930 4838 4743 4650 4564 60 4480 4396 4317 4240 4163 4085 4015 3946 3879 3813 70 3745 3674 3608 3534 3456 3380 3299 3224 3138 3059 80 2975 2889 2808 2727 2645 2563 2492 2421 2330 2215 90 2118 2024 1929 1838 1761 1695 1601 1502 1411 1311 100 1104

308 Environmental Publication 2007/06
0100000200000300000400000500000600000700000800000900000
1000000
1995 1997 1999 2001 2003 2005
Year
Flow
(l/s
)
Maximum Flow 5 per. Mov. Avg. (Maximum Flow )
0
500
1000
1500
2000
2500
3000
3500
4000
4500
5000
1995 1997 1999 2001 2003 2005
Year
Flow
(l/s
)
Minimum Flow 5 per. Mov. Avg. (Minimum Flow )
0
2000
4000
6000
8000
10000
12000
14000
16000
1995 1997 1999 2001 2003 2005
Year
Flow
(l/s
)
Mean Autumn Flow 5 per. Mov. Avg. (Mean Autumn Flow )
500070009000
1100013000150001700019000210002300025000
1995 1997 1999 2001 2003 2005
Year
Flow
(l/s
)
Mean Winter Flow 5 per. Mov. Avg. (Mean Winter Flow )
02000400060008000
100001200014000160001800020000
1995 1997 1999 2001 2003 2005
Year
Flow
(l/s
)
Mean Spring Flow 5 per. Mov. Avg. (Mean Spring Flow )
0
2000
4000
6000
8000
10000
12000
14000
16000
1995 1997 1999 2001 2003 2005
Year
Flow
(l/s
)
Mean Summer Flow 5 per. Mov. Avg. (Mean Summer Flow )
Waimana at Ranger Station
20003000400050006000700080009000
100001100012000
1995 1997 1999 2001 2003 2005
Year
Flow
(l/s
)
Mean Flow 5 per. Mov. Avg. (Mean Flow )

Environment Bay of Plenty 309
Environment Bay of Plenty River Flow Recording Station
River Waimana Site Olgilvie Bridge Site Number 15536 Grid Reference W16: 704 128 Start of Record February 1968 Data Capture Rate 99% Data Summary From January 1969 To December 1996 Data Audited From January 1969 To December 1995 Equipment History
14/02/68: Float with F&P digital recorder. 08/08/73: Backup Foxboro chart recorder. 03/03/94: Float with L&S digital recorder. Comments on Stage/Discharge Ratings Site control is by a shingle bar. The bar is unstable and moves easily in floods. Because of this some scatter of gaugings about the rating curves is unavoidable. Ratings are available to convert Stage (mm) to Flow (l/s).
General Comments Site was operated by NIWA, Rotorua. Site handed over to Environment Bay of Plenty in March 1994 and is was operated as part of the Natural Environment Regional Monitoring Network. Site replaced by Wamana at Ranger Station, site number 15544. Flood frequency data derived from combined Waimana at Olgilvie Bridge and Waimana at Ranger Station (site number 15544) dataset.
SITE LOCATION Waimana at Ogilvie Bridge

310 Environmental Publication 2007/06
Station Comments Waimana River at Ogilvie Bridge. Site Number 15536, on River Number 155090. The local recording authority is Environment Bay of Plenty. The site is situated 42.75 kilometres from the confluence with the Whakatane River and 64.5 kilometres from the mouth of the Whakatane River. Sediment concentration is also measured at this site. 14/02/68 - An unusual steepening in recessions will sometimes be seen in the stage data between approximately 1700mm and 1900mm. This is a site characteristic occurring only at low stage and caused by the stilling well picking up the water level down stream of the well. 29/06/68 - Missing record 680629 181501 to 680705 221500 due to recorder malfunction. During the flood of 680629 the recorder structure dropped 244mm. 30/01/69 - The recorder structure dropped further during this flood. 05/05/69 - Missing record 690505 115000 to 690618 140000 due to removal of recorder structure. Records recommenced at new location (5 metres down stream) at 690618 140000. Te Panaa recorded 206.0 mm of rain during this period. 25/03/75 - The steps in stage recorded at 750325 and 910514 and 920605 were due to the installation of a groin immediately down stream of the stilling well. 31/12/95 - Data audit carried out on flow site 15536 for the period 940303 to 951231. The data audit was produced by Environment B·O·P who operated the site during this time. The data audit required some data to be reprocessed. 11/04/96 - Site removed. Replaced by Waimana at Ranger Station, site number 15544. 09/10/97 - Rating curve comment: in construction of the top end of the rating curves for the period which the site was under Environment Bay of Plenty control, have used the high stage gaugings prior to 940303 103000 to help define the shape. This is partly due to the small number of high stage gaugings undertaken by Environment Bay of Plenty. Extrapolation of the velocity and area curves for the post 940303 gaugings show flow values that slightly favour the pre 940303 gaugings. These patterns hold true up to ~3000mm stage, have therefore tried to find a suitable fit between the pre and post 940303 gaugings for the top end rating curve.
For additional information, please see recording authority.

Environment Bay of Plenty 311
Environment Bay of Plenty Hydrological Flow Summary
Date Complied July 2006 Site Number 15536 Compiled by G R Ellery River Waimana Station Olgiilvie Bridge Metric Map Reference W16: 704 128 Catchment Area (km2) 211 Period of Summary 1969 to 1995 Statistical Summary
Flow (l/s) Minimum Flow 468 Maximum Flow 329953 Mean Annual Minimum Flow 1440 Mean Annual Maximum Flow 184472 Mean Flow 8148 Mean Summer Flow 6479 Median Flow 4882 Mean Autumn Flow 5521 Mean Specific Flow (/km2) 39 Mean Winter Flow 10777 Mean Spring Flow 10134 Low Flow Distribution Fit GEV Peak Flow Distribution Fit Gumbel GEV 7 day Low Flow (Minimum) 614 Peak Flow (5 yr Return) 297000 279000 7 Day Low Flow (Mean Annual) 1513 Peak Flow (10 yr Return) 368000 361000 7 day Low Flow (5 yr Return) 1220 Peak Flow (20 yr Return) 435000 455000 7 Day Low Flow (10 yr Return) 1017 Peak Flow (50 yr Return) 522000 600000 Peak Flow (100 yr Return)
Annual Summaries Flow (l/s) Flow (l/s) Year
Minimum Mean Maximum Year
Minimum Mean Maximum 1970 1490 13310 254929 1983 992 9043 237001 1971 1690 12189 186959 1984 1750 7445 157833 1972 1493 6109 184531 1985 1662 8356 249124 1973 1251 4772 59753 1986 1712 8169 147416 1974 1355 8673 156375 1987 1716 8498 277598 1975 1586 7977 221232 1988 1247 7699 257088 1976 1610 8569 250601 1989 1669 10096 113233 1977 1011 5152 91724 1990 1720 9073 207182 1978 693 6835 153707 1991 1309 8089 176664 1979 1648 10933 153432 1992 1917 7463 173751 1980 1300 7656 92250 1993 1183 4347 136993 1981 1133 8253 82756 1994 468 9567 283273 1982 1501 5219 73747 1995 2292 9562 271645
Flow Distribution Flow (l/s)
Percentiles 0 1 2 3 4 5 6 7 8 9 0 329953 57577 40159 32555 27893 24719 22403 20405 18856 17528 10 16376 15423 14591 13861 13166 12543 12005 11506 11088 10682 20 10285 9936 9593 9257 8959 8676 8408 8156 7926 7711 30 7522 7332 7151 6979 6817 6654 6500 6356 6219 6097 40 5968 5840 5726 5616 5509 5404 5297 5197 5089 4986 50 4882 4783 4682 4588 4498 4405 4319 4237 4146 4058 60 3976 3890 3804 3724 3637 3556 3483 3407 3340 3267 70 3196 3129 3061 2998 2933 2869 2807 2747 2682 2616 80 2557 2498 2437 2371 2302 2239 2172 2113 2060 2012 90 1961 1911 1845 1771 1693 1597 1507 1421 1293 1114 100 468

312 Environmental Publication 2007/06
0
50000
100000
150000
200000
250000
300000
350000
1968 1970 1972 1974 1976 1978 1980 1982 1984 1986 1988 1990 1992 1994
Year
Flow
(l/s
)
Maximum Flow 5 per. Mov. Avg. (Maximum Flow )
0
500
1000
1500
2000
2500
1968 1970 1972 1974 1976 1978 1980 1982 1984 1986 1988 1990 1992 1994
Year
Flow
(l/s
)
Minimum Flow 5 per. Mov. Avg. (Minimum Flow )
0
2000
4000
6000
8000
10000
12000
1968 1970 1972 1974 1976 1978 1980 1982 1984 1986 1988 1990 1992 1994
Year
Flow
(l/s
)
Mean Autumn Flow 5 per. Mov. Avg. (Mean Autumn Flow )
0
5000
10000
15000
20000
25000
1968 1970 1972 1974 1976 1978 1980 1982 1984 1986 1988 1990 1992 1994
Year
Flow
(l/s
)
Mean Winter Flow 5 per. Mov. Avg. (Mean Winter Flow )
0
5000
10000
15000
20000
25000
30000
1968 1970 1972 1974 1976 1978 1980 1982 1984 1986 1988 1990 1992 1994
Year
Flow
(l/s
)
Mean Spring Flow 5 per. Mov. Avg. (Mean Spring Flow )
02000400060008000
100001200014000160001800020000
1968 1970 1972 1974 1976 1978 1980 1982 1984 1986 1988 1990 1992 1994
Year
Flow
(l/s
)
Mean Summer Flow 5 per. Mov. Avg. (Mean Summer Flow )
0
2000
4000
6000
8000
10000
12000
14000
1968 1970 1972 1974 1976 1978 1980 1982 1984 1986 1988 1990 1992 1994
Year
Flow
(l/s
)
Mean Flow 5 per. Mov. Avg. (Mean Flow )

Environment Bay of Plenty 313
Environment Bay of Plenty River Flow Recording Station
River Nukuhou Site Old Quarry Road Site Number 15605 Grid Reference W16:729 387 Start of Record September 1990 Data Capture Rate 98% Data Summary From January 1991 To December 2005 Data Audited From September 1997 To December 2005 Equipment History
13/09/90: Float with L&S digital recorder. 26/08/99: iQuest logger and Handar. Comments on Stage/Discharge Ratings Site control is by natural gravel channel. Ratings are available to convert Stage (mm) to Flow (l/s).
General Comments Site is operated by Environment Bay of Plenty as part of its Natural Environment Regional Monitoring Network.
SITE LOCATION Nukuhou at Old Quarry Road

314 Environmental Publication 2007/06
Station Comments Nukuhou River at Old Quarry Road. Site Number 15605, on River Number 156010.
Controlling authority is Environment Bay of Plenty.
This site is situated 10.5 kilometres from the mouth. It has a natural gravel control.
River is slow and meandering. Overhanging trees and berm flow contribute to loop rating effect at higher stages. Ratings are drawn to go approximately through the middle of the loop, therefore some deviation from the rating may be evident for higher stage gaugings.
Gaugings are by wading at lower stages and by slackline at higher stages. Slackline x-section above stage height of approximately 1 metre is broad and flat. Gaugings are filed at the end time of each gauging up until 970101. From 970101 onwards gaugings are filed to mid gauge time.
23/09/90 - Missing record from 900923 at 164500 to 900928 at 1016 due to tape jamming in recorder.
24/01/90 - Missing record from 901024 at 080000 to 901029 at 94500 due to tape ripping.
10/09/91 - Missing record from 910910 at 104500 to 910930 at 111500 due to recorder failure.
04/06/92 - Data from 920604 101500 to 921002 084500 should be treated with caution due to recorder time (slow) problem. Data has been corrected to inspection times.
10/08/92 - Missing record from 920810 at 141500 to 920814 at 111500 due to ripped tape.
01/09/94 - Missing record from 940901 at 154500 to 940905 at 143000 due to l&s not punching.
14/06/95 - Missing record from 950614 at 180000 to 950620 at 150000 due to recorder failure.
13/07/95 - Missing record from 950713 at 163000 to 950719 at 123000 due to Aquitel remote crashing.
17/11 95 - Missing record from 951117 at 180000 to 951120 at 101500 due to Aquitel remote coldstarting.
22/11/95 - Missing record from 951122 at 150000 to 951124 at 113100.
27/11/95 - Missing record from 951127 at 150000 to 951208 at 153000 due to Aquitel remote crashing.
27/02/96 - Missing record 960227 at 093000 to 960229 at 094500 due to Aquitel remote failure.
08/05/96 - Missing record from 960508 at 164500 to 960515 at 114500 due to Aquitel failure.
18/05/96 - Missing record from 960518 at 011500 to 960522 134500 due to Aquitel remote crashing.
22/05/96 - Missing record from 960522 at 170000 to 960523 at 113000 due to remote not being started.
24/06/96 - Missing record from 960624 at 053000 to 960626 at 113000 due to Aquitel remote failure.
26/09/99 - Missing record from 990926 at 223000 to 990908 at 101500 due to fault with new iQuest logger
26/08/99 - iQuest logger and Handar encoder installed. Time resolution of 15 minutes. Stage resolution 1 mm.
02/03/00 - Missing record from 1000302 at 240000 to 1000303 at 101500 due to programming fault.
06/04/03 - Change in mid-stage rating shape due to left bank mid berm suffering significant scour. Scour was exacerbated by upstream channel works that removed some meander loops and may have increased velocities through section.
15/07/03 - Missing record from 20030715 at 113000 to 20030803 at 023000 due to memory overwrite.
23/07/04 - Tower flushed. Flushing only appears to have been partially successful as bottom end of recessions show signs of siltation through to subsequent tower flushing on 20041202 at 141500. Use lower flow data with caution.
For additional information, please see recording authority.

Environment Bay of Plenty 315
Environment Bay of Plenty Hydrological Flow Summary
Date Complied July 2006 Site Number 15605 Compiled by G R Ellery River Nukuhou Station Old Quarry Road Metric Map Reference W16:729 387 Catchment Area (km2) 67 Period of Summary 1991 to 2005
Statistical Summary Flow (l/s)
Minimum Flow 82 Maximum Flow 91924 Mean Annual Minimum Flow 201 Mean Annual Maximum Flow 43550 Mean Flow 1867 Mean Summer Flow 1183 Median Flow 1074 Mean Autumn Flow 1216 Mean Specific Flow (/km2) 28 Mean Winter Flow 3038 Mean Spring Flow 2078 Low Flow Distribution Fit Gumbel Peak Flow Distribution Fit Gumbel GEV 7 day Low Flow (Minimum) 92 Peak Flow (5 yr Return) 62000 60000 7 Day Low Flow (Mean Annual) 191 Peak Flow (10 yr Return) 76000 76000 7 day Low Flow (5 yr Return) 152 Peak Flow (20 yr Return) 90000 93000 7 Day Low Flow (10 yr Return) 130 Peak Flow (50 yr Return) Peak Flow (100 yr Return)
Annual Summaries Flow (l/s) Flow (l/s) Year
Minimum Mean Maximum Year
Minimum Mean Maximum 1980 1993 147 711 16838 1981 1994 183 1777 40105 1982 1995 179 2535 31778 1983 1996 386 2093 33621 1984 1997 248 1515 39960 1985 1998 127 2276 70484 1986 1999 159 2107 61328 1987 2000 192 1568 22483 1988 2001 175 2792 53236 1989 2002 184 1315 17977 1990 2003 82 1830 83346 1991 235 1564 28288 2004 257 2670 91924 1992 291 1810 41171 2005 163 1486 20710
Flow Distribution Flow (l/s)
Percentiles 0 1 2 3 4 5 6 7 8 9 0 91924 14212 9686 7713 6486 5738 5161 4728 4343 4025 10 3760 3523 3327 3157 3013 2882 2767 2662 2564 2477 20 2392 2315 2250 2187 2130 2071 2014 1961 1911 1862 30 1820 1773 1723 1677 1633 1588 1547 1505 1464 1426 40 1393 1356 1322 1287 1256 1225 1194 1164 1130 1102 50 1074 1044 1014 985 956 926 900 875 849 822 60 798 772 748 725 704 682 657 634 612 592 70 571 552 534 520 506 492 476 461 447 432 80 418 402 389 376 365 353 341 328 316 304 90 289 276 263 250 236 222 208 196 176 150 100 82

316 Environmental Publication 2007/06
0100002000030000400005000060000700008000090000
100000
1990 1992 1994 1996 1998 2000 2002 2004
Year
Flow
(l/s
)
Maximum Flow 5 per. Mov. Avg. (Maximum Flow )
0
50
100
150
200
250
300
350
400
450
1990 1992 1994 1996 1998 2000 2002 2004
Year
Flow
(l/s
)
Minimum Flow 5 per. Mov. Avg. (Minimum Flow )
0
500
1000
1500
2000
2500
3000
1990 1992 1994 1996 1998 2000 2002 2004
Year
Flow
(l/s
)
Mean Flow 5 per. Mov. Avg. (Mean Flow )
0
500
1000
1500
2000
2500
3000
1990 1992 1994 1996 1998 2000 2002 2004
Year
Flow
(l/s
)
Mean Autumn Flow 5 per. Mov. Avg. (Mean Autumn Flow )
0
1000
2000
3000
4000
5000
6000
1990 1992 1994 1996 1998 2000 2002 2004
Year
Flow
(l/s
)
Mean Winter Flow 5 per. Mov. Avg. (Mean Winter Flow )
0
500
1000
1500
2000
2500
3000
3500
4000
1990 1992 1994 1996 1998 2000 2002 2004
Year
Flow
(l/s
)
Mean Spring Flow 5 per. Mov. Avg. (Mean Spring Flow )
0
500
1000
1500
2000
2500
3000
1990 1992 1994 1996 1998 2000 2002 2004
Year
Flow
(l/s
)
Mean Summer Flow 5 per. Mov. Avg. (Mean Summer Flow )
Nukuhou at Old Quarry Road

Environment Bay of Plenty 317
Environment Bay of Plenty River Flow Recording Station
River Waioeka Site Cableway Site Number 15901 Grid Reference W16:876 219 Start of Record March 1958 Data Capture Rate 95% Data Summary From January 1959 To December 2005 Data Audited From NIWA To NIWA Equipment History 10/03/58: Monthly Lea chart recorder. 03/03/59: Monthly Kent chart recorder. 04/09/69: Float with F&P digital recorder. 16/02/77: Backup Foxboro chart recorder. 15/12/87: 10 metre range P.T. and Aquitel. 09/12/93: Encoder with WRIC data logger. Comments on Stage/Discharge Ratings Site control is by natural gravel bed. Rating curve is well defined with gaugings over the full range. Ratings are available to convert Stage (mm) to Flow (l/s). General Comments Site is operated by NIWA, Rotorua. Environment Bay of Plenty operate their own equipment at the same site for flood monitoring purposes.
SITE LOCATION Waioeka at Cableway

318 Environmental Publication 2007/06
Station Comments Waioeka River at Gorge Cableway. Site Number 15901, on River Number 159000. The local recording authority is NIWA, Rotorua. The site is situated 36.6 kilometres from the mouth. 01/09/67 -Logs cleared around staff gauge and intakes, causing drop in stage of 150mm. 30/06/76 - Control of site transferred from Rotorua to Gisborne Water Resources Survey on 760630. 23/01/79 - Periods of missing record occurred from November 1977 to January 1979 due to intake problems. New middle intake installed 790123 causing 75mm rise in stage. 18/11/86 - Continued problems with intake. Bottom intake extended by approximately 800mm and tower desilted on 861118.
For additional information, please see recording authority.

Environment Bay of Plenty 319
Environment Bay of Plenty Hydrological Flow Summary
Date Complied December 2006 Site Number 15901 Compiled by G R Ellery River Waioeka Station Cableway Metric Map Reference W16: 876 219 Catchment Area (km2) 640 Period of Summary 1959 to 2005
Statistical Summary Flow (l/s)
Minimum Flow 1141 Maximum Flow 1520537 Mean Annual Minimum Flow 4030 Mean Annual Maximum Flow 684923 Mean Flow 31592 Mean Summer Flow 22253 Median Flow 16739 Mean Autumn Flow 25017 Mean Specific Flow (/km2) 49 Mean Winter Flow 44082 Mean Spring Flow 36358 Low Flow Distribution Fit GEV Peak Flow Distribution Fit Pearson III 7 day Low Flow (Minimum) 1828 Peak Flow (5 yr Return) 904000 7 Day Low Flow (Mean Annual) 4004 Peak Flow (10 yr Return) 1047000 7 day Low Flow (5 yr Return) 3179 Peak Flow (20 yr Return) 1297000 7 Day Low Flow (10 yr Return) 2696 Peak Flow (50 yr Return) 1583000 Peak Flow (100 yr Return) 1845000
Annual Summaries Flow (l/s) Flow (l/s) Year
Minimum Mean Maximum Year
Minimum Mean Maximum 1980 1680 30640 574702 1993 3371 18044 483860 1981 4449 35235 491910 1994 4837 31763 610068 1982 4248 20034 303544 1995 4401 36018 1001960 1983 2093 33274 674550 1996 7604 34285 666555 1984 6535 29274 635707 1997 5396 26663 605871 1985 4101 32593 799272 1998 3574 40818 1520540 1986 4343 30367 465064 1999 3515 31993 882375 1987 4482 34112 1026020 2000 4971 26144 379086 1988 4197 34689 943341 2001 4992 34759 622917 1989 3445 36740 593709 2002 4598 23813 586478 1990 4476 31536 713512 2003 2798 35347 906962 1991 3632 32072 887364 2004 3498 34165 705536 1992 4832 29972 483183 2005 2984 24109 440316
Flow Distribution Flow (l/s)
Percentiles 0 1 2 3 4 5 6 7 8 9 0 1520537 250091 177043 141686 120777 105501 94062 84893 77682 71633 10 66583 62264 58527 55307 52510 49904 47490 45365 43398 41515 20 39830 38262 36768 35380 34103 32934 31833 30781 29801 28872 30 27988 27168 26391 25639 24909 24210 23552 22930 22343 21797 40 21256 20731 20228 19742 19261 18802 18364 17932 17513 17109 50 16739 16374 15998 15637 15288 14946 14618 14297 13980 13676 60 13375 13080 12790 12500 12212 11930 11659 11379 11115 10837 70 10577 10333 10098 9861 9610 9358 9112 8862 8624 8391 80 8154 7913 7673 7433 7195 6958 6728 6509 6283 6060 90 5840 5623 5410 5182 4945 4705 4457 4155 3750 3115 100 1141

320 Environmental Publication 2007/06
0
200000
400000
600000
800000
1000000
1200000
1400000
1600000
1955 1965 1975 1985 1995 2005
Year
Flow
(l/s
)
Maximum Flow 5 per. Mov. Avg. (Maximum Flow )
0
10000
20000
30000
40000
50000
60000
1955 1965 1975 1985 1995 2005
Year
Flow
(l/s
)
Mean Flow 5 per. Mov. Avg. (Mean Flow )
0
1000
2000
3000
4000
5000
6000
7000
8000
9000
1955 1965 1975 1985 1995 2005
Year
Flow
(l/s
)
Minimum Flow 5 per. Mov. Avg. (Minimum Flow )
0
10000
20000
30000
40000
50000
60000
70000
80000
1955 1965 1975 1985 1995 2005
Year
Flow
(l/s
)
Mean Autumn Flow 5 per. Mov. Avg. (Mean Autumn Flow )
0100002000030000400005000060000700008000090000
100000
1955 1960 1965 1970 1975 1980 1985 1990 1995 2000 2005
Year
Flow
(l/s
)
Mean Winter Flow 5 per. Mov. Avg. (Mean Winter Flow )
0100002000030000400005000060000700008000090000
1955 1965 1975 1985 1995 2005
Year
Flow
(l/s
)
Mean Spring Flow 5 per. Mov. Avg. (Mean Spring Flow )
05000
100001500020000250003000035000400004500050000
1955 1965 1975 1985 1995 2005
Year
Flow
(l/s
)
Mean Summer Flow 5 per. Mov. Avg. (Mean Summer Flow )
Waioeka at Cableway

Environment Bay of Plenty 321
Environment Bay of Plenty River Flow Recording Station
River Otara Site Browns Bridge Site Number 16002 Grid Reference W16:931 376 Start of Record March 1979 Data Capture Rate 90% Data Summary From January 1980 To December 2005 Data Audited From December 1989 To December 2005 Equipment History 02/06/72 - Recorder installed is an Ericsson. 01/02/79: Monthly Foxboro chart recorder. 13/12/89: 10 metre P.T. & Aquitel Remote. 15/11/93: Float with L&S digital recorder. Comments on Stage/Discharge Ratings Site control is by natural gravel bed. Control is unstable and there have been numerous rating changes at this site. Gravel extraction occurs at this site and can cause rating changes. Ratings are available to convert Stage (mm) to Flow (l/s)
General Comments Site was originally operated by the East Cape Catchment Board, before being handed over in November 1989. This site is also used for flood monitoring purposes. Site is now operated by Environment Bay of Plenty as part of its Natural Environment Regional Monitoring Network.
SITE LOCATION Otara at Browns Bridge

322 Environmental Publication 2007/06
Station Comments Otara River at Browns Bridge. Site Number 16002, on River Number 160000.
The local recording authority is Environment Bay of Plenty.
The site is situated 20.34 kilometres from the mouth. Lower flow gaugings are performed by wading, higher flow gaugings are performed from the bridge using a gauging crane and suspended meter. The bed in the vicinity of the recorder on the Otara River at Browns Bridge consists mainly of gravels and is subject to regular movement during freshes. During larger events major changes in bed shape are possible with resulting changes in rating shape. At a stage of approximately 1.9 metres bank overflow occurs into berm area.
01/02/79 - Recorder installed is a 5 metre range monthly Foxboro with a time resolution of 281 minutes / mm recorded and a stage resolution of 47mm stage / mm recorded.
01/11/89 - Site handed over to Environment Bay of Plenty. As part of local authority reorganisation. Collection and processing procedures for this data is unknown. This data should be used with caution.
13/12/89 - Recorder installed is an Aquitel remote with a time resolution of 15 minutes connected to a 10metre pressure transducer with an accuracy of 20 mm. Foxboro retained as a backup recorder.
24/12/89 - Missing record from 891224 at 023000 to 900104 at 134500 due to power supply failure. During this period Pakihi (16004) an upstream site recorded a small fresh.
11/10/91
Site handed over to Environment Bay of Plenty as part of local authority reorganisation. Data from March 1979 transferred to Environment Bay of Plenty. Collection and processing procedures for this data is unknown, use data with caution.
15/11/93 - Stilling well and Leopold and Stevens digital recorder installed. Recorder has a 15 minute time resolution and a stage resolution of 1 mm of stage change to 1 mm recorded.
30/08/94 - Missing record for the period 940830 at 124500 to 940907 at 141500 due to equipment failure.
13/10/95 - Missing record for the period 951013 at 151500 to 951018 at 144500 due to Aquitel remote failure.
26/12/95 - Missing record for the period 951226 at 133000 to 960109 at 093900 due to Aquitel remote failure.
27/05/96 - Data from 960527 at 083000 to 960626 at 160000 missing due to siltation of intakes.
14/09/96 - Missing record from 960914 at 201500 to 960920 at 144500 due to recorder failure.
01/10/96 - Missing record from 961001 at 094500 to 961009 at 101500 due to recorder failure
30/09/97 - Missing record from 970930 at 104500 to 971001 at 120000 due to recorder failure.
19/10/97 - Missing record from 971019 at 141500 to 971022 at 104500 due to power supply fault.
23/10/97 - Missing record from 971023 at 060000 to 971024 at 110000 due to Aquitel remote failure.
22/04/01 - Missing record from 20010422 at 070000 to 20010426 at 154500 due to encoder fault.
17/07/04 - Missing record from 20040717 211500 to 20040720 170000 due to failing Handar 436BD encoder.
23/07/04 - Missing record from 20040723 120000 to 20040723 124500.
18/08/04 - Missing record from 20040818 170000 to 20040823 160000 due to failing Handar 436BD encoder.
19/12/04 - Missing record from 20041219 111500 to 2041223 111500. Cause unknown.
17/07/04 - Missing record from 20040717 at 211500 to 20040720 at 170000 due to bank slumping and blocking intakes.
18/08/04 - Missing record from 20040818 at 170000 to 20040823 at 160000 due to encoder jamming.
17/10/05 - Missing record from 20051017 at 184500 to 20051018 at 113000 due to encoder jamming.
For additional information, please see recording authority.

Environment Bay of Plenty 323
Environment Bay of Plenty Hydrological Flow Summary
Date Complied July 2006 Site Number 16002 Compiled by G R Ellery River Otara Station Browns Bridge Metric Map Reference W16:931 376 Catchment Area (km2) 254 Period of Summary 1980 to 2005
Statistical Summary Flow (l/s)
Minimum Flow 495 Maximum Flow 727521 Mean Annual Minimum Flow 1502 Mean Annual Maximum Flow 345142 Mean Flow 11840 Mean Summer Flow 9409 Median Flow 6123 Mean Autumn Flow 8829 Mean Specific Flow (/km2) 47 Mean Winter Flow 15848 Mean Spring Flow 12430 Low Flow Distribution Fit GEV Peak Flow Distribution Fit GEV 7 day Low Flow (Minimum) 663 Peak Flow (5 yr Return) 463000 7 Day Low Flow (Mean Annual) 1607 Peak Flow (10 yr Return) 562000 7 day Low Flow (5 yr Return) 1226 Peak Flow (20 yr Return) 666000 7 Day Low Flow (10 yr Return) 1004 Peak Flow (50 yr Return) 812000 Peak Flow (100 yr Return)
Annual Summaries Flow (l/s) Flow (l/s) Year
Minimum Mean Maximum Year
Minimum Mean Maximum 1980 1974 10772 249867 1993 1337 6072 183156 1981 574 14062 191708 1994 1269 11151 182522 1982 2072 8144 181884 1995 1552 13290 303431 1983 888 13350 379321 1996 2133 14620 483152 1984 495 10312 297694 1997 1998 9366 297507 1985 898 9215 427229 1998 1827 17055 549808 1986 1470 13463 495514 1999 1365 14151 519387 1987 1106 8741 357574 2000 2191 11995 252876 1988 1470 14914 259394 2001 1929 14980 391790 1989 753 9554 517039 2002 1992 9860 244158 1990 2082 12013 287602 2003 1228 14656 727521 1991 1229 12139 385586 2004 1744 13430 445367 1992 2091 12229 243326 2005 1388 8835 119281
Flow Distribution Flow (l/s)
Percentiles 0 1 2 3 4 5 6 7 8 9 0 727521 110664 71406 53622 43626 37025 32542 29091 26442 24354 10 22618 21209 19896 18756 17809 16933 16117 15417 14805 14243 20 13717 13214 12754 12324 11893 11513 11160 10826 10505 10204 30 9908 9629 9365 9112 8871 8646 8431 8221 8026 7832 40 7641 7456 7284 7121 6957 6806 6659 6520 6387 6257 50 6123 5982 5844 5720 5599 5482 5366 5248 5133 5027 60 4928 4827 4724 4621 4523 4424 4327 4230 4138 4045 70 3958 3872 3779 3686 3596 3509 3423 3330 3239 3157 80 3076 2995 2914 2818 2729 2647 2572 2494 2416 2336 90 2260 2177 2106 2017 1898 1786 1679 1548 1404 1178 100 495

324 Environmental Publication 2007/06
0
100000
200000
300000
400000
500000
600000
700000
800000
1980 1985 1990 1995 2000 2005
Year
Flow
(l/s
)
Maximum Flow 5 per. Mov. Avg. (Maximum Flow )
0
500
1000
1500
2000
2500
1980 1985 1990 1995 2000 2005
Year
Flow
(l/s
)
Minimum Flow 5 per. Mov. Avg. (Minimum Flow )
0
2000
4000
6000
8000
10000
12000
14000
16000
18000
1980 1985 1990 1995 2000 2005
Year
Flow
(l/s
)
Mean Flow 5 per. Mov. Avg. (Mean Flow )
02000400060008000
1000012000140001600018000
1980 1985 1990 1995 2000 2005
Year
Flow
(l/s
)
Mean Autumn Flow 5 per. Mov. Avg. (Mean Autumn Flow )
0
5000
10000
15000
20000
25000
30000
35000
40000
1980 1985 1990 1995 2000 2005
Year
Flow
(l/s
)
Mean Winter Flow 5 per. Mov. Avg. (Mean Winter Flow )
0
5000
10000
15000
20000
25000
30000
1980 1985 1990 1995 2000 2005
Year
Flow
(l/s
)
Mean Spring Flow 5 per. Mov. Avg. (Mean Spring Flow )
02000400060008000
100001200014000160001800020000
1980 1985 1990 1995 2000 2005
Year
Flow
(l/s
)
Mean Summer Flow 5 per. Mov. Avg. (Mean Summer Flow )
Otara at Browns Bridge

Environment Bay of Plenty 325
Environment Bay of Plenty River Flow Recording Station
River Motu Site Houpoto Site Number 16501 Grid Reference X15: 181 609 Start of Record April 1957 Data Capture Rate 99% Data Summary From January 1958 To December 2005 Data Audited From To Equipment History 08/04/1957 - Recorder is a 20 feet range weekly Lea, time resolution of 38 minutes/mm recorded and a stage ratio of 24 mm of stage/mm chart recorded.
27/05/1957 - Recorder replaced by a 20 feet range 32 day Lea, having a time resolution of 152 minutes/mm recorded and a stage ratio of 24mm of stage/mm chart recorded.
19/03/1958 - Recorder replaced on 580319 by a 25 feet range 32 day Kent, having a time resolution of 96 minutes/mm recorded and a stage ratio of 30mm of stage/mm chart recorded.
16/08/1966 - Recorder replaced on 660816 by a 30 metre range F&P, having a time interval of 15 minutes and a stage ratio of 3mm of stage/mm recorded.
09/09/1992 -Recorder replaced 920909 114500 by a datalogger and shaft encoder. This unit has a 10 metre range with a time interval of 15 minutes and a stage ratio of 1mm of stage/mm recorded.
Comments on Stage/Discharge Ratings Control is by stable natural channel. Ratings available to convert stage (mm) to flow (l/s). General Comments Site is operated by NIWA – Rotorua.
SITE LOCATION Motu at Houpoto

326 Environmental Publication 2007/06
Station Comments 07/04/1957 - Motu At Houpoto on the Motu river, river number 165000 Station operated by the Hamilton then Rotorua hydro surveys, MWD, from 1957 to 1976. The local recording authority is NIWA, Rotorua. 1/10/1962 - Missing record for period 621001 103001 to 621003 155959. Clock removed for repair. 31/12/1965 - Missing record for period 651231 061301 to 660107 125959. Clock stopped. 17/10/1966 - Missing record for period 661017 124501 to 661106 145959. Silting in well. 2/09/1975 - Missing record for period 750902 200001 to 750922 111459 due to faulty recorder. 18/04/1977 - Missing record for period 770418 123001 to 770531 134459. Punch motor failure 28/07/1997 - Missing record for period 770728 223001 to 770811 144959. Timer stopped. 25/09/1985 - Missing record for period 850925 103801 to 851016 135959. Jammed punchblock on F&P and backup Foxboro pen failure. 29/05/1995 - Missing record from 950529 153001 to 950601 114500. The aquitel remote failed during this period. 14/09/1996 - Missing record from 960914 151501 to 960916 115959 due to a faulty remote. The backup Foxboro recorder also failed during this period.
For additional information, please see recording authority.
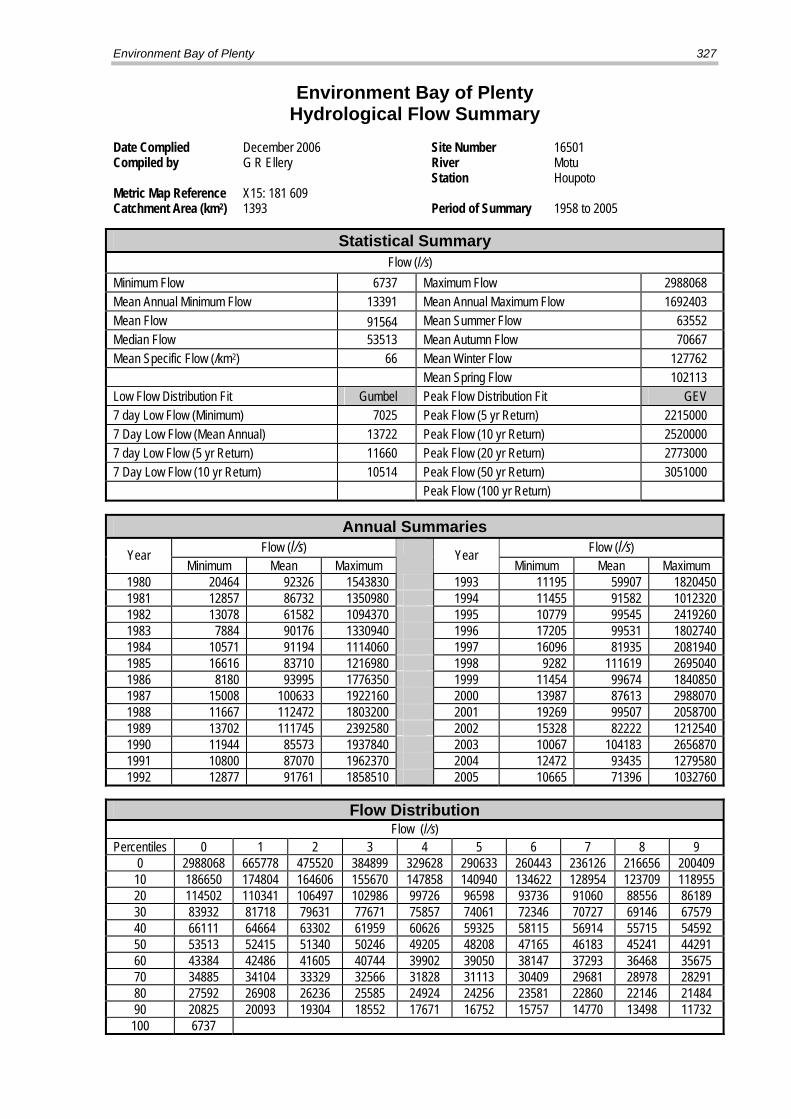
Environment Bay of Plenty 327
Environment Bay of Plenty Hydrological Flow Summary
Date Complied December 2006 Site Number 16501 Compiled by G R Ellery River Motu Station Houpoto Metric Map Reference X15: 181 609 Catchment Area (km2) 1393 Period of Summary 1958 to 2005
Statistical Summary Flow (l/s)
Minimum Flow 6737 Maximum Flow 2988068 Mean Annual Minimum Flow 13391 Mean Annual Maximum Flow 1692403 Mean Flow 91564 Mean Summer Flow 63552 Median Flow 53513 Mean Autumn Flow 70667 Mean Specific Flow (/km2) 66 Mean Winter Flow 127762 Mean Spring Flow 102113 Low Flow Distribution Fit Gumbel Peak Flow Distribution Fit GEV 7 day Low Flow (Minimum) 7025 Peak Flow (5 yr Return) 2215000 7 Day Low Flow (Mean Annual) 13722 Peak Flow (10 yr Return) 2520000 7 day Low Flow (5 yr Return) 11660 Peak Flow (20 yr Return) 2773000 7 Day Low Flow (10 yr Return) 10514 Peak Flow (50 yr Return) 3051000 Peak Flow (100 yr Return)
Annual Summaries Flow (l/s) Flow (l/s) Year
Minimum Mean Maximum Year
Minimum Mean Maximum 1980 20464 92326 1543830 1993 11195 59907 1820450 1981 12857 86732 1350980 1994 11455 91582 1012320 1982 13078 61582 1094370 1995 10779 99545 2419260 1983 7884 90176 1330940 1996 17205 99531 1802740 1984 10571 91194 1114060 1997 16096 81935 2081940 1985 16616 83710 1216980 1998 9282 111619 2695040 1986 8180 93995 1776350 1999 11454 99674 1840850 1987 15008 100633 1922160 2000 13987 87613 2988070 1988 11667 112472 1803200 2001 19269 99507 2058700 1989 13702 111745 2392580 2002 15328 82222 1212540 1990 11944 85573 1937840 2003 10067 104183 2656870 1991 10800 87070 1962370 2004 12472 93435 1279580 1992 12877 91761 1858510 2005 10665 71396 1032760
Flow Distribution Flow (l/s)
Percentiles 0 1 2 3 4 5 6 7 8 9 0 2988068 665778 475520 384899 329628 290633 260443 236126 216656 200409 10 186650 174804 164606 155670 147858 140940 134622 128954 123709 118955 20 114502 110341 106497 102986 99726 96598 93736 91060 88556 86189 30 83932 81718 79631 77671 75857 74061 72346 70727 69146 67579 40 66111 64664 63302 61959 60626 59325 58115 56914 55715 54592 50 53513 52415 51340 50246 49205 48208 47165 46183 45241 44291 60 43384 42486 41605 40744 39902 39050 38147 37293 36468 35675 70 34885 34104 33329 32566 31828 31113 30409 29681 28978 28291 80 27592 26908 26236 25585 24924 24256 23581 22860 22146 21484 90 20825 20093 19304 18552 17671 16752 15757 14770 13498 11732 100 6737

328 Environmental Publication 2007/06
0
500000
1000000
1500000
2000000
2500000
3000000
3500000
1955 1965 1975 1985 1995 2005
Year
Flow
(l/s
)
Maximum Flow 5 per. Mov. Avg. (Maximum Flow )
0
5000
10000
15000
20000
25000
30000
1955 1965 1975 1985 1995 2005
Year
Flow
(l/s
)
Minimum Flow 5 per. Mov. Avg. (Minimum Flow )
0
20000
40000
60000
80000
100000
120000
140000
160000
180000
1955 1965 1975 1985 1995 2005
Year
Flow
(l/s
)
Mean Flow 5 per. Mov. Avg. (Mean Flow )
020000400006000080000
100000120000140000160000180000
1955 1965 1975 1985 1995 2005
Year
Flow
(l/s
)
Mean Autumn Flow 5 per. Mov. Avg. (Mean Autumn Flow )
020000400006000080000
100000120000140000160000180000200000220000240000
1955 1960 1965 1970 1975 1980 1985 1990 1995 2000 2005
Year
Flow
(l/s
)
Mean Winter Flow 5 per. Mov. Avg. (Mean Winter Flow )
020000400006000080000
100000120000140000160000180000200000
1955 1965 1975 1985 1995 2005
Year
Flow
(l/s
)
Mean Spring Flow 5 per. Mov. Avg. (Mean Spring Flow )
0
20000
40000
60000
80000
100000
120000
140000
1955 1965 1975 1985 1995 2005
Year
Flow
(l/s
)
Mean Summer Flow 5 per. Mov. Avg. (Mean Summer Flow )
Motu at Houpoto

Environment Bay of Plenty 329
3.6 River Level Data Summaries
The river level data summaries in this chapter are provided in the following sequences of 4 pages per site:
Page 1 Provides general information regarding the site, such as its location, instrument types, start of record, etc.
Page 2 Lists site comments that should be read in conjunction with the results of the data summary. Note that these comments are an edited selection of the full set of comments. Contact the recording authority for a full set of comments if required.
Page 3 Displays the Summary information
Page 4 Graphical presentation of a selection of parameters provided in Page 3.
The ID No. in Table 3.6 indicates the order in which individual site data summaries are provided in this report.
Table 3.6 River Level Monitoring Sites
ID Number
Page No. River Site Period of
Audit Data
Capture Rate (%)
1 321 Tuapiro Woodlands Rd 1985-2005 98 2 325 Kopurereroa S.H.29 1991-2005 99 3 329 Kaituna Fords Cut 1981-2005 86 4 333 Kaituna Clarkes 1981-2005 95 5 337 Raparapahoe Above Drop Structure 1992-2005 96 6 341 Mangorewa Saunders 1968-2005 99 7 345 Kaituna Te Matai 1968-2005 97 8 349 Ngongotaha S.H.5 Bridge 1976-2005 99 9 353 Tarawera Awakaponga 1949-2005 99 10 357 Rangitaiki Thornton 1989-2005 89 11 361 Rangitaiki Te Teko 1949-2005 100 12 365 Rangitaiki Murupara 1949-2005 100 13 369 Whakatane Town Wharf 1987-2005 80 14 373 Whakatane Whakatane 1957-2005 99 15 377 Whakatane Huitieke 1987-2005 93 16 381 Waimana Gorge 1951-2005 97 17 385 Waimana Ranger Station 1996-2005 100 18 389 Otara Town Wharf 1991-2005 94 19 393 Waioeka Mouth of Gorge 1987-2005 94 20 397 Waioeka Cableway 1959-2005 95 21 401 Otara Browns Bridge 1980-2005 90 22 405 Pakihi Station Pakihi 1989-2005 86
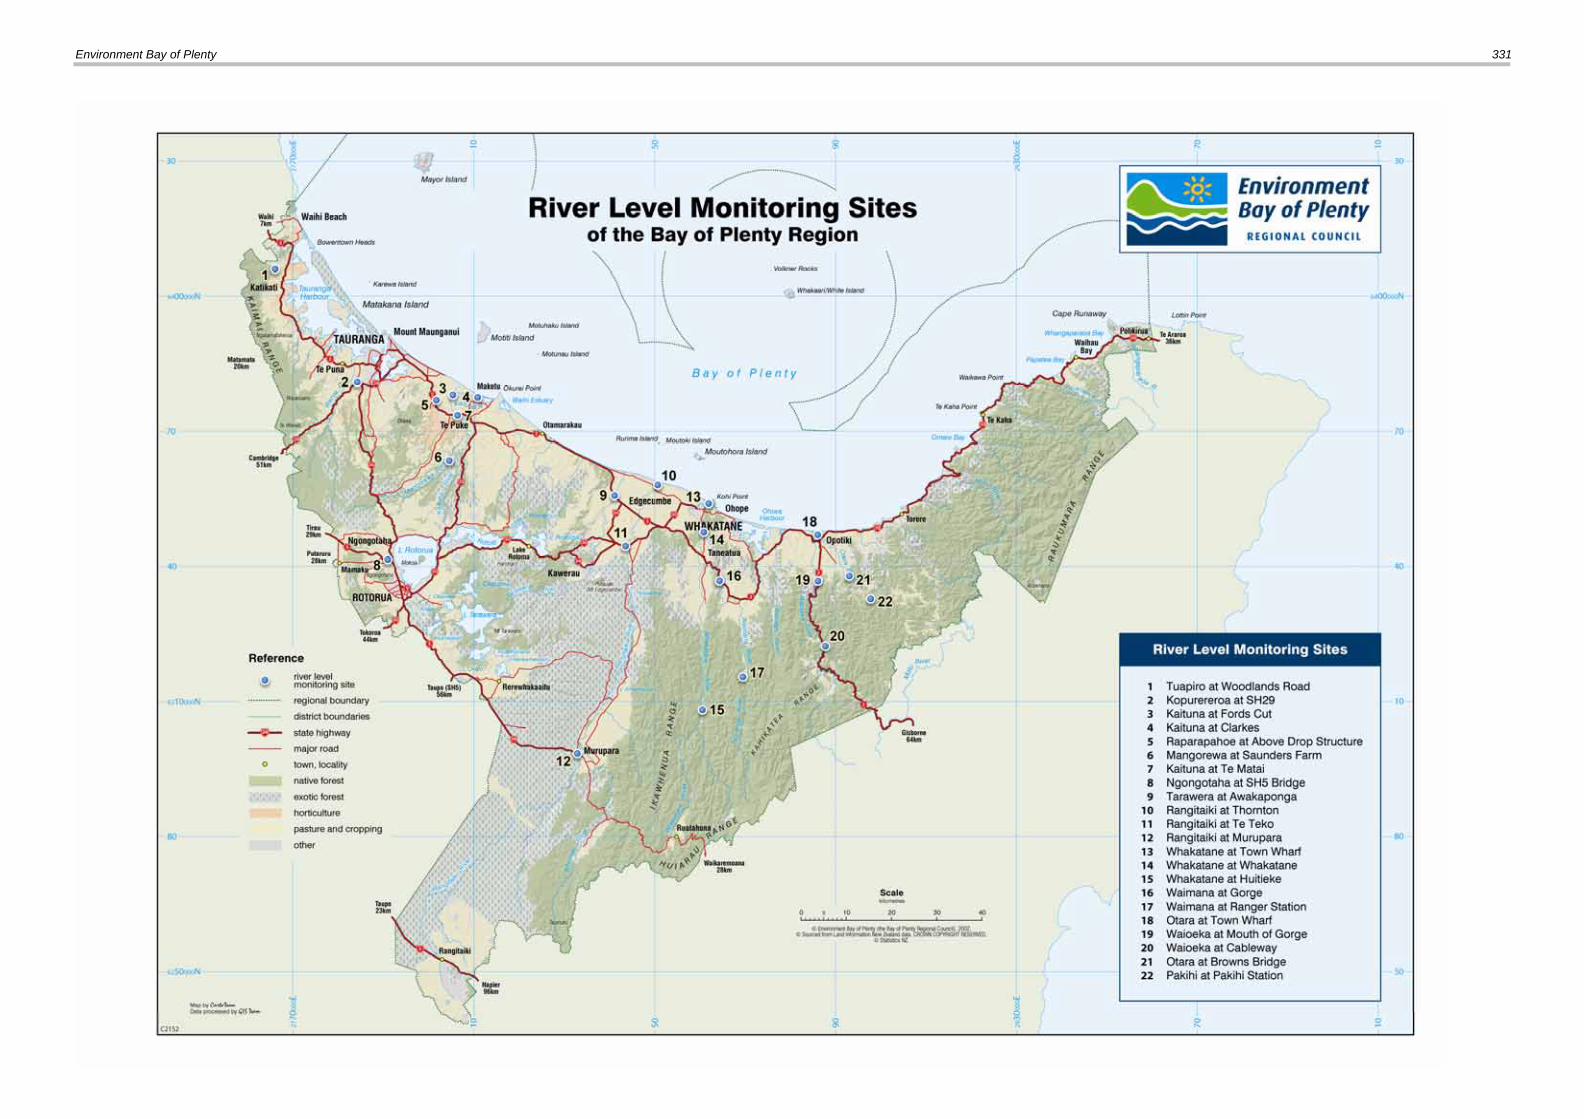
Environment Bay of Plenty 331

Environment Bay of Plenty 333
Environment Bay of Plenty River Level Recording Station
River Tuapiro Site Woodlands Road Site Number 13310 Grid Reference T13:661 057 Start of Record February 1984 Data Capture Rate 98% Data Summary From January 1995 To December 2005 Data Audited From February 1984 To December 2005 Equipment History Float/counterweight system with shaft encoder. 1mm resolution. Comments on Stage/Discharge Ratings Control is by concrete ford. Stream overtops channel and floods surrounding paddocks at high levels. Ratings available to convert stage (mm) to (l/s).
General Comments Site is operated by Environment Bay of Plenty as part of its Natural Environmental Monitoring Network.
SITE LOCATION Tuapiro at Woodlands Road

334 Environmental Publication 2007/06
Station Comments Tuapiro River at Woodlands Road. Site Number 13310, on River Number 133000. The local recording authority is Environment Bay of Plenty. The control is by a stable concrete ford, some movement in bottom end of ratings due to holes through ford filling up and clearing themselves. Spot gaugings carried out since 690318. L&S and recording tower installed 840202. Continuous water level records begin 840202 154500. Top of ford is approximately 0.94 metres on gauge. Bottom of culverts through ford at approximately 0.46 metres on gauge. Ramp corrections applied on numerous occasions since site installed due to debris collecting on ford during flood events. 02/02/84 - Records commenced on 840202 154500. Equipment is a 10 metre L&S digital recorder having a stage ratio of 1mm of stage/mm recorded and a time punch out of 15 minutes. 22/05/84 - Missing record from 840522 at 063000 to 840713 at 140000 due to L&S recorder jamming. 13/07/84 - Missing record from 840713 at 234500 to 840720 at 131500 due to float tape coming off roller. 02/06/86 - Missing record from 860602 at 074500 to 860709 at 124500 due to battery voltage dropping too low to record 11/01/88 - Missing record from 880111 at 120000 to 880125 at 130000 due to L&S recorder jamming. 02/11/89 - Missing record from 891102 at 213000 to 891107 at 123000 due to L&S recorder malfunctioning. 09/12/92 - Missing record from 921209 at 104500 to 921222 at 143000 due to battery voltage dropping too low to record. 13/09/95 - Missing record from 950913 at 063000 to 950920 at 140000 due to Aquitel remote failure. 16/01/96 - Missing record from 960116 at 011500 to 960117 at 104500 due to Aquitel remote having cold started. 24/01/96 - Missing record from 960124 at 174500 to 960131 at 100000 due to Aquitel remote having crashed. 11/02/96 - Missing record from 960211 at 093000 to 960214 at 121500 due to Aquitel remote having locked up. 12/03/96 - Missing record from 960312 at 044500 to 960314 at 131500 due to Aquitel remote having crashed. 15/03/96 - Missing record from 960315 at 070000 to 960320 at 111500 due to Aquitel remote having crashed. 30/12/96 - Missing record 961230 at 174500 to 970107 at 150000 due to upstream suspension bridge being destroyed in flood and washing onto recorder, demolishing recorder hut. 18/10/97 - Missing record from 971018 at 060000 to 971021 at 113000 due to Aquitel failure. 27/07/98 - Missing record from 980727 at 151500 to 980729 at 113000 due to Aquitel failure. 21/04/00 - Missing record from 1000421 at 114500 to 1000427 at 234500 due to rats chewing through power cables. 12/01/02 - Missing record from 1020112 53000 to 1020113 60000 due to deterioration of comms quality. 07/09/04 - Missing record from 20040907 093000 to 20040907 153000 due to communications problems (faulty GPRS unit).
For additional information, please see recording authority.

Environment Bay of Plenty 335
Environment Bay of Plenty Hydrological Level Summary
Date Complied August 2006 Site Number 13310 Compiled by Glenn Ellery River Tuapiro Station Woodlands Road Metric Map Reference T13:661 057 Catchment Area (km2) 39.05 Period of Summary 1985 to 2005 Statistical Summary
Level (mm) Moturiki Datum Minimum Level 34988 Maximum Level 37226 Mean Annual Minimum Level 35029 Mean Annual Maximum Level 36710 Mean Level 35200 Mean Summer Level 35154 Median Level 35140 Mean Autumn Level 35157 Mean Winter Level 35280 Mean Spring Level 35211 Low Level Distribution Fit GEV Peak Level Distribution Fit GEV 7 day Low Level (Minimum) 34990 Peak Level (5 yr Return) 36984 7 Day Low Level (Mean Annual) 35030 Peak Level (10 yr Return) 37135 7 day Low Level (5 yr Return) 35017 Peak Level (20 yr Return) 37257 7 Day Low Level (10 yr Return) 35009
Annual Summaries Level (mm) Moturiki Datum Level (mm) Moturiki Datum Year Minimum Mean Maximum
Year Minimum Mean Maximum 1980 1993 35024 35136 36211 1981 1994 35036 35227 36757 1982 1995 35038 35241 37105 1983 1996 35059 35231 37168 1984 1997 35026 35183 36721 1985 1998 35019 35197 36704 1986 35033 35170 36720 1999 35010 35160 36446 1987 35012 35179 37131 2000 34988 35161 36638 1988 35060 35241 36586 2001 35023 35241 36685 1989 35049 35294 36988 2002 35017 35152 36473 1990 35043 35189 36547 2003 35042 35214 37014 1991 35028 35150 36145 2004 35029 35196 36387 1992 35034 35218 36542 2005 35017 35224 37226
Level Distribution Level (mm) Moturiki Datum
Percentiles 0 1 2 3 4 5 6 7 8 9 0 37226 35841 35696 35623 35576 35546 35521 35501 35483 35468 10 35454 35442 35430 35416 35400 35379 35357 35339 35323 35309 20 35297 35286 35277 35267 35259 35252 35245 35238 35232 35226 30 35220 35215 35210 35205 35200 35195 35190 35186 35182 35177 40 35173 35169 35165 35162 35158 35155 35153 35149 35146 35143 50 35140 35138 35135 35132 35129 35127 35124 35122 35119 35117 60 35115 35112 35110 35108 35106 35104 35102 35100 35098 35096 70 35094 35092 35090 35088 35086 35084 35082 35080 35077 35075 80 35073 35070 35068 35066 35063 35061 35059 35057 35055 35053 90 35050 35048 35045 35041 35039 35036 35032 35028 35023 35015 100 34988
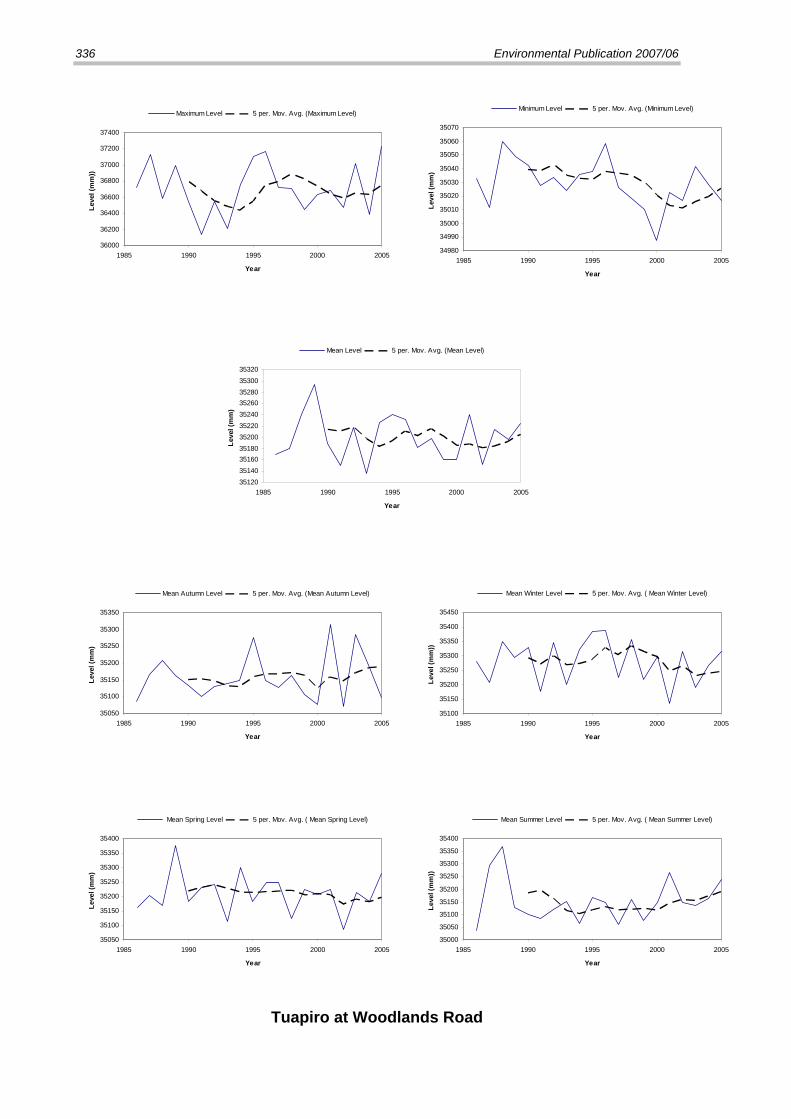
336 Environmental Publication 2007/06
36000
36200
36400
36600
36800
37000
37200
37400
1985 1990 1995 2000 2005
Year
Leve
l (m
m))
Maximum Level 5 per. Mov. Avg. (Maximum Level)
34980
34990
35000
35010
35020
35030
35040
35050
35060
35070
1985 1990 1995 2000 2005
Year
Leve
l (m
m)
Minimum Level 5 per. Mov. Avg. (Minimum Level)
3512035140351603518035200352203524035260352803530035320
1985 1990 1995 2000 2005
Year
Leve
l (m
m)
Mean Level 5 per. Mov. Avg. (Mean Level)
35050
35100
35150
35200
35250
35300
35350
1985 1990 1995 2000 2005
Year
Leve
l (m
m)
Mean Autumn Level 5 per. Mov. Avg. (Mean Autumn Level)
35100
35150
35200
35250
35300
35350
35400
35450
1985 1990 1995 2000 2005
Year
Leve
l (m
m))
Mean Winter Level 5 per. Mov. Avg. ( Mean Winter Level)
35050
35100
35150
35200
35250
35300
35350
35400
1985 1990 1995 2000 2005
Year
Leve
l (m
m)
Mean Spring Level 5 per. Mov. Avg. ( Mean Spring Level)
35000
35050
35100
35150
35200
35250
35300
35350
35400
1985 1990 1995 2000 2005
Year
Leve
l (m
m))
Mean Summer Level 5 per. Mov. Avg. ( Mean Summer Level)
Tuapiro at Woodlands Road
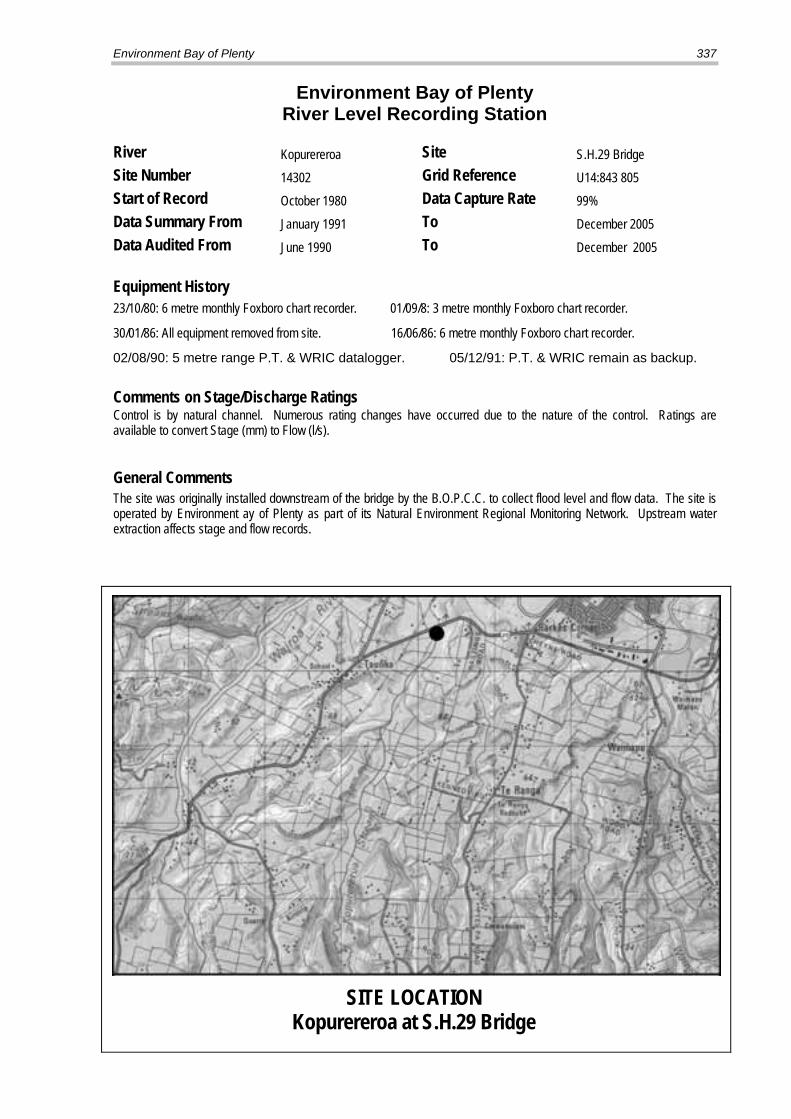
Environment Bay of Plenty 337
Environment Bay of Plenty River Level Recording Station
River Kopurereroa Site S.H.29 Bridge Site Number 14302 Grid Reference U14:843 805 Start of Record October 1980 Data Capture Rate 99% Data Summary From January 1991 To December 2005 Data Audited From June 1990 To December 2005 Equipment History 23/10/80: 6 metre monthly Foxboro chart recorder. 01/09/8: 3 metre monthly Foxboro chart recorder.
30/01/86: All equipment removed from site. 16/06/86: 6 metre monthly Foxboro chart recorder.
02/08/90: 5 metre range P.T. & WRIC datalogger. 05/12/91: P.T. & WRIC remain as backup. Comments on Stage/Discharge Ratings Control is by natural channel. Numerous rating changes have occurred due to the nature of the control. Ratings are available to convert Stage (mm) to Flow (l/s).
General Comments The site was originally installed downstream of the bridge by the B.O.P.C.C. to collect flood level and flow data. The site is operated by Environment ay of Plenty as part of its Natural Environment Regional Monitoring Network. Upstream water extraction affects stage and flow records.
SITE LOCATION Kopurereroa at S.H.29 Bridge

338 Environmental Publication 2007/06
Station Comments Kopurereroa River at S.H.29 Bridge. Site Number 14302, on River Number 14300. The local recording authority is Environment Bay of Plenty Site established on downstream side of S.H.29 Bridge. Site is affected by pumping extractions. Lambrecht rainfall recorder installed at Williams Road in September 1980 NZMS 260 reference U15:844 695 (later to be shifted along the road to NZMS 260 Reference U15:843 692). This rainfall site is called "Williams Road" and has a Meteorological Service number of B76812. 1/09/81 - Foxboro removed and a new Foxboro installed with a range of 3.0 meter, monthly. Stage resolution of 28mm per 1mm recorded. Time resolution of 281 minutes per 1mm recorded. 19/06/85 - Foxboro recorder and staff gauges moved to upstream side of S.H.29 Bridge 16/06/86 - 6 meter monthly Foxboro installed. Stage resolution of 57mm per 1mm recorded. Time resolution of 281 minutes per 1mm recorded 27/06/90 - Stage discharge ratings commence. 2/08/90 - Foxboro removed 900802 and a 5 metre range pressure transducer connected to a datalogger was installed. Stage resolution of 1mm and time resolution of 15 minutes. 5/12/91 - Site converted from pressure transducer with datalogger to a Leupold and Stevens. Stage resolution of 1mm and time resolution of 15 minutes. First tape commences 911205 at 150100. 26/12/91 - Missing record from 911226 at 021500 to 920110 at 115900 due to recorder failure. 8/08/03 - Major expansion of bridge crossing began some time between 20030808 at 151500 and 20030908 at 134500. Works altered profile of banks upstream and downstream of bridge. Top end of rating is unlikely to change as bridge abutments controls were not changed, however medium stage height discharge relationship are altered due to bank profile changes. 8/09/03 - Missing record 20030908 at 134500 to 20030910 at 120000 due to memory overwrite. 31/08/04 - Missing record 20040831 at 123000 to 20040831 at 130000 due to lose of power during equipment install. 16/09/04 - Missing record 20040916 134500 to 153000 due to installation of new pressure transducer.. 25/05/05 - Missing record 20051225 003000 to 20051228 211500 due to logger programme failure.
For additional information, please see recording authority.

Environment Bay of Plenty 339
Environment Bay of Plenty Hydrological Level Summary
Date Complied August 2006 Site Number 14302 Compiled by Glenn Ellery River Kopurereroa Station S.H.29 Bridge Metric Map Reference U14:843 805 Catchment Area (km2) 60 Period of Summary 1991 to 2005 Statistical Summary
Level (mm) Moturiki Datum Minimum Level 2802 Maximum Level 4993 Mean Annual Minimum Level 2876 Mean Annual Maximum Level 4430 Mean Level 3014 Mean Summer Level 2969 Median Level 2985 Mean Autumn Level 3031 Mean Winter Level 3040 Mean Spring Level 2980 Low Level Distribution Fit GEV Peak Level Distribution Fit GEV 7 day Low Level (Minimum) 2838 Peak Level (5 yr Return) 4789 7 Day Low Level (Mean Annual) 2869 Peak Level (10 yr Return) 4950 7 day Low Level (5 yr Return) 2848 Peak Level (20 yr Return) 5069 7 Day Low Level (10 yr Return) 2838
Annual Summaries Level (mm) Moturiki Datum Level (mm) Moturiki Datum Year Minimum Mean Maximum
Year Minimum Mean Maximum 1980 1993 2931 3009 3733 1981 1994 2873 2999 4993 1982 1995 2866 3006 4906 1983 1996 2935 3037 4735 1984 1997 2875 3032 4133 1985 1998 2822 3003 4798 1986 1999 2850 3009 4238 1987 2000 2856 2996 4437 1988 2001 2821 2974 4882 1989 2002 2804 2966 4221 1990 2003 2836 2976 4265 1991 3073 3167 3829 2004 2802 2941 4688 1992 2980 3097 4185 2005 2817 3005 4414
Level Distribution Level (mm) Moturiki Datum
Percentiles 0 1 2 3 4 5 6 7 8 9 0 4993 3729 3447 3319 3247 3209 3186 3170 3161 3155 10 3149 3142 3134 3123 3114 3106 3098 3090 3084 3077 20 3071 3066 3060 3055 3051 3047 3043 3038 3035 3031 30 3028 3026 3023 3020 3017 3015 3013 3011 3008 3006 40 3004 3002 3000 2998 2996 2994 2992 2990 2988 2986 50 2985 2983 2981 2979 2977 2976 2974 2972 2971 2969 60 2967 2966 2964 2962 2960 2959 2957 2955 2953 2951 70 2949 2947 2945 2942 2940 2937 2934 2931 2927 2924 80 2921 2918 2914 2911 2908 2905 2901 2898 2895 2892 90 2888 2885 2881 2878 2874 2870 2866 2860 2853 2844 100 2802

340 Environmental Publication 2007/06
3000
3500
4000
4500
5000
5500
1990 1992 1994 1996 1998 2000 2002 2004
Year
Leve
l (m
m))
Maximum Level 5 per. Mov. Avg. (Maximum Level)
2750
2800
2850
2900
2950
3000
3050
3100
1990 1992 1994 1996 1998 2000 2002 2004
Year
Leve
l (m
m)
Minimum Level 5 per. Mov. Avg. (Minimum Level)
2900
2950
3000
3050
3100
3150
3200
1990 1992 1994 1996 1998 2000 2002 2004
Year
Leve
l (m
m)
Mean Level 5 per. Mov. Avg. (Mean Level)
2900
2950
3000
3050
3100
3150
3200
1990 1992 1994 1996 1998 2000 2002 2004
Year
Leve
l (m
m)
Mean Autumn Level 5 per. Mov. Avg. (Mean Autumn Level)
2850
2900
2950
3000
3050
3100
3150
3200
1990 1992 1994 1996 1998 2000 2002 2004
Year
Leve
l (m
m)
Mean Winter Level 5 per. Mov. Avg. (Mean Winter Level)
2850
2900
2950
3000
3050
3100
3150
3200
1990 1992 1994 1996 1998 2000 2002 2004
Year
Leve
l (m
m)
Mean Spring Level 5 per. Mov. Avg. (Mean Spring Level)
2850
2900
2950
3000
3050
3100
3150
1990 1992 1994 1996 1998 2000 2002 2004
Year
Leve
l (m
m)
Mean Summer Level 5 per. Mov. Avg. (Mean Summer Level)
Kopurereroa at S.H.29 Bridge

Environment Bay of Plenty 341
Environment Bay of Plenty River Level Recording Station
River Kaituna Site Fords Cut Site Number 14618 Grid Reference V14:108 773 Start of Record August 1955 Data Capture Rate 86% Data Summary From January 1981 To December 2005 Data Audited From March 1983 To December 2005 Equipment History
03/08/80: 3 metre range monthly Foxboro chart recorder. 06/07/95: Float with L&S digital recorder. 23/04/01: IQuest logger with Kainga encoder. Comments on Stage/Discharge Ratings Ratings are available to convert Stage (mm) to Reduced Level (mm) in Moturiki Datum. General Comments Records from 1955 exist as part of the lower Kaituna river flood protection scheme investigations. These early records are of unknown quality and therefore have not been processed.
SITE LOCATION Kaituna at Fords Cut

342 Environmental Publication 2007/06
Station Comments Kaituna River at Fords Cut. Site Number 14618, on River Number 146000. The local recording authority is Environment Bay of Plenty Discharges are not measured at this site. Site installed 07/08/80 as part of Kaituna River major scheme flood protection investigations. Staff gauges not always set to zero Moturiki Datum so linear ratings have been provided to make this transformation. 06/08/80 - Weekly Foxboro was changed to monthly Foxboro. 28/07/89 - Foxboro re-installed at floodgates, as was a 3 metre staff-gauge. 23/06/95 - P.V.C. cylinder and aluminium recorder house were installed. Level was taken for underside of recorder house. 06/07/95 - L&S installed at this site. First punchout at 134500. Level was again taken for underside of recorder house, no change. Recorder has a time resolution of 15 minutes and a stage resolution of 1mm. 12/07/95 - Internal plumbob was installed and levelled; staff gauge was shifted and re-levelled. 50mm diameter hole for intake was reduced to 12mm at 130000 to stop surges. Foxboro, diaphragm and house were removed. 31/12/95 - Numerous periods of missing record and synthetic data occur throughout the entire data set. 23/04/01 - IQuest logger installed.
For additional information, please see recording authority.
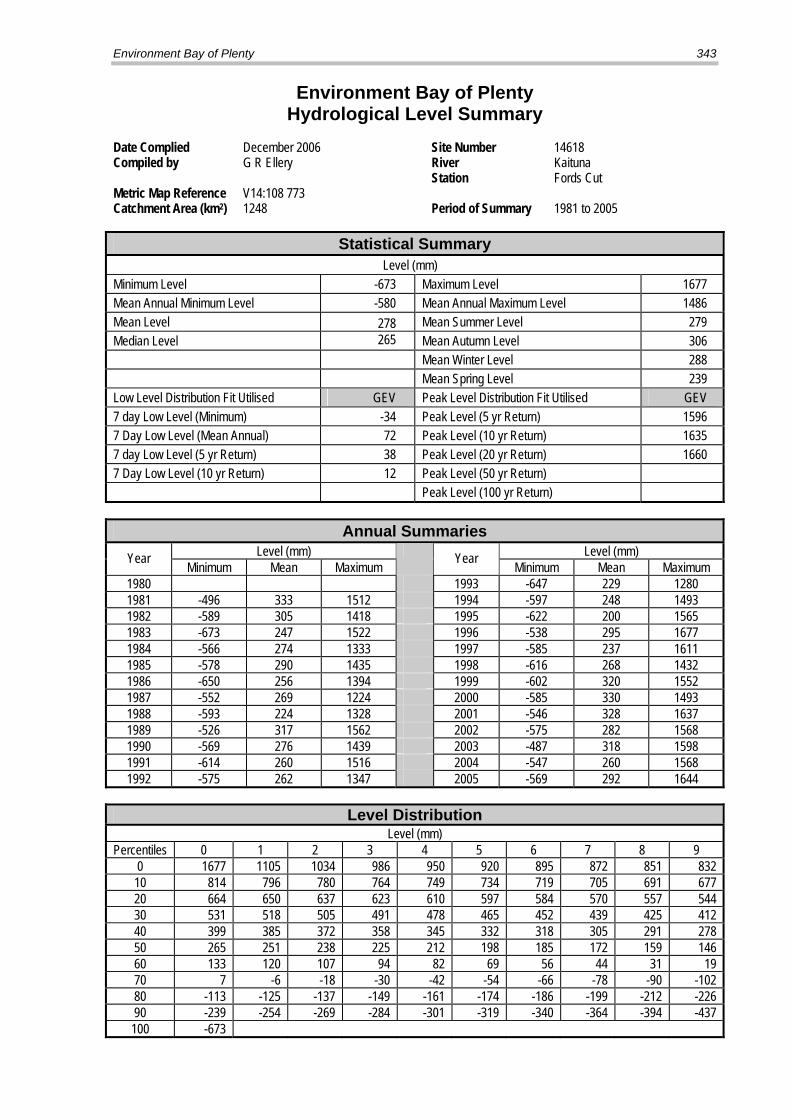
Environment Bay of Plenty 343
Environment Bay of Plenty Hydrological Level Summary
Date Complied December 2006 Site Number 14618 Compiled by G R Ellery River Kaituna Station Fords Cut Metric Map Reference V14:108 773 Catchment Area (km2) 1248 Period of Summary 1981 to 2005 Statistical Summary
Level (mm) Minimum Level -673 Maximum Level 1677 Mean Annual Minimum Level -580 Mean Annual Maximum Level 1486 Mean Level 278 Mean Summer Level 279 Median Level 265 Mean Autumn Level 306 Mean Winter Level 288 Mean Spring Level 239 Low Level Distribution Fit Utilised GEV Peak Level Distribution Fit Utilised GEV 7 day Low Level (Minimum) -34 Peak Level (5 yr Return) 1596 7 Day Low Level (Mean Annual) 72 Peak Level (10 yr Return) 1635 7 day Low Level (5 yr Return) 38 Peak Level (20 yr Return) 1660 7 Day Low Level (10 yr Return) 12 Peak Level (50 yr Return) Peak Level (100 yr Return)
Annual Summaries Level (mm) Level (mm) Year Minimum Mean Maximum
Year Minimum Mean Maximum 1980 1993 -647 229 1280 1981 -496 333 1512 1994 -597 248 1493 1982 -589 305 1418 1995 -622 200 1565 1983 -673 247 1522 1996 -538 295 1677 1984 -566 274 1333 1997 -585 237 1611 1985 -578 290 1435 1998 -616 268 1432 1986 -650 256 1394 1999 -602 320 1552 1987 -552 269 1224 2000 -585 330 1493 1988 -593 224 1328 2001 -546 328 1637 1989 -526 317 1562 2002 -575 282 1568 1990 -569 276 1439 2003 -487 318 1598 1991 -614 260 1516 2004 -547 260 1568 1992 -575 262 1347 2005 -569 292 1644
Level Distribution
Level (mm) Percentiles 0 1 2 3 4 5 6 7 8 9
0 1677 1105 1034 986 950 920 895 872 851 832 10 814 796 780 764 749 734 719 705 691 677 20 664 650 637 623 610 597 584 570 557 544 30 531 518 505 491 478 465 452 439 425 412 40 399 385 372 358 345 332 318 305 291 278 50 265 251 238 225 212 198 185 172 159 146 60 133 120 107 94 82 69 56 44 31 19 70 7 -6 -18 -30 -42 -54 -66 -78 -90 -102 80 -113 -125 -137 -149 -161 -174 -186 -199 -212 -226 90 -239 -254 -269 -284 -301 -319 -340 -364 -394 -437 100 -673

344 Environmental Publication 2007/06
800900
100011001200130014001500160017001800
1980 1985 1990 1995 2000 2005
Year
Leve
l (m
m)
Maximum Level 5 per. Mov. Avg. (Maximum Level)
-700
-650
-600
-550
-500
-450
-400
1980 1985 1990 1995 2000 2005
Year
Leve
l (m
m)
Minimum Level 5 per. Mov. Avg. (Minimum Level)
100
150
200
250
300
350
400
1980 1985 1990 1995 2000 2005
Year
Leve
l (m
m)
Mean Level 5 per. Mov. Avg. (Mean Level)
050
100150200250300350400450
1980 1985 1990 1995 2000 2005
Year
Leve
l (m
m)
Mean Autumn Level 5 per. Mov. Avg. (Mean Autumn Level)
050
100150200250300350400450
1980 1985 1990 1995 2000 2005
Year
Leve
l (m
m)
Mean Winter Level 5 per. Mov. Avg. (Mean Winter Level)
0
50
100
150
200
250
300
350
400
1980 1985 1990 1995 2000 2005
Year
Leve
l (m
m)
Mean Spring Level 5 per. Mov. Avg. (Mean Spring Level)
050
100150200250300350400450
1980 1985 1990 1995 2000 2005
Year
Leve
l (m
m)
Mean Summer Level 5 per. Mov. Avg. (Mean Summer Level)
Kaituna at Fords Cut

Environment Bay of Plenty 345
Environment Bay of Plenty River Level Recording Station
River Kaituna Site Clarkes Site Number 1114607 Grid Reference U14: 055 779 Start of Record April 1980 Data Capture Rate 95% Data Summary From January 1981 To December 2005 Data Audited From January 1981 To December 2005 Equipment History 24/04/80: 5 metre range Monthly Foxboro chart recorder. 04/09/95: Pressure transducer and WRIC datalogger. 21/02/00: Pressure transducer and Campbell Scientific CR510. Comments on Stage/Discharge Ratings Ratings available to convert stage (mm) to Level (mm).
General Comments Site was installed as part of the lower Kaituna river flood protection scheme investigation.
SITE LOCATION Kaituna at Clarkes

346 Environmental Publication 2007/06
Station Comments Kaituna River at Clarkes. Site Number 1114607, on River Number 146000. The local recording authority is Environment Bay of Plenty. The site is situated 6.85 kilometres from the mouth at NZMS 260 Reference U14: 055 779 and has a natural control. Site installed 800424 as part of Kaituna River major scheme flood protection investigations. Staff gauges not always set to zero Moturiki Datum so linear ratings have been provided to make this transformation. Discharges are not measured at this site. Level is controlled to some degree by the Okere Falls control gates at Lake Rotoiti. Large changes in level and flow may occur when these gates are repositioned. Site is subject to tidal fluctuations. 24/04/80 - 5 metre range 31 day chart Foxboro installed. Recorder has a time resolution of 281 minutes per 1mm recorded and a stage resolution of 47mm per 1mm recorded. 18/11/83 - Cut at Fords opened. Increased tidal fluctuation due to diversion. 01/11/89 - Site transferred to Environment Bay of Plenty 10/07/91 - 5 metre range Foxboro was replaced with a 6 metre range Foxboro. Staff gauges were also lowered by 1 metre and levelled. 21/12/92 - Data from 921221 084000 to 930119 085400 has a time error of 1.45 days. This data should be used with caution. The stages are correct. 04/09/95 - Foxboro was removed and a WRIC datalogger was installed along with a pressure transducer. Recorder has a time resolution of 15 minutes and a stage resolution of 10mm. 31/12/95 - Numerous periods of missing record and synthetic data occur throughout the entire data set. 21/02/00 - Campbell Scientific CR510 installed. Recording interval 15 minutes. Due to site being removed and re-installed 400m upstream. Site moved to avoid large build-up of sand and weed along embankment, which has gradually suppressed the true range of the pressure transducer.
For additional information, please see recording authority.

Environment Bay of Plenty 347
Environment Bay of Plenty Hydrological Level Summary
Date Complied October 2006 Site Number 1114607 Compiled by G R Ellery River Kaituna Station Clarkes Metric Map Reference U14: 055 779 Catchment Area (km2) 1233 Period of Summary 1981 to 2005 Statistical Summary
Level (mm) Minimum Level -444 Maximum Level 2851 Mean Annual Minimum Level -125 Mean Annual Maximum Level 1849 Mean Level 558 Mean Summer Level 533 Median Level 553 Mean Autumn Level 593 Mean Winter Level 653 Mean Spring Level 563 Low Level Distribution Fit Utilised Gumbel Peak Level Distribution Fit Utilised Gumbel 7 day Low Level (Minimum) 38 Peak Level (5 yr Return) 2122 7 Day Low Level (Mean Annual) 249 Peak Level (10 yr Return) 2344 7 day Low Level (5 yr Return) 155 Peak Level (20 yr Return) 2556 7 Day Low Level (10 yr Return) 103 Peak Level (50 yr Return) 2832 Peak Level (100 yr Return) 3038
Annual Summaries Level (mm) Level (mm) Year Minimum Mean Maximum
Year Minimum Mean Maximum 1980 1993 -266 370 1350 1981 665 1121 2371 1994 -321 368 1474 1982 408 955 1965 1995 -330 420 2028 1983 40 795 2436 1996 -260 450 1834 1984 -444 470 1538 1997 -288 420 1650 1985 -190 518 1606 1998 -295 474 2105 1986 -171 496 1573 1999 -291 490 2851 1987 -284 433 1596 2000 -75 542 1655 1988 -136 475 1484 2001 -200 591 2113 1989 -75 626 1692 2002 -53 554 1768 1990 -105 586 2148 2003 -6 589 1761 1991 -274 457 1557 2004 -20 628 2249 1992 -254 411 1468 2005 89 672 1959
Level Distribution
Level (mm) Percentiles 0 1 2 3 4 5 6 7 8 9
0 2851 1400 1277 1214 1170 1136 1108 1083 1060 1040 10 1021 1004 988 972 958 944 930 917 904 892 20 880 868 857 845 834 823 812 801 790 779 30 768 757 746 736 725 714 704 693 682 671 40 661 650 639 628 617 607 596 585 574 564 50 553 542 531 520 509 499 488 477 466 455 60 445 434 423 412 401 390 378 367 356 345 70 334 323 311 300 289 278 266 255 243 232 80 220 208 196 183 171 158 145 131 117 102 90 87 71 54 35 15 -8 -33 -62 -99 -145 100 -444

348 Environmental Publication 2007/06
0
500
1000
1500
2000
2500
3000
1980 1985 1990 1995 2000 2005
Year
Leve
l (m
m)
Maximum Level 5 per. Mov. Avg. (Maximum Level)
-600
-400
-200
0
200
400
600
800
1980 1985 1990 1995 2000 2005
Year
Leve
l (m
m)
Minimum Level 5 per. Mov. Avg. (Minimum Level)
0
200
400
600
800
1000
1200
1980 1985 1990 1995 2000 2005
Year
Leve
l (m
m)
Mean Level 5 per. Mov. Avg. (Mean Level)
0
200
400
600
800
1000
1200
1980 1985 1990 1995 2000 2005
Year
Leve
l (m
m)
Mean Autumn Level 5 per. Mov. Avg. (Mean Autumn Level)
0
200
400
600
800
1000
1200
1400
1980 1985 1990 1995 2000 2005
Year
Leve
l (m
m)
Mean Winter Level 5 per. Mov. Avg. (Mean Winter Level)
0
200
400
600
800
1000
1200
1980 1985 1990 1995 2000 2005
Year
Leve
l (m
m)
Mean Spring Level 5 per. Mov. Avg. (Mean Spring Level)
0
200
400
600
800
1000
1200
1980 1985 1990 1995 2000 2005
Year
Leve
l (m
m)
Mean Summer Level 5 per. Mov. Avg. (Mean Summer Level)
Kaituna at Clarkes

Environment Bay of Plenty 349
Environment Bay of Plenty River Flow Recording Station
River Raparapahoe Site Above Drop Structure Site Number 1114651 Grid Reference U14:017 766 Start of Record March 1992 Data Capture Rate 96% Data Summary From January 1993 To December 2005 Data Audited From March 1992 To December 2005 Equipment History 23/09/91 6 metre range monthly Foxboro. Stage resolution 57mm, time resolution of 281 minutes. 15/08/95 Datalogger with 5 metre pressure transducer installed. Stage resolution 5mm, time resolution 15 minutes.
Comments on Stage/Discharge Ratings Control is by downstream drop structure. Ratings available to convert stage (mm) to flow (l/s).
General Comments Site is operated by Environment Bay of Plenty and is part of the Kaituna River scheme flood protection investigations
SITE LOCATION Raparapahoe at U/S Drop Structure

350 Environmental Publication 2007/06
Station Comments Raparapahoe at Drop Structure. Site Number 1114651, on River Number 146000. The site is situated 16.4 kilometres from mouth and replaces Raparapahoe at Manoeka Road Bridge (14630). The local recording authority is Environment Bay of Plenty. Drop structure was installed by Environment Bay of Plenty on 22/11/88. Top end rating based upon combination of flow gauging measurement along with output from Mike11modelled flow over drop structure. 23/09/91 - Site erected and 6 metre monthly Foxboro recorder installed. 15/08/95 - Foxboro recorder removed. Data logger with a time resolution of 15 minutes and a 5 metre pressure transducer with a stage resolution of 5mm installed. 18/10/91 - Missing record from 911018 at 090000 to 911120 at 093000 due to faulty recorder. 09/05/94 - Missing record 940509 at 122900 to 940624 at 103600 due to faulty recorder 16/07/94 - Missing record from 940716 at 80900 to 940811 at 122800 due to faulty recorder 18/09/94 - Missing record from 940918 at 120000 to 941012 at 132600 due to faulty recorder 22/11/94 - Missing record from 941122 at 145000 to 941213 at 134500 due to recorder malfunction. 24/12/94 - Missing record from 941224 at 050000 to 950110 at 151500 due to recorder malfunction. 29/06/97 - Missing record from 970629 at 051500 to 970711 at 120000 due to power supply failure. 08/02/98 - Missing record from 980208 at 121500 to 980217 at 140000 due to transducer being buried in silt. 13/07/98 - Missing record from 980713 at 203000 to 980717 at 091500 due to low battery. 13/07/98 - Data from 980713 at 203000 to 1000204 at 094500 affected by what appears to be a fault with the pressure transducer. Data should be used with caution. 04/06/99 - Missing record from 990604 at 140000 to 990609 at 134500 due to low battery. 18/02/00 - Missing record from 20000218 at 170000 to 20000229 at 113000 due to ISD pressure transducer being repaired. 08/05/02 - Missing record from 1020508 100000 to 1020513 114500. Unknown reason but gap coincides with 2002 annual inspection, may have accidently left power off. 19/06/02 - Missing record from 20020619 at 133000 to 20020703 at 101500 due to low battery. 04/08/04 - Missing record from 20040804 123000 to 20040807 154500. Gap coincides with inspection may have knocked off power lead. 20/07/04 - Missing record from 20050720 130000 to 20050722 130000 due to logger failure.
For additional information, please see recording authority.

Environment Bay of Plenty 351
Environment Bay of Plenty Hydrological Flow Summary
Date Complied May 2006 Site Number 1114651 Compiled by Glenn Ellery River Raparapahoe Station Above Drop Structure Metric Map Reference U14:017 766 Catchment Area (km2) 46.36 Period of Summary 1992 to 2005
Statistical Summary Flow (l/s)
Minimum Flow 249 Maximum Flow 77163 Mean Annual Minimum Flow 577 Mean Annual Maximum Flow 42440 Mean Flow 1852 Mean Summer Flow 1515 Median Flow 1284 Mean Autumn Flow 1706 Mean Specific Flow (/km2) 40 Mean Winter Flow 2350 Mean Spring Flow 1904 Low Flow Distribution Fit GEV Peak Flow Distribution Fit Gumbel GEV 7 day Low Flow (Minimum) 399 Peak Flow (5 yr Return) 57400 59800 7 Day Low Flow (Mean Annual) 674 Peak Flow (10 yr Return) 69500 69000 7 day Low Flow (5 yr Return) 574 Peak Flow (20 yr Return) 81100 77200 7 Day Low Flow (10 yr Return) 498 Peak Flow (50 yr Return) Peak Flow (100 yr Return)
Annual Summaries Flow (l/s) Flow (l/s) Year
Minimum Mean Maximum Year
Minimum Mean Maximum 1980 1993 381 1117 9880 1981 1994 451 1432 33544 1982 1995 249 2260 59782 1983 1996 637 2020 45546 1984 1997 588 1586 22066 1985 1998 648 2080 42315 1986 1999 477 2212 73042 1987 2000 662 1981 47474 1988 2001 766 2556 77163 1989 2002 671 1442 23130 1990 2003 667 1498 46302 1991 2004 716 2005 38161 1992 352 1535 25223 2005 810 2056 50537
Flow Distribution Flow (l/s)
Percentiles 0 1 2 3 4 5 6 7 8 9 0 77163 11477 7616 6086 5170 4539 4103 3756 3494 3272 10 3101 2951 2809 2683 2572 2473 2386 2307 2238 2174 20 2112 2057 2008 1963 1925 1880 1840 1803 1769 1735 30 1706 1675 1649 1620 1596 1570 1544 1521 1501 1480 40 1461 1441 1420 1401 1383 1367 1350 1331 1315 1299 50 1284 1268 1256 1240 1227 1213 1200 1186 1174 1160 60 1147 1134 1123 1109 1098 1085 1074 1061 1050 1037 70 1024 1012 999 987 975 963 953 943 933 922 80 909 898 887 873 861 848 835 821 807 793 90 779 764 750 736 721 703 682 645 598 530 100 249

352 Environmental Publication 2007/06
0
10000
20000
30000
40000
50000
60000
70000
80000
90000
1990 1992 1994 1996 1998 2000 2002 2004
Year
Flow
(l/s
)
Maximum Flow 5 per. Mov. Avg. (Maximum Flow )
0
100
200
300
400
500
600
700
800
900
1990 1992 1994 1996 1998 2000 2002 2004
Year
Flow
(l/s
)
Minimum Flow 5 per. Mov. Avg. (Minimum Flow )
0
500
1000
1500
2000
2500
3000
1990 1992 1994 1996 1998 2000 2002 2004
Year
Flow
(l/s
)
Mean Flow 5 per. Mov. Avg. (Mean Flow )
0
500
1000
1500
2000
2500
3000
3500
4000
1990 1992 1994 1996 1998 2000 2002 2004
Year
Flow
(l/s
)
Mean Autumn Flow 5 per. Mov. Avg. (Mean Autumn Flow )
0
500
1000
1500
2000
2500
3000
3500
4000
1990 1992 1994 1996 1998 2000 2002 2004
Year
Flow
(l/s
)
Mean Winter Flow 5 per. Mov. Avg. (Mean Winter Flow )
0
500
1000
1500
2000
2500
3000
3500
4000
1990 1992 1994 1996 1998 2000 2002 2004
Year
Flow
(l/s
)
Mean Spring Flow 5 per. Mov. Avg. (Mean Spring Flow )
0
500
1000
1500
2000
2500
3000
3500
1990 1992 1994 1996 1998 2000 2002 2004
Year
Flow
(l/s
)
Mean Summer Flow 5 per. Mov. Avg. (Mean Summer Flow )
Raparapahoe at Above Drop Structure

Environment Bay of Plenty 353
Environment Bay of Plenty River Level Recording Station
River Mangorewa Site Saunders Site Number 13309 Grid Reference U15: 047 632 Start of Record July 1967 Data Capture Rate 99% Data Summary From January 1968 To December 2005 Data Audited From May 1968 To December 2005 Equipment History Float/counterweight system with shaft encoder. 1mm resolution. Comments on Stage/Discharge Ratings Control is by stable natural channel. Ratings available to convert stage (mm) to flow (l/s).
General Comments Site was originally operated by the Hamilton Hydrological Survey until December 1981. Site is now operated by Environment Bay of Plenty as part of its Natural Environmental Monitoring Network.
SITE LOCATION Mangorewa at Saunders

354 Environmental Publication 2007/06
Station Comments Mangorewa River at Saunders Farm. Site Number 14628, on River Number 146050. Local recording authority is Environment Bay of Plenty. Sediment concentration has also been measured at this site. The site is situated 9.2 kilometres to confluence of the Kaituna River. The control is natural. 09/12/81 - Site handed over to B.O.P.C.C. on 811210. 30/04/91 - Site damaged by lightning. Recorder stopped causing missing record. Gap is from 910430 at 164501 to 910509 at 144600. 06/02/96 - Missing record from 960216 061500 to 960208 154500 due to Aquitel failure. 06/01/97 - Missing record from 970106 at 214500 to 970110 at 101500 due to faulty Leopold and Stevens recorder. 10/08/98 - Missing record from 980810 at 151500 to 980813 at 113000 due to Aquitel failure. 31/12/95 - Missing record from this site has been replaced with synthetic data derived from adjacent site Waiari at Muttons (14627) and rainfall records. 01/05/99 – This event was the highest recorded since the site was installed in 1967. Historical top end rating extrapolation has been used due to the lack of high stage gaugings (highest gauging is at 4125mm. Investigation of bed slope and cross-section proved inconclusive at defining the top end of the rating. However it is noted that the cross-section is rectangular in shape with vertical walls approximately 12 metres high, the upstream cross section is straight and the bed slope quite high. Discussions with NIWA, Rotorua staff also supported that in higher flood events velocities are high. Use derived peak flow with caution. 07/09/00 - Missing record from 20000907 at 0444500 to 20000908 at 141500 due to Aquitel failure. 12/05/91 - Missing record from 20010512 at 93000 to 20010514 at 083000 due to Aquitel failure. 19/12/01 - Missing record from 20011219 at 53000 to 20011220 at 101500 due to Aquitel failure. 20/12/01 - Missing record from 20011220 at 104500 to 20020104 at 091500 due to Aquitel failure. 25/03/00 - Gaps affect the data set from 20050325 101500 to 20050428 104500 due to a lightening strike. 1: gap from 20050325 101500 to 20050404 123000 of 10.09 days 2: gap from 20050404 123000 to 20050413 143000 of 9.08 days 3: gap from 20050413 143000 to 20050418 130000 of 4.94 days 4: gap from 20050418 130000 to 20050418 161500 of 3.25 hours 5: gap from 20050418 161500 to 20050428 104500 of 9.77 days 6: gap from 20050518 124500 to 20050519 113000 of 22.75 hours 18/05/2005 - Missing record from 20050518 130000 to 20050519 113000 due to iQuest logger failure. 25/01/2006 - Missing record from 20060125 at 180000 to 20060125 at 114500 due to power failure.

Environment Bay of Plenty 355
Environment Bay of Plenty Hydrological Flow Summary
Date Complied August 2006 Site Number 14628 Compiled by Glenn Ellery River Mangorewa Station Saunders Metric Map Reference U15:047 632 Catchment Area (km2) 178.7 Period of Summary 1968 to 2005 Statistical Summary
Level (mm) Moturiki Datum Minimum Level 15872 Maximum Level 26507 Mean Annual Minimum Level 15989 Mean Annual Maximum Level 19630 Mean Level 16086 Mean Summer Level 16063 Median Level 16038 Mean Autumn Level 16071 Mean Winter Level 16122 Mean Spring Level 16088 Low Level Distribution Fit Utilised Gumbel Peak Level Distribution Fit Utilised GEV 7 day Low Level (Minimum) 15873 Peak Level (5 yr Return) 20688 7 Day Low Level (Mean Annual) 15966 Peak Level (10 yr Return) 21713 7 day Low Level (5 yr Return) 15926 Peak Level (20 yr Return) 22769 7 Day Low Level (10 yr Return) 15905 Peak Level (50 yr Return) 24251
Annual Summaries Level (mm) Moturiki Datum Level (mm) Moturiki Datum Year Minimum Mean Maximum
Year Minimum Mean Maximum 1980 16018 16096 17453 1993 15901 15950 18938 1981 15994 16080 20433 1994 15872 15945 18657 1982 15998 16057 18360 1995 15872 16013 20780 1983 15934 16040 20833 1996 15982 16057 19412 1984 15944 16005 18910 1997 15931 16022 18137 1985 15957 16054 19226 1998 15912 16019 20545 1986 16028 16096 21918 1999 15947 16119 26507 1987 15967 16037 18659 2000 16011 16084 18581 1988 15926 16031 21354 2001 15970 16058 20041 1989 16010 16135 18073 2002 15944 16006 19548 1990 16026 16134 21719 2003 15907 15981 18005 1991 15969 16048 17277 2004 15902 16025 19900 1992 15934 16009 18400 2005 15985 16108 18736
Level Distribution Level (mm) Moturiki Datum
Percentiles 0 1 2 3 4 5 6 7 8 9 0 26507 16964 16632 16478 16397 16345 16308 16280 16262 16250 10 16241 16232 16221 16213 16206 16199 16190 16182 16172 16163 20 16154 16147 16139 16133 16126 16120 16113 16107 16102 16097 30 16093 16090 16086 16083 16079 16076 16073 16071 16068 16065 40 16063 16061 16058 16055 16053 16050 16047 16045 16043 16040 50 16038 16036 16034 16031 16030 16028 16026 16024 16022 16020 60 16018 16016 16014 16012 16010 16008 16006 16005 16003 16001 70 15999 15997 15994 15992 15990 15987 15985 15982 15979 15977 80 15974 15972 15969 15967 15965 15962 15960 15957 15955 15952 90 15949 15945 15940 15934 15929 15925 15919 15910 15903 15889 100 15872

356 Environmental Publication 2007/06
15000
17000
19000
21000
23000
25000
27000
29000
1965 1970 1975 1980 1985 1990 1995 2000 2005
Year
Leve
l (m
m)
Maximum Level 5 per. Mov. Avg. (Maximum Level)
15850
15900
15950
16000
16050
16100
16150
16200
16250
1965 1970 1975 1980 1985 1990 1995 2000 2005
Year
Leve
l (m
m)
Minimum Level 5 per. Mov. Avg. (Minimum Level)
15900
15950
16000
16050
16100
16150
16200
16250
16300
16350
1965 1970 1975 1980 1985 1990 1995 2000 2005
Year
Leve
l (m
m)
Mean Level 5 per. Mov. Avg. (Mean Level)
1590015950160001605016100161501620016250163001635016400
1965 1970 1975 1980 1985 1990 1995 2000 2005
Year
Leve
l (m
m)
M ean Autumn Level 5 per. M ov. Avg. (M ean Autumn Level)
1590015950160001605016100161501620016250163001635016400
1965 1970 1975 1980 1985 1990 1995 2000 2005
Year
Leve
l (m
m)
Mean Winter Level 5 per. Mov. Avg. ( Mean Winter Level)
1590015950160001605016100161501620016250163001635016400
1965 1970 1975 1980 1985 1990 1995 2000 2005
Year
Leve
l (m
m)
Mean Spring Level 5 per. Mov. Avg. ( Mean Spring Level)
1585015900159501600016050161001615016200162501630016350
1965 1970 1975 1980 1985 1990 1995 2000 2005
Year
Flow
(l/s
)
Mean Summer Level 5 per. Mov. Avg. ( Mean Summer Level)
Mangorewa at Saunders

Environment Bay of Plenty 357
Environment Bay of Plenty River Level Recording Station
River Kaituna Site Te Matai Site Number 14614 Grid Reference U14:063 727 Start of Record May 1955 Data Capture Rate 97% Data Summary From January 1968 To December 2005 Data Audited From January 1998 To December 2005 Equipment History
23/01/55: Staff gauge and chart recorder. 12/08/65: Float with F&P digital recorder. 06/08/86: 3 metre range Foxboro. 20/03/90: P.T. and Aquitel Remote. 01/11/99: IQuest logger. Comments on Stage/Discharge Ratings Control is by stable natural channel. Ratings available to convert stage (mm) to flow (l/s).
General Comments This site recorded flow from May 1955 to January 1982 for the Hamilton Hydrological Survey. The site was transferred to the B.O.P.C.B. in January 1982, from this time tidal influences occurred as a result of the Kaituna flood control scheme. Site is now operated by Environment Bay of Plenty for flood monitoring purposes; flow discharge ratings for lower stages are no longer derived. Users of the statistics presented should be aware of the change in level regime in the mid 80’s due to the effect of the Kaituna flood control scheme.
SITE LOCATION
Kaituna at Te Matai
358 Environmental Publication 2007/06
Station Comments Kaituna at Te Matai. Site Number 14614, on River Number 146000. The local recording authority is Environment Bay of Plenty. The site is situated 14.5 kilometres from the river mouth. Sediment concentration is also measured at the site. The gates at the outlet of Lake Rotoiti at Okere Falls act as an upstream control. Large changes in stage and flow occur when the settings on these gates are changed. 11/08/65 - Chart recorder replaced with F&P recorder on 650812. Recorder has a stage resolution of 1mm and a time resolution of 15 minutes. 16/08/67 - Synthetic record from 670816 to 670911 and from 680902 to 681001. Record derived from correlation with Waiari at Muttons. This period should not be used for flood analysis, daily mean discharges only. 02/07/68 - Synthetic record from 680702 to 681001. Record derived from correlation with Waiari at Muttons. This period should not be used for flood analysis, daily mean discharges only. 23/12/69 - Synthetic data from 691223 to 691231 16/09/72 - Synthetic data from 720916 to 720922. Record derived from correlation with Waiari at Muttons and rainfall data. 09/05/73 - Synthetic data from 730509 to 730511 04/03/79 - From 790304 at 163000 to 790305 104500 a straight line recession has been assumed as recorder was tampered with. No rain fell during this period. 26/08/80 - Missing record from 800826 134000 to 800905 100000 due to recorder malfunction. For an indication of flow during this period, refer to Mangorewa at Saunders (14628) and Kaituna at Lake Rotoiti outlet (14601). 120.9 mm of rain was recorded in Rotorua. 29/11/81 - Missing record from 811129 134500 to 811210 142700 due to recorder failure. 114.5mm of rain was recorded at Whakarewarewa during this period, with a maximum fall of 41.7mm on 811129. 07/01/82 - Site handed over to Bay of Plenty Catchment Board on 820107. 02/09/82 - Due to recorder failure there is synthetic data from 820902. This period, a gradual recession is considered adequate. F&P recorder removed from site due to water level dropping below the intake pipes. This drop was due to engineering work undertaken down stream of recorder, (Kaituna River scheme). 06/08/86 - 3 metre range Foxboro installed. 03/02/92 - Site shows a large fall in flow with minimum being reached at 240000. This is caused by the control gates at Okere Falls being shut to constrict flow. 01/11/99 - iQuest logger installed.
For additional information, please see recording authority.

Environment Bay of Plenty 359
Environment Bay of Plenty Hydrological Level Summary
Date Complied August 2006 Site Number 14614 Compiled by Glenn Ellery River Kaituna Station Te Matai Metric Map Reference U14: 060 736 Catchment Area (km2) 948 Period of Summary 1968 to 2005 Statistical Summary
Level (mm) Moturiki Datum Minimum Level 699 Maximum Level 5530 Mean Annual Minimum Level 1731 Mean Annual Maximum Level 3962 Mean Level 2147 Mean Summer Level 2040 Median Level 1941 Mean Autumn Level 2078 Mean Winter Level 2231 Mean Spring Level 2187 Low Level Distribution Fit (using 1985-2005 data)
GEV Peak Level Distribution Fit (using 1985-2005 data)
Gumbel
7 day Low Level (Minimum) 965 Peak Level (5 yr Return) 3760 7 Day Low Level (Mean Annual) 1050 Peak Level (10 yr Return) 4230 7 day Low Level (5 yr Return) 977 Peak Level (20 yr Return) 4700 7 Day Low Level (10 yr Return) 934
Annual Summaries Level (mm) Moturiki Datum Level (mm) Moturiki Datum Year Minimum Mean Maximum
Year Minimum Mean Maximum 1980 2462 2828 4054 1993 699 1118 2249 1981 2565 2886 4890 1994 891 1223 2634 1982 2436 2760 4439 1995 910 1390 3623 1983 2295 2650 5386 1996 1159 1501 2923 1984 2347 2541 3921 1997 868 1400 2324 1985 1816 2296 3788 1998 906 1437 3848 1986 999 1379 3626 1999 1013 1444 5157 1987 827 1197 2639 2000 964 1399 2863 1988 885 1230 3019 2001 1033 1505 4268 1989 863 1491 2464 2002 883 1430 3004 1990 1128 1521 3672 2003 1019 1421 2996 1991 928 1329 2277 2004 1029 1511 3960 1992 898 1258 2533 2005 1203 1617 3278
Level Distribution Level (mm) Moturiki Datum
Percentiles 0 1 2 3 4 5 6 7 8 9 0 5530 3975 3740 3607 3513 3441 3393 3343 3292 3248 10 3213 3185 3160 3139 3119 3099 3078 3055 3033 3015 20 2995 2976 2958 2941 2925 2909 2893 2876 2859 2842 30 2826 2809 2792 2777 2760 2740 2719 2694 2668 2642 40 2611 2583 2552 2523 2485 2446 2389 2331 2222 2074 50 1941 1846 1775 1725 1685 1653 1626 1600 1578 1558 60 1539 1523 1507 1493 1479 1465 1453 1441 1429 1418 70 1407 1395 1383 1371 1360 1349 1339 1329 1318 1307 80 1296 1284 1273 1261 1249 1236 1222 1208 1193 1178 90 1163 1149 1134 1119 1102 1085 1065 1039 1004 957 100 699

360 Environmental Publication 2007/06
0
1000
2000
3000
4000
5000
6000
1965 1970 1975 1980 1985 1990 1995 2000 2005
Year
Leve
l (m
m)
Maximum Level 5 per. Mov. Avg. (Maximum Level)
0
500
1000
1500
2000
2500
3000
3500
1965 1970 1975 1980 1985 1990 1995 2000 2005
Year
Leve
l (m
m)
Minimum Level 5 per. Mov. Avg. (Minimum Level)
0
500
1000
1500
2000
2500
3000
3500
4000
1965 1970 1975 1980 1985 1990 1995 2000 2005
Year
Leve
l (m
m)
Mean Level 5 per. Mov. Avg. (Mean Level)
0
500
1000
1500
2000
2500
3000
3500
4000
1965 1970 1975 1980 1985 1990 1995 2000 2005
Year
Leve
l (m
m)
Mean Autumn Level 5 per. Mov. Avg. (Mean Autumn Level)
0
500
1000
1500
2000
2500
3000
3500
4000
1965 1970 1975 1980 1985 1990 1995 2000 2005
Year
Leve
l (m
m)
Mean Winter Level 5 per. Mov. Avg. (Mean Winter Level)
0
500
1000
1500
2000
2500
3000
3500
4000
1965 1970 1975 1980 1985 1990 1995 2000 2005
Year
L:ev
el (m
m)
MeanSpring Level 5 per. Mov. Avg. (MeanSpring Level)
0
500
1000
1500
2000
2500
3000
3500
4000
1965 1970 1975 1980 1985 1990 1995 2000 2005
Year
Leve
l (m
m)
Mean Summer Level 5 per. Mov. Avg. (Mean Summer Level)
Kaituna at Te Matai

Environment Bay of Plenty 361
Environment Bay of Plenty River Level Recording Station
River Ngongotaha Site S.H.5 Bridge Site Number 1014641 Grid Reference U15: 910 414 Start of Record May 1975 Data Capture Rate 99% Data Summary From January 1976 To December 2005 Data Audited From May 1975 To December 2005 Equipment History
20/05/75: Float with F&P digital recorder. 13/04/84: Float with L&S digital recorder. 13/12/99: 5 metre P.T. with Kainga logger. Comments on Stage/Discharge Ratings Control at this site is by natural bed. Ratings are available to convert Stage (mm) to Reduced Level (mm) in Moturiki datum. General Comments Site is operated by NIWA, Rotorua.
SITE LOCATION Ngongotaha at S.H.5 Bridge

362 Environmental Publication 2007/06
Station Comments Ngongotaha River at S.H. 5 Bridge. Site Number 1014641, on River Number 146074. Control is by natural bed. Approximately 800 metres upstream of recorder, Fish and Game New Zealand and DOC clean a fish trap causing small fluctuations in gauge height. Local recording authority is NIWA, Rotorua. 20/05/75 - Recorder installed on 750520 is a 10 metre range F&P digital recorder, having a stage ratio of 1mm of stage/mm recorded and a time punchout interval of 15 minutes. 13/04/84 - Recorder replaced on 840413 154500 by a 10 m range L&S digital recorder, having a stage ratio of 1 mm of stage/mm recorded and a time punchout interval of 15 minutes. 24/09/85 - Telemetry installed on 850925 09/11/87 - Growth of willow trees on the channel berm downstream of the recorder since 871109 051500 has caused the high stage range of rating curves to move to the left of previous curves. This reduction in channel efficiency is documented by photos taken since the site was first established. Some "crossing" of earlier curves has occurred. The lower end of these ratings remains similar in shape, but move up and down as a consequence of bed-level changes. 21/12/93 - The instability of the rating curve above 1.4 metre is caused by willow tree growth. 14/06/98 - Ratings have a change of shape due to the July 1998 floods. 13/12/99- Kainga logger and Greenspan transducer installed as backup recorder. Pressure transducer has a 5 metre range and 10mm resolution. Logger has a 15 minute interval.
For additional information, please see recording authority.

Environment Bay of Plenty 363
Environment Bay of Plenty Hydrological Level Summary
Date Complied December 2006 Site Number 1014641 Compiled by G R Ellery River Ngongotaha Station S.H.5 Bridge Metric Map Reference U15: 910 414 Catchment Area (km2) 73.3 Period of Summary 1976 to 2005 Statistical Summary
Level (mm) Minimum Level 285602 Maximum Level 290457 Mean Annual Minimum Level 285794 Mean Annual Maximum Level 288821 Mean Level 285940 Mean Summer Level 285923 Median Level 285915 Mean Autumn Level 285903 Mean Winter Level 285986 Mean Spring Level 285951 Low Level Distribution Fit Utilised GEV Peak Level Distribution Fit Utilised GEV 7 day Low Level (Minimum) 285608 Peak Level (5 yr Return) 289657 7 Day Low Level (Mean Annual) 285784 Peak Level (10 yr Return) 290037 7 day Low Level (5 yr Return) 285697 Peak Level (20 yr Return) 290319 7 Day Low Level (10 yr Return) 285638 Peak Level (50 yr Return) 290592 Peak Level (100 yr Return)
Annual Summaries Level (mm) Level (mm) Year Minimum Mean Maximum
Year Minimum Mean Maximum 1980 285762 285894 286995 1993 285790 285908 289009 1981 285756 285883 289066 1994 285760 285963 288298 1982 285658 285781 287643 1995 285882 286116 290012 1983 285602 285713 289134 1996 286050 286227 290241 1984 285607 285688 287296 1997 285937 286130 288533 1985 285612 285728 288208 1998 285879 286055 289758 1986 285643 285759 290457 1999 285890 285998 289086 1987 285635 285713 287091 2000 285840 285937 288386 1988 285626 285811 288358 2001 285835 285978 289716 1989 285902 286060 288079 2002 285869 285969 290095 1990 285897 286055 289498 2003 285855 285960 288306 1991 285801 285921 287939 2004 285882 286106 289370 1992 285806 285949 288390 2005 285978 286110 289692
Level Distribution
Level (mm) Percentiles 0 1 2 3 4 5 6 7 8 9
0 290457 286830 286516 286389 286311 286262 286226 286200 286179 286164 10 286150 286138 286128 286117 286108 286100 286091 286081 286073 286065 20 286057 286050 286042 286036 286028 286021 286015 286009 286003 285998 30 285992 285988 285983 285978 285973 285968 285964 285959 285955 285951 40 285948 285944 285941 285938 285934 285931 285927 285924 285921 285918 50 285915 285912 285909 285906 285903 285900 285897 285894 285891 285887 60 285884 285881 285878 285874 285870 285865 285860 285855 285849 285844 70 285839 285834 285829 285824 285818 285812 285805 285799 285793 285788 80 285781 285772 285763 285751 285736 285724 285716 285708 285701 285694 90 285688 285682 285676 285671 285666 285661 285654 285645 285637 285628 100 285602

364 Environmental Publication 2007/06
286500
287000
287500
288000
288500
289000
289500
290000
290500
291000
1975 1980 1985 1990 1995 2000 2005
Year
Leve
l (m
m)
Maximum Level 5 per. Mov. Avg. (Maximum Level)
285550285600285650285700285750285800285850285900285950286000286050286100
1975 1980 1985 1990 1995 2000 2005
Year
Leve
l (m
m)
Minimum Level 5 per. Mov. Avg. (Minimum Level)
285600
285700
285800
285900
286000
286100
286200
286300
1975 1980 1985 1990 1995 2000 2005
Year
Leve
l (m
m)
Mean Level 5 per. Mov. Avg. (Mean Level)
285600
285700
285800
285900
286000
286100
286200
286300
1975 1980 1985 1990 1995 2000 2005
Year
Leve
l (m
m)
Mean Autumn Level 5 per. Mov. Avg. (Mean Autumn Level)
285600
285700
285800
285900
286000
286100
286200
286300
286400
1975 1980 1985 1990 1995 2000 2005
Year
Leve
l (m
m)
Mean Winter Level 5 per. Mov. Avg. (Mean Winter Level)
285600
285700
285800
285900
286000
286100
286200
286300
1975 1980 1985 1990 1995 2000 2005
Year
Leve
l (m
m)
Mean Spring Level 5 per. Mov. Avg. (Mean Spring Level)
285600
285700
285800
285900
286000
286100
286200
286300
1975 1980 1985 1990 1995 2000 2005
Year
Leve
l (m
m)
Mean Summer Level 5 per. Mov. Avg. (Mean Summer Level)
Ngongotaha at S.H.5 Bridge

Environment Bay of Plenty 365
Environment Bay of Plenty River Level Recording Station
River Tarawera Site Awakaponga Site Number 15302 Grid Reference V15: 412 559 Start of Record May 1948 Data Capture Rate 99% Data Summary From January 1949 To December 2005 Data Audited From July 1992 To December 2005 Equipment History
01/01/36: Staff gauge installed. 16/12/48: Kent chart recorder. 23/08/65: F&P digital recorder. 24/08/82: Backup Foxboro chart recorder. 15/06/92: Backup Foxboro removed. 01/07/92: Float with L&S digital recorder. 15/09/99: IQuest logger and Handar. 15/03/05: Sutron pressure transducer replaces Handar. Comments on Stage/Discharge Ratings Site has a natural control with the riverbed comprising sandy pumice. Ratings are available to convert Stage (mm) to Flow (l/s).
General Comments Site was operated by NIWA, Rotorua until 01/07/92. Use of draglines in the clearing of the river channel appears to have affected stage data for periods throughout the record. Drawn off by the Pulp and Paper mills causes frequent rises and falls in the stage record. Site is operated by Environment Bay of Plenty as part of its Natural Environment Regional Monitoring Network. Users of the level data should be aware of the degrading bed since 1971.
SITE LOCATION Tarawera at Awakaponga

366 Environmental Publication 2007/06
Station Comments Tarawera River at Awakaponga. Site Number 15302, on River Number 153000. The local recording authority is Environment Bay of Plenty. The site is situated 6.5 kilometres from the mouth. The control is by natural channel. The catchment area includes landlocked lakes: Rotomahana, Rerewhakaaitu, Okataina, Okareka, Tikitapu, and Rotokakahi totalling 243km2. The lower reaches of the Tarawera River where the water level recorder is located has a sandy pumice bed, which causes cross section changes on an hour by hour basis. The bed load travelling past the recorder site varies from two to four hundred tonnes per day. The changes in bed level have a direct effect on water levels at the site with the station never registering smooth recession curves. This combined with water extraction by the pulp and paper mills upstream causes the stage fluctuations that are apparent when the filed data has three millimetres or less compression applied. Dragline and earthquake effects are best seen in the variation due to major changes in water level slope through the reach. 28/05/48 - Data from 480528 to 541217 was obtained from weekly staff gauge readings. Some flood events over this period had an increased frequency of readings to establish peak heights and define hydrograph shapes. The staff gauge used for these readings was situated downstream of the present recorder location at the Railway Bridge. 01/01/73 - From 730101 the increased water draw off by the pulp and paper mills causes frequent large, rapid, rises and falls in the stage record. These fluctuations are responsible for a lag between some external and internal readings observed at the site. The rating change beginning 730723 at 150500 is due to a gradual increase in cross sectional area at the gauging site and is probably attributable to a reduction in sediment transport during a year which only produced 75% of the mean annual rainfall. This trend was reversed after a fresh in October, causing the rating curve to revert back to its previous position. 01/02/75 - Dragline operations observed in channel from February 1975, causing unusual shaped base flow recessions. 10/08/77 - Syphon intake installed on 770810 094500 to enable the recorder to operate below the invert level of the bottom intake. 02/03/87 - Data from 870302 133000 to 870303 133300 was filed from the Foxboro backup recorder as the digital recorder was badly affected by an earthquake. The order of the sequence of events between 134200 and 140300 is a guess only as they appear instantaneous on the Foxboro chart. 01/06/87 - Drag line clearing channel upstream and downstream of recorder from 870601 to 870721. This work appears to have affected the stage record from 870616. 03/02/88 - Dragline was observed clearing channel 880203 112400. This work appears to have affected the stage data from 880123. 29/04/92 - Missing record 920429 080000 to 920429 143000 . 01/07/92 - Site handed over to Environment Bay of Plenty. Instrumentation L&S tape recorder with 1mm resolution, connected to an Aquitel Remote. 29/11/92 - Reduction in water level while Tasman pulp and paper mill shut effluent outfall gates for approximately 2 hours, while floating a boat stuck on an effluent pond bar. 15/12/94 - Missing record from 941215 231500 to 941216 084500 due to earthquake affecting recorder. 22/09/95 - Missing record from 950922 113000 to 950925 151500. 07/11/95 - Missing record from 951107 091600 to 951110 130000 due to float tape not being on pulleys. 24/11/96 - Data from 961124 0 to 961130 240000 shows the result of Tasman pulp and paper mill stopping their discharge into the river at Pipe Bridge. 15/11/ 97 - Missing record from 971115 124500 to 971117 130000. 15/03/2005 - Sutron Gas Purge system installed as replacement for Handar 436B encoder (primary stage recorder). Sensor has a resolution of +/-5mm and a recording interval of 15 minutes. Tower now sitting above normal water level.
For additional information, please see recording authority.

Environment Bay of Plenty 367
Environment Bay of Plenty Hydrological Level Summary
Date Complied August 2006 Site Number 15302 Compiled by G R Ellery River Tarawera Station Awakaponga Metric Map Reference V15: 412 559 Catchment Area (km2) 906 Period of Summary 1949 to 2005 Statistical Summary
Level (l/s) Minimum Level 2350 Maximum Level 5507 Mean Annual Minimum Level 3508 Mean Annual Maximum Level 4414 Mean Level 3730 Mean Summer Level 3675 Median Level 3791 Mean Autumn Level 3702 Mean Winter Level 3800 Mean Spring Level 3777 Low Level Distribution Fit GEV Peak Level Distribution Fit GEV 7 day Low Level (Minimum) 2396 Peak Level (5 yr Return) 4849 7 Day Low Level (Mean Annual) 3519 Peak Level (10 yr Return) 5074 7 day Low Level (5 yr Return) 3085 Peak Level (20 yr Return) 5251 7 Day Low Level (10 yr Return) 2758 Peak Level (50 yr Return) 5435 Peak Level (100 yr Return)
Annual Summaries Level (mm) Moturiki Datum Level (mm) Moturiki Datum Year Minimum Mean Maximum
Year Minimum Mean Maximum 1980 3413 3575 3984 1993 3146 3276 3762 1981 3406 3643 4173 1994 3090 3269 4078 1982 3466 3649 4118 1995 3084 3390 4725 1983 3409 3684 4790 1996 3083 3346 3949 1984 3646 3777 4399 1997 2874 3103 3613 1985 3652 3942 4655 1998 2793 3061 4308 1986 3309 3648 4527 1999 2741 2968 3887 1987 3076 3300 3741 2000 2689 2856 3610 1988 3000 3195 3983 2001 2595 2800 4005 1989 3256 3510 4030 2002 2413 2667 3492 1990 3235 3408 3950 2003 2350 2583 3703 1991 3156 3312 3848 2004 2408 2736 4196 1992 3142 3308 3838 2005 2405 2671 3823
Level Distribution Level (mm) Moturiki Datum
Percentiles 0 1 2 3 4 5 6 7 8 9 0 5507 4718 4619 4557 4509 4479 4449 4415 4390 4368 10 4349 4333 4319 4307 4295 4285 4274 4263 4252 4242 20 4233 4223 4214 4205 4197 4189 4181 4173 4164 4156 30 4148 4139 4130 4122 4113 4105 4097 4089 4080 4070 40 4059 4046 4031 4009 3974 3932 3898 3862 3837 3812 50 3791 3768 3747 3727 3706 3687 3668 3649 3631 3616 60 3600 3585 3568 3553 3535 3512 3487 3464 3442 3419 70 3395 3375 3357 3338 3320 3302 3285 3268 3250 3234 80 3216 3199 3181 3164 3146 3120 3091 3043 2983 2920 90 2882 2844 2803 2765 2728 2688 2649 2609 2557 2498 100 2350

368 Environmental Publication 2007/06
3000
3500
4000
4500
5000
5500
6000
1945 1955 1965 1975 1985 1995 2005
Year
Leve
l (m
m))
Maximum Level 5 per. Mov. Avg. (Maximum Level)
2000
2500
3000
3500
4000
4500
5000
1945 1955 1965 1975 1985 1995 2005
Year
Leve
l (m
m)
Minimum Level 5 per. Mov. Avg. (Minimum Level)
2000
2500
3000
3500
4000
4500
5000
1945 1955 1965 1975 1985 1995 2005
Year
Leve
l (m
m)
Mean Level 5 per. Mov. Avg. (Mean Level)
2000
2500
3000
3500
4000
4500
5000
1945 1955 1965 1975 1985 1995 2005
Year
Leve
l (m
m)
Mean Autumn Level 5 per. Mov. Avg. (Mean Autumn Level)
2000
2500
3000
3500
4000
4500
5000
1945 1950 1955 1960 1965 1970 1975 1980 1985 1990 1995 2000 2005
Year
Leve
l (m
m)
Mean Winter Level 5 per. Mov. Avg. (Mean Winter Level)
2000
2500
3000
3500
4000
4500
5000
1945 1955 1965 1975 1985 1995 2005
Year
Leve
l (m
m)
Mean Spring Level 5 per. Mov. Avg. (Mean Spring Level)
2000
2500
3000
3500
4000
4500
5000
1945 1955 1965 1975 1985 1995 2005
Year
Leve
l (m
m)
Mean Summer Level 5 per. Mov. Avg. (Mean Summer Level)
Tarawera at Awakaponga

Environment Bay of Plenty 369
Environment Bay of Plenty River Level Recording Station
River Rangitaiki Site Thornton Site Number 15401 Grid Reference W15:507 576 Start of Record February 1965 Data Capture Rate 87% Data Summary From January 1989 To December 2005 Data Audited From January 1994 To December 2005 Equipment History
03/08/80: 3 metre range Monthly Foxboro chart recorder. 06/07/95: Float with L&S digital recorder. Comments on Stage/Discharge Ratings Ratings are available to convert Stage (mm) to Reduced Level (mm) in Moturiki Datum.
General Comments This site was originally operated in the 1960’s by the Drainage Board. Some charts are available and some storms have been processed. Site is operated by Environment Bay of Plenty for engineering purposes in the Lower Rangitaiki catchment.
SITE LOCATION Rangitaiki at Thornton

370 Environmental Publication 2007/06
Station Comments Rangitaiki River at Thornton. Site Number 15401, on River Number 154000. The local recording authority is Environment Bay of Plenty The recorder is located on Reids central canal, 50 metres above the confluence with the Rangitaiki River. The 1960’s chart recorder is thought to have been set to Drainage Board Datum which is thought to be MSL=96.8 ft. 96.8 ft = 29.505 metres. All data processed from this period has had 29.505 metres subtracted from it to reduce it to mean sea level (Moturiki Datum). The charts are held by the Bay of Plenty Catchment Board. 23/10/88 On the 23rd October an Aquitel Remote, A-D converter and a pressure transducer were installed. This is installed temporarily for the engineering department. 19/10/89 During this period 981019 to 920904 there were periods of missing data due to equipment problems with the primary recorder. Gaps have been filled with Foxboro data where available and some periods of synthetic data occur. 20/07/94 Steel stilling well cylinders installed. Water level is now recorded by a float connected to an encoder. 05/05/2000 WRIC logger replaced by Campbell logger.
For additional information, please see recording authority.

Environment Bay of Plenty 371
Environment Bay of Plenty Hydrological Level Summary
Date Complied December 2006 Site Number 15401 Compiled by G R Ellery River Rangitaiki Station Thornton Metric Map Reference W15:507 576 Catchment Area (km2) 3004 Period of Summary 1989 to 2005 Statistical Summary
Level (mm) Minimum Level -600 Maximum Level 2409 Mean Annual Minimum Level -442 Mean Annual Maximum Level 1690 Mean Level 371 Mean Summer Level 365 Median Level 332 Mean Autumn Level 380 Mean Winter Level 398 Mean Spring Level 344 Low Level Distribution Fit Utilised GEV Peak Level Distribution Fit Utilised GEV 7 day Low Level (Minimum) -66 Peak Level (5 yr Return) 1809 7 Day Low Level (Mean Annual) 172 Peak Level (10 yr Return) 1959 7 day Low Level (5 yr Return) 122 Peak Level (20 yr Return) 2130 7 Day Low Level (10 yr Return) 78 Peak Level (50 yr Return) Peak Level (100 yr Return)
Annual Summaries Level (mm) Level (mm) Year Minimum Mean Maximum
Year Minimum Mean Maximum 1980 1993 -600 250 1419 1981 1994 -519 312 1481 1982 1995 -456 368 1622 1983 1996 -379 395 1835 1984 1997 -383 337 1657 1985 1998 -435 376 1599 1986 1999 -416 405 1678 1987 2000 -447 395 1575 1988 2001 -443 401 1654 1989 -369 404 1474 2002 -439 376 1646 1990 -444 401 2409 2003 -402 407 1521 1991 -418 359 1734 2004 -553 405 1935 1992 -352 354 1625 2005 -457 378 1859
Level Distribution
Level (mm) Percentiles 0 1 2 3 4 5 6 7 8 9
0 2409 1235 1162 1115 1079 1050 1024 1002 982 964 10 947 930 915 900 885 870 856 842 829 815 20 802 788 775 762 748 735 721 707 693 679 30 664 649 634 619 603 587 570 554 537 520 40 503 486 469 451 434 417 400 382 365 348 50 332 315 299 283 268 252 237 222 207 193 60 179 165 151 138 125 112 100 88 76 64 70 53 42 31 20 9 -2 -12 -23 -33 -43 80 -54 -64 -74 -84 -95 -105 -116 -126 -137 -149 90 -160 -173 -185 -199 -214 -230 -248 -269 -295 -334 100 -600

372 Environmental Publication 2007/06
0
500
1000
1500
2000
2500
3000
1989 1991 1993 1995 1997 1999 2001 2003 2005
Year
Leve
l (m
m)
Maximum Level 5 per. Mov. Avg. (Maximum Level)
-700
-600
-500
-400
-300
-200
-100
0
1989 1991 1993 1995 1997 1999 2001 2003 2005
Year
Leve
l (m
m)
Minimum Level 5 per. Mov. Avg. (Minimum Level)
0
50
100
150
200
250
300
350
400
450
1989 1991 1993 1995 1997 1999 2001 2003 2005
Year
Leve
l (m
m)
Mean Level 5 per. Mov. Avg. (Mean Level)
050
100150200250300350400450500
1989 1991 1993 1995 1997 1999 2001 2003 2005
Year
Leve
l (m
m)
Mean Autumn Level 5 per. Mov. Avg. (Mean Autumn Level)
0
100
200
300
400
500
600
1989 1991 1993 1995 1997 1999 2001 2003 2005
Year
Leve
l (m
m)
Mean Winter Level 5 per. Mov. Avg. (Mean Winter Level)
050
100150200250300350400450500
1989 1991 1993 1995 1997 1999 2001 2003 2005
Year
Leve
l (m
m)
Mean Spring Level 5 per. Mov. Avg. (Mean Spring Level)
050
100150200250300350400450500
1989 1991 1993 1995 1997 1999 2001 2003 2005
Year
Leve
l (m
m)
Mean Summer Level 5 per. Mov. Avg. (Mean Summer Level)
Rangitaiki at Thornton

Environment Bay of Plenty 373
Environment Bay of Plenty River Level Recording Station
River Rangitaiki Site Te Teko Site Number 15412 Grid Reference V15:435 448 Start of Record June 1948 Data Capture Rate 100% Data Summary From January 1949 To December 2005 Data Audited From June 1948 To December 2005 Equipment History
01/06/48: Staff gauge installed. 07/09/52: Kent chart recorder. 25/08/65: Float with F&P digital recorder. 08/03/88: Backup Foxboro chart recorder. Comments on Stage/Discharge Ratings Ratings are available to convert Stage (mm) to Reduced Level (mm) in Moturiki Datum. General Comments Site is operated by NIWA, Rotorua. Record from June 1948 to October 1952 is from staff gauge at Edgecumbe Bridge, approximately 12 kilometres down stream. Water levels were affected by the filling of Lake Matahina in November 1966. Since then water levels have been affected by the dam operation. Flow recorded at Matahina Dam has been used as a backup. Site is now contains equipment operated as part of Environment Bay of Plenty’s Natural Environment Regional Monitoring Network for flood monitoring purposes
SITE LOCATION Rangitaiki at Te Teko

374 Environmental Publication 2007/06
Station Comments Rangitaiki River at Te Teko. Site number 15412, on River Number 154000. The local recording authority is NIWA, Rotorua. The site is situated 23 kilometres from the river mouth, and has a natural channel control. Sediment concentration is also measured at this site. 07/09/52 - Chart data was not filed until 521001. Charts have not been digitised so data filed are mainly one daily value. 24/11/66 - Stage values on 661125 and 661126 go below zero due to the filling of Lake Matahina. From now on water levels are affected by the Matahina dam. 02/03/87 - Stage record from 870302 133000 to 870302 160000 has been affected by an Earthquake. The stage record has been filed as recorded although this may not produce true flows during the event. 04/03/88 - Missing record from 880304 123000 to 880308 121500 due to water level receding below bottom of intake pipe. 08/03/88 - Chart recorder installed on 880308 121500 to record water levels when stage drops below bottom intake. 31/05/88 - The unusual stage hydrograph during June and July 1988 was due to the Matahina dam being refilled after maintenance work to the right bank abatement. 05/07/96 - Data from 960705 140000 to 960706 140000 is an assumed straightline. Matahina power station was not generating during this period, as the dam was being dewatered for major maintenance. 27/07/02 - Missing record from 27 July 2002 081500 to 29 July 2002 111500 due to vandals breaking into recorder house and smashing all recording equipment. 30/0//03 - Data from 30 July 2003 024500 to 8 august 2003 114500 has been suppressed due to the syphon being partially blocked. During this time the shape and frequency of the hydrographs has been affected. Accuracy of the data is +/- 15 %. 31/10/04 - Data from 31 October 2004 051500 to 19 November 2004 161500 is almost a flat line trace. This trace is correct and is caused by Matahina dam operating on one generator during maintenance.
For additional information, please see recording authority.

Environment Bay of Plenty 375
Environment Bay of Plenty Hydrological Level Summary
Date Complied December 2006 Site Number 15412 Compiled by G R Ellery River Rangitaiki Station Te Teko Metric Map Reference V15:435 448 Catchment Area (km2) 1184 Period of Summary 1949 to 2005 Statistical Summary
Level (mm) Minimum Level 5860 Maximum Level 12501 Mean Annual Minimum Level 6638 Mean Annual Maximum Level 9874 Mean Level 7288 Mean Summer Level 7183 Median Level 7138 Mean Autumn Level 7091 Mean Winter Level 7565 Mean Spring Level 7502 Low Level Distribution Fit Utilised Gumbel Peak Level Distribution Fit Utilised GEV 7 day Low Level (Minimum) 6147 Peak Level (5 yr Return) 10643 7 Day Low Level (Mean Annual) 6625 Peak Level (10 yr Return) 11193 7 day Low Level (5 yr Return) 6450 Peak Level (20 yr Return) 11692 7 Day Low Level (10 yr Return) 6352 Peak Level (50 yr Return) 12300 Peak Level (100 yr Return)
Annual Summaries Level (mm) Level (mm) Year Minimum Mean Maximum
Year Minimum Mean Maximum 1980 6878 6228 8225 1993 6714 7102 8922 1981 7070 6365 9644 1994 6736 7349 9895 1982 6721 6313 8495 1995 6953 7688 11538 1983 6676 6104 10555 1996 6957 7634 9761 1984 6645 6173 9325 1997 6945 7376 8705 1985 6669 6127 9871 1998 6846 7487 11811 1986 7747 6396 9851 1999 6801 7306 10203 1987 7401 7001 10441 2000 6753 7110 8965 1988 7386 6748 9694 2001 6754 7252 9663 1989 7729 7033 9768 2002 6637 7117 8833 1990 7597 7027 9825 2003 6445 7023 9149 1991 7397 7018 9611 2004 6605 7434 12501 1992 7389 6913 8877 2005 6574 7086 9612
Level Distribution
Level (mm) Percentiles 0 1 2 3 4 5 6 7 8 9
0 12501 9183 8850 8698 8578 8472 8391 8322 8267 8208 10 8162 8120 8086 8049 8010 7974 7941 7909 7881 7854 20 7822 7791 7758 7724 7690 7655 7622 7592 7564 7537 30 7511 7485 7459 7436 7415 7395 7377 7361 7342 7322 40 7302 7282 7263 7246 7228 7210 7193 7177 7163 7151 50 7138 7124 7112 7102 7093 7084 7074 7063 7051 7038 60 7024 7010 6996 6983 6969 6956 6943 6932 6922 6912 70 6902 6890 6877 6863 6847 6831 6816 6804 6791 6779 80 6768 6758 6746 6731 6715 6696 6677 6655 6636 6612 90 6592 6567 6543 6516 6482 6446 6411 6387 6354 6291 100 5860

376 Environmental Publication 2007/06
7000
8000
9000
10000
11000
12000
13000
1945 1950 1955 1960 1965 1970 1975 1980 1985 1990 1995 2000 2005
Year
Leve
l (m
m)
Maximum Level 5 per. Mov. Avg. (Maximum Level)
5000
5500
6000
6500
7000
7500
8000
1945 1950 1955 1960 1965 1970 1975 1980 1985 1990 1995 2000 2005
Year
Leve
l (m
m)
Minimum Level 5 per. Mov. Avg. (Minimum Level)
6000
6500
7000
7500
8000
8500
9000
1945 1950 1955 1960 1965 1970 1975 1980 1985 1990 1995 2000 2005
Year
Leve
l (m
m)
Mean Level 5 per. Mov. Avg. (Mean Level)
6000
6500
7000
7500
8000
8500
1945 1950 1955 1960 1965 1970 1975 1980 1985 1990 1995 2000 2005
Year
Leve
l (m
m)
Mean Autumn Level 5 per. Mov. Avg. (Mean Autumn Level)
6000
6500
7000
7500
8000
8500
9000
1945 1950 1955 1960 1965 1970 1975 1980 1985 1990 1995 2000 2005
Year
Leve
l (m
m)
Mean Winter Level 5 per. Mov. Avg. (Mean Winter Level)
6000
6500
7000
7500
8000
8500
9000
1945 1950 1955 1960 1965 1970 1975 1980 1985 1990 1995 2000 2005
Year
Leve
l (m
m)
Mean Spring Level 5 per. Mov. Avg. (Mean Spring Level)
6000
6500
7000
7500
8000
8500
1945 1950 1955 1960 1965 1970 1975 1980 1985 1990 1995 2000 2005
Year
Leve
l (m
m)
Mean Summer Level 5 per. Mov. Avg. (Mean Summer Level)
Rangitaiki at Te Teko

Environment Bay of Plenty 377
Environment Bay of Plenty River Level Recording Station
River Rangitaiki Site Murupara Site Number 15408 Grid Reference V17:329 984 Start of Record June 1948 Data Capture Rate 100% Data Summary From January 1949 To December 2000 Data Audited From June 1948 To December 2000 Equipment History 01/01/48: Staff gauge installed. 16/09/52: Bristol chart recorder. 06/02/59: Kent chart recorder. 24/08/65: Float with F&P digital recorder. 13/06/83: Backup Foxboro chart recorder. 22/08/84: Float with L&S digital recorder. 12/08/94: Float with Kainga Encoder and Aquitel Remote Comments on Stage/Discharge Ratings Ratings are available to convert Stage (mm) to Reduced Level (mm) Moturiki Datum. General Comments Site is operated by NIWA, Rotorua. Stage record has been affected by the Wheao Power Scheme from 1982. Sediment concentration is also measured at this site.
SITE LOCATION Rangitaiki at Murupara

378 Environmental Publication 2007/06
Station Comments Rangitaiki River at Murupara. Site Number 15408, on River Number 154000. The local recording authority is NIWA, Rotorua. From April 1982 stage record is affected by the Wheao Power Scheme. Sediment concentration is also measured at the site. 31/12/47 - Record from 480601 to 520915 is readings taken from daily staff gauge observations. Data for the period of daily readings is not completely reliable with the reader generally only reading the gauge to 0.1ft (30mm). 17/09/52 - The stage record has been manually read from the Bristol charts at a rate of one point per day. From 520917 to 581215 during any period where the recorder has malfunctioned, daily staff gauge readings have been filed. Record from 520917 to 650824 was checked against Whirinaki at Galatea (site 15410), this check showed only daily mean discharges should be used. The original charts are held by Works (Major Projects Wellington) if any storm analysis is required. 01/11/55 - There is no chart record from 551101 100000 to 560815 134500. All values filed are daily staff gauge readings. 06/02/59 - Recorder installed on day 590206 is a 6.10 metre (20ft) range, monthly Kent with a time resolution of 96 minutes/mm recorded and a stage ratio of 24mm of stage/mm chart recorded. 24/08/65 - Recorder replaced on 650824 153000 by a 15 minute punch F&P digital with a recording resolution of 1/mm increment. 01/04/82 - Rapid stage fluctuations from April 1982 to December 1982 were caused by the Wheao power scheme construction and testing. 30/12/82 - Wheao power station head race collapse caused a very short sharp flood hydrograph on 821230. 14/12/83 - Wheao power scheme began influencing the stage record at Murupara after being rebuilt from December 1983. 12/08/94 - Recorder replaced 940812 114500 by a Kainga encoder with a range of 10 metres, a resolution of 1 mm, and a time interval of 15 minutes, connected directly to the Remote. Data is now filed via telemetry.
For additional information, please see recording authority.

Environment Bay of Plenty 379
Environment Bay of Plenty Hydrological Level Summary
Date Complied December 2006 Site Number 15408 Compiled by G R Ellery River Rangitaiki Station Murupara Metric Map Reference V17:329 984 Catchment Area (km2) 1184 Period of Summary 1949 to 2005 Statistical Summary
Level (mm) Minimum Level 179674 Maximum Level 182589 Mean Annual Minimum Level 179901 Mean Annual Maximum Level 180847 Mean Level 180206 Mean Summer Level 180220 Median Level 180174 Mean Autumn Level 180082 Mean Winter Level 180218 Mean Spring Level 180306 Low Level Distribution Fit Utilised GEV Peak Level Distribution Fit Utilised Gumbel 7 day Low Level (Minimum) 179750 Peak Level (5 yr Return) 181156 7 Day Low Level (Mean Annual) 179821 Peak Level (10 yr Return) 181410 7 day Low Level (5 yr Return) 179867 Peak Level (20 yr Return) 181653 7 Day Low Level (10 yr Return) 179942 Peak Level (50 yr Return) 181968 Peak Level (100 yr Return)
Annual Summaries Level (mm) Level (mm) Year Minimum Mean Maximum
Year Minimum Mean Maximum 1980 180138 180291 180569 1993 179723 180070 180667 1981 180025 180270 180606 1994 179674 180194 181019 1982 179776 180099 180601 1995 179814 180459 181016 1983 179814 180015 181216 1996 179945 180463 180924 1984 179771 180058 180616 1997 179875 180266 180739 1985 179768 180011 180449 1998 179937 180360 181675 1986 179815 180151 180992 1999 179934 180244 180782 1987 179791 180039 180441 2000 179866 180146 180618 1988 179692 180177 181093 2001 179816 180116 180805 1989 179872 180334 180994 2002 179886 180202 180769 1990 179834 180302 180940 2003 179737 180094 180744 1991 179868 180226 180962 2004 179951 180508 181750 1992 179809 180209 180889 2005 180026 180221 180669
Level Distribution
Level (mm) Percentiles 0 1 2 3 4 5 6 7 8 9
0 182589 180874 180772 180717 180679 180647 180619 180597 180578 180558 10 180539 180521 180503 180486 180472 180458 180444 180431 180418 180409 20 180399 180388 180379 180370 180361 180353 180345 180338 180330 180321 30 180314 180307 180299 180291 180284 180278 180270 180262 180256 180248 40 180242 180234 180228 180221 180214 180207 180200 180194 180188 180181 50 180174 180166 180160 180154 180148 180142 180136 180130 180124 180119 60 180111 180105 180099 180095 180090 180082 180076 180069 180062 180056 70 180049 180043 180038 180032 180028 180022 180016 180010 180004 179998 80 179996 179988 179981 179974 179966 179959 179951 179944 179936 179925 90 179916 179910 179900 179888 179884 179874 179859 179848 179826 179791 100 179674

380 Environmental Publication 2007/06
179500
180000
180500
181000
181500
182000
182500
183000
1945 1950 1955 1960 1965 1970 1975 1980 1985 1990 1995 2000 2005
Year
Leve
l (m
m)
Maximum Level 5 per. Mov. Avg. (Maximum Level)
179600
179700
179800
179900
180000
180100
180200
180300
1945 1950 1955 1960 1965 1970 1975 1980 1985 1990 1995 2000 2005
Year
Leve
l (m
m)
Minimum Level 5 per. Mov. Avg. (Minimum Level)
179800
179900
180000
180100
180200
180300
180400
180500
180600
1945 1950 1955 1960 1965 1970 1975 1980 1985 1990 1995 2000 2005
Year
Leve
l (m
m)
Mean Level 5 per. Mov. Avg. (Mean Level)
179700179800179900180000180100180200180300180400180500180600
1945 1950 1955 1960 1965 1970 1975 1980 1985 1990 1995 2000 2005
Year
Leve
l (m
m)
Mean Autumn Level 5 per. Mov. Avg. (Mean Autumn Level)
179800179900180000180100180200180300180400180500180600180700180800
1945 1950 1955 1960 1965 1970 1975 1980 1985 1990 1995 2000 2005
Year
Leve
l (m
m)
Mean Winter Level 5 per. Mov. Avg. (Mean Winter Level)
179800179900180000180100180200180300180400180500180600180700180800180900
1945 1950 1955 1960 1965 1970 1975 1980 1985 1990 1995 2000 2005
Year
Leve
l (m
m)
Mean Spring Level 5 per. Mov. Avg. (Mean Spring Level)
179800179900180000180100180200180300180400180500180600180700
1945 1950 1955 1960 1965 1970 1975 1980 1985 1990 1995 2000 2005
Year
Leve
l (m
m)
Mean Summer Level 5 per. Mov. Avg. (Mean Summer Level)
Rangitaiki at Murupara

Environment Bay of Plenty 381
Environment Bay of Plenty River Level Recording Station
River Whakatane Site Town Wharf Site Number 15509 Grid Reference W15:619 537 Start of Record March 1986 Data Capture Rate 80% Data Summary From January 1987 To December 2005 Data Audited From March 1986 To December 2005 Equipment History Float/counterweight system with shaft encoder. 1mm resolution.
22-07-64: Staff gauge and Lea chart recorder 14-01-86: 3 metre range Stevens chart recorder 20-07-90: 5 metre range P.T. & WRIC datalogger 21-05-91: 3 metre range Stevens chart recorder 23-08-93: Encoder & WRIC datalogger Comments on Stage/Discharge Ratings Ratings are available to convert Stage (mm) to Reduced Level (mm) in Moturiki Datum
General Comments Site is operated by Environment Bay of Plenty for engineering investigation works. This site is tidally influenced and has been used by the R.N.Z.N. Hydrographic office for calculating secondary point tide tables.
SITE LOCATION Whakatane at Town Wharf

382 Environmental Publication 2007/06
Station Comments Whakatane River at Town Wharf. Site Number 15509, on River Number 155000. The local recording authority is Environment Bay of Plenty Staff gauge installed 22/7/64. R.L.Zero = -2.5 ft. Moturiki datum. The highest stage recorded =2.316m Moturiki Datum on 10/04/68 during the Wahine Storm. The staff gauge converted to new R.L.Zero = -1.000 metres (Moturiki Datum) on 7/5/86. 20/09/90 Lea recorder removed temporarily and WRIC and pressure transducer installed. This was done in response to a request, by the R.N.Z.N. Hydrographic Office, for accurate tidal readings to enable the inclusion of Whakatane as a secondary port in the NZ Nautical Almanac. Pressure transducer is 5m range with values recorded every 6 minutes. 01/01/96 General comment: record for the period 960101 to 980101 shows periods where the high and low tide is missing. This appears to have a random occurrence. The data after these events is still valid due to external values matching recorded values. There is no evidence of the float or counter-weight jamming.
For additional information, please see recording authority.

Environment Bay of Plenty 383
Environment Bay of Plenty Hydrological Level Summary
Date Complied December 2006 Site Number 15509 Compiled by G R Ellery River Whakatane Station Town Wharf Metric Map Reference W15:619 537 Catchment Area (km2) 1795 Period of Summary 1987 to 2005 Statistical Summary
Level (mm) Minimum Level -1069 Maximum Level 3048 Mean Annual Minimum Level -934 Mean Annual Maximum Level 1677 Mean Level 166 Mean Summer Level 157 Median Level 166 Mean Autumn Level 183 Mean Specific Level (/km2) Mean Winter Level 194 Mean Spring Level 132 Low Level Distribution Fit Utilised GEV Peak Level Distribution Fit Utilised GEV 7 day Low Level (Minimum) -153 Peak Level (5 yr Return) 1827 7 Day Low Level (Mean Annual) -45 Peak Level (10 yr Return) 2091 7 day Low Level (5 yr Return) -89 Peak Level (20 yr Return) 2424 7 Day Low Level (10 yr Return) -120 Peak Level (50 yr Return) Peak Level (100 yr Return)
Annual Summaries Level (mm) Level (mm) Year Minimum Mean Maximum
Year Minimum Mean Maximum 1980 1993 -976 101 1208 1981 1994 -919 132 1503 1982 1995 -901 142 1635 1983 1996 -828 154 1515 1984 1997 -903 108 1674 1985 1998 -899 172 2440 1986 1999 -897 213 1856 1987 -873 135 1561 2000 -1040 185 1507 1988 -952 129 1613 2001 -955 220 1516 1989 -903 223 1343 2002 -976 166 1508 1990 -1069 191 1442 2003 -929 182 1542 1991 -896 179 1758 2004 -880 182 3048 1992 -1005 161 1358 2005 -950 172 1834
Level Distribution
Level (mm) Percentiles 0 1 2 3 4 5 6 7 8 9
0 3048 1130 1052 1003 966 934 908 885 864 844 10 825 808 791 775 760 745 730 715 701 686 20 672 657 643 628 614 599 584 568 553 537 30 521 505 489 472 455 438 420 403 385 367 40 349 331 313 295 277 258 240 221 203 184 50 166 148 129 111 93 74 56 38 20 2 60 -16 -34 -52 -70 -87 -104 -122 -139 -156 -173 70 -189 -206 -222 -238 -254 -270 -285 -301 -316 -331 80 -346 -361 -377 -392 -407 -423 -439 -455 -471 -488 90 -505 -523 -542 -563 -585 -609 -636 -668 -709 -767 100 -1069

384 Environmental Publication 2007/06
1000
1500
2000
2500
3000
3500
1987 1989 1991 1993 1995 1997 1999 2001 2003 2005
Year
Leve
l (m
m)
Maximum Level 5 per. Mov. Avg. (Maximum Level)
-1100-1050-1000-950-900-850-800-750-700-650-600
1987 1989 1991 1993 1995 1997 1999 2001 2003 2005
Year
Leve
l (m
m)
Minimum Level 5 per. Mov. Avg. (Minimum Level)
0
50
100
150
200
250
1987 1989 1991 1993 1995 1997 1999 2001 2003 2005
Year
Leve
l (m
m)
Mean Level 5 per. Mov. Avg. (Mean Level)
0
50
100
150
200
250
300
1987 1989 1991 1993 1995 1997 1999 2001 2003 2005
Year
Leve
l (m
m)
Mean Autumn Level 5 per. Mov. Avg. (Mean Autumn Level)
0
50
100
150
200
250
300
350
400
1987 1989 1991 1993 1995 1997 1999 2001 2003 2005
Year
Leve
l (m
m)
Mean Winter Level 5 per. Mov. Avg. (Mean Winter Level)
0
50
100
150
200
250
300
1987 1989 1991 1993 1995 1997 1999 2001 2003 2005
Year
Leve
l (m
m)
Mean Spring Level 5 per. Mov. Avg. (Mean Spring Level)
0
50
100
150
200
250
300
1987 1989 1991 1993 1995 1997 1999 2001 2003 2005
Year
Leve
l (m
m)
Mean Summer Level 5 per. Mov. Avg. (Mean Summer Level)
Whakatane at Town Wharf

Environment Bay of Plenty 385
Environment Bay of Plenty River Level Recording Station
River Whakatane Site Whakatane Site Number 15514 Grid Reference W15:609 475 Start of Record July 1956 Data Capture Rate 99% Data Summary From January 1957 To December 2005 Data Audited From July 1956 To December 2005 Equipment History
31/07/56: Kent chart recorder. 30/10/75: Float with F&P digital recorder. 23/07/87: Float with F&P digital and Aquitel Remote. 06/01/94: Float with Encoder and Aquitel. Comments on Stage/Discharge Ratings Ratings are available to convert Stage (mm) to Reduced Level (mm) in Moturiki Datum. General Comments Site is operated by NIWA, Rotorua. Site is influenced by a tidal effect that is apparent up to mean flow during spring tide events. Suspended sediment is also measured at this site. Site also contains equipment owned by Environment Bay of Plenty that is utilised for flood monitoring purposes.
SITE LOCATION Whakatane at Whakatane

386 Environmental Publication 2007/06
Station Comments Whakatane River at Whakatane. Site Number 15514, on River Number 155000 The local recording authority is NIWA, Rotorua. The site is situated 13.5 kilometres. from the mouth. Site control is by downstream riffle. The natural river character has undergone major changes since the stations construction. Major flood protection works in the form of 10 year and 100 year return period stop banking, upstream and downstream channel diversion and straightening, and rip-rap emplacement on the right bank adjacent to the recorder tower were undertaken from the mid 1960's. Large-scale gravel and sand abstraction has also occurred from the 1940's and is continuing today. The station is situated on the outside bank of a meander bend crest. The channel bed material is mixed sand-gravel and therefore the channel is susceptible to bed-level changes. Rating changes may also occur due to localised bank erosion and control modification due to floods or gravel extraction activities. The site is also influenced by a tidal effect, which is apparent up to mean flow during spring tide events. The effect tends to exaggerate river flows when the tidal peak elevates river levels. Suspended sediment concentration is also measured at this site. The original processing is archived on the miscellaneous file under site number 2215. A surge in the recorder tower and a small time lag between river and recorder tower levels occurs at periods of high stage. 31/12/60 - Many of the flood peaks from 1961 to 1975 recorded on Kent charts were verified by actual event observations and/or from floodmarks on the recorder tower. 19/01/61 - Data from 610119 240000 to 630909 240000 is generally filed at 6-hourly, 12-hourly or 24-hourly intervals depending on stage variation from Kent charts. Nearly all of the tidal influence has been ignored. 27/05/83 - New gauging cableway commissioned on 830527 100000. 26/10/83 -Ten year stopbank overtopped approximately 2 kilometres upstream of recorder. 23/07/87 - Aquitel telemetry installed on 870723 140000 as additional backup recorder and for flood warning. Unless otherwise stated from this date onwards backup data is obtained from the Aquitel Remote unless that too is unavailable or erroneous. Periods where telemetered data is filed are not commented.
For additional information, please see recording authority.

Environment Bay of Plenty 387
Environment Bay of Plenty Hydrological Level Summary
Date Complied December 2006 Site Number 15514 Compiled by G R Ellery River Whakatane Station Whakatane Metric Map Reference W15:609 475 Catchment Area (km2) 1557 Period of Summary 1957 to 2005 Statistical Summary
Level (mm) Minimum Level 931 Maximum Level 8593 Mean Annual Minimum Level 1146 Mean Annual Maximum Level 6141 Mean Level 1729 Mean Summer Level 1591 Median Level 1581 Mean Autumn Level 1561 Mean Winter Level 1940 Mean Spring Level 1831 Low Level Distribution Fit Utilised GEV Peak Level Distribution Fit Utilised GEV 7 day Low Level (Minimum) 951 Peak Level (5 yr Return) 7067 7 Day Low Level (Mean Annual) 1155 Peak Level (10 yr Return) 7593 7 day Low Level (5 yr Return) 1088 Peak Level (20 yr Return) 8024 7 Day Low Level (10 yr Return) 1044 Peak Level (50 yr Return) 8490 Peak Level (100 yr Return)
Annual Summaries Level (mm) Level (mm) Year Minimum Mean Maximum
Year Minimum Mean Maximum 1980 1133 1611 5112 1993 1166 1459 4756 1981 1128 1769 5119 1994 1211 1713 6290 1982 1089 1506 4359 1995 1165 1875 6548 1983 931 1666 7229 1996 1275 1799 5661 1984 1323 1726 6400 1997 1190 1634 6007 1985 1315 1847 6290 1998 1116 1817 8011 1986 1186 1772 5277 1999 1038 1727 7266 1987 1231 1657 6357 2000 1064 1553 4547 1988 1200 1690 6533 2001 1124 1790 6692 1989 1229 1865 5667 2002 1080 1520 5277 1990 1258 1799 6105 2003 1006 1588 6283 1991 1214 1728 6246 2004 1114 1826 8593 1992 1225 1703 5029 2005 1084 1579 6101
Level Distribution
Level (mm) Percentiles 0 1 2 3 4 5 6 7 8 9
0 8593 4222 3505 3132 2914 2756 2637 2545 2467 2404 10 2349 2299 2253 2211 2171 2135 2102 2071 2043 2017 20 1993 1968 1947 1926 1906 1887 1870 1853 1837 1821 30 1807 1792 1779 1765 1753 1740 1728 1716 1704 1692 40 1680 1670 1659 1649 1639 1628 1618 1608 1599 1590 50 1581 1572 1563 1554 1545 1536 1527 1519 1510 1502 60 1493 1485 1477 1468 1459 1451 1443 1435 1427 1419 70 1411 1404 1397 1389 1382 1374 1366 1358 1349 1341 80 1333 1325 1316 1307 1299 1289 1280 1271 1261 1251 90 1241 1229 1217 1205 1190 1174 1152 1130 1102 1060 100 931

388 Environmental Publication 2007/06
0100020003000400050006000700080009000
10000
1955 1960 1965 1970 1975 1980 1985 1990 1995 2000 2005
Year
Leve
l (m
m)
Maximum Level 5 per. Mov. Avg. (Maximum Level)
600
700
800
900
1000
1100
1200
1300
1400
1955 1960 1965 1970 1975 1980 1985 1990 1995 2000 2005
Year
Leve
l (m
m)
Minimum Level 5 per. Mov. Avg. (Minimum Level)
1000
1200
1400
1600
1800
2000
2200
2400
1955 1960 1965 1970 1975 1980 1985 1990 1995 2000 2005
Year
Leve
l (m
m)
Mean Level 5 per. Mov. Avg. (Mean Level)
0
500
1000
1500
2000
2500
3000
1955 1960 1965 1970 1975 1980 1985 1990 1995 2000 2005
Year
Leve
l (m
m)
Mean Autumn Level 5 per. Mov. Avg. (Mean Autumn Level)
0
500
1000
1500
2000
2500
3000
1955 1960 1965 1970 1975 1980 1985 1990 1995 2000 2005
Year
Leve
l (m
m)
Mean Winter Level 5 per. Mov. Avg. (Mean Winter Level)
0
500
1000
1500
2000
2500
3000
1955 1960 1965 1970 1975 1980 1985 1990 1995 2000 2005
Year
Leve
l (m
m)
Mean Spring Level 5 per. Mov. Avg. (Mean Spring Level)
0
500
1000
1500
2000
2500
3000
1955 1960 1965 1970 1975 1980 1985 1990 1995 2000 2005
Year
Leve
l (m
m)
Mean Summer Level 5 per. Mov. Avg. (Mean Summer Level)
Whakatane at Whakatane

Environment Bay of Plenty 389
Environment Bay of Plenty River Level Recording Station
River Whakatane Site Huitieke Site Number 15541 Grid Reference W17:604 074 Start of Record April 1986 Data Capture Rate 93% Data Summary From January 1987 To December 2005 Data Audited From January 1998 To December 2005 Equipment History
28/04/86: Float with F&P digital recorder and Jepsen slave. 14/06/90: Float with L&S digital recorder and Aquitel Remote. 21/6/00: Float with Handar and IQuest DS4483 datalogger. Comments on Stage/Discharge Ratings Ratings are available to convert Stage (mm) to Reduced Level (mm) in assumed datum.
General Comments Site is operated by Environment Bay of Plenty as part of its Natural Environment Regional Monitoring network for flood warning and monitoring purposes.
SITE LOCATION Whakatane at Huitieke

390 Environmental Publication 2007/06
Station Comments Whakatane River at Huitieke. Site Number 15541, on River Number 15500. The local recording authority is Environment Bay of Plenty The site is situated 58.5 kilometres from the mouth. Site control is by unstable gravel bed. No discharge is measured at this site. This site was installed as part of the Whakatane-Waimana flood warning system. 28/04/86 - Synthetic type 3 rating to convert Stage values to Assumed Datum. This rating was established from surveyed level of staff gauge carried out on 911008. It was assumed that the staff gauge had not moved between 860428 to 911008. Caution should be used when using rated data through this period. 17/07/86 - Missing record due to gravel build up inside tower from 860717 to 900629.
31/12/95 - Synthetic data has been inserted during periods of missing record. Synthetic data is derived from comparisons with Waimana at Ogilvies Bridge (15536). Aquitel telemetry data has also been used where available. 24/02/02 - Missing record 20020224 114500 to 20030304 at 091500 due to battery and radio being stolen from site. 29/05/04 - Missing record from 20040529 020000 to 20040602 114500. Logger program failed, after being incorrectly updated on 20040526 114500. Program reloaded. 18/06/04 - Missing record from 20040618 221500 to 20040625 104500 due to logger program failure. 17/7/04 - Missing record from 20040717 201500 to 20040719 140000 due to logger program failure. 20/7/04 - Blockage in stilling well intake becomes evident 20040720 084500 (flat line in stage trace). The well was thought to be fully flushed from 20040721 094500 to 20040721 160000, resulting in a natural stage recession until 20040721 164500. However, a deeper obstruction at 0.765m remained until 20040722 073000 when the tower was flushed again. Due to high stage, further silt/gravel obstruction was unclear, but remained until 20040901. Water levels which exceeded the level of the blockage were recorded throughout this event. Hence the flat line remains in the data set, to show where water levels remained below the blockage. 1/09/04 - Missing record from 20040901 140000 to 20040902 163000. Huitieke fully flushed at normal river stage. Drainage holes (4) clearly visible (afterwards) in base of stilling well.
For additional information, please see recording authority.

Environment Bay of Plenty 391
Environment Bay of Plenty Hydrological Level Summary
Date Complied December 2006 Site Number 15541 Compiled by G R Ellery River Whakatane Station Huitieke Metric Map Reference W17:604 074 Catchment Area (km2) 620 Period of Summary 1987 to 2005 Statistical Summary
Level (mm) Minimum Level 6566 Maximum Level 9904 Mean Annual Minimum Level 6816 Mean Annual Maximum Level 8870 Mean Level 7124 Mean Summer Level 7063 Median Level 7076 Mean Autumn Level 7024 Mean Winter Level 7243 Mean Spring Level 7183 Low Level Distribution Fit Utilised GEV Peak Level Distribution Fit Utilised Gumbel 7 day Low Level (Minimum) 6573 Peak Level (5 yr Return) 9193 7 Day Low Level (Mean Annual) 6816 Peak Level (10 yr Return) 9455 7 day Low Level (5 yr Return) 6718 Peak Level (20 yr Return) 9707 7 Day Low Level (10 yr Return) 6649 Peak Level (50 yr Return) Peak Level (100 yr Return)
Annual Summaries Level (mm) Level (mm) Year Minimum Mean Maximum
Year Minimum Mean Maximum 1980 1993 6795 7017 8407 1981 1994 6919 7239 8986 1982 1995 6996 7315 9178 1983 1996 6915 7231 8804 1984 1997 6834 7125 9241 1985 1998 6716 7077 9717 1986 1999 6756 7069 8625 1987 6713 7040 8963 2000 6862 7079 8268 1988 6872 7177 8996 2001 6795 7130 8722 1989 6949 7214 8602 2002 6642 7020 8816 1990 6945 7299 8982 2003 6690 7022 8885 1991 6919 7250 8639 2004 6566 6940 9904 1992 6958 7230 8644 2005 6671 6910 8157
Level Distribution
Level (mm) Percentiles 0 1 2 3 4 5 6 7 8 9
0 9904 8052 7872 7761 7679 7622 7580 7544 7512 7482 10 7458 7435 7415 7397 7379 7362 7347 7333 7321 7309 20 7298 7287 7276 7266 7257 7247 7239 7230 7221 7212 30 7204 7197 7189 7181 7174 7167 7159 7152 7146 7140 40 7134 7127 7121 7115 7109 7103 7097 7092 7086 7081 50 7076 7071 7066 7060 7055 7049 7044 7038 7033 7028 60 7024 7019 7014 7009 7004 7000 6995 6990 6987 6982 70 6977 6972 6967 6962 6957 6952 6946 6940 6934 6927 80 6921 6913 6906 6897 6889 6881 6874 6866 6858 6850 90 6840 6830 6815 6801 6785 6772 6755 6733 6715 6685 100 6566

392 Environmental Publication 2007/06
8000820084008600880090009200940096009800
10000
1987 1989 1991 1993 1995 1997 1999 2001 2003 2005
Year
Leve
l (m
m)
Maximum Level 5 per. Mov. Avg. (Maximum Level)
650065506600665067006750680068506900695070007050
1987 1989 1991 1993 1995 1997 1999 2001 2003 2005
Year
Leve
l (m
m)
Minimum Level 5 per. Mov. Avg. (Minimum Level)
68506900695070007050710071507200725073007350
1987 1989 1991 1993 1995 1997 1999 2001 2003 2005
Year
Leve
l (m
m)
Mean Level 5 per. Mov. Avg. (Mean Level)
6700680069007000710072007300740075007600
1987 1989 1991 1993 1995 1997 1999 2001 2003 2005
Year
Leve
l (m
m)
Mean Autumn Level 5 per. Mov. Avg. (Mean Autumn Level)
6700680069007000710072007300740075007600
1987 1989 1991 1993 1995 1997 1999 2001 2003 2005
Year
Leve
l (m
m)
Mean Winter Level 5 per. Mov. Avg. (Mean Winter Level)
6700680069007000710072007300740075007600
1987 1989 1991 1993 1995 1997 1999 2001 2003 2005
Year
Leve
l (m
m)
Mean Spring Level 5 per. Mov. Avg. (Mean Spring Level)
6700680069007000710072007300740075007600
1987 1989 1991 1993 1995 1997 1999 2001 2003 2005
Year
Leve
l (m
m)
Mean Summer Level 5 per. Mov. Avg. (Mean Summer Level)
Whakatane at Huitieke

Environment Bay of Plenty 393
Environment Bay of Plenty River Level Recording Station
River Waimana Site Gorge Site Number 15511 Grid Reference W16: 366 644 Start of Record October 1950 Data Capture Rate 97% Data Summary From January 1951 To December 2005 Data Audited From To December 2005 Equipment History
01/10/50: Staff gauge and chart recorder. 29/08/69: Float with F&P digital recorder. 12/06/79: Float with L&S digital recorder. 19/07/99: Float with Aquitel Remote. Comments on Stage/Discharge Ratings Site has a natural gravel control. Ratings are available to convert Stage (mm) to Flow (l/s). Ratings cease on 27 November 1980. General Comments This site recorded flow from October 1950 to November 1980 for the Hamilton Hydrological Survey. Site was handed over to B.O.P.C.C. on 03/01/81 and now operates for flood monitoring purposes. Site is now operated by Environment Bay of Plenty as part of its Natural Environmental Monitoring Network.
SITE LOCATION Waimana at Gorge

394 Environmental Publication 2007/06
Station Comments Waimana River at Waimana Gorge. Site Number 15511, on River Number 155090. The local recording authority is Environment Bay of Plenty. The site is situated 29.5 kilometres from mouth. The control is a natural gravel riverbed. 01/10/50 Stage/time data for the period 501001 to 660121 has been hand tabulated from the water level charts by Power Division staff at Head Office. In general not enough points have been taken off the charts to accurately define the shape of some hydrographs. Flood peaks have been tabulated but filed at times to suit the tabulation interval being used. Although there are some variations, tabulation intervals are: 501001 to 560101 3 hourly values 560101 to 610709 12 hourly values 610709 to 660121 6 hourly values With some 2 and 3 hourly values for these periods and in extreme cases, some daily mean discharges are 38% higher than they should be. In general the daily mean discharge are in error between +/-3%. 27/11/80 - Site changed from rated site to non-rated site on 801127. 02/01/81 -Site handed over to B.O.P.C.C. on 810103. 19/07/91 - Aquitel logger installed for telemetered flood warning purposes.
31/12/95 - Periods of missing record and synthetic data occur throughout the data record. Some periods of missing record have been filled with synthetic data based on comparisons with some or all of the following sites. Meteorological gauges; Ruatoki (B87101), Matahi (B887212), Waimana (B87103), Ogilvie Bridge (873103), and water levels Whakatane at Whakatane (15514) and Waimana at Ogilvie Bridge (15536).

Environment Bay of Plenty 395
Environment Bay of Plenty Hydrological Level Summary
Date Complied December 2006 Site Number 15511 Compiled by G R Ellery River Waimana Station Gorge Metric Map Reference W16: 642 375 Catchment Area (km2) 440 Period of Summary 1951 to 2005 Statistical Summary
Level (mm) Moturiki Datum Minimum Level 19068 Maximum Level 26194 Mean Annual Minimum Level 19548 Mean Annual Maximum Level 22968 Mean Level 19905 Mean Summer Level 19822 Median Level 19882 Mean Autumn Level 19826 Mean Winter Level 20035 Mean Spring Level 19943 Low Level Distribution Fit GEV Peak Level Distribution Fit Gumbel 7 day Low Level (Minimum) 19085 Peak Level (5 yr Return) 23846 7 Day Low Level (Mean Annual) 19513 Peak Level (10 yr Return) 24562 7 day Low Level (5 yr Return) 19338 Peak Level (20 yr Return) 25248 7 Day Low Level (10 yr Return) 19222 Peak Level (50 yr Return) 26136 Peak Level (100 yr Return)
Annual Summaries Level (mm) Moturiki Datum Level (mm) Moturiki Datum Year Minimum Mean Maximum
Year Minimum Mean Maximum 1980 19681 20073 22404 1993 19729 19910 22374 1981 19700 19957 21586 1994 19747 20042 22760 1982 19702 20070 24262 1995 19799 20221 23912 1983 19784 20072 23334 1996 19853 20144 22669 1984 19809 20129 22966 1997 19796 20052 22890 1985 19803 20138 22276 1998 19739 20216 26144 1986 19774 20118 23734 1999 19785 20143 24424 1987 19845 20147 23679 2000 19810 20052 22005 1988 19839 20207 23095 2001 19751 20169 23811 1989 19836 20173 23121 2002 19733 19972 22152 1990 19840 20182 24136 2003 19656 20078 23432 1991 19826 20109 22346 2004 19764 20238 25999 1992 19681 20073 22404 2005 19898 20131 22014
Level Distribution
Level (l/s) Percentiles 0 1 2 3 4 5 6 7 8 9
0 26194 21306 20947 20778 20668 20587 20527 20476 20434 20397 10 20364 20333 20307 20283 20261 20242 20223 20205 20188 20173 20 20159 20145 20132 20120 20108 20097 20086 20076 20066 20056 30 20046 20037 20028 20018 20010 20001 19992 19984 19976 19969 40 19961 19953 19945 19937 19928 19920 19913 19906 19898 19890 50 19882 19875 19867 19859 19852 19844 19837 19829 19820 19811 60 19802 19793 19785 19775 19766 19757 19748 19738 19727 19715 70 19702 19688 19676 19664 19651 19641 19629 19620 19610 19598 80 19586 19571 19553 19534 19518 19496 19477 19457 19437 19421 90 19399 19376 19358 19337 19315 19296 19274 19244 19209 19165 100 19068

396 Environmental Publication 2007/06
20000
21000
22000
23000
24000
25000
26000
27000
1950 1960 1970 1980 1990 2000
Year
Leve
l (m
m)
Maximum Level 5 per. Mov. Avg. (Maximum Level)
19000
19100
19200
19300
19400
19500
19600
19700
19800
19900
20000
1950 1960 1970 1980 1990 2000
Year
Leve
l (m
m)
Minimum Level 5 per. Mov. Avg. (Minimum Level)
1930019400195001960019700198001990020000201002020020300
1950 1960 1970 1980 1990 2000
Year
Leve
l (m
m)
Mean Level 5 per. Mov. Avg. (Mean Level)
1900019200194001960019800200002020020400206002080021000
1950 1960 1970 1980 1990 2000
Year
Leve
l (m
m)
Mean Autumn Level 5 per. Mov. Avg. (Mean Autumn Level)
19400
19600
19800
20000
20200
20400
20600
20800
1950 1955 1960 1965 1970 1975 1980 1985 1990 1995 2000 2005
Year
Leve
l (m
m)
Mean Winter Level 5 per. Mov. Avg. (Mean Winter Level)
19200
19400
19600
19800
20000
20200
20400
20600
1950 1960 1970 1980 1990 2000
Year
Leve
l (m
m)
Mean Spring Level 5 per. Mov. Avg. (Mean Spring Level)
19000
19200
19400
19600
19800
20000
20200
20400
20600
1950 1960 1970 1980 1990 2000
Year
Leve
l (m
m)
Mean Summer Level 5 per. Mov. Avg. (Mean Summer Level)
Waimana at Gorge

Environment Bay of Plenty 397
Environment Bay of Plenty River Level Recording Station
River Waimana Site Ranger Station Site Number 15544 Grid Reference W16:642 375 Start of Record February 1995 Data Capture Rate 100% Data Summary From January 1996 To December 2005 Data Audited From February 1995 To December 2005 Equipment History
20/02/95: Kainga WRIC and Kainga encoder installed. 11/04/96: Kainga WRIC datalogger as backup. 02/09/99: DS-4483 logger installed with Sutron pressure sensor, with a CR500 and Kainga P.T. for backup. Comments on Stage/Discharge Ratings Site control is by a bedrock structure located across the channel 10 metres downstream of site. Ratings are available to convert Stage (mm) to Flow (l/s).
General Comments Site installed 950209 by Environment Bay of Plenty. Site is operated for flood monitoring purposes and is also part of the Natural Environment Regional Monitoring Network. Large flood in 1998 lifted stream bed significantly approximately 600mm.
SITE LOCATION Waimana at Ranger Station

398 Environmental Publication 2007/06
Station Comments Waimana River at Ranger Station. Site Number 15544, on River Number 155090. The site is situated 40.25 kilometres from the confluence with the Whakatane River and 62 kilometres from the mouth of the Whakatane River. NZMS 260 Reference W16:696 153. Drains 216 km2. The control is by a bedrock structure located across the channel 10 metres downstream of the site. 09/02/95 - Six steel cylinders bolted together with an aluminium recorder house. 20/02/95 - Kainga WRIC and Kainga shaft encoder installed. 11/04/96 - L&S recorder installed. Kainga WRIC data is used as backup. 02/07/98 - Missing record from 980702 64500 to 980707 123000 due to site being destroyed during flood event. Maximum water levels were pegged from floodmarks (on 3/7/98) with a level of 7.65 metres measured. 02/07/98 - Slope area gauging calculation (Gauging number 62) resulted in a discharge of 913.6 cumecs. Mean area was 245.724m2. A Mannings n of 0.035 was used in the calculation. This event raised the level of the bed by approximately 600mm. This addition of bed material completely buried the bedrock control. Removal of the bed material over time could result in a migration of the rating curves back to historical positions until the control takes effect again. 25/01/99 - Missing record from 990125 50000 to 990127 124500 due to new site installation. No rainfall was recorded at surrounding rain gauges, a straight line recession was implemented. New equipment includes a Sutron Gas Bubbler P.T. (0-15 metre range). A Kainga PT 0-10 metre range. Logging is done via a CR500. 02/09/99 – DS-4483 logger installed with Sutron P.T. connected to it as the main recording instrument. CR500 with Kainga P.T. provides backup record. 29/09/03 – Missing record from 20030929 at 160000 to 20031002 at 134500 due to programme fault in logger. 26mm of rainfall fell over this period.
For additional information, please see recording authority.
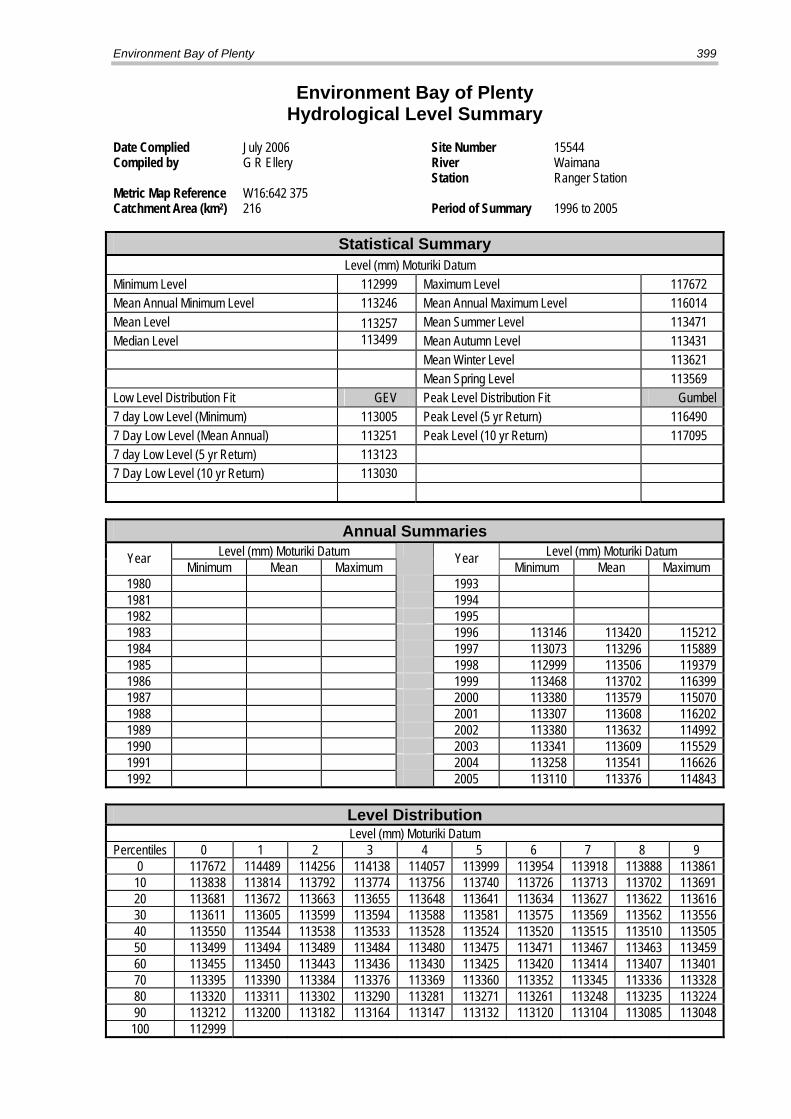
Environment Bay of Plenty 399
Environment Bay of Plenty Hydrological Level Summary
Date Complied July 2006 Site Number 15544 Compiled by G R Ellery River Waimana Station Ranger Station Metric Map Reference W16:642 375 Catchment Area (km2) 216 Period of Summary 1996 to 2005 Statistical Summary
Level (mm) Moturiki Datum Minimum Level 112999 Maximum Level 117672 Mean Annual Minimum Level 113246 Mean Annual Maximum Level 116014 Mean Level 113257 Mean Summer Level 113471 Median Level 113499 Mean Autumn Level 113431 Mean Winter Level 113621 Mean Spring Level 113569 Low Level Distribution Fit GEV Peak Level Distribution Fit Gumbel 7 day Low Level (Minimum) 113005 Peak Level (5 yr Return) 116490 7 Day Low Level (Mean Annual) 113251 Peak Level (10 yr Return) 117095 7 day Low Level (5 yr Return) 113123 7 Day Low Level (10 yr Return) 113030
Annual Summaries Level (mm) Moturiki Datum Level (mm) Moturiki Datum Year Minimum Mean Maximum
Year Minimum Mean Maximum 1980 1993 1981 1994 1982 1995 1983 1996 113146 113420 115212 1984 1997 113073 113296 115889 1985 1998 112999 113506 119379 1986 1999 113468 113702 116399 1987 2000 113380 113579 115070 1988 2001 113307 113608 116202 1989 2002 113380 113632 114992 1990 2003 113341 113609 115529 1991 2004 113258 113541 116626 1992 2005 113110 113376 114843
Level Distribution Level (mm) Moturiki Datum
Percentiles 0 1 2 3 4 5 6 7 8 9 0 117672 114489 114256 114138 114057 113999 113954 113918 113888 113861 10 113838 113814 113792 113774 113756 113740 113726 113713 113702 113691 20 113681 113672 113663 113655 113648 113641 113634 113627 113622 113616 30 113611 113605 113599 113594 113588 113581 113575 113569 113562 113556 40 113550 113544 113538 113533 113528 113524 113520 113515 113510 113505 50 113499 113494 113489 113484 113480 113475 113471 113467 113463 113459 60 113455 113450 113443 113436 113430 113425 113420 113414 113407 113401 70 113395 113390 113384 113376 113369 113360 113352 113345 113336 113328 80 113320 113311 113302 113290 113281 113271 113261 113248 113235 113224 90 113212 113200 113182 113164 113147 113132 113120 113104 113085 113048 100 112999

400 Environmental Publication 2007/06
114500115000115500116000116500117000117500118000118500119000119500120000
1995 1997 1999 2001 2003 2005
Year
Leve
l (m
m)
Series1 5 per. Mov. Avg. (Series1)
113250113300113350113400113450113500113550113600113650113700113750
1995 1997 1999 2001 2003 2005
Year
Leve
l (m
m)
Mean level 5 per. Mov. Avg. (Mean level)
112900
113000
113100
113200
113300
113400
113500
1995 1997 1999 2001 2003 2005
Year
Leve
l (m
m)
Minimum Level 5 per. Mov. Avg. (Minimum Level)
113100
113200
113300
113400
113500
113600
113700
1995 1997 1999 2001 2003 2005
Year
Leve
l (m
m)
Mean Autumn Level 5 per. Mov. Avg. (Mean Autumn Level)
113300
113400
113500
113600
113700
113800
113900
1995 1997 1999 2001 2003 2005
Year
Leve
l (m
m)
Mean Winter Level 5 per. Mov. Avg. (Mean Winter Level)
113200
113300
113400
113500
113600
113700
113800
1995 1997 1999 2001 2003 2005
Year
Leve
l (m
m)
Mean Spring Level 5 per. Mov. Avg. (Mean Spring Level)
113000
113100
113200
113300
113400
113500
113600
113700
113800
1995 1997 1999 2001 2003 2005
Year
Flow
(l/s
)
Mean Summer Level 5 per. Mov. Avg. (Mean Summer Level)
Waimana at Ranger Station

Environment Bay of Plenty 401
Environment Bay of Plenty River Level Recording Station
River Otara Site Opotiki Wharf Site Number 16007 Grid Reference W15:861 468 Start of Record August 1990 Data Capture Rate 94% Data Summary From January 1991 To December 2005 Data Audited From August 1990 To December 2005 Equipment History
01/08/90: 5 metre range P.T. and datalogger. Comments on Stage/Discharge Ratings Ratings are available to convert Stage (mm) to Reduced Level (mm) in Moturiki Datum.
General Comments Site is operated by Environment Bay of Plenty for engineering design on the Waioeka-Otara flood protection scheme.
SITE LOCATION Otara at Opotiki Wharf

402 Environmental Publication 2007/06
Station Comments Otara River at Opotiki Wharf. Site Number 16007, on River Number 160000. The local recording authority is Environment Bay of Plenty. The site is situated on the Otara River upstream of the confluence with the Waioeka River. The site is tidally influenced and is located 2 kilometres from the mouth. 02/08/90 Water level recording commences. Data is recorded at six minute intervals. 31/12/95 Periods of missing record occur throughout the data, due to power failure and equipment malfunction.
For additional information, please see recording authority.

Environment Bay of Plenty 403
Environment Bay of Plenty Hydrological Level Summary
Date Complied December 2006 Site Number 16007 Compiled by G R Ellery River Otara Station Opotiki Wharf Metric Map Reference W15:861 468 Catchment Area (km2) 257 Period of Summary 1991 to 2005 Statistical Summary
Level (mm) Minimum Level -1107 Maximum Level 2743 Mean Annual Minimum Level Mean Annual Maximum Level Mean Level 234 Mean Summer Level Median Level 233 Mean Autumn Level Mean Winter Level Mean Spring Level Low Level Distribution Fit Utilised GEV Peak Level Distribution Fit Utilised GEV 7 day Low Level (Minimum) -86 Peak Level (5 yr Return) 2340 7 Day Low Level (Mean Annual) -1 Peak Level (10 yr Return) 2532 7 day Low Level (5 yr Return) -35 Peak Level (20 yr Return) 2688 7 Day Low Level (10 yr Return) -58 Peak Level (50 yr Return) Peak Level (100 yr Return)
Annual Summaries Level (mm) Level (mm) Year Minimum Mean Maximum
Year Minimum Mean Maximum 1980 1993 -941 150 1370 1981 1994 -981 194 1516 1982 1995 -948 195 2036 1983 1996 -1107 231 2090 1984 1997 -909 204 1741 1985 1998 -1042 233 2743 1986 1999 -943 262 2551 1987 2000 -813 264 1639 1988 2001 -801 271 2030 1989 2002 -767 243 1862 1990 2003 -736 285 2253 1991 -972 220 2341 2004 -742 233 2148 1992 -940 223 1554 2005 -800 276 2076
Level Distribution
Level (mm) Percentiles 0 1 2 3 4 5 6 7 8 9
0 2743 1249 1158 1104 1064 1031 1004 980 958 938 10 919 901 884 868 852 837 822 807 793 778 20 764 750 736 721 707 693 678 664 649 633 30 618 601 585 568 550 533 515 496 477 458 40 439 419 399 378 358 337 316 295 275 254 50 233 212 191 171 150 130 109 89 70 50 60 31 12 -7 -26 -44 -63 -80 -98 -116 -133 70 -150 -166 -183 -199 -215 -230 -246 -261 -276 -291 80 -306 -321 -336 -351 -367 -382 -397 -413 -429 -446 90 -463 -481 -500 -521 -543 -568 -596 -630 -672 -733 100 -1107

404 Environmental Publication 2007/06
0
500
1000
1500
2000
2500
3000
1990 1992 1994 1996 1998 2000 2002 2004
Year
Leve
l (m
m)
Maximum Level 5 per. Mov. Avg. (Maximum Level)
-1200
-1100
-1000
-900
-800
-700
-600
1990 1992 1994 1996 1998 2000 2002 2004
Year
Leve
l (m
m)
Minimum Level 5 per. Mov. Avg. (Minimum Level)
0
50
100
150
200
250
300
1990 1992 1994 1996 1998 2000 2002 2004
Year
Leve
l (m
m)
Mean Level 5 per. Mov. Avg. (Mean Level)
050
100150200250300350400
1990 1992 1994 1996 1998 2000 2002 2004
Year
Leve
l (m
m)
Mean Autumn Level 5 per. Mov. Avg. (Mean Autumn Level)
0
50
100
150
200
250
300
350
1990 1992 1994 1996 1998 2000 2002 2004
Year
Leve
l (m
m)
Mean Winter Level 5 per. Mov. Avg. (Mean Winter Level)
0
50
100
150
200
250
300
1990 1992 1994 1996 1998 2000 2002 2004
Year
Leve
l (m
m)
Mean Spring Level 5 per. Mov. Avg. (Mean Spring Level)
0
50
100
150
200
250
300
350
1990 1992 1994 1996 1998 2000 2002 2004
Year
Leve
l (m
m)
Mean Summer Level 5 per. Mov. Avg. (Mean Summer Level)
Otara at Opotiki Wharf

Environment Bay of Plenty 405
Environment Bay of Plenty River Level Recording Station
River Waioeka Site Mouth of Gorge Site Number 15912 Grid Reference W16:862 365 Start of Record November 1981 Data Capture Rate 94% Data Summary From January 1987 To December 2005 Data Audited From December 1989 To December 2005 Equipment History
27/1/81: 10 metre range monthly Foxboro chart recorder. 07/12/89: 10 metre range P.T. with Aquitel Remote. 16/05/90: 6 metre range backup Foxboro chart recorder. 26/10/99: 10 metre range P.T. with I Quest DS4483 datalogger. Comments on Stage/Discharge Ratings Ratings are available to convert Stage (mm) to Reduced Level (mm) in Moturiki Datum
General Comments Site was originally operated by the Gisborne District Council and its predecessor the East Cape Catchment Board. Site was handed over to Environment Bay of Plenty in November 1989. This site is operated for flood monitoring and warning purposes.
SITE LOCATION Waioeka at Mouth of Gorge

406 Environmental Publication 2007/06
Station Comments Waioeka River at Mouth of Gorge. Site Number 15912, on River Number 15900. The local recording authority is Environment Bay Of Plenty. The site is situated 13.62 kilometres from the mouth of the river. The site is affected by gravel extraction from gravel beach, which forms part of the downstream control. 27/11/81 Data for the period 811127 112500 to 890424 104700 has been obtained from the Gisborne District Council who then operated the site under the East Cape Catchment Board organisation. 13/03/86 First R/L rating recorded. 13760mm Moturiki Datum. 01/11/89 Site handed over to Environment Bay of Plenty. 31/12/95 Periods of missing record and synthetic data occur throughout the data set. Some periods of Synthetic data are based on a correlation with Otara at Browns Bridge (16002).
For additional information, please see recording authority.

Environment Bay of Plenty 407
Environment Bay of Plenty Hydrological Level Summary
Date Complied December 2006 Site Number 15912 Compiled by G R Ellery River Waioeka Station Mouth of Gorge Metric Map Reference W16:862 365 Catchment Area (km2) 750 Period of Summary 1987 to 2005 Statistical Summary
Level (mm) Minimum Level 13572 Maximum Level 20520 Mean Annual Minimum Level 14191 Mean Annual Maximum Level 17970 Mean Level 14646 Mean Summer Level 14562 Median Level 14636 Mean Autumn Level 14549 Mean Winter Level 14795 Mean Spring Level 14697 Low Level Distribution Fit Utilised GEV Peak Level Distribution Fit Utilised Gumbel 7 day Low Level (Minimum) 13605 Peak Level (5 yr Return) 18804 7 Day Low Level (Mean Annual) 14235 Peak Level (10 yr Return) 19481 7 day Low Level (5 yr Return) 13965 Peak Level (20 yr Return) 20131 7 Day Low Level (10 yr Return) 13755 Peak Level (50 yr Return) Peak Level (100 yr Return)
Annual Summaries Level (mm) Level (mm) Year Minimum Mean Maximum
Year Minimum Mean Maximum 1980 1993 14474 14654 17039 1981 1994 14487 14795 17398 1982 1995 14537 14862 19157 1983 1996 14588 14867 17998 1984 1997 14428 14776 17462 1985 1998 14269 14814 20520 1986 1999 13998 14504 19227 1987 14246 14825 17898 2000 13834 14487 16567 1988 14221 14688 16457 2001 14061 14553 17746 1989 14386 14885 17590 2002 13717 14201 17547 1990 14301 14898 18492 2003 13572 14254 18919 1991 14496 14842 19191 2004 13836 14379 18523 1992 14446 14849 17271 2005 13738 14288 16436
Level Distribution
Level (mm) Percentiles 0 1 2 3 4 5 6 7 8 9
0 20520 16019 15686 15530 15427 15349 15286 15236 15193 15153 10 15120 15087 15057 15031 15007 14986 14967 14949 14932 14915 20 14900 14887 14873 14860 14848 14837 14826 14816 14806 14796 30 14787 14778 14769 14761 14753 14745 14737 14729 14721 14713 40 14705 14697 14690 14682 14676 14669 14662 14656 14649 14642 50 14636 14630 14623 14618 14613 14607 14601 14595 14589 14583 60 14577 14570 14564 14556 14549 14542 14535 14527 14518 14510 70 14502 14491 14476 14457 14438 14416 14393 14373 14353 14335 80 14315 14295 14275 14254 14231 14207 14188 14167 14141 14118 90 14094 14068 14041 14013 13987 13951 13916 13879 13818 13749 100 13572

408 Environmental Publication 2007/06
15000
16000
17000
18000
19000
20000
21000
1987 1989 1991 1993 1995 1997 1999 2001 2003 2005
Year
Leve
l (m
m)
Maximum Level 5 per. Mov. Avg. (Maximum Level)
13400
13600
13800
14000
14200
14400
14600
14800
15000
1987 1989 1991 1993 1995 1997 1999 2001 2003 2005
Year
Leve
l (m
m)
Minimum Level 5 per. Mov. Avg. (Minimum Level)
1400014100142001430014400145001460014700148001490015000
1987 1989 1991 1993 1995 1997 1999 2001 2003 2005
Year
Leve
l (m
m)
Mean Level 5 per. Mov. Avg. (Mean Level)
138001400014200144001460014800150001520015400
1987 1989 1991 1993 1995 1997 1999 2001 2003 2005
Year
Leve
l (m
m)
Mean Autumn Level 5 per. Mov. Avg. (Mean Autumn Level)
138001400014200144001460014800150001520015400
1987 1989 1991 1993 1995 1997 1999 2001 2003 2005
Year
Leve
l (m
m)
Mean Winter Level 5 per. Mov. Avg. (Mean Winter Level)
13800
14000
14200
14400
14600
14800
15000
15200
15400
1987 1989 1991 1993 1995 1997 1999 2001 2003 2005
Year
Leve
l (m
m)
Mean Spring Level 5 per. Mov. Avg. (Mean Spring Level)
13800
14000
14200
14400
14600
14800
15000
15200
15400
1987 1989 1991 1993 1995 1997 1999 2001 2003 2005
Year
Leve
l (m
m)
Mean Summer Level 5 per. Mov. Avg. (Mean Summer Level)
Waioeka at Mouth of Gorge

Environment Bay of Plenty 409
Environment Bay of Plenty River Level Recording Station
River Waioeka Site Cableway Site Number 15901 Grid Reference W16:876 219 Start of Record March 1958 Data Capture Rate 95% Data Summary From January 1959 To December 2005 Data Audited From March 1958 To December 2005 Equipment History 10/03/58: Monthly Lea chart recorder. 03/03/59: Monthly Kent chart recorder. 04/09/69: Float with F&P digital recorder. 16/02/77: Backup Foxboro chart recorder. 15/12/89: 10 metre range P.T. and Aquitel (EBOP) 09/12/93: Encoder and WRIC data logger. 28/07/94: P.T. replaced by encoder (EBOP). Comments on Stage/Discharge Ratings Control is by stable natural channel. Ratings available to convert stage (mm) to Level (mm).
General Comments Site is shared by Environment Bay of Plenty and NIWA Rotorua. Environment Bay of Plenty equipment is telemetered and used for flood warning and monitoring purposes
SITE LOCATION Waioeka at Cableway

410 Environmental Publication 2007/06
Station Comments Waioeka River at Gorge Cableway. Site number 15901, on River Number 159000. The local recording authority is NIWA, Rotorua. The site is situated 36.6 kilometres from the river mouth. Environment B·O·P uses the site for flood monitoring purposes. 24/10/56 - Staff gauge installed 561024. 26/01/56 - Gaugings at 561026, 580719, 581224, 640311 carried out by slope area method. 10/03/58 - Recorder installed on 580317 is a 20 foot range monthly Lea. 01/09/67 - Logs cleared around staff gauge and intakes causing drop in stage of 150mm. 30/06/76 - Control of site transferred from Rotorua to Gisborne Water Resources Survey on 760630. 23/01/79 - Periods of missing record occurred from November 1977 to January 1979 due to intake problems. New middle intake installed 790123 causing 75mm rise in stage. 18/11/86 - Continued problems with intake. Bottom intake extended by approximately 800mm and tower desilted on 861118. 2/07/98 - Data from 980702 083000 to 980702 094500 is derived by measuring flood peak inside tower after event to an accuracy of +/- 5 mm. Peak time was derived by following the rate of rise up the event. Float hit recorder house floor during flood. 21/07/98 - Data from 980721 60000 to 980722 230000 is a flat trace due to silt build up in large flood. 18/12/03 - Syphon tube length shortened causing a rise in stage from 1639 to 1700 mm. This rise has been left in the data. The flow will be fixed with a rating change at this date and time.
For additional information, please see recording authority.

Environment Bay of Plenty 411
Environment Bay of Plenty Hydrological Level Summary
Date Complied December 2006 Site Number 15901 Compiled by G R Ellery River Waioeka Station Cableway Metric Map Reference W16:876 219 Catchment Area (km2) 640 Period of Summary 1959 to 2005 Statistical Summary
Level (mm) Minimum Level 61446 Maximum Level 70888 Mean Annual Minimum Level 61800 Mean Annual Maximum Level 66555 Mean Level 62297 Mean Summer Level 62156 Median Level 62223 Mean Autumn Level 62212 Mean Winter Level 62476 Mean Spring Level 62369 Low Level Distribution Fit Utilised GEV Peak Level Distribution Fit Utilised Gumbel 7 day Low Level (Minimum) 61449 Peak Level (5 yr Return) 67564 7 Day Low Level (Mean Annual) 61782 Peak Level (10 yr Return) 68547 7 day Low Level (5 yr Return) 61652 Peak Level (20 yr Return) 69404 7 Day Low Level (10 yr Return) 61570 Peak Level (50 yr Return) 70513 Peak Level (100 yr Return)
Annual Summaries Level (mm) Level (mm) Year Minimum Mean Maximum
Year Minimum Mean Maximum 1980 61800 62512 66067 1993 61793 62043 65523 1981 62023 62594 65620 1994 61770 62186 66025 1982 61965 62341 64507 1995 61725 62212 68178 1983 61736 62429 66597 1996 61793 62195 66106 1984 62118 62443 66390 1997 61781 62091 66077 1985 62097 62462 67253 1998 61714 62213 70750 1986 61972 62407 65470 1999 61661 62112 67445 1987 62088 62466 68440 2000 61570 62001 64629 1988 61965 62386 68008 2001 61602 62129 66023 1989 61927 62389 66167 2002 61549 61944 65817 1990 61883 62293 66803 2003 61529 62035 67577 1991 61835 62228 67717 2004 61582 62058 66485 1992 61815 62199 65519 2005 61488 61899 64980
Level Distribution
Level (mm) Percentiles 0 1 2 3 4 5 6 7 8 9
0 70888 64103 63612 63371 63222 63112 63028 62956 62897 62848 10 62806 62770 62737 62708 62680 62654 62631 62610 62590 62571 20 62553 62536 62520 62506 62492 62479 62466 62453 62441 62429 30 62417 62406 62394 62383 62372 62361 62351 62341 62331 62322 40 62312 62302 62293 62284 62274 62266 62257 62248 62239 62231 50 62223 62215 62207 62199 62190 62181 62173 62164 62155 62146 60 62138 62129 62120 62110 62101 62091 62082 62072 62063 62053 70 62043 62034 62024 62014 62004 61994 61984 61974 61964 61953 80 61942 61930 61917 61906 61895 61884 61874 61862 61851 61840 90 61826 61809 61792 61773 61754 61733 61706 61677 61646 61586 100 61446

412 Environmental Publication 2007/06
63000
64000
65000
66000
67000
68000
69000
70000
71000
72000
1955 1960 1965 1970 1975 1980 1985 1990 1995 2000 2005
Year
Leve
l (m
m)
Maximum Level 5 per. Mov. Avg. (Maximum Level)
61400
61500
61600
61700
61800
61900
62000
62100
62200
62300
1955 1960 1965 1970 1975 1980 1985 1990 1995 2000 2005
Year
Leve
l (m
m)
Minimum Level 5 per. Mov. Avg. (Minimum Level)
6180061900620006210062200623006240062500626006270062800
1955 1960 1965 1970 1975 1980 1985 1990 1995 2000 2005
Year
Leve
l (m
m)
Mean Level 5 per. Mov. Avg. (Mean Level)
61600
61800
62000
62200
62400
62600
62800
63000
1955 1960 1965 1970 1975 1980 1985 1990 1995 2000 2005
Year
Leve
l (m
m)
Mean Autumn Level 5 per. Mov. Avg. (Mean Autumn Level)
61800
62000
62200
62400
62600
62800
63000
63200
1955 1960 1965 1970 1975 1980 1985 1990 1995 2000 2005
Year
Leve
l (m
m)
Mean Winter Level 5 per. Mov. Avg. (Mean Winter Level)
61800
62000
62200
62400
62600
62800
63000
1955 1960 1965 1970 1975 1980 1985 1990 1995 2000 2005
Year
Leve
l (m
m)
Mean Spring Level 5 per. Mov. Avg. (Mean Spring Level)
6160061700618006190062000621006220062300624006250062600
1955 1960 1965 1970 1975 1980 1985 1990 1995 2000 2005
Year
Leve
l (m
m)
Mean Summer Level 5 per. Mov. Avg. (Mean Summer Level)
Waioeka at Cableway

Environment Bay of Plenty 413
Environment Bay of Plenty River Level Recording Station
River Otara Site Browns Bridge Site Number 16002 Grid Reference W16:931 376 Start of Record March 1979 Data Capture Rate 90% Data Summary From January 1980 To December 2005 Data Audited From December 1989 To December 2005 Equipment History 02/06/72 - Recorder installed is an Ericsson. 01/02/79: Monthly Foxboro chart recorder 13/12/89: 10 metre P.T. & Aquitel Remote 15/11/93: Float with L&S digital recorder. Comments on Stage/Discharge Ratings Site control is by natural gravel bed. Control is unstable and there have been numerous rating changes at this site. Gravel extraction occurs at this site and can cause rating changes. Ratings are available to convert Stage (mm) to Flow (l/s)
General Comments Site was originally operated by the East Cape Catchment Board, before being handed over in November 1989. This site is also used for flood monitoring purposes. Site is now operated by Environment Bay of Plenty as part of its Natural Environment Regional Monitoring Network.
SITE LOCATION Otara at Browns Bridge

414 Environmental Publication 2007/06
Station Comments Otara River at Browns Bridge. Site Number 16002, on River Number 160000. The local recording authority is Environment Bay of Plenty.
The site is situated 20.34 kilometres from the mouth. Lower flow gaugings are performed by wading, higher flow gaugings are performed from the bridge using a gauging crane and suspended meter. The bed in the vicinity of the recorder on the Otara River at Browns Bridge consists mainly of gravels and is subject to regular movement during freshes. During larger events major changes in bed shape are possible with resulting changes in rating shape. At a stage of approximately 1.9 metres bank overflow occurs into berm area.
01/02/79 - Recorder installed is a 5 metre range monthly Foxboro with a time resolution of 281 minutes / mm recorded and a stage resolution of 47mm stage / mm recorded.
01/11/89 - Site handed over to Environment Bay of Plenty. As part of local authority reorganisation. Collection and processing procedures for this data is unknown. This data should be used with caution.
13/12/89 - Recorder installed is an Aquitel remote with a time resolution of 15 minutes connected to a 10metre pressure transducer with an accuracy of 20 mm. Foxboro retained as a backup recorder.
24/12/89 - Missing record from 891224 at 023000 to 900104 at 134500 due to power supply failure. During this period Pakihi (16004) an upstream site recorded a small fresh.
11/10/91 - Site handed over to Environment Bay of Plenty as part of local authority reorganisation. Data from March 1979 transferred to Environment Bay of Plenty. Collection and processing procedures for this data is unknown, use data with caution.
15/11/93 - Stilling well and L&S installed. Recorder has a 15 minute time resolution and a stage resolution of 1 mm.
30/08/94 - Missing record for the period 940830 at 124500 to 940907 at 141500 due to equipment failure.
13/10/95 - Missing record for the period 951013 at 151500 to 951018 at 144500 due to Aquitel remote failure.
26/12/95 - Missing record for the period 951226 at 133000 to 960109 at 093900 due to Aquitel remote failure.
27/05/96 – Missing record for the period 960527 at 083000 to 960626 at 160000 due to siltation of intakes.
14/09/96 - Missing record from 960914 at 201500 to 960920 at 144500 due to recorder failure.
01/10/96 - Missing record from 961001 at 094500 to 961009 at 101500 due to recorder failure
30/09/97 - Missing record from 970930 at 104500 to 971001 at 120000 due to recorder failure.
19/10/97 - Missing record from 971019 at 141500 to 971022 at 104500 due to power supply fault.
23/10/97 - Missing record from 971023 at 060000 to 971024 at 110000 due to Aquitel remote failure.
22/04/01 - Missing record from 20010422 at 070000 to 20010426 at 154500 due to encoder fault.
17/07/04 - Missing record from 20040717 211500 to 20040720 170000 due to failing Handar 436BD encoder.
23/07/04 - Missing record from 20040723 120000 to 20040723 124500.
18/08/04 - Missing record from 20040818 170000 to 20040823 160000 due to failing Handar 436BD encoder.
19/12/04 - Missing record from 20041219 111500 to 2041223 111500. Cause unknown.
17/07/04 - Missing record from 20040717 at 211500 to 20040720 at 170000 due to bank slumping and blocking intakes.
18/08/04 - Missing record from 20040818 at 170000 to 20040823 at 160000 due to encoder jamming.
17/10/05 - Missing record from 20051017 at 184500 to 20051018 at 113000 due to encoder jamming.
For additional information, please see recording authority.

Environment Bay of Plenty 415
Environment Bay of Plenty Hydrological Level Summary
Date Complied August 2006 Site Number 16002 Compiled by G R Ellery River Otara Station Browns Bridge Metric Map Reference W16:931 376 Catchment Area (km2) 254 Period of Summary 1980 to 2005 Statistical Summary
Level (mm) Moturiki Datum Minimum Level 26422 Maximum Level 31127 Mean Annual Minimum Level 26694 Mean Annual Maximum Level 29822 Mean Level 27049 Mean Summer Level 26992 Median Level 26986 Mean Autumn Level 26971 Mean Winter Level 27129 Mean Spring Level 27082 Low Level Distribution Fit GEV Peak Level Distribution Fit GEV 7 day Low Level (Minimum) 26461 Peak Level (5 yr Return) 30405 7 Day Low Level (Mean Annual) 26686 Peak Level (10 yr Return) 30676 7 day Low Level (5 yr Return) 26585 Peak Level (20 yr Return) 30878 7 Day Low Level (10 yr Return) 26521 Peak Level (50 yr Return) 31077
Annual Summaries Level (mm) Moturiki Datum Level (mm) Moturiki Datum Year Minimum Mean Maximum
Year Minimum Mean Maximum 1980 26809 27093 29177 1993 26986 27171 29283 1981 26637 27079 29044 1994 26977 27282 29278 1982 26668 26925 28976 1995 26855 27232 30104 1983 26510 26968 30069 1996 26836 27179 30649 1984 26422 26932 29677 1997 26682 26963 29830 1985 26512 26913 30270 1998 26657 27116 30516 1986 26604 27004 30527 1999 26751 27061 30402 1987 26549 26884 29971 2000 26756 27038 29217 1988 26604 27072 29467 2001 26740 27067 29902 1989 26483 26832 30602 2002 26771 27048 29164 1990 26544 26923 29679 2003 26824 27103 31127 1991 26533 26933 30300 2004 26813 27108 30117 1992 26778 27173 29690 2005 26731 27009 28329
Level Distribution Level (mm) Moturiki Datum
Percentiles 0 1 2 3 4 5 6 7 8 9 0 31127 28375 28042 27851 27729 27639 27576 27527 27485 27447 10 27417 27389 27364 27342 27320 27301 27283 27267 27252 27237 20 27223 27210 27198 27187 27176 27166 27156 27146 27136 27127 30 27117 27109 27101 27093 27085 27078 27071 27065 27058 27052 40 27047 27040 27034 27029 27022 27016 27010 27004 26998 26992 50 26986 26980 26974 26968 26962 26956 26950 26944 26938 26932 60 26926 26921 26915 26910 26905 26899 26894 26888 26883 26878 70 26873 26867 26862 26857 26852 26846 26840 26835 26830 26824 80 26817 26810 26803 26795 26787 26779 26771 26761 26752 26742 90 26730 26717 26703 26689 26675 26658 26636 26614 26582 26553 100 26422

416 Environmental Publication 2007/06
28000
28500
29000
29500
30000
30500
31000
31500
1980 1985 1990 1995 2000 2005
Year
Leve
l (m
m)
Maximum Level 5 per. Mov. Avg. (Maximum Level)
26300
26400
26500
26600
26700
26800
26900
27000
27100
1980 1985 1990 1995 2000 2005
Year
Leve
l (m
m)
Minimum Level 5 per. Mov. Avg. (Minimum Level)
268002685026900269502700027050271002715027200272502730027350
1980 1985 1990 1995 2000 2005
Year
Leve
l (m
m)
Mean Level 5 per. Mov. Avg. (Mean Level)
2650026600267002680026900270002710027200273002740027500
1980 1985 1990 1995 2000 2005
Year
Leve
l (m
m)
Mean Autumn Level 5 per. Mov. Avg. (Mean Autumn Level)
2650026600267002680026900270002710027200273002740027500
1980 1985 1990 1995 2000 2005
Year
Leve
l (m
m)
Mean Winter Level 5 per. Mov. Avg. (Mean Winter Level)
2650026600267002680026900270002710027200273002740027500
1980 1985 1990 1995 2000 2005
Year
Leve
l (m
m)
Mean Spring Level 5 per. Mov. Avg. (Mean Spring Level)
2650026600267002680026900270002710027200273002740027500
1980 1985 1990 1995 2000 2005
Year
Leve
l (m
m)
Mean Summer Level 5 per. Mov. Avg. (Mean Summer Level)
Otara at Browns Bridge

Environment Bay of Plenty 417
Environment Bay of Plenty River Level Recording Station
River Pakihi Site Pakihi Station Site Number 16004 Grid Reference X16:979 325 Start of Record August 1979 Data Capture Rate 86% Data Summary From January 1980 To December 2005 Data Audited From November 1989 To December 2005 Equipment History 28/08/79: 5 metre range monthly Foxboro chart recorder. 23/02/90: 5 metre range P.T. with Aquitel remote. 29/05/95: Backup Foxboro removed. Comments on Stage/Discharge Ratings Ratings are available to convert Stage (mm) to Reduced Level (mm) in assumed datum.
General Comments Site was operated by Gisborne District Council and its predecessor East Cape Catchment Board. The site was handed over to Environment Bay of Plenty in November 1989. This site is used for flood monitoring and warning purposes..
SITE LOCATION Pakihi at Pakihi Station

418 Environmental Publication 2007/06
Station Comments Pakihi River at Pakihi Station. Site Number 16004, on River Number 160020. The local recording authority is Environment Bay of Plenty. The site is situated approx 5.9 kilometres upstream of confluence with Te Waiti Stream Staff gauge records from 640304. This original staff gauge site was approximately 50 metres upstream of house on opposite side of river, but was demolished in slip of 640311. Stilling well installed 640907 on left bank, upstream of house. New recorder site installed on left bank approximately 75 metres downstream of original site. 01/11/89 - Site transferred to Environment Bay of Plenty. Site is not rated, used for level purposes only. 23/02/90 - Aquitel telemetry unit and 5 metre range pressure transducer installed 900223. Useable records from this equipment not available until 900312. Pressure transducer suffers from diurnal fluctuations due to temperature effects. 31/12/95 - Periods of missing record and synthetic data occur throughout the data set. Where possible missing record has been filled with data from the backup recorder. Synthetic data is based on correlations with rainfall record and downstream site Otara at Browns Bridge (16002).
For additional information, please see recording authority.

Environment Bay of Plenty 419
Environment Bay of Plenty Hydrological Level Summary
Date Complied Site Number 16004 Compiled by River Pakihi Station Pakihi Station Metric Map Reference X16:979 325 Catchment Area (km2) 109 Period of Summary 1980 to 2005 Statistical Summary
Level (mm) Minimum Level 24150 Maximum Level 27350 Mean Annual Minimum Level 24403 Mean Annual Maximum Level 26224 Mean Level 24600 Mean Summer Level 24560 Median Level 24554 Mean Autumn Level 24571 Mean Winter Level 24700 Mean Spring Level 24631 Low Level Distribution Fit Utilised Gumbel Peak Level Distribution Fit Utilised GEV 7 day Low Level (Minimum) 24154 Peak Level (5 yr Return) 26660 7 Day Low Level (Mean Annual) 24349 Peak Level (10 yr Return) 26877 7 day Low Level (5 yr Return) 24282 Peak Level (20 yr Return) 27044 7 Day Low Level (10 yr Return) 24245 Peak Level (50 yr Return) 27214 Peak Level (100 yr Return)
Annual Summaries Level (mm) Level (mm) Year Minimum Mean Maximum
Year Minimum Mean Maximum 1980 24632 24845 25872 1993 24295 24485 25824 1981 24527 24743 25576 1994 24374 24619 25763 1982 24611 24801 26046 1995 24359 24577 26436 1983 24528 24817 25920 1996 24377 24617 26778 1984 24513 24851 26157 1997 24409 24591 26449 1985 24572 24780 26312 1998 24410 24619 26634 1986 24938 25066 25426 1999 24324 24541 26292 1987 24353 24632 26113 2000 24382 24638 26083 1988 24299 24545 25756 2001 24393 24617 26299 1989 24388 24589 26450 2002 24367 24586 27018 1990 24311 24587 26234 2003 24292 24554 27350 1991 24248 24518 26728 2004 24164 24449 26200 1992 24274 24514 26634 2005 24150 24369 25472
Level Distribution
Level (mm) Percentiles 0 1 2 3 4 5 6 7 8 9
0 27350 25409 25240 25152 25080 25026 24981 24946 24918 24893 10 24873 24856 24841 24827 24812 24799 24788 24776 24765 24753 20 24744 24732 24722 24712 24704 24696 24688 24681 24675 24669 30 24663 24657 24650 24644 24638 24632 24626 24620 24614 24609 40 24602 24597 24591 24586 24581 24576 24572 24567 24563 24558 50 24554 24551 24546 24542 24538 24535 24531 24527 24524 24520 60 24516 24512 24508 24504 24500 24496 24491 24486 24482 24478 70 24473 24468 24464 24459 24455 24450 24446 24441 24436 24431 80 24426 24421 24416 24411 24406 24401 24395 24388 24382 24376 90 24370 24363 24356 24348 24339 24329 24317 24304 24282 24239 100 24150

420 Environmental Publication 2007/06
25000
25500
26000
26500
27000
27500
1980 1985 1990 1995 2000 2005
Year
Leve
l (m
m)
Maximum Level 5 per. Mov. Avg. (Maximum Level)
24100
24200
24300
24400
24500
24600
24700
24800
24900
25000
1980 1985 1990 1995 2000 2005
Year
Leve
l (m
m)
Minimum Level 5 per. Mov. Avg. (Minimum Level)
24300
24400
24500
24600
24700
24800
24900
25000
25100
25200
1980 1985 1990 1995 2000 2005
Year
Leve
l (m
m)
Mean Level 5 per. Mov. Avg. (Mean Level)
24200
24300
24400
24500
24600
24700
24800
24900
1980 1985 1990 1995 2000 2005
Year
Leve
l (m
m)
Mean Autumn Level 5 per. Mov. Avg. (Mean Autumn Level)
24400
24500
24600
24700
24800
24900
25000
25100
1980 1985 1990 1995 2000 2005
Year
Leve
l (m
m)
Mean Winter Level 5 per. Mov. Avg. (Mean Winter Level)
24300
24400
24500
24600
24700
24800
24900
25000
1980 1985 1990 1995 2000 2005
Year
Leve
l (m
m)
Mean Spring Level 5 per. Mov. Avg. (Mean Spring Level)
24200
24300
24400
24500
24600
24700
24800
24900
25000
1980 1985 1990 1995 2000 2005
Year
Leve
l (m
m)
Mean Summer Level 5 per. Mov. Avg. (Mean Summer Level)
Pakihi at Pakihi Station

Environment Bay of Plenty 421
3.7 Lake Level Data Summaries
The lake level data summaries in this chapter are provided in the following sequences of 4 pages per station:
Page 1 Provides general information regarding the station, such as its location, instrument types, start of record, etc.
Page 2 Lists station comments that should be read in conjunction with the results of the data summary. Note that these comments are an edited selection of the full set of comments. Contact the recording authority for a full set of comments if required.
Page 3 Displays the summary information. If the lake has had significant level control put in place within the period of the summary, then this page will be for the pre-control period.
Page 4 Graphical presentation of a selection of parameters provided in Page 3. If the lake has had significant level control put in place within the period of the summary, then this page will be for the pre-control period.
Page 5 (where applicable) Displays the summary information. If the lake has had significant level control put in place within the period of the summary, then this page will be for the post-control period.
Page 6 (where applicable) Graphical presentation of a selection of parameters provided in Page 5. If the lake has had significant level control put in place within the period of the summary, then this page will be for the post-control period.
The ID No. in Table 3.7 indicates the order in which individual station data summaries are provided in this report.
Table 3.7 Lake Level Monitoring Stations
ID Number Page No. Lake Site Period of Audit
Data Capture Rate (%)
1 411 Rotorua Town Wharf 1953-2005 98 2 415 Rotoiti Okawa Bay 1906-2005 98 3 421 Rotehu Te Pohue Bay 1954-2005 94 4 425 Rotoma Otangiwai Point 1954-2005 97 5 429 Okataina Tauranganui Bay 1953-2005 99 6 433 Okareka Acacia Rd. 1966-2005 86 7 437 Tikitapu Tarawera Rd. 1972-2005 100 8 441 Tarawera Te Wairoa 1926-2005 96 9 445 Rotokakahi Wairoa Outlet 1973-2005 100
10 449 Rotomahana Crater Bay 1925-2005 90 11 453 Okaro Reserve 1990-2005 100 12 457 Rerewhakaaitu Homestead Arm 1984-2005 96


Environment Bay of Plenty 423


Environment Bay of Plenty 425
Environment Bay of Plenty Lake Level Recording Station
Lake Rotorua Site Town Wharf Site Number 14615 Grid Reference U16: 951 364 Start of Record July 2003 Data Capture Rate 98% Data Summary From January 1953 To December 2005 Data Audited From NIWA (pre - July 2003) To December 2005 Equipment History 07/03/66: 1.5 metre range monthly Kent chart recorder. 27/07/73: Hourly F&P digital recorder.
16/07/03: 5m range PT and CR510 data logger 31/10/03: Float with DS-4483 data logger
Comments on Stage/Discharge Ratings Ratings are available to convert Stage (mm) to Reduced Level (mm) in Moturiki Datum. Ratings are available to convert Stage (mm) to Discharge (l/s) through the Ohau Channel.
General Comments Lake levels are controlled by stop logs at the outlet weir. Data from September 1953 to March 1966 comes from Lake Rotorua at Wharf (Site No. 14615). Subsequent data was provided by the NIWA (Rotorua) operated site at Mission Bay, until the Rotorua Wharf site was re-instated by Environment BOP in July 2003. NOTE: Benchmarks in the area of the Mission Bay recorder are known to be sinking. Refer enquiries to the appropriate recording authority.
SITE LOCATION Rotorua at Town Wharf

426 Environmental Publication 2007/06
Station Comments Lake Rotorua at Wharf. Site number 14615.
Surface Area (km2)
Average Depth (m)
Maximum Depth (m)
Maximum Length (km)
Maximum Width (km)
Type
80 11.0 44.8 12.1 9.7 Volcanic Source: Waters of New Zealand (1992). The dataset is not homogeneous because the lake level outlet control was severely modified by enlargement of Ohau Channel in 1972-73. This resulted in a drop in lake level of around 0.4 metre. Following that date lake levels were controlled by gabions until a permanent structure was completed in September 1989. The lake level frequency analysis therefore cannot be carried out using conventional techniques. It is achieved by a hydraulic transformation of the lake outflows frequency. This results in substantially lower levels than those estimated by the standard level frequency method. The site is situated at the Rotorua Lakefront, approximately 80m from the shore, on a wharf used by charter and scenic cruise vessels. The lake level is governed by a weir at the opposite end of the lake (Ohau Channel, draining to Lake Rotoiti). The local recording authority is Environment Bay of Plenty. Periods of synthetic data occur throughout the record. Synthetic data compiled using Mission Bay recorder, at northern end of Lake Rotorua. 31/08/52 Data from 31/08/52 240000 to 66/03/05 240000 are taken from Lake Rotorua at Wharf. 31/12/58 Only four readings were taken from January 1959 to March 1959. 07/03/66 Data from 07/03/66 to 16/07/03 are taken from Mission Bay recorder, courtesy of NIWA, Rotorua. Phone (07) 346 1950. 24/04/72 Daily recorder installed to measure seiche time intervals from 24/04/72 to 19/05/72. Reconstructed weekly charts held by NIWA, Rotorua. 30/04/89 A new weir was constructed between 30/04/89 120000 and 22/09/89 120000. The weir is designed to keep the level of Lake Rotorua high in times of low inflows. To help modify flows in times of extremes, a series of stop logs can be added or removed to regulate the flow. There can be a maximum of three stop logs in each of the front, middle and back positions on the weir. 16/07/03 Rotorua Wharf site resurrected 16/07/03. Pressure transducer and Campbell CR510 datalogger installed, recording at two minute intervals until 28/08/03, when interval was increased to 30 minutes. Purpose was to determine relationship between the existing Rotorua Wharf staff gauge and the NIWA recorder at Mission Bay. Mission Bay recorder appears to be overstating lake level by approximately 40mm. 31/10/03 A permanent stilling well recorder site was established at Rotorua Wharf (Lakefront), to ensure lake level is managed at a point that enables the Rotorua Wharf boat operators to avoid running aground.
For additional information, please see recording authority.
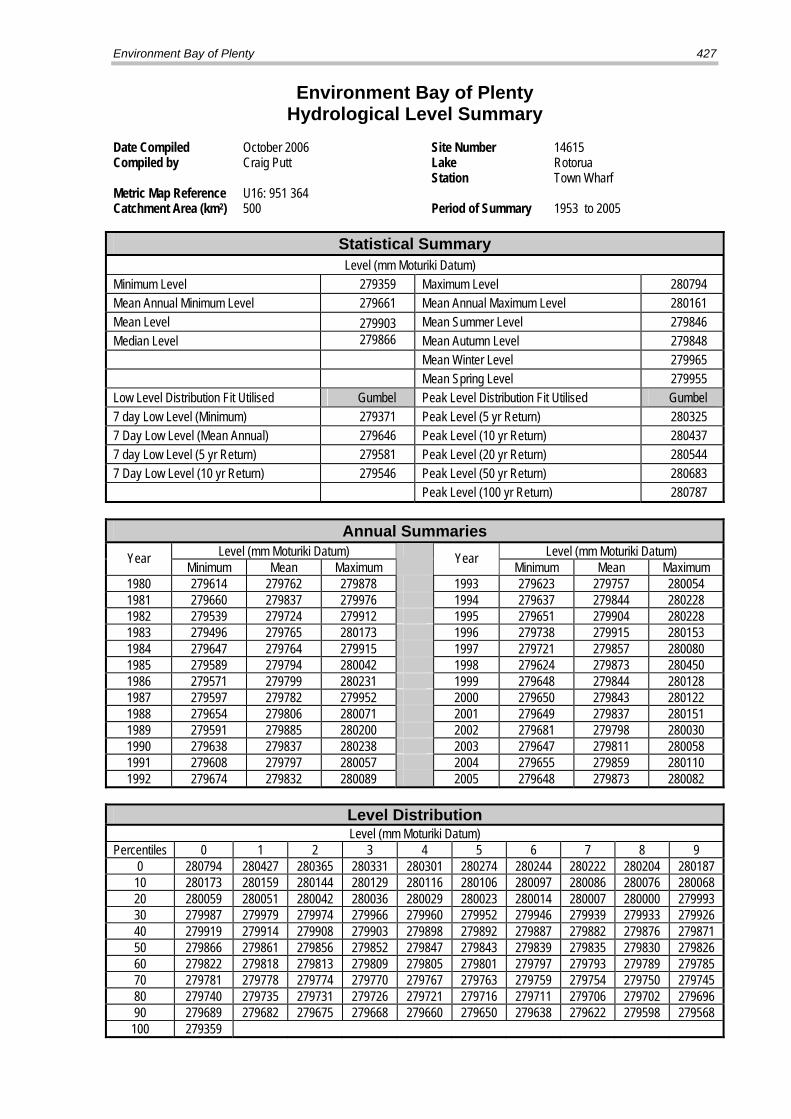
Environment Bay of Plenty 427
Environment Bay of Plenty Hydrological Level Summary
Date Compiled October 2006 Site Number 14615 Compiled by Craig Putt Lake Rotorua Station Town Wharf Metric Map Reference U16: 951 364 Catchment Area (km2) 500 Period of Summary 1953 to 2005 Statistical Summary
Level (mm Moturiki Datum) Minimum Level 279359 Maximum Level 280794 Mean Annual Minimum Level 279661 Mean Annual Maximum Level 280161 Mean Level 279903 Mean Summer Level 279846 Median Level 279866 Mean Autumn Level 279848 Mean Winter Level 279965 Mean Spring Level 279955 Low Level Distribution Fit Utilised Gumbel Peak Level Distribution Fit Utilised Gumbel 7 day Low Level (Minimum) 279371 Peak Level (5 yr Return) 280325 7 Day Low Level (Mean Annual) 279646 Peak Level (10 yr Return) 280437 7 day Low Level (5 yr Return) 279581 Peak Level (20 yr Return) 280544 7 Day Low Level (10 yr Return) 279546 Peak Level (50 yr Return) 280683 Peak Level (100 yr Return) 280787
Annual Summaries Level (mm Moturiki Datum) Level (mm Moturiki Datum) Year Minimum Mean Maximum
Year Minimum Mean Maximum 1980 279614 279762 279878 1993 279623 279757 280054 1981 279660 279837 279976 1994 279637 279844 280228 1982 279539 279724 279912 1995 279651 279904 280228 1983 279496 279765 280173 1996 279738 279915 280153 1984 279647 279764 279915 1997 279721 279857 280080 1985 279589 279794 280042 1998 279624 279873 280450 1986 279571 279799 280231 1999 279648 279844 280128 1987 279597 279782 279952 2000 279650 279843 280122 1988 279654 279806 280071 2001 279649 279837 280151 1989 279591 279885 280200 2002 279681 279798 280030 1990 279638 279837 280238 2003 279647 279811 280058 1991 279608 279797 280057 2004 279655 279859 280110 1992 279674 279832 280089 2005 279648 279873 280082
Level Distribution Level (mm Moturiki Datum)
Percentiles 0 1 2 3 4 5 6 7 8 9 0 280794 280427 280365 280331 280301 280274 280244 280222 280204 280187 10 280173 280159 280144 280129 280116 280106 280097 280086 280076 280068 20 280059 280051 280042 280036 280029 280023 280014 280007 280000 279993 30 279987 279979 279974 279966 279960 279952 279946 279939 279933 279926 40 279919 279914 279908 279903 279898 279892 279887 279882 279876 279871 50 279866 279861 279856 279852 279847 279843 279839 279835 279830 279826 60 279822 279818 279813 279809 279805 279801 279797 279793 279789 279785 70 279781 279778 279774 279770 279767 279763 279759 279754 279750 279745 80 279740 279735 279731 279726 279721 279716 279711 279706 279702 279696 90 279689 279682 279675 279668 279660 279650 279638 279622 279598 279568 100 279359
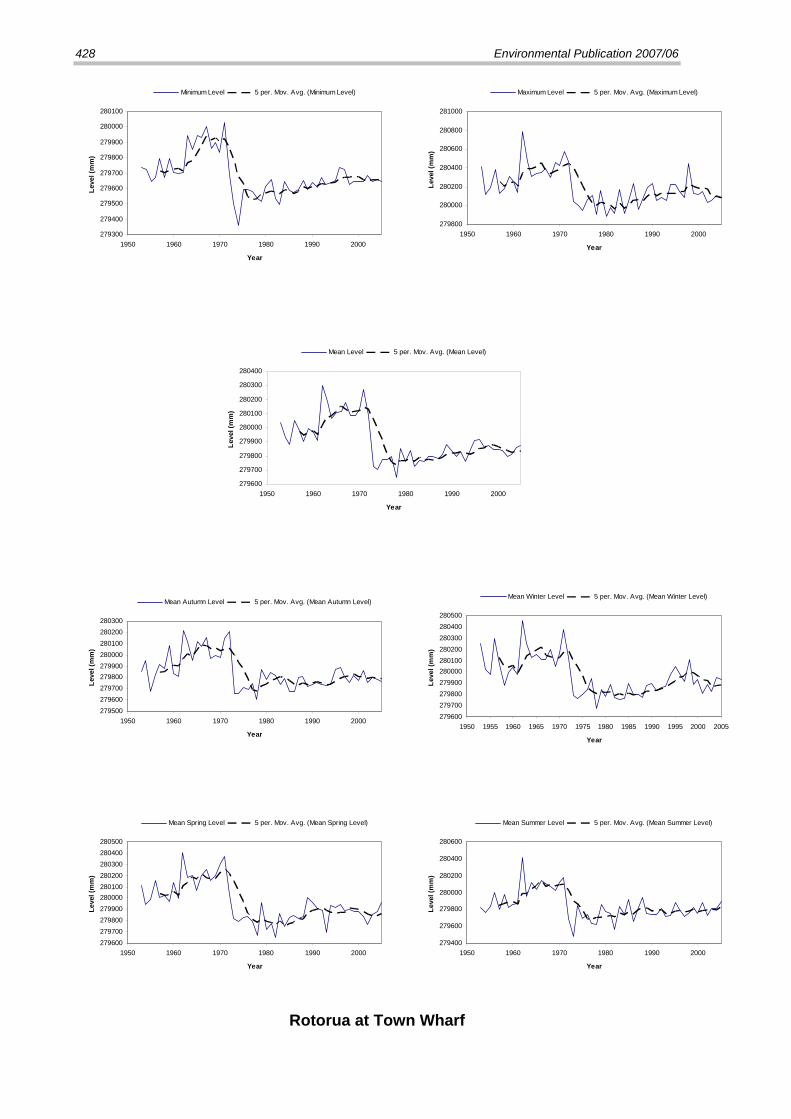
428 Environmental Publication 2007/06
279300
279400
279500
279600
279700
279800
279900
280000
280100
1950 1960 1970 1980 1990 2000
Year
Leve
l (m
m)
Minimum Level 5 per. Mov. Avg. (Minimum Level)
279800
280000
280200
280400
280600
280800
281000
1950 1960 1970 1980 1990 2000
Year
Leve
l (m
m)
Maximum Level 5 per. Mov. Avg. (Maximum Level)
279600
279700
279800
279900
280000
280100
280200
280300
280400
1950 1960 1970 1980 1990 2000
Year
Leve
l (m
m)
Mean Level 5 per. Mov. Avg. (Mean Level)
279500279600279700279800279900280000280100280200280300
1950 1960 1970 1980 1990 2000
Year
Leve
l (m
m)
Mean Autumn Level 5 per. Mov. Avg. (Mean Autumn Level)
279600279700279800279900280000280100280200280300280400280500
1950 1955 1960 1965 1970 1975 1980 1985 1990 1995 2000 2005
Year
Leve
l (m
m)
Mean Winter Level 5 per. Mov. Avg. (Mean Winter Level)
279600279700279800279900280000280100280200280300280400280500
1950 1960 1970 1980 1990 2000
Year
Leve
l (m
m)
Mean Spring Level 5 per. Mov. Avg. (Mean Spring Level)
279400
279600
279800
280000
280200
280400
280600
1950 1960 1970 1980 1990 2000
Year
Leve
l (m
m)
Mean Summer Level 5 per. Mov. Avg. (Mean Summer Level)
Rotorua at Town Wharf

Environment Bay of Plenty 429
Environment Bay of Plenty Lake Level Recording Station
Lake Rotoiti (Pre-Control) Site Okawa Bay Site Number 1114675 Grid Reference V15: 304 447 Start of Record June 2001 Data Capture Rate 98% Data Summary From January 1906 To December 2005 Data Audited From January 1906 To December 2005 Equipment History 02/11/1905: Staff gauge installed. 16/01/42: Yearly Littlejohn chart recorder. 03/07/56: Weekly Lea chart recorder. 13/12/58: Monthly Kent chart recorder.
11/08/65: Float with F&P digital recorder. 03/11/80: Float with L&S digital recorder. 18/09/00: Float with iQuest DS-4483 logger. 09/12/05: Float with iRis 320 datalogger.
Comments on Stage/Discharge Ratings Ratings available to convert Stage (mm) to Reduced Level (mm) in Moturiki Datum.
General Comments This summary is of two datasets separated by the commissioning of the Okere Control Gates in January 1982. The gates are located 40 metres north of Rotoiti Outlet recorder station (Site No. 14601, operated by NIWA, Rotorua). Rotoiti Outlet was utilised by Environment BOP until May 2001, in association with the control gates. In May 2001, Environment BOP established a new site at Okawa Bay to avoid the draw-down effect of the Okere Gates, on recorded lake level.
SITE LOCATION Rotoiti at Okawa Bay

430 Environmental Publication 2007/06
Station Comments Lake Rotoiti at Okawa Bay. Site Number 1114675, on River Number 146000.
Surface Area (km2)
Average Depth (m)
Maximum Depth (m)
Maximum Length (km)
Maximum Width (km)
Type
34.35 33.04 122 15.0 3.6 Volcanic Source: Waters of New Zealand (1992). The local recording authority is Environment BOP. Data is filed in staff gauge heights and can be converted to Moturiki Datum by applying Kind 3 ratings. The dataset is not homogenous, because of the construction of the Okere Gates control structure commissioned in October 1982. The 100 year lake level was calculated by hydraulically routing the 100 year inflow hydrograph through the lake storage. The 50 year lake level was calculated through a straight adjustment corresponding to the difference between the 50 and 100 year levels in the 1995 Hydro-Meteorological Data Summaries. The accuracy of this is suitable for this publication and planning purposes. From 820109 lake level control is via gates operated by Environment BOP. Flow data may be synthesised from site 1114609 Kaituna River at Taaheke. Staff gauge datum changed 560813 240000. 02/11/1905 Staff gauge height data available at Outlet from 051102 240000 (the local recording authority is now NIWA, Rotorua. Phone 07 346 1950.). From 051102 to 420116 staff gauge readings were made intermittently and were to varying accuracy. That is, staff gauge readings were taken to the nearest 0.1, 0.05, or 0.01 foot stage Increment depending on reader. All stage data to 420116 240000 is filed at 240000. 16/01/42 Recorder installed at Outlet on 420116 is a 16 foot range yearly Littlejohn having a time resolution of 1.18 days/mm recorded and a stage ratio of 24 mm of stage/mm chart recorded. Most early Littlejohn record should be treated with caution due to little or no routine periodic inspection/checking. Stage record edited to +/-20 mm accuracy for audit purposes. 28/03/43 Instrument was set to agree with staff gauge on 28/03/43, but when checked on 05/11/43 it differed by 0.3 feet. Data was filed assuming the error developed evenly over these seven months. 18/09/46 Instrument dismantled for overhaul for period 17/09/46 to 16/07/47. Hence staff gauge readings taken at approximately fortnightly intervals to the nearest 0.05 foot increment on gauge. 13/08/56 Datum changed to Moturiki. Type 3 rating changed accordingly. 01/01/82 Control gates commissioned on approximately 01/01/82. Gates sited approximately 40 m north of recorder station. Rating derivation at this site now impossible. Flow measurement now at site number 1114609, Kaituna at Taaheke. From 09/01/82, gate setting adjustments are responsible for any abrupt changes in lake level. Modification of lake control probable for at least one month before gate commissioning due to construction activities. 07/05/01 Environment BOP shifts monitoring equipment from Kaituna at Lake Rotoiti Outlet (Site No.14601, NZMS 260s grid reference U15: 038 484) to Okawa Bay. Recorded water levels at Outlet were thought to be inaccurate due to draw down effect of Okere Falls lake level control gates, situated nearby.
For additional information, please see recording authority.

Environment Bay of Plenty 431
Environment Bay of Plenty Hydrological Level Summary
Date Compiled October 2006 Site Number 1114675 Compiled by Craig Putt Lake Rotoiti Station Okawa Bay Metric Map Reference V15: 304 447 Catchment Area (km2) 632 Period of Summary 1906 to 1981 Statistical Summary (Prior to Installation of Okere Gates)
Level (mm Moturiki Datum) Minimum Level 278858 Maximum Level 279805 Mean Annual Minimum Level 279031 Mean Annual Maximum Level 279399 Mean Level 279200 Mean Summer Level 279158 Median Level 279193 Mean Autumn Level 279140 Mean Winter Level 279239 Mean Spring Level 279260 Low Level Distribution Fit Utilised GEV Peak Level Distribution Fit Utilised GEV 7 day Low Level (Minimum) 278866 Peak Level (5 yr Return) 279495 7 Day Low Level (Mean Annual) 279020 Peak Level (10 yr Return) 279558 7 day Low Level (5 yr Return) 278968 Peak Level (20 yr Return) 279614 7 Day Low Level (10 yr Return) 278936 Peak Level (50 yr Return) 279678 Peak Level (100 yr Return) 279722
Annual Summaries Level (mm Moturiki Datum) Level (mm Moturiki Datum) Year Minimum Mean Maximum
Year Minimum Mean Maximum 1956 279007 279291 279535 1969 279094 279251 279529 1957 279116 279226 279342 1970 279057 279299 279587 1958 279040 279174 279400 1971 279206 279405 279751 1959 279113 279235 279388 1972 279176 279338 279543 1960 279022 279197 279400 1973 279041 279176 279403 1961 279068 279152 279311 1974 278877 279210 279408 1962 279037 279432 279805 1975 279120 279264 279434 1963 279174 279334 279625 1976 279084 279253 279499 1964 279074 279228 279430 1977 279028 279208 279478 1965 279132 279243 279415 1978 278983 279137 279325 1966 279149 279314 279519 1979 278908 279284 279493 1967 279219 279343 279510 1980 279032 279236 279347 1968 279125 279298 279490 1981 279087 279259 279427
Level Distribution Level (mm Moturiki Datum)
Percentiles 0 1 2 3 4 5 6 7 8 9 0 279805 279507 279474 279450 279435 279420 279409 279397 279385 279374 10 279364 279356 279350 279343 279337 279330 279325 279321 279315 279309 20 279306 279300 279295 279291 279286 279281 279277 279272 279267 279264 30 279260 279257 279252 279248 279245 279241 279237 279235 279231 279229 40 279225 279222 279218 279215 279212 279208 279206 279203 279200 279197 50 279193 279190 279186 279184 279180 279177 279174 279171 279169 279165 60 279162 279157 279154 279151 279148 279145 279141 279138 279135 279132 70 279127 279124 279121 279117 279113 279109 279108 279103 279099 279094 80 279092 279087 279083 279079 279075 279070 279065 279060 279054 279049 90 279044 279037 279031 279023 279017 279010 279001 278989 278968 278931 100 278858

432 Environmental Publication 2007/06
278800
278850
278900
278950
279000
279050
279100
279150
279200
279250
1905 1915 1925 1935 1945 1955 1965 1975 1985
Year
Leve
l (m
m)
Minimum Level 5 per. Mov. Avg. (Minimum Level)
279100
279200
279300
279400
279500
279600
279700
279800
279900
1905 1915 1925 1935 1945 1955 1965 1975 1985
Year
Leve
l (m
m)
Maximum Level 5 per. Mov. Avg. (Maximum Level)
278950279000279050279100279150279200279250279300279350279400279450279500
1905 1915 1925 1935 1945 1955 1965 1975 1985
Year
Leve
l (m
m)
Mean Level 5 per. Mov. Avg. (Mean Level)
278900
279000
279100
279200
279300
279400
279500
1905 1915 1925 1935 1945 1955 1965 1975 1985
Year
Leve
l (m
m)
Mean Autumn Level 5 per. Mov. Avg. (Mean Autumn Level)
279000
279100
279200
279300
279400
279500
279600
1905 1915 1925 1935 1945 1955 1965 1975 1985
Year
Leve
l (m
m)
Mean Winter Level 5 per. Mov. Avg. (Mean Winter Level)
278900
279000
279100
279200
279300
279400
279500
279600
1905 1915 1925 1935 1945 1955 1965 1975 1985
Year
Leve
l (m
m)
Mean Spring Level 5 per. Mov. Avg. (Mean Spring Level)
278800
278900
279000
279100
279200
279300
279400
279500
279600
1905 1915 1925 1935 1945 1955 1965 1975 1985
Year
Leve
l (m
m)
Mean Summer Level 5 per. Mov. Avg. (Mean Summer Level)
Lake Rotoiti at Okawa Bay (Prior to Installation of Okere Control Gates)
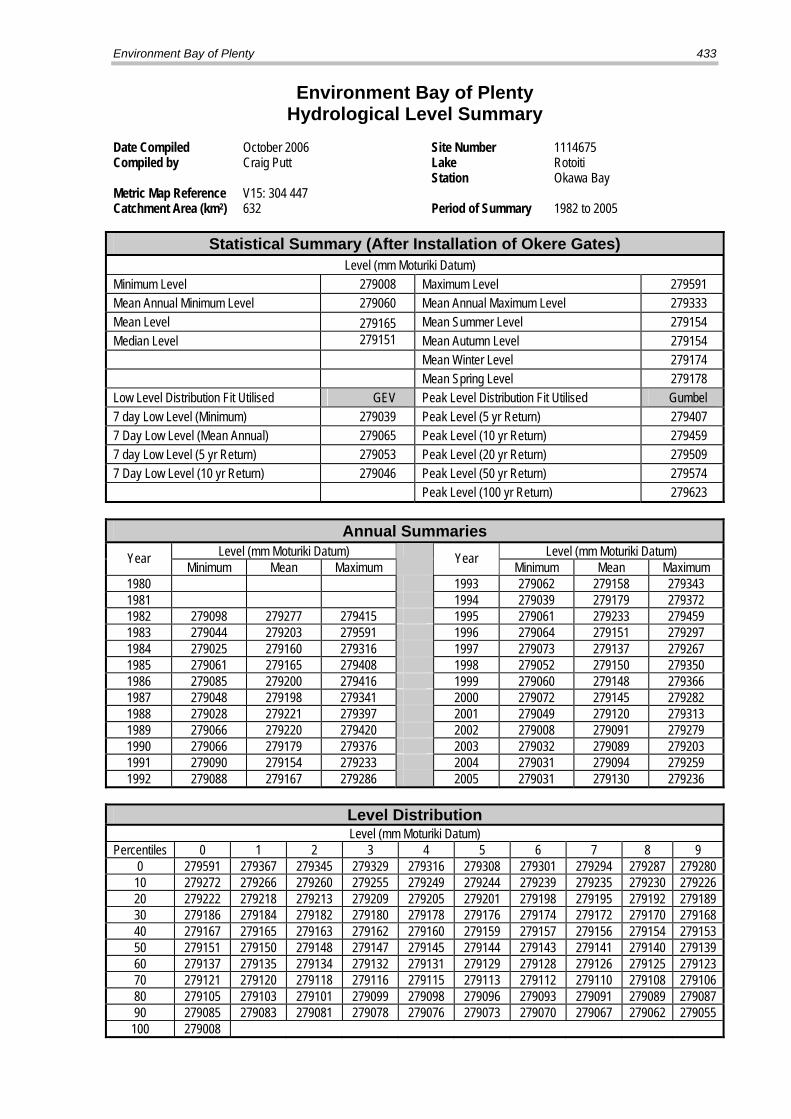
Environment Bay of Plenty 433
Environment Bay of Plenty Hydrological Level Summary
Date Compiled October 2006 Site Number 1114675 Compiled by Craig Putt Lake Rotoiti Station Okawa Bay Metric Map Reference V15: 304 447 Catchment Area (km2) 632 Period of Summary 1982 to 2005 Statistical Summary (After Installation of Okere Gates)
Level (mm Moturiki Datum) Minimum Level 279008 Maximum Level 279591 Mean Annual Minimum Level 279060 Mean Annual Maximum Level 279333 Mean Level 279165 Mean Summer Level 279154 Median Level 279151 Mean Autumn Level 279154 Mean Winter Level 279174 Mean Spring Level 279178 Low Level Distribution Fit Utilised GEV Peak Level Distribution Fit Utilised Gumbel 7 day Low Level (Minimum) 279039 Peak Level (5 yr Return) 279407 7 Day Low Level (Mean Annual) 279065 Peak Level (10 yr Return) 279459 7 day Low Level (5 yr Return) 279053 Peak Level (20 yr Return) 279509 7 Day Low Level (10 yr Return) 279046 Peak Level (50 yr Return) 279574 Peak Level (100 yr Return) 279623
Annual Summaries Level (mm Moturiki Datum) Level (mm Moturiki Datum) Year Minimum Mean Maximum
Year Minimum Mean Maximum 1980 1993 279062 279158 279343 1981 1994 279039 279179 279372 1982 279098 279277 279415 1995 279061 279233 279459 1983 279044 279203 279591 1996 279064 279151 279297 1984 279025 279160 279316 1997 279073 279137 279267 1985 279061 279165 279408 1998 279052 279150 279350 1986 279085 279200 279416 1999 279060 279148 279366 1987 279048 279198 279341 2000 279072 279145 279282 1988 279028 279221 279397 2001 279049 279120 279313 1989 279066 279220 279420 2002 279008 279091 279279 1990 279066 279179 279376 2003 279032 279089 279203 1991 279090 279154 279233 2004 279031 279094 279259 1992 279088 279167 279286 2005 279031 279130 279236
Level Distribution Level (mm Moturiki Datum)
Percentiles 0 1 2 3 4 5 6 7 8 9 0 279591 279367 279345 279329 279316 279308 279301 279294 279287 279280 10 279272 279266 279260 279255 279249 279244 279239 279235 279230 279226 20 279222 279218 279213 279209 279205 279201 279198 279195 279192 279189 30 279186 279184 279182 279180 279178 279176 279174 279172 279170 279168 40 279167 279165 279163 279162 279160 279159 279157 279156 279154 279153 50 279151 279150 279148 279147 279145 279144 279143 279141 279140 279139 60 279137 279135 279134 279132 279131 279129 279128 279126 279125 279123 70 279121 279120 279118 279116 279115 279113 279112 279110 279108 279106 80 279105 279103 279101 279099 279098 279096 279093 279091 279089 279087 90 279085 279083 279081 279078 279076 279073 279070 279067 279062 279055 100 279008

434 Environmental Publication 2007/06
279000279010279020279030279040279050279060279070279080279090279100279110
1980 1985 1990 1995 2000 2005
Year
Leve
l (m
m)
Minimum Level 5 per. Mov. Avg. (Minimum Level)
279150279200279250279300279350279400279450279500279550279600279650
1980 1985 1990 1995 2000 2005
Year
Leve
l (m
m)
Maximum Level 5 per. Mov. Avg. (Maximum Level)
279050
279100
279150
279200
279250
279300
1980 1985 1990 1995 2000 2005
Year
Leve
l (m
m)
Mean Level 5 per. Mov. Avg. (Mean Level)
279050
279100
279150
279200
279250
279300
279350
1980 1985 1990 1995 2000 2005
Year
Leve
l (m
m)
Mean Autumn Level 5 per. Mov. Avg. (Mean Autumn Level)
279050
279100
279150
279200
279250
279300
279350
1980 1985 1990 1995 2000 2005
Year
Leve
l (m
m)
Mean Winter Level 5 per. Mov. Avg. (Mean Winter Level)
279050
279100
279150
279200
279250
279300
279350
1980 1985 1990 1995 2000 2005
Year
Leve
l (m
m)
Mean Spring Level 5 per. Mov. Avg. (Mean Spring Level)
279050
279100
279150
279200
279250
279300
1980 1985 1990 1995 2000 2005
Year
Leve
l (m
m)
Mean Summer Level 5 per. Mov. Avg. (Mean Summer Level)
Lake Rotoiti at Okawa Bay (After Installation of Okere Control Gates)

Environment Bay of Plenty 435
Environment Bay of Plenty Lake Level Recording Station
Lake Rotoehu Site Te Pohue Bay Site Number 14716 Grid Reference V15: 085 462 Start of Record July 1953 Data Capture Rate 94% Data Summary From January 1954 To December 2005 Data Audited From January 1986 To December 2005 Equipment History 21/02/25: Staff gauge installed. 02/03/65: Kent chart recorder. 24/07/73: Float with F&P digital recorder. 14/08/79: 1.5 metre range Monthly Stevens chart.
31/01/86: Float with F&P digital recorder. 02/06/88: Float with L&S digital recorder. 27/07/93: 5 metre range P.T. with WRIC datalogger. 25/11/97: Float with Campbell CR500 datalogger.
Comments on Stage/Discharge Ratings Ratings are available to convert Stage (mm) to Reduced Level (mm) in Moturiki Datum. General Comments Manual staff gauge and charts were initially recorded by the Water & Soil Division, Hamilton. Site handed over to B.O.P.C.C. in August 1979. Site was moved in April 1994 in response to lowering lake levels. Site is now operated by Environment Bay of Plenty as part of its Natural Environmental Regional Monitoring Network.
SITE LOCATION Rotoehu at Te Pohue Bay

436 Environmental Publication 2007/06
Station Comments Lake Rotoehu at Te Pohue Bay. Site Number 14716, on River Number 147071.
Surface Area (km2)
Average Depth (m)
Maximum Depth (m)
Maximum Length (km)
Maximum Width (km)
Type
8.11 8.16 13.5 4.6 4.0 Volcanic Source: Waters of New Zealand (1992). The local recording authority is Environment BOP. Lake levels are in gauge heights, to convert to Moturiki Datum apply kind 3 ratings. Periods of synthetic data occur throughout the record. Synthetic data compiled using Lake Rotoma. 21/02/25 The lake levels for the period 250221 to 260312 are from a staff gauge installed by Mr. Martin of the Lands & Survey Department. In his report he states that it was difficult to obtain regular readings and the above period appears to be all that was recorded. Readings (in Martins datum) have been converted to Moturiki datum and filed. 12/03/26 No lake levels were recorded from 260312 to 530307. 27/03/53 Only 5 staff gauge readings were taken between 530328 and 540201. 31/12/59 No lake levels were recorded from 600101 to 620131. 02/03/65 Kent chart recorder installed 650303. Original charts held by Hamilton Hydrological Survey. Lake seiche has been recorded on charts & is of varying frequency, duration & amplitude. These variations have not been transferred to the water tape & interested users are advised to contact relevant recording authority. 07/12/78 Between 781207 and 790109, the lake level fell, and remained below invert of stilling well. As no other record is available, a straight line recession has been assumed. A total of 72.4mm fell at Rotoehu Forest during this period. 21/12/88 New recorder tower installed. 09/04/94 Dam constructed in March by member of public at French Pass burst at about this time. See file for more information. Diurnal fluctuations in data may be due to temperature effect on pressure transducer. 14/04/94 5 metre range PT and Kainga logger re-installed at a new site approx 150m from the cylinders, north east towards the Bluffs. The instruments were moved due to development of mudflats around the cylinder intakes. Cylinders remain at original site. 25/11/97 Pressure transducer disconnected and Kainga logger removed from temporary site, near bluffs. A Handar Encoder and CR500 Datalogger were installed at the Te Pohue Bay cylinders. 31/12/00 Data audit carried out on lake level monitoring site 14716 covering the period 980101 to 20001231. Data audit passed external audit carried out by Environmental Quality Systems.
For additional information, please see recording authority.

Environment Bay of Plenty 437
Environment Bay of Plenty Hydrological Level Summary
Date Compiled October 2006 Site Number 14716 Compiled by Craig Putt Lake Rotoehu Station Te Pohue Bay Metric Map Reference V15: 085 462 Catchment Area (km2) 50 Period of Summary 1954 to 2005 Statistical Summary
Level (mm Moturiki Datum) Minimum Level 292346 Maximum Level 296967 Mean Annual Minimum Level 294750 Mean Annual Maximum Level 295407 Mean Level 294970 Mean Summer Level 294952 Median Level 294936 Mean Autumn Level 294831 Mean Winter Level 294967 Mean Spring Level 295088 Low Level Distribution Fit Utilised GEV Peak Level Distribution Fit Utilised GEV 7 day Low Level (Minimum) 292360 Peak Level (5 yr Return) 295955 7 Day Low Level (Mean Annual) 294456 Peak Level (10 yr Return) 296318 7 day Low Level (5 yr Return) 293863 Peak Level (20 yr Return) 296611 7 Day Low Level (10 yr Return) 293468 Peak Level (50 yr Return) 296925 Peak Level (100 yr Return) 297119
Annual Summaries Level (mm Moturiki Datum) Level (mm Moturiki Datum) Year Minimum Mean Maximum
Year Minimum Mean Maximum 1980 294612 294884 295165 1993 292827 293323 294006 1981 294423 294744 295063 1994 292346 292687 293031 1982 294333 294775 294969 1995 292459 293227 294069 1983 293723 294131 294877 1996 293851 294149 294565 1984 294488 294713 294883 1997 293785 294054 294268 1985 294560 294986 295297 1998 293593 294084 294587 1986 295011 295192 295428 1999 294212 294552 295054 1987 294028 294500 295043 2000 294503 294795 295089 1988 293594 293799 294054 2001 294493 294830 295146 1989 293975 294447 294984 2002 294599 294905 295105 1990 294468 294747 295057 2003 294320 294611 294913 1991 294228 294494 294770 2004 294405 294792 295155 1992 293648 293942 294369 2005 294530 294819 295048
Level Distribution Level (mm Moturiki Datum)
Percentiles 0 1 2 3 4 5 6 7 8 9 0 296967 296787 296649 296531 296441 296281 296224 296191 296151 296124 10 296088 296048 296008 295966 295917 295884 295864 295834 295806 295764 20 295725 295671 295592 295560 295524 295488 295463 295428 295383 295353 30 295329 295311 295284 295256 295234 295215 295194 295171 295152 295132 40 295113 295100 295077 295054 295036 295013 295001 294979 294964 294949 50 294936 294922 294911 294898 294887 294871 294859 294849 294835 294824 60 294810 294797 294782 294765 294745 294724 294706 294689 294675 294660 70 294645 294627 294609 294587 294565 294547 294527 294507 294483 294452 80 294419 294381 294344 294289 294229 294169 294110 294045 293986 293949 90 293908 293867 293816 293755 293689 293626 293349 293013 292858 292561 100 292346

438 Environmental Publication 2007/06
292000292500293000293500294000294500295000295500296000296500297000
1950 1960 1970 1980 1990 2000
Year
Leve
l (m
m)
Minimum Level 5 per. Mov. Avg. (Minimum Level)
292500293000293500294000294500295000295500296000296500297000297500
1950 1960 1970 1980 1990 2000
Year
Leve
l (m
m)
Maximum Level 5 per. Mov. Avg. (Maximum Level)
292000292500293000293500294000294500295000295500296000296500297000
1950 1960 1970 1980 1990 2000
Year
Leve
l (m
m)
Mean Level 5 per. Mov. Avg. (Mean Level)
292000292500293000293500294000294500295000295500296000296500297000
1950 1960 1970 1980 1990 2000
Year
Leve
l (m
m)
Mean Autumn Level 5 per. Mov. Avg. (Mean Autumn Level)
292000292500293000293500294000294500295000295500296000296500297000
1950 1955 1960 1965 1970 1975 1980 1985 1990 1995 2000 2005
Year
Leve
l (m
m)
Mean Winter Level 5 per. Mov. Avg. (Mean Winter Level)
292500293000293500294000294500295000295500296000296500297000297500
1950 1960 1970 1980 1990 2000
Year
Leve
l (m
m)
Mean Spring Level 5 per. Mov. Avg. (Mean Spring Level)
292000292500293000293500294000294500295000295500296000296500297000
1950 1960 1970 1980 1990 2000
Year
Leve
l (m
m)
Mean Summer Level 5 per. Mov. Avg. (Mean Summer Level)
Rotoehu at Te Pohue Bay

Environment Bay of Plenty 439
Environment Bay of Plenty Lake Level Recording Station
Lake Rotoma Site Otangiwai Point Site Number 14717 Grid Reference V15: 238 434 Start of Record March 1953 Data Capture Rate 97% Data Summary From January 1954 To December 2005 Data Audited From February 1986 To December 2005 Equipment History 05/03/53: Staff gauge installed. 03/03/65: 3 metre range Monthly Kent chart recorder. 18/07/73: Float with F&P digital recorder. 17/09/79: 1.5 metre range Monthly Stevens chart recorder. 28/02/86: Float with F&P digital recorder.
09/06/88: Float with L&S digital recorder. 21/09/93: 5 metre range P.T. with WRIC datalogger. 17/02/94: Float with L&S digital recorder. 25/11/97: Float with Campbell CR500.
Comments on Stage/Discharge Ratings Ratings are available to convert Stage (mm) to Reduced Level (mm) in Moturiki Datum.
General Comments Manual staff gauge and charts were initially recorded by Water & Soil Division, Hamilton. Site handed over to B.O.P.C.C. on 18th September 1979. Site is now operated by Environment Bay of Plenty as part of its Natural Environmental Regional Monitoring Network.
SITE LOCATION Rotoma at Otangiwai Point

440 Environmental Publication 2007/06
Station Comments Lake Rotoma at Otangiwai Point. Site Number 14717, on River Number 147072.
Surface Area (km2)
Average Depth (m)
Maximum Depth (m)
Maximum Length (km)
Maximum Width (km)
Type
11.16 36.9 83.0 5.2 4.7 Volcanic Source: Waters of New Zealand (1992). The local recording authority is Environment BOP. Lake levels are in staff gauge heights, to convert to reduced level, Moturiki Datum, apply kind 3 rating. Periods of synthetic data occur throughout the record. Synthetic data compiled using Lakes Rotoehu and Okataina. 25/02/25 The lake levels for the period 250225 to 260331 are from a staff gauge installed by Mr. Martin of the Lands and Survey Department. In his report he states that it was difficult to obtain regular readings and the above period appears to be all that was recorded. The readings (in Martins Datum) have been converted to Moturiki Datum and filed. 31/03/26 There were no lake levels recorded from 260331 to 530305. 05/03/53 Staff gauge installed on 530305 02/03/65 Recorder installed on 650302 at 142000 is a 3.0m range 32 day Kent. 18/09/79 Site handed over to BOP Catchment Commission on 790918. Hourly F & P recorder replaced by 1.5m monthly Stevens F chart recorder. 24/04/89 Synthetic data from 890424 at 150000 to 891120 at 090000 due to recorder working intermittently. Synthetic data based on Rotoehu and Okataina recorders. 21/09/93 Instruments change from float to pressure transducer (PT), due to lake level dropping below bottom of cylinder. 01/01/94 A data audit has been carried out on the period of record from 860228 at 000000 to 940101 at 000000. Environment BOP was the recording authority during this period with the audit being carried out by Environment BOP, in February 1994. As a part of the data Lake Rotoma at Otangiwai point data (14717) was compared with Lake Rotoehu at Te Pohue Bay data (14716), map reference V15:185462. 17/02/94 Recording tower moved 4m north along the edge of the point. 25/11/97 A Handar encoder and CR500 datalogger were installed. Recording interval is 30 minutes, stage resolution 1mm. 31/12/00 Data audit carried out on lake level monitoring site 14717 covering the period 980101 to 20001231. Data audit passed external audit carried out by Environmental Quality Systems.
For additional information, please see recording authority.

Environment Bay of Plenty 441
Environment Bay of Plenty Hydrological Level Summary
Date Compiled October 2006 Site Number 14717 Compiled by Craig Putt Lake Rotoma Station Otangiwai Point Metric Map Reference V15: 238 434 Catchment Area (km2) 29 Period of Summary 1954 to 2005 Statistical Summary
Level (mm Moturiki Datum) Minimum Level 312171 Maximum Level 317734 Mean Annual Minimum Level 315076 Mean Annual Maximum Level 315942 Mean Level 315117 Mean Summer Level 315154 Median Level 315118 Mean Autumn Level 314992 Mean Winter Level 315023 Mean Spring Level 315207 Low Level Distribution Fit Utilised GEV Peak Level Distribution Fit Utilised GEV 7 day Low Level (Minimum) 312189 Peak Level (5 yr Return) 316475 7 Day Low Level (Mean Annual) 314539 Peak Level (10 yr Return) 316984 7 day Low Level (5 yr Return) 313833 Peak Level (20 yr Return) 317401 7 Day Low Level (10 yr Return) 313372 Peak Level (50 yr Return) 317853 Peak Level (100 yr Return) 318137
Annual Summaries Level (mm Moturiki Datum) Level (mm Moturiki Datum) Year Minimum Mean Maximum
Year Minimum Mean Maximum 1980 314821 315179 315620 1993 312915 313593 314190 1981 314618 314904 315310 1994 312171 312521 312954 1982 314493 314949 315274 1995 312190 312762 313649 1983 313838 314163 314889 1996 313546 313840 314267 1984 314619 314845 315001 1997 313597 313877 314188 1985 314640 315260 315742 1998 313114 313799 314519 1986 315352 315594 315864 1999 314019 314317 314933 1987 314115 314624 315378 2000 314378 314624 314872 1988 313544 313794 314150 2001 314241 314494 314871 1989 314113 314612 315437 2002 314066 314462 314857 1990 314828 315262 315719 2003 313766 313994 314218 1991 314668 315015 315490 2004 313683 314167 314590 1992 313894 314212 314779 2005 314044 314352 314599
Level Distribution Level (mm Moturiki Datum)
Percentiles 0 1 2 3 4 5 6 7 8 9 0 317734 317479 317292 317159 317038 316888 316792 316717 316663 316613 10 316535 316468 316408 316325 316267 316229 316194 316156 316113 316073 20 316030 315975 315918 315852 315805 315760 315719 315682 315642 315610 30 315587 315560 315536 315514 315486 315464 315444 315425 315403 315378 40 315358 315333 315307 315286 315267 315245 315213 315190 315165 315136 50 315118 315096 315076 315055 315029 315005 314983 314960 314936 314913 60 314891 314869 314845 314816 314787 314751 314709 314655 314614 314582 70 314550 314516 314488 314462 314440 314420 314399 314373 314336 314290 80 314242 314203 314163 314121 314080 314032 314001 313971 313942 313911 90 313867 313822 313745 313684 313621 313497 313273 312929 312574 312412 100 312171

442 Environmental Publication 2007/06
311000
312000
313000
314000
315000
316000
317000
318000
1950 1960 1970 1980 1990 2000
Year
Leve
l (m
m)
Minimum Level 5 per. Mov. Avg. (Minimum Level)
312000
313000
314000
315000
316000
317000
318000
1950 1960 1970 1980 1990 2000
Year
Leve
l (m
m)
Maximum Level 5 per. Mov. Avg. (Maximum Level)
312000
313000
314000
315000
316000
317000
318000
1950 1960 1970 1980 1990 2000
Year
Leve
l (m
m)
Mean Level 5 per. Mov. Avg. (Mean Level)
312000
313000
314000
315000
316000
317000
318000
1950 1960 1970 1980 1990 2000
Year
Leve
l (m
m)
Mean Autumn Level 5 per. Mov. Avg. (Mean Autumn Level)
312000
313000
314000
315000
316000
317000
318000
1950 1955 1960 1965 1970 1975 1980 1985 1990 1995 2000 2005
Year
Leve
l (m
m)
Mean Winter Level 5 per. Mov. Avg. (Mean Winter Level)
312000
313000
314000
315000
316000
317000
318000
1950 1960 1970 1980 1990 2000
Year
Leve
l (m
m)
Mean Spring Level 5 per. Mov. Avg. (Mean Spring Level)
312000
313000
314000
315000
316000
317000
318000
1950 1960 1970 1980 1990 2000
Year
Leve
l (m
m)
Mean Summer Level 5 per. Mov. Avg. (Mean Summer Level)
Rotoma at Otangiwai Point

Environment Bay of Plenty 443
Environment Bay of Plenty Lake Level Recording Station
Lake Okataina Site Tauranganui Bay Site Number 15309 Grid Reference V16: 110 385 Start of Record October 1952 Data Capture Rate 99% Data Summary From January 1953 To December 2005 Data Audited From February 1986 To December 2005 Equipment History 01/10/52: Staff gauge installed. 14/10/65: Chart recorder. 28/08/73: Float with F&P digital recorder. 17/09/79: 1.5 metre range Monthly Stevens chart recorder.
28/02/86: Float with F&P digital recorder. 02/06/88: Float with L&S digital recorder. 08/12/93: 5 metre range P.T. with WRIC datalogger. 24/11/97: Float with Campbell CR500 datalogger.
Comments on Stage/Discharge Ratings Ratings are available to convert Stage (mm) to Reduced Level (mm) in Moturiki Datum.
General Comments Manual staff gauge readings and charts were initially recorded by Water & Soil Division, Hamilton. Site handed over to B.O.P.C.C. on 18th September 1979. Site is now operated by Environment Bay of Plenty as part of its Natural Environmental Regional Monitoring Network.
SITE LOCATION Okataina at Tauranganui Bay

444 Environmental Publication 2007/06
Station Comments Lake Okataina at Tauranganui Bay. Site Number 15309, on River Number 153136.
Surface Area (km2)
Average Depth (m)
Maximum Depth (m)
Maximum Length (km)
Maximum Width (km)
Type
10.8 39.4 78.5 6.2 5.0 Volcanic Source: Waters of New Zealand (1992). The local recording authority is Environment BOP. Lake levels are in staff gauge heights, to convert to reduced level Moturiki datum, apply kind 3 ratings. 23/01/72 Periods of synthetic data occur throughout the record. Synthetic data compiled using Rerewhakaaitu, Rotoehu and Rotoma. 30/06/77 Recorder relocated to a new structure at NZMS map reference N76: 893 080, on 770630. 18/09/79 Site handed over to Bay of Plenty Catchment Commission on 790918. 08/12/93 L&S digital recorder and float were removed and replaced by a 5m range pressure transducer due to the water level having dropped below the level of stilling well intake. 24/11/97 A Handar encoder and CR500 datalogger were installed. Recording interval is 30 minutes. 31/12/00 Data audit carried out on lake level monitoring site 15309 covering the period 980101 to 1001231. Data audit passed external audit carried out by Environmental Quality Systems.
For additional information, please see recording authority.

Environment Bay of Plenty 445
Environment Bay of Plenty Hydrological Level Summary
Date Compiled October 2006 Site Number 15309 Compiled by Craig Putt Lake Okataina Station Tauranganui Bay Metric Map Reference V16: 110 385 Catchment Area (km2) 62 Period of Summary 1953 to 2005 Statistical Summary
Level (mm Moturiki Datum) Minimum Level 306309 Maximum Level 313456 Mean Annual Minimum Level 308943 Mean Annual Maximum Level 309771 Mean Level 309221 Mean Summer Level 309286 Median Level 308303 Mean Autumn Level 309116 Mean Winter Level 309145 Mean Spring Level 309307 Low Level Distribution Fit Utilised GEV Peak Level Distribution Fit Utilised GEV 7 day Low Level (Minimum) 306328 Peak Level (5 yr Return) 310677 7 Day Low Level (Mean Annual) 308396 Peak Level (10 yr Return) 311649 7 day Low Level (5 yr Return) 307656 Peak Level (20 yr Return) 312641 7 Day Low Level (10 yr Return) 307244 Peak Level (50 yr Return) 314015 Peak Level (100 yr Return) 315118
Annual Summaries Level (mm Moturiki Datum) Level (mm Moturiki Datum) Year Minimum Mean Maximum
Year Minimum Mean Maximum 1980 308630 308772 308950 1993 306808 307202 307672 1981 308418 308652 309021 1994 306309 306660 306956 1982 308470 308799 308990 1995 306565 307126 307901 1983 307828 308064 308465 1996 307836 308239 308690 1984 307896 308112 308402 1997 308318 308578 308740 1985 307698 308027 308375 1998 307984 308509 309020 1986 308333 308601 308761 1999 308647 308943 309497 1987 307390 307932 308585 2000 309111 309352 309570 1988 306852 307081 307419 2001 308994 309161 309399 1989 307188 307563 308167 2002 308677 309040 309373 1990 307860 308174 308694 2003 308021 308261 308708 1991 308101 308369 308569 2004 307791 308120 308418 1992 307580 307838 308340 2005 307976 308249 308508
Level Distribution Level (mm Moturiki Datum)
Percentiles 0 1 2 3 4 5 6 7 8 9 0 313456 313109 312881 312423 311990 311914 311859 311813 311751 311663 10 311550 311475 311380 311307 311259 311201 311143 311079 310994 310845 20 310762 310692 310299 310200 310128 309949 309862 309810 309755 309706 30 309606 309514 309418 309357 309321 309272 309233 309197 309155 309114 40 309081 309055 309023 308991 308971 308942 308914 308881 308848 308823 50 308803 308779 308758 308740 308723 308704 308695 308679 308666 308647 60 308628 308611 308594 308574 308549 308525 308505 308486 308465 308433 70 308399 308367 308339 308315 308290 308270 308250 308224 308182 308135 80 308099 308070 308040 308011 307979 307945 307911 307877 307823 307724 90 307661 307617 307470 307374 307278 307164 307031 306928 306803 306631 100 306309

446 Environmental Publication 2007/06
306000
307000
308000
309000
310000
311000
312000
313000
1950 1960 1970 1980 1990 2000
Year
Leve
l (m
m)
Minimum Level 5 per. Mov. Avg. (Minimum Level)
306000
307000
308000
309000
310000
311000
312000
313000
314000
1950 1960 1970 1980 1990 2000
Year
Leve
l (m
m)
Maximum Level 5 per. Mov. Avg. (Maximum Level)
306000
307000
308000
309000
310000
311000
312000
313000
314000
1950 1960 1970 1980 1990 2000
Year
Leve
l (m
m)
Mean Level 5 per. Mov. Avg. (Mean Level)
306000
307000
308000
309000
310000
311000
312000
313000
314000
1950 1960 1970 1980 1990 2000
Year
Leve
l (m
m)
Mean Autumn Level 5 per. Mov. Avg. (Mean Autumn Level)
306000
307000
308000
309000
310000
311000
312000
313000
314000
1950 1955 1960 1965 1970 1975 1980 1985 1990 1995 2000 2005
Year
Leve
l (m
m)
Mean Winter Level 5 per. Mov. Avg. (Mean Winter Level)
306000
307000
308000
309000
310000
311000
312000
313000
314000
1950 1960 1970 1980 1990 2000
Year
Leve
l (m
m)
Mean Spring Level 5 per. Mov. Avg. (Mean Spring Level)
306000
307000
308000
309000
310000
311000
312000
313000
314000
1950 1960 1970 1980 1990 2000
Year
Leve
l (m
m)
Mean Summer Level 5 per. Mov. Avg. (Mean Summer Level)
Okataina at Tauranganui Bay

Environment Bay of Plenty 447
Environment Bay of Plenty Lake Level Recording Station
Lake Okareka Site Acacia Bay Site Number 15307 Grid Reference U16: 035 308 Start of Record July 1951 Data Capture Rate 86% Data Summary From January 1966 To December 2005 Data Audited From February 1986 To December 2005 Equipment History 03/07/51: Staff gauge installed. 19/02/86: 1 metre range monthly Foxboro chart recorder. 23/05/91: 5 metre range P.T. and WRIC datalogger. 24/05/00: 5 metre range P.T. and Campbell CR500 datalogger. Comments on Stage/Discharge Ratings Ratings available to convert stage (mm) to reduced level (mm) in Moturiki datum.
General Comments Manual staff gauge readings and charts were initially recorded by Water & Soil Division, Hamilton. Site handed over to B.O.P.C.C. on 18th September 1979. Site is now operated by Environment Bay of Plenty as part of its Natural Environmental Regional Monitoring Network. A control structure on the southern side of the lake is operated by the Rotorua District Council as a high level overflow route to Lake Tarawera. NOTE: This summary excludes data prior to the establishment of the control structure.
SITE LOCATION Okareka at Acacia Bay

448 Environmental Publication 2007/06
Station Comments Lake Okareka at Acacia Bay. Site Number 15307, on River Number 147072.
Surface Area (km2)
Average Depth (m)
Maximum Depth (m)
Maximum Length (km)
Maximum Width (km)
Type
3.46 20.0 33.5 2.8 1.9 Volcanic Source: Waters of New Zealand (1992). The local recording authority is Environment BOP. The dataset is not homogeneous because of construction of a control structure – in this case an overflow pipeline. This has resulted in the peak lake levels being significantly reduced. Lake levels are filed in staff gauge heights. To convert to reduced level Moturiki Datum, apply kind 3 rating. Periods of synthetic data occur throughout the record. Synthetic data compiled using Lake Tarawera. 15/03/96 Lake Okareka had no natural surface outlet and all drainage before the 1960's used to be via underground channels. A pump and pipeline were installed in March 1963 and operated until February 1964 in an attempt to control rising lake levels. A controlled gravity pipeline between Lake Okareka and Lake Tarawera was installed in May 1965 and is currently operated on a day to day basis by Rotorua District Council to try and maintain the lake level within the control range of 353.50m and 353.90m. Greater information can be obtained from Environment BOP report ISSN 1172 5377. 17/12/61 Intermittent readings taken from 611217 to 630101. 27/04/67 Missing record from 670427 to 710709 due to no gauge reader being available. 05/08/74 Missing record from 740805 to 750101 due to no lake readings being taken. Synthetic data can be constructed using lake levels from 15309 Lake Okataina at Tauranganui Bay. 31/03/82 Daily staff gauge readings ceased on 820331 090000, but monthly staff gauge readings continue from 820414 143000. 16/02/86 Site handed over to Bay Of Plenty Catchment Commission. 24/05/00 A 5 metre range pressure transducer and CR500 data logger were installed.
For additional information, please see recording authority.

Environment Bay of Plenty 449
Environment Bay of Plenty Hydrological Level Summary
Date Compiled October 2006 Site Number 15307 Compiled by Craig Putt Lake Okareka Station Acacia Bay Metric Map Reference U16: 035 308 Catchment Area (km2) 19 Period of Summary 1966 to 2005 Statistical Summary
Level (mm Moturiki Datum) Minimum Level 353197 Maximum Level 354419 Mean Annual Minimum Level 353523 Mean Annual Maximum Level 353947 Mean Level 353733 Mean Summer Level 353729 Median Level 353727 Mean Autumn Level 353632 Mean Winter Level 353741 Mean Spring Level 353836 Low Level Distribution Fit Utilised GEV Peak Level Distribution Fit Utilised GEV 7 day Low Level (Minimum) 353204 Peak Level (5 yr Return) 354103 7 Day Low Level (Mean Annual) 353499 Peak Level (10 yr Return) 354210 7 day Low Level (5 yr Return) 353393 Peak Level (20 yr Return) 354306 7 Day Low Level (10 yr Return) 353330 Peak Level (50 yr Return) 354420 Peak Level (100 yr Return) 354500
Annual Summaries Level (mm Moturiki Datum) Level (mm Moturiki Datum) Year Minimum Mean Maximum
Year Minimum Mean Maximum 1980 353513 353643 353854 1993 353364 353498 353762 1981 353508 353673 353835 1994 353277 353560 353902 1982 353445 353674 353830 1995 353531 353865 354097 1983 353254 353531 353920 1996 353673 353805 354041 1984 353438 353610 353745 1997 353653 353798 353956 1985 353540 353735 353925 1998 353562 353934 354293 1986 353604 353798 354014 1999 353681 353811 353943 1987 353508 353606 353687 2000 353536 353785 353993 1988 353432 353637 353852 2001 353696 353828 353998 1989 353543 353832 354110 2002 353717 353810 353950 1990 353490 353806 354090 2003 353515 353682 353905 1991 353540 353688 353865 2004 353681 353948 354203 1992 353517 353670 353881 2005 353629 353827 354053
Level Distribution Level (mm Moturiki Datum)
Percentiles 0 1 2 3 4 5 6 7 8 9 0 354419 354273 354231 354194 354171 354134 354088 354056 354039 354019 10 353996 353977 353960 353941 353926 353915 353904 353894 353886 353880 20 353873 353866 353860 353855 353850 353844 353840 353835 353830 353825 30 353820 353816 353811 353807 353803 353799 353795 353790 353786 353782 40 353778 353775 353770 353764 353760 353755 353749 353743 353737 353732 50 353727 353721 353715 353710 353706 353701 353696 353691 353687 353681 60 353676 353671 353667 353663 353659 353655 353649 353644 353639 353635 70 353630 353626 353621 353616 353612 353607 353601 353595 353589 353581 80 353574 353566 353559 353551 353542 353535 353525 353516 353503 353491 90 353478 353464 353449 353435 353418 353399 353373 353349 353323 353300 100 353197

450 Environmental Publication 2007/06
353000
353200
353400
353600
353800
354000
354200
354400
1965 1970 1975 1980 1985 1990 1995 2000 2005
Year
Leve
l (m
m)
Minimum Level 5 per. Mov. Avg. (Minimum Level)
353000
353200
353400
353600
353800
354000
354200
354400
354600
1965 1970 1975 1980 1985 1990 1995 2000 2005
Year
Leve
l (m
m)
Maximum Level 5 per. Mov. Avg. (Maximum Level)
353000
353200
353400
353600
353800
354000
354200
354400
1965 1970 1975 1980 1985 1990 1995 2000 2005
Year
Leve
l (m
m)
Mean Level 5 per. Mov. Avg. (Mean Level)
353100.00
353300.00
353500.00
353700.00
353900.00
354100.00
354300.00
354500.00
1965 1970 1975 1980 1985 1990 1995 2000 2005
Year
Leve
l (m
m)
Mean Autumn Level 5 per. Mov. Avg. (Mean Autumn Level)
353300
353500
353700
353900
354100
354300
354500
1965 1970 1975 1980 1985 1990 1995 2000 2005
Year
Leve
l (m
m)
Mean Winter Level 5 per. Mov. Avg. (Mean Winter Level)
353400353500353600353700353800353900354000354100354200354300
1965 1970 1975 1980 1985 1990 1995 2000 2005
Year
Leve
l (m
m)
Mean Spring Level 5 per. Mov. Avg. (Mean Spring Level)
353200
353400
353600
353800
354000
354200
354400
1965 1970 1975 1980 1985 1990 1995 2000 2005
Year
Leve
l (m
m)
Mean Summer Level 5 per. Mov. Avg. (Mean Summer Level)
Okareka at Acacia Bay

Environment Bay of Plenty 451
Environment Bay of Plenty Lake Level Recording Station
Lake Tikitapu Site Tarawera Rd Site Number 15347 Grid Reference U16: 022 292 Start of Record January 1972 Data Capture Rate Data Summary From January 1972 To December 2005 Data Audited From January 1994 To December 2005 Equipment History 26/01/72: Staff gauge installed.
Comments on Stage/Discharge Ratings Ratings are available to convert Stage (mm) to Reduced Level (mm) in Moturiki Datum.
General Comments Manual staff gauge read weekly until July 1972, then bi-weekly till October 1976 and monthly since then. The local recording authority was Water & Soil Division, Hamilton. Site is now operated by Environment Bay of Plenty as part of its Natural Environmental Regional Monitoring Network.
SITE LOCATION Tikitapu at Tarawera Rd

452 Environmental Publication 2007/06
Station Comments Lake Tikitapu at Tarawera Rd. Site Number 15347, on River Number 153133.
Surface Area (km2)
Average Depth (m)
Maximum Depth (m)
Maximum Length (km)
Maximum Width (km)
Type
1.4 18.0 27.5 1.6 1.3 Volcanic Source: Waters of New Zealand (1992). The local recording authority is Environment B.O.P. The lake is landlocked without a surface outlet. The lake is also known as Blue Lake. Lake levels are recorded at intermittent intervals and filed as staff gauge heights. To convert to Reduced Level Moturiki Datum, apply kind 3 rating. 31/12/00 Data audit carried out on lake level monitoring site 15347 covering the period 980101 to 20001231. Data audit passed external audit carried out by Environmental Quality Systems.
For additional information, please see recording authority.

Environment Bay of Plenty 453
Environment Bay of Plenty Hydrological Level Summary
Date Compiled October 2006 Site Number 15347 Compiled by Craig Putt Lake Tikitapu Station Tarawera Rd Metric Map Reference U16: 022 292 Catchment Area (km2) 5.75 Period of Summary 1972 to 2005 Statistical Summary
Level (mm Moturiki Datum) Minimum Level 416268 Maximum Level 418675 Mean Annual Minimum Level 417169 Mean Annual Maximum Level 417612 Mean Level 417407 Mean Summer Level 417453 Median Level 417464 Mean Autumn Level 417332 Mean Winter Level 417353 Mean Spring Level 417494 Low Level Distribution Fit Utilised GEV Peak Level Distribution Fit Utilised GEV 7 day Low Level (Minimum) 416272 Peak Level (5 yr Return) 417978 7 Day Low Level (Mean Annual) 417150 Peak Level (10 yr Return) 418099 7 day Low Level (5 yr Return) 416826 Peak Level (20 yr Return) 418174 7 Day Low Level (10 yr Return) 416599 Peak Level (50 yr Return) 418236 Peak Level (100 yr Return) 418264
Annual Summaries Level (mm Moturiki Datum) Level (mm Moturiki Datum) Year Minimum Mean Maximum
Year Minimum Mean Maximum 1980 417500 417599 417816 1993 416922 417039 417274 1981 417357 417486 417651 1994 416564 416883 417225 1982 417130 417355 417627 1995 416980 417347 417722 1983 416605 416778 417075 1996 417702 417878 418117 1984 416778 416893 417000 1997 417689 417921 418018 1985 416626 416807 416920 1998 417473 417844 418152 1986 416935 417043 417160 1999 417693 417848 418051 1987 416510 416707 416951 2000 417570 417685 417891 1988 416268 416468 416668 2001 417465 417557 417689 1989 416650 416921 417325 2002 417421 417566 417729 1990 417060 417265 417660 2003 417098 417233 417404 1991 417005 417213 417424 2004 417337 417643 417929 1992 416808 417049 417317 2005 417564 417741 417939
Level Distribution Level (mm Moturiki Datum)
Percentiles 0 1 2 3 4 5 6 7 8 9 0 418675 418430 418358 418136 418094 418045 418021 418011 417995 417974 10 417952 417936 417927 417914 417901 417886 417877 417856 417832 417819 20 417810 417801 417790 417776 417764 417752 417743 417730 417719 417711 30 417702 417688 417679 417665 417651 417640 417626 417615 417603 417592 40 417584 417574 417564 417553 417546 417532 417518 417510 417498 417487 50 417464 417445 417431 417414 417397 417381 417364 417343 417329 417305 60 417287 417268 417250 417237 417222 417208 417192 417176 417162 417145 70 417132 417121 417104 417082 417068 417053 417034 417021 417005 416988 80 416966 416947 416934 416907 416888 416874 416863 416852 416832 416811 90 416788 416741 416712 416686 416664 416652 416625 416602 416510 416417 100 416268

454 Environmental Publication 2007/06
416000
416500
417000
417500
418000
418500
1970 1975 1980 1985 1990 1995 2000 2005
Year
Leve
l (m
m)
Minimum Level 5 per. Mov. Avg. (Minimum Level)
416500
417000
417500
418000
418500
419000
1970 1975 1980 1985 1990 1995 2000 2005
Year
Leve
l (m
m)
Maximum Level 5 per. Mov. Avg. (Maximum Level)
416000
416500
417000
417500
418000
418500
419000
1970 1975 1980 1985 1990 1995 2000 2005
Year
Leve
l (m
m)
Mean Level 5 per. Mov. Avg. (Mean Level)
416000
416500
417000
417500
418000
418500
419000
1970 1975 1980 1985 1990 1995 2000 2005
Year
Leve
l (m
m)
Mean Autumn Level 5 per. Mov. Avg. (Mean Autumn Level)
416000
416500
417000
417500
418000
418500
1970 1975 1980 1985 1990 1995 2000 2005
Year
Leve
l (m
m)
Mean Winter Level 5 per. Mov. Avg. (Mean Winter Level)
416500
417000
417500
418000
418500
1970 1975 1980 1985 1990 1995 2000 2005
Year
Leve
l (m
m)
Mean Spring Level 5 per. Mov. Avg. (Mean Spring Level)
416000
416500
417000
417500
418000
418500
1970 1975 1980 1985 1990 1995 2000 2005
Year
Leve
l (m
m)
Mean Summer Level 5 per. Mov. Avg. (Mean Summer Level)
Tikitapu at Tarawera Rd

Environment Bay of Plenty 455
Environment Bay of Plenty Lake Level Recording Station
Lake Tarawera Site Te Wairoa Site Number 15301 Grid Reference U16: 057 274 Start of Record April 1925 Data Capture Rate 96% Data Summary From January 1926 To December 2005 Data Audited From January 1994 To December 2005 Equipment History 01/01/25: Staff gauge installed. 12/03/51: Weekly Bristol chart recorder. 17/12/58: Monthly Kent chart recorder. 24/08/73: Float with F&P digital recorder.
24/08/73: Backup is Kent chart recorder. 16/12/93: Encoder and WRIC datalogger. 01/06/94: Float with L&S datalogger. 26/11/97: Float with Campbell datalogger.
Comments on Stage/Discharge Ratings Ratings are available to convert Stage (mm) to Reduced Level (mm) in Moturiki Datum. General Comments Staff gauge readings were collected on an intermittent basis from 1925 till 1951. Site was operated by NIWA, Rotorua. Site is now operated by Environment Bay of Plenty as part of its Natural Environmental Regional Monitoring Network. NOTE: Suspected tectonic land deformation in this area could be affecting the recorder site, and hence influencing the historical relativity of the lake level record.
SITE LOCATION Tarawera at Te Wairoa

456 Environmental Publication 2007/06
Station Comments Lake Tarawera at Te Wairoa. Site Number 15301, on River Number 153000.
Surface Area (km2)
Average Depth (m)
Maximum Depth (m)
Maximum Length (km)
Maximum Width (km)
Type
41.02 50 87.5 11.4 9.0 Volcanic Source: Waters of New Zealand (1992). The local recording authority is Environment BOP. The catchment area includes the following land locked lakes, totalling 243km2: Rotomahana, Rerewhakaaitu, Tikitapu, Okataina, Okareka and Rotokakahi. Data is filed in gauge heights, to convert to Moturiki datum apply kind 3 ratings. Periods of synthetic data occur throughout the record. Synthetic data compiled using Lake Okareka. 01/01/25 A kind 3 rating has been filed for the staff gauge installed (to Martins datum) on 250101. The rating converts the filed gauge heights to Moturiki datum. 20/05/20 Staff gauge readings began 250520 on an intermittent basis until the installation of a chart recorder 510312. Periods of less than six months between readings have been treated as continuous record. Levels have generally been read to the nearest thirty millimetres (0.1ft). 03/10/44 There were no lake levels recorded from 441003 to 480101. 31/12/47 A new kind 3 rating applies from 471231, as the old staff gauge was replaced when the markings became unreadable. The new staff gauge was levelled to Martins bench mark at Te Wairoa Buried Village and set to a new reduced level zero. 12/03/51 Recorder installed on day 510312 is a 4.57 metre (15 ft) range, weekly Bristol with a time resolution of 13-64 minutes/mm recorded and a stage ratio of 43 mm of stage/mm chart recorded. 27/02/64 Recorder not operational from 640227 at 70000 to 640325 at 130000 due to tower reconstruction. Daily staff gauge readings have been filed. 17/02/94 Operation of site handed over to Environment BOP. 26/11/97 A Handar encoder and CR500 datalogger were installed. Recording interval is 30 minutes. 31/12/00 Data audit carried out on lake level monitoring site 15301 covering the period 980101 to 20001231. Data audit passed external audit carried out by Environmental Quality Systems.
For additional information, please see recording authority.

Environment Bay of Plenty 457
Environment Bay of Plenty Hydrological Level Summary
Date Compiled October 2006 Site Number 15301 Compiled by Craig Putt Lake TARAWERA Station TE WAIROA Metric Map Reference U16: 057 274 Catchment Area (km2) 412 Period of Summary 1926 to 2005 Statistical Summary
Level (mm Moturiki Datum) Minimum Level 297676 Maximum Level 298549 Mean Annual Minimum Level 297936 Mean Annual Maximum Level 298203 Mean Level 298028 Mean Summer Level 298032 Median Level 298012 Mean Autumn Level 298001 Mean Winter Level 298034 Mean Spring Level 298043 Low Level Distribution Fit Utilised GEV Peak Level Distribution Fit Utilised GEV 7 day Low Level (Minimum) 297684 Peak Level (5 yr Return) 298313 7 Day Low Level (Mean Annual) 297890 Peak Level (10 yr Return) 298403 7 day Low Level (5 yr Return) 297796 Peak Level (20 yr Return) 298485 7 Day Low Level (10 yr Return) 297740 Peak Level (50 yr Return) 298585 Peak Level (100 yr Return) 298656
Annual Summaries Level (mm Moturiki Datum) Level (mm Moturiki Datum) Year Minimum Mean Maximum
Year Minimum Mean Maximum 1980 297852 297908 297995 1993 297728 297804 297962 1981 297841 297916 298052 1994 297676 297805 298001 1982 297783 297856 298003 1995 297720 297863 298040 1983 297742 297836 298059 1996 297795 297887 298032 1984 297773 297875 297999 1997 297791 297894 298052 1985 297740 297867 297969 1998 297752 297891 298167 1986 297766 297881 298138 1999 297764 297884 298118 1987 297785 297839 297951 2000 297729 297871 298001 1988 297746 297846 298015 2001 297776 297886 298031 1989 297729 297908 298108 2002 297763 297864 297990 1990 297773 297888 298087 2003 297702 297823 297972 1991 297727 297835 298022 2004 297678 297849 298041 1992 297696 297846 298038 2005 297701 297849 298012
Level Distribution Level (mm Moturiki Datum)
Percentiles 0 1 2 3 4 5 6 7 8 9 0 298549 298419 298375 298347 298325 298311 298295 298283 298272 298265 10 298256 298248 298240 298229 298220 298213 298205 298197 298195 298194 20 298191 298184 298173 298166 298156 298153 298144 298134 298126 298125 30 298114 298105 298095 298094 298091 298082 298075 298067 298065 298064 40 298062 298054 298046 298039 298034 298034 298033 298033 298027 298019 50 298012 298005 298004 298003 297999 297993 297987 297980 297973 297972 60 297970 297964 297958 297953 297948 297943 297940 297934 297929 297925 70 297920 297915 297911 297906 297902 297897 297893 297888 297883 297880 80 297875 297871 297866 297861 297857 297852 297847 297842 297838 297833 90 297828 297822 297815 297808 297801 297794 297785 297776 297764 297746 100 297676

458 Environmental Publication 2007/06
297600
297700
297800
297900
298000
298100
298200
298300
1925 1935 1945 1955 1965 1975 1985 1995 2005
Year
Leve
l (m
m)
Minimum Level 5 per. Mov. Avg. (Minimum Level)
297900
298000
298100
298200
298300
298400
298500
298600
1925 1935 1945 1955 1965 1975 1985 1995 2005
Year
Leve
l (m
m)
Maximum Level 5 per. Mov. Avg. (Maximum Level)
297700
297800
297900
298000
298100
298200
298300
298400
1925 1935 1945 1955 1965 1975 1985 1995 2005
Year
Leve
l (m
m)
Mean Level 5 per. Mov. Avg. (Mean Level)
297700297800297900298000298100298200298300298400298500
1925 1935 1945 1955 1965 1975 1985 1995 2005
Year
Leve
l (m
m)
Mean Autumn Level 5 per. Mov. Avg. (Mean Autumn Level)
297700
297800
297900
298000
298100
298200
298300
298400
298500
1925 1935 1945 1955 1965 1975 1985 1995 2005
Year
Leve
l (m
m)
Mean Winter Level 5 per. Mov. Avg. (Mean Winter Level)
297700
297800
297900
298000
298100
298200
298300
298400
298500
1925 1935 1945 1955 1965 1975 1985 1995 2005
Year
Leve
l (m
m)
Mean Spring Level 5 per. Mov. Avg. (Mean Spring Level)
297700
297800
297900
298000
298100
298200
298300
298400
298500
1925 1935 1945 1955 1965 1975 1985 1995 2005
Year
Leve
l (m
m)
Mean Summer Level 5 per. Mov. Avg. (Mean Summer Level)
Tarawera at Te Wairoa

Environment Bay of Plenty 459
Environment Bay of Plenty Lake Level Recording Station
Lake Rotokakahi Site Te Wairoa Site Number 15344 Grid Reference U16: 030 272 Start of Record January 1972 Data Capture Rate Data Summary From January 1972 To December 2005 Data Audited From January 1994 To December 2005 Equipment History 26/01/72: Staff gauge installed.
Comments on Stage/Discharge Ratings Ratings are available to convert Stage (mm) to Reduced Level (mm) in Moturiki Datum. General Comments Staff gauge read weekly until August 1972, then bi-weekly until October 1976, monthly since then. Site is operated by Environment Bay of Plenty as part of its Natural Environmental Regional Monitoring Network.
SITE LOCATION Rotokakahi at Te Wairoa

460 Environmental Publication 2007/06
Station Comments Lake Rotokakahi at Te Wairoa Outlet. Site Number 15344, on River Number 153132.
Surface Area (km2)
Average Depth (m)
Maximum Depth (m)
Maximum Length (km)
Maximum Width (km)
Type
4.48 17.5 32.0 4.3 1.7 Volcanic Source: Waters of New Zealand (1992). The local recording authority is Environment B.O.P. Lake is also known as Green Lake. Lake volume is 77,100,000m3. Lake levels are recorded at intermittent intervals and filed as staff gauge heights. To convert to reduced level Moturiki Datum, apply kind 3 rating. 31/12/00 Data audit carried out on lake level monitoring site 15344 covering the period 980101 to 20001231. Data audit passed external audit carried out by Environmental Quality Systems.
For additional information, please see recording authority.

Environment Bay of Plenty 461
Environment Bay of Plenty Hydrological Level Summary
Date Compiled October 2006 Site Number 15344 Compiled by Craig Putt Lake Rotokakahi Station Te Wairoa Metric Map Reference U16: 030 272 Catchment Area (km2) 19.9 Period of Summary 1973 to 2005 Statistical Summary
Level (mm Moturiki Datum) Minimum Level 394742 Maximum Level 395172 Mean Annual Minimum Level 394833 Mean Annual Maximum Level 395010 Mean Level 394920 Mean Summer Level 394905 Median Level 394912 Mean Autumn Level 394888 Mean Winter Level 394932 Mean Spring Level 394947 Low Level Distribution Fit Utilised GEV Peak Level Distribution Fit Utilised GEV 7 day Low Level (Minimum) 395131 Peak Level (5 yr Return) 394805 7 Day Low Level (Mean Annual) 395014 Peak Level (10 yr Return) 394786 7 day Low Level (5 yr Return) 395056 Peak Level (20 yr Return) 394772 7 Day Low Level (10 yr Return) 395084 Peak Level (50 yr Return) 394757 Peak Level (100 yr Return) 394748
Annual Summaries Level (mm Moturiki Datum) Level (mm Moturiki Datum) Year Minimum Mean Maximum
Year Minimum Mean Maximum 1980 394847 394902 394939 1993 394831 394917 395051 1981 394836 394919 395020 1994 394831 394944 395045 1982 394824 394882 394934 1995 394868 395006 395106 1983 394768 394873 394990 1996 394988 395022 395105 1984 394812 394862 394907 1997 394921 394992 395030 1985 394742 394860 394968 1998 394844 394971 395137 1986 394777 394886 395062 1999 394837 394916 395004 1987 394806 394838 394887 2000 394816 394879 394922 1988 394827 394904 394992 2001 394839 394877 394931 1989 394827 394959 395077 2002 394824 394872 394945 1990 394900 394943 395039 2003 394800 394876 395002 1991 394828 394907 394977 2004 394907 394947 395034 1992 394879 394951 395050 2005 394864 394906 394990
Level Distribution Level (mm Moturiki Datum)
Percentiles 0 1 2 3 4 5 6 7 8 9 0 395172 395089 395069 395052 395040 395031 395023 395018 395015 395012 10 395008 395004 395001 394998 394995 394993 394990 394988 394986 394983 20 394980 394978 394976 394973 394970 394967 394964 394961 394958 394955 30 394952 394949 394946 394943 394941 394938 394936 394934 394932 394930 40 394928 394927 394925 394924 394922 394920 394918 394917 394915 394914 50 394912 394911 394910 394908 394907 394905 394904 394902 394901 394900 60 394898 394897 394895 394894 394892 394891 394889 394887 394886 394884 70 394883 394881 394880 394878 394877 394875 394873 394871 394868 394866 80 394864 394862 394859 394856 394854 394852 394850 394848 394846 394844 90 394842 394838 394834 394830 394825 394820 394817 394812 394800 394784 100 394742

462 Environmental Publication 2007/06
394700
394750
394800
394850
394900
394950
395000
395050
1970 1975 1980 1985 1990 1995 2000 2005
Year
Leve
l (m
m)
Minimum Level 5 per. Mov. Avg. (Minimum Level)
394850
394900
394950
395000
395050
395100
395150
395200
1970 1975 1980 1985 1990 1995 2000 2005
Year
Leve
l (m
m)
Maximum Level 5 per. Mov. Avg. (Maximum Level)
394800
394850
394900
394950
395000
395050
1970 1975 1980 1985 1990 1995 2000 2005
Year
Leve
l (m
m)
Mean Level 5 per. Mov. Avg. (Mean Level)
394750
394800
394850
394900
394950
395000
395050
1970 1975 1980 1985 1990 1995 2000 2005
Year
Leve
l (m
m)
Mean Autumn Level 5 per. Mov. Avg. (Mean Autumn Level)
394800
394850
394900
394950
395000
395050
395100
1970 1975 1980 1985 1990 1995 2000 2005
Year
Leve
l (m
m)
Mean Winter Level 5 per. Mov. Avg. (Mean Winter Level)
394850
394900
394950
395000
395050
395100
1970 1975 1980 1985 1990 1995 2000 2005
Year
Leve
l (m
m)
Mean Spring Level 5 per. Mov. Avg. (Mean Spring Level)
394800
394850
394900
394950
395000
395050
1970 1975 1980 1985 1990 1995 2000 2005
Year
Leve
l (m
m)
Mean Summer Level 5 per. Mov. Avg. (Mean Summer Level)
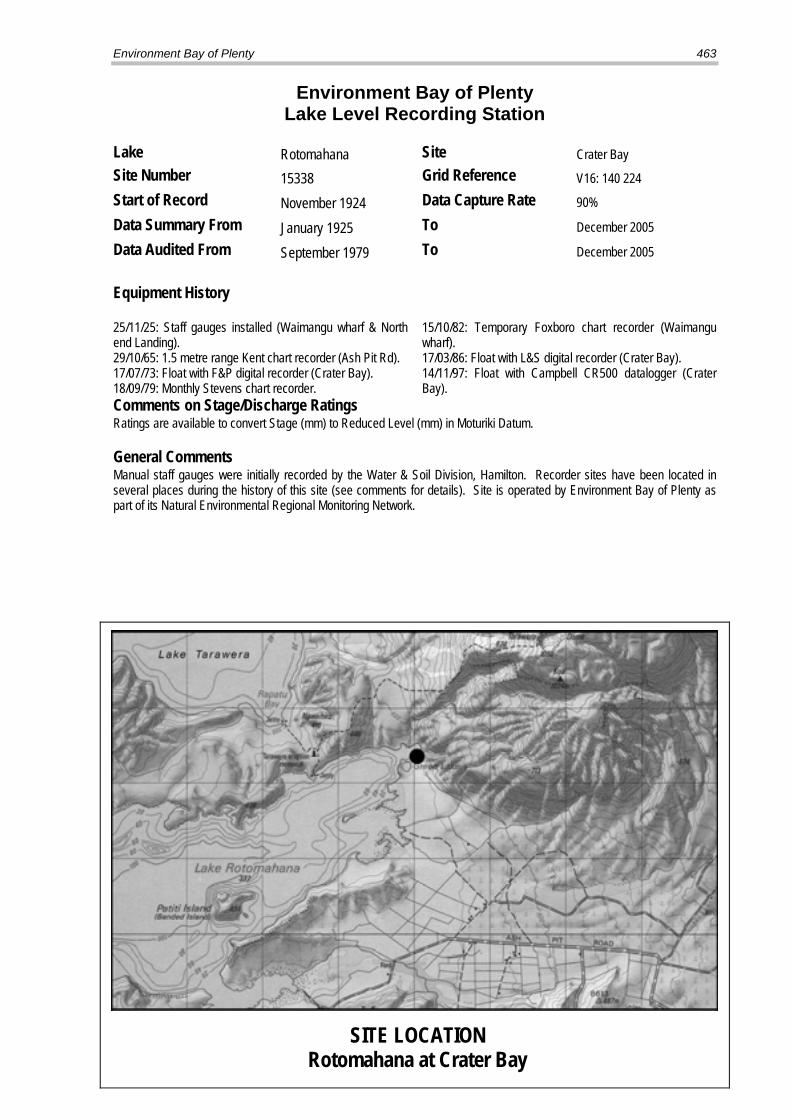
Environment Bay of Plenty 463
Environment Bay of Plenty Lake Level Recording Station
Lake Rotomahana Site Crater Bay Site Number 15338 Grid Reference V16: 140 224 Start of Record November 1924 Data Capture Rate 90%
Data Summary From January 1925 To December 2005
Data Audited From September 1979 To December 2005
Equipment History 25/11/25: Staff gauges installed (Waimangu wharf & North end Landing). 29/10/65: 1.5 metre range Kent chart recorder (Ash Pit Rd). 17/07/73: Float with F&P digital recorder (Crater Bay). 18/09/79: Monthly Stevens chart recorder.
15/10/82: Temporary Foxboro chart recorder (Waimangu wharf). 17/03/86: Float with L&S digital recorder (Crater Bay). 14/11/97: Float with Campbell CR500 datalogger (Crater Bay).
Comments on Stage/Discharge Ratings Ratings are available to convert Stage (mm) to Reduced Level (mm) in Moturiki Datum. General Comments Manual staff gauges were initially recorded by the Water & Soil Division, Hamilton. Recorder sites have been located in several places during the history of this site (see comments for details). Site is operated by Environment Bay of Plenty as part of its Natural Environmental Regional Monitoring Network.
SITE LOCATION Rotomahana at Crater Bay

464 Environmental Publication 2007/06
Station Comments Lake Rotomahana at Crater Bay. Site Number 15338, on River Number 153134.
Surface Area (km2)
Average Depth (m)
Maximum Depth (m)
Maximum Length (km)
Maximum Width (km)
Type
7.95 60 125 6.2 2.8 Volcanic Source: Waters of New Zealand (1992). Local recording authority is Environment BOP. Levels for the 50 and 100 year return periods would be affected by the performance of the high level overflow culvert. Staff gauge data from 241125; automatically recorded data from 651029. Periods of synthetic data occur throughout the record. Synthetic data compiled using Lake Rerewhakaaitu. Gauges A1 to E at, or near Waimangu Wharf N85: 876 875. Gauge A1 installed November 1924. Various others were installed between 1924 and 1953. Readings from A1, A2 & B are generally daily to nearest 25mm with some to nearest 6mm. Regular readings stopped 411031, restarted in 1948 but there are 3 readings in Feb 1942 & 3 in 1947. Any further gaps are because of the launch not running or the gauge being overtopped. 25/11/24 Gauges F to H at north end landing N77: 917 902. Gauge F installed 531015, Gauge G installed 550114, and Gauge H installed 560222. 337930mm added to readings from F, G & H to convert to Moturiki datum. 31/10/41 Records of lake levels were not kept from 411031 to 480103, except for the period 420217 to 420221 and spot readings taken on the following dates, 470404, 470615 and 470910. The spot readings were taken at 0900hrs and extra points of the same level have been added to make these read as daily mean reduced levels. 01/09/62 Staff gauge under water from 620901 to 621130, inclusive. 18/09/79 Site handed over to Bay of Plenty Catchment Commission on 790918. Seiche effects of up to 12mm have been ignored when manually extracting lake levels from charts. 15/10/82 Temporary Foxboro site established near Waimangu Wharf from 821015 to 840331, due to low water levels at Crater Bay. 15/02/87 Synthetic data from 870215 to 870715 - some spot heights available. 16/11/87 Missing record from 871116 to 880122 and from 880501 to 880916, due to lake level dropping below level of stilling well intake pipes. 14/11/97 A Handar encoder and CR500 datalogger were installed. Recording interval is 30 minutes. 31/12/00 Data audit carried out on lake level monitoring site 15338 covering the period 980101 to 20001231. Data audit passed external audit carried out by Environmental Quality Systems.
For additional information, please see recording authority.

Environment Bay of Plenty 465
Environment Bay of Plenty Hydrological Level Summary
Date Compiled October 2006 Site Number 15338 Compiled by Craig Putt Lake Rotomahana Station Crater Bay Metric Map Reference V16: 140 224 Catchment Area (km2) 84 Period of Summary 1925 to 2005 Statistical Summary
Level (mm Moturiki Datum) Minimum Level 333572 Maximum Level 342123 Mean Annual Minimum Level 337836 Mean Annual Maximum Level 338598 Mean Level 338203 Mean Summer Level 338829 Median Level 338144 Mean Autumn Level 338657 Mean Winter Level 338770 Mean Spring Level 338888 Low Level Distribution Fit Utilised GEV Peak Level Distribution Fit Utilised GEV 7 day Low Level (Minimum) 333580 Peak Level (5 yr Return) 340015 7 Day Low Level (Mean Annual) 337534 Peak Level (10 yr Return) 340842 7 day Low Level (5 yr Return) 336272 Peak Level (20 yr Return) 341520 7 Day Low Level (10 yr Return) 335447 Peak Level (50 yr Return) 342254 Peak Level (100 yr Return) 342715
Annual Summaries Level (mm Moturiki Datum) Level (mm Moturiki Datum) Year Minimum Mean Maximum
Year Minimum Mean Maximum 1980 338840 339050 339360 1993 336568 336949 337386 1981 338456 338645 338920 1994 336081 336509 336900 1982 337987 338288 338703 1995 336381 337005 337674 1983 337307 337555 337992 1996 337532 337915 338405 1984 337238 337373 337554 1997 338137 338481 338805 1985 336943 337204 337381 1998 338125 338519 338840 1986 337241 337463 337676 1999 338294 338432 338686 1987 336829 337128 337452 2000 338026 338184 338504 1988 336325 336489 336626 2001 337799 337925 338128 1989 336336 336715 337244 2002 337535 337759 338029 1990 336796 337142 337597 2003 337025 337232 337557 1991 336892 337186 337423 2004 336982 337361 337769 1992 336694 337010 337443 2005 337312 337604 338027
Level Distribution Level (mm Moturiki Datum)
Percentiles 0 1 2 3 4 5 6 7 8 9 0 342123 341919 341398 341075 340950 340879 340810 340767 340703 340656 10 340603 340537 340493 340458 340429 340405 340378 340338 340269 340183 20 340084 339943 339873 339766 339513 339422 339357 339300 339238 339194 30 339145 339109 339059 339022 338992 338943 338902 338812 338730 338631 40 338580 338511 338445 338392 338370 338349 338319 338270 338234 338202 50 338144 338105 338033 337966 337898 337823 337758 337697 337645 337609 60 337571 337524 337472 337434 337397 337370 337343 337315 337286 337263 70 337233 337205 337176 337136 337094 337060 337021 336983 336938 336896 80 336858 336798 336723 336623 336559 336502 336442 336383 336322 336260 90 336189 336100 335960 335807 335384 334903 334654 334378 334274 333968 100 333572

466 Environmental Publication 2007/06
333000
334000
335000
336000
337000
338000
339000
340000
341000
342000
343000
1925 1935 1945 1955 1965 1975 1985 1995 2005
Year
Leve
l (m
m)
Minimum Level 5 per. Mov. Avg. (Minimum Level)
334000
335000
336000
337000
338000
339000
340000
341000
342000
343000
1925 1935 1945 1955 1965 1975 1985 1995 2005
Year
Leve
l (m
m)
Maximum Level 5 per. Mov. Avg. (Maximum Level)
333000334000335000336000337000338000339000340000341000342000343000
1925 1935 1945 1955 1965 1975 1985 1995 2005
Year
Leve
l (m
m)
Mean Level 5 per. Mov. Avg. (Mean Level)
333000334000335000336000337000338000339000340000341000342000343000
1925 1935 1945 1955 1965 1975 1985 1995 2005
Year
Leve
l (m
m)
Mean Autumn Level 5 per. Mov. Avg. (Mean Autumn Level)
333000334000335000336000337000338000339000340000341000342000343000
1925 1935 1945 1955 1965 1975 1985 1995 2005
Year
Leve
l (m
m)
Mean Winter Level 5 per. Mov. Avg. (Mean Winter Level)
333000334000335000336000337000338000339000340000341000342000343000
1925 1935 1945 1955 1965 1975 1985 1995 2005
Year
Leve
l (m
m)
Mean Spring Level 5 per. Mov. Avg. (Mean Spring Level)
333000334000335000336000337000338000339000340000341000342000343000
1925 1935 1945 1955 1965 1975 1985 1995 2005
Year
Leve
l (m
m)
Mean Summer Level 5 per. Mov. Avg. (Mean Summer Level)
Rotomahana at Crater Bay

Environment Bay of Plenty 467
Environment Bay of Plenty Lake Level Recording Station
Lake Okaro Site Reserve Site Number 1015325 Grid Reference U16: 067 173 Start of Record November 1989 Data Capture Rate Data Summary From January 1990 To December 2005 Data Audited From January 1990 To December 2005 Equipment History 26/08/87: Staff gauge installed (replaced original). Comments on Stage/Discharge Ratings Ratings available to convert stage (mm) to reduced level (mm) in Moturiki Datum.
General Comments Monthly staff gauge readings only. Site is operated by Environment Bay of Plenty as part of its Natural Environmental Regional Monitoring Network. Artificial control on lake level exerted by the periodic excavation of the outlet control should be taken into account when using the prepared frequency estimates. For more information, contact the recording authority.
SITE LOCATION Okaro at Reserve

468 Environmental Publication 2007/06
Station Comments Lake Okaro At Reserve. Site Number 1015325.
Surface Area (km2)
Average Depth (m)
Maximum Depth (m)
Maximum Length (km)
Maximum Width (km)
Type
0.28 12.1 18.0 0.7 0.6 Volcanic Source: Waters of New Zealand (1992). The local recording authority is Environment B.O.P. This is a staff gauge only site and is read at approximately 6 weekly intervals by Environment BOP staff. Lake levels are in gauge heights, to convert to Moturiki datum apply type three ratings. 18/08/80 This is the first date on record of staff gauge readings at Okaro. It is therefore assumed that the site was installed initially in mid to late 1980. 18/08/80 120000 17/11/89 120000 Between 800818 and 891117 the site was visited on random occasions. Subsequently, there is not a complete data record for this period. 26/08/87 Installed new staff gauge on 870826. 17/03/94 Missing data from 940317 to 940519 staff gauge not read in April. 13/09/05 Missing data from 20050913 to 20051208 staff gauge not read in November.
For additional information, please see recording authority.
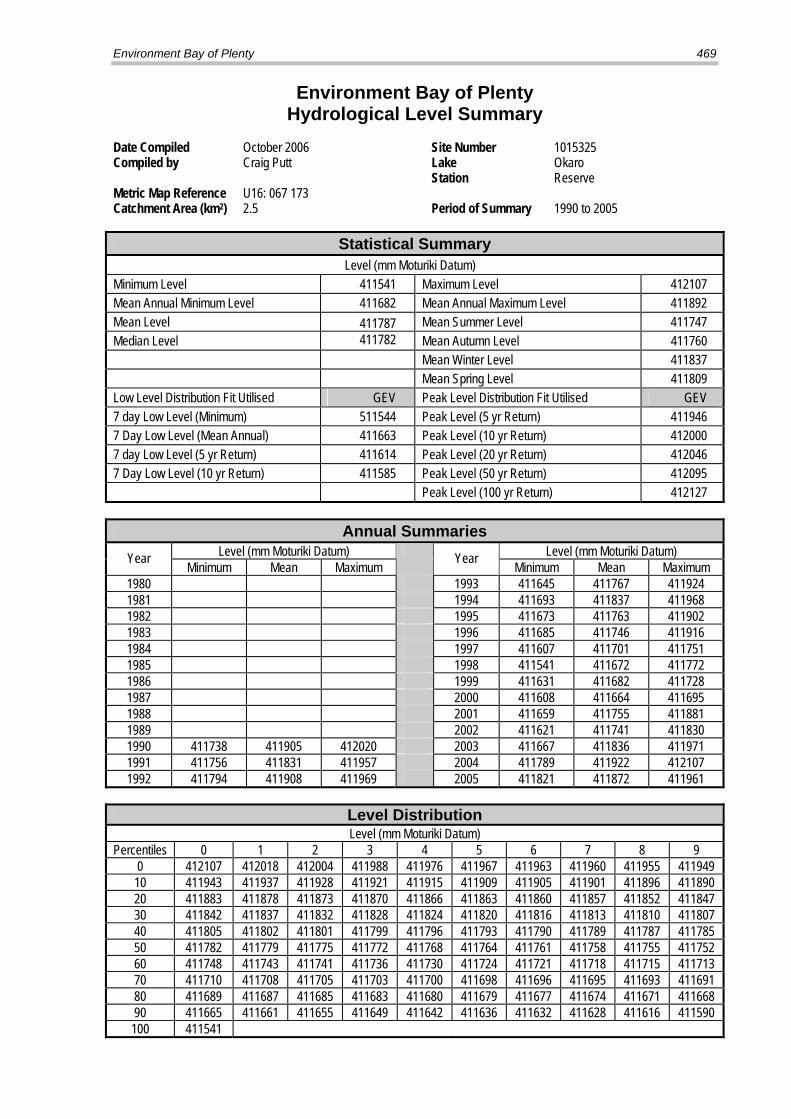
Environment Bay of Plenty 469
Environment Bay of Plenty Hydrological Level Summary
Date Compiled October 2006 Site Number 1015325 Compiled by Craig Putt Lake Okaro Station Reserve Metric Map Reference U16: 067 173 Catchment Area (km2) 2.5 Period of Summary 1990 to 2005 Statistical Summary
Level (mm Moturiki Datum) Minimum Level 411541 Maximum Level 412107 Mean Annual Minimum Level 411682 Mean Annual Maximum Level 411892 Mean Level 411787 Mean Summer Level 411747 Median Level 411782 Mean Autumn Level 411760 Mean Winter Level 411837 Mean Spring Level 411809 Low Level Distribution Fit Utilised GEV Peak Level Distribution Fit Utilised GEV 7 day Low Level (Minimum) 511544 Peak Level (5 yr Return) 411946 7 Day Low Level (Mean Annual) 411663 Peak Level (10 yr Return) 412000 7 day Low Level (5 yr Return) 411614 Peak Level (20 yr Return) 412046 7 Day Low Level (10 yr Return) 411585 Peak Level (50 yr Return) 412095 Peak Level (100 yr Return) 412127
Annual Summaries Level (mm Moturiki Datum) Level (mm Moturiki Datum) Year Minimum Mean Maximum
Year Minimum Mean Maximum 1980 1993 411645 411767 411924 1981 1994 411693 411837 411968 1982 1995 411673 411763 411902 1983 1996 411685 411746 411916 1984 1997 411607 411701 411751 1985 1998 411541 411672 411772 1986 1999 411631 411682 411728 1987 2000 411608 411664 411695 1988 2001 411659 411755 411881 1989 2002 411621 411741 411830 1990 411738 411905 412020 2003 411667 411836 411971 1991 411756 411831 411957 2004 411789 411922 412107 1992 411794 411908 411969 2005 411821 411872 411961
Level Distribution Level (mm Moturiki Datum)
Percentiles 0 1 2 3 4 5 6 7 8 9 0 412107 412018 412004 411988 411976 411967 411963 411960 411955 411949 10 411943 411937 411928 411921 411915 411909 411905 411901 411896 411890 20 411883 411878 411873 411870 411866 411863 411860 411857 411852 411847 30 411842 411837 411832 411828 411824 411820 411816 411813 411810 411807 40 411805 411802 411801 411799 411796 411793 411790 411789 411787 411785 50 411782 411779 411775 411772 411768 411764 411761 411758 411755 411752 60 411748 411743 411741 411736 411730 411724 411721 411718 411715 411713 70 411710 411708 411705 411703 411700 411698 411696 411695 411693 411691 80 411689 411687 411685 411683 411680 411679 411677 411674 411671 411668 90 411665 411661 411655 411649 411642 411636 411632 411628 411616 411590 100 411541

470 Environmental Publication 2007/06
411500
411550
411600
411650
411700
411750
411800
411850
1990 1992 1994 1996 1998 2000 2002 2004
Year
Leve
l (m
m)
Minimum Level 5 per. Mov. Avg. (Minimum Level)
411650411700411750411800411850411900411950412000412050412100412150
1990 1992 1994 1996 1998 2000 2002 2004
Year
Leve
l (m
m)
Maximum Level 5 per. Mov. Avg. (Maximum Level)
411650
411700
411750
411800
411850
411900
411950
1990 1992 1994 1996 1998 2000 2002 2004
Year
Leve
l (m
m)
Mean Level 5 per. Mov. Avg. (Mean Level)
411600
411650
411700
411750
411800
411850
411900
411950
1985 1990 1995 2000 2005
Year
Leve
l (m
m)
Mean Autumn Level 5 per. Mov. Avg. (Mean Autumn Level)
411650
411700
411750
411800
411850
411900
411950
412000
412050
1985 1990 1995 2000 2005
Year
Leve
l (m
m)
Mean Winter Level 5 per. Mov. Avg. (Mean Winter Level)
411650
411700
411750
411800
411850
411900
411950
412000
412050
1985 1990 1995 2000 2005
Year
Leve
l (m
m)
Mean Spring Level 5 per. Mov. Avg. (Mean Spring Level)
411550
411600
411650
411700
411750
411800
411850
411900
411950
1985 1990 1995 2000 2005
Year
Leve
l (m
m)
Mean Summer Level 5 per. Mov. Avg. (Mean Summer Level)
Okaro at Reserve

Environment Bay of Plenty 471
Environment Bay of Plenty Lake Level Recording Station
Lake Rerewhakaaitu Site Homestead Arm Site Number 1015310 Grid Reference V16: 145 165 Start of Record April 1983 Data Capture Rate 96% Data Summary From January 1984 To December 2005 Data Audited From April 1983 To December 2005 Equipment History 29/06/83: 3 metre range Monthly Foxboro chart recorder. 30/10/84: 10 metre range Monthly Stevens chart recorder.
14/06/88: Float with L&S digital recorder. 18/11/97: Float with Campbell CR500 datalogger.
Comments on Stage/Discharge Ratings Ratings are available to convert Stage (mm) to Reduced Level (mm) in Moturiki Datum.
General Comments The Lake Rerewhakaaitu recorder was originally installed at Awaatua Bay (Site No. 15308) and was operated by Water & Soil Division, Hamilton. The site was handed over to B.O.P.C.C. in July 1979. Due to low lake levels, the site was moved to Homestead Arm (1015310) in April 1983. A control structure on the eastern side of Lake Rerewhakaaitu is operated by the Rotorua District Council during periods of high water levels, to divert water from Rerewhakaaitu into the Mangaharakeke Stream. Site is now operated by Environment Bay of Plenty as part of its Natural Environmental Regional Monitoring Network.
SITE LOCATION Rerewhakaaitu at Homestead Arm

472 Environmental Publication 2007/06
Station Comments Lake Rerewhakaaitu at Homestead Arm. Site Number 1015310, on River Number 153135.
Surface Area (km2)
Average Depth (m)
Maximum Depth (m)
Maximum Length (km)
Maximum Width (km)
Type
7.47 7.0 15.8 3.8 3.7 Volcanic Source: Waters of New Zealand (1992). The local recording authority is Environment BOP. This site was established in April 1983 when the previous recording site (15308) at Awaatua Bay was abandoned due to low lake levels at the site. Reduced level ratings are available to convert gauge height to reduced level (Moturiki datum). Periods of synthetic data occur throughout the record. Synthetic data compiled using Lake Rotomahana. 29/06/83 Foxboro (3m range) monthly recorder installed at site. Instrument has a time resolution of 58-291 minutes/mm recorded and a stage ratio of 28mm stage/mm chart recorded. 15/01/88 Missing record from 880115 at 125700 to 880115 at 205424 due to staff gauge lowered by 2.000 meters on 880115. 27/02/88 Missing record from 880227 at 192240 to 880307 at 162744 due to water level dropping below intake pipe level. @@ 1015310 880308 100344 Missing record on several occasions between February 1988 and April 1988 due to water level dropping below intake pipe level. 28/03/89 Rating change after this point. When staff gauges were surveyed in 1990 an unexplained rise of 8mm was measured. The R.L. of DOSLI benchmark AD65 is questionable; DOSLI have not surveyed this benchmark since 1969. A temporary rating has been filed and will be checked after DOSLI have surveyed their benchmark. 01/01/97 Change of primary reference from external staff gauge to internal gauge. 18/11/97 A Handar encoder and CR500 datalogger were installed. Recording interval is 30 minutes. 31/12/00 Data audit carried out on lake level monitoring site 1015310 covering the period 980101 to 20001231. Data audit passed external audit carried out by Environmental Quality Systems.
For additional information, please see recording authority.

Environment Bay of Plenty 473
Environment Bay of Plenty Hydrological Level Summary
Date Compiled October 2006 Site Number 1015310 Compiled by Craig Putt Lake Rerewhakaaitu Station Homestead Arm Metric Map Reference V16: 145 165 Catchment Area (km2) 54 Period of Summary 1984 to 2005 Statistical Summary
Level (mm Moturiki Datum) Minimum Level 433782 Maximum Level 435780 Mean Annual Minimum Level 434838 Mean Annual Maximum Level 435508 Mean Level 435114 Mean Summer Level 435082 Median Level 435254 Mean Autumn Level 434863 Mean Winter Level 434973 Mean Spring Level 435182 Low Level Distribution Fit Utilised GEV Peak Level Distribution Fit Utilised GEV 7 day Low Level (Minimum) 433793 Peak Level (5 yr Return) 435662 7 Day Low Level (Mean Annual) 434713 Peak Level (10 yr Return) 435734 7 day Low Level (5 yr Return) 434362 Peak Level (20 yr Return) 435774 7 Day Low Level (10 yr Return) 434092 Peak Level (50 yr Return) 435802 Peak Level (100 yr Return) 435814
Annual Summaries Level (mm Moturiki Datum) Level (mm Moturiki Datum) Year Minimum Mean Maximum
Year Minimum Mean Maximum 1980 1993 1981 1994 433792 434179 434468 1982 1995 433782 434371 435047 1983 1996 434850 435227 435700 1984 1997 435227 435508 435761 1985 1998 434990 435404 435780 1986 1999 435217 435407 435621 1987 2000 435079 435366 435631 1988 2001 435193 435403 435620 1989 2002 435146 435367 435586 1990 2003 434714 434852 435185 1991 2004 434479 434939 435400 1992 2005 434946 435321 435700
Level Distribution Level (mm Moturiki Datum)
Percentiles 0 1 2 3 4 5 6 7 8 9 0 435780 435735 435716 435696 435684 435671 435660 435631 435615 435606 10 435597 435590 435580 435572 435561 435551 435540 435528 435519 435510 20 435501 435493 435485 435477 435469 435462 435456 435450 435445 435438 30 435432 435426 435420 435414 435406 435398 435388 435377 435367 435359 40 435350 435340 435330 435320 435311 435301 435288 435276 435268 435261 50 435254 435248 435242 435235 435226 435219 435212 435196 435175 435165 60 435151 435136 435123 435105 435084 435062 435040 435027 434993 434959 70 434933 434900 434878 434865 434852 434838 434825 434813 434802 434791 80 434777 434757 434740 434716 434694 434651 434591 434526 434435 434389 90 434347 434317 434238 434179 434079 434012 433953 433927 433904 433850 100 433782

474 Environmental Publication 2007/06
433600
433800
434000
434200
434400
434600
434800
435000
435200
435400
1990 1992 1994 1996 1998 2000 2002 2004
Year
Leve
l (m
m)
Minimum Level 5 per. Mov. Avg. (Minimum Level)
434400
434600
434800
435000
435200
435400
435600
435800
436000
1990 1992 1994 1996 1998 2000 2002 2004
Year
Leve
l (m
m)
Maximum Level 5 per. Mov. Avg. (Maximum Level)
434000
434200
434400
434600
434800
435000
435200
435400
435600
1990 1992 1994 1996 1998 2000 2002 2004
Year
Leve
l (m
m)
Mean Level 5 per. Mov. Avg. (Mean Level)
433800
434000
434200
434400
434600
434800
435000
435200
435400
1980 1985 1990 1995 2000 2005
Year
Leve
l (m
m)
Mean Autumn Level 5 per. Mov. Avg. (Mean Autumn Level)
433800434000434200434400434600434800435000435200435400435600
1980 1985 1990 1995 2000 2005
Year
Leve
l (m
m)
Mean Winter Level 5 per. Mov. Avg. (Mean Winter Level)
434200
434400
434600
434800
435000
435200
435400
435600
435800
1980 1985 1990 1995 2000 2005
Year
Leve
l (m
m)
Mean Spring Level 5 per. Mov. Avg. (Mean Spring Level)
434000434200434400434600434800435000435200435400435600435800
1980 1985 1990 1995 2000 2005
Year
Leve
l (m
m)
Mean Summer Level 5 per. Mov. Avg. (Mean Summer Level)
Rerewhakaaitu at Homestead Arm

Environment Bay of Plenty 475
3.8 Groundwater Level Data Summaries
The groundwater level data summaries in this chapter are provided in the following sequences of 4 pages per station:
Page 1 Provides general information regarding the station, such as its location, instrument types, start of record, etc.
Page 2 Lists station comments that should be read in conjunction with the results of the data summary. Note that these comments are an edited selection of the full set of comments. Contact the recording authority for a full set of comments if required.
Page 3 Displays the Summary information
Page 4 Graphical presentation of a selection of parameters provided in Page 3.
The ID No. in Table 3.8 indicates the order in which individual station data summaries are provided in this report.
Table 3.8 Groundwater Level Monitoring Stations
ID Number Page No.
Bore Site Period of Audit
Data Capture Rate (%)
1 463 Duncan Lunds Rd. 1988-2005 93 2 467 Stannett Matahiwi 1991-2005 99 3 471 Otumoetai Beach Rd. Reserve 1984-2005 88 4 475 Stewart Maketu 1991-2005 99 5 479 Zink Otakiri Rd. 1987-2005 89 6 483 Brady Grieg Rd. 1989-2005 98 7 487 Signal McDonalds Rd. 1989-2005 98


Environment Bay of Plenty 477


Environment Bay of Plenty 479
Environment Bay of Plenty Groundwater Level Recording Station
Bore Duncan Site Lund Road Site Number 2328 Grid Reference T14:664 966 Start of Record June 1987 Data Capture Rate 93% Data Summary From January 1988 To December 2005 Data Audited From June 1987 To December 2005 Equipment History 01/06/87: Manual pressure gauge readings. 08/12/88: 20 metre P.T. with A-D converter and Aquitel. 01/06/95: 20 metre range P.T. with WRIC datalogger. 17/02/00: 20 metre range P.T. with Campbell CR500. Comments on Stage/Discharge Ratings Ratings are available to convert Stage (mm) to Reduced Level (mm) in Moturiki Datum. General Comments Site is operated by Environment Bay of Plenty as part of its Natural Environment Regional Monitoring Network. The bore is 454 metres deep.
SITE LOCATION Duncan at Lund Road

480 Environmental Publication 2007/06
Station Comments Groundwater monitoring site Duncan at Lund Road. Site Number 2328. The local recording authority is Environment Bay of Plenty Log no: 2328 Finder no: K 41 Drilled: August 84 By: Ewen Cameron Reduced level: 21.449 metre (890209 on “T” by gauge) 21.450 metre (890314 on “T” by gauge) 21.911 metre (890314 on undersideof recorder house) Groundwater levels are affected by localised pumping. 01/06/87 - Manual readings available - read with a pressure gauge. Greenhouse park reads pressure gauge at 0800 daily and sends in returns. Data is stored in a Tideda file 2328.man and covers the period 870601 120000 to 891130 080000. 08/12/88 - Aquitel Remote unit installed with a time resolution of 15 minutes coupled to a 20 metre range pressure transducer. Use Reduced Level of pressure transducer 21.936 metres, pressure gauge 21.450 metres. 31/12/89 - Due to computer malfunction, data for the period 881208 000015 to 891231 115959, has been erased. Data for this period has been reconstructed by re-entering mean daily levels from previous "PDAY" output. Manual readings from 870602 80000 to 881212 080000 have also been entered. Mean daily levels have been entered as a single instantaneous level at 1200 each day, from 881213 120000 to 891231 120000. Hardcopy plots of original data confirm that the above method gives an accurate representation of levels over the period. 31/12/89 - Missing record due to computer malfunction, data for the period 891231 120000 to 900327 130000 has been erased. 04/03/92 - Missing record from 920304 150000 to 920724 110000 due to incorrect range pressure transducer being installed. 18/12/94 - Missing record from 941218 080000 to 950202 110000 due to water level going below pressure transducer height. The landowner installed a submersible pump on or about this time. 24/11/95 - Data for the period 951124 123000 to 951204 210000 looks unusual. Treat data with caution. 19/12/95 - Missing record from 951219 at 110000 to 960214 at 131500 due to several data logger and pressure transducer problems. 14/02/96 - 20m range pressure transducer installed on 960214 at 131500. 26/02/96 - Missing record from 960226 at 010000 to 960308 at 113000 due to battery voltage problem. 14/03/96 - Missing record from 960314 at 141500 to 960321 at 221500 due to unknown fault with transducer or logger. 27/09/99 - Missing record from 990826 at 110000 to 990927 at 111500 due to Datapak corruption. 17/02/00 - Missing record from 1000217 at 121500 to 1000224 at 123000. Removed WRIC and installed CR500. 9/03/00 - Missing record from 1000309 at 220000 to 1000410 at 133000 due to loss of power in data logger. 5/07/02 - Missing data from 1020705 91500 to 1020805 113000 due to a split in the supply tube to the pressure transducer. 4/10/03 - Missing data from 20031004 154500 to 20031023 103000 due to power supply failure. 15/07/05 - Missing data from 20050715 110000 to 20050727 094500 due to a faulty data logger.
For additional information, please see recording authority.

Environment Bay of Plenty 481

482 Environmental Publication 2007/06
Environment Bay of Plenty Hydrological Groundwater Level Summary
Date Complied G R Ellery Site Number 2328 Compiled by January 2007 Bore Duncan Station Lund Road Metric Map Reference T14: 664 966 Period of Summary 1988 to 2005 Statistical Summary
Level (mm) Minimum Level 11847 Maximum Level 42842 Mean Annual Minimum Level 21218 Mean Annual Maximum Level 39468 Mean Level 32590 Mean Summer Level 32538 Median Level 33163 Mean Autumn Level 34739 Mean Winter Level 31589 Mean Spring Level 31166 Low Level Distribution Fit Utilised GEV Peak Level Distribution Fit Utilised GEV 7 day Low Level (Minimum) 21960 Peak Level (5 yr Return) 42098 7 Day Low Level (Mean Annual) 25702 Peak Level (10 yr Return) 42594 7 day Low Level (5 yr Return) 23726 Peak Level (20 yr Return) 42844 7 Day Low Level (10 yr Return) 22414
Annual Summaries Level (mm) Level (mm) Year Minimum Mean Maximum
Year Minimum Mean Maximum 1980 1993 21940 28034 34732 1981 1994 21939 25958 34079 1982 1995 19870 28778 41936 1983 1996 21938 26585 33181 1984 1997 21827 30604 36840 1985 1998 21962 31833 39126 1986 1999 21963 33047 40905 1987 2000 21964 33762 41780 1988 27340 34112 39440 2001 18325 35720 42842 1989 28020 34442 39450 2002 19049 35415 42173 1990 21992 33162 39878 2003 19029 35489 41793 1991 21942 31947 42184 2004 19029 36692 40097 1992 21953 29012 37974 2005 11847 38231 42017
Level Distribution
Level (mm) Percentiles 0 1 2 3 4 5 6 7 8 9
0 42842 40536 40002 39729 39555 39379 39192 39032 38841 38700 10 38556 38443 38355 38279 38180 38076 37973 37856 37732 37605 20 37481 37324 37166 36976 36851 36692 36565 36451 36328 36217 30 36088 35972 35835 35681 35524 35357 35200 35020 34847 34685 40 34524 34382 34275 34148 34016 33905 33753 33591 33420 33300 50 33163 33059 32980 32903 32797 32669 32551 32438 32321 32212 60 32105 31987 31886 31732 31594 31448 31332 31183 30998 30841 70 30619 30383 30192 30025 29796 29422 29160 28828 28510 28188 80 27868 27375 27014 26669 26419 26270 25956 25634 25418 25164 90 24834 24567 24089 23459 23146 22690 22456 22004 21965 21039 100 11847

Environment Bay of Plenty 483
30000
32000
34000
36000
38000
40000
42000
44000
1987 1989 1991 1993 1995 1997 1999 2001 2003 2005
Year
Leve
l (m
m)
Maximum Level 5 per. Mov. Avg. (Maximum Level)
10000
12000
14000
16000
18000
20000
22000
24000
26000
28000
30000
1987 1989 1991 1993 1995 1997 1999 2001 2003 2005
Year
Leve
l (m
m)
Minimum Level 5 per. Mov. Avg. (Minimum Level)
24000
26000
28000
30000
32000
34000
36000
38000
40000
1987 1989 1991 1993 1995 1997 1999 2001 2003 2005
Year
Leve
l (m
m)
Mean Level 5 per. Mov. Avg. (Mean Level)
20000
25000
30000
35000
40000
45000
1987 1989 1991 1993 1995 1997 1999 2001 2003 2005
Year
Leve
l (m
m)
Mean Autumn Level 5 per. Mov. Avg. (Mean Autumn Level)
20000
25000
30000
35000
40000
45000
1987 1989 1991 1993 1995 1997 1999 2001 2003 2005
Year
Leve
l (m
m)
Mean Winter Level 5 per. Mov. Avg. (Mean Winter Level)
20000
25000
30000
35000
40000
45000
1987 1989 1991 1993 1995 1997 1999 2001 2003 2005
Year
Leve
l (m
m)
Mean Spring Level 5 per. Mov. Avg. (Mean Spring Level)
20000
25000
30000
35000
40000
45000
1987 1989 1991 1993 1995 1997 1999 2001 2003 2005
Year
Leve
l (m
m)
Mean Summer Level 5 per. Mov. Avg. (Mean Summer Level)
Duncan at Lund Road


Environment Bay of Plenty 485
Environment Bay of Plenty Groundwater Level Recording Station
Bore Stannett Site Matahiwi Road Site Number 2533 Grid Reference U14:793 889 Start of Record July 1990 Data Capture Rate 99% Data Summary From January 1991 To December 2005 Data Audited From July 1990 To December 2005 Equipment History 12/07/90: 5 metre range P.T. with A-D converter and Aquitel Remote. 27/06/94: 5 metre range P.T. with WRIC datalogger. 24/02/00: 5 metre range P.T. with Campbell CR500 datalogger. Comments on Stage/Discharge Ratings Ratings are available to convert Stage (mm) to Reduced Level (mm) in Moturiki Datum.
General Comments Site is operated by Environment Bay of Plenty. as part of its Natural Environment Regional Monitoring Network. The bore is 247 metres deep, with static water at approximately ground level.
SITE LOCATION Stannett at Matahiwi Road

486 Environmental Publication 2007/06
Station Comments Groundwater level monitoring site Stannett at Matahiwi Road. Site Number 2533. The local recording authority is Environment Bay of Plenty. Log No: Finder: Drilled: October 1975. deepened 12/01/77 By: Ewan Cameron Reduced Level: 3.440 metre (Top of PVC) Method: Second order 26/06/90 - Construction of this site was on 900626. 31/12/95 - Numerous amounts of missing record occur for this site over the entire data set due to instrumentation problems. While every care has been taken when processing this data, the data should be used with caution.
For additional information, please see recording authority.

Environment Bay of Plenty 487
Environment Bay of Plenty Hydrological Groundwater Level Summary
Date Complied January 2007 Site Number 2533 Compiled by G R Ellery Bore Stannet Station Matahiwi Metric Map Reference U14: 793 889 Period of Summary 1991 to 2005 Statistical Summary
Level (mm) Minimum Level 1218 Maximum Level 3548 Mean Annual Minimum Level 1853 Mean Annual Maximum Level 3046 Mean Level 2411 Mean Summer Level 2341 Median Level 2403 Mean Autumn Level 2303 Mean Winter Level 2494 Mean Spring Level 2515 Low Level Distribution Fit Utilised GEV Peak Level Distribution Fit Utilised GEV 7 day Low Level (Minimum) 1602 Peak Level (5 yr Return) 3154 7 Day Low Level (Mean Annual) 2035 Peak Level (10 yr Return) 3267 7 day Low Level (5 yr Return) 1884 Peak Level (20 yr Return) 3387 7 Day Low Level (10 yr Return) 1774
Annual Summaries Level (mm) Level (mm) Year Minimum Mean Maximum
Year Minimum Mean Maximum 1980 1993 2090 2454 2895 1981 1994 1960 2397 2936 1982 1995 1805 2386 3005 1983 1996 2127 2484 3136 1984 1997 2068 2470 2974 1985 1998 1743 2388 3073 1986 1999 2039 2410 2966 1987 2000 1852 2324 3006 1988 2001 1736 2251 2838 1989 2002 1855 2299 2854 1990 2003 1417 2157 3062 1991 1799 2426 3033 2004 1218 2644 3548 1992 2046 2578 3178 2005 2037 2515 3192
Level Distribution
Level (mm) Percentiles 0 1 2 3 4 5 6 7 8 9
0 3548 3090 2988 2920 2871 2832 2802 2777 2756 2738 10 2722 2707 2694 2682 2671 2661 2651 2641 2632 2623 20 2614 2605 2597 2589 2581 2573 2565 2557 2549 2541 30 2534 2527 2519 2512 2505 2498 2491 2484 2477 2470 40 2463 2457 2450 2444 2438 2432 2426 2420 2415 2409 50 2403 2397 2392 2386 2381 2376 2371 2365 2360 2355 60 2349 2344 2339 2333 2328 2322 2316 2310 2304 2298 70 2291 2285 2278 2271 2264 2256 2249 2241 2233 2225 80 2216 2207 2197 2187 2176 2165 2153 2139 2125 2110 90 2095 2077 2056 2035 2010 1982 1950 1910 1858 1773 100 1218

488 Environmental Publication 2007/06
2500
2700
2900
3100
3300
3500
3700
1991 1993 1995 1997 1999 2001 2003 2005
Year
Leve
l (m
m)
Maximum Level 5 per. Mov. Avg. (Maximum Level)
1000
1200
1400
1600
1800
2000
2200
1991 1993 1995 1997 1999 2001 2003 2005
Year
Leve
l (m
m)
Minimum Level 5 per. Mov. Avg. (Minimum Level)
2000
2100
2200
2300
2400
2500
2600
2700
2800
1991 1993 1995 1997 1999 2001 2003 2005
Year
Leve
l (m
m)
Mean Level 5 per. Mov. Avg. (Mean Level)
1800
2000
2200
2400
2600
2800
3000
3200
1991 1993 1995 1997 1999 2001 2003 2005
Year
Leve
l (m
m)
Mean Autumn Level 5 per. Mov. Avg. (Mean Autumn Level)
1800
2000
2200
2400
2600
2800
3000
3200
1991 1993 1995 1997 1999 2001 2003 2005
Year
Leve
l (m
m)
Mean Winter Level 5 per. Mov. Avg. (Mean Winter Level)
1800
2000
2200
2400
2600
2800
3000
3200
1991 1993 1995 1997 1999 2001 2003 2005
Year
Leve
l (m
m)
Mean Spring Level 5 per. Mov. Avg. (Mean Spring Level)
1800
2000
2200
2400
2600
2800
3000
3200
1991 1993 1995 1997 1999 2001 2003 2005
Year
Leve
l (m
m)
Mean Summer Level 5 per. Mov. Avg. (Mean Summer Level)
Stannett at Matahiwi Road
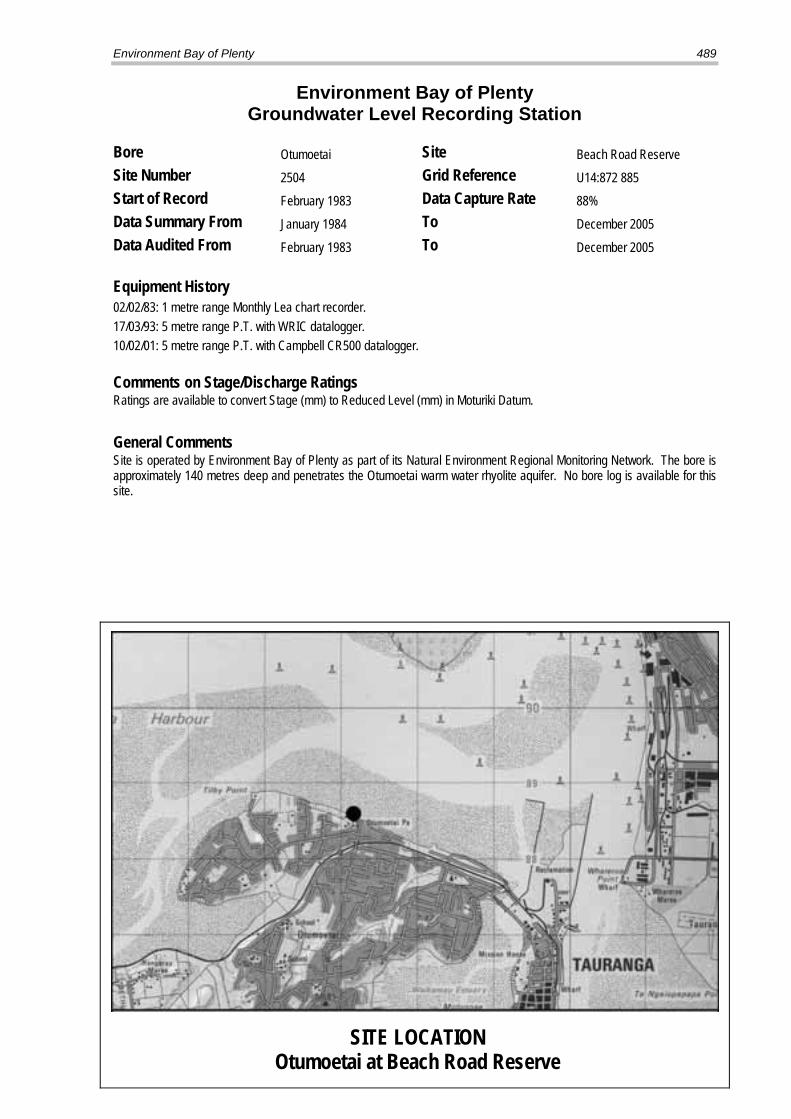
Environment Bay of Plenty 489
Environment Bay of Plenty Groundwater Level Recording Station
Bore Otumoetai Site Beach Road Reserve Site Number 2504 Grid Reference U14:872 885 Start of Record February 1983 Data Capture Rate 88% Data Summary From January 1984 To December 2005 Data Audited From February 1983 To December 2005 Equipment History 02/02/83: 1 metre range Monthly Lea chart recorder. 17/03/93: 5 metre range P.T. with WRIC datalogger. 10/02/01: 5 metre range P.T. with Campbell CR500 datalogger. Comments on Stage/Discharge Ratings Ratings are available to convert Stage (mm) to Reduced Level (mm) in Moturiki Datum.
General Comments Site is operated by Environment Bay of Plenty as part of its Natural Environment Regional Monitoring Network. The bore is approximately 140 metres deep and penetrates the Otumoetai warm water rhyolite aquifer. No bore log is available for this site.
SITE LOCATION Otumoetai at Beach Road Reserve

490 Environmental Publication 2007/06
Station Comments Groundwater monitoring site Otumoetai at Beach Road Reserve. Site Number 2504. The local recording authority is Environment Bay of Plenty Log no: 2504 Finder: Not available Drilled: Not available By: MWD Reduced level: 3.719 metres Method: Second order 31/12/95 Missing record occurs in this data set due to instrumentation problems. While every care has been taken when processing this data, the data should be used with caution as there were problems associated with interpretation of charts. All charts display a tidal cycle.
For additional information, please see recording authority.

Environment Bay of Plenty 491
Environment Bay of Plenty Hydrological Groundwater Level Summary
Date Complied January 2007 Site Number 2504 Compiled by G R Ellery Bore Otumoetai Station Beach Road Reserve Metric Map Reference U14:872 885 Period of Summary 1984 to 2005 Statistical Summary
Level (mm) Minimum Level -174 Maximum Level 1904 Mean Annual Minimum Level 240 Mean Annual Maximum Level 1584 Mean Level 860 Mean Summer Level 1096 Median Level 843 Mean Autumn Level 917 Mean Winter Level 676 Mean Spring Level 726 Low Level Distribution Fit Utilised GEV Peak Level Distribution Fit Utilised Gumbel 7 day Low Level (Minimum) 52 Peak Level (5 yr Return) 1695 7 Day Low Level (Mean Annual) 406 Peak Level (10 yr Return) 1778 7 day Low Level (5 yr Return) 284 Peak Level (20 yr Return) 1856 7 Day Low Level (10 yr Return) 201
Annual Summaries Level (mm) Level (mm) Year Minimum Mean Maximum
Year Minimum Mean Maximum 1980 1993 7 673 1545 1981 1994 -174 647 1514 1982 1995 135 794 1417 1983 1996 85 687 1648 1984 576 1120 1876 1997 121 769 1665 1985 512 1032 1687 1998 155 811 1575 1986 373 1041 1904 1999 245 990 1782 1987 323 971 1564 2000 263 831 1534 1988 266 800 1609 2001 -128 678 1389 1989 539 976 1468 2002 229 833 1608 1990 376 863 1351 2003 198 828 1468 1991 168 665 1486 2004 449 1157 1675 1992 290 964 1559 2005 264 862 1513
Level Distribution
Level (mm) Percentiles 0 1 2 3 4 5 6 7 8 9
0 1904 1581 1493 1446 1412 1386 1363 1343 1324 1306 10 1290 1274 1259 1245 1231 1217 1203 1190 1177 1165 20 1152 1140 1128 1116 1104 1092 1081 1069 1058 1046 30 1035 1024 1013 1002 992 981 971 961 951 941 40 932 922 913 904 895 886 877 869 860 852 50 843 834 826 817 809 800 792 783 774 766 60 758 749 740 732 723 714 705 697 688 679 70 670 661 652 643 634 624 615 605 596 586 80 576 566 555 545 534 523 512 500 487 474 90 460 445 429 412 392 370 344 311 265 195 100 -174

492 Environmental Publication 2007/06
10001100120013001400150016001700180019002000
1980 1985 1990 1995 2000 2005
Year
Leve
l (m
m)
Maximum Level 5 per. Mov. Avg. (Maximum Level)
-300
-200
-100
0
100
200
300
400
500
600
700
1980 1985 1990 1995 2000 2005
Year
Leve
l (m
m)
Minimum Level 5 per. Mov. Avg. (Minimum Level)
500600700800900
100011001200130014001500
1980 1985 1990 1995 2000 2005
Year
Leve
l (m
m)
Mean Level 5 per. Mov. Avg. (Mean Level)
0
200
400
600
800
1000
1200
1400
1980 1985 1990 1995 2000 2005
Year
Leve
l (m
m)
Mean Autumn Level 5 per. Mov. Avg. (Mean Autumn Level)
0
200
400
600
800
1000
1200
1400
1980 1985 1990 1995 2000 2005
Year
Leve
l (m
m)
Mean Winter Level 5 per. Mov. Avg. (Mean Winter Level)
0
200
400
600
800
1000
1200
1400
1980 1985 1990 1995 2000 2005
Year
Leve
l (m
m)
Mean Spring Level 5 per. Mov. Avg. (Mean Spring Level)
0
200
400
600
800
1000
1200
1400
1600
1980 1985 1990 1995 2000 2005
Year
Leve
l (m
m)
Mean Summer Level 5 per. Mov. Avg. (Mean Summer Level)
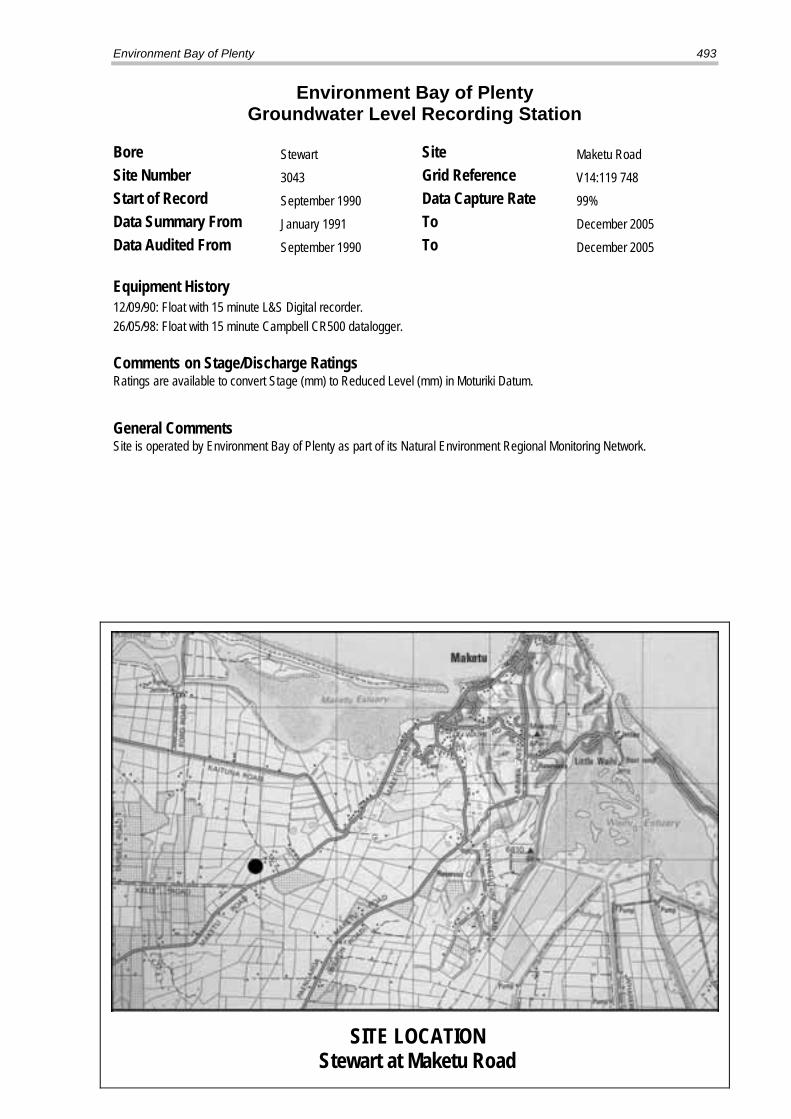
Environment Bay of Plenty 493
Environment Bay of Plenty Groundwater Level Recording Station
Bore Stewart Site Maketu Road Site Number 3043 Grid Reference V14:119 748 Start of Record September 1990 Data Capture Rate 99% Data Summary From January 1991 To December 2005 Data Audited From September 1990 To December 2005 Equipment History 12/09/90: Float with 15 minute L&S Digital recorder. 26/05/98: Float with 15 minute Campbell CR500 datalogger. Comments on Stage/Discharge Ratings Ratings are available to convert Stage (mm) to Reduced Level (mm) in Moturiki Datum.
General Comments Site is operated by Environment Bay of Plenty as part of its Natural Environment Regional Monitoring Network.
SITE LOCATION Stewart at Maketu Road

494 Environmental Publication 2007/06
Station Comments Groundwater monitoring site. Stewart at Maketu Road. Site Number 3043. The local recording authority is Environment Bay of Plenty. Log no: 3043 Finder no: Drilled: By: Reduced level: 3.990 metres Moturiki Datum Method: Second order Well is backed by barbary hedge in field off Maketu Road. 28/09/91 Water level in well affected by surface runoff. Between 910928 063000 and 910928 223000 the water level rose 180mm with 55mm rain having fallen on 910928.
For additional information, please see recording authority.

Environment Bay of Plenty 495
Environment Bay of Plenty Hydrological Groundwater Level Summary
Date Complied January 2007 Site Number 3043 Compiled by G R Ellery Bore Stewart Station Maketu Road Metric Map Reference V14:119 748 Period of Summary 1991 to 2005 Statistical Summary
Level (mm) Minimum Level 815 Maximum Level 2607 Mean Annual Minimum Level 982 Mean Annual Maximum Level 2143 Mean Level 1410 Mean Summer Level 1246 Median Level 1365 Mean Autumn Level 1187 Mean Winter Level 1641 Mean Spring Level 1582 Low Level Distribution Fit Utilised GEV Peak Level Distribution Fit Utilised GEV 7 day Low Level (Minimum) 821 Peak Level (5 yr Return) 2448 7 Day Low Level (Mean Annual) 961 Peak Level (10 yr Return) 2587 7 day Low Level (5 yr Return) 903 Peak Level (20 yr Return) 2689 7 Day Low Level (10 yr Return) 868
Annual Summaries Level (mm) Level (mm) Year Minimum Mean Maximum
Year Minimum Mean Maximum 1980 1993 893 1129 1422 1981 1994 815 1260 1867 1982 1995 949 1597 2511 1983 1996 1067 1525 2510 1984 1997 1158 1459 2195 1985 1998 912 1362 2607 1986 1999 970 1314 1823 1987 2000 1010 1405 1949 1988 2001 963 1562 2298 1989 2002 1071 1455 1987 1990 2003 951 1370 1931 1991 976 1370 2090 2004 1115 1525 2585 1992 1002 1383 2003 2005 873 1445 2374
Level Distribution
Level (mm) Percentiles 0 1 2 3 4 5 6 7 8 9
0 2607 2275 2174 2097 2041 1994 1953 1921 1882 1854 10 1833 1818 1804 1789 1775 1759 1745 1732 1718 1704 20 1689 1676 1665 1651 1637 1624 1612 1600 1589 1577 30 1567 1558 1550 1540 1532 1526 1518 1508 1497 1488 40 1477 1466 1456 1448 1439 1426 1414 1401 1390 1377 50 1365 1357 1348 1340 1333 1327 1319 1309 1302 1295 60 1289 1279 1269 1259 1250 1241 1233 1227 1220 1213 70 1206 1195 1184 1175 1165 1152 1140 1130 1122 1113 80 1103 1094 1085 1077 1068 1060 1054 1046 1038 1031 90 1020 1013 1003 989 980 969 951 922 901 883 100 815

496 Environmental Publication 2007/06
1000
1200
1400
1600
1800
2000
2200
2400
2600
2800
1991 1993 1995 1997 1999 2001 2003 2005
Year
Leve
l (m
m)
Maximum Level 5 per. Mov. Avg. (Maximum Level)
600
700
800
900
1000
1100
1200
1991 1993 1995 1997 1999 2001 2003 2005
Year
Leve
l (m
m)
Minimum Level 5 per. Mov. Avg. (Minimum Level)
1000
1100
1200
1300
1400
1500
1600
1700
1991 1993 1995 1997 1999 2001 2003 2005
Year
Leve
l (m
m)
Mean Level 5 per. Mov. Avg. (Mean Level)
800900
100011001200130014001500160017001800
1991 1993 1995 1997 1999 2001 2003 2005
Year
Leve
l (m
m)
Mean Autumn Level 5 per. Mov. Avg. (Mean Autumn Level)
1000
1200
1400
1600
1800
2000
2200
1991 1996 2001
Year
Leve
l (m
m)
Mean Winter Level 5 per. Mov. Avg. (Mean Winter Level)
1000
1200
1400
1600
1800
2000
2200
1991 1993 1995 1997 1999 2001 2003 2005
Year
Leve
l (m
m)
Mean Spring Level 5 per. Mov. Avg. (Mean Spring Level)
800900
100011001200130014001500160017001800
1991 1993 1995 1997 1999 2001 2003 2005
Year
Leve
l (m
m)
Mean Summer Level 5 per. Mov. Avg. (Mean Summer Level)
Stewart at Maketu Road

Environment Bay of Plenty 497
Environment Bay of Plenty Groundwater Level Recording Station
Bore Zink Site Otakiri Soldiers Road Site Number 2541 Grid Reference V15:391 510 Start of Record July 1986 Data Capture Rate 89% Data Summary From January 1987 To December 2005 Data Audited From July 1986 To December 2005 Equipment History 29/07/86: manual pressure gauge readings. 11/06/90: 20 metre range P.T. with L&S Digital recorder. 19/06/90: 20 metre range P.T. with Aquitel Remote. 11/07/91: 20 metre range P.T. with WRIC datalogger. 16/02/00: 20 metre range P.T. with Campbell CR500 datalogger. Comments on Stage/Discharge Ratings Ratings are available to convert Stage (mm) to Reduced Level (mm) in Moturiki Datum.
General Comments Site is operated by Environment Bay of Plenty as part of its Natural Environment Regional Monitoring Network. A pressure gauge is located at the bore for comparison with pressure transducer readings, but the data is not corrected to the gauge. The bore is 199 metres deep, and penetrates the Matahina Ignimbrite Aquifer. Pressures at the bore head are generally in the order of 15 to 20 metres of equivalent head.
SITE LOCATION Zink at Otakiri Soldiers Road

498 Environmental Publication 2007/06
Station Comments Groundwater monitoring site Zink at Otakiri Soldiers Road. Site Number 2541. The local recording authority is Environment Bay of Plenty Log no: 2541 Finder no: B 209 Drilled: 860217 By: Rob Garnham Reduced level: 8.168 metre (Prequake) 8.161 metre (on “T” by gauge) Method: second order Bore is situated approximately 50 metres from Zinks cowshed. Pressure gauge readings are available from 29/7/86. Extracted water is used for frost protection and milking shed requirements. Spikes both positive and negative are apparent in the dataset. The positive spikes are the result of a tap being opened to provide water for cowshed washing. The negative spikes are a result of the activation of the large volume pump being used for frost protection and irrigation. 02/03/87 - Major earthquake affected groundwater pressures 870302. 11/06/87 - L&S digital with pressure transducer and A-D converter installed 870611. Data is recorded and stored in terms of 0.5 * head (in mm). A straight line rating is available to multiply stored values by 2 to give head in mm. The measuring point is the pressure transducer, which is situated approx 1300mm above ground level. 14/11/89 - Raised pressure transducer due to high pressures. Pressure transducer raised by 594mm (594mm from floor to centre of incoming hose). 09/02/90 - Pressure gauge installed at site. 08/02/94 -Data for period 940208 230000 to 940306 000000 has been edited to remove erroneous spikes from data. Data to be treated with caution. 31/12/95 - Missing record occurs within this data set. While every care has been taken when processing the data, caution should be exercised when using the processed data.
For additional information, please see recording authority.

Environment Bay of Plenty 499
Environment Bay of Plenty Hydrological Groundwater Level Summary
Date Complied January 2007 Site Number 2541 Compiled by G R Ellery Bore Zink Station Otakiri Soldiers Road Metric Map Reference V15: 391 510 Period of Summary 1987 to 2005 Statistical Summary
Level (mm) Minimum Level 9018 Maximum Level 32669 Mean Annual Minimum Level 10998 Mean Annual Maximum Level 30208 Mean Level 26797 Mean Summer Level 26742 Median Level 26949 Mean Autumn Level 26588 Mean Winter Level 26736 Mean Spring Level 26912 Low Level Distribution Fit Utilised GEV Peak Level Distribution Fit Utilised GEV 7 day Low Level (Minimum) 20716 Peak Level (5 yr Return) 31448 7 Day Low Level (Mean Annual) 25818 Peak Level (10 yr Return) 31753 7 day Low Level (5 yr Return) 24769 Peak Level (20 yr Return) 31925 7 Day Low Level (10 yr Return) 23809
Annual Summaries Level (mm) Level (mm) Year Minimum Mean Maximum
Year Minimum Mean Maximum 1980 1993 9141 25791 28996 1981 1994 9018 25368 28681 1982 1995 10031 25786 29025 1983 1996 11311 27352 29869 1984 1997 9065 27064 31316 1985 1998 9053 26737 31318 1986 1999 9255 27591 30924 1987 23847 26597 30668 2000 9266 27833 31142 1988 23206 24965 26664 2001 9230 27815 31102 1989 9678 26545 28573 2002 9277 27549 30959 1990 9185 26972 32669 2003 9129 26785 31145 1991 10047 26657 28723 2004 9642 27132 30968 1992 10448 26160 30422 2005 9140 27550 30796
Level Distribution
Level (mm) Percentiles 0 1 2 3 4 5 6 7 8 9
0 32669 28997 28485 28354 28265 28218 28171 28133 28095 28060 10 28016 27976 27933 27904 27878 27850 27824 27800 27774 27746 20 27723 27702 27679 27654 27629 27606 27582 27557 27530 27496 30 27460 27425 27390 27363 27341 27320 27295 27270 27242 27207 40 27173 27146 27122 27096 27070 27044 27021 27001 26982 26966 50 26949 26931 26912 26893 26870 26846 26827 26807 26787 26761 60 26737 26709 26686 26664 26637 26605 26580 26557 26534 26511 70 26481 26441 26383 26293 26180 26087 26009 25946 25913 25882 80 25849 25808 25768 25728 25683 25642 25574 25493 25395 25346 90 25305 25261 25212 25156 25064 24968 24889 24804 24699 24395 100 9018

500 Environmental Publication 2007/06
26000
27000
28000
29000
30000
31000
32000
33000
34000
1987 1989 1991 1993 1995 1997 1999 2001 2003 2005
Year
Leve
l (m
m)
Maximum Level 5 per. Mov. Avg. (Maximum Level)
5000
7000
9000
11000
13000
15000
17000
19000
21000
23000
25000
1987 1989 1991 1993 1995 1997 1999 2001 2003 2005
Year
Leve
l (m
m)
Minimum Level 5 per. Mov. Avg. (Minimum Level)
24500
25000
25500
26000
26500
27000
27500
28000
1987 1989 1991 1993 1995 1997 1999 2001 2003 2005
Year
Leve
l (m
m)
Mean Level 5 per. Mov. Avg. (Mean Level)
24500
25000
25500
26000
26500
27000
27500
28000
1987 1989 1991 1993 1995 1997 1999 2001 2003 2005
Year
Leve
l (m
m)
Mean Autumn Level 5 per. Mov. Avg. (Mean Autumn Level)
24500
25000
25500
26000
26500
27000
27500
28000
28500
1987 1989 1991 1993 1995 1997 1999 2001 2003 2005
Year
Leve
l (m
m)
Mean Winter Level 5 per. Mov. Avg. (Mean Winter Level)
24500
25000
25500
26000
26500
27000
27500
28000
28500
1987 1989 1991 1993 1995 1997 1999 2001 2003 2005
Year
Leve
l (m
m)
Mean Spring Level 5 per. Mov. Avg. (Mean Spring Level)
24500
25000
25500
26000
26500
27000
27500
28000
28500
1987 1989 1991 1993 1995 1997 1999 2001 2003 2005
Year
Leve
l (m
m)
Mean Summer Level 5 per. Mov. Avg. (Mean Summer Level)
Zink at Otakiri Soldiers Road

Environment Bay of Plenty 501
Environment Bay of Plenty Groundwater Level Recording Station
Bore Brady Site Greig Road Site Number 461 Grid Reference V15:475 567 Start of Record November 1988 Data Capture Rate 98% Data Summary From January 1989 To December 2005 Data Audited From November 1988 To December 2005 Equipment History 10/11/88: Float with L&S digital recorder. 25/02/98: Float with Handar encoder and Campbell CR500 datalogger. Comments on Stage/Discharge Ratings Ratings are available to convert Stage (mm) to Reduced Level (mm) in Moturiki Datum.
General Comments Site is operated by Environment Bay of Plenty as part of its Natural Environment Regional Monitoring Network.
SITE LOCATION Brady at Greig Road

502 Environmental Publication 2007/06
Station Comments Groundwater monitoring site Brady at Greig Road. Site Number 461. The local recording authority is Environment Bay of Plenty. The bore was previously known as Battenburg. Log no: 0461 Finder no: B 56 Drilled: 800110 By: Rob Garnham Reduced level: 0.714 metre (800609 preqauke) 0.177 metre (870618 on bore cap postquake) 0.129 metre (881109 on bore no cap) Method: Second order 17/07/95 - While carrying out a data audit on Brady’s bore for the period of data from 881110 091500 to 921231 240000, it was found that some of the reduced levels calculated and used in processing data were incorrect. The correct reduced levels were established and the corresponding periods of data were reprocessed to agree with the corrected reduced levels.
For additional information, please see recording authority.
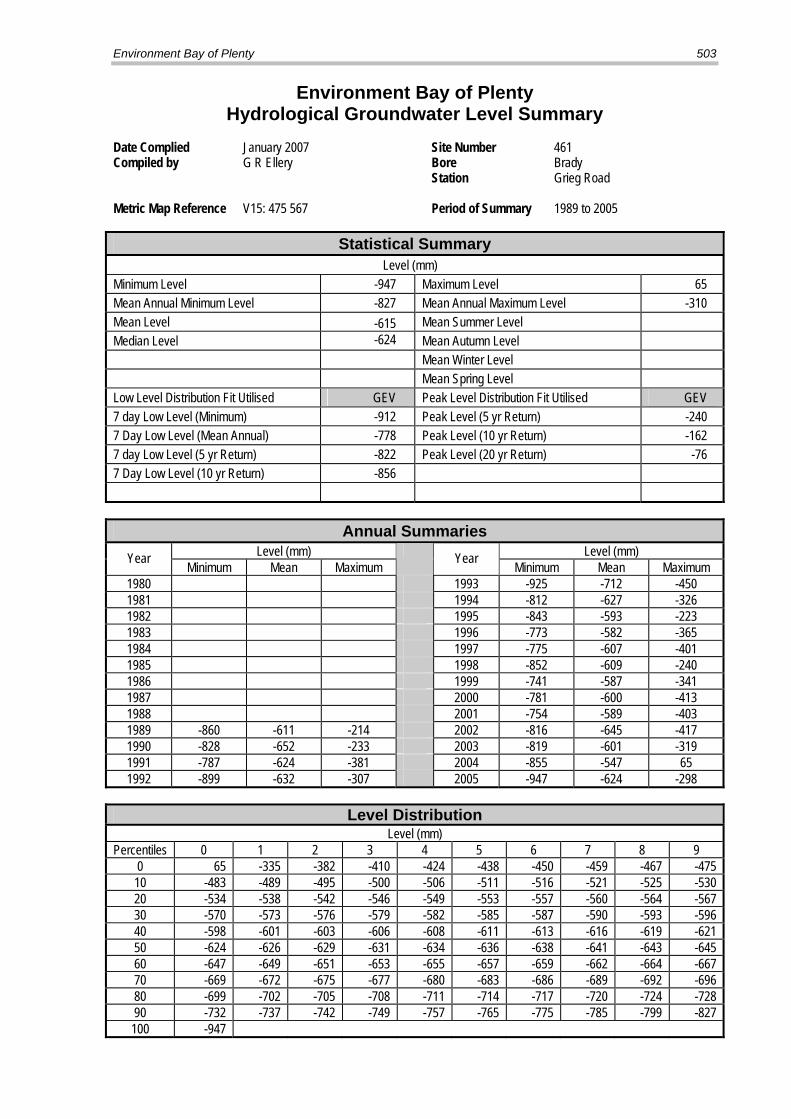
Environment Bay of Plenty 503
Environment Bay of Plenty Hydrological Groundwater Level Summary
Date Complied January 2007 Site Number 461 Compiled by G R Ellery Bore Brady Station Grieg Road Metric Map Reference V15: 475 567 Period of Summary 1989 to 2005 Statistical Summary
Level (mm) Minimum Level -947 Maximum Level 65 Mean Annual Minimum Level -827 Mean Annual Maximum Level -310 Mean Level -615 Mean Summer Level Median Level -624 Mean Autumn Level Mean Winter Level Mean Spring Level Low Level Distribution Fit Utilised GEV Peak Level Distribution Fit Utilised GEV 7 day Low Level (Minimum) -912 Peak Level (5 yr Return) -240 7 Day Low Level (Mean Annual) -778 Peak Level (10 yr Return) -162 7 day Low Level (5 yr Return) -822 Peak Level (20 yr Return) -76 7 Day Low Level (10 yr Return) -856
Annual Summaries Level (mm) Level (mm) Year Minimum Mean Maximum
Year Minimum Mean Maximum 1980 1993 -925 -712 -450 1981 1994 -812 -627 -326 1982 1995 -843 -593 -223 1983 1996 -773 -582 -365 1984 1997 -775 -607 -401 1985 1998 -852 -609 -240 1986 1999 -741 -587 -341 1987 2000 -781 -600 -413 1988 2001 -754 -589 -403 1989 -860 -611 -214 2002 -816 -645 -417 1990 -828 -652 -233 2003 -819 -601 -319 1991 -787 -624 -381 2004 -855 -547 65 1992 -899 -632 -307 2005 -947 -624 -298
Level Distribution
Level (mm) Percentiles 0 1 2 3 4 5 6 7 8 9
0 65 -335 -382 -410 -424 -438 -450 -459 -467 -475 10 -483 -489 -495 -500 -506 -511 -516 -521 -525 -530 20 -534 -538 -542 -546 -549 -553 -557 -560 -564 -567 30 -570 -573 -576 -579 -582 -585 -587 -590 -593 -596 40 -598 -601 -603 -606 -608 -611 -613 -616 -619 -621 50 -624 -626 -629 -631 -634 -636 -638 -641 -643 -645 60 -647 -649 -651 -653 -655 -657 -659 -662 -664 -667 70 -669 -672 -675 -677 -680 -683 -686 -689 -692 -696 80 -699 -702 -705 -708 -711 -714 -717 -720 -724 -728 90 -732 -737 -742 -749 -757 -765 -775 -785 -799 -827 100 -947

504 Environmental Publication 2007/06
-500
-400
-300
-200
-100
0
100
1989 1991 1993 1995 1997 1999 2001 2003 2005
Year
Leve
l (m
m)
Maximum Level 5 per. Mov. Avg. (Maximum Level)
-1000
-950
-900
-850
-800
-750
-700
1989 1991 1993 1995 1997 1999 2001 2003 2005
Year
Leve
l (m
m)
Minimum Level 5 per. Mov. Avg. (Minimum Level)
-750
-700
-650
-600
-550
-500
1989 1991 1993 1995 1997 1999 2001 2003 2005
Year
Leve
l (m
m)
Mean Level 5 per. Mov. Avg. (Mean Level)
-800
-750
-700
-650
-600
-550
-500
-450
-400
1989 1991 1993 1995 1997 1999 2001 2003 2005
Year
Leve
l (m
m)
Mean Autumn Level 5 per. Mov. Avg. (Mean Autumn Level)
-800
-750
-700
-650
-600
-550
-500
-450
-400
1989 1991 1993 1995 1997 1999 2001 2003 2005
Year
Leve
l (m
m)
Mean Winter Level 5 per. Mov. Avg. (Mean Winter Level)
-750
-700
-650
-600
-550
-500
-450
-400
1989 1991 1993 1995 1997 1999 2001 2003 2005
Year
Leve
l (m
m)
Mean Spring Level 5 per. Mov. Avg. (Mean Spring Level)
-800
-750
-700
-650
-600
-550
-500
-450
-400
1989 1991 1993 1995 1997 1999 2001 2003 2005
Year
Leve
l (m
m)
Mean Summer Level 5 per. Mov. Avg. (Mean Summer Level)

Environment Bay of Plenty 505
Environment Bay of Plenty Groundwater Level Recording Station
Bore Signal Site McDonald Road Site Number 2060 Grid Reference V15:453 442 Start of Record September 1988 Data Capture Rate 98% Data Summary From January 1989 To December 2005 Data Audited From September 1988 To December 2005 Equipment History
13/09/88: Float with L&S digital recorder. 21/01/98: Campbell CR500 with Handar shaft encoder. 28/01/01: Campbell CR500 with pressure transducer. Comments on Stage/Discharge Ratings Ratings are available to convert Stage (mm) to Reduced Level (mm) in Moturiki Datum.
General Comments Site is operated by Environment Bay of Plenty as part of its Natural Environment Regional Monitoring Network.
SITE LOCATION Signal at McDonald Road

506 Environmental Publication 2007/06
Station Comments Groundwater monitoring site Signal at McDonald Road. Site Number 2060. The local recording authority is Environment Bay of Plenty. Log no: 2060 Finder no: B103. Drilled: April 1988 By: Rob Garnham Reduced level: 14.010 Method: Second order Bore was drilled by B.O.P.C.B as an investigation bore. 05/01/95 -Data from 950105 to 950130 has flat periods due to unknown reasons. This data should be treated with caution. 31/12/95 - Data audit carried out for site 2060 Signals bore at McDonald Road. Data audit covers the period 880913 to 951231 240000 during which Environment Bay of Plenty was the recording authority. Groundwater level data was compared with groundwater level site 461 Brady at Greig Road situated at NZMS 260 Reference V15:475 567. While carrying out a data audit on Signal’s bore for the period 880913 to 951231, it was found that numerous periods of data had been processed incorrectly. These batches of data have been re-processed to the correct readings and copied onto the data archive.
For additional information, please see recording authority.

Environment Bay of Plenty 507
Environment Bay of Plenty Hydrological Groundwater Level Summary
Date Complied January 2007 Site Number 2060 Compiled by G R Ellery Bore Signal Station McDonald Road Metric Map Reference V15: 453 442 Period of Summary 1989 to 2005 Statistical Summary
Level (mm) Minimum Level 9730 Maximum Level 12464 Mean Annual Minimum Level 10585 Mean Annual Maximum Level 11937 Mean Level 11361 Mean Summer Level 11181 Median Level 11359 Mean Autumn Level 11134 Mean Winter Level 11503 Mean Spring Level 11616 Low Level Distribution Fit Utilised GEV Peak Level Distribution Fit Utilised GEV 7 day Low Level (Minimum) 10017 Peak Level (5 yr Return) 12162 7 Day Low Level (Mean Annual) 10647 Peak Level (10 yr Return) 12305 7 day Low Level (5 yr Return) 10404 Peak Level (20 yr Return) 12427 7 Day Low Level (10 yr Return) 10246
Annual Summaries Level (mm) Level (mm) Year Minimum Mean Maximum
Year Minimum Mean Maximum 1980 1993 10640 11083 11451 1981 1994 10475 11091 11790 1982 1995 10586 11551 12159 1983 1996 11403 11822 12220 1984 1997 10844 11452 11844 1985 1998 10399 11438 12316 1986 1999 11116 11522 11919 1987 2000 10720 11393 11727 1988 2001 10681 11484 12141 1989 10769 11408 11898 2002 10201 11344 12091 1990 10902 11443 11981 2003 9784 10915 11797 1991 10692 11332 11822 2004 10087 11409 12464 1992 10919 11265 11679 2005 9730 11164 11634
Level Distribution
Level (mm) Percentiles 0 1 2 3 4 5 6 7 8 9
0 12464 12236 12149 12098 12063 12021 11959 11923 11896 11870 10 11844 11821 11801 11784 11765 11745 11728 11713 11699 11685 20 11674 11665 11657 11649 11638 11626 11616 11607 11598 11589 30 11580 11570 11561 11553 11543 11535 11528 11521 11513 11504 40 11495 11486 11478 11468 11453 11435 11420 11406 11392 11375 50 11359 11348 11335 11324 11314 11305 11297 11289 11281 11272 60 11264 11255 11245 11235 11226 11216 11207 11195 11186 11173 70 11162 11145 11129 11117 11105 11094 11082 11073 11062 11051 80 11034 11014 10997 10985 10972 10960 10941 10921 10898 10871 90 10852 10835 10810 10784 10754 10721 10678 10617 10552 10420 100 9730

508 Environmental Publication 2007/06
11400
11600
11800
12000
12200
12400
12600
1989 1991 1993 1995 1997 1999 2001 2003 2005
Year
Leve
l (m
m)
Maximum Level 5 per. Mov. Avg. (Maximum Level)
9600
9800
10000
10200
10400
10600
10800
11000
11200
11400
11600
1989 1991 1993 1995 1997 1999 2001 2003 2005
Year
Leve
l (m
m)
Minimum Level 5 per. Mov. Avg. (Minimum Level)
108001090011000111001120011300114001150011600117001180011900
1989 1991 1993 1995 1997 1999 2001 2003 2005
Year
Leve
l (m
m)
Mean Level 5 per. Mov. Avg. (Mean Level)
10000
10500
11000
11500
12000
12500
13000
1989 1991 1993 1995 1997 1999 2001 2003 2005
Year
Leve
l (m
m)
Mean Autumn Level 5 per. Mov. Avg. (Mean Autumn Level)
10000
10500
11000
11500
12000
12500
13000
1989 1991 1993 1995 1997 1999 2001 2003 2005
Year
Leve
l (m
m)
Mean Winter Level 5 per. Mov. Avg. (Mean Winter Level)
10000
10500
11000
11500
12000
12500
13000
1989 1991 1993 1995 1997 1999 2001 2003 2005
Year
Leve
l (m
m)
Mean Spring Level 5 per. Mov. Avg. (Mean Spring Level)
1000010200104001060010800110001120011400116001180012000
1989 1991 1993 1995 1997 1999 2001 2003 2005
Year
Leve
l (m
m)
Mean Summer Level 5 per. Mov. Avg. (Mean Summer Level)
Signal at McDonald Road

Environment Bay of Plenty 509
3.9 Water Temperature Data Summaries
The water temperature data summaries in this chapter are provided in the following sequences of 3 pages per station:
Page 1 Provides general information regarding the station, such as its location, instrument types, start of record, etc.
Page 2 Displays the data summary information
Page 3 Graphical presentation of a selection of parameters provided in Page 2.
The ID No. in Table 3.9 indicates the order in which individual station data summaries are provided in this report.
Table 3.9 Water Temperature Monitoring Stations
ID Number
Page No.
Site Site Period of Audit
Data Capture Rate (%)
1 493 Tauranga Harbour Salisbury Avenue 1992-2005 85 2 497 Puarenga Path 1989-2000 80 3 501 Puarenga F.R.I 1992-1996 93


Environment Bay of Plenty 511


Environment Bay of Plenty 513
Environment Bay of Plenty Water Temperature Recording Station
Parameter Water Temperature Station Tauranga Harbour Site Number 514212 NZMS 260 Reference U14:909 908 Recorder Type CS107 probe Start of Record July 1991 Data Capture Rate 85% Data Summary From January 1992 To December 2005 Data Audited From July 1991 To December 2005 General Comments Site is operated by Environment Bay of Plenty as part of its Natural Environment Regional Monitoring Network. From July 1991 to December 1992 temperature is recorded by the Phillips Linear Silicon sensor to a Kainga datalogger. On 12 December 1992 a Kainga Sensor (-5 to 35°C range) was installed as a backup. On 3 June 1994 the Kainga logger was replaced with a Campbell datalogger (CR10) with a single Kainga probe connected. Probes were subsequently replaced by V Campbell CS107 probes. The temperature probe was initially mounted on a floating jetty and therefore remained at a constant depth below the water. This jetty was removed in September 2001 so that the sensor is now mounted in a static position on the harbour edge (i.e. it has a variable head of water above it dependent on tide level).
SITE LOCATION Water Temperature at Tauranga Harbour

514 Environmental Publication 2007/06
Environment Bay of Plenty Water Temperature Summary
Date Compiled March 2007 Site Number 514212 Compiled by G R Ellery Station Tauranga Harbour Equipment Type CS107 temperature probe NZMS 260 Reference U14:909 908 Period of Summary 1992 to 2005
Statistical Summary Mean Annual Water Temperature 16.8 °C Mean Summer Water Temperature 19.2 °C Median Water Temperature 16.5 °C Mean Autumn Water Temperature 18.5 °C Mean Winter Water Temperature 13.8 °C Mean Spring Water Temperature 15.2°C Minimum Water Temperature 10.0 °C Min. Water Temperature (Mean Annual) 11.3 °C Maximum Water Temperature 25.6 °C Max. Water Temperature (Mean Annual) 24.0 °C
Monthly Statistics (°C) Jan Feb Mar Apr May Jun Jul Aug Sep Oct Nov Dec Minimum 13.8 15.2 11.8 13.3 10.5 10.0 10.1 10.6 11.2 12.1 13.7 12.5 Median 19.5 20.7 20.0 18.4 16.7 14.3 13.5 13.5 14.4 15.2 16.2 17.9
Maximum 25.6 25.4 23.5 22.2 19.7 18.1 15.7 15.5 18.7 20.5 24.2 23.2 Mean 19.5 20.5 19.9 18.3 16.6 14.3 13.4 13.5 14.3 15.3 16.3 17.9
Annual Summary
Water Temperature (°C) Extreme Water Temperature (°C) Year Mean Minimum Date Maximum Date
1992 16.9 11.5 13/09/1992 22.6 20/02/1992 1993 15.7 10.8 10/07/1993 23.3 21/01/1993 1994 16.1 10.2 10/07/1994 23.5 26/02/1994 1995 16.7 10.6 24/07/1995 24.3 18/02/1995 1996 16.5 10.1 10/07/1996 24.3 4/02/1996 1997 17.0 10.0 26/06/1997 23.3 4/01/1997 1998 16.8 11.5 21/08/1998 24.2 21/11/1998 1999 17.5 11.9 29/07/1999 25.6 20/01/1999 2000 17.3 12.4 17/06/2000 23.5 22/01/2000 2001 17.4 11.7 21/07/2001 24.6 22/02/2001 2002 16.7 11.8 15/07/2002 24.1 31/01/2002

Environment Bay of Plenty 515
Annual Mean, Minimum and Maximum
8.0
10.0
12.0
14.0
16.0
18.0
20.0
22.0
24.0
26.0
1992 1994 1996 1998 2000 2002 2004
Year
Wat
er T
empe
ratu
re (o
C)
Mean
Minimum
Maximum
Seasonal Mean Water Temperature
12
1314
1516
17
1819
2021
22
1992 1994 1996 1998 2000 2002 2004
Year
Wat
er T
empe
ratu
re (o
C)
Autumn
Winter
Spring
Summer
Monthly Mean, Minimum and Maximum
810
1214
1618
2022
2426
Jan
Feb
Mar
April
May
June
July
Aug
Sept
Oct
Nov
Dec
Month
Tem
pera
ture
(oC
)
Mean
Minimum
Maximum


Environment Bay of Plenty 517
Environment Bay of Plenty Water Temperature Recording Station
Parameter Water Temperature Station Path Site Number 2039 NZMS 260 Reference U16:957 328 Recorder Type EDSC Temp. probe Start of Record April 1988 Data Capture Rate 80% Data Summary From April 1988 To December 2000 Data Audited From To General Comments Site is operated by Environment Bay of Plenty as part of its Natural Environment Regional Monitoring Network. The Roto-A-Tamaheke at Path water temperature recorder was installed by NIWA for the Rotorua Geothermal Monitoring Programme. On 2 November 1992 an EDSC temperature probe (0 - 100°C range) was installed and connected to a Kainga datalogger. Prior to this time several types of temperature recorders and loggers were run at the site (see local recording authority for details). The site was handed over to Environment B.O.P in July 1992. In July 1993 data collection and processing was contracted to NIWA, Rotorua.
SITE LOCATION Water Temperature at Path

518 Environmental Publication 2007/06
Environment Bay of Plenty Water Temperature Summary
Date Compiled March 2007 Site Number 2039 Compiled by G R Ellery Station Path Equipment Type EDSC Temp. probe NZMS 260 Reference U16:958 328 Period of Summary 1989 to 2000
Statistical Summary Mean Annual Water Temperature 60.5 °C Mean Summer Water Temperature 60.2 °C Median Water Temperature 61.1 °C Mean Autumn Water Temperature 60.5 °C Mean Winter Water Temperature 59.6 °C Mean Spring Water Temperature 60.4 °C Minimum Water Temperature 41.5 °C Min. Water Temperature (Mean Annual) 46.4 °C Maximum Water Temperature 74.6 °C Max. Water Temperature (Mean Annual) 68.6 °C
Monthly Statistics (°C) Jan Feb Mar Apr May Jun Jul Aug Sep Oct Nov Dec Minimum 41.5 50.1 48.1 44.9 43.2 44.0 43.0 45.5 46.9 46.1 48.2 44.1 Median 61.6 60.5 61.9 60.9 61.2 60.6 61.0 61.3 60.8 60.8 60.3 61.8 Maximum 69.6 71.8 72.6 72.3 74.6 74.4 71.2 70.8 68.7 71.2 71.9 70.7 Mean 61.3 61.1 61.1 60.0 60.4 60.0 60.1 60.2 60.4 60.4 60.3 60.6
Annual Summary Water Temperature (°C) Extreme Water Temperature (°C)
Year Mean Minimum Date Maximum Date 1989 61.0 41.5 3/01/1989 66.9 15/04/1989 1990 62.9 51.3 15/10/1990 69.9 26/12/1990 1991 61.3 44.9 21/04/1991 74.6 13/05/1991 1992 58.7 49.7 15/08/1992 65.2 19/10/1992 1993 60.9 47.3 16/05/1993 66.2 16/12/1993 1994 62.5 48.4 11/06/1994 71.9 27/11/1994 1995 62.7 46.8 29/05/1995 72.7 27/05/1995 1996 63.5 52.3 20/11/1996 72.6 13/03/1996 1997 54.3 44.0 2/06/1997 62.9 3/01/1997 1998 63.0 43.0 9/07/1998 70.8 6/08/1998 1999 59.8 43.2 1/05/1999 67.7 27/01/1999 2000 52.0 44.0 19/06/2000 62.1 1/01/2000
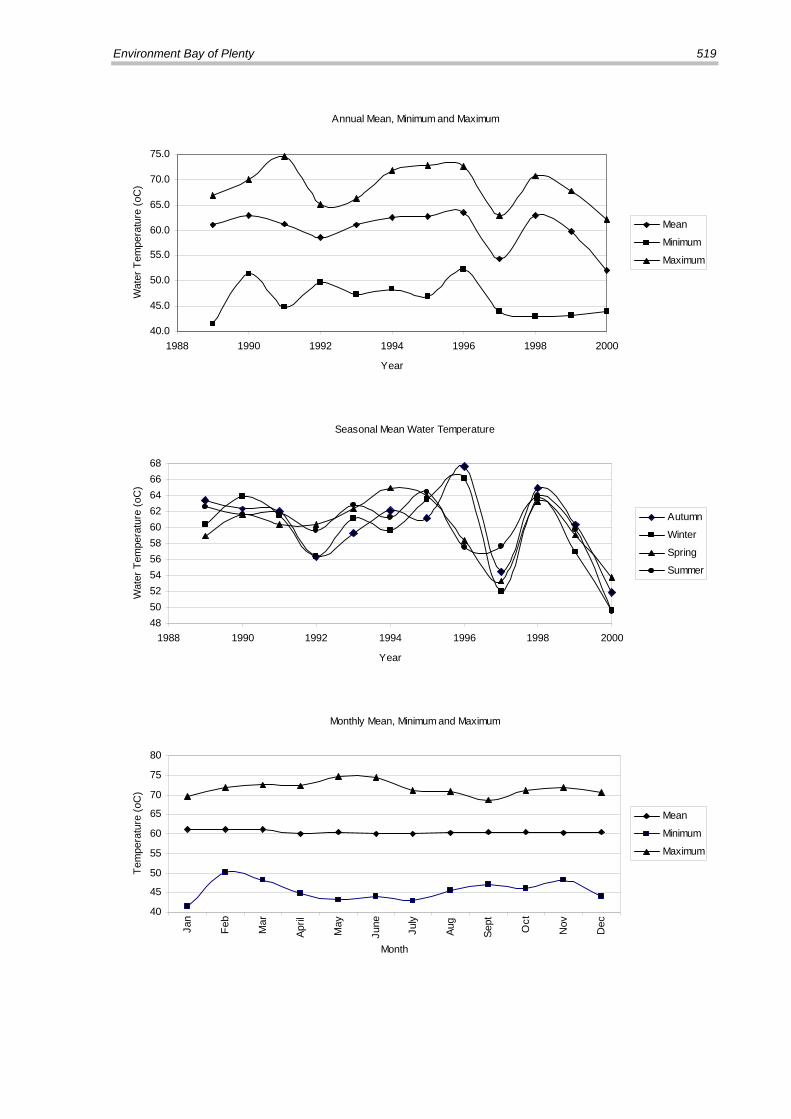
Environment Bay of Plenty 519
Annual Mean, Minimum and Maximum
40.0
45.0
50.0
55.0
60.0
65.0
70.0
75.0
1988 1990 1992 1994 1996 1998 2000
Year
Wat
er T
empe
ratu
re (o
C)
Mean
Minimum
Maximum
Seasonal Mean Water Temperature
4850525456586062646668
1988 1990 1992 1994 1996 1998 2000
Year
Wat
er T
empe
ratu
re (o
C)
Autumn
Winter
Spring
Summer
Monthly Mean, Minimum and Maximum
40
45
50
55
60
65
70
75
80
Jan
Feb
Mar
April
May
June
July
Aug
Sept
Oct
Nov
Dec
Month
Tem
pera
ture
(oC
)
Mean
Minimum
Maximum


Environment Bay of Plenty 521
Environment Bay of Plenty Water Temperature Recording Station
Parameter Water Temperature Station F.R.I. Site Number 2026 Grid Reference U16:962 333 Recorder Type EDSC Temp. probe Start of Record July 1991 Data Capture Rate 93% Data Summary From January 1992 To December 1996 Data Audited From To General Comments Site is operated by Environment Bay of Plenty as part of its Natural Environment Regional Monitoring Network. From July 1991 to July 1992 temperature is recorded by an unknown type of temperature probe connected to a L&S digital recorder. On 13 July 1992 a EDSC temperature probe was installed and connected to a Kainga datalogger. In July 1993 data collection and processing was contracted to NIWA, Rotorua.
SITE LOCATION Water Temperature at F.R.I

Environment Bay of Plenty Water Temperature Summary
Date Compiled September 2001 Site Number 2026 Compiled by GR Ellery Station F.R.I. Equipment Type EDSC temp. probe NZMS 260 Reference U16:962 333 Period of Summary 1992 to 1996
Statistical Summary Mean Annual Water Temperature 16.1 °C Mean Summer Water Temperature 18.9 °C Median Water Temperature 16.1 °C Mean Autumn Water Temperature 16.9 °C Mean Winter Water Temperature 13.2 °C Mean Spring Water Temperature 15.5 °C Minimum Water Temperature 9.5 °C Min. Water Temperature (Mean Annual) 10.1 °C Maximum Water Temperature 23.9 °C Max. Water Temperature (Mean Annual) 22.3 °C
Monthly Statistics (°C) Jan Feb Mar Apr May Jun Jul Aug Sep Oct Nov Dec Minimum 15.6 16.5 14.0 12.8 10.9 9.9 9.5 10.3 10.9 11.4 13.9 14.5 Median 19.5 19.8 18.3 17.0 15.3 13.5 12.8 13.1 14.2 15.9 17.0 18.6 Maximum 23.9 22.9 22.2 20.1 18.2 16.6 15.5 15.8 17.9 20.0 21.0 22.5 Mean 19.5 19.8 18.3 16.9 15.2 13.5 12.7 13.0 14.2 15.9 17.0 18.6
Annual Summary Water Temperature (°C) Extreme Water Temperature (°C)
Year Mean Minimum Date Maximum Date 1990 1991 1992 16.9 10.7 15/07/1992 23.9 11/01/1992 1993 16.0 9.5 3/07/1993 21.9 14/12/1993 1994 16.2 10.3 12/08/1994 22.2 9/01/1994 1995 16.3 10.0 3/07/1995 22.5 7/12/1995 1996 14.9 9.9 19/06/1996 21.1 11/01/1996 1997 1998 1999 2000

Environment Bay of Plenty 523
Annual Mean, Minimum and Maximum
8.0
10.0
12.0
14.0
16.0
18.0
20.0
22.0
24.0
1991 1992 1993 1994 1995 1996 1997
Year
Wat
er T
empe
ratu
re (o
C)
Mean
Minimum
Maximum
Seasonal Mean Water Temperature
12
14
16
18
20
1991 1992 1993 1994 1995 1996 1997
Year
Wat
er T
empe
ratu
re (o
C)
Autumn
Winter
Spring
Summer
Monthly Mean, Minimum and Maximum
8
10
12
14
16
18
20
22
24
Jan
Feb
Mar
April
May
June
July
Aug
Sept
Oct
Nov
Dec
Month
Tem
pera
ture
(oC
)
Mean
Minimum
Maximum