07661 - combined effect of co2, h2s and acetic acid on ... effect of co2, h2s and acetic acid on...
TRANSCRIPT

Combined Effect of CO2, H2S and Acetic Acid on Bottom of the Line Corrosion
Singer, M., Brown, B., Camacho, A., Nesic, S. Ohio University - Institute for Corrosion and Multiphase Technology
342 West State St., Athens, OHIO, 45701
ABSTRACT This research work presents a study of the combined influence of the partial pressure of H2S and the concentration of free acetic acid on the general and localized CO2 corrosion at the bottom of the line. Experiments were carried out during 21 days in three 4” internal diameter flow loops at 70ºC with 2 bars of CO2. The flow regime was stratified for all of the experiments. It was found that trace amounts of H2S (from 0.004 to 0.13 bars) greatly retards the CO2 corrosion with general corrosion rates usually 10 to 100 times lower than their pure CO2 equivalent. However, the most protective conditions were observed at the lowest partial pressure of H2S as the corrosion increased when more H2S was added. The presence of a mackinawite film on the coupon surface seems to be the origin of this protectiveness. When acetic acid was added to the system (the tests were performed with 1000 ppm of free acetic acid), the general corrosion was multiplied by 2 in CO2 environment and by 10 to 50 in H2S/CO2 mixtures. Once again the lowest corrosivity is found at the lowest partial pressure of H2S.
INTRODUCTION CO2 corrosion in the presence of acetic acid has been extensively studied in the literature by many different authors1-4. Corrosion mechanisms are now very well defined and are already incorporated in prediction models5,6. The influence of acetic acid on the FeCO3 film characteristics and formation may be one of the last areas where a widely accepted theory is not completed agreed upon7-10. In summary, the different chemical and electrochemical reactions involved in CO2 corrosion in presence of acetic acid are described below:
• Water dissociation −+ +⎯→← )()()(2 aqaql OHHOH
• Carbon dioxide dissolution )(2)(2 aqg COCO ↔
• Carbon dioxide hydration (slow step) )(32)(2)(2 aqlaq COHOHCO ⎯→←+
1
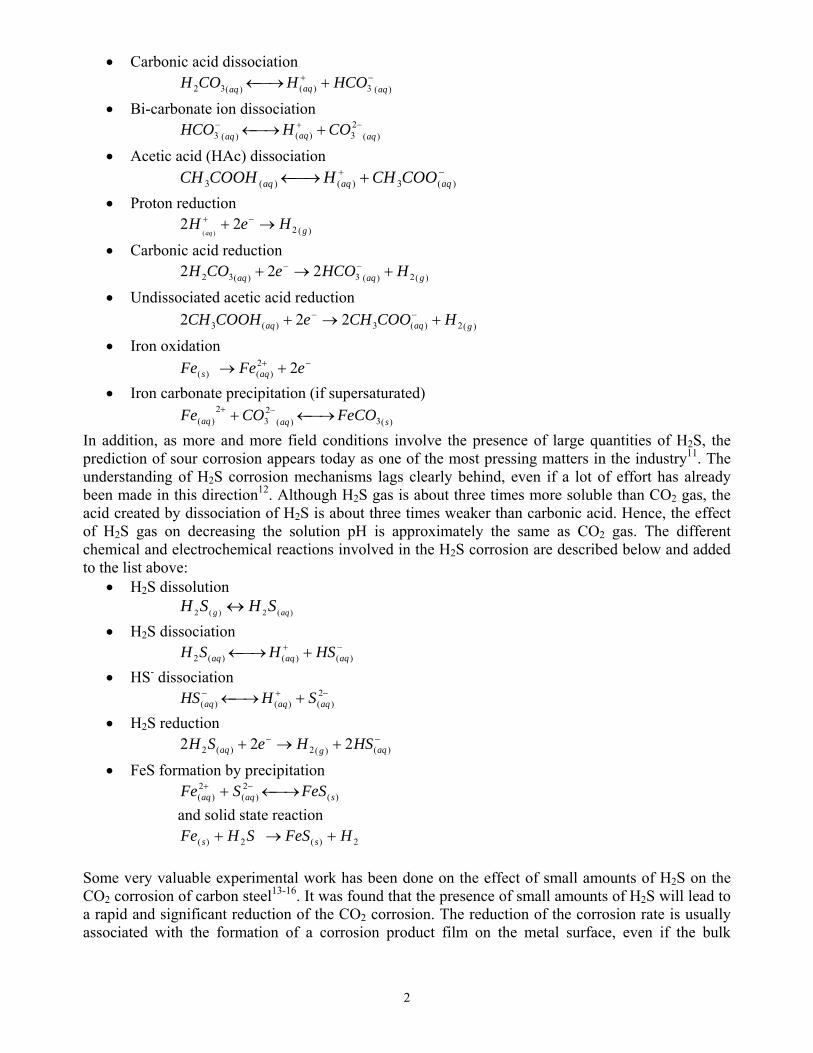
• Carbonic acid dissociation )(3)()(32 aqaqaq HCOHCOH −+ +⎯→←
• Bi-carbonate ion dissociation )(
23)()(3 aqaqaq COHHCO −+− +⎯→←
• Acetic acid (HAc) dissociation −+ +⎯→← )(3)()(3 aqaqaq COOCHHCOOHCH
• Proton reduction )(222
)( gHeHaq
→+ −+
• Carbonic acid reduction )(2)(3)(32 222 gaqaq HHCOeCOH +→+ −−
• Undissociated acetic acid reduction
)(2)(3)(3 222 gaqaq HCOOCHeCOOHCH +→+ −−
• Iron oxidation −+ +→ eFeFe aqs 22
)()( • Iron carbonate precipitation (if supersaturated)
)(3)(23
2)( saqaq FeCOCOFe ⎯→←+ −+
In addition, as more and more field conditions involve the presence of large quantities of H2S, the prediction of sour corrosion appears today as one of the most pressing matters in the industry11. The understanding of H2S corrosion mechanisms lags clearly behind, even if a lot of effort has already been made in this direction12. Although H2S gas is about three times more soluble than CO2 gas, the acid created by dissociation of H2S is about three times weaker than carbonic acid. Hence, the effect of H2S gas on decreasing the solution pH is approximately the same as CO2 gas. The different chemical and electrochemical reactions involved in the H2S corrosion are described below and added to the list above:
• H2S dissolution )(2)(2 aqg SHSH ↔
• H2S dissociation −+ +⎯→← )()()(2 aqaqaq HSHSH
• HS- dissociation −+− +⎯→← 2
)()()( aqaqaq SHHS • H2S reduction
−− +→+ )()(2)(2 222 aqgaq HSHeSH
• FeS formation by precipitation )(
2)(
2)( saqaq FeSSFe ⎯→←+ −+
and solid state reaction 2)(2)( HFeSSHFe ss +→+
Some very valuable experimental work has been done on the effect of small amounts of H2S on the CO2 corrosion of carbon steel13-16. It was found that the presence of small amounts of H2S will lead to a rapid and significant reduction of the CO2 corrosion. The reduction of the corrosion rate is usually associated with the formation of a corrosion product film on the metal surface, even if the bulk
2

conditions for supersaturation of FeCO3 or FeS are not met. The analysis of the film usually shows the presence of a very thin mackinawite film. It has been reported that the process of FeS film formation is linked to a solid state reaction where the hydrogen sulfide (or sulfide ions) reacts directly with the iron of the metal surface13-16. Depending on various environmental factors, different thermodynamically stable types of FeS can be formed. In some cases FeS film can be non-protective and result in localized attack. For example, the formed layer can develop internal stresses which can lead to film fracture, causing a potential localized attack problem. Generally, three regimes in CO2/H2S systems have been classified based on the concentration of H2S17 as shown in Figure 1. Nevertheless, the mixed CO2/H2S zone has been reported to begin at a much smaller ratio than the one displayed in the graph15. The chemistry of iron sulfide film formation is very complex and the film characteristics and morphology can change with test conditions and time and can lead to very different scenario of corrosivity. Smith et al19 reported in a review paper that there are three main forms of FeS commonly found in the field: mackinawite, pyrrhotite and pyrite.
• Mackinawite is a metastable form of FeS that forms in the presence of small amounts of H2S by solid state reaction.
• Pyrrhotite is believed to be more thermodynamically stable than mackinawite because the pyrrhotite formation kinetics is much slower than those of mackinawite.
• The formation of pyrite is associated to high H2S partial pressure and is believed to require elemental sulfur.
The corrosion product map related to the formation of these three types of FeS film is shown in Figure 2. On the other hand, the influence of organic acids on the relative protectiveness of iron sulfide films adds another unknown to the problem since there is, to our knowledge, only one published work on that subject18. The objective of this paper is to try to improve our understanding of the influence of the partial pressure of H2S and the presence of acetic acid on the CO2 influenced corrosion rate of carbon steel and the characteristics of the corrosion product film formed.
EXPERIMENTAL PROCEDURE Experimental loop Three different large scale flow loops were used in this study. The experiments were carried out in multiphase stratified flow with water and a mixture of CO2/N2/H2S. The flow loops, made of 316 stainless steel and Hastelloy C276 (for the H2S experiments) have all very similar characteristics and can be divided in three main parts: the tank, the pump and the loop.
- The tank is used for the liquid phase conditioning and heating. It is filled with de-ionized water. Acetic acid is added to reach the requirements of the tests. A set of immersion heaters control the temperature.
- Positive displacement progressive cavity pumps or gas blower are used to move the liquid or the gas phase.
- The 4” diameter flow loop is 30 meters long and horizontally leveled. The test sections, where the measurements are taken, are located at least 8 meters downstream from the exit of the tank. The test sections (Figure 3) are 1.5 meters long pipe spool pieces. Each has up to eight probe ports (four at the top, four at the bottom). In this paper, only the bottom of the line results are taken into account. Samples of condensed liquid and in situ pH measurements were taken at the test section.
3

More complete presentations of these loops have been already published in the open literature15, 20, 21 and the reader is directed to consult these publications for more detailed information. The experimental procedure is as follows. The tank is first filled with 1 m3 of de-ionized water. Carbon dioxide (and nitrogen in some cases) is injected in the loop at a specific pressure. The liquid phase is then heated up to the specific temperature by two electrical resistance heaters. The pump is started and the gas/liquid mixture flows around the loop in stratified flow regime. The de-oxygenation is done by de-pressurizing several times until the concentration of oxygen is low (<50 ppb). Oxygen concentration is measured using colorimetric test kits. Once the de-oxygenation is completed, acetic acid and/or H2S concentrations are adjusted (see procedures below) to the required levels. The corrosion probes are then introduced under pressure at the test section and the experiment begins. A data acquisition device is used in order to continuously measure the total pressure and the gas/liquid temperature. Liquid phase specification The liquid phase is made up exclusively from de-ionized water. No salt is added. However, dissolved ferrous iron Fe2+ build-up occurs throughout the test due to the corrosion process on the weight loss coupons. Liquid samples were taken regularly from the liquid phase and Table 3 presents the evolution of Fe2+ concentration and pH during the whole duration of the tests. Scale formation The pH of the liquid phase at the bottom of the line is kept at a value around 4-4.5 in each test and the solution is always under-saturated with regard to iron carbonate precipitation. Therefore, FeCO3 is not expected to form on the metal surface in any of the tests performed. On the other hand, the solution was always above the saturation point with regard to FeS (in the test with H2S). The saturation levels for each type of scale are displayed in Table 2. Acetic acid concentration The acetic acid (HAc) concentration is adjusted by adding a calculated amount of pure HAc in the tank. The acetic acid solution is first de-oxygenated before being introduced into the tank using a high-pressure vessel connected to the tank. The concentration distribution of free HAc and acetate (Ac-) in the liquid phase is calculated from the measured value of pH and is verified later by using ion chromatography. A differentiation is made between the free or undissociated acetic acid concentration (free HAc) and the total acetic acid concentration which includes all acetate containing species (free HAc and acetate Ac-). In order to keep the concentration of free acetic acid constant during the test, the pH of the liquid phase was adjusted if necessary by adding more acetic acid. Table 4 presents the calculated free acetic concentration at the bottom of the line for each test. Ion chromatograph measurements are provided where available. A range of concentration is provided each time to take into account the change in pH. It is important to notice that the calculated concentration of free acetic acid is close to the required concentration but there is in most cases a 20-30% discrepancy. This discrepancy is most likely due to the technical difficulties often met in large scale loop tests to keep a high degree of accuracy in the measurements but also includes errors in the measurement process. For clarity purposes, the concentration of free acetic acid will be displayed as 100 or 1000 ppm (depending on the test conditions) in the entire paper.
4
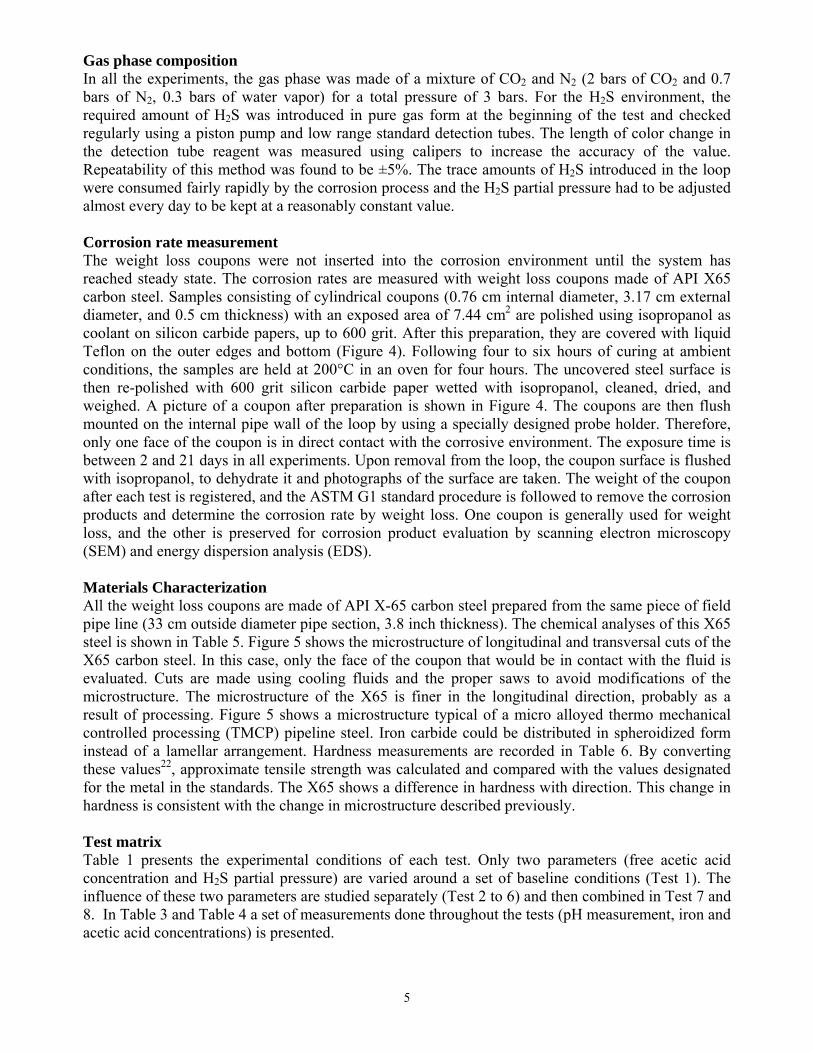
Gas phase composition In all the experiments, the gas phase was made of a mixture of CO2 and N2 (2 bars of CO2 and 0.7 bars of N2, 0.3 bars of water vapor) for a total pressure of 3 bars. For the H2S environment, the required amount of H2S was introduced in pure gas form at the beginning of the test and checked regularly using a piston pump and low range standard detection tubes. The length of color change in the detection tube reagent was measured using calipers to increase the accuracy of the value. Repeatability of this method was found to be ±5%. The trace amounts of H2S introduced in the loop were consumed fairly rapidly by the corrosion process and the H2S partial pressure had to be adjusted almost every day to be kept at a reasonably constant value. Corrosion rate measurement The weight loss coupons were not inserted into the corrosion environment until the system has reached steady state. The corrosion rates are measured with weight loss coupons made of API X65 carbon steel. Samples consisting of cylindrical coupons (0.76 cm internal diameter, 3.17 cm external diameter, and 0.5 cm thickness) with an exposed area of 7.44 cm2 are polished using isopropanol as coolant on silicon carbide papers, up to 600 grit. After this preparation, they are covered with liquid Teflon on the outer edges and bottom (Figure 4). Following four to six hours of curing at ambient conditions, the samples are held at 200°C in an oven for four hours. The uncovered steel surface is then re-polished with 600 grit silicon carbide paper wetted with isopropanol, cleaned, dried, and weighed. A picture of a coupon after preparation is shown in Figure 4. The coupons are then flush mounted on the internal pipe wall of the loop by using a specially designed probe holder. Therefore, only one face of the coupon is in direct contact with the corrosive environment. The exposure time is between 2 and 21 days in all experiments. Upon removal from the loop, the coupon surface is flushed with isopropanol, to dehydrate it and photographs of the surface are taken. The weight of the coupon after each test is registered, and the ASTM G1 standard procedure is followed to remove the corrosion products and determine the corrosion rate by weight loss. One coupon is generally used for weight loss, and the other is preserved for corrosion product evaluation by scanning electron microscopy (SEM) and energy dispersion analysis (EDS). Materials Characterization All the weight loss coupons are made of API X-65 carbon steel prepared from the same piece of field pipe line (33 cm outside diameter pipe section, 3.8 inch thickness). The chemical analyses of this X65 steel is shown in Table 5. Figure 5 shows the microstructure of longitudinal and transversal cuts of the X65 carbon steel. In this case, only the face of the coupon that would be in contact with the fluid is evaluated. Cuts are made using cooling fluids and the proper saws to avoid modifications of the microstructure. The microstructure of the X65 is finer in the longitudinal direction, probably as a result of processing. Figure 5 shows a microstructure typical of a micro alloyed thermo mechanical controlled processing (TMCP) pipeline steel. Iron carbide could be distributed in spheroidized form instead of a lamellar arrangement. Hardness measurements are recorded in Table 6. By converting these values22, approximate tensile strength was calculated and compared with the values designated for the metal in the standards. The X65 shows a difference in hardness with direction. This change in hardness is consistent with the change in microstructure described previously. Test matrix Table 1 presents the experimental conditions of each test. Only two parameters (free acetic acid concentration and H2S partial pressure) are varied around a set of baseline conditions (Test 1). The influence of these two parameters are studied separately (Test 2 to 6) and then combined in Test 7 and 8. In Table 3 and Table 4 a set of measurements done throughout the tests (pH measurement, iron and acetic acid concentrations) is presented.
5

The eight experiments conducted can be divided into three groups investigating different aspects of the corrosion process in a CO2 environment:
• Influence of the concentration of free acetic acid; • Influence of the partial pressure of H2S; • Combined effect of the concentration of free acetic acid and the partial pressure of H2S.
Apart from the acetic acid concentration and the partial pressure of H2S, all the other experimental parameters were kept at a fixed value (system temperature: 70°C, partial pressure of CO2: 2 bars, total pressure: 3 bars, gas velocity: 5 m/s). The liquid flow rates at the bottom of the line were different between the sweet and the sour tests. The primary concern was to ensure that the flow regime was stratified and not much attention was put on the superficial liquid velocity which was determined to be below 0.05 m/s.
RESULTS Corrosion rate results The corrosion rate results are displayed in a series of graphs from Figure 6 to Figure 12. Due to confidentiality reasons, the corrosion rates are normalized (all the data are multiplied by an arbitrary constant) without invalidating the trends and the cross comparisons. Error bars representing maximum and minimum values and number of coupons (number of repeated measurements) are displayed when applicable on each graph. Influence of the free acetic acid concentration The observed influence of the free acetic acid concentration on the average corrosion rate is not surprising. The acetic acid acts as a provider of protons and at the same time adds a new cathodic reaction via the direct reduction of undissociated acetic acid. Therefore, in the absence of protective corrosion product film (as it is the case here), the average corrosion rate will increase when free acetic is present. The effect is proportional to the amount added. As it is shown in Figure 6, the corrosion rate will double if 1000 ppm of free acetic acid is introduced in solution. In all cases, the corrosion rate may vary a little bit with time, but is expected to remain rather high as no protective film can form in the severe conditions tested (pH always below 4.5). Influence of the partial pressure of hydrogen sulfide The results related to the influence of the partial pressure of H2S are shown in Figure 7 and Figure 8 which represent the same data but displayed in different ways for purposes of clarity. The first H2S partial pressure tested is 0.004 bar at a H2S/CO2 ratio of 500 (at the limit between the reported sweet and mixed regimes). However, there is obviously an overwhelming effect of H2S as the corrosion rates are globally reduced by almost a factor 100. As more H2S is added up to 0.07 and 0.13 bar (corresponding to H2S/CO2 ratio of, respectively, 29 and 15), the tendency is reversed with the average corrosion rate being only 10 to 20 times lower as compared to the pure CO2 environment. With 0.13 bar of H2S, the corrosion regime is supposed to be clearly sour and the effect of the additional cathodic reaction (H2S reduction) is now seen. Moreover, there seems to be a slight decreasing trend in the average corrosion in the presence of H2S which could correspond to the gradual formation of a corrosion product film layer. Some FeS films (especially mackinawite) are believed to form almost immediately with small quantities of H2S and to create a diffusion barrier which prevents corrosive species (H+, H2CO3) from reaching the surface.
6

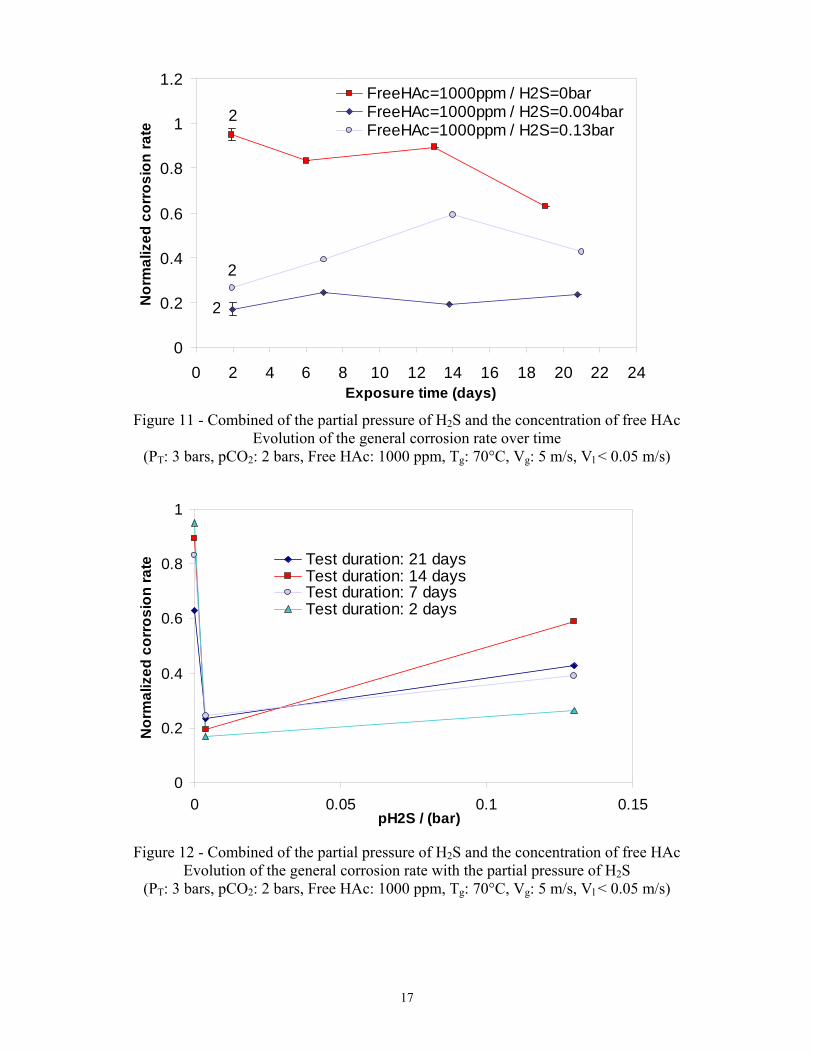
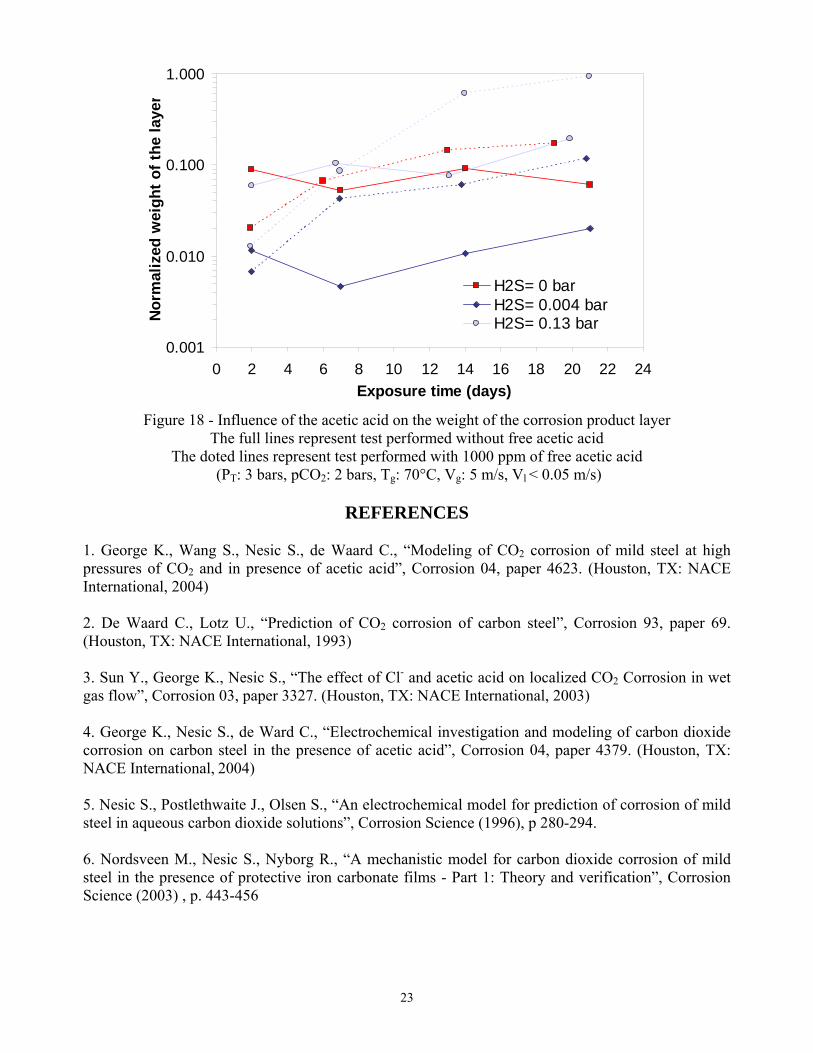
Combined effect of the acetic acid and the hydrogen sulfide These results are shown in a series of graphs from Figure 9 to Figure 12. The presence of 1000 ppm of free acetic acid has a very strong influence on the average corrosion rate in sour environment. The influence of the free acetic acid on the general corrosion rate is even greater compared to the pure CO2 environment as described above. The 1000 ppm of HAc increased the average uniform corrosion rate by 50 time at 0.004 bar H2S (Figure 9) and 8 times at 0.13 bar H2S (Figure 10). The beneficial effect of the protective sulfide scale shown above is all but completely cancelled by the presence of HAc and the magnitude of the average corrosion rate is not acceptable (Figure 11). In the presence of 1000 ppm of free acetic acid, the partial pressure of H2S does not seem to have a very strong influence with a corrosion rate being globally half its sweet conditions equivalent (Figure 12). Surface analysis The corrosion product layer was systematically studied for each test using SEM and EDS. However, the complete characterization of corrosion product films (and especially sulfide films) requires XRD analysis which was not performed in this study. Therefore, even if the visual observations obtained by SEM give some useful indications about the nature of the corrosion product film, some caution should be taken when interpreting the findings. Influence of the free acetic acid concentration Figure 13 presents typical pictures of the corrosion product film that forms on the surface in a sweet environment when the conditions for FeCO3 precipitation are not met (low pH). The scale found is identified as iron carbide (Fe3C), the undissolved component of carbon steel which is left behind due to the corrosion process. Fe3C is a non-protective, very porous film, and has been reported in some case to enhance the corrosion process by galvanic coupling (Fe3C is conductive). The numerous cracks observed in the SEM pictures of Figure 13 appeared during the dehydration process of the weight loss coupons when they are flushed with isopropanol immediately after their removal from the loop. There is no indication of localized corrosion and the corrosion process was strictly uniform. There is no specific influence of the nature of the corrosion product layer once acetic acid is added. However, since the corrosion rate increased with the addition of acetic acid, the weight of the layer increases as well (Figure 18). Influence of the partial pressure of H2S Once traces of H2S are added to the system, the corrosion product layer seems fairly different. With a partial pressure of H2S of 0.004 bar, the weight loss coupons are covered with a very thin, amorphous layer (Figure 14). Even if different film structures can be observed on the surface, EDS analysis shows the same FeS composition. In these conditions, the film is expected to be mackinawite. As the partial pressure of H2S increases, the corrosion becomes more severe and the corrosion product layer becomes thicker. The film is poorly adherent to the surface and large parts actually fell off when the coupons were processed after the tests. Even if EDS analysis gives a similar FeS film composition, the structure of the film looks different when compared to the amorphous FeS coinciding with hexagonal shaped crystals (Figure 15). Without XRD analysis, it is difficult to characterize accurately the film composition but pyrrhotite or cubic FeS could form in these conditions and could match the hexagonal shape of the crystals observed. The weight of the film increases by a factor of 100, when comparing 0.004 and 0.13 bar of H2S corrosion coupons, while the corrosion rate itself only increased by a factor of 10. In the presence of 0.13 bar of H2S, the liquid phase is strongly supersaturated with FeS. Precipitation of FeS, as well as the solid state reaction to form mackinawite, is expected to occur at the same time. Internal stresses are caused by the growth of the corrosion product film underneath the already existing layer (instead of above the layer for standard precipitation). Therefore, the growth of the scale associated with the solid state reaction should be at the origin of the scale breakdown
7

observed with SEM. Large parts of the coupons where the scale peeled off are much more corroded than the rest. This indicates the potential for occurrence of localized corrosion. However, no pitting corrosion was observed for the duration of these exposures. Combined effect of the acetic acid and the H2S Figure 16 and Figure 17 present the SEM pictures of the corrosion scale from 1000 ppm of free acetic acid and 0.004 or 0.13 bar of H2S. The FeS layer looks very similar in both cases: a uniform amorphous film, entirely cracked, thick and non-adherent. The weight of the film is, in both cases, around 6 times what it was in the absence of any acetic acid (Figure 18). The composition of the scale is expected to be mainly mackinawite, but some crystals could be seen at 0.13 bars of H2S (Figure 17 f)). Once again, it could be an evidence of the presence of pyrrhotite at the higher H2S partial pressure. Pitting corrosion is observed in Figure 16 b) and Figure 17 b) even if the relative magnitude of the localized corrosion is small.
CONCLUSIONS
• In the presence of 2 bars of CO2, the average corrosion at the bottom of the line (non film forming conditions) is approximately doubled when 1000 ppm of undissociated acetic acid is added. An unprotective Fe3C film is present on the metal surface and no localized corrosion could be observed.
• The presence of trace amounts of H2S (0.004 bar) in the CO2 environment sharply decreases the corrosion rate by two orders of magnitude. As the partial pressure of H2S is increased to 0.13 bar, the tendency is reversed and the general corrosion rate increase by an order of magnitude. A FeS film, protective at low H2S partial pressure, covers the surface. At higher H2S content, the scale seems to break easily due to internal stresses and the steel is not evenly corroded.
• The introduction of 1000 ppm of free acetic acid in the H2S/CO2 mixture negated positive effects of H2S, leading to average corrosion rates comparable to their pure sweet condition equivalents (same order of magnitude). Some pitting and localized corrosion could be observed on the metal surface.
ACKNOWLEDGEMENTS The authors would like to express their gratitude to Total, BP, ConocoPhillips and ENI for the financial support of this research and for allowing the publication of this paper. The authors are also grateful for the contribution of Dezra Hinkson, Ziru Zhang and Dr. Victor Wang, colleagues at the Institute, to this experimental work. Finally, the authors are thankful to Dr. David Young and Dr. Wei Sun for their guidance and expertise on sulfide chemistry and H2S corrosion phenomena.
8
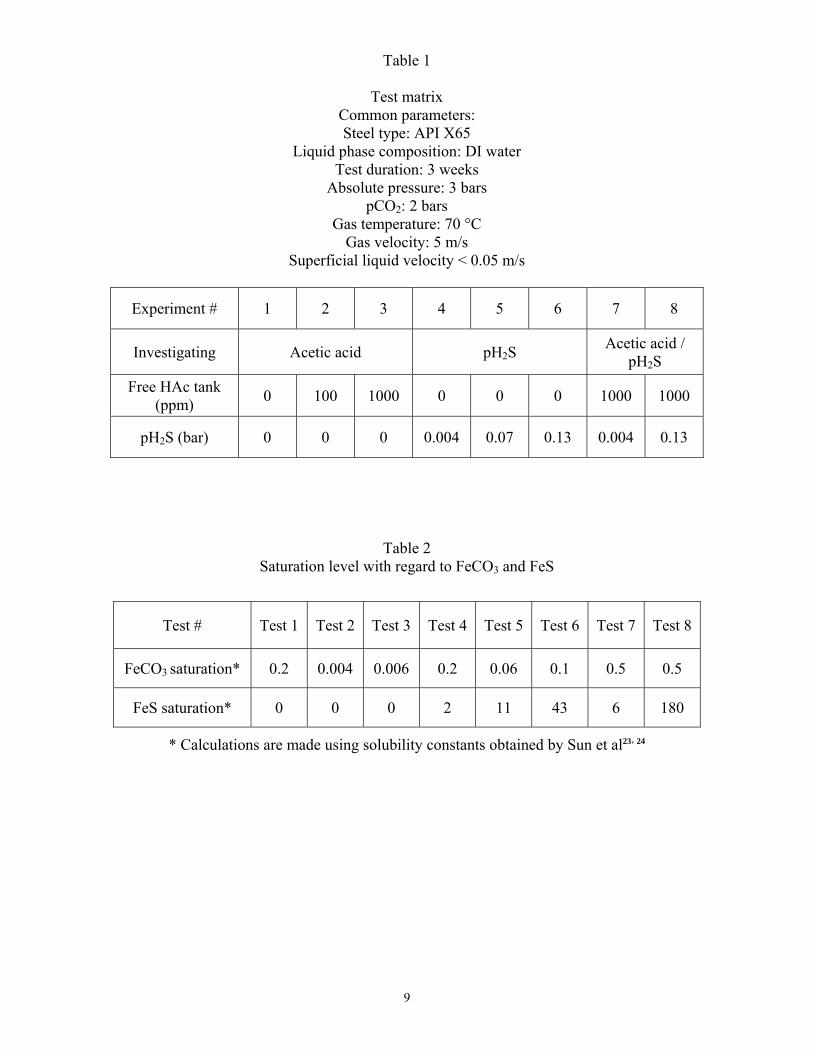
Table 1
Test matrix Common parameters: Steel type: API X65
Liquid phase composition: DI water Test duration: 3 weeks
Absolute pressure: 3 bars pCO2: 2 bars
Gas temperature: 70 °C Gas velocity: 5 m/s
Superficial liquid velocity < 0.05 m/s
Experiment # 1 2 3 4 5 6 7 8
Investigating Acetic acid pH2S Acetic acid / pH2S
Free HAc tank (ppm) 0 100 1000 0 0 0 1000 1000
pH2S (bar) 0 0 0 0.004 0.07 0.13 0.004 0.13
Table 2 Saturation level with regard to FeCO3 and FeS
Test # Test 1 Test 2 Test 3 Test 4 Test 5 Test 6 Test 7 Test 8
FeCO3 saturation* 0.2 0.004 0.006 0.2 0.06 0.1 0.5 0.5
FeS saturation* 0 0 0 2 11 43 6 180
* Calculations are made using solubility constants obtained by Sun et al23, 24
9

Table 3 Experimental conditions
Acetic acid series pH2S series Acetic acid/H2S series
Test 1 Test 2 Test 3 Test 4 Test 5 Test 6 Test 7 Test 8
Duration pH Fe2+ ppm pH Fe2+
ppm pH Fe2+ ppm pH Fe2+
ppm pH Fe2+ ppm pH Fe2+
ppm pH Fe2+ ppm pH Fe2+
ppm
At start NA NA 3.4 N/A N/A N/A 4.2 7.9 4.3 9 4.4 6.5 4.4 56.3 3.9 76
After2 days 4.6 0.4 N/A N/A 3.9 70.5 4.4 18.7 4.4 N/A 4 25 4.2 145 4.3 94
After7 days 4.9 8.4 N/A 9.6 3.6 40 4.4 18.9 4.5 N/A 4.1 22.9 4.5 110 4.3 N/A
After14 days 4.6 11.4 4 24.4 3.7 35.8 4.6 N/A 4.4 18.1 4.3 25.3 4.5 150 4.1 170
After21 days 4.8 11.2 4 17.4 3.7 32.3 4.7 18 4.5 20.3 4.3 26 4.6 170 4 140
After removal
of the probes
4.8 3.3 N/A 6.4 N/A N/A 4.7 18 N/A N/A N/A N/A N/A N/A N/A N/A
10
Table 4 Acetic acid concentration
Test # Measured total acetate species in
the liquid phase with ion chromatograph (ppm)
Calculated free acetic acid concentration in the liquid phase
(ppm)
Test 2 57 Between 50 and 55*
Test 3 675 Between 605 and 664*
Test 7 1052 Between 656 and 846*
Test 8 1120 Between 861 and 1002*
*Calculations based on the amount of acetate species measured with ion chromatography
Table 5 Chemical analysis of the carbon steels used in the experiments
Element X65 Composition (%)
API 5L X65 Standard (%)
C 0.13 < 0.26 Mn 1.16 <1.40 P 0.009 < 0.03 S 0.009 < 0.03
Table 6 Hardness (HRB) results
X65 longitudinal cut X65 transversal cut 1 81.3 60.3 2 94.4 68.7 3 98.7 63.3 4 87.9 78.0 5 95.4 59.1 6 89.3 51.1 7 88.7 66.5 8 92.9 75.0 9 93.3 58.5
10 85.1 67.7 Average 90.7 64.8
Approx.Tensile Strength 90,000 psi for 90.7HRB 56,000 psi for 65.7HRB Tensile requirements 77,000psi (min) 77,000psi (min)
Yield Strength 65,000psi (min) 65,000psi (min)
11

pCO2/pH2S = 20
H2S Regime Sour CO2 + H2S Regime
Mixed
pCO2/pH2S = 500 pH2S
CO2 Regime sweet
pCO2
Figure 1 - Corrosion regimes in CO2/H2S corrosion defined by Pots, et al.17
Figure 2 - Corrosion product formation as a function of temperature and H2S19
12

Figure 3 - Test section of the H2S loop
Only the bottom ports were used in this study
FRONT BACK
3.17 cm
Figure 4 - Weight loss coupons with Teflon coating at the back and the side (External diameter = 3.17 cm)
13

(a) 1000X
(b) 1000X
Figure 5 - Microstructure of the X65 carbon steel a) longitudinal cut, b) transversal cut
0
0.2
0.4
0.6
0.8
1
0 2 4 6 8 10 12 14 16 18 20 22 24Exposure time (days)
Nor
mal
ized
cor
rosi
on ra
te
Free HAc= 0 ppmFree HAc= 100 ppmFree HAc= 1000 ppm
4
2
2
Figure 6 - Influence of the free HAc concentration Evolution of the general corrosion rate over time
(PT: 3 bars, pCO2: 2 bars, pH2S: 0 bar, Tg: 70°C, Vg: 5 m/s, Vl < 0.05 m/s)
14

0
0.1
0.2
0.3
0.4
0.5
0 2 4 6 8 10 12 14 16 18 20 22 24Exposure time (days)
Nor
mal
ized
cor
rosi
on ra
te
H2S=0barH2S=0.004barH2S=0.07 barH2S=0.13bar
2
2
2
2
Figure 7 - Influence of the partial pressure of H2S
Evolution of the general corrosion rate with the partial pressure of H2S (PT: 3 bars, pCO2: 2 bars, Free HAc: 0 ppm, Tg: 70°C, Vg: 5 m/s, Vl < 0.05 m/s)
0.001
0.01
0.1
1
0 0.05 0.1 0.15pH2S / (bar)
Nor
mal
ized
cor
rosi
on ra
te
Test duration: 21 daysTest duration: 14 daysTest duration: 7 daysTest duration: 2 days
Figure 8 - Influence of the partial pressure of H2S Evolution of the general corrosion rate over time
(PT: 3 bars, pCO2: 2 bars, HAc: 0 ppm, Tg: 70°C, Vg: 5 m/s, Vl < 0.05 m/s)
15

0
0.05
0.1
0.15
0.2
0.25
0.3
0 2 4 6 8 10 12 14 16 18 20 22 24Exposure time (days)
Nor
mal
ized
cor
rosi
on ra
te
H2S=0.004bar / FreeHAc=0ppmH2S=0.004bar / FreeHAc=1000ppm
2
2
Figure 9 - Combined of the partial pressure of H2S and the concentration of free HAc
Evolution of the general corrosion rate over time (PT: 3 bars, pCO2: 2 bars, pH2S: 0.004 bar, Tg: 70°C, Vg: 5 m/s, Vl≈ 0.2 m/s)
0
0.1
0.2
0.3
0.4
0.5
0.6
0 2 4 6 8 10 12 14 16 18 20 22 24Exposure time (days)
Nor
mal
ized
cor
rosi
on ra
te
H2S=0.13bar / FreeHAc=0ppm
H2S=0.13bar / FreeHAc=1000ppm2
2
Figure 10 - Combined of the partial pressure of H2S and the concentration of free HAc
Evolution of the general corrosion rate over time (PT: 3 bars, pCO2: 2 bars, pH2S: 0.13 bar, Tg: 70°C, Vg: 5 m/s, Vl < 0.05 m/s)
16
0
0.2
0.4
0.6
0.8
1
1.2
0 2 4 6 8 10 12 14 16 18 20 22 24Exposure time (days)
Nor
mal
ized
cor
rosi
on ra
te
FreeHAc=1000ppm / H2S=0barFreeHAc=1000ppm / H2S=0.004barFreeHAc=1000ppm / H2S=0.13bar
2
2
2
Figure 11 - Combined of the partial pressure of H2S and the concentration of free HAc
Evolution of the general corrosion rate over time (PT: 3 bars, pCO2: 2 bars, Free HAc: 1000 ppm, Tg: 70°C, Vg: 5 m/s, Vl < 0.05 m/s)
0
0.2
0.4
0.6
0.8
1
0 0.05 0.1 0.15pH2S / (bar)
Nor
mal
ized
cor
rosi
on ra
te Test duration: 21 daysTest duration: 14 daysTest duration: 7 daysTest duration: 2 days
Figure 12 - Combined of the partial pressure of H2S and the concentration of free HAc
Evolution of the general corrosion rate with the partial pressure of H2S (PT: 3 bars, pCO2: 2 bars, Free HAc: 1000 ppm, Tg: 70°C, Vg: 5 m/s, Vl < 0.05 m/s)
17

(a) WL coupon after 14 days of exposure
(b) Corrosion product layer X100
(c) Corrosion layer X100 Back scatter
(d) Corrosion product layer X200
(e) EDS analysis of the corrosion layer
Figure 13 - Test 1 – Pure CO2 environment
(PT: 3 bars, pCO2: 2 bars, pH2S: 0 bar, Free HAc: 1000 ppm, Tg: 70°C, Vg: 5 m/s, Vl < 0.05 m/s)
18

(a) WL coupon after 21 days of exposure
(b) WL coupon after removal of the layer
(c) Corrosion product layer X100
(d) Corrosion product layer X2000
(e) Corrosion product layer X2000
(f) EDS analysis of the corrosion layer c)
Figure 14 - Test 4 – CO2 environment with traces of H2S – CO2/H2S: 500
(PT: 3 bars, pCO2: 2 bars, pH2S: 0.004 bar, Free HAc: 0 ppm, Tg: 70°C, Vg: 5 m/s, Vl < 0.05 m/s)
19

(a) WL coupon after 21 days of exposure
(b) WL coupon after removal of the layer
(c) Corrosion product layer X50
(d) Corrosion product layer X500
(e) Corrosion product layer X2000
(f) Corrosion product layer X10000
Figure 15 - Test 6 – CO2 environment with H2S – CO2/H2S: 15
(PT: 3 bars, pCO2: 2 bars, pH2S: 0.13 bar, Free HAc: 0 ppm, Tg: 70°C, Vg: 5 m/s, Vl < 0.05 m/s)
20

(a) WL coupon after 21 days of exposure
(b) WL coupon after removal of the layer
(c) Corrosion product layer X50
(d) Corrosion product layer X200
(e) Corrosion product layer X500
(f) EDS Analysis
Figure 16 - Test 7 – CO2 environment with traces of H2S and acetic acid – CO2/H2S: 500
(PT: 3 bars, pCO2: 2 bars, pH2S: 0.004 bar, Free HAc: 1000 ppm, Tg: 70°C, Vg: 5 m/s, Vl < 0.05 m/s)
21

(a) WL coupon after 21 days of exposure
(b) WL coupon after removal of the layer
(c) Corrosion product layer X50
(d) Corrosion product layer X5000
(e) Corrosion product layer X500
(f) Corrosion product layer X500
Figure 17 - Test 8 – CO2 environment with H2S and acetic acid – CO2/H2S: 15
(PT: 3 bars, pCO2: 2 bars, pH2S: 0.13 bar, Free HAc: 1000 ppm, Tg: 70°C, Vg: 5 m/s, Vl < 0.05 m/s)
22
0.001
0.010
0.100
1.000
0 2 4 6 8 10 12 14 16 18 20 22 24Exposure time (days)
Nor
mal
ized
wei
ght o
f the
laye
r
H2S= 0 barH2S= 0.004 barH2S= 0.13 bar
Figure 18 - Influence of the acetic acid on the weight of the corrosion product layer
The full lines represent test performed without free acetic acid The doted lines represent test performed with 1000 ppm of free acetic acid
(PT: 3 bars, pCO2: 2 bars, Tg: 70°C, Vg: 5 m/s, Vl < 0.05 m/s)
REFERENCES 1. George K., Wang S., Nesic S., de Waard C., “Modeling of CO2 corrosion of mild steel at high pressures of CO2 and in presence of acetic acid”, Corrosion 04, paper 4623. (Houston, TX: NACE International, 2004) 2. De Waard C., Lotz U., “Prediction of CO2 corrosion of carbon steel”, Corrosion 93, paper 69. (Houston, TX: NACE International, 1993) 3. Sun Y., George K., Nesic S., “The effect of Cl- and acetic acid on localized CO2 Corrosion in wet gas flow”, Corrosion 03, paper 3327. (Houston, TX: NACE International, 2003) 4. George K., Nesic S., de Ward C., “Electrochemical investigation and modeling of carbon dioxide corrosion on carbon steel in the presence of acetic acid”, Corrosion 04, paper 4379. (Houston, TX: NACE International, 2004) 5. Nesic S., Postlethwaite J., Olsen S., “An electrochemical model for prediction of corrosion of mild steel in aqueous carbon dioxide solutions”, Corrosion Science (1996), p 280-294. 6. Nordsveen M., Nesic S., Nyborg R., “A mechanistic model for carbon dioxide corrosion of mild steel in the presence of protective iron carbonate films - Part 1: Theory and verification”, Corrosion Science (2003) , p. 443-456
23

7. Crolet J.L., Thevenot N., Dugstad A., “Role of free acetic acid on the CO2 corrosion of steel” Corrosion 99, paper 24 (Houston, TX: NACE International, 1999). 8. Dugstad A., “The importance of FeCO3 Supersaturation on the CO2 Corrosion of Carbon Steel”, Corrosion 92, paper 14, (Houston, TX: NACE International, 1992). 9. Nesic S., Lee K.L., “A mechanistic model for CO2 corrosion with protective iron carbonate films-Part 3: Film growth model”, Corrosion Science (2003), Volume 59, No.5, p 616-628O. 10. Nafday O., Nesic S., “Iron carbonate film scale formation and CO2 corrosion the presence of acetic acid”, Corrosion 05, paper 5295, (Houston, TX: NACE International, 2005). 11. Bonis M., Girgis M., Goerz K., MacDonald R., “Weight loss corrosion with H2S: using past operations for designing future facilities”, Corrosion 06, paper 6122. (Houston, TX: NACE International, 2006) 12. Smith S., Joosten M., “Corrosion of carbon steel by H2S in CO2 containing environments”, Corrosion 06, paper 6115, (Houston, TX: NACE International, 2006) 13. Valdes A., Case R., Ramirez M., and Ruiz A., “The effect of small amounts of H2S on CO2 corrosion of carbon steel,” Corrosion 98, paper 22, (Houston, TX: NACE International, 1998). 14. Kvarekval J., “The influence of small amounts of H2S on CO2 corrosion of iron and carbon steel,” Eurocorr 97, Trondheim, Norway. 15. Brown B., Lee K.-L., Nesic S., “Corrosion in multiphase flow containing small amounts of H2S”, Corrosion 03, paper 3341, (Houston, TX: NACE International, 2003). 16. Brown B., Reddy Parakala S., Nesic S., “CO2 corrosion in presence of trace amounts of H2S”, Corrosion 03, paper 4736, (Houston, TX: NACE International, 2004). 17. Pts B. et al, “Improvements on de-Waard Milliams corrosion prediction and applications to corrosion management” Corrosion 02, paper 2235, (Houston, TX: NACE International, 2002). 18. Camacho A., "CO2 top of the line corrosion in presence of H2S ", Master’s thesis, Ohio University, 2006. 19. Smith S.N., Pacheco J.L., "Prediction of Corrosion in Slightly Sour Environments", Corrosion 02, paper 2241, (Houston, TX: NACE International, 2002). 20. Singer M., Nesic S., Gunaltun Y., “Top of the line corrosion in presence of acetic acid and carbon dioxide”, Corrosion 04, paper 4377, (Houston, TX: NACE International, 2004). 21. Mendez C., Singer M., Camacho A., Hernandez S., Nesic S., “Effect of acetic acid, pH and MEG on the CO2 top of the line corrosion”, Corrosion 05, paper 5278. (Houston, TX: NACE International, 2005) 22. Craig, Bruce, “Practical Oilfield Metallurgy and Corrosion”, 2nd Edition, Metcorr (Denver, Colorado) p.14.
24

23. Sun S., Nesic S., Woollam R., “The effect of temperature and ionic strength on iron carbonate (FeCO3) solubility”, Board Meeting Report Spring 2006, Internal report to be published. 24. Sun S., Nesic S., Woollam R., Young D., “The solubility study of hydrogen sulfide and iron sulfide in hydrogen sulfide corrosion”, Board Meeting Report Spring 2006, Internal report to be published.
25